rare earths mine costs - june 2013 - greenfields research / curtin university / university of...
TRANSCRIPT
© Greenfields Research
Ltd 2013
RESOURCE COST AND CAPITAL
602
RARE EARTH MINE COSTS
John P. Sykes
Director, Greenfields Research
Provisional PhD Candidate,
Centre for Exploration Targeting & Curtin Graduate School of Business
© Greenfields Research
Ltd 2013
Rare Earth Mine Costs: Contents
1 What do we know about rare earth mine costs?
2 Back to Principles: How are costs calculated for mining?
3 What costs are there in mining and processing?
4 Differing costs for mining and processing types?
5 The most important cost sensitivities in mining?
6 What about capital costs?
7 Calculating mining costs for rare earth projects
8 Using costs curves as an analytical tool
© Greenfields Research
Ltd 2013
602 Resource Cost & Capital: Rare Earth Mine Costs
What do we know about rare earth
mine costs? Section 1 Section 2 Section 3 Section 4 Section 5 Section 6 Section 7 Section 8
© Greenfields Research
Ltd 2013
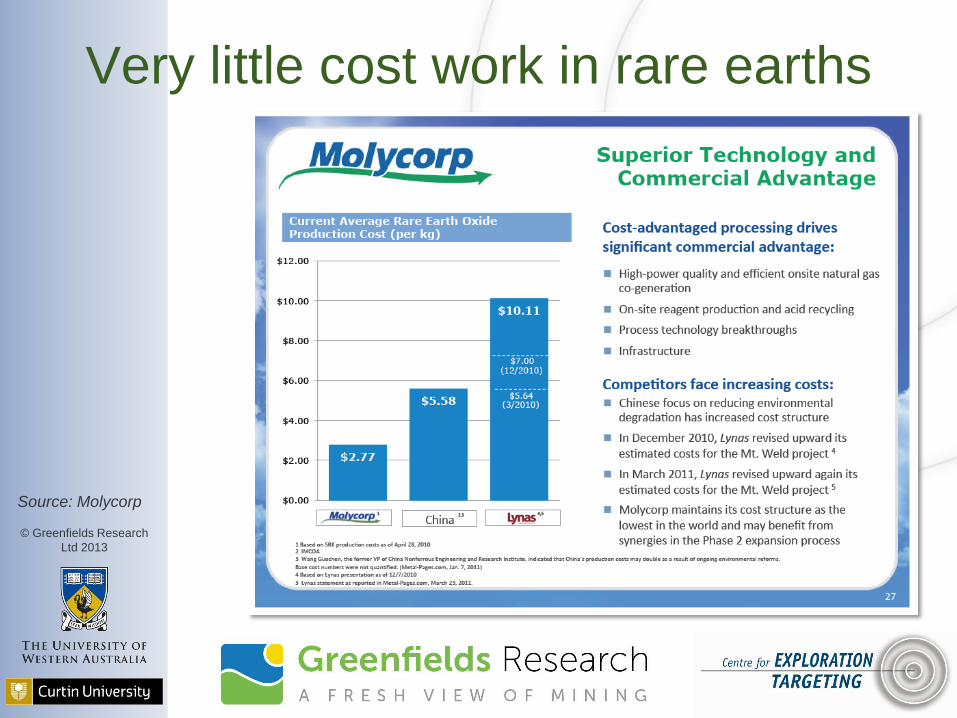
Very little cost work in rare earths
Source: Molycorp

© Greenfields Research
Ltd 2013
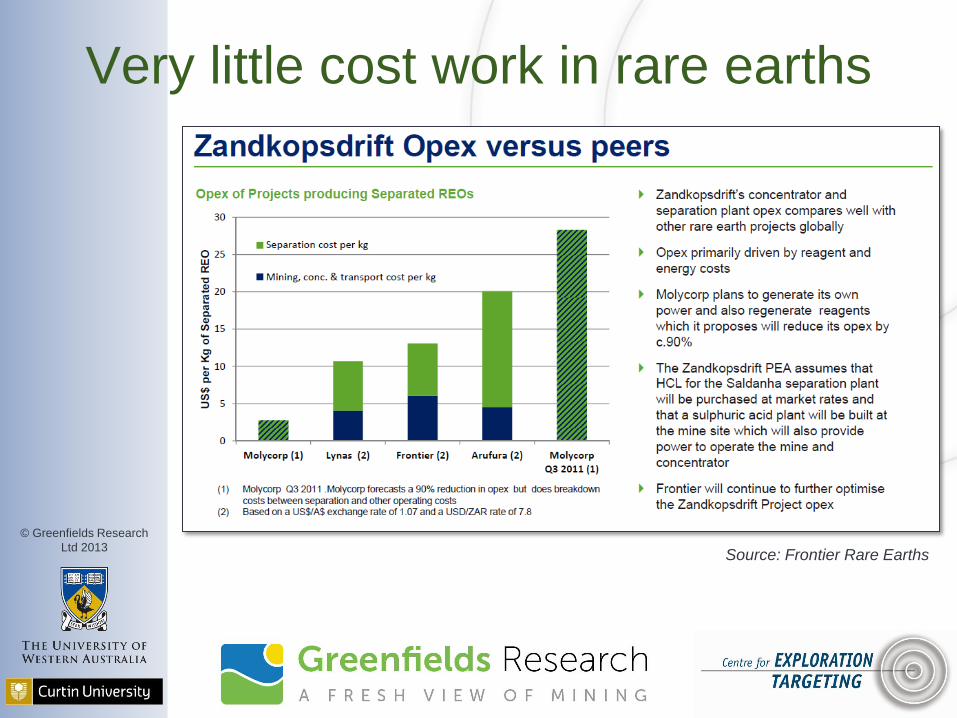
Very little cost work in rare earths
Source: Frontier Rare Earths
© Greenfields Research
Ltd 2013
Very little cost work in rare earths
Source: Frontier Rare Earths
© Greenfields Research
Ltd 2013
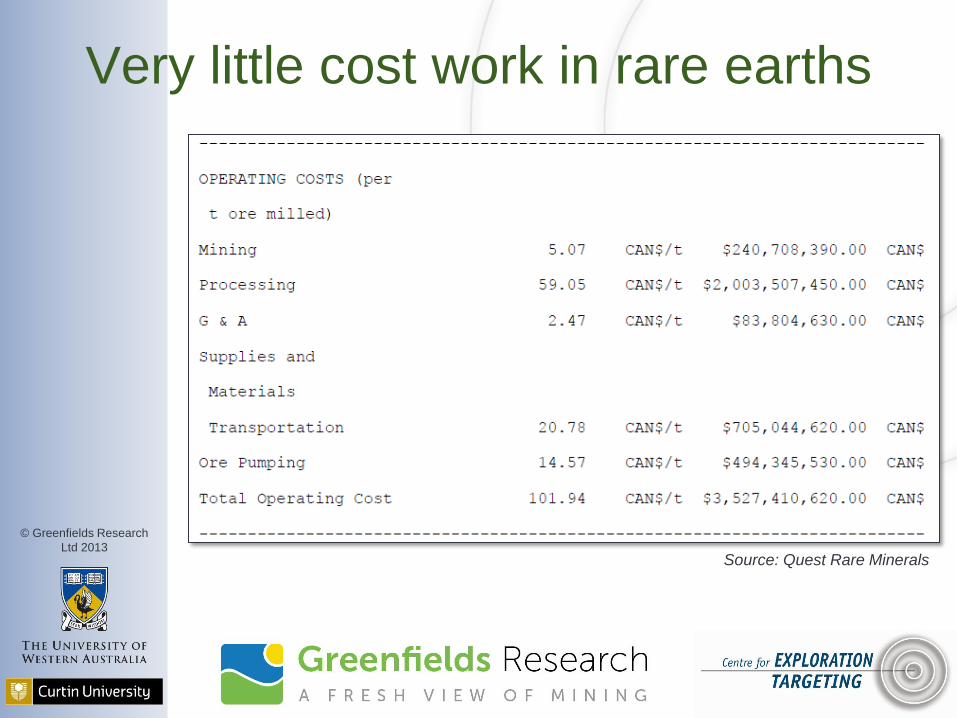
Very little cost work in rare earths
Source: Quest Rare Minerals
© Greenfields Research
Ltd 2013
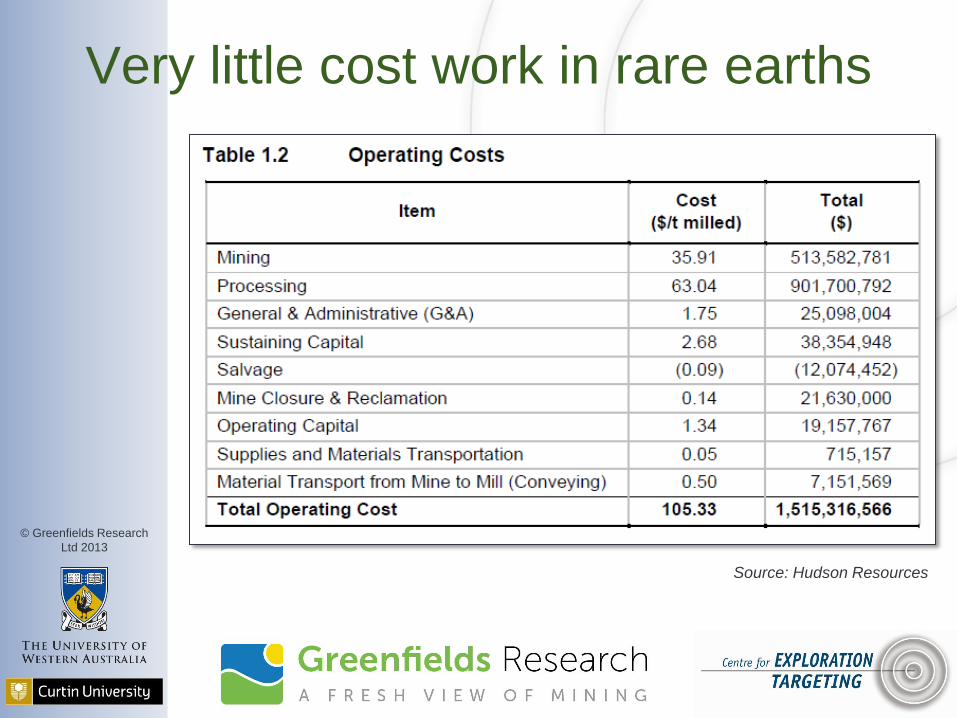
Very little cost work in rare earths
Source: Hudson Resources
© Greenfields Research
Ltd 2013
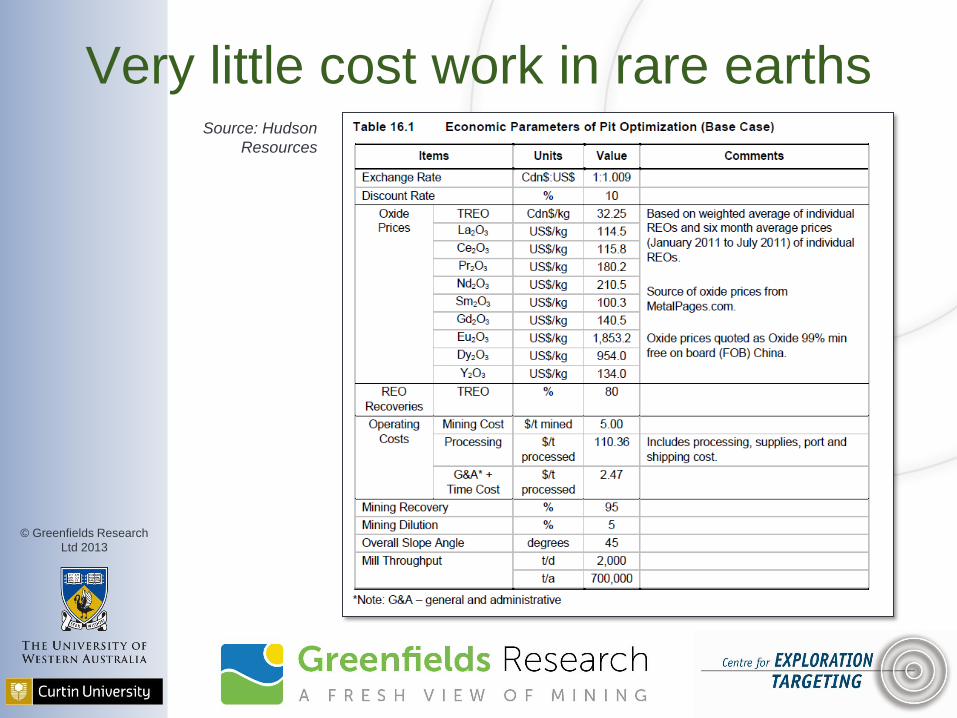
Very little cost work in rare earths Source: Hudson
Resources
© Greenfields Research
Ltd 2013
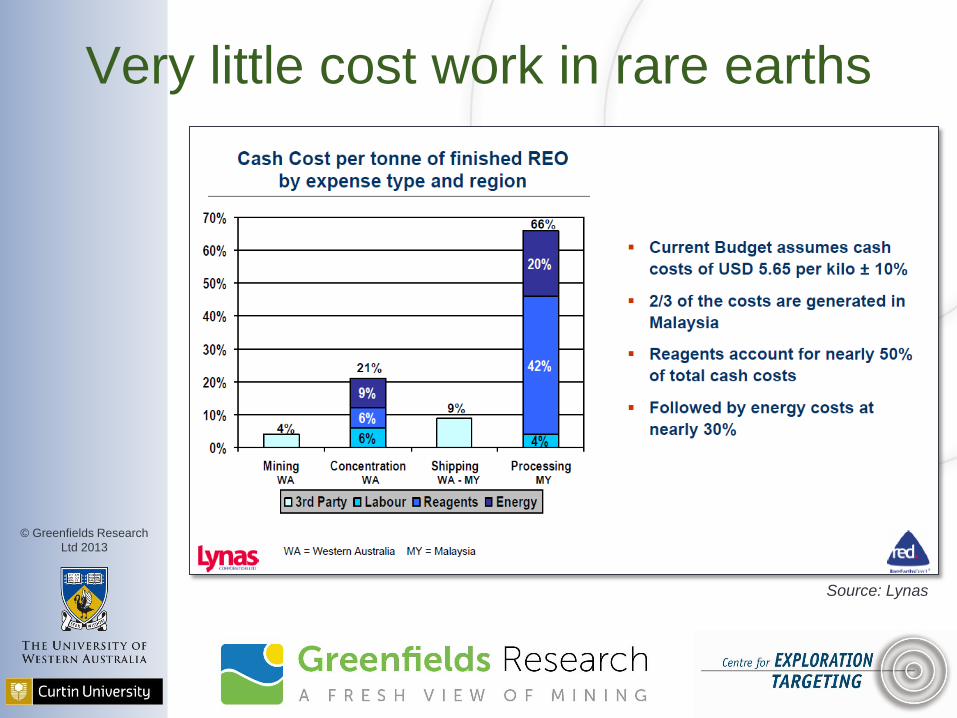
Very little cost work in rare earths
Source: Lynas
© Greenfields Research
Ltd 2013
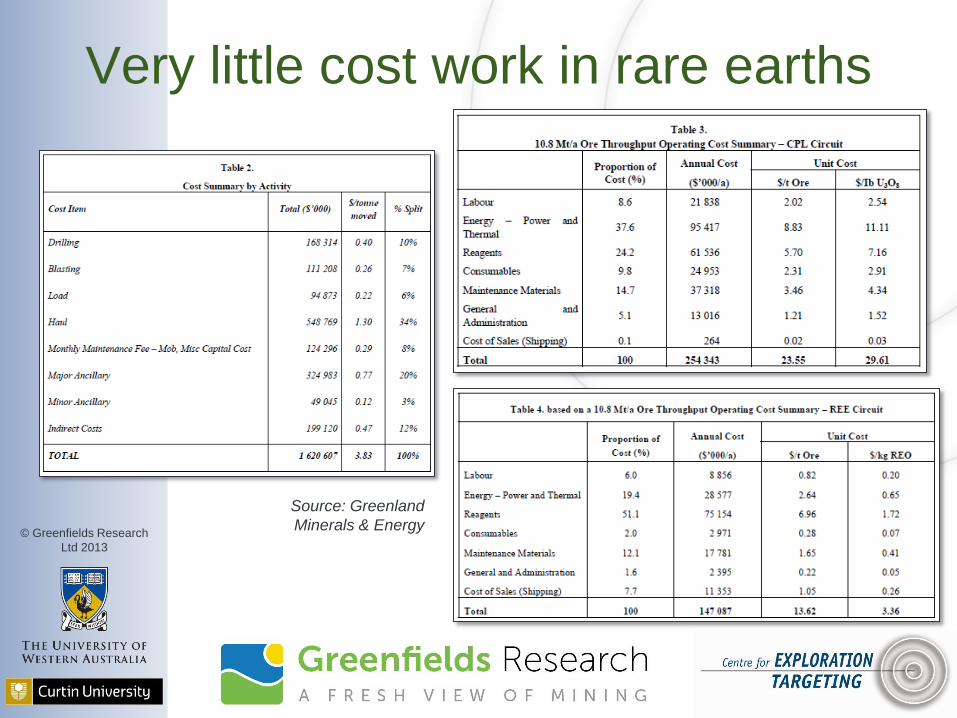
Very little cost work in rare earths
Source: Greenland
Minerals & Energy
© Greenfields Research
Ltd 2013
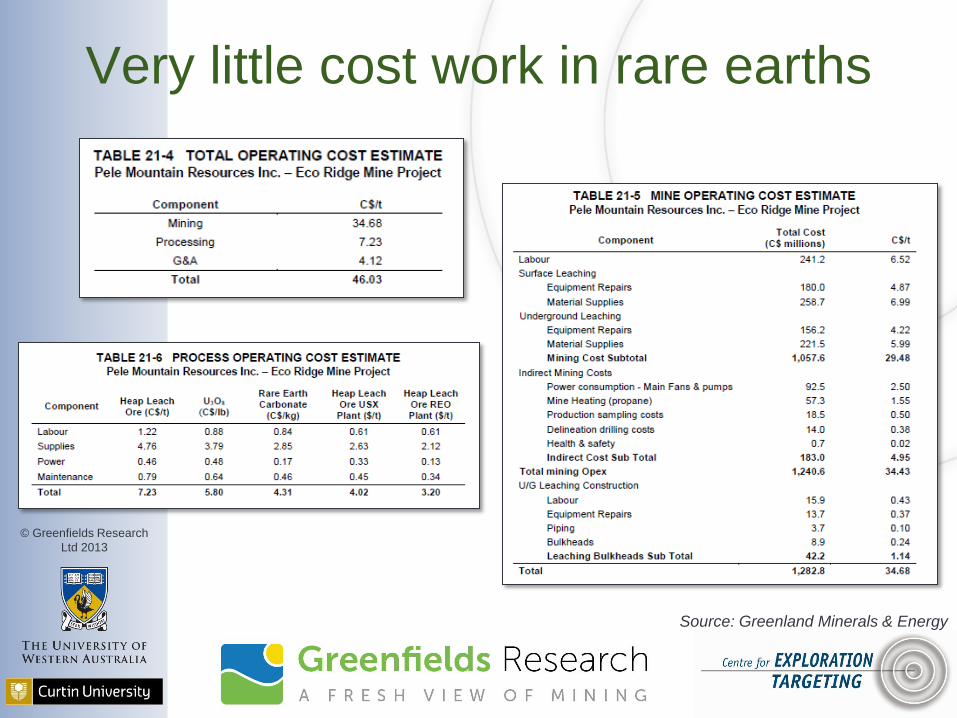
Very little cost work in rare earths
Source: Greenland Minerals & Energy
© Greenfields Research
Ltd 2013
602 Resource Cost & Capital: Rare Earth Mine Costs
Back to Principles: How are costs
calculated for mining? Section 1 Section 2 Section 3 Section 4 Section 5 Section 6 Section 7 Section 8
© Greenfields Research
Ltd 2013
Mine costs 101
Cost of mining = Cost of moving rock

© Greenfields Research
Ltd 2013
How much rock is moved?
Ore throughput x REO grade x recovery
= REO production
© Greenfields Research Ltd
© Greenfields Research
Ltd 2013
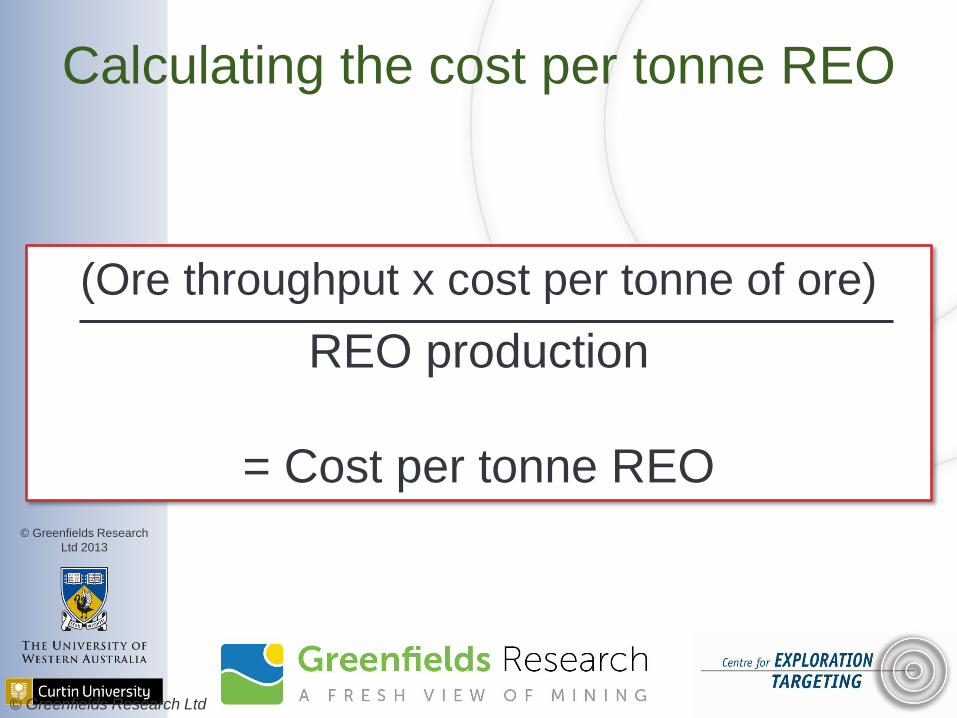
Calculating the cost per tonne REO
(Ore throughput x cost per tonne of ore)
REO production
= Cost per tonne REO
© Greenfields Research Ltd
© Greenfields Research
Ltd 2013
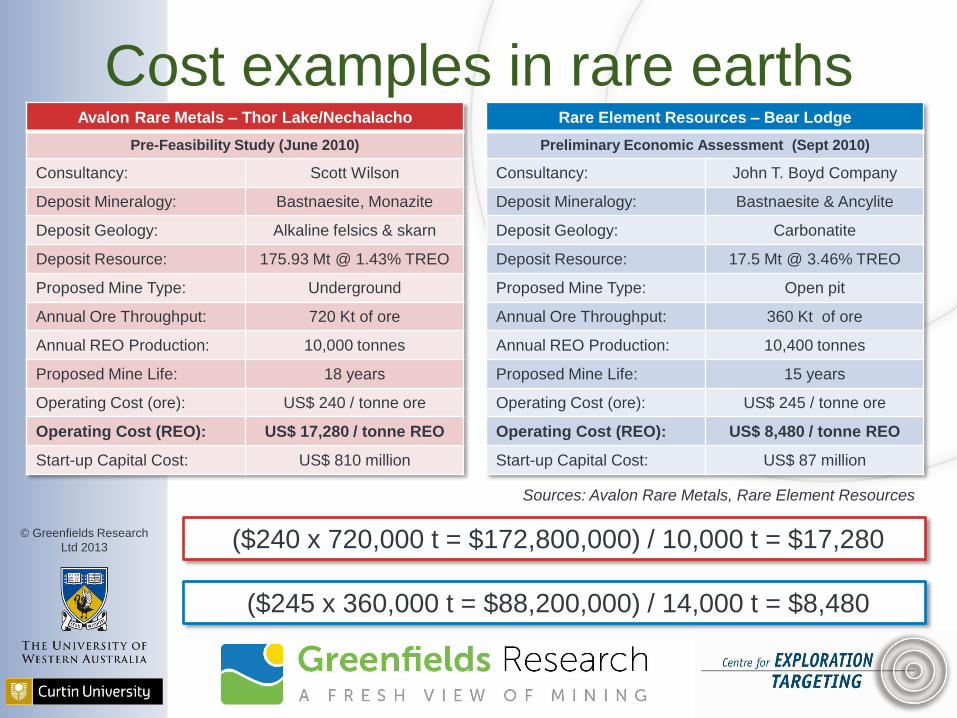
Cost examples in rare earths Avalon Rare Metals – Thor Lake/Nechalacho
Pre-Feasibility Study (June 2010)
Consultancy: Scott Wilson
Deposit Mineralogy: Bastnaesite, Monazite
Deposit Geology: Alkaline felsics & skarn
Deposit Resource: 175.93 Mt @ 1.43% TREO
Proposed Mine Type: Underground
Annual Ore Throughput: 720 Kt of ore
Annual REO Production: 10,000 tonnes
Proposed Mine Life: 18 years
Operating Cost (ore): US$ 240 / tonne ore
Operating Cost (REO): US$ 17,280 / tonne REO
Start-up Capital Cost: US$ 810 million
Rare Element Resources – Bear Lodge
Preliminary Economic Assessment (Sept 2010)
Consultancy: John T. Boyd Company
Deposit Mineralogy: Bastnaesite & Ancylite
Deposit Geology: Carbonatite
Deposit Resource: 17.5 Mt @ 3.46% TREO
Proposed Mine Type: Open pit
Annual Ore Throughput: 360 Kt of ore
Annual REO Production: 10,400 tonnes
Proposed Mine Life: 15 years
Operating Cost (ore): US$ 245 / tonne ore
Operating Cost (REO): US$ 8,480 / tonne REO
Start-up Capital Cost: US$ 87 million
($240 x 720,000 t = $172,800,000) / 10,000 t = $17,280
($245 x 360,000 t = $88,200,000) / 14,000 t = $8,480
Sources: Avalon Rare Metals, Rare Element Resources
© Greenfields Research
Ltd 2013
602 Resource Cost & Capital: Rare Earth Mine Costs
What costs are there in mining and
processing? Section 1 Section 2 Section 3 Section 4 Section 5 Section 6 Section 7 Section 8
© Greenfields Research
Ltd 2013
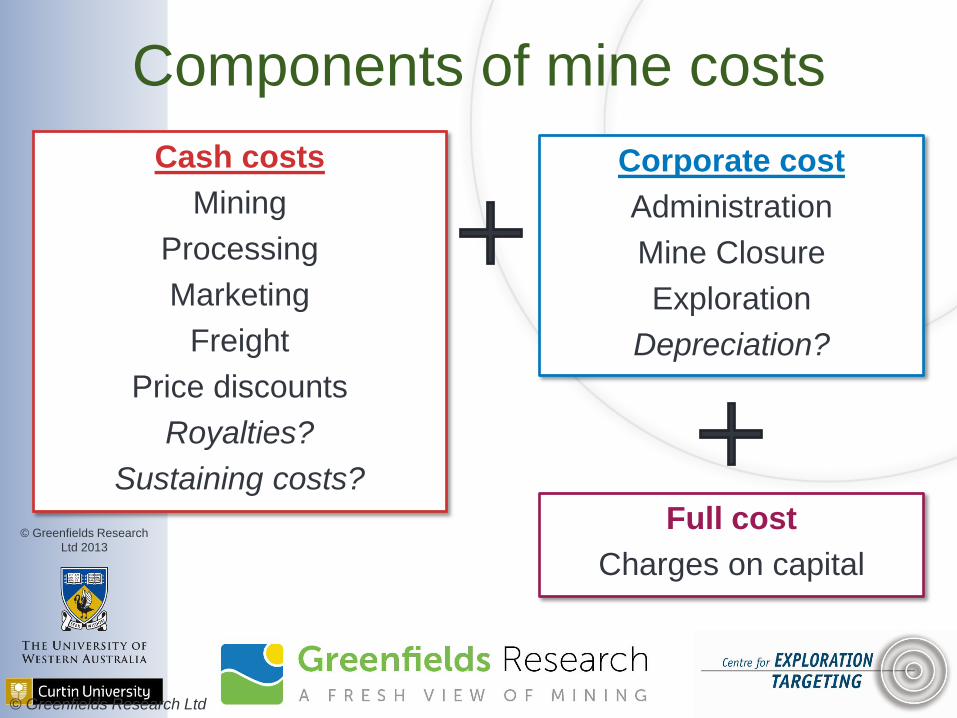
Components of mine costs
Cash costs
Mining
Processing
Marketing
Freight
Price discounts
Royalties?
Sustaining costs?
Corporate cost
Administration
Mine Closure
Exploration
Depreciation?
Full cost
Charges on capital
© Greenfields Research Ltd
© Greenfields Research
Ltd 2013
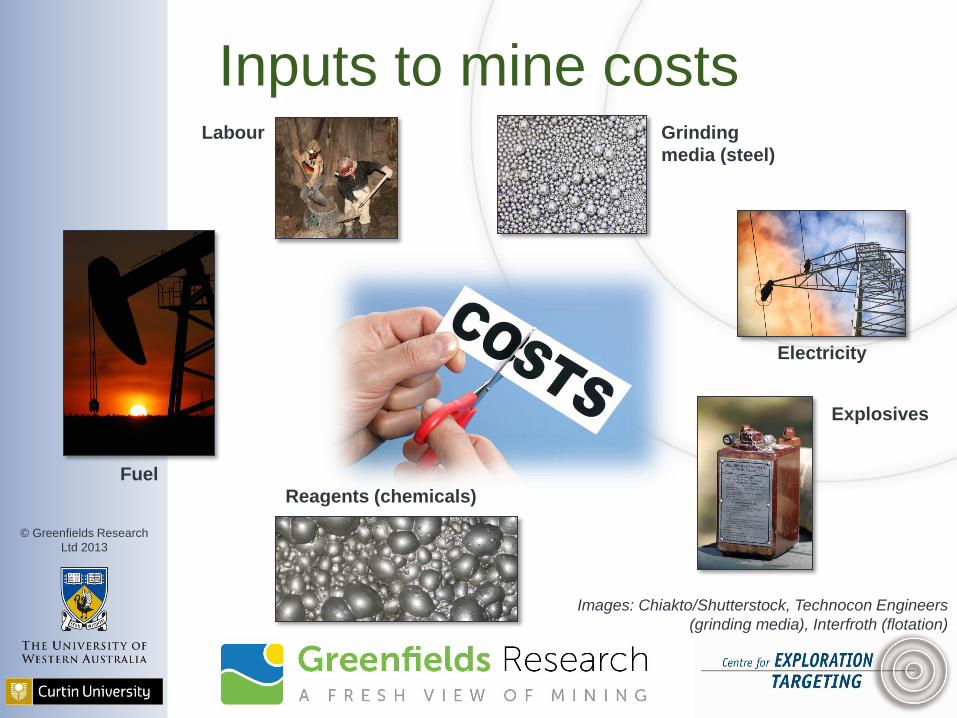
Inputs to mine costs
Fuel
Labour Grinding
media (steel)
Electricity
Explosives
Reagents (chemicals)
Images: Chiakto/Shutterstock, Technocon Engineers
(grinding media), Interfroth (flotation)
© Greenfields Research
Ltd 2013
602 Resource Cost & Capital: Rare Earth Mine Costs
Differing costs for mining and
processing types? Section 1 Section 2 Section 3 Section 4 Section 5 Section 6 Section 7 Section 8
© Greenfields Research
Ltd 2013
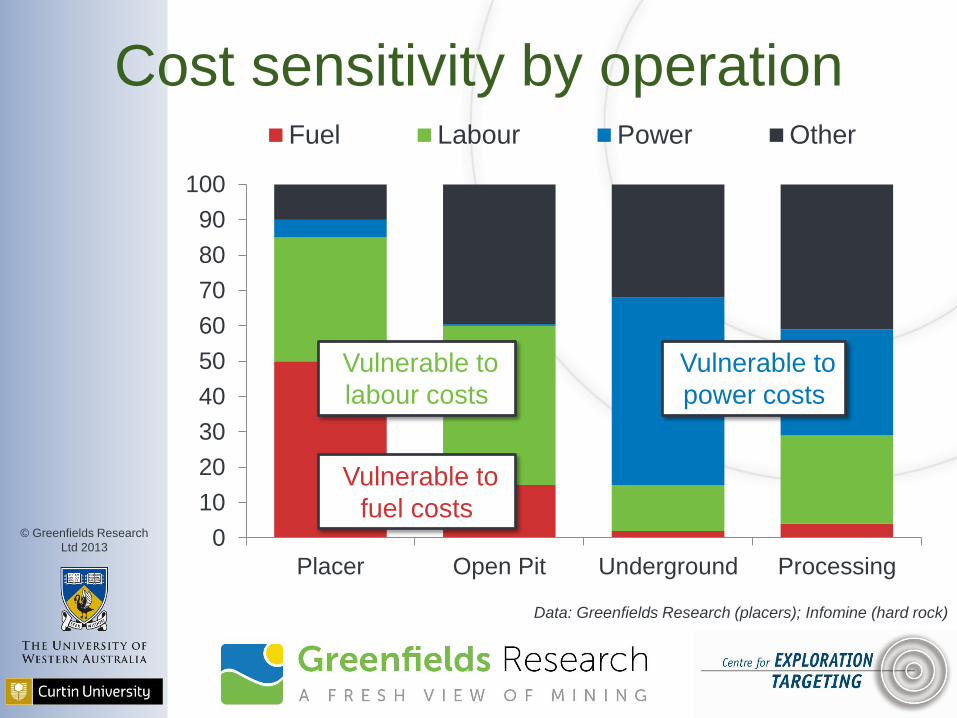
Cost sensitivity by operation
0
10
20
30
40
50
60
70
80
90
100
Placer Open Pit Underground Processing
Fuel Labour Power Other
Vulnerable to
fuel costs
Vulnerable to
labour costs
Vulnerable to
power costs
Data: Greenfields Research (placers); Infomine (hard rock)
© Greenfields Research
Ltd 2013
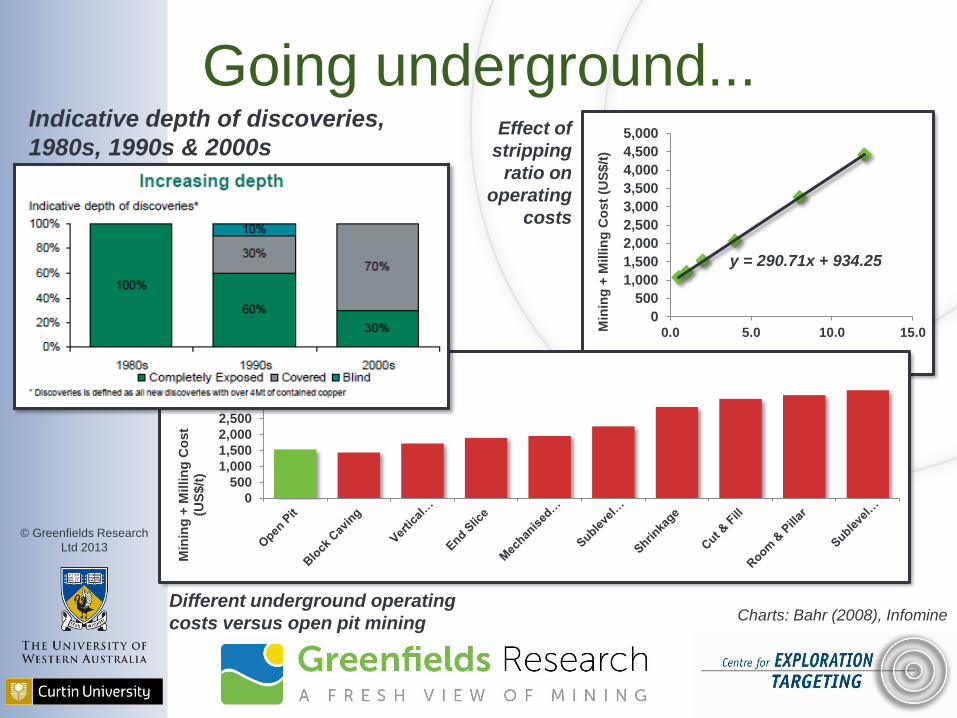
Going underground...
y = 290.71x + 934.25
0
500
1,000
1,500
2,000
2,500
3,000
3,500
4,000
4,500
5,000
0.0 5.0 10.0 15.0Min
ing
+ M
illin
g C
ost
(US
$/t
)
Stripping Ratio
Indicative depth of discoveries,
1980s, 1990s & 2000s
0
500
1,000
1,500
2,000
2,500
3,000
3,500
4,000
Min
ing
+ M
illin
g C
ost
(US
$/t
)
Effect of
stripping
ratio on
operating
costs
Different underground operating
costs versus open pit mining Charts: Bahr (2008), Infomine
© Greenfields Research
Ltd 2013
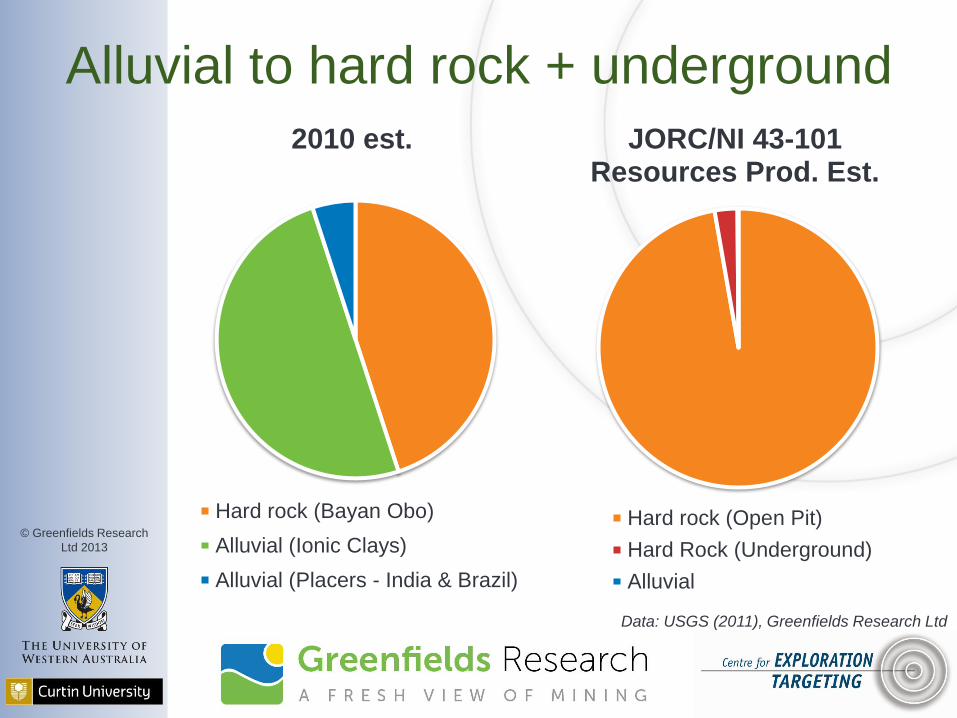
Alluvial to hard rock + underground
2010 est.
Hard rock (Bayan Obo)
Alluvial (Ionic Clays)
Alluvial (Placers - India & Brazil)
JORC/NI 43-101 Resources Prod. Est.
Hard rock (Open Pit)
Hard Rock (Underground)
Alluvial
Data: USGS (2011), Greenfields Research Ltd
© Greenfields Research
Ltd 2013
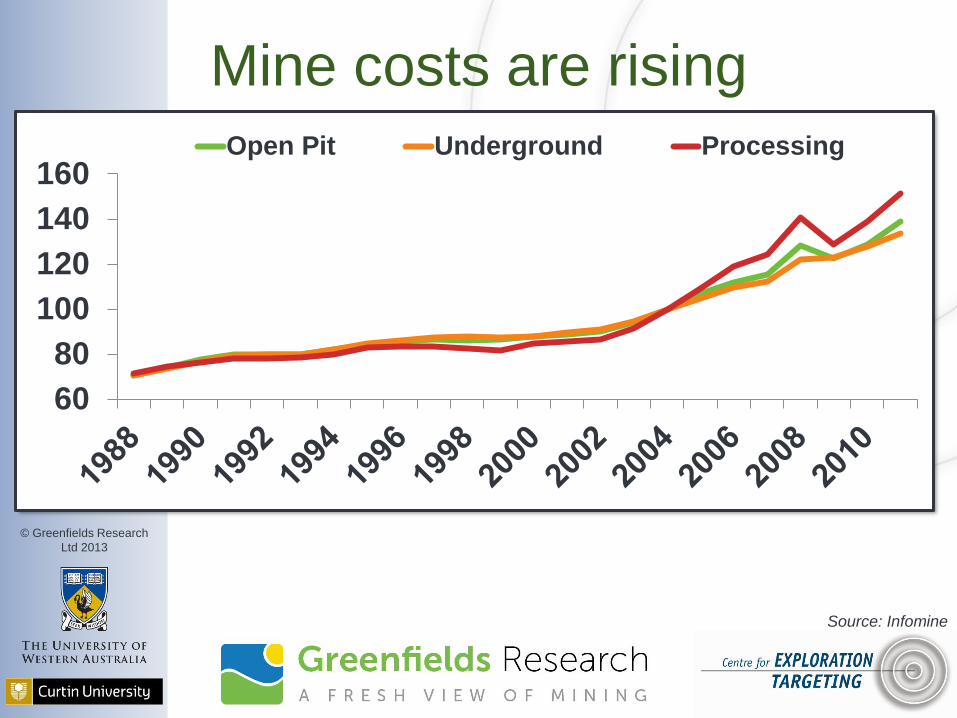
Mine costs are rising
60
80
100
120
140
160Open Pit Underground Processing
Source: Infomine
© Greenfields Research
Ltd 2013
602 Resource Cost & Capital: Rare Earth Mine Costs
The most important cost
sensitivities in mining? Section 1 Section 2 Section 3 Section 4 Section 5 Section 6 Section 7 Section 8
© Greenfields Research
Ltd 2013
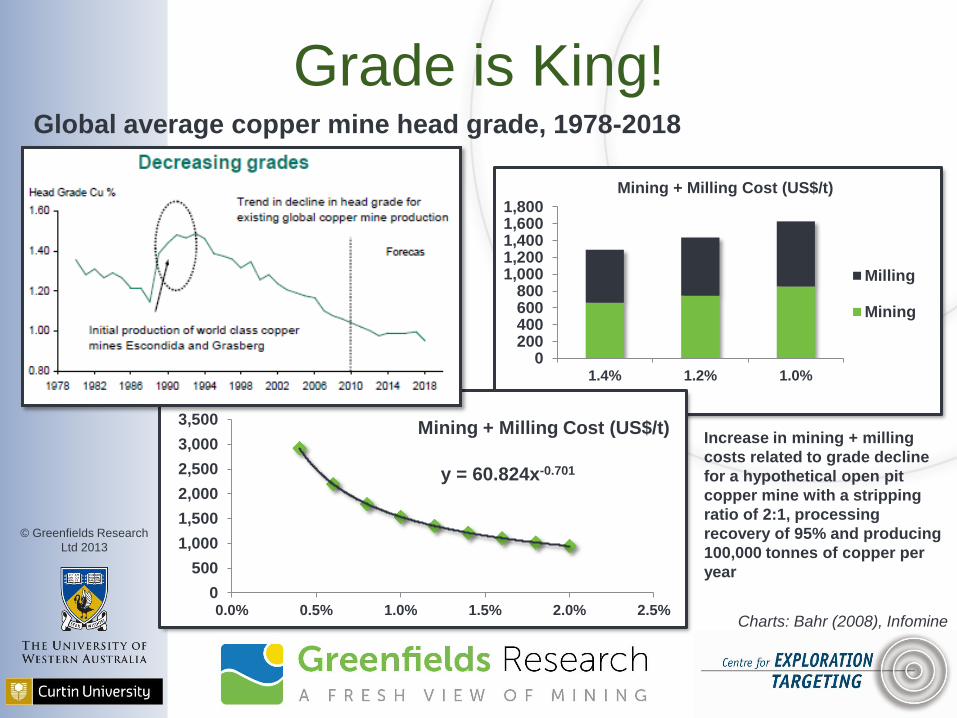
Grade is King!
0200400600800
1,0001,2001,4001,6001,800
1.4% 1.2% 1.0%
Mining + Milling Cost (US$/t)
Milling
Mining
Global average copper mine head grade, 1978-2018
y = 60.824x-0.701
0
500
1,000
1,500
2,000
2,500
3,000
3,500
0.0% 0.5% 1.0% 1.5% 2.0% 2.5%
Mining + Milling Cost (US$/t) Increase in mining + milling
costs related to grade decline
for a hypothetical open pit
copper mine with a stripping
ratio of 2:1, processing
recovery of 95% and producing
100,000 tonnes of copper per
year
Charts: Bahr (2008), Infomine
© Greenfields Research
Ltd 2013
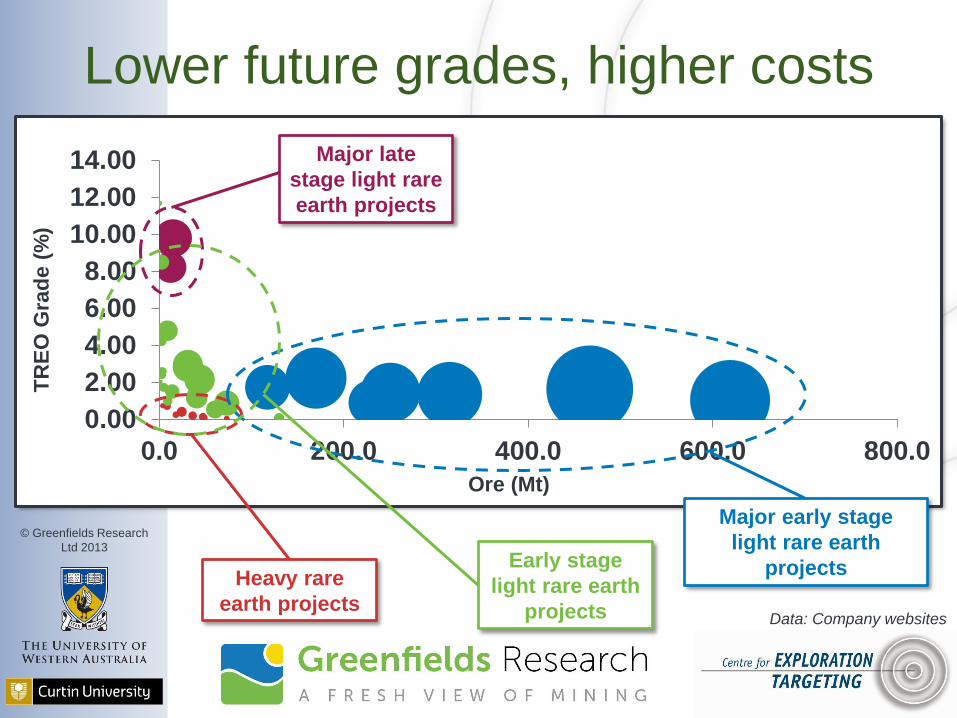
Lower future grades, higher costs
0.00
2.00
4.00
6.00
8.00
10.00
12.00
14.00
0.0 200.0 400.0 600.0 800.0
TR
EO
Gra
de (
%)
Ore (Mt)
Major early stage
light rare earth
projects
Major late
stage light rare
earth projects
Heavy rare
earth projects
Early stage
light rare earth
projects Data: Company websites
© Greenfields Research
Ltd 2013
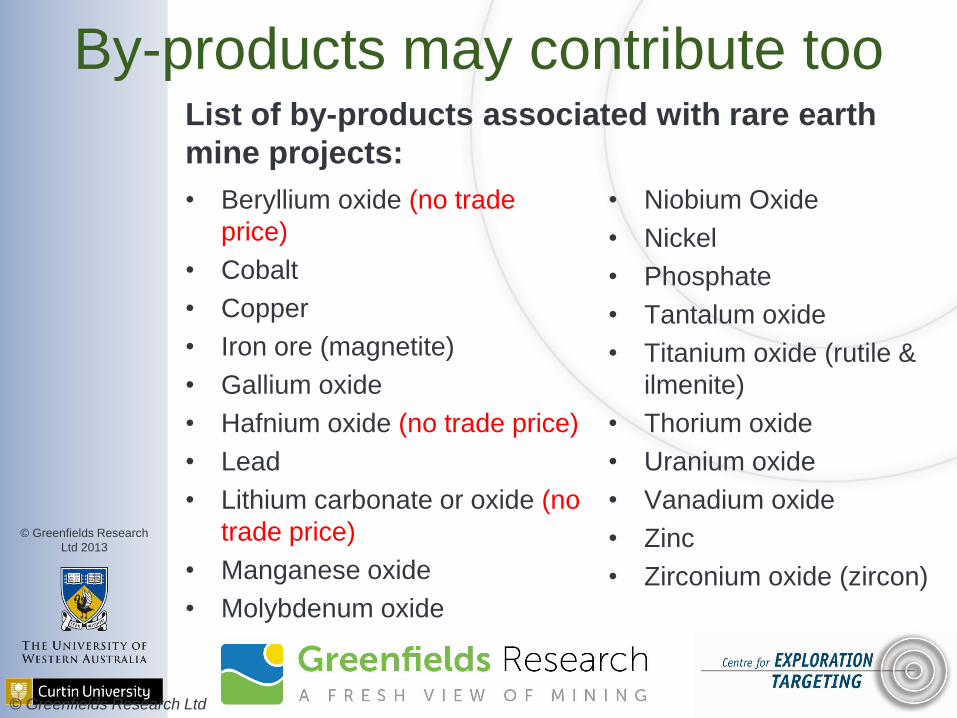
By-products may contribute too List of by-products associated with rare earth
mine projects:
• Beryllium oxide (no trade
price)
• Cobalt
• Copper
• Iron ore (magnetite)
• Gallium oxide
• Hafnium oxide (no trade price)
• Lead
• Lithium carbonate or oxide (no
trade price)
• Manganese oxide
• Molybdenum oxide
• Niobium Oxide
• Nickel
• Phosphate
• Tantalum oxide
• Titanium oxide (rutile &
ilmenite)
• Thorium oxide
• Uranium oxide
• Vanadium oxide
• Zinc
• Zirconium oxide (zircon)
© Greenfields Research Ltd
© Greenfields Research
Ltd 2013
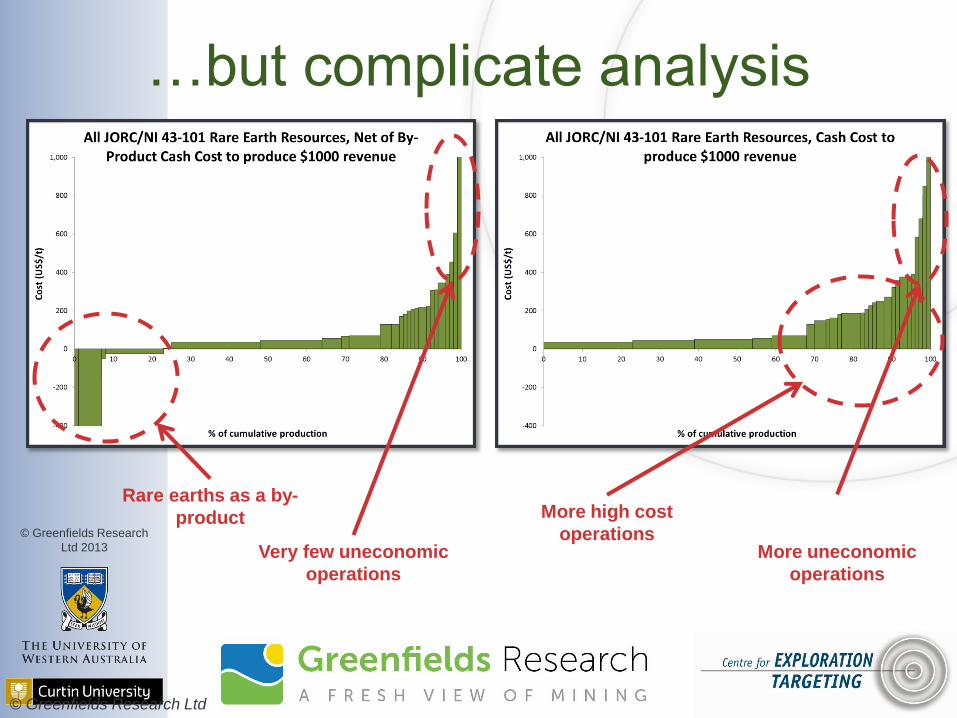
…but complicate analysis
Rare earths as a by-
product
Very few uneconomic
operations
More uneconomic
operations
More high cost
operations
© Greenfields Research Ltd
© Greenfields Research
Ltd 2013
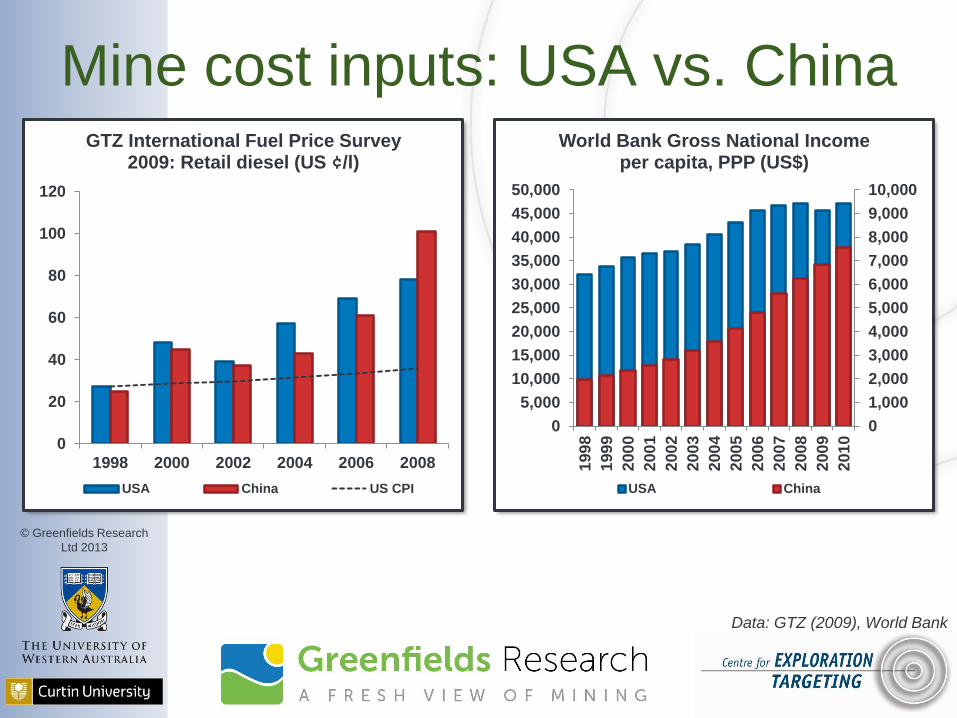
Mine cost inputs: USA vs. China
0
20
40
60
80
100
120
1998 2000 2002 2004 2006 2008
GTZ International Fuel Price Survey 2009: Retail diesel (US ¢/l)
USA China US CPI
0
1,000
2,000
3,000
4,000
5,000
6,000
7,000
8,000
9,000
10,000
0
5,000
10,000
15,000
20,000
25,000
30,000
35,000
40,000
45,000
50,000
199
8
199
9
200
0
200
1
200
2
200
3
200
4
200
5
200
6
200
7
200
8
200
9
201
0
World Bank Gross National Income per capita, PPP (US$)
USA China
Data: GTZ (2009), World Bank
© Greenfields Research
Ltd 2013
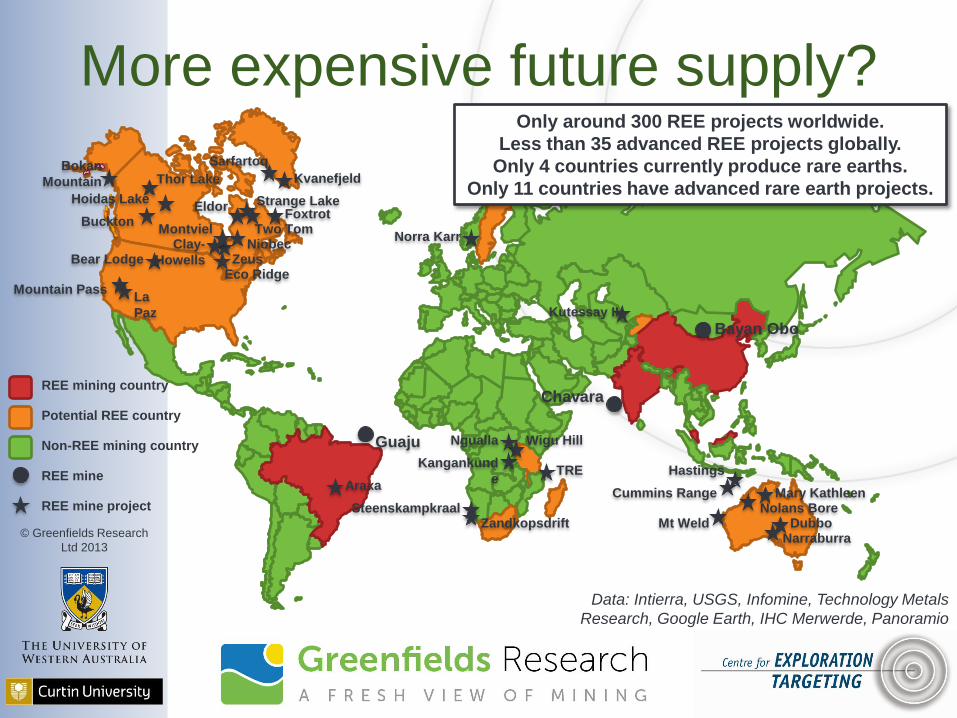
More expensive future supply?
Thor Lake Kvanefjeld
Hoidas Lake
Bokan
Mountain
Zeus
Strange Lake
Sarfartoq
Mountain Pass
Bear Lodge
Wigu Hill
Kangankund
e
Steenskampkraal
Bayan Obo
Chavara
Guaju
Mt Weld
Cummins Range Nolans Bore
Dubbo
Eco Ridge
Eldor
Hastings
Kutessay II
Norra Karr
Zandkopsdrift
Non-REE mining country
REE mining country
REE mine
REE mine project
Potential REE country
Only around 300 REE projects worldwide.
Less than 35 advanced REE projects globally.
Only 4 countries currently produce rare earths.
Only 11 countries have advanced rare earth projects.
Data: Intierra, USGS, Infomine, Technology Metals
Research, Google Earth, IHC Merwerde, Panoramio
Buckton Two Tom
Foxtrot
Niobec Montviel
Clay-
Howells
La
Paz
Araxa
Ngualla
TRE
Mary Kathleen
Narraburra
© Greenfields Research
Ltd 2013
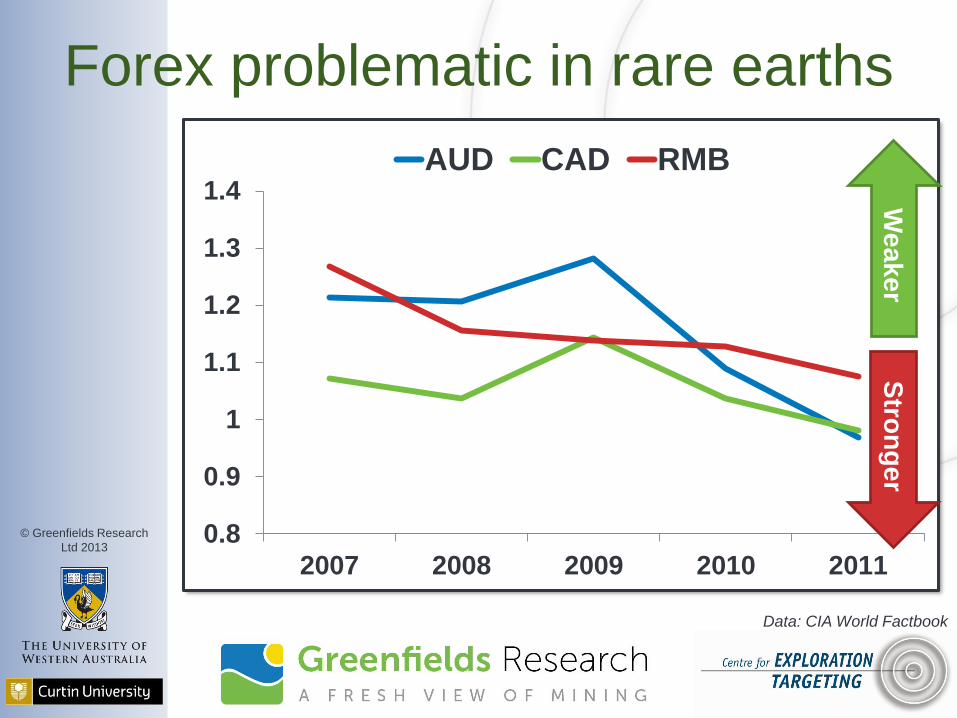
Forex problematic in rare earths
0.8
0.9
1
1.1
1.2
1.3
1.4
2007 2008 2009 2010 2011
AUD CAD RMB
Stro
ng
er
We
ak
er
Data: CIA World Factbook
© Greenfields Research
Ltd 2013
602 Resource Cost & Capital: Rare Earth Mine Costs
What about capital costs?
Section 1 Section 2 Section 3 Section 4 Section 5 Section 6 Section 7 Section 8
© Greenfields Research
Ltd 2013
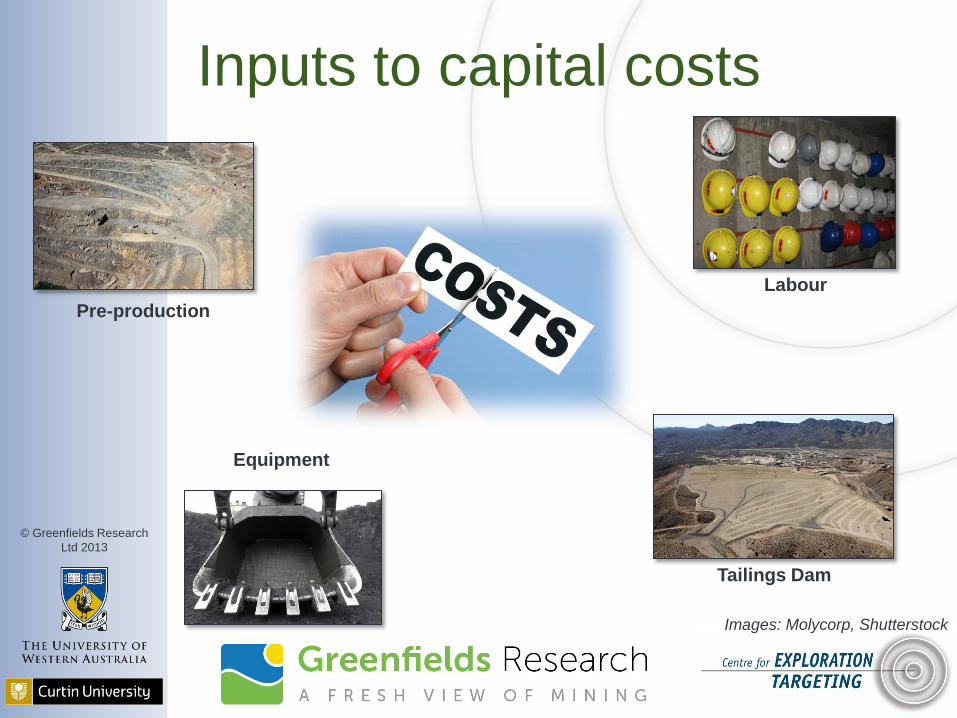
Inputs to capital costs
Pre-production
Equipment
Labour
Tailings Dam
Images: Molycorp, Shutterstock
© Greenfields Research
Ltd 2013
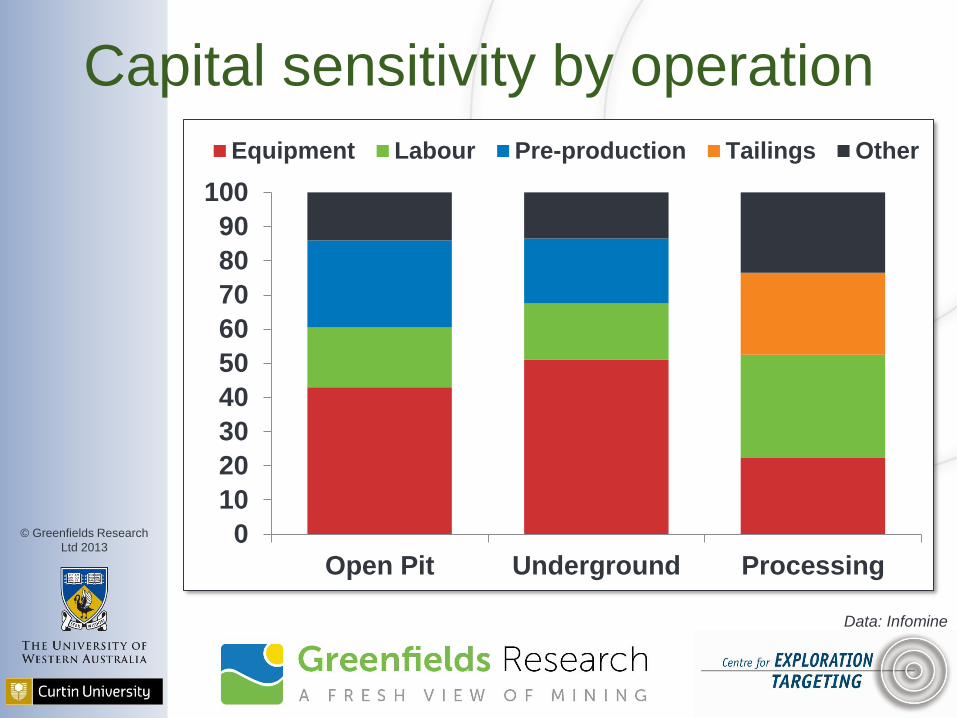
Capital sensitivity by operation
0
10
20
30
40
50
60
70
80
90
100
Open Pit Underground Processing
Equipment Labour Pre-production Tailings Other
Data: Infomine
© Greenfields Research
Ltd 2013
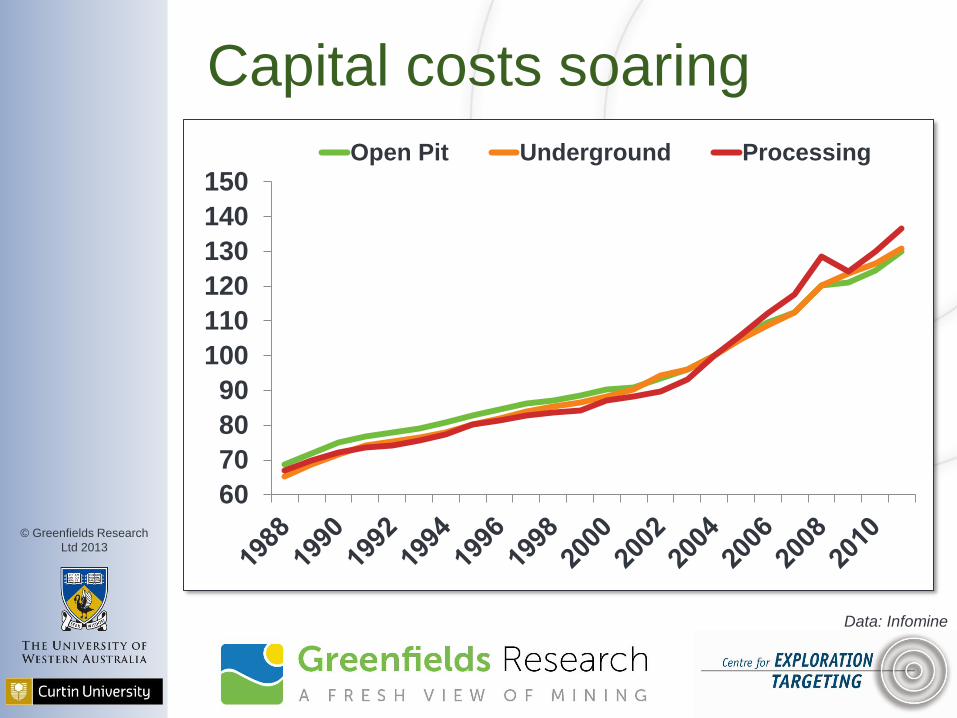
Capital costs soaring
60
70
80
90
100
110
120
130
140
150Open Pit Underground Processing
Data: Infomine
© Greenfields Research
Ltd 2013
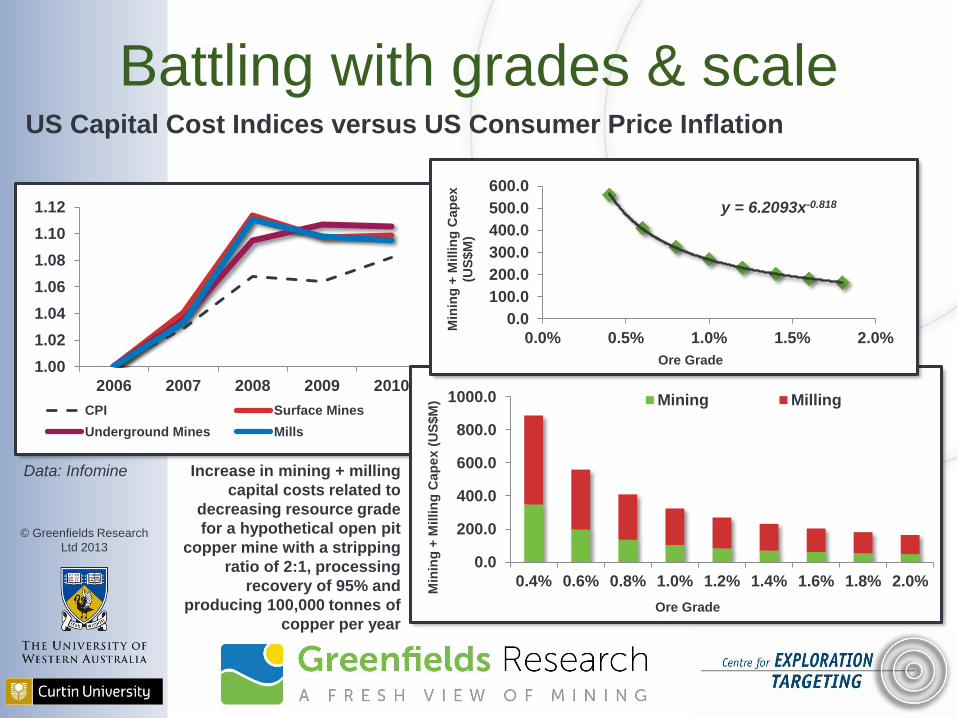
Battling with grades & scale
1.00
1.02
1.04
1.06
1.08
1.10
1.12
2006 2007 2008 2009 2010
CPI Surface Mines
Underground Mines Mills
0.0
200.0
400.0
600.0
800.0
1000.0
0.4% 0.6% 0.8% 1.0% 1.2% 1.4% 1.6% 1.8% 2.0%
Min
ing
+ M
illin
g C
ap
ex (
US
$M
)
Ore Grade
Mining Milling
y = 6.2093x-0.818
0.0
100.0
200.0
300.0
400.0
500.0
600.0
0.0% 0.5% 1.0% 1.5% 2.0%
Min
ing
+ M
illin
g C
ap
ex
(US
$M
)
Ore Grade
US Capital Cost Indices versus US Consumer Price Inflation
Increase in mining + milling
capital costs related to
decreasing resource grade
for a hypothetical open pit
copper mine with a stripping
ratio of 2:1, processing
recovery of 95% and
producing 100,000 tonnes of
copper per year
Data: Infomine
© Greenfields Research
Ltd 2013
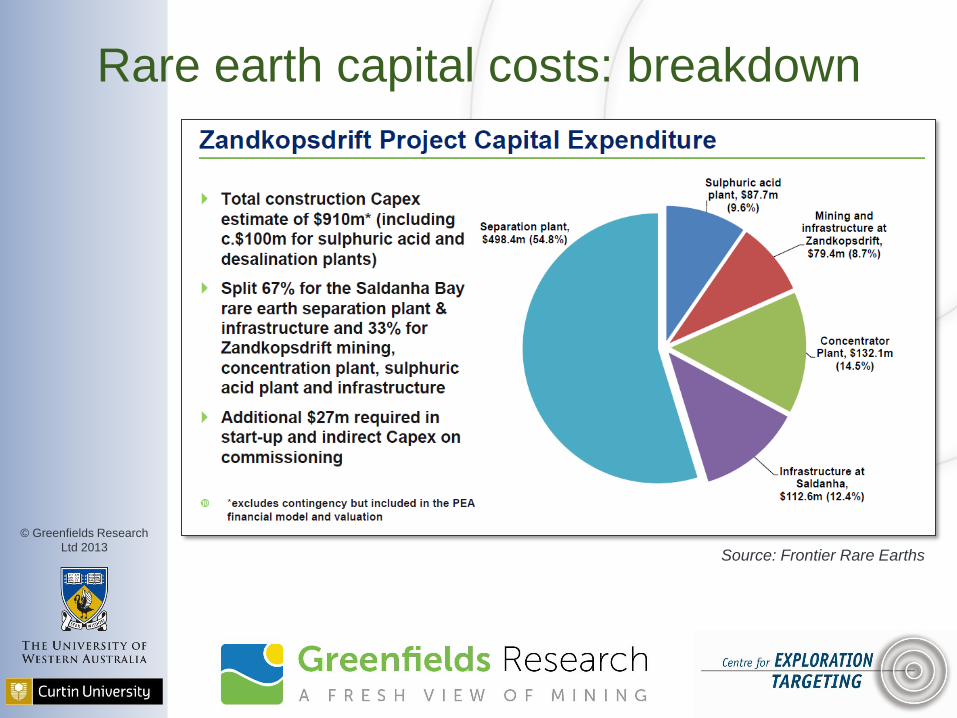
Rare earth capital costs: breakdown
Source: Frontier Rare Earths
© Greenfields Research
Ltd 2013
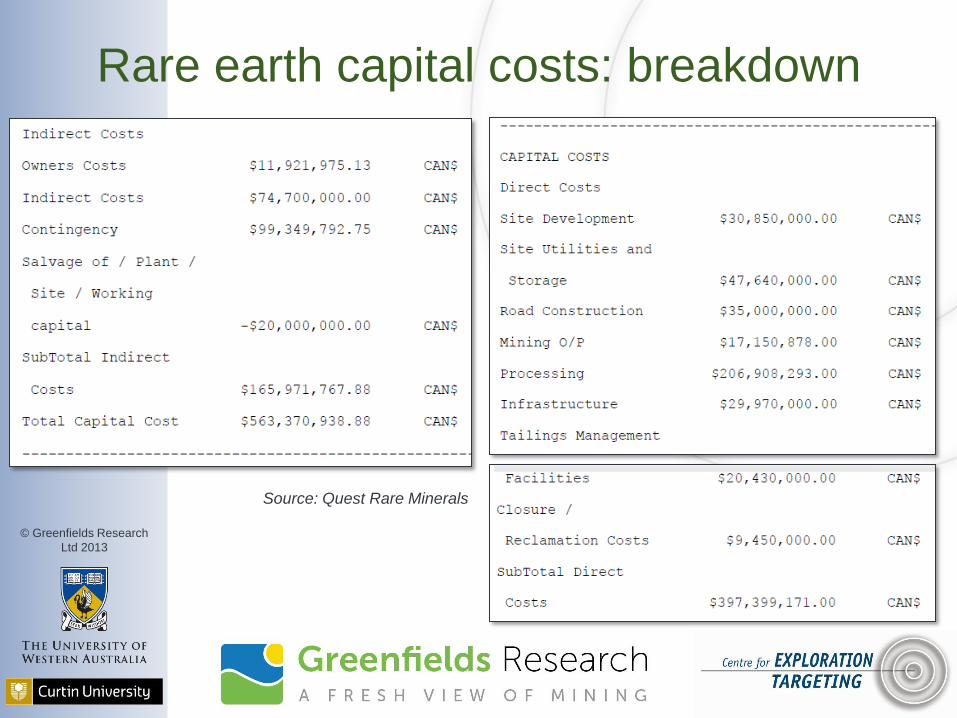
Rare earth capital costs: breakdown
Source: Quest Rare Minerals
© Greenfields Research
Ltd 2013
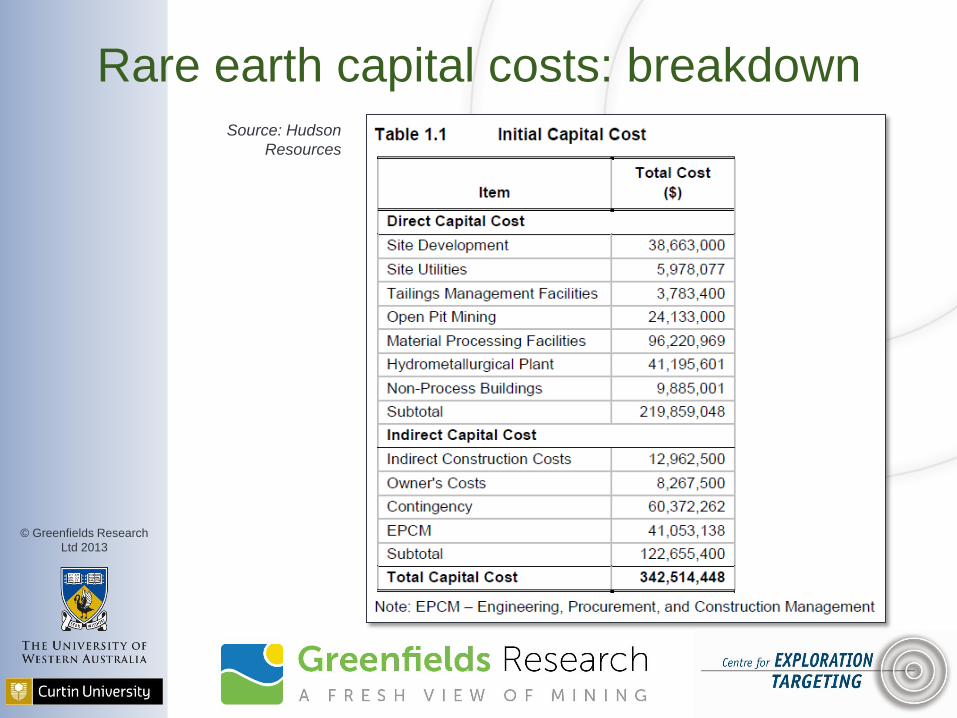
Rare earth capital costs: breakdown Source: Hudson
Resources
© Greenfields Research
Ltd 2013
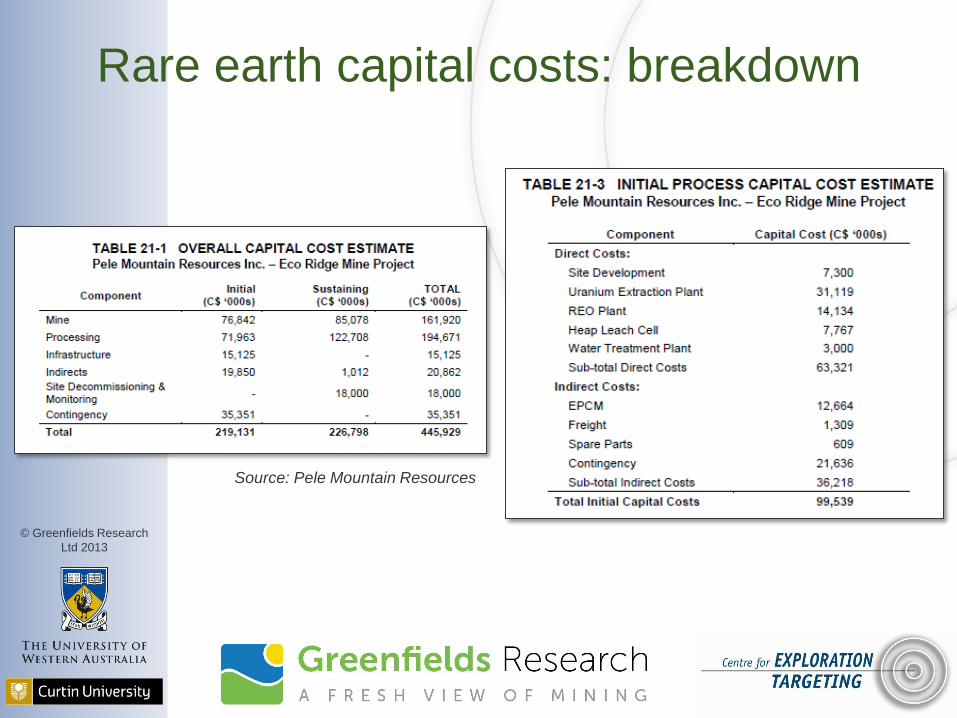
Rare earth capital costs: breakdown
Source: Pele Mountain Resources
© Greenfields Research
Ltd 2013
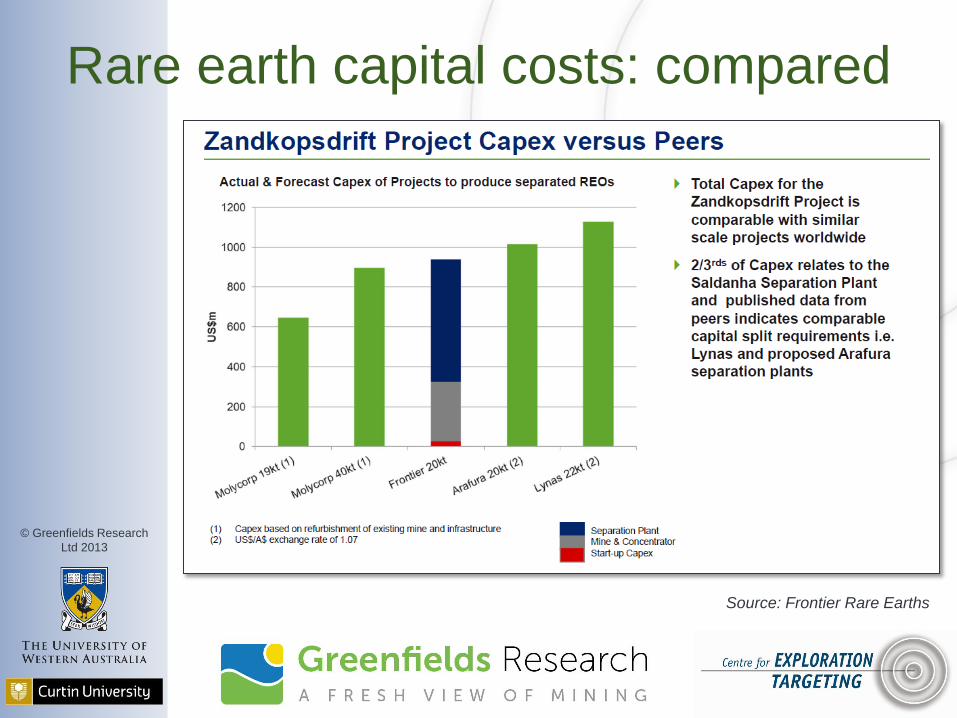
Rare earth capital costs: compared
Source: Frontier Rare Earths
© Greenfields Research
Ltd 2013
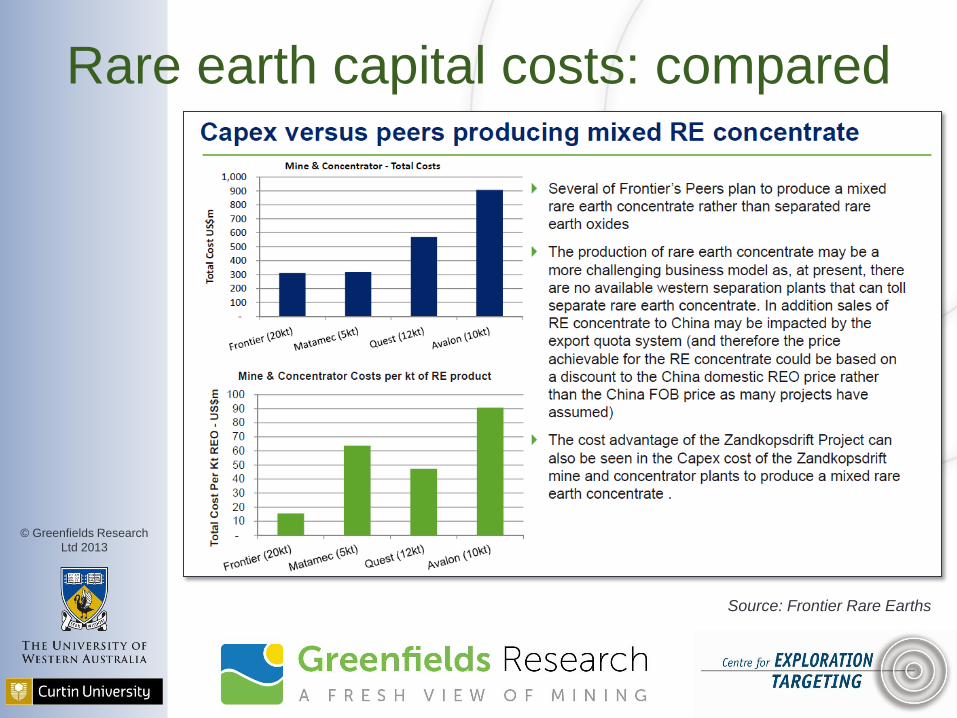
Rare earth capital costs: compared
Source: Frontier Rare Earths

© Greenfields Research
Ltd 2013
602 Resource Cost & Capital: Rare Earth Mine Costs
Calculating mining costs for rare
earth projects Section 1 Section 2 Section 3 Section 4 Section 5 Section 6 Section 7 Section 8
© Greenfields Research
Ltd 2013
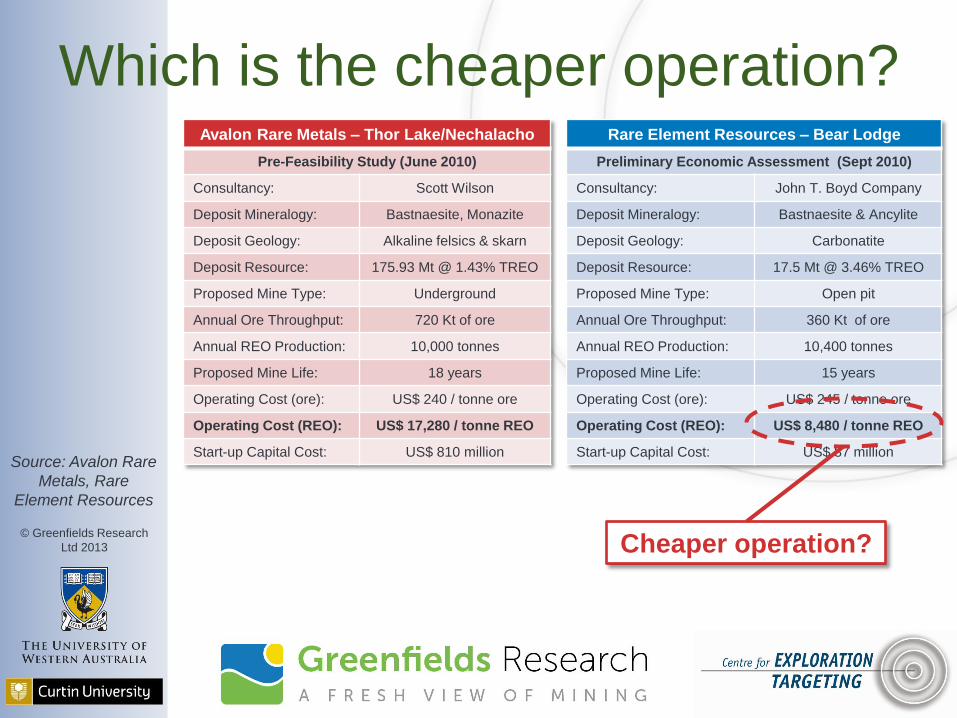
Which is the cheaper operation? Avalon Rare Metals – Thor Lake/Nechalacho
Pre-Feasibility Study (June 2010)
Consultancy: Scott Wilson
Deposit Mineralogy: Bastnaesite, Monazite
Deposit Geology: Alkaline felsics & skarn
Deposit Resource: 175.93 Mt @ 1.43% TREO
Proposed Mine Type: Underground
Annual Ore Throughput: 720 Kt of ore
Annual REO Production: 10,000 tonnes
Proposed Mine Life: 18 years
Operating Cost (ore): US$ 240 / tonne ore
Operating Cost (REO): US$ 17,280 / tonne REO
Start-up Capital Cost: US$ 810 million
Rare Element Resources – Bear Lodge
Preliminary Economic Assessment (Sept 2010)
Consultancy: John T. Boyd Company
Deposit Mineralogy: Bastnaesite & Ancylite
Deposit Geology: Carbonatite
Deposit Resource: 17.5 Mt @ 3.46% TREO
Proposed Mine Type: Open pit
Annual Ore Throughput: 360 Kt of ore
Annual REO Production: 10,400 tonnes
Proposed Mine Life: 15 years
Operating Cost (ore): US$ 245 / tonne ore
Operating Cost (REO): US$ 8,480 / tonne REO
Start-up Capital Cost: US$ 87 million
Cheaper operation?
Source: Avalon Rare
Metals, Rare
Element Resources
© Greenfields Research
Ltd 2013
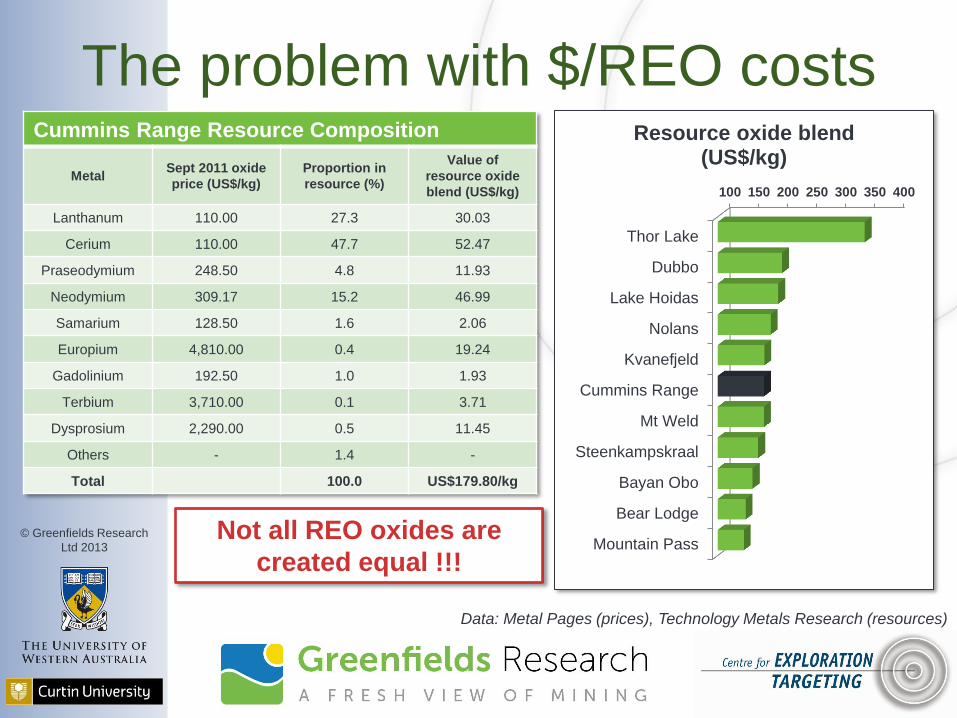
The problem with $/REO costs Cummins Range Resource Composition
Metal Sept 2011 oxide
price (US$/kg)
Proportion in
resource (%)
Value of
resource oxide
blend (US$/kg)
Lanthanum 110.00 27.3 30.03
Cerium 110.00 47.7 52.47
Praseodymium 248.50 4.8 11.93
Neodymium 309.17 15.2 46.99
Samarium 128.50 1.6 2.06
Europium 4,810.00 0.4 19.24
Gadolinium 192.50 1.0 1.93
Terbium 3,710.00 0.1 3.71
Dysprosium 2,290.00 0.5 11.45
Others - 1.4 -
Total 100.0 US$179.80/kg
100 150 200 250 300 350 400
Thor Lake
Dubbo
Lake Hoidas
Nolans
Kvanefjeld
Cummins Range
Mt Weld
Steenkampskraal
Bayan Obo
Bear Lodge
Mountain Pass
Resource oxide blend (US$/kg)
Not all REO oxides are
created equal !!!
Data: Metal Pages (prices), Technology Metals Research (resources)
© Greenfields Research
Ltd 2013
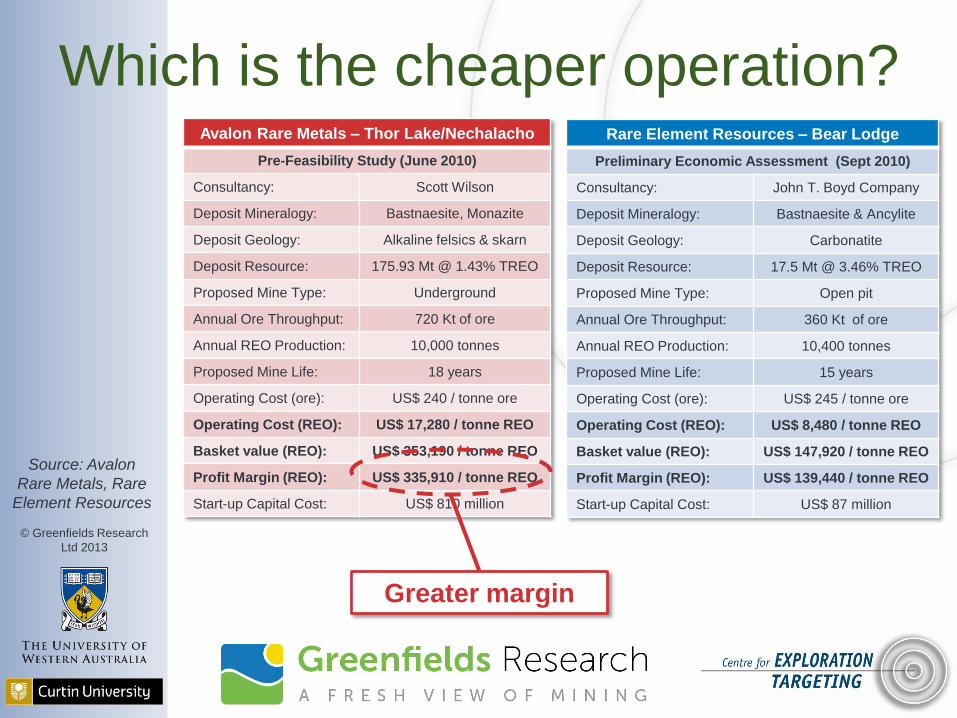
Which is the cheaper operation? Avalon Rare Metals – Thor Lake/Nechalacho
Pre-Feasibility Study (June 2010)
Consultancy: Scott Wilson
Deposit Mineralogy: Bastnaesite, Monazite
Deposit Geology: Alkaline felsics & skarn
Deposit Resource: 175.93 Mt @ 1.43% TREO
Proposed Mine Type: Underground
Annual Ore Throughput: 720 Kt of ore
Annual REO Production: 10,000 tonnes
Proposed Mine Life: 18 years
Operating Cost (ore): US$ 240 / tonne ore
Operating Cost (REO): US$ 17,280 / tonne REO
Basket value (REO): US$ 353,190 / tonne REO
Profit Margin (REO): US$ 335,910 / tonne REO
Start-up Capital Cost: US$ 810 million
Rare Element Resources – Bear Lodge
Preliminary Economic Assessment (Sept 2010)
Consultancy: John T. Boyd Company
Deposit Mineralogy: Bastnaesite & Ancylite
Deposit Geology: Carbonatite
Deposit Resource: 17.5 Mt @ 3.46% TREO
Proposed Mine Type: Open pit
Annual Ore Throughput: 360 Kt of ore
Annual REO Production: 10,400 tonnes
Proposed Mine Life: 15 years
Operating Cost (ore): US$ 245 / tonne ore
Operating Cost (REO): US$ 8,480 / tonne REO
Basket value (REO): US$ 147,920 / tonne REO
Profit Margin (REO): US$ 139,440 / tonne REO
Start-up Capital Cost: US$ 87 million
Greater margin
Source: Avalon
Rare Metals, Rare
Element Resources

© Greenfields Research
Ltd 2013
What’s missing here?
Source: Molycorp
© Greenfields Research
Ltd 2013
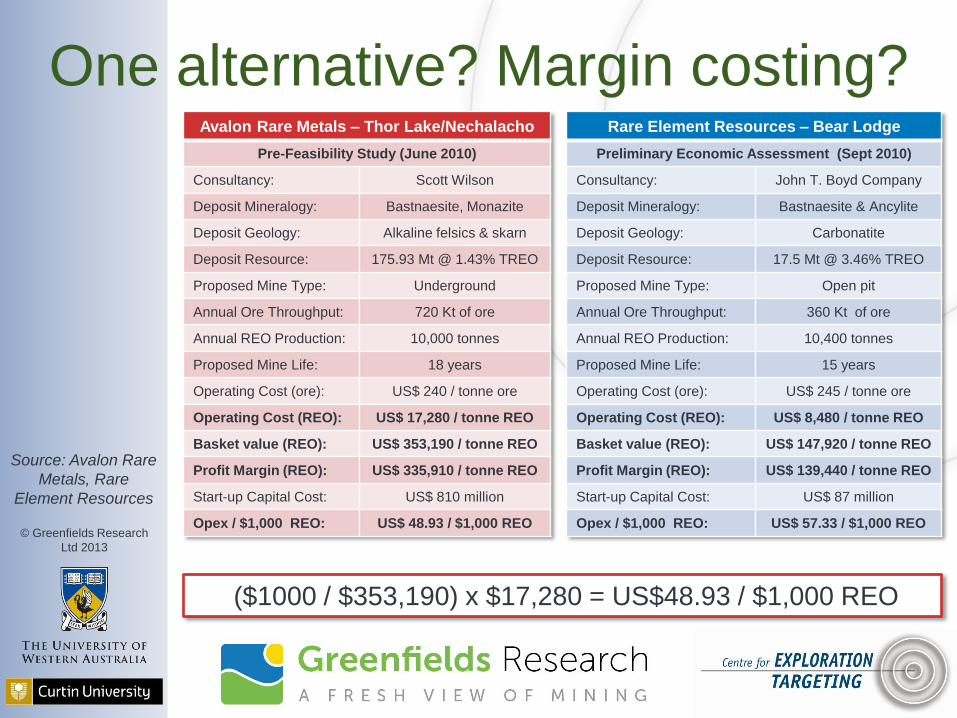
One alternative? Margin costing? Avalon Rare Metals – Thor Lake/Nechalacho
Pre-Feasibility Study (June 2010)
Consultancy: Scott Wilson
Deposit Mineralogy: Bastnaesite, Monazite
Deposit Geology: Alkaline felsics & skarn
Deposit Resource: 175.93 Mt @ 1.43% TREO
Proposed Mine Type: Underground
Annual Ore Throughput: 720 Kt of ore
Annual REO Production: 10,000 tonnes
Proposed Mine Life: 18 years
Operating Cost (ore): US$ 240 / tonne ore
Operating Cost (REO): US$ 17,280 / tonne REO
Basket value (REO): US$ 353,190 / tonne REO
Profit Margin (REO): US$ 335,910 / tonne REO
Start-up Capital Cost: US$ 810 million
Opex / $1,000 REO: US$ 48.93 / $1,000 REO
Rare Element Resources – Bear Lodge
Preliminary Economic Assessment (Sept 2010)
Consultancy: John T. Boyd Company
Deposit Mineralogy: Bastnaesite & Ancylite
Deposit Geology: Carbonatite
Deposit Resource: 17.5 Mt @ 3.46% TREO
Proposed Mine Type: Open pit
Annual Ore Throughput: 360 Kt of ore
Annual REO Production: 10,400 tonnes
Proposed Mine Life: 15 years
Operating Cost (ore): US$ 245 / tonne ore
Operating Cost (REO): US$ 8,480 / tonne REO
Basket value (REO): US$ 147,920 / tonne REO
Profit Margin (REO): US$ 139,440 / tonne REO
Start-up Capital Cost: US$ 87 million
Opex / $1,000 REO: US$ 57.33 / $1,000 REO
($1000 / $353,190) x $17,280 = US$48.93 / $1,000 REO
Source: Avalon Rare
Metals, Rare
Element Resources
© Greenfields Research
Ltd 2013
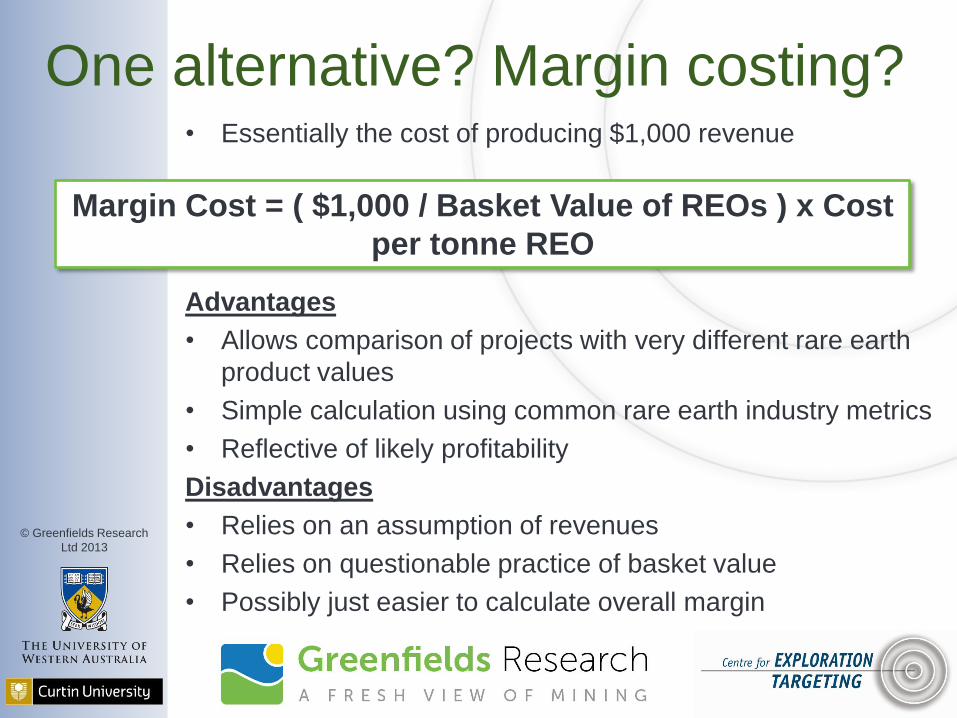
One alternative? Margin costing? • Essentially the cost of producing $1,000 revenue
Advantages
• Allows comparison of projects with very different rare earth
product values
• Simple calculation using common rare earth industry metrics
• Reflective of likely profitability
Disadvantages
• Relies on an assumption of revenues
• Relies on questionable practice of basket value
• Possibly just easier to calculate overall margin
Margin Cost = ( $1,000 / Basket Value of REOs ) x Cost
per tonne REO
© Greenfields Research
Ltd 2013
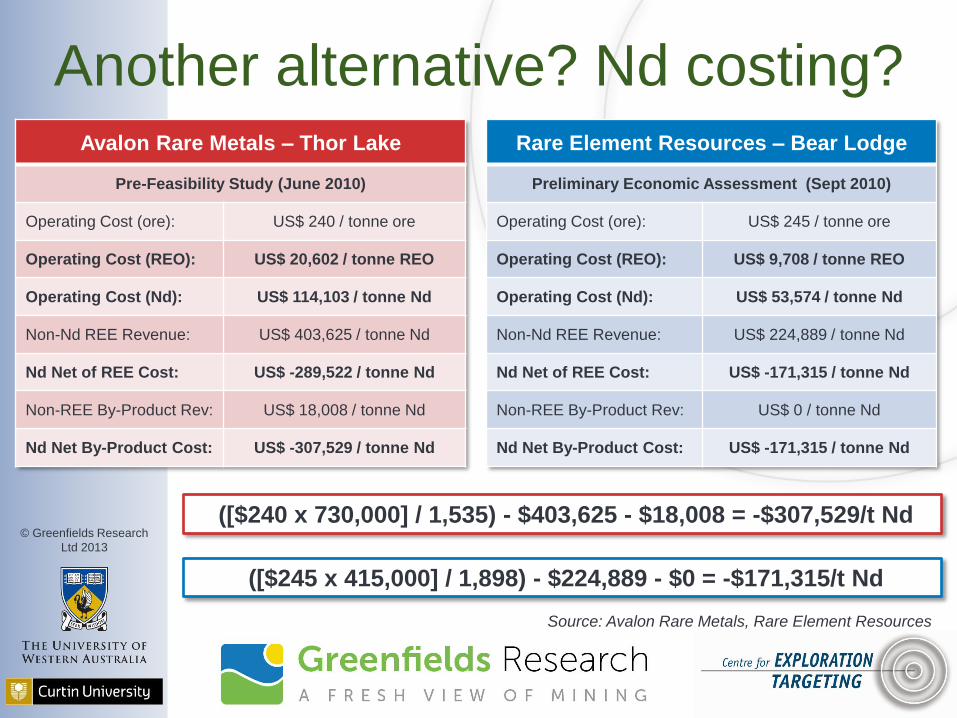
Another alternative? Nd costing? Avalon Rare Metals – Thor Lake
Pre-Feasibility Study (June 2010)
Operating Cost (ore): US$ 240 / tonne ore
Operating Cost (REO): US$ 20,602 / tonne REO
Operating Cost (Nd): US$ 114,103 / tonne Nd
Non-Nd REE Revenue: US$ 403,625 / tonne Nd
Nd Net of REE Cost: US$ -289,522 / tonne Nd
Non-REE By-Product Rev: US$ 18,008 / tonne Nd
Nd Net By-Product Cost: US$ -307,529 / tonne Nd
Rare Element Resources – Bear Lodge
Preliminary Economic Assessment (Sept 2010)
Operating Cost (ore): US$ 245 / tonne ore
Operating Cost (REO): US$ 9,708 / tonne REO
Operating Cost (Nd): US$ 53,574 / tonne Nd
Non-Nd REE Revenue: US$ 224,889 / tonne Nd
Nd Net of REE Cost: US$ -171,315 / tonne Nd
Non-REE By-Product Rev: US$ 0 / tonne Nd
Nd Net By-Product Cost: US$ -171,315 / tonne Nd
([$240 x 730,000] / 1,535) - $403,625 - $18,008 = -$307,529/t Nd
Source: Avalon Rare Metals, Rare Element Resources
([$245 x 415,000] / 1,898) - $224,889 - $0 = -$171,315/t Nd

© Greenfields Research
Ltd 2013
Another alternative? Dy costing? Avalon Rare Metals – Thor Lake
Pre-Feasibility Study (June 2010)
Operating Cost (ore): US$ 240 / tonne ore
Operating Cost (REO): US$ 20,602 / tonne REO
Operating Cost (Dy): US$ 741,668 / tonne Dy
Non-Dy REE Revenue: US$ 2,596,769 / tonne Dy
Dy Net of REE Cost: US$ -1,855,101 / tonne Dy
Non-REE By-Product Rev: US$ 117,050 / tonne Dy
Dy Net By-Product Cost: US$ -1,972,151 / tonne Dy
Rare Element Resources – Bear Lodge
Preliminary Economic Assessment (Sept 2010)
Operating Cost (ore): US$ 245 / tonne ore
Operating Cost (REO): US$ 9,708 / tonne REO
Operating Cost (Dy): US$ 2,892,979 / tonne Dy
Non-Dy REE Revenue: US$ 16,460,748 / tonne Dy
Dy Net of REE Cost: US$ -13,567,769 / tonne Dy
Non-REE By-Product Rev: US$ 0 / tonne Dy
Dy Net By-Product Cost: US$ -13,567,769 / tonne Dy
([$240 x 730,000] / 236) - $2,596,769 - $117,050 = -$1,972,151/t Dy
Source: Avalon Rare Metals, Rare Element Resources
([$245 x 415,000] / 35) - $16,460,748 - $0 = -$13,567,769/t Dy
© Greenfields Research
Ltd 2013
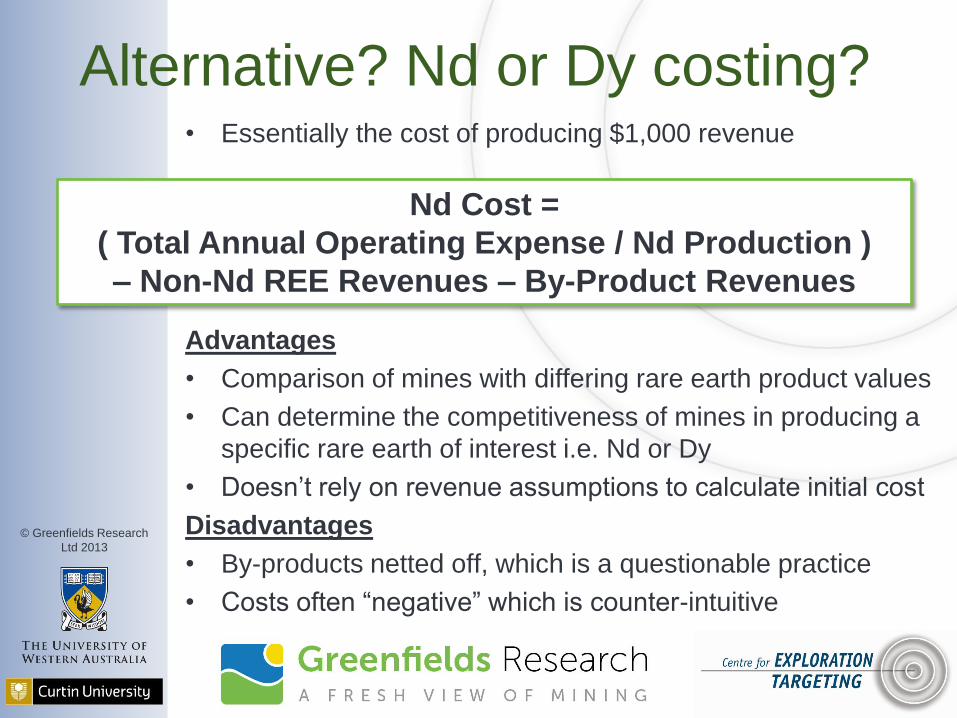
Alternative? Nd or Dy costing? • Essentially the cost of producing $1,000 revenue
Advantages
• Comparison of mines with differing rare earth product values
• Can determine the competitiveness of mines in producing a
specific rare earth of interest i.e. Nd or Dy
• Doesn’t rely on revenue assumptions to calculate initial cost
Disadvantages
• By-products netted off, which is a questionable practice
• Costs often “negative” which is counter-intuitive
Nd Cost =
( Total Annual Operating Expense / Nd Production )
– Non-Nd REE Revenues – By-Product Revenues
© Greenfields Research
Ltd 2013
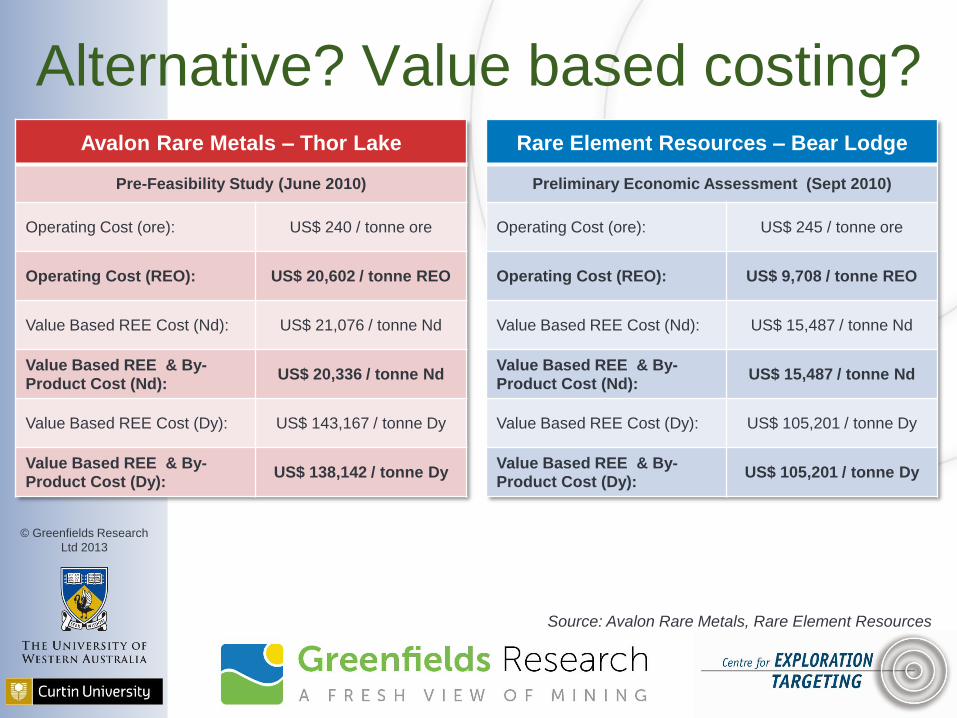
Alternative? Value based costing? Avalon Rare Metals – Thor Lake
Pre-Feasibility Study (June 2010)
Operating Cost (ore): US$ 240 / tonne ore
Operating Cost (REO): US$ 20,602 / tonne REO
Value Based REE Cost (Nd): US$ 21,076 / tonne Nd
Value Based REE & By-Product Cost (Nd):
US$ 20,336 / tonne Nd
Value Based REE Cost (Dy): US$ 143,167 / tonne Dy
Value Based REE & By-Product Cost (Dy):
US$ 138,142 / tonne Dy
Rare Element Resources – Bear Lodge
Preliminary Economic Assessment (Sept 2010)
Operating Cost (ore): US$ 245 / tonne ore
Operating Cost (REO): US$ 9,708 / tonne REO
Value Based REE Cost (Nd): US$ 15,487 / tonne Nd
Value Based REE & By-Product Cost (Nd):
US$ 15,487 / tonne Nd
Value Based REE Cost (Dy): US$ 105,201 / tonne Dy
Value Based REE & By-Product Cost (Dy):
US$ 105,201 / tonne Dy
Source: Avalon Rare Metals, Rare Element Resources
© Greenfields Research
Ltd 2013
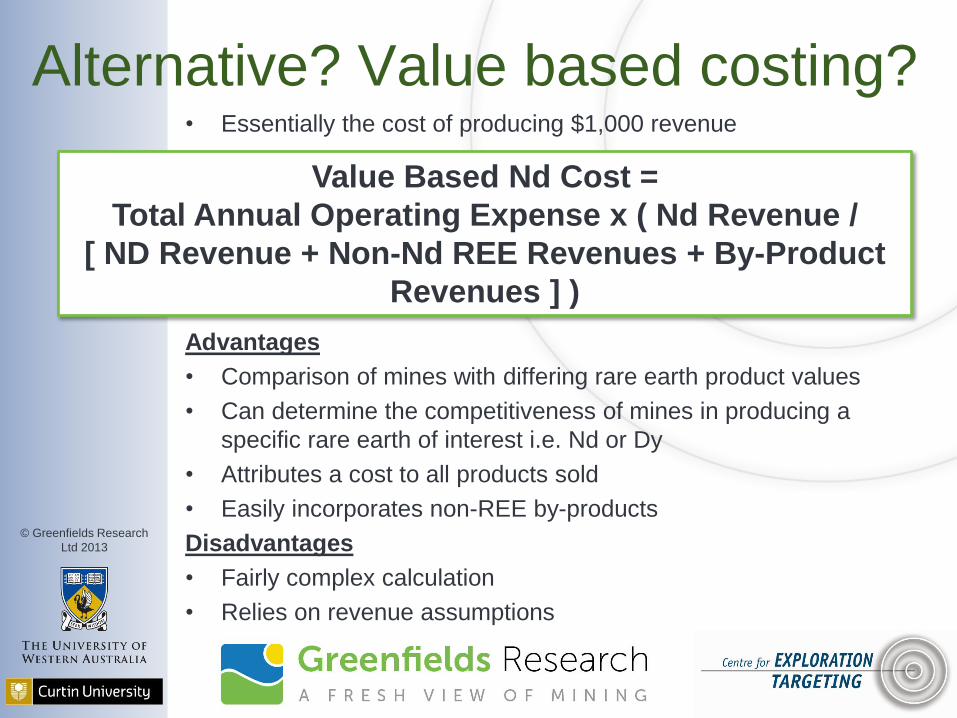
Alternative? Value based costing? • Essentially the cost of producing $1,000 revenue
Advantages
• Comparison of mines with differing rare earth product values
• Can determine the competitiveness of mines in producing a
specific rare earth of interest i.e. Nd or Dy
• Attributes a cost to all products sold
• Easily incorporates non-REE by-products
Disadvantages
• Fairly complex calculation
• Relies on revenue assumptions
Value Based Nd Cost =
Total Annual Operating Expense x ( Nd Revenue /
[ ND Revenue + Non-Nd REE Revenues + By-Product
Revenues ] )
© Greenfields Research
Ltd 2013
602 Resource Cost & Capital: Rare Earth Mine Costs
Using costs curves as an
analytical tool Section 1 Section 2 Section 3 Section 4 Section 5 Section 6 Section 7 Section 8
© Greenfields Research
Ltd 2013
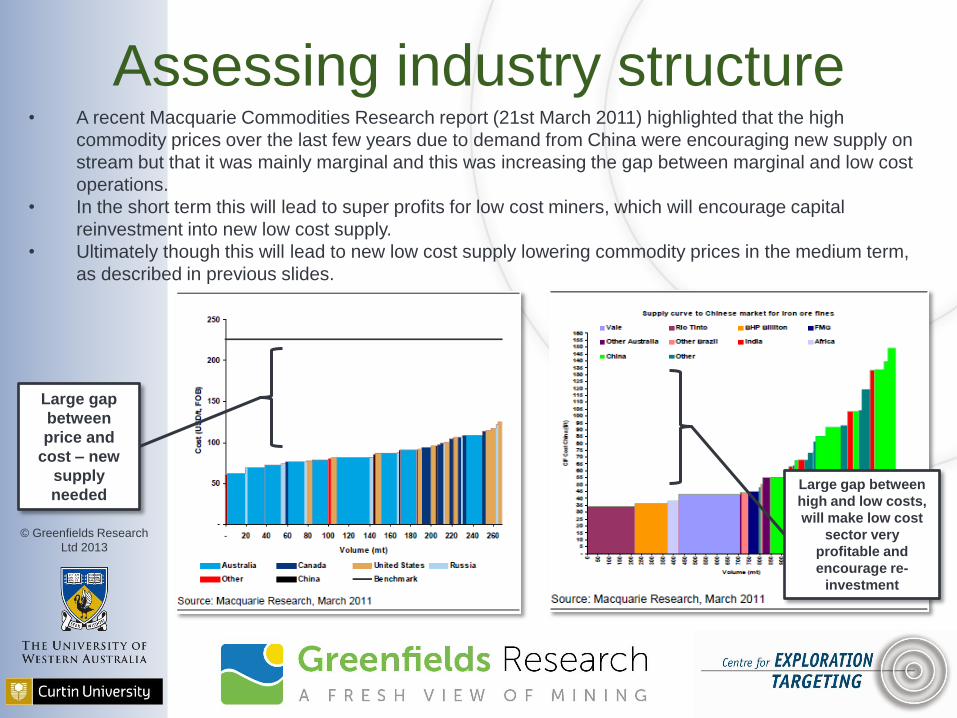
Assessing industry structure • A recent Macquarie Commodities Research report (21st March 2011) highlighted that the high
commodity prices over the last few years due to demand from China were encouraging new supply on
stream but that it was mainly marginal and this was increasing the gap between marginal and low cost
operations.
• In the short term this will lead to super profits for low cost miners, which will encourage capital
reinvestment into new low cost supply.
• Ultimately though this will lead to new low cost supply lowering commodity prices in the medium term,
as described in previous slides.
Large gap
between
price and
cost – new
supply
needed Large gap between
high and low costs,
will make low cost
sector very
profitable and
encourage re-
investment
© Greenfields Research
Ltd 2013
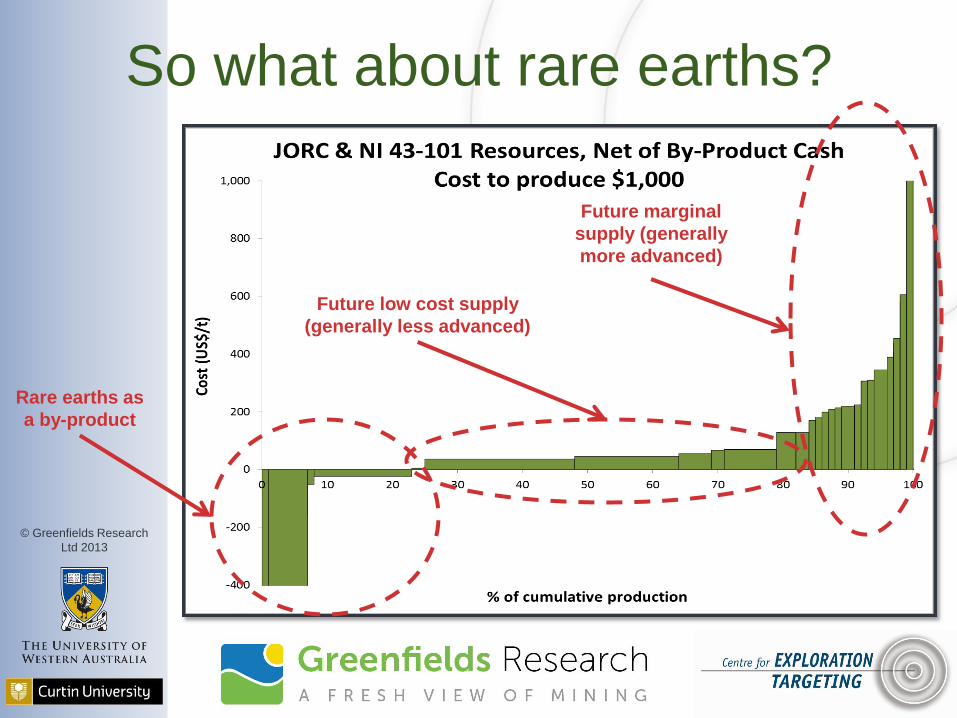
So what about rare earths?
Rare earths as
a by-product
Future low cost supply
(generally less advanced)
Future marginal
supply (generally
more advanced)
© Greenfields Research
Ltd 2013
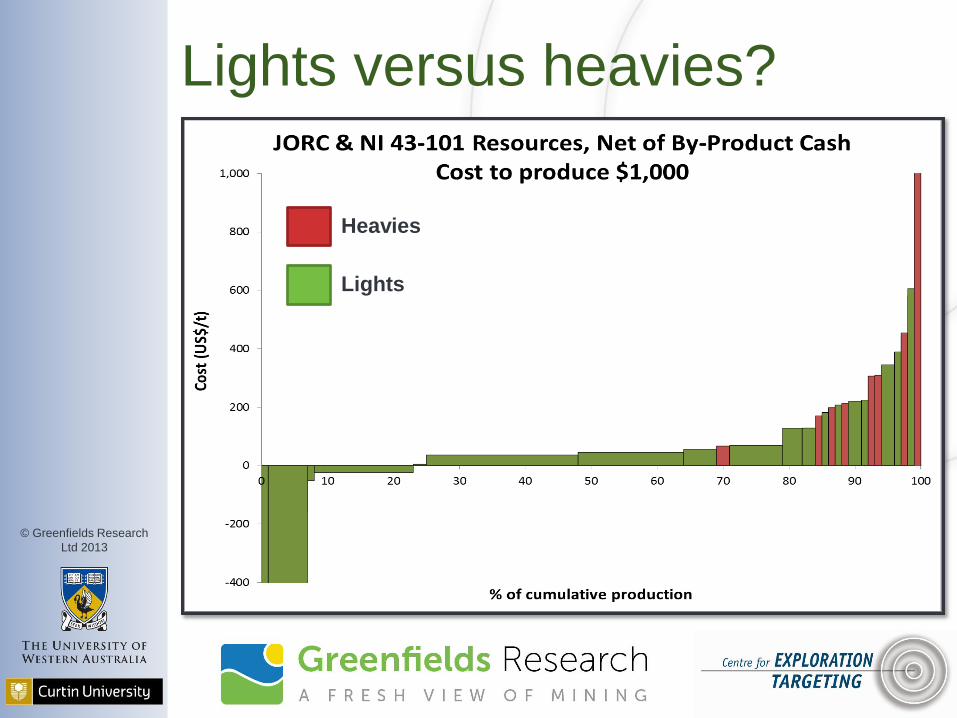
Lights versus heavies?
Lights
Heavies
© Greenfields Research
Ltd 2013
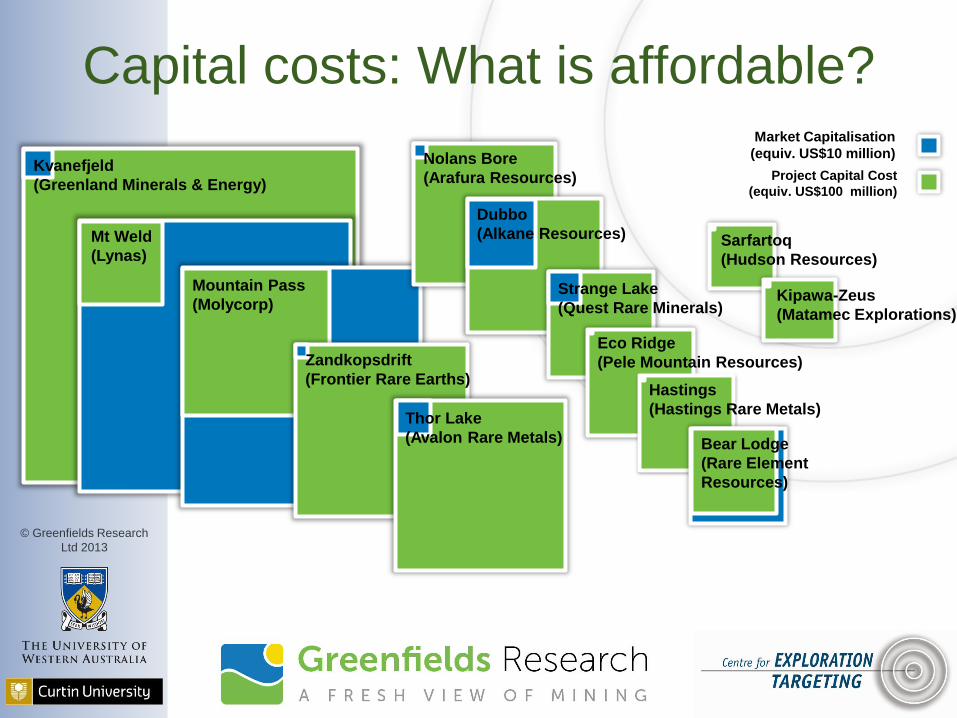
Capital costs: What is affordable?
Kvanefjeld
(Greenland Minerals & Energy)
Mt Weld
(Lynas)
Mountain Pass
(Molycorp)
Zandkopsdrift
(Frontier Rare Earths)
Nolans Bore
(Arafura Resources)
Dubbo
(Alkane Resources)
Strange Lake
(Quest Rare Minerals)
Eco Ridge
(Pele Mountain Resources)
Hastings
(Hastings Rare Metals)
Bear Lodge
(Rare Element
Resources)
Sarfartoq
(Hudson Resources)
Thor Lake
(Avalon Rare Metals)
Kipawa-Zeus
(Matamec Explorations)
Market Capitalisation
(equiv. US$10 million)
Project Capital Cost
(equiv. US$100 million)
© Greenfields Research
Ltd 2013
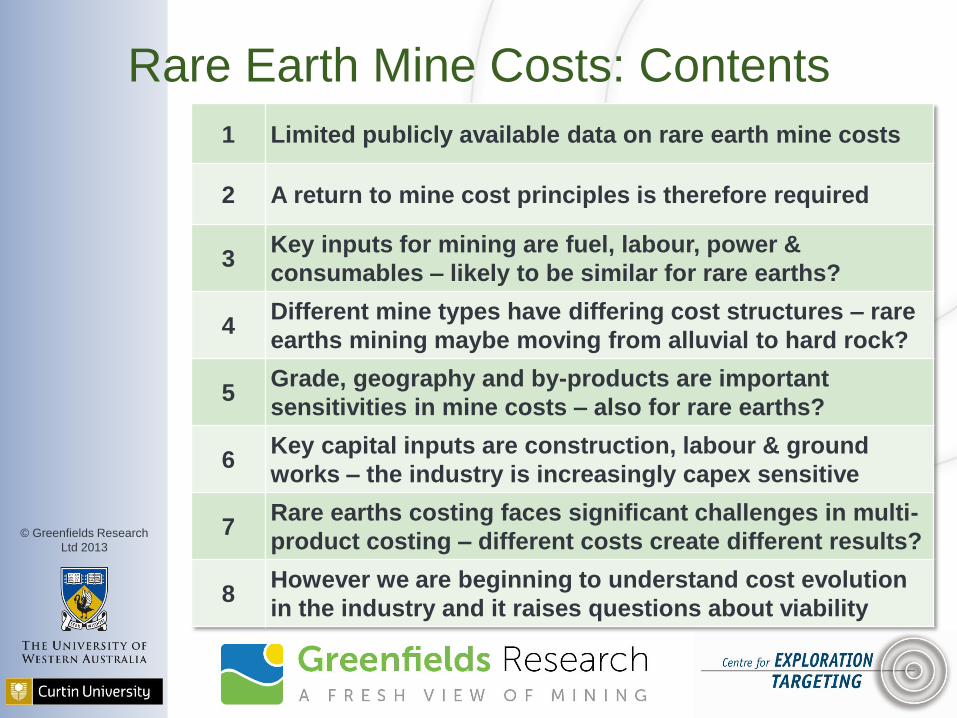
Rare Earth Mine Costs: Contents
1 Limited publicly available data on rare earth mine costs
2 A return to mine cost principles is therefore required
3 Key inputs for mining are fuel, labour, power &
consumables – likely to be similar for rare earths?
4 Different mine types have differing cost structures – rare
earths mining maybe moving from alluvial to hard rock?
5 Grade, geography and by-products are important
sensitivities in mine costs – also for rare earths?
6 Key capital inputs are construction, labour & ground
works – the industry is increasingly capex sensitive
7 Rare earths costing faces significant challenges in multi-
product costing – different costs create different results?
8 However we are beginning to understand cost evolution
in the industry and it raises questions about viability
© Greenfields Research
Ltd 2013
References from this section • The Bear Lodge project, Rare Element Resources,
http://www.rareelementresources.com/s/BearLodge.asp
• The Nechalacho project, Avalon Rare Metals,
http://avalonraremetals.com/projects/thor_lake/thor_lake_intro/
• Infomine Mining Cost Service 2011, Infomine, http://costs.infomine.com/ - subscription required
• Global Copper Market Trends 2011-12 for the ICSG Environmental & Economic Committee
Meeting, Robin Bahr, Credit Agricole, 14th April 2011,
http://www.icsg.org/index.php?option=com_content&task=view&id=86&Itemid=64
• Extractive Metallurgy of Rare Earths, C.K. Gupta & N. Krishnamurthy, CRC Press, 2005 – not
available online
• TMR Advanced Rare-Earth Projects Index, G. Hatch & J. Lifton, Technology Metals Research,
http://www.techmetalsresearch.com/metrics-indices/tmr-advanced-rare-earth-projects-index/
• Tin mine costs provided courtesy of ITRI, http://www.itri.co.uk/
• GNI per capita PPP data, World Bank,
http://data.worldbank.org/indicator/NY.GNP.PCAP.PP.CD?page=2
• International Fuel Prices 2009, 6th Edition, GTZ Transport Policy Advisory Services, Federal
Ministry for Economic Cooperation & Development, Germany,
http://www.gtz.de/de/dokumente/en-int-fuel-prices-6th-edition-gtz2009-corrected.pdf
• Infomine mine project information, http://www.infomine.com/
• Intierra mine project information, http://www.intierra.com/Homepage.aspx
• Cranking up the cost curve gradient, Commodities Comment, Macquarie Commodities
Research, 21st March 2011 – not available online
© Greenfields Research
Ltd 2013
References from this section • Developing Zandkopsdrift a world class rare earth project, February 2012, Frontier Rare
Earths, http://www.frontierrareearths.com/images/pdfs/Frontier_PEA_Presentation_21-02-12.pdf
• Mountain Pass photos, http://www.molycorp.com/
• The Next Rare Earth Era: Global Diversity in RE Manufacturing, Mark Smith, Molycorp, Sept
15th 2010 – not available online
• Metal prices, Metal Pages, https://www.metal-pages.com/
• Photo of grinding media, Technocon Engineers, http://www.steelmedia.com/grinding-media.htm
• Photo of reagent bubbles, Interfroth, http://www.interfroth.com/flotation-reagents.html
• Quest Rare Minerals Receives Results of Preliminary Economic Assessment (PEA) for
Strange Lake B-Zone, Quest Rare Minerals, Sept 9th 2010,
http://questrareminerals.com/pdf/create/pdf.php?page=news_.php%3Furl%3Dhttp%3A%2F%2Fcnrp.
marketwire.com%2Fclient%2Fquest_uranium%2Frelease_xml.jsp%3FactionFor%3D1316109
• Preliminary Economic Assessment on the Sarfartoq Rare Earth Element Project, Greenland,
Hudson Resources, Nov 25th 2011, http://www.hudsonresources.ca/files/HUD-PEA-SARFARTOQ-
2011.pdf
• Investor Presentation, Lynas Corporation, March 2010,
http://www.lynascorp.com/content/upload/files/Presentations/Investor_Presentation_March_10_8235
34.pdf
• Kvanefjeld Multi-Element Project Pre-Feasibility Study – Interim Report Market Summary,
Greenlands Minerals and Energy, 1st February 2010,
http://www.ggg.gl/userfiles/file/ASX/GGG%20Pre-feasibility%20Announcement.pdf
• Technical Report on the Eco Ridge Mine Rare Earths & Uranium Project, Elliot Lake, Ontario,
Canada, Pele Mountain Resources, 19th August 2011,
http://www.pelemountain.com/pdf/09072011pea.pdf
© Greenfields Research
Ltd 2013
Contact details
John P. Sykes MSci (Hons) MSc ARSM MAusIMM FGS
Director, Greenfields Research Ltd (UK)
Provisional PhD Candidate, Centre for Exploration
Targeting & Curtin Graduate School of Business
Australia Mobile: +61 448 658 656
Australia Office: +61 8 9467 1860
Email: [email protected]
Web: www.greenfieldsresearch.com
Linkedin: http://www.linkedin.com/in/johnpsykes