rare and minor metals company review exploration, development & production rm… · rare and...
TRANSCRIPT
Rare and Minor Metals Company ReviewExploration, Development & ProductionDecember Quarter 2010

Resource Capital Research
Resource Capital Research
Suite 1306 183 Kent Street Sydney, NSW 2000
Tel: +612 9252 9405 Fax: +612 9251 2859 Email: [email protected]: www.rcresearch.com.au
Resource Capital Research ACN 111 622 489
Rare and Minor Metals Company ReviewDecember Quarter 2010
Resource Analyst (Rare and Minor Metals): Dr Trent Allen
Resource Analyst: Dr Tony Parry
Resource Analyst: John Wilson
This report is subject to copyright and may not be redistributed without written permission from RCR. The information contained in this report is for use by US, Canadian and Australian residents only. Copies are available for purchase from RCR.
17 November 2010

Resource Capital Research
Rare and Minor Metals Company Review, December Q 2010. Disclaimer and disclosure attached. Copyright© 2010 by Resource Capital Research Pty Ltd. All rights reserved. 2
Contents Contents .............................................................................................................................. 2 Overview and Investment Comment ........................................................................................ 3 RCR December Quarter 2010 Featured Company Summary ........................................................ 4 [Explorers‟ Development Cycle Chart, December Q 2010 ............................................................. ] [Comparative Charts ............................................................................................................... ] Financial Data ....................................................................................................................... 5 Company Statistics ................................................................................................................ 5 Reserves, Resources and Historic Mineralisation ........................................................................ 6 Valuation and Performance Data ............................................................................................. 6
Exploration, Development and Production Companies
[Alkane Exploration Limited ........................................................................................... ] Arafura Resources Limited ............................................................................................ 7 Avalon Rare Metals Inc ................................................................................................. 9 Crossland Uranium Mines Limited ................................................................................ 11 Globe Metals & Mining Limited .................................................................................... 13 Greenland Minerals & Energy Limited ........................................................................... 15 [Gippsland Limited ........................................................................................................ ] Gunson Resources Limited .......................................................................................... 17 Galaxy Resources Limited ........................................................................................... 19 [Icon Resources Limited ................................................................................................ ] [King Island Scheelite Limited ........................................................................................ ] [Rodinia Lithium Inc ...................................................................................................... ] [TNR Gold Corp ............................................................................................................ ]
Market Update: Lithium ........................................................................................................ 20 Market Update: Niobium ...................................................................................................... 23 Market Update: Tantalum ..................................................................................................... 25 Market Update: Tungsten ..................................................................................................... 27 Market update: Rare Earth Elements ...................................................................................... 29 Market Update: Zirconium and Zircon .................................................................................... 31
[Selected rare and minor metal price data and production statistics .............................................. ] [Exchange rates of some rare and minor metals producers and consumers. ................................... ] [Rare and minor metal mompany share performance tables ......................................................... ]
Report Contributors ............................................................................................................. 33 Disclosure and Disclaimer ..................................................................................................... 34
[This is the Abridged Report version of the December Quarter RCR Rare and Minor Metals Company Review. The
purchase price of RCR‟s December quarter Subscriber Reports (including uranium, gold, rare and minor metals,
and iron ore) is A$110. The annual rate for RCR reports – commodities covered may vary from quarter to
quarter – is A$440. Purchase details and research services for institutional investors can be found at
www.rcresearch.com.au]

Resource Capital Research
Rare and Minor Metals Company Review, December Q 2010. Disclaimer and disclosure attached. Copyright© 2010 by Resource Capital Research Pty Ltd. All rights reserved. 3
Overview and Investment Comment
The outlook for rare and minor metals
Analyst: Dr Trent Allen
The past three months have seen considerable share price gains for some
rare and minor metals (RMM) equities, as investors become aware of the
potential for future supply shortages and consequent high metal prices.
Speculation has cooled in the past month, but companies that have quality
projects should retain some of their recent gains while prices remain above
their pre-2H10 levels.
The main market driver is China, which is reforming its RMM sectors, by
raising tariffs, reducing export quotas, and encouraging consolidation and
vertical integration of production. China‟s stated aims are to increase
domestic value-adding and use of the RMM, conserve resources, and
improve industry monitoring and efficiency. China‟s actions could boost
global RMM production.
Some examples of commodities with a stable to strong outlook for the next
several years:
Lithium: Increasing intensity of use is expected to require additional
supply beyond 2014.
Niobium: Industry forecasts are for FeNb consumption growth of ~15%
per annum to 2014.
Rare earth elements (REE): Forecasts are for 20-30% CAGR in prices
to 2015. Export prices (China) up 510% year-on-year.
Tantalum: A supply shortfall is expected to hand a competitive
advantage to companies that provide a long-term supply of ethically
produced tantalum.
Tungsten: Supply shortages are indicated from 2013.
Zircon/zirconium: A lack of greenfields projects could create supply
shortages and boost prices in the near to medium term (1-3 yrs).
RMM deposits can take 5+ years to develop as mines, sometimes due to
their geochemical complexity, and the challenge of financing projects that
are considered to be outside the resources mainstream.
This provides an opportunity for companies with projects that are advanced
or can be fast-tracked, e.g. due to location, favourable chemistry, size
and/or high grades).
Equity performances
Globally, RMM stocks have outperformed most exchange-based indices in
the past 12 months. Share price performances have been studied, for 336
exchange-listed companies with one or more RMM projects (in six
commodity groups: lithium, REE, tungsten, zirconium, niobium, tantalum).
The unweighted average performance over 1 month (to November 17) was
+11%, compared to 1% for Australia‟s ASX S&P300 Metals and Mining
Index, and 0.1% for the ASX All Ords. Twelve-month performance was
+56% (S&P300 MM, 12%). The average RMM company share price is 33%
below its 12-month high and 155% above a 12-month low.
RMM stocks have
climbed this quarter,
in line with expected
metal shortages and
price rises.
The current market
driver is China‟s
policy of squeezing
exports.
Strong medium to
long term market
and price growth is
likely for many RMMs
Companies with
strong projects
should continue to
benefit from the
buoyant RMM
markets.
Share prices of rare
and minor metal
companies have
outperformed the
ASX over the past
year, with +56% annual growth.
Resource Capital Research
Rare and Minor Metals Company Review, December Q 2010. Disclaimer and disclosure attached. Copyright© 2010 by Resource Capital Research Pty Ltd. All rights reserved. 4
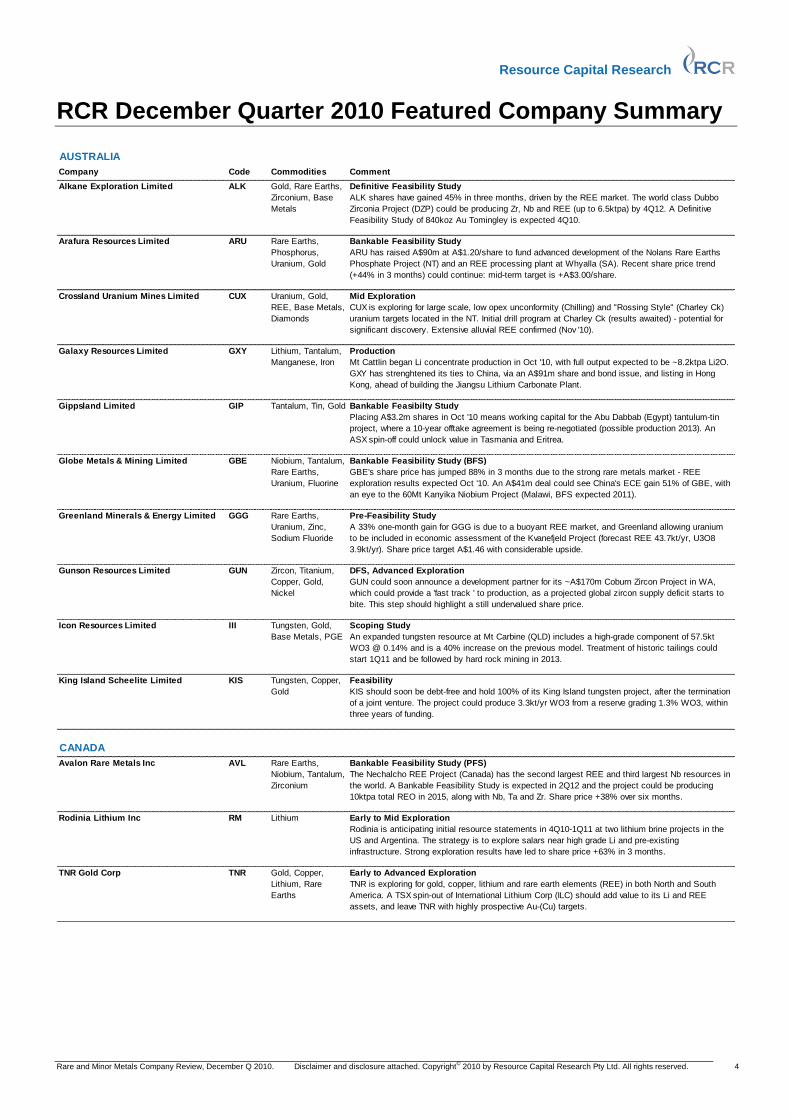
RCR December Quarter 2010 Featured Company Summary AUSTRALIA
Company Code Commodities Comment
Alkane Exploration Limited ALK Definitive Feasibility Study
ALK shares have gained 45% in three months, driven by the REE market. The world class Dubbo
Zirconia Project (DZP) could be producing Zr, Nb and REE (up to 6.5ktpa) by 4Q12. A Definitive
Feasibility Study of 840koz Au Tomingley is expected 4Q10.
Arafura Resources Limited ARU Bankable Feasibility Study
ARU has raised A$90m at A$1.20/share to fund advanced development of the Nolans Rare Earths
Phosphate Project (NT) and an REE processing plant at Whyalla (SA). Recent share price trend
(+44% in 3 months) could continue: mid-term target is +A$3.00/share.
Crossland Uranium Mines Limited CUX Mid Exploration
CUX is exploring for large scale, low opex unconformity (Chilling) and "Rossing Style" (Charley Ck)
uranium targets located in the NT. Initial drill program at Charley Ck (results awaited) - potential for
significant discovery. Extensive alluvial REE confirmed (Nov '10).
Galaxy Resources Limited GXY Production
Mt Cattlin began Li concentrate production in Oct '10, with full output expected to be ~8.2ktpa Li2O.
GXY has strenghtened its ties to China, via an A$91m share and bond issue, and listing in Hong
Kong, ahead of building the Jiangsu Lithium Carbonate Plant.
Gippsland Limited GIP Bankable Feasibilty Study
Placing A$3.2m shares in Oct '10 means working capital for the Abu Dabbab (Egypt) tantulum-tin
project, where a 10-year offtake agreement is being re-negotiated (possible production 2013). An
ASX spin-off could unlock value in Tasmania and Eritrea.
Globe Metals & Mining Limited GBE Bankable Feasibility Study (BFS)
GBE's share price has jumped 88% in 3 months due to the strong rare metals market - REE
exploration results expected Oct '10. An A$41m deal could see China's ECE gain 51% of GBE, with
an eye to the 60Mt Kanyika Niobium Project (Malawi, BFS expected 2011).
Greenland Minerals & Energy Limited GGG Pre-Feasibility Study
A 33% one-month gain for GGG is due to a buoyant REE market, and Greenland allowing uranium
to be included in economic assessment of the Kvanefjeld Project (forecast REE 43.7kt/yr, U3O8
3.9kt/yr). Share price target A$1.46 with considerable upside.
Gunson Resources Limited GUN DFS, Advanced Exploration
GUN could soon announce a development partner for its ~A$170m Coburn Zircon Project in WA,
which could provide a 'fast track ' to production, as a projected global zircon supply deficit starts to
bite. This step should highlight a still undervalued share price.
Icon Resources Limited III Scoping Study
An expanded tungsten resource at Mt Carbine (QLD) includes a high-grade component of 57.5kt
WO3 @ 0.14% and is a 40% increase on the previous model. Treatment of historic tailings could
start 1Q11 and be followed by hard rock mining in 2013.
King Island Scheelite Limited KIS Feasibility
KIS should soon be debt-free and hold 100% of its King Island tungsten project, after the termination
of a joint venture. The project could produce 3.3kt/yr WO3 from a reserve grading 1.3% WO3, within
three years of funding.
CANADA
Avalon Rare Metals Inc AVL Bankable Feasibility Study (PFS)
The Nechalcho REE Project (Canada) has the second largest REE and third largest Nb resources in
the world. A Bankable Feasibility Study is expected in 2Q12 and the project could be producing
10ktpa total REO in 2015, along with Nb, Ta and Zr. Share price +38% over six months.
Rodinia Lithium Inc RM Early to Mid Exploration
Rodinia is anticipating initial resource statements in 4Q10-1Q11 at two lithium brine projects in the
US and Argentina. The strategy is to explore salars near high grade Li and pre-existing
infrastructure. Strong exploration results have led to share price +63% in 3 months.
TNR Gold Corp TNR Early to Advanced Exploration
TNR is exploring for gold, copper, lithium and rare earth elements (REE) in both North and South
America. A TSX spin-out of International Lithium Corp (ILC) should add value to its Li and REE
assets, and leave TNR with highly prospective Au-(Cu) targets.
Lithium, Tantalum,
Manganese, Iron
Tungsten, Gold,
Base Metals, PGE
Uranium, Gold,
REE, Base Metals,
Diamonds
Tungsten, Copper,
Gold
Rare Earths,
Niobium, Tantalum,
Zirconium
Lithium
Gold, Copper,
Lithium, Rare
Earths
Gold, Rare Earths,
Zirconium, Base
Metals
Rare Earths,
Phosphorus,
Uranium, Gold
Niobium, Tantalum,
Rare Earths,
Uranium, Fluorine
Rare Earths,
Uranium, Zinc,
Sodium Fluoride
Tantalum, Tin, Gold
Zircon, Titanium,
Copper, Gold,
Nickel

Resource Capital Research
Rare and Minor Metals Company Review, December Q 2010. Disclaimer and disclosure attached. Copyright© 2010 by Resource Capital Research Pty Ltd. All rights reserved. 5
Financial Data
C OM P A N Y Aust Canada USA Europe other
Listed
opt ions Share Price (LC$/share)3
2 Fully
Diluted
M arket
Cap Book
Enterprise
Value
Code Status1
Yr End 52 week Current Shares Opt+W2
C. Notes2
Shares (undiluted) Cash Debt Value (Undiluted)
17 N o vember 2010 Hi Low (m) (m) (m) (m) (LC$m)3
(LC$m)3
(LC$m)3
(LC$m)3
(LC$m)3
AUSTRALIA (A$)
Alkane Explorat ion Limited Equinox M inAZXls LimitedALK E Dec ASX ARUO 1.19 0.23 0.68 249 0 0 249 168 3.6 0.0 46 168
Arafura Resources Limited ARU E June ASX 1.79 0.38 1.07 335 17 0 352 358 90.7 0.0 140 358
Crossland Uranium M ines Limited CUX E June ASX 0.31 0.08 0.21 115 9 0 124 24 5.7 0.0 12 24
Galaxy Resources Limited GXY P June ASX GXYO 1.66 0.91 1.45 191 24 0 215 277 104.8 146.3 107 423
Gippsland Limited GIP E June ASX GIX 0.09 0.03 0.05 624 56 0 680 29 2.6 0.0 7 29
Globe M etals & M ining Limited GBE E June ASX 0.51 0.12 0.32 94 3 0 97 30 3.9 0.0 19 30
Greenland M inerals & Energy Limited GGG E Dec ASX GGGO 1.10 0.31 0.82 270 154 0 424 220 10.5 0.0 59 220
Gunson Resources Limited Uranex NLGUN E June ASX 0.20 0.06 0.17 178 4 0 182 29 0.2 0.0 25 29
Icon Resources Limited III I June ASX 0.23 0.06 0.13 119 23 0 142 15 1.3 0.0 7 15
King Island Scheelite Limited KIS I June ASX 0.28 0.14 0.15 62 5 0 67 9 2.0 0.0 31 9
Total : (A$) 225.3 146.3 452.8 1306
CANADA (C$)
Avalon Rare M etals Inc AVL E Aug TSX OTCQX 5.00 1.89 3.14 92 11 0 103 290 38.8 0.0 77 290
Rodinia Lithium Inc RM E Dec TSX.V OTCQX 0.68 0.25 0.48 65 29 0 94 31 4.3 0.0 15 31
TNR Gold Corp TNR E Dec TSX.V 0.38 0.15 0.18 131 21 0 152 24 3.5 0.0 20 24
Total : (C$) 46.6 0.0 112.1 345
(1) P: Producer; E: Explorer; I: Imminent - includes companies with bankable feasibility studies and likely to be in production within 3 years (2) Fully Diluted (shares, opt ions + warrants (opt. + w), convert ible notes (Conv. N), other obligat ions)
(3) L.C. - Local Currency unit ; Nov '10F (4) AUD/USD:1.01; CAN/USD: 0.99 Colour code: Actuals in black, forecasts in blue. Numbers for FY2010 can be either, depending on when the FY ends and companies' report ing schedules.
Exchanges
Company Statistics
C OM P A N Y
Code Land (A)/(A+B) %
17 N o vember 2010 ('000 ha) Sep-10 Dec-10 2010 2011 Sep-10 Dec-10 2010 2011 Sep-10 Dec-10 2010 2011 Dec-10 2010 2011
AUSTRALIA (A$)
Alkane Explorat ion Limited ALK 181 3.8 3.8 21.2 15.0 1.9 2.0 7.7 6.0 0.3 0.3 1.2 1.0 89 86 86
Arafura Resources Limited ARU 500 6.3 6.3 15.0 25.0 3.0 5.3 13.2 14.3 1.3 2.3 6.0 7.1 70 69 67
Crossland Uranium M ines Limited CUX 964 0.7 2.0 0.0 18.7 1.9 0.4 1.6 3.5 0.3 0.3 0.6 1.0 61 71 77
Galaxy Resources Limited GXY 145 5.0 5.0 21.8 20.0 1.2 0.5 7.1 3.7 3.2 2.0 8.9 9.2 20 44 29
Gippsland Limited GIP 1,330 0.0 0.0 2.0 2.0 0.1 0.5 0.3 1.4 0.5 0.6 2.4 2.2 46 10 40
Globe M etals & M ining Limited GBE 279 1.7 3.0 20.0 14.7 0.8 0.3 5.4 2.1 0.3 0.4 1.0 1.3 46 84 61
Greenland M inerals & Energy Limited GGG 211 1.0 1.0 8.0 4.0 2.6 0.7 6.6 6.0 1.7 1.1 5.3 5.4 39 56 53
Gunson Resources Limited GUN 273 0.5 0.5 4.9 2.0 0.4 0.4 2.2 1.7 0.2 0.2 0.6 0.6 70 79 73
Icon Resources Limited III 441 1.0 1.0 8.0 4.0 0.6 0.2 2.2 1.2 0.1 0.1 0.3 0.4 67 88 77
King Island Scheelite Limited KIS 0.0 0.0 0.0 0.0 0.0 0.0 0.2 0.7 0.8 0.2 0.2 1.1 0.8 45 38 49
4323 19.9 22.5 100.8 105.4 12.5 10.4 46.9 40.6 8.0 7.3 27.4 29.0 55 63 61
CANADA (C$)
Avalon Rare M etals Inc AVL 4 8.8 5.0 22.2 23.8 3.0 3.0 19.2 12.0 0.5 0.5 2.1 2.0 86 90 86
Rodinia Lithium Inc RM 31 0.6 0.6 2.3 2.4 0.8 0.8 3.0 3.2 0.4 0.4 1.6 1.6 67 65 67
TNR Gold Corp TNR 34 1.0 0.5 2.3 3.5 0.7 0.7 2.2 2.7 0.3 0.3 2.6 1.3 73 46 68
Total or Average: 69 10 6 26.8 29.7 4 4 24.4 17.9 1 1.2 6.3 4.9 75 67 74
(A) Explorat ion (L.C.$m) (B) Corporate (L.C.$m)Drilling ('000 m)
Prepared by Dr Trent Allen
Resource Capital Research
Rare and Minor Metals Company Review, December Q 2010. Disclaimer and disclosure attached. Copyright© 2010 by Resource Capital Research Pty Ltd. All rights reserved. 6
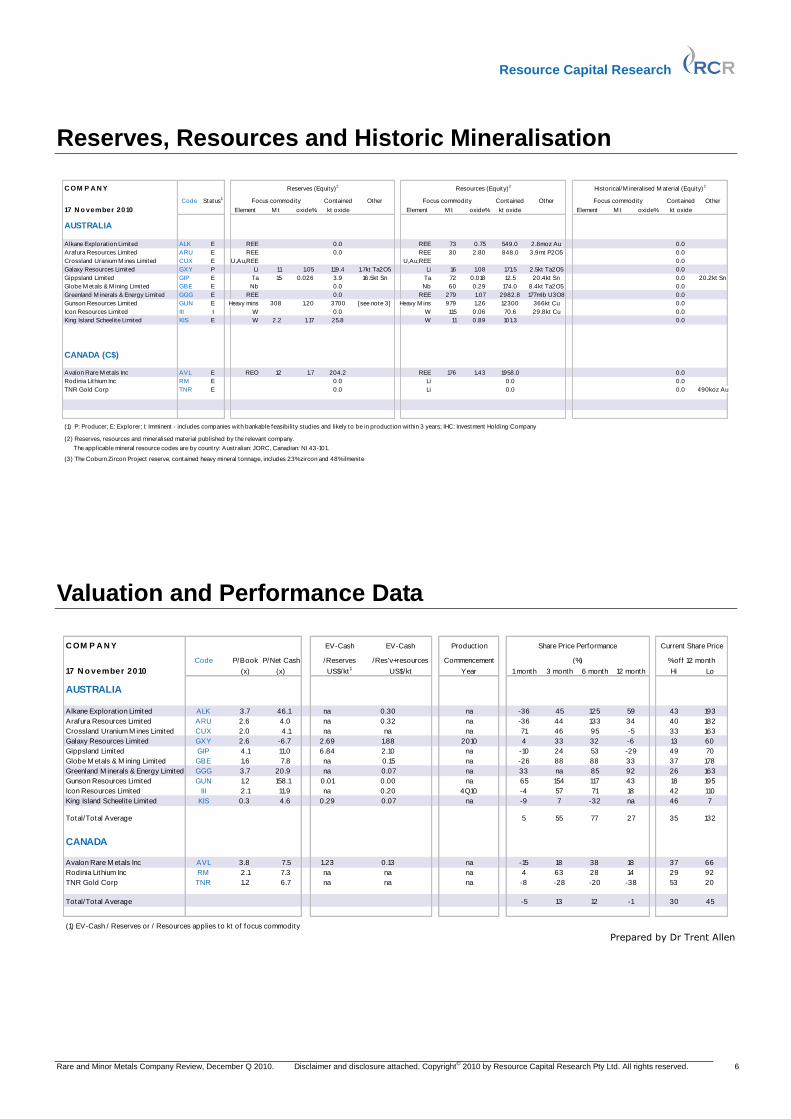
Reserves, Resources and Historic Mineralisation
C OM P A N Y
Code Status1
Contained Other Contained Other Contained Other
17 N o vember 2010 Element M t oxide% kt oxide Element M t oxide% kt oxide Element M t oxide% kt oxide
AUSTRALIA
Alkane Explorat ion Limited ALK E REE 0.0 REE 73 0.75 549.0 2.8moz Au 0.0
Arafura Resources Limited ARU E REE 0.0 REE 30 2.80 848.0 3.9mt P2O5 0.0
Crossland Uranium M ines Limited CUX E U,Au,REE U,Au,REE 0.0
Galaxy Resources Limited GXY P Li 11 1.05 119.4 1.7kt Ta2O5 Li 16 1.08 171.5 2.5kt Ta2O5 0.0
Gippsland Limited GIP E Ta 15 0.026 3.9 16.5kt Sn Ta 72 0.018 12.5 20.4kt Sn 0.0 20.2kt Sn
Globe M etals & M ining Limited GBE E Nb 0.0 Nb 60 0.29 174.0 8.4kt Ta2O5 0.0
Greenland M inerals & Energy Limited GGG E REE 0.0 REE 279 1.07 2982.8 177mlb U3O8 0.0
Gunson Resources Limited GUN E Heavy mins 308 1.20 3700 [see note 3] Heavy M ins 979 1.26 12300 366kt Cu 0.0
Icon Resources Limited III I W 0.0 W 115 0.06 70.6 29.8kt Cu 0.0
King Island Scheelite Limited KIS E W 2.2 1.17 25.8 W 11 0.89 101.3 0.0
CANADA (C$)
Avalon Rare M etals Inc AVL E REO 12 1.7 204.2 REE 176 1.43 1958.0 0.0
Rodinia Lithium Inc RM E 0.0 Li 0.0 0.0
TNR Gold Corp TNR E 0.0 Li 0.0 0.0 490koz Au
(1) P: Producer; E: Explorer; I: Imminent - includes companies with bankable feasibility studies and likely to be in production within 3 years; IHC: Investment Holding Company
(2) Reserves, resources and mineralised material published by the relevant company.
The applicable mineral resource codes are by country: Australian: JORC, Canadian: NI 43-101.
(3) The Coburn Zircon Project reserve, contained heavy mineral tonnage, includes 23% zircon and 48% ilmenite
Focus commodity Focus commodity Focus commodity
Reserves (Equity)2
Resources (Equity)2
Historical/M ineralised M aterial (Equity)2
Valuation and Performance Data
C OM P A N Y EV-Cash EV-Cash Production
Code P/Book P/Net Cash /Reserves /Res'v+resources Commencement
17 N o vember 2010 (x) (x) US$/kt1
US$/kt Year 1 month 3 month 6 month 12 month Hi Lo
AUSTRALIA
Alkane Explorat ion Limited ALK 3.7 46.1 na 0.30 na -36 45 125 59 43 193
Arafura Resources Limited ARU 2.6 4.0 na 0.32 na -36 44 133 34 40 182
Crossland Uranium M ines Limited CUX 2.0 4.1 na na na 71 46 95 -5 33 163
Galaxy Resources Limited GXY 2.6 -6.7 2.69 1.88 2010 4 33 32 -6 13 60
Gippsland Limited GIP 4.1 11.0 6.84 2.10 na -10 24 53 -29 49 70
Globe M etals & M ining Limited GBE 1.6 7.8 na 0.15 na -26 88 88 33 37 178
Greenland M inerals & Energy Limited GGG 3.7 20.9 na 0.07 na 33 na 85 92 26 163
Gunson Resources Limited GUN 1.2 158.1 0.01 0.00 na 65 154 117 43 18 195
Icon Resources Limited III 2.1 11.9 na 0.20 4Q10 -4 57 71 18 42 110
King Island Scheelite Limited KIS 0.3 4.6 0.29 0.07 na -9 7 -32 na 46 7
Total/Total Average 5 55 77 27 35 132
CANADA
Avalon Rare M etals Inc AVL 3.8 7.5 1.23 0.13 na -15 18 38 18 37 66
Rodinia Lithium Inc RM 2.1 7.3 na na na 4 63 28 14 29 92
TNR Gold Corp TNR 1.2 6.7 na na na -8 -28 -20 -38 53 20
Total/Total Average -5 13 12 -1 30 45
(1) EV-Cash / Reserves or / Resources applies to kt of focus commodity
(%)
Share Price Performance Current Share Price
% off 12 month
Prepared by Dr Trent Allen

Resource Capital Research
Rare and Minor Metals Company Review, December Q 2010. Disclaimer and disclosure attached. Copyright© 2010 by Resource Capital Research Pty Ltd. All rights reserved. 7
Arafura Resources Limited
1.79
Debt (A$m) - Dec 10F
Enterprise value (A$m)
Avg monthly volume (m)
Cash (A$m) - Dec 10F
Price/Cash (x) Cash (A$m)
Price/Book (x)
Listed company options: Net asset backing (Ac/share)
*Quarters refer to calendar year. ^Raising capex A$950m in 4Q11, assumed 50/50 equity/debt.
Resources
Mineralised Material (est., non compliant with JORC)
Contacts Directors
Dr Steve Ward
Managing Director, CEO
Tel: +61 (0) 8 6210 7666
Perth, WA, Australia
Analyst: Dr Trent Allen
Capital raisings (A$m)^
Equity %
-
165.7
124.5
Drilling - Other/Diamond (m) 15,0006,250
291.3
Drilling - RAB (m) 0
Shares on issue (pr end) (m shares)
na
Arafura Resources Limited
40.34.0
0 0
A$ 1.07
Production and Financial Forecasts
2012F
486.4
0
Company Comment
0.0
163
Classification Project c/off
(JORC)
Ore
30.3
0.355
U
Mt
P2O5
2.60
2.80
12.3
Reserves and Resources/Mineralised MaterialCode for reporting mineral resources - Australian:
REO
1.0
Measured
Indicated 1.0
Location
REE %
1.0
0.00 0.0
1.7 g/t Au
2.98
Sep-10a
6,250
13.255.30
366.3
Partner Type
100% (Au)
-
0.0
23.518.4
0.0
Key Projects
500
0.0
0.00
na
Tenement costs ($k per year) -
Vein
na
na
M Muir (Non Exec)
(Non Exec)
www.arafuraresources.com.au
East China Min Expl & Devel Bureau (ECE, 22.2%)
I Laurance (Chairman)
Investment Points
Land holding ('000 ha)
Funding from JV partners (A$m)
No
90.7
"
Nolans Total
Mt Porter
ARU.AU
358.4
to
0.0
334.9Number of shares (m)
17.1Options and warrants (m)
Capital Profile
17 November 2010
30
Fully diluted (m)
358.4
World-class rare earth element (REE) deposit at Nolans
Project, with total resources of 30.3mt and production
expected in 2013.
Nolans Project valuation of A$1,967m and NAV
A$3.16/share (10% nom, exchange 0.8, post dilution) at
REO blend value US$30/kg, current is +US$50/kg.
Good infrastructure at NT mine site (railway, gas,
highway). Downstream chemical plant site will be at
Whyalla port in SA: given Major Project status by State.
Mine life +20 years with production of 20ktpa rare earth
oxides (REO), plus phosphoric acid, uranium, gypsum.
REO blend has high proportions of desirable "magnet
feed" REE: Nd, Pr and Dy. Value was US$51/kg in mid
October 2010, up 319% since Dec '09 in strong market.
Project risk should further decrease through 2011 with
final technology demonstration, mine and chemical plant
EIS/approvals, BFS and project finance (both 4Q11).
A$90m placement at A$1.20/share to fund BFS,
resource drilling. Shareholding of ECE will be diluted.
Market capitalisation (undiluted) (A$m)
Major shareholders: JP Morgan Nominees (29.5%)
0.0
Australia
Bankable Feasibility Study
Exchanges: ASX:ARU
Share price (A$) 1.07
S Ward (MD, CEO)
4.0
52 week range (A$/share)
Convertible notes (m)
0.38
352.0
2.6
Aust (NT)
Ni,Cu
Au
100% Au
A Losada-Calderon 100%
100%Kurinelli
Rare Earth Elements, Phosphorus, Uranium, Gold
Corporate (A$m)
5.6333
5.3
Funding duration at current burn (years)
1.32
ARU has raised A$90m at A$1.20/share to fund advanced development
of the Nolans Rare Earths Phosphate Project (NT) and an REE
processing plant at Whyalla (SA). Recent share price trend (+44% in 3
months) could continue: mid-term target is +A$3.00/share.
1.2
12.00
YEAR END: June*
8.007.07
Exploration and evaluation (A$m)
Exploration/(Expl.+ Corporate) (%) 69 6970 60
Dec-10F
25,000
0
500
290.6
2010a 2011F
14.28
347.9
500 500
33.92
2.25
67
5.99
90.00
- -
25,000
500
806.0
21.4 40.438.2
90.7
24.6
20.8
8.1
475
0.0 0.0
Cash backing (Ac/share) 6.3
I Kowalick (Non Exec)
none
Aileron / Reynolds 100%/(40%)
Indicated, inferred
L Shasha (Exec)
T Jackson (Non Exec)
Nolans
Hammer Hill
Mt Porter / Frances Ck
REE, P, Fe
100% REE, P, U
REO
1.7
Aust (NT)Mid Expl.
Early Expl.
na
Leach
none
none
none
Sulphide
Reef
Aust (NT)
M'morphic
Various
Aust (NT)
(Ngalia)
Aust (NT)
na
Early Expl.
Adv Expl.
na
Feasibility
Aust (NT)
1.6
kt mlb
848 3.9
2.9 0.7
Option Metal
91.96
ProjectJV
85.7
24.8
Rare Earth Elements
Reserves
2.80
ProcessOwnership/ Target
"
3 g/t Au
Project StatusRoute
344
A free, in-depth report about Arafura Resources Ltd, dated 18 December 2009, is available from w w w .rcresearch.com.au, as are recent quarterly updates
100% Fe, V M'morphicnone Mid. Expl.Jervois
Inferred
Nolans Project 100% 1.05.1 3.20
12.8
34.2koz Au
0.0 0.0 0.0
13.3
mt
0
0.2
0.4
0.6
0.8
1
1.2
1.4
1.6
1.8
2
Nov-
09
Dec-
09
Jan-1
0
Mar-
10
Apr-
10
May-
10
Jun-1
0
Jul-10
Aug-1
0
Sep-1
0
Oct-10
Sh
are
Pri
ce
($/S
hare
)
ARU - Arafura Resources Limited
Source: Bloomberg
Introduction: Arafura‟s flagship is the Nolans Rare Earths-Phosphate-Uranium Project (NT), 135km NNW of Alice Springs. The deposit has a JORC resource of 30.3mt containing 848kt of rare earth oxides (REO), 3.9mt of phosphate (P2O5), and 13.3mlbs of uranium (U3O8), with potential to expand. A Bankable Feasibility Study (BFS) is expected in 4Q11. Mining is planned for 2013, when the Nolans Project could supply ~10% of the global rare earths market. ARU holds +5,000km
2 of grassroots to advanced exploration +projects (REE, Au, Fe, Ni) in the NT.
Nolans Project: Planned annual production from Nolans is 20kt REO, 80kt P2O5 (as phosphoric acid), 0.5mt CaSO4 (gypsum) and 0.33mlbs (150t) U3O8, with 400kt CaCl2 as residue that could be recycled into the chemical process. Mining rate, by open cut, will be 1mtpa with mine life +20 years. Processing will be in three broad stages: concentration; acid leaching into RE/uranium and phosphate streams; and production of final commodities such as REOs. Key inputs are chloralkali and sulphuric acid. The waste material would include Th, which is slightly radioactive (alpha) and must be stored appropriately. Forecast capital costs are A$950m (@ A/US 0.95) with 20% contingency, including A$690m for the chemical plant. Opex could be A$376mpa (chem. plant A$291mpa), i.e. US$376/t ore at 1mtpa. Infrastructure, includes a railway and gas pipeline. Road distance to the Darwin-Adelaide rail line is 65km. On-site concentrate production would precede rail transport to a chemical plant. Whyalla Rare Earths Complex (SA): The major industrial port of Whyalla (1400km rail from Nolans) was chosen in Sep „10 as location for the chemical plant. ARU has signed an Exclusivity Deed for 800ha land with OneSteel (ASX:OST), which controls the port. The purchase is expected to be finalised in 4Q10. The Complex will include facilities for producing feed chemicals and final products. The SA Gov‟t has granted Major Project status, providing certainty for work programs. A final decision to build should follow the BFS and project finance. Development schedule: The Nolans Bankable Feasibility Study (BFS) is now expected in 4Q11 after the scope was broadened due to improving credit markets. Announcements in 4Q10 should include a Mine Optimisation Study with mining reserves. Groundwater studies began 2Q10 ahead of an EIS for the mine site in 2Q11. Process de-risking via pilot and demonstration plant testing is under way, focused on beneficiation, the RE/REO stream, and acid recycling. Subject to finance in 4Q11, construction could begin in 2012 and production in 2013. Valuation: NAV is highly sensitive to REO prices. At a long term US$30/kg for the Nolans REO blend (current +US$50/kg), with U3O8 at US$50/lb, phosphate US$750/t and gypsum US$25/t, revenue would be US$689m/yr. Using opex/capex from the Oct ‟10 economic update and a 30% pre-BFS discount, Nolans after-tax NPV is A$1,967m (10% DR, AU/US 0.8). NAV could be A$3.31/share (fully diluted, with cash and exploration assets), assuming dilution from raising 50% of A$950m at a nominal A$2.00/share. Risks to the valuation (both upside and downside) include exchange rates and the China-controlled REO market, especially elevated LREE prices. There is upside risk from an increase in the Nolans resource, and downside in delays (process, permits, finance). Investment Comment: ARU‟s share price has increased 44% in the past three months due to high REE prices and well-received news about the Whyalla chemical complex, although it has backed off the Oct ‟10 high of A$1.79/share due to profit taking and stabilisation of an overheated REE equity market. If ARU keeps meeting its development milestones, a price of +A$3.00/share could be reached after project finance is established (expected 4Q11). The force driving Nolans to production will continue to be increasing REE demand (7%-9%pa) over the next 5 years, against a background of supply constraint and export quotas in China.

Resource Capital Research
Rare and Minor Metals Company Review, December Q 2010. Disclaimer and disclosure attached. Copyright© 2010 by Resource Capital Research Pty Ltd. All rights reserved. 8
Nolans Project economics are sensitive to the REO price, with US$30/kg shown in blue.
The NAV at this value is A$5.14/share, or ~A$3.31/share with dilution in 4Q11 or 1H12 to
raise 50% of capex (A$950m) at A$2/share. Current REO blend value is +US$50/kg.
ARAFURA RESOURCES VALUATION
Target
Price (Low) (High)
Equity REO Valuation A$m A$m A$m
Projects (kt) US$/kg
+ Nolans Resource 100% 848 1.86 1,967 75 5,548
+ Regional Exploration 100% 20 30 150
Sub Total 1,987 105 5,698
+ Cash 90.7 90.7 90.7
+ Tax Losses 0.0 0.0 0.0
- Debt 0.0 0.0 0.0
- Corporate 45.7 45.7 45.7
Sub Total 45.0 45.0 45.0
ARU NET ASSET VALUE 2032 150 5743
Capital Structure
Shares (assumes successful placement of A$90m at A$1.20/share in 4Q10). 366.3 366.3 366.3
Fully Diluted Shares 382.6 382.6 382.6
ARU NET ASSET VALUE PER SHARE :A$/share 5.55 0.41 15.68
ARU NET ASSET VALUE DILUTED :A$/share fully diluted 5.36 0.44 15.06
NOLANS PROJECT (NPV based on current resource, October 2007 PFS, August 2009 BFS uppdate, October 2010 project update)
Equity
LONG TERM PRICE FOR NOLANS' REO BLEND :US$/kg 20 30 40 50 60
EXCHANGE RATE :AUUS 0.80 0.80 0.80 0.80 0.80
NOLANS NPV @ 10% NOMINAL* :A$m 100% -872 1,967 3,186 4,372 5,548
NOLANS NPV @ 10% NOMINAL* :US$m 100% -698 1,574 2,549 3,498 4,439
NPV/SHARE (fully diluted) :A$/share na 5.14 8.33 11.43 14.50
* Includes a pre-BFS project discount of 30% of the project valuation: 30%
*Assumes constant long term prices for phosphoric acid, of US$750/t; and uranium, of US$50/lb
NOLANS RARE EARTHS-PHOSPHATE-URANIUM PROJECT, KEY ASSUMPTIONS*
RESOURCE ESTIMATES
Current JORC Measured, Indicated and Inferred resource (1% REE cut-off) Ore REO P2O5 U3O8
Mt % % lb/t
30.3 2.80 12.900 0.44
Contained metal, kt 848 3900 5.9 (=13.3mlbs U3O8)
MINING METHOD Open Pit
PROCESS METHOD On site: heavy media separation and flotation (beneficiation)
At chemical complex: hydrochloric acid leach removing phosphate as liquid
From liquid, phosphoric acid, gypsum (via CaCl2); from solid, production of REE, uranium
Year 1 Year 20
PRODUCTION RATE :mtpa 0.5 1.0 Production ramp up: 25-75% yr1, 75% yr 2; 100% yr3
:ktpa REO 10 20 Head grade and blend are same as resource grade
:tpa P2O5 40 80
:mlbspa U308 0.17 0.33 ie 150ktpa at full production
:ktpa CaSO4 250 500 ie Gypsum
:strip ratio 1.0 1.0
CAPITAL COSTS :A$m At AU/US 0.95. Sustaining capex 4%pa
RECOVERIES TO CONCENTRATE :% Heavy media recovers 90% of apatite and REE minerals
DOWNSTREAM RECOVERY :% For REO; 85% phosphoric acid; 80% U3O8
OPERATING COSTS :$Am/yr At AU/US 0.95
TAX :%
ROYALTY :%
MINE LIFE :Years
COMMISSION DATE :
950
90
86
* These figures are preliminary in nature and are intended to provide only a general indication of project potential scale and economic robustness.
Considerable refinement may result from Bankable Feasibility study, expected in 4Q11.
Valuation Sensitivity
Sensitivity
376
30
3
20+
2013

Resource Capital Research
Rare and Minor Metals Company Review, December Q 2010. Disclaimer and disclosure attached. Copyright© 2010 by Resource Capital Research Pty Ltd. All rights reserved. 9
Avalon Rare Metals Inc
4.99
Debt (C$m) - Aug 10F
Enterprise value (C$m)
Avg monthly volume (m)
Cash (C$m) -Aug 10F
Price/Cash (x) Cash (C$m)
Price/Book (x)
Listed company warrants: Net asset backing (Cc/share)
Quarters refer to calendar year.
Contacts Directors
Mr Donald Bubar
President, Director, CEO
Tel: +1 (416) 364 4938
Toronto, ON, Canada
Analyst: Dr Trent Allen
Capital raisings (C$m)
-
35.5
0.0 0.0
* Cut offs defined on basis of Net Metal Return (NMR) in PFS financial modelling. ^ Inferred total has 0.21% HREO, 2.7% ZrO2, 300ppm Ga2O5.
to
D Bubar (Pres, CEO)
D Connelly
7.6
3.25
1.89
A Ferry (Non Exec Chair)
LocationType
Investment Points
Land holding ('000 ha)*
Funding from JV partners (C$m)
AVL.WT
c/off
feldspar
-
0.0
MFC Global Investment Management US, LLC (15.6%)
Igneous
Partner
2.30.3
Drilling - Other/Diamond (m) 10,2725,000
92.3
0
23,757
79.1
Drilling - RAB (m)
C$ 3.25
Production and Financial Forecasts
2011F2009a 2010F
Avalon Rare Metals Inc
Shares on issue (pr end) (m shares) 79.0 79.1 70.8
0 00
10.39 3.00
Corporate (C$m)
May-10a Aug-10F
95
Exploration and evaluation (C$m)
Exploration/(Expl.+ Corporate) (%)
AVL.CN
300.0
0.0
92.3Number of shares (m)
10.7Options and warrants (m)
Capital Profile
52 week range (C$/share)
Exchanges: TSX:AVL, OTCQX:AVARF
25
Fully diluted (m)
300.0
Nechalcho Project: world's second largest REE
resource (Canada, NWT), includes ~2.5mt of Total REE
Oxides (TREO) grading 1.4%.
Rare earths in Basal Zone of the deposit are 23% heavy
rare earths, implying a high value ore. Recent 40%
upgrade in Inferred resource (Sep '10).
Thor Lake Pre-Feasibility Study (June 2010): capex
C$900m, opex C$267/t (mined) for 10ktpa TREO, LOM
18yrs, pre-tax NPV (10%) of C$246m (C$2.78/share).
A viable metallurgical process has been defined for
REE, with valuable by-products (zirconium, niobium,
gallium). Low thorium, no significant contaminants.
Well-funded to finish BFS in 1H12, with Oct '10 cash
C$42m (and no debt) after C$30m share placement and
C$9.6m exercise of warrants.
Three-month share price +18% in tight REE market, with
industry-wide speculation followed by pullback.
Market capitalisation (undiluted) (C$m)
Major shareholders:
0.0
Canada
Bankable Feasibility Study (BFS)
Share price (C$)
6.81
The Nechalcho REE Project (Canada) has the second largest REE and third
largest Nb resources in the world. A Bankable Feasibility Study is expected
in 2Q12 and the project could be producing 10ktpa total REO in 2015, along
with Nb, Ta and Zr. Share price +38% over six months.
0.4
12.0019.24
YEAR END: August
17 November 2010
Funding duration at current burn (years)
0.56
Convertible notes (m)
103.0
Rare Metals
2.002.120.50
90
3.22
6886 86
0
4
5,000
4
3.9416.11 0.00
44
Tenement costs ($k per year)
5.8
32.8
9.2
4
22,217
- - -
39.62
41.2
Cash backing (Cc/share) 13.3
10.5
0.0
7.3
0.07.3
50.4
Company Comment
49.949.9 35.4 83.3
Ta
Separation Rapids Igneous
Process
P Fontaine
H Panday Canada (ON)Exploration
Permitting
na
na
none
P McCarter
BD MacEachenwww.avalonraremetals.com
100%
100%
100%
none
none
REE,Nb,Ta100%
100%
Sn,In,Ga
Li
none
none
Option Metal
48.89
Project
7.3
9.2
4.1
JV
Lilypad Lakes Igneous
IgneousWarren Township
Ownership/ Target
Project
East Kemptville
Nechalacho
Canada (ON)
na
Route
Financing
Scoping
na
PFS Canada (NWT)Float, hydromet
Status
Canada (ON)
Canada (NS)
Key Projects
Igneous
TREO
Equity Mt %
Reserves - Nechalacho
Reserves and Resources/Mineralised MaterialCode for reporting mineral resources - Canadian: NI 43-101
Rare Metals Classification Project Ore Nb2O5 Ta2O5TREO
kt
260 204.2
% ppmC$/t NMR*
20.5 1.75 260
0.41 410100% 12.0 1.70
Resources - Nechalacho
358 0.42 139Basal Zone Indicated 100%
Upper Zone Indicated 100% 10.0 1.43 260 143 0.28 169
Basal Zone Inferred 100% 84.2 1.53 260 1,288 0.43 131
Upper Zone Inferred 100% 98.4 1.29 260 1,269 0.36 171
2,556 0.39Total as Inferred^ 182.6 1531.40
Mineralised Material (est., non compliant with JORC) 0.0 0.0 0.0
1
1.5
2
2.5
3
3.5
4
4.5
5
Dec-
09
Jan-1
0
Feb
-10
Mar-
10
Apr-
10
May-
10
Jun-1
0
Aug-1
0
Sep-1
0
Oct-10
Share
Price (
$/S
hare
)
AVL - Avalon Rare Metals Inc
Source: Bloomberg
Introduction: AVL owns five rare metals and minerals projects in Canada, of which four are at advanced stages of development. Its main asset is the 100% owned Nechalacho Rare Earth Element Deposit. Nechalacho (REE, Nb, Ta, Zr): The project is at Thor Lake, 100km SE of Yellowknife. The deposit, an igneous intrusion, is enriched in valuable HREE (heavy rare earth elements). Since 2005, Avalon has spent C$25m on exploration and development. It is focusing on high-grade, HREE-rich resources in the large Basal Zone, which (as of September 2010) contains Indicated Resources of 20.45mt @ 1.75% TREO (total rare earth oxides) with 23% HREO/TREO. Total Inferred Resources are 182.6mt @ 1.4% TREO. The deposit also contains Ta, Nb, Zr, Hf and Ga. Less than 10% of the property has been drilled. Recent discoveries include a near-surface zone (North Tardiff) with 11m @ 10.78% TREO. Assays from summer drilling are pending. The main deposit is open in three directions. Pre-Feasibility Study: This June 2010 study was of an 18-year mine life, operating underground (~200m depth) on a 12mt reserve in the deposit‟s Basal Zone, ramping from 5ktpa up to 10ktpa TREO (total rare earth oxides), 18ktpa ZrO2, 1.7ktpa Nb2O5 and 100t Ta2O5. Opex is expected to be C$267/t. Capex is C$899.7m with 22% contingency, including C$589.3m for an underground mine, onsite mill (crush, flotation; 8.4MW by diesel at 2,000tpd) and offsite hydrometallurgical separation plant. The PFS contemplates a plant in the tailings area of an historic mine (Pine Point), to reduce environmental impacts and allow hydroelectric power during summer (7.3MW). In this scenario, concentrate will be barged in summer from Thor Lake via Great Slave Lake to the plant. Combined recoveries are 84.6% for flotation, 90% for the hydro plant. A more recent Scoping Study of plant costs (Oct ‟10) estimates capex at C$346m. The PFS estimates pre-tax net cash flow of C$2.1bn ($1.5bn post tax), with IRR 14%, and pre-tax NPV @ 10% of C$246m (C$/US$ 0.9) and NPV @ 5% of C$826m. REEs contribute ~56% of revenue at US$21.94/kg TREO. Development: Possible start date for full capacity production is 2015, with 24-30 months construction from 2013 upon receipt of land and water permits and financing. A flotation pilot plant could be constructed from September 2010 and a Bankable Feasibility Study is expected in 1H12, ahead of project financing. Permitting: Avalon commenced application for Type A Land Use Permit and Water Licence, in 2Q10 – an Environmental Assessment can take ~1.5-2.5 years to complete, prior to official review and approval. Other Projects: There are three other advanced projects in Canada, i.e. Separation Rapids (lithium, Ontario), Warren Township (calcium feldspar; Ontario; currently inactive pending resolution of permitting issue) and East Kemptville (tin-indium-gallium-germanium; Nova Scotia). A fifth project, Lilypad Lakes (tantalum; Ontario) is early stage. These projects could move forward under Joint Venture or be monetised while AVL develops Nechalacho. Investment Comment: Nechalacho has the second largest REE resource in the world, and the third largest niobium resource. If Nechalacho comes on line in 2015 it would fill <5% of anticipated world REE demand, even at the full rate of 10ktpa, so any downward pressure on global REE prices due to extra supply should be moderate. The NPV of Nechalacho, of C$246m (from the PFS), is close to AVL‟s market capitalisation of ~C$410m but the ore value will have increased since July 2010 (e.g. cerium oxide value +500% in 3 months). In line with other REE equities, the share price increased dramatically after July 2010 due to dramatic cuts in Chinese rare earth exports, and pulled back due to profit taking and stabilisation of the market; AVL remains highly leveraged to REE prices.

Resource Capital Research
Rare and Minor Metals Company Review, December Q 2010. Disclaimer and disclosure attached. Copyright© 2010 by Resource Capital Research Pty Ltd. All rights reserved. 10
Avalon Rare Metals Inc project location map: from a recent company presentation, this
graphic shows the main focus is on Thor Lake, where AVL has the Nechalacho and North T
Deposits. Total resources include 2mt of Rare Earth Oxides (REO).
Thor Lake, schedule to production: Avalon plans to have the Nechalacho REE Deposit in
production in late 2015. The project is expected to progress along four lines: community
engagement, permitting, marketing and Bankable Feasibility Study (BFS).

Resource Capital Research
Rare and Minor Metals Company Review, December Q 2010. Disclaimer and disclosure attached. Copyright© 2010 by Resource Capital Research Pty Ltd. All rights reserved. 11
Crossland Uranium Mines Limited
0.31
Debt (A$m) - Dec 10F
Enterprise value (A$m)
Major shareholders: Gaden Nominees (6.14%); ANZ Nominees (5.7%)
Avg monthly volume (m)
Cash (A$m) - Dec 10F
Price/Cash (x) Cash (A$m)
Price/Book (x)
Listed company options: Net asset backing (Ac/share)
*Uranium prospective tenements only; held and under application. Quarters refer to calendar year.
Contacts Directors
Mr Geoff Eupene
Executive Director
Tel: 61 (0) 8 8981 5911
North Sydney, NSW, Australia
U3O8 Eq
Mlb
Status
Kt
0.0 0.0
P Walker (Non Exec Dir)
1.1
3.3
0.0
Process
Charley Creek
Analyst: John Wilson
Granite
Target
www.crosslanduranium.com.au R Richardson (Non Exec Dir)
5.00
Equity
U3O8Cut Off
P Elliott (Non Exec Dir)
R Cleary (Non Exec Ch)
G Eupene (Exec Dir)
Mineralised Material (est., non compliant w ith JORC)
Project Metal
4.1
0.2
8.4
Cash backing (Ac/share)
1.2
Early Expl. Aus (NT)
Early Expl.
0.00
Aus (NT)
Aus (SA)
16,000
0.00
Lake Woods
Type
Unconf
Project
IOCGU
Chilling Project
Ownership/
Kalabity 30%
TSX.V:PUC
JV
Option Partner
Diamonds
5.7
Reserves and Resources/Mineralised Material
Key Projects
0.0
U3O8
U3O8Classification
U
TSX.V:PUC
50%
50%
100%
na
Project
Route
na
NT uranium focus - 90%. Exploration budget ~A$3mpa.
Charley Creek (near Alice Springs, NT): strategic holding
(4,111km2); large radiometric anomaly. Cockroach Dam
drilling 4Q10 for "Rossing Style" granite hosted uranium.
Charley Creek sediment basins: Shallow, high percentage
heavy REE (contained in 39% REO). Likely extractable
with exisiting technology. Potential JORC 4Q11.
Chilling (NT): Shallow unconformity style targets in Pine
Creek Orogen. Similar stratigraphy to Rum Jungle.
Marchfly Zone (Chilling): best drill intercept 0.5m @
0.816% U3O8 (2009). Drilling 1H11(2,000m).
Exploration team experienced in Australian uranium
unconformity style deposits - chief geologist for Ranger
Mine development and Ranger 68 discovery.
Uranium
Code for reporting mineral resources - Australian:
Reserves
Aus (NT)
0.0
U Platsearch
U, REE
na
5
-
140.5
2,730
964
Company Comment
9.3
4.6
140.5
17,000
964
Location
Early Expl.
na
Early Expl.
na
0.00.0
24.3
125
Eupene Nominees (5.20%)
0.0
Market capitalisation (undiluted) (A$m)
1.2
0
Fully diluted (m)
24.3
964
4.2
Investment Points
Convertible notes (m)
YEAR END: Dec
5.7
-
2.1
No
Share price (A$)
Number of shares (m) 115
Options and warrants (m)
0.21
0.08
CUX.AU
9
Uranium, Gold, REE, Base Metals, Diamonds
Australia (NT,SA)
Mid Exploration
Exchanges: ASX:CUX
Capital Profile
52 week range (A$/share) to
17 November 2010
0 Exploration/(Expl.+ Corporate) (%)
2.2
Ore U3O8
Mt
-
140.5
%
0.0
115.5
0.00
0
0
0
ppm
-
85 70
0.40
0.26
80
1.3
0.970.44 1.04
1.85
0.27Corporate (A$m)
2.55 2.403.86
A$ 0.21
Production and Financial Forecasts
2011FDec-10F
CUX is exploring for large scale, low opex unconformity (Chilling)
and "Rossing Style" (Charley Ck) uranium targets located in the NT.
Initial drill program at Charley Ck (results awaited) - potential for
significant discovery. Extensive alluvial REE confirmed (Nov '10).
61
Land holding ('000 ha)*
Drilling - RAB (m)
Shares on issue (pr end) (m shares)
Funding duration at current burn (years)
Drilling - Other/Diamond (m)
Exploration and evaluation - gross (A$m)
Funding from JV partners (A$m)
8.4
Capital raisings (A$m)
Tenement costs ($k per year)
7.7
-
964
0
2,000
5.6
3.2 4.1
(JORC)
5.7
Resources
Mlb
0.0
2.2
5.00
1.0
3.1
3.7
Crossland Uranium Mines Limited
87
115.5
0
730
1.3
2009aSep-10a 2010F
0.00
0.05
0.10
0.15
0.20
0.25
0.30
0.35
Nov-
09
Dec-
09
Jan-1
0
Mar-
10
Apr-
10
May-
10
Jun-1
0
Jul-10
Aug-1
0
Sep-1
0
Nov-
10
Sh
are
Pri
ce
($/S
hare
)
CUX - Crossland Uranium Mines Limited
Source: Bloomberg
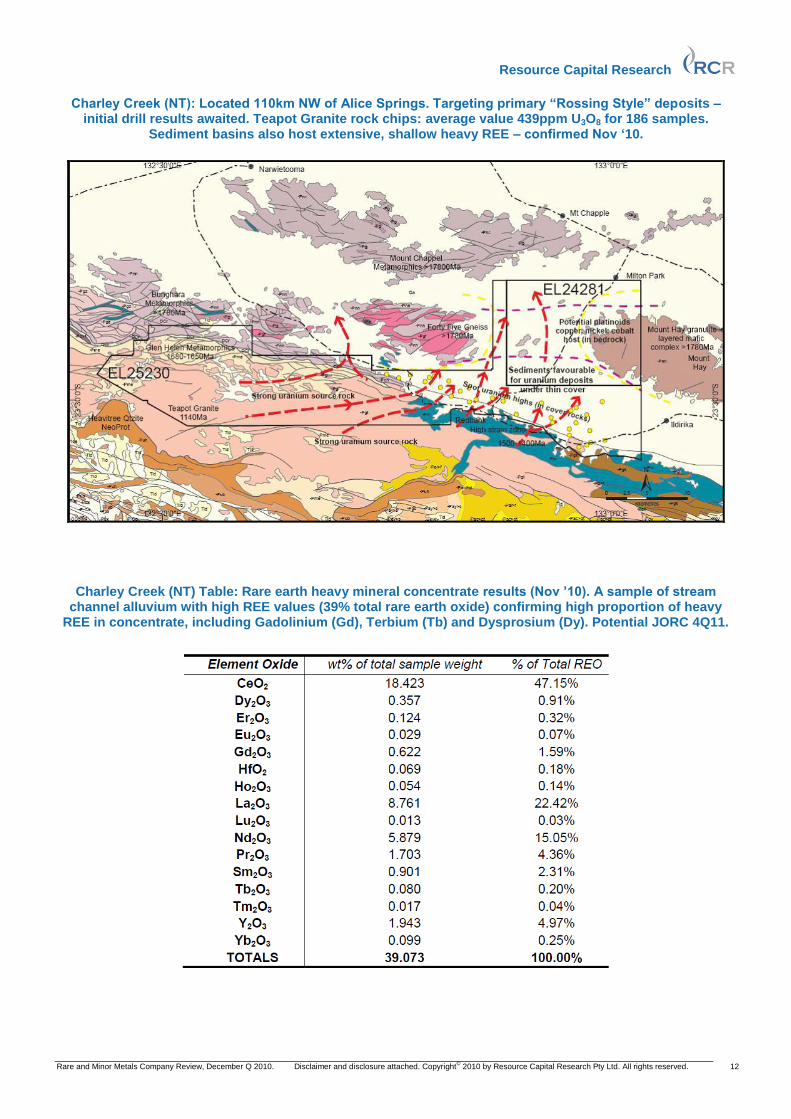
Overview: Crossland Uranium Mines formed as the merger of Klondike Source Limited (KSL) and Crossland Mines Pty Ltd, in May 2006. It listed on the ASX April 2007. Pancontinental holds a contributing 50% stake in most CUX projects (U/REE/base metals). Crossland‟s directors and management are one of the most experienced uranium teams in Australia. Charley Creek project (NT): (4,111km
2 granted) Located 110km north-west of Alice Springs, prospective for
a variety of mineralisation styles, including primary and secondary uranium, heavy rare earth elements and intrusive related copper, nickel and platinoids. Granite hosted uranium - CUX is currently drilling “hot” granites – targeting large, low grade uranium deposit styles, the closest analogy being “Rossing Style” deposits in Namibia. Rock chip samples have returned values up to 0.54% U3O8, with an average of 439ppm for 186 samples. The area has received little, or no, previous exploration attention. Permits were granted mid July and drilling commenced August (1,500m, 10 holes @ 150m) – targeting areas within the Teapot Granite (~50km
2) at Cockroach Dam, Cockroach East, and Cockroach Central. CUX expanded Charley
Creek holding and announced a JV with Western Desert (ASX:WDR, Aug „10). Drainage and Sediment Basins: prospective for palaeochannel and calcrete uranium deposits. Airborne EM conducted in 2007 identified palaeochannels - drilling expected 1H11 subject to approvals. Rare Earth Elements (REE, NT): Initial assays and met test work produced a heavy mineral concentrate from stream channel alluvium. Initial samples contained 39% REO, including a high proportion of heavy REE (Gd, Tb, and Dy, refer table) which are in global short supply. Initial exploration suggests these REE ratios could be widely reported throughout the Cockroach Dam area. CUX expects, due to the shallow nature and likely established process routes for this type of REE mineralogy (phosphate mineral) that there is potential for a low capex project to produce several thousand tonnes pa of heavy REE concentrate. Expansion of REE exploration is expected 2011 - auger drilling (10,000m) 1Q11 to test for depth extensions and consistency of heavy REE RAB/RC drilling (10,000m) expected 2Q11. Chilling (NT): (2904km
2). Located 20km SSW of Rum Jungle on the west side of the Pine Creek Orogen -
targeting large scale, high grade unconformity style uranium deposits. Chilling contains 130km of prospective unconformity strike length and potential 110km extension under cover. Airborne geophysical survey completed 2007 and regional AEM identified 43 priority anomalies, followed up with ground surveys and some initial air-core drilling. Buchanan Window - Increasing focus of CUX activity prospective for uranium and base metals. Confirmed basal Pine Creek Orogen stratigraphy as at Rum Jungle. Drilling 1Q11 (1,500m) – targeting bedrock to 250m depth (10 drill targets). Allia Window - drilling EM anomalies 1Q11 (1,000m). Marchfly - initial drill program 2009 (11 holes) - highest grade intersection - CHDD12: 0.816% U3O8 over 0.5m. Investment Comment: CUX has potential for large scale uranium discovery in established (Chilling, Pine Creek Orogen) and new (Charley Creek) districts. Near term share price catalysts could be Initial drill results from primary uranium targets at Charley Creek - expected Nov-Dec ‟10; and REE auger results 1Q11. The share price doubled from $0.15 with REE announcement 1 November. CUX offers an attractive risk/reward trade-off, with upside to large scale uranium discovery, REE and base metals. Cash A$5.7m Dec ‟10F; capital raising expected 1H11.
Resource Capital Research
Rare and Minor Metals Company Review, December Q 2010. Disclaimer and disclosure attached. Copyright© 2010 by Resource Capital Research Pty Ltd. All rights reserved. 12
Charley Creek (NT): Located 110km NW of Alice Springs. Targeting primary “Rossing Style” deposits – initial drill results awaited. Teapot Granite rock chips: average value 439ppm U3O8 for 186 samples.
Sediment basins also host extensive, shallow heavy REE – confirmed Nov „10.
Charley Creek (NT) Table: Rare earth heavy mineral concentrate results (Nov ‟10). A sample of stream channel alluvium with high REE values (39% total rare earth oxide) confirming high proportion of heavy
REE in concentrate, including Gadolinium (Gd), Terbium (Tb) and Dysprosium (Dy). Potential JORC 4Q11.

Resource Capital Research
Rare and Minor Metals Company Review, December Q 2010. Disclaimer and disclosure attached. Copyright© 2010 by Resource Capital Research Pty Ltd. All rights reserved. 13
Globe Metals & Mining Limited
0.51
Debt (A$m) - Dec 10F
Enterprise value (A$m)
Avg monthly volume (m)
Cash (A$m) - Dec 10F
Price/Cash (x) Cash (A$m)
Price/Book (x)
Listed company options Net asset backing (Ac/share)
Quarters refer to calendar year.
Resources
Mineralised Material (est., non compliant with JORC)
*5Mt measured, 18Mt Indicated, 37Mt Inferred
Contacts Directors
Mr Mark Sumich
Managing Director
Tel: +61 (0) 8 9486 1779
West Perth, WA, Australia
MW100%/20% U ASX:RSL S'stone na Adv Expl
0.0 0.0 0.0
174.00.29 0.15 0.014 0.009Kanyika Meas, Ind, Inf* 100% 60.0
% %
Reserves 0.0 0.0
Equity Mt
c/off
% Nb2O5%
Code for reporting mineral resources - Australian:(JORC)
Nb, Ta, U Classification Project Ore Nb2O5
0.00.0 0.00
Ta2O5 U3O8 Nb2O5
kt
0.0
Key Projects
0.00
Status
Target ProcessOwnership/
BFS MW
Mid Expl
MW
Analyst: Dr Trent Allen
0.0
18.4
(JORC)
1.6
1.5
Company Comment
36.2
100.1
11.2
Option Metal
44.50
Project
0.0
Early Expl
na
93.75
5.9
1.401.34
MW
MZ
Early Expl
F, REE Carb'tite
Salambidwe
Mount Muambe
J Stephens (Non Exec)
W Hayden (Non Exec)
Livingstonia
Reserves and Resources/Mineralised Material
5.29
2.5
0.00 3.50
17.5
0.0
Type
ASX:RSL
none
Partner
JV
Project
Machinga
Kanyika 100%
164.1
1,688
279
No
3.9
17.3
2.37.8
Cash backing (Ac/share) 3.6
0.35
61
1.03
8446
17 November 2010
0.12
Rare Metals, Uranium, Fluorine
Exchanges: ASX:GBE
Share price (A$)
0.29
73
Exploration and evaluation (A$m)*
Exploration/(Expl.+ Corporate) (%)Performance shares (m)
102 1.4
5.36
0.32
GBE's share price has jumped 88% in 3 months due to the strong
rare metals market - REE exploration results expected Oct '10. An
A$41m deal could see China's ECE gain 51% of GBE, with an eye to
the 60Mt Kanyika Niobium Project (Malawi, BFS expected 2011).
0.4
2.002.09
59
Sep-10a 2011F
Funding duration at current burn (years)
11
Fully diluted (m)
30.1
Valuation gap: Globe NAV (10% nom, 4Q10) based on
scoping/feasibility study is A$315m or ~A$1.78/share post
development funding - current market cap ~A$30m.
Kanyika Project BFS results expected 2011. Scoping
Study (Jun '08, Coffey; update May „09) - 4ktpa Nb as
FeNb, opex US$13/kg-US$20/kg Nb, capex US$155m.
Key economic driver is niobium, used in steel. Nb price is
extremely stable, LT forecast US$39/kg in FeNb, current
US$42/kg. Nb 70-85% revenue; tantalum 15-30%.
Planned 51% investment by China's ECE could bring
initial A$41m and lead to project funding, subject to
government, shareholder approvals (possible Jan '11).
MOU's for offtake covering 45% of forecast production.
Portfolio of exploration projects in Africa. Drilling results
expected Nov '10 from Machinga Project (REE,Nb,Ta).
Kanyika resource of 60mt has 174kt Nb2O5 grading
0.29%, with 18.5mlbs tantalum as Ta2O5 and 11.9mlbs
Market capitalisation (undiluted) (A$m)
Major shareholders: HSBC Custody Nom (7.6%)
0.0
Malawi, Mozambique
Bankable Feasibility Study (BFS)
GBE.AU
30.1
to
5
94Number of shares (m)
3.2Options and warrants (m)
Capital Profile
52 week range (A$/share)
Shares on issue (pr end) (m shares)
YEAR END: June
0.79 0.30
Corporate (A$m)
A$ 0.32
Production and Financial Forecasts
2012FDec-10F 2010a
Globe Metals & Mining Limited
Drilling - Other/Diamond (m)
92.9
00
20,000
108.2
3,000
94.2
Drilling - RAB (m) 0
29.45.4
279
5.9
320.8
0
20,00014,688
0
279
Ragusa Investments (6.7%), JP Morgan Nom (6.3%)
M Sumich (Exec Chair, MD)
Investment Points
1.6
Code for reporting mineral resources - Australian:
Land holding ('000 ha)* 279
-
279
Tenement costs ($k per year) -
3.9
Acid leachU (Nb,Ta)
REE0%/80%
none
ASX:RSL100%
0%/90%
Location
na
Granitoid
Pegmatite
na
Route
Pegmatite
REEwww.globemetalsandmining.com.au
D Sumich (Non Exec)
-
31.2
46.8
- -
16.9
Capital raisings (A$m)
Funding from JV partners (A$m) 0.0
0
0.05
0.1
0.15
0.2
0.25
0.3
0.35
0.4
0.45
0.5
Nov-
09
Dec-
09
Jan-1
0
Mar-
10
Apr-
10
May-
10
Jun-1
0
Jul-10
Aug-1
0
Sep-1
0
Oct-10
Sh
are
Pri
ce
($/S
hare
)
GBE - Globe Metals & Mining Limited
Source: Bloomberg
Introduction: Globe Metals & Mining listed on the ASX in December 2005. It is an African-focused rare metals resource company. Its main project is the multi-commodity Kanyika Niobium Project. Globe also has exploration projects focused on rare metals, fluorite and uranium projects. Investment by ECE: A A$41m buy-in at A$0.345/share could see the East China Mineral Exploration and Development Bureau own 51% of GBE. China consumes ~35% of global ferroniobium (FeNb) and ECE (a holder in ASX-listed REE player Arafura) plans to help GBE with project finance and development. Approval is needed from Malawi, China, Australia, shareholders (EGM called for Jan ‟10). Kanyika (uranium, central Malawi): GBE is targeting rare metals (niobium, tantalum), zirconium and uranium mineralisation in an alkalic granitoid in central Malawi. The main ore minerals are disseminated pyrochlore (Nb, Ta, U) and zircon (Zr). GBE aims to bring Kanyika into production in late 2012, or 2013. Resource and grade – The current resource is 60mt, with a recent 77% increase in Measured and Indicated tonnes (now 23Mt). The resource is defined to 300m width, 250m depth and 2.3km of ~3.8km known strike within 5 zones: 60mt @ 0.29% Nb2O5 (174kt), 0.009% U3O8 (11.9mlbs), 0.014% Ta2O5 (18.5mlbs) and 0.5% ZrSiO4. There is a high-grade resource at 3,000ppm Nb2O5 cut-off, of 21mt with 0.41% Nb2O5 of which 10mt is M&I grading 0.47% Nb2O5 The deposit is open along strike in both directions (N-S). There is a high-grade Exploration Target of 40-50Mt @ 0.37-0.4% Nb2O5. Metallurgy – GBE aims to produce ferro-niobium (FeNb) for the steel industry, as well as oxides of niobium, tantalum and uranium, and possibly magnetite (iron oxide) and zircon. Studies commenced in 2008: two initial phases reported encouraging costs and recoveries, and work is entering Stage 3 (bulk testing pilot program). Studies were on hold (dispute with former JV partner) but could restart in 4Q10. Mining Potential - The deposit could be mined open-pit with low strip ratio of 0.5-0.9. Higher-grade, near surface Measured and Indicated resources could be targeted first (critical for early payback of capex). A Scoping Study (Coffey, Jun ‟08; updated May „09) examined 4ktpa Nb production as FeNb alloy, with 59tpa Ta2O5 and 11.4-13.7ktpa ZrSiO4 (processing 2.2-3.5mtpa) with a 20yr LOM. Uranium would report to aluminous slag for potential future processing. Current (revised) model prefers mining 1.5mt-2.5mtpa, for 3,000tpa Nb and 192tpa Ta2O5 over life-of-mine. Capex US$155m, opex US$40.3/t. A Bankable Feasibility Study (BFS) is in progress, and a pit design should be completed 4Q10 (Coffey Mining). Other Projects: GBE has exploration projects in Malawi and Mozambique that could provide positive newsflow in the near term. The main focus is Machinga (Southern Malawi), for pegmatite-hosted REE-Nb-Ta-Zr. Trenching in 2Q10 incl. 10m @ 1% TREO (total REO) and 0.5% Nb2O5, with 0.34% HREO. Drilling results expected early Nov „10. The Mount Muambe Project (REE-Fluorite) could be drilled in 4Q10 – surface sampling and re-sampling in 3Q10 turned up high REE values (peak >1.2% TREO) with av. 50% HREO/TREO in fluorite samples, including 168ppm dysprosium (a high-value element). Investment Comment: GBE‟s share price has benefitted from the jump in REE prices in 3Q10. Our NAV for the company is A$315m, or A$1.78/share based on funding 50% of capex at A$1.00/share. The sale of 51% to ECE for A$41m at A$0.375/share moves this NAV to A$0.59/share, close to the 4Q07 high of +A$0.60/share and a reasonable target, subject to ECE‟s investment and a successful BFS.

Resource Capital Research
Rare and Minor Metals Company Review, December Q 2010. Disclaimer and disclosure attached. Copyright© 2010 by Resource Capital Research Pty Ltd. All rights reserved. 14
Kanyika Project valuation: economics are sensitive to the niobium price, with RCR long
term Nb price of US$39/kg in ferroniobium (current is ~US$42/kg). Our share price
target for GBE is A$1.25/share, post financing 50% of capex at A$0.50/share.
GLOBE METALS AND MINING VALUATION
Target
Price (Low) (High)
Equity Niobium Valuation A$m A$m A$m
Projects (kt) US$/kg
+ Kanyika Resource 100% 174 1.04 227 23 730
+ Kanyika exploration 100% 160 0.38 76 4 21
+ Regional exploration 100% 10 5 20
Sub Total 313 32 771
+ Cash 3.9 3.9 3.9
+ Tax Losses 0.0 0.0 0.0
- Debt 0.0 0.0 0.0
- Corporate 1.9 1.9 1.9
Sub Total 2.0 2.0 2.0
GBE NET ASSET VALUE 315 34 773
Capital Structure
Shares 94 94 94
Fully Diluted Shares 102 102 102
GBE NET ASSET VALUE PER SHARE :A$/share 3.35 0.36 8.22
GBE NET ASSET VALUE DILUTED :A$/share fully diluted 3.09 0.34 7.58
With dilution at A$1/share to raise 50% of US$150m :A$/share fully diluted 1.78
With dilution at A$0.50/share to raise 50% of US$150m :A$/share fully diluted 1.25
With dilution at A$1/share, after sale of 51% for A$41m cash :A$/share fully diluted 0.59
KANYIKA SPECIALTY METALS PROJECT (NPV based on June 2010 resource, June 2008 Scoping Study and May 2009 update)
Equity
LONG TERM NIOBIUM PRICE (per kg in FeNb alloy)^ :US$/kg 25 35 45 55 65
EXCHANGE RATE :AUUS 0.80 0.80 0.80 0.80 0.80
KANYIKA NPV @ 10% NOMINAL* :A$m 100% 27 210 381 574 757
KANYIKA NPV @ 10% NOMINAL* :US$m 100% 22 168 305 459 606
NPV/SHARE :A$/share 0.29 2.23 4.06 6.11 8.05
* Includes a pre-BFS discount of 30% of the project valuation: 30%
^Niobium prices are modelled as f lat line from start of production. Long term FeNb is US$39/kg (Nb), Ta2O5 US$65/lb, U3O8 US$46/lb
GBE's equity assumed to be 100%; however, Govt of Malawi could hold 15% in return for fiscal trade-offs such as tax and royalty reductions
KANYIKA SPECIALTY METALS PROJECT KEY ASSUMPTIONS*
RESOURCE ESTIMATES
Current JORC Indicated and Inferred resource (1,500ppm Nb2O5 cut-off) Ore Nb2O5 Ta2O5 ZrSiO4 U3O8
Mt % % % %
Model does not include zircon production 60 0.29 0.014 0.50 0.009
Contained metal, mlbs 383.6 18.5 661.4 11.9
Contained metal, kt 174.0 8.4 300.0 5.4
MINING METHOD Open Pit
PROCESS METHOD Dedicated Specialty Metals Plant
Concentrate: crush, gravity (incl. seperation of zircon and magnetite), flotation.
Downstream: weak then strong acid leaches, calcining (Nb, Ta, U), smelting with Fe (FeNb).
Year 1 Year 10
PRODUCTION RATE :mtpa 1.72 2.3 Head grade falls from 0.38% Nb2O5 to 0.29% Nb2O5
:tpa Nb 3,000 3,000
:strip ratio 0.6 1.9
CAPITAL COSTS :US$ 155m Excludes working capital; sustaining capex $4mpa.
RECOVERIES TO CONCENTRATE :% 65 All products (Nb, Ta, U)
DOWNSTREAM RECOVERY :% 69
OPERATING COSTS :US$/t 40 to 43 (Includes US$2.80/t mined, US$26 to 34/t milled)
TAX :% 30 Company tax in Malawi
ROYALTY :% 3 ASX:PDN at Kayelekera pays 1.5% for first 3 yrs, then 3%
MINE LIFE :Years 10+
COMMISSION DATE : 3Q13
Valuation Sensitivity
Sensitivity
* These figures are preliminary in nature and are intended to provide only a general indication of project potential scale and economic robustness.
Considerable refinement may result from bankable feasibility study, expected in 2011.

Resource Capital Research
Rare and Minor Metals Review, 4Q10 Disclaimer and disclosure attached. Copyright© 2010 by Resource Capital Research Pty Ltd. All rights reserved. 1
1.10
Debt (A$m) - Dec 10F
Enterprise value (A$m)
Avg monthly volume (m)
Cash (A$m) - Dec 10F
Price/Cash (x) Cash (A$m)
Price/Book (x)
Listed company options: Net asset backing (Ac/share)
* Uranium prospective properties only.
Mineralised Material (est., non compliant w ith JORC)
Contacts Directors
Mr Roderick McIllree M Hutchinson (Chair)
Managing Director
Tel: 61 (0) 8 9226 1100 S Cato (Exec Dir)
West Perth, WA, Australia J Whybrow (Expl Dir)
Analyst: Dr Trent Allen
T Ho (Non-Exec)www.ggg.gl
10.5
Uranium
Code for reporting mineral resources - Australian:
0.0
na
Key Projects
20.9
Investment Points
3.7
GGGO
R McIllree (MD)
Reserves
Type Location
Target
Multi-element focus at Kvanefjeld - uranium component
valued in-ground (4Q10) at ~US$17.5 billion (US$62/lb)
and REE at ~US$146 billion (US$30/kg).
Potential to be one of the world's largest REE and U
deposits - plus economic potential NaF, Zn and Sn.
Resource includes 283mlbs U3O8, 4.9mt REO, 1mt Zn
and 3.1mt NaF- defined over 2km x 1km; open at depth
(>300m) and along strike, regional prospectivity is high.
Metallurgical studies are advanced: process flow sheet
includes alkaline/carbonate pressure leach for uranium,
and separate flotation and leach for REO.
Pre-feasibility study, Feb '10: processing 10.8mtpa for 23
years, producing 43.7ktpa REO and 8.6mlbspa U3O8 .
Capex is US$2.31bn, opex US$41/t. NPV US$2.18bn.
Greenland Government has amended exploration licence
structure to allow for investigation of uranium, signalling
willingness to consider allowing uranium mining.
Indicated, inferred
Project
150
0.0
Route
61%/100%
Partner
Resources
Kvanefjeld*
Project
0.0
Kvanefjeld Advanced Expl
Ownership/
Option Status
JV
U, REO
Metal
Greenland
457 1.0761%
IgneousWestrip
%Mt
Process
Classification
0
*Also uranium (283mlbs contained @ 0.028%), Zn (0.99mt contained @ 0.22%) and NaF (3.09mt contained @ 0.85% NaF).
0.0
10,780
ppm
U3O8
1.6
10.5
3.4
7.6
31.9
(JORC)
Reserves and Resources/Mineralised Material
TREOCut OffOre
0.71
-
211
Cash backing (Ac/share)
211
Funding from JV partners (A$m)
TREO
0
3.9
6.3 10.5
21.9
Project
2.5
1
211
2011F
32.2
7.6
20.5
5.40
6.00
58
Company Comment
424.3
2.8
Sep-10a 2009aDec-10FYear End: December
Land holding ('000 ha)
13.2
7,000 4,000
0
Greenland Minerals and Energy Ltd
1.10
Funding duration at current burn (years)
-
6.8
JP Morgan Nom (15.9%), HSBC Nom (7.6%), Westrip Hold. (6.9%)
22 November 2010
Exchanges: ASX:GGG
0.31 to
Share price (A$) 0.82
Convertible notes (m) 0.0
52 week range (A$/share)
GGG.AU
Rare Earth Elements, Uranium, Zinc, Sodium Fluoride
Greenland
Pre-Feasibility Study
Production and Financial Forecasts Capital Profile
A 33% one-month gain for GGG is due to a buoyant REE market,
and Greenland allowing uranium to be included in economic
assessment of the Kvanefjeld Project (forecast REE 43.7kt/yr,
U3O8 3.9kt/yr). Share price target A$1.46 with considerable upside.
61
211
-
Capital raisings (A$m)
Tenement costs ($k per year)
39
270.4
0
270.4 226.8
211
0
Market capitalisation (undiluted) (A$m)
Major shareholders: Citicorp Nom (16.7%), National Nom (16.7%),
220.4
220.4
1,000
0
1,000
21.9
3.9
2
21.6 20.7
0
-
6.06.1
2.63
Exploration/(Expl.+ Corporate) (%)
Corporate (A$m)
31
1.65
424.3
250.5
Drilling - Other/Diamond (m)
Drilling - RAB (m)
10.47 6.64
0
56
5.28
0.9
6
65
153.9
Number of shares (m) 270.4 Exploration and evaluation (A$m)
Options and warrants (m)
U3O8
Fully diluted (m)
Shares on issue (pr end) (m shares)
0.0
4,000
Equity
0.0
-
Kt Kt
A$ 0.82
Mlb
TREO Eqty
2010F
2,983
TREO
4,890
0.0
0.00
0.20
0.40
0.60
0.80
1.00
1.20
Nov-
09
Dec-
09
Jan-1
0
Mar-
10
Apr-
10
May-
10
Jun-1
0
Aug-1
0
Sep-1
0
Oct-10
Sh
are
Pri
ce
($/S
hare
)
GGG - Greenland Minerals and Energy Limited
Source: Bloomberg
Overview: Greenland Minerals and Energy Limited listed on the ASX in June 2006 (ASX:GGG). It is evaluating the uranium-rich Kvanefjeld multi-element project in Greenland. Kvanefjeld (uranium, Greenland): The project (80km
2) is located on the SW tip of Greenland, at
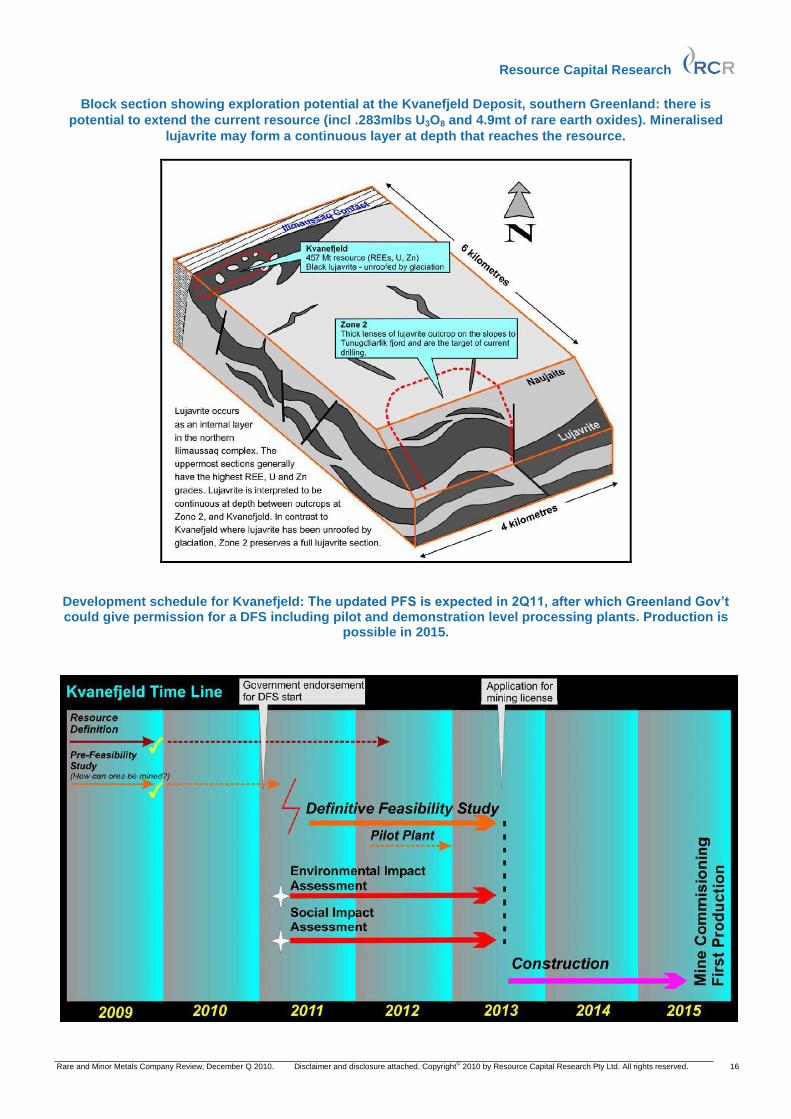
Narsaq. Within the Ilimaussaq alkaline intrusive igneous complex, it is one of the world‟s largest rare earth elements and uranium deposits. Other elements and minerals include zinc, tin and sodium fluoride. GGG‟s 61% ownership is moving to 90% with A$10m payment, and 100% with A$50m. The deposit: is a flat-lying slab of disseminated mineralisation, open at depth and in three directions. Current JORC resource (Jun ‟09) is 457mt @ 0.028% U3O8 for 283mlbs, 1.07% REO for 4.91mt (includes yttrium) and 0.22% Zn for 0.99mt, with 79% of these in the Indicated category. There is also 363mt @ 0.85% NaF for 3.09mt. The resource covers 2km by 1km and extends from surface to 280m depth. Exploration: There is resource upside within the ~6km x 4km Ilimaussaq intrusive. Regional and resource development drilling (~11,000m from Jun ‟10) has intersected black lujavrite at Zone 2 (6km SE of Kvanefjeld), which is similar to mineralised rocks to the resource. Modelling suggests the lujavrite is present as a continuous layer at depth between the resource and Zone 2. Assays expected 4Q10. Metallurgical and mineralogical tests are at an advanced stage. Current process flow sheet includes alkaline pressure leach (CPL) to remove uranium, recovering 84%, followed by flotation and acid leach to produce REE carbonate (rec. 34%). There is potential to improve recoveries, and to beneficiate the ore prior to the CPL circuit and reduce costs. There is also the possibility of generating a zinc concentrate (ZnS). Fluorine and thorium can both convert to insoluble compounds during CPL. A recently started mineralogical study at UBC (Uni British Columbia) should help refine the processing methodology. Pre-Feasibility Study (updated January 2010): Calls for open cut mining and 10.8mtpa processing, for 43.7kt REO and 3.9kt (8.6mlbs) U3O8. Total capital cost is US$2.31bn including contingency. Operating costs are US$3.83/t mining, US$23.55/t for the CPL uranium circuit (US$29.61/lb at head grade 365ppm U3O8), which includes some of the REO flowsheet, and a further US$13.62/t for the REO circuit (US$3.36/kg at head grade 1.19% REO). Construction is scheduled for 2013 and production for 2015. The study places mid-point NPV (10% disc) at US$2.18bn (pre-tax). Base commodity prices are US$80/lb U3O8 (current LT contract price is ~US$62/lb) and US$13/kg REO (which could now be +US$30/kg). Break even U3O8 is US$37.47/lb. A Definitive Feasibility Study could start in mid 2011 if approved by .the Greenland Government. Corporate: GGG raised working capital in 2Q10, placing A$6m in equity at A$0.34/share, and has organised a further A$15m equity facility that can be drawn down when needed over the next 5 years. Investment Comment: An NPV of US$2.18bn for a PFS-stage project, even pre tax, compared to the market cap of A$220m suggests GGG is undervalued. The gap is due to investor uncertainty, over Greenland‟s attitude to uranium mining, the metallurgical process and the large capex. In Sep „10, the Greenland Government amended the Standard Terms for Exploration Licences to include radioactive elements as exploitable minerals for the purpose of evaluation and reporting. This allows further development of Kvanefjeld and signals the Government‟s willingness to talk about uranium mining – the next positive sign would be approval to start a DFS in mid 2011. As the share price chart shows, this news and the strong rare earths market have been well received by investors. Assuming GGG raises 50% of project capex at A$2/share, pre-tax NPV is A$1.46/share: a likely mid-term price target if the DFS goes ahead and good progress continues with the flowsheet and Kvanefjeld exploration.
Resource Capital Research
Rare and Minor Metals Company Review, December Q 2010. Disclaimer and disclosure attached. Copyright© 2010 by Resource Capital Research Pty Ltd. All rights reserved. 16
Block section showing exploration potential at the Kvanefjeld Deposit, southern Greenland: there is
potential to extend the current resource (incl .283mlbs U3O8 and 4.9mt of rare earth oxides). Mineralised
lujavrite may form a continuous layer at depth that reaches the resource.
Development schedule for Kvanefjeld: The updated PFS is expected in 2Q11, after which Greenland Gov‟t could give permission for a DFS including pilot and demonstration level processing plants. Production is
possible in 2015.
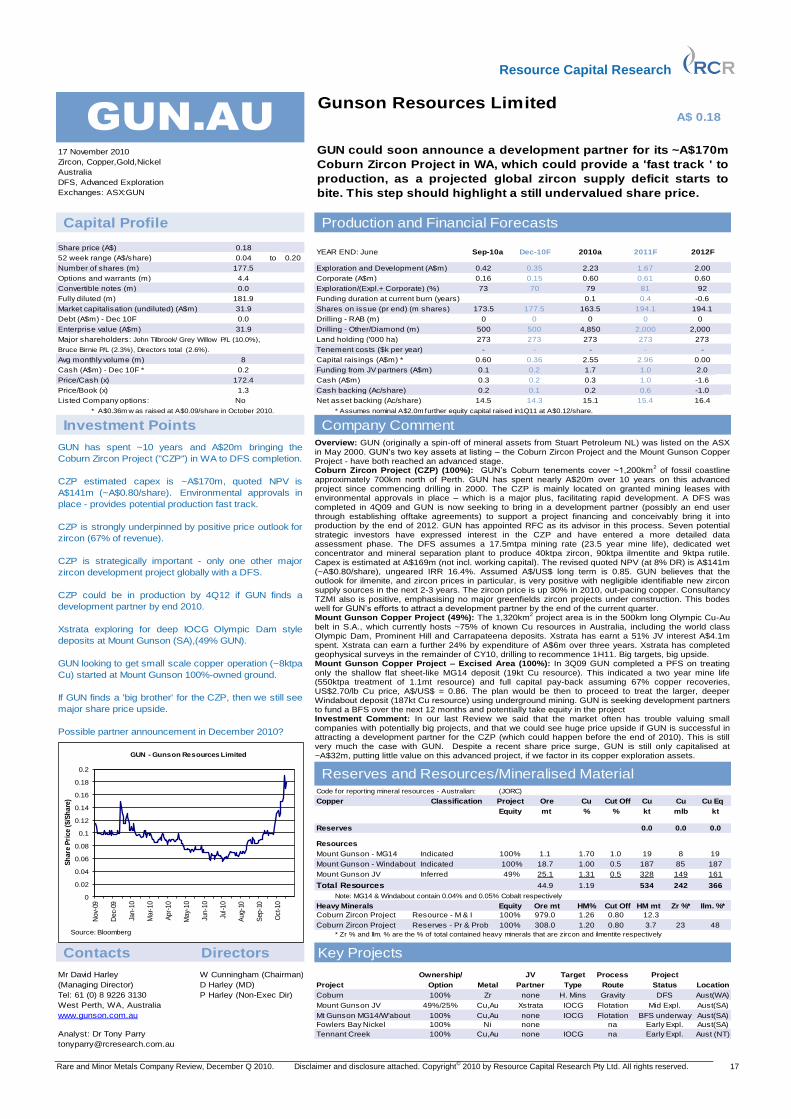
Resource Capital Research
Rare and Minor Metals Company Review, December Q 2010. Disclaimer and disclosure attached. Copyright© 2010 by Resource Capital Research Pty Ltd. All rights reserved. 17
Gunson Resources Limited
0.20
Debt (A$m) - Dec 10F
Enterprise value (A$m)
Avg monthly volume (m)
Cash (A$m) - Dec 10F *
Price/Cash (x) Cash (A$m)
Price/Book (x)
Listed Company options: Net asset backing (Ac/share)
* A$0.36m w as raised at A$0.09/share in October 2010. * Assumes nominal A$2.0m further equity capital raised in1Q11 at A$0.12/share.
Reserves
Resources
1.1
18.7
25.1
Total Resources 44.9
Note: MG14 & Windabout contain 0.04% and 0.05% Cobalt respectively
Coburn Zircon Project
Coburn Zircon Project
* Zr % and Ilm. % are the % of total contained heavy minerals that are zircon and ilmentite respectively
Contacts Directors
Mr David Harley
(Managing Director)
Tel: 61 (0) 8 9226 3130
West Perth, WA, Australia
Resource - M & I
Reserves - Pr & Prob 0.80 3.7 23 48100% 308.0 1.20
Mount Gunson - MG14
Mount Gunson - Windabout
Mount Gunson JV
Indicated 100%
1.01.70
187
328 149 161
187
HM mt
1.00 0.5
Inferred 49%
Cut Off
Gunson Resources Limited
1.19
Heavy Minerals
100%Indicated
1.7
% %
(JORC)
PartnerMetal
Target
19
-1.6
0
2,000
8 19
kt
85
Cu
242
Zr %*
BFS underway
Mid Expl.
534
Aust(SA)
Location
Aust(SA)
Aust(SA)
Status
0.0
HM%
1.26
1.31 0.5
Mt Gunson MG14/W'about 100%
Fowlers Bay Nickel 100%
IOCG
na
none
Mount Gunson JV 49%/25% FlotationCu,Au Xstrata
Project
Coburn 100%
W Cunningham (Chairman)
P Harley (Non-Exec Dir)
Option
Cash backing (Ac/share)
Analyst: Dr Tony Parry
www.gunson.com.au
D Harley (MD)
1.0
Flotation
na
Ore Cu
0.1 0.2
Cut Off
15.415.1
-1.0
0.3
DFS Aust(WA)
Early Expl.
2.0
0.00
Reserves and Resources/Mineralised Material
Key Projects
366
Cu
mt mlb
979.0
Classification Project
Equity
Gravity
0.80
Type
Ownership/ JV Process
H. MinsZr
GUN has spent ~10 years and A$20m bringing the
Coburn Zircon Project ("CZP") in WA to DFS completion.
CZP estimated capex is ~A$170m, quoted NPV is
A$141m (~A$0.80/share). Environmental approvals in
place - provides potential production fast track.
CZP is strongly underpinned by positive price outlook for
zircon (67% of revenue).
CZP is strategically important - only one other major
zircon development project globally with a DFS.
CZP could be in production by 4Q12 if GUN finds a
development partner by end 2010.
Xstrata exploring for deep IOCG Olympic Dam style
deposits at Mount Gunson (SA),(49% GUN).
GUN looking to get small scale copper operation (~8ktpa
Cu) started at Mount Gunson 100%-owned ground.
If GUN finds a 'big brother' for the CZP, then we still see
major share price upside.
Possible partner announcement in December 2010?
Code for reporting mineral resources - Australian:
Investment Points
1.3
No
92
0.2
81
-
500
0.2
0.600.15
0.35
0.3
-0.60.4
273
- -
194.1194.1
0
163.5
2.55
0.6
Cu,Au none
Ni
8
Fully diluted (m)
31.9 2,000
Company Comment
16.414.3
0.1
Copper
14.5
Bruce Birnie P/L (2.3%), Directors total (2.6%).
0
2.960.60Capital raisings (A$m) *
273
0.0
273
172.4
Tenement costs ($k per year)
Convertible notes (m)
181.9
0.0 70Exploration/(Expl.+ Corporate) (%) 73
Funding duration at current burn (years)
-
Market capitalisation (undiluted) (A$m)
Major shareholders: John Tilbrook/ Grey Willow P/L (10.0%),
31.9 173.5
Drilling - Other/Diamond (m)
Land holding ('000 ha)
Drilling - RAB (m)
Shares on issue (pr end) (m shares)
500
0
Options and warrants (m)
0.18
0.0452 week range (A$/share)
GUN.AU
4.4
Zircon, Copper,Gold,Nickel
Australia
DFS, Advanced Exploration
Exchanges: ASX:GUN
Capital Profile
Share price (A$)
Number of shares (m) 177.5
17 November 2010
Production and Financial Forecasts
2012F
0.1
177.5
0.36
273 273
4,850
-
0
0.610.60
79
to
0.42Exploration and Development (A$m)
Dec-10F 2010aSep-10a 2011F
A$ 0.18
YEAR END: June
Funding from JV partners (A$m)
0.16Corporate (A$m)
GUN could soon announce a development partner for its ~A$170m
Coburn Zircon Project in WA, which could provide a 'fast track ' to
production, as a projected global zircon supply deficit starts to
bite. This step should highlight a still undervalued share price.
2.23 2.001.67
0.2
0.2
100%
Equity Ore mt Ilm. %*
12.3
Early Expl. Aust (NT)
0.0
kt
Route
IOCG
none
none IOCG
Project
0.0
1.0
Cu Eq
Tennant Creek 100% Cu,Au
0
0.02
0.04
0.06
0.08
0.1
0.12
0.14
0.16
0.18
0.2
Nov-
09
Dec-
09
Jan-1
0
Mar-
10
Apr-
10
May-
10
Jun-1
0
Jul-10
Aug-1
0
Sep-1
0
Oct-10
Sh
are
Pri
ce
($/S
hare
)
GUN - Gunson Resources Limited
Source: Bloomberg
Overview: GUN (originally a spin-off of mineral assets from Stuart Petroleum NL) was listed on the ASX in May 2000. GUN‟s two key assets at listing – the Coburn Zircon Project and the Mount Gunson Copper Project - have both reached an advanced stage. Coburn Zircon Project (CZP) (100%): GUN‟s Coburn tenements cover ~1,200km
2 of fossil coastline
approximately 700km north of Perth. GUN has spent nearly A$20m over 10 years on this advanced project since commencing drilling in 2000. The CZP is mainly located on granted mining leases with environmental approvals in place – which is a major plus, facilitating rapid development. A DFS was completed in 4Q09 and GUN is now seeking to bring in a development partner (possibly an end user through establishing offtake agreements) to support a project financing and conceivably bring it into production by the end of 2012. GUN has appointed RFC as its advisor in this process. Seven potential strategic investors have expressed interest in the CZP and have entered a more detailed data assessment phase. The DFS assumes a 17.5mtpa mining rate (23.5 year mine life), dedicated wet concentrator and mineral separation plant to produce 40ktpa zircon, 90ktpa ilmentite and 9ktpa rutile. Capex is estimated at A$169m (not incl. working capital). The revised quoted NPV (at 8% DR) is A$141m (~A$0.80/share), ungeared IRR 16.4%. Assumed A$/US$ long term is 0.85. GUN believes that the outlook for ilmenite, and zircon prices in particular, is very positive with negligible identifiable new zircon supply sources in the next 2-3 years. The zircon price is up 30% in 2010, out-pacing copper. Consultancy TZMI also is positive, emphasising no major greenfields zircon projects under construction. This bodes well for GUN‟s efforts to attract a development partner by the end of the current quarter. Mount Gunson Copper Project (49%): The 1,320km
2 project area is in the 500km long Olympic Cu-Au
belt in S.A., which currently hosts ~75% of known Cu resources in Australia, including the world class Olympic Dam, Prominent Hill and Carrapateena deposits. Xstrata has earnt a 51% JV interest A$4.1m spent. Xstrata can earn a further 24% by expenditure of A$6m over three years. Xstrata has completed geophysical surveys in the remainder of CY10, drilling to recommence 1H11. Big targets, big upside. Mount Gunson Copper Project – Excised Area (100%): In 3Q09 GUN completed a PFS on treating only the shallow flat sheet-like MG14 deposit (19kt Cu resource). This indicated a two year mine life (550ktpa treatment of 1.1mt resource) and full capital pay-back assuming 67% copper recoveries, US$2.70/lb Cu price, A$/US$ = 0.86. The plan would be then to proceed to treat the larger, deeper Windabout deposit (187kt Cu resource) using underground mining. GUN is seeking development partners to fund a BFS over the next 12 months and potentially take equity in the project Investment Comment: In our last Review we said that the market often has trouble valuing small companies with potentially big projects, and that we could see huge price upside if GUN is successful in attracting a development partner for the CZP (which could happen before the end of 2010). This is still very much the case with GUN. Despite a recent share price surge, GUN is still only capitalised at ~A$32m, putting little value on this advanced project, if we factor in its copper exploration assets.

Resource Capital Research
Rare and Minor Metals Company Review, December Q 2010. Disclaimer and disclosure attached. Copyright© 2010 by Resource Capital Research Pty Ltd. All rights reserved. 18
GUN‟s Project portfolio is headlined by the advanced Coburn mineral sands project in WA (zircon is the
key mineral) and the Mount Gunson copper exploration project in SA‟s Olympic Dam territory, where GUN
has a small scale production project BFS underway. Fowler‟s Bay is early stage nickel exploration, and
Tennant Creek early stage copper-gold exploration.
The Mount Gunson Copper project (49% GUN, 51% Xstrata) is situated in the 500km long Olympic Copper-Gold Province in South Australia which contains ~75% of the known copper resources in Australia –
including the Olympic Dam, Prominent Hill and Carrapateena deposits. The latter, potentially containing >4mt Cu (drilled by Teck Cominco), is only 20km east of GUN‟s tenements.
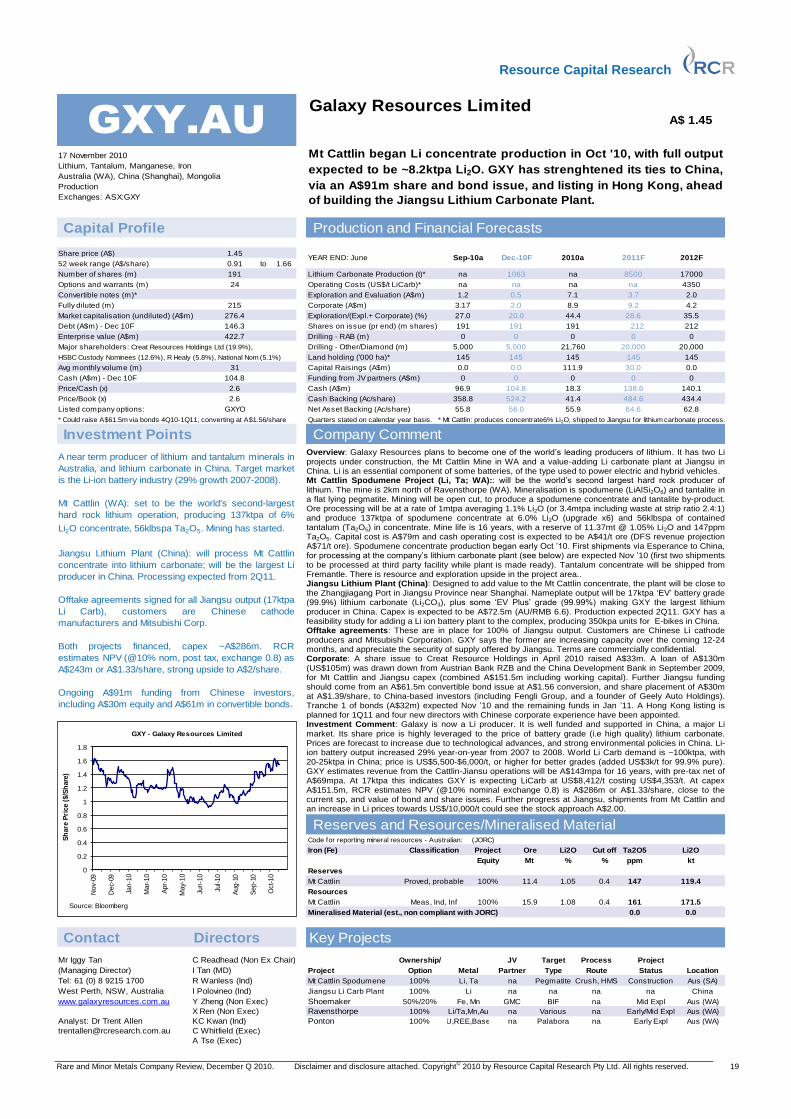
Resource Capital Research
Rare and Minor Metals Company Review, December Q 2010. Disclaimer and disclosure attached. Copyright© 2010 by Resource Capital Research Pty Ltd. All rights reserved. 19
Galaxy Resources Limited
1.66
Debt (A$m) - Dec 10F
Enterprise value (A$m)
Avg monthly volume (m)
Cash (A$m) - Dec 10F
Price/Cash (x) Cash (A$m)
Price/Book (x)
Listed company options: Net Asset Backing (Ac/share)
* Could raise A$61.5m via bonds 4Q10-1Q11, converting at A$1.56/share Quarters stated on calendar year basis. * Mt Cattlin: produces concentrate6% Li2O, shipped to Jiangsu for lithium carbonate process.
Reserves
Resources
Mineralised Material (est., non compliant with JORC)
Contact Directors
Mr Iggy Tan
(Managing Director)
Tel: 61 (0) 8 9215 1700
West Perth, NSW, Australia
Shoemaker
Ravensthorpe
Analyst: Dr Trent Allen Ponton
0.0
Cut off
0.0
Option
0.0
434.4
0.0
484.6
kt
R Wanless (Ind)
na
na
Y Zheng (Non Exec)
I Polovineo (Ind)
Li/Ta,Mn,Au na
C Whitfield (Exec)
Fe, Mn
Major shareholders: Creat Resources Holdings Ltd (19.9%),
Route
C Readhead (Non Ex Chair)
I Tan (MD)
18.3
Process
Equity
na na
Mid Expl
111.9
20,000
00
55.9
21,760
145
China
Construction
138.6
ppm
147 119.4
171.5
64.6
161
Li2O
55.8
%
56.0
145
%
Li2O
41.4
140.1
Company Comment
A near term producer of lithium and tantalum minerals in
Australia, and lithium carbonate in China. Target market
is the Li-ion battery industry (29% growth 2007-2008).
Mt Cattlin (WA): set to be the world's second-largest
hard rock lithium operation, producing 137ktpa of 6%
Li2O concentrate, 56klbspa Ta2O5. Mining has started.
Jiangsu Lithium Plant (China): will process Mt Cattlin
concentrate into lithium carbonate; will be the largest Li
producer in China. Processing expected from 2Q11.
Offtake agreements signed for all Jiangsu output (17ktpa
Li Carb), customers are Chinese cathode
manufacturers and Mitsubishi Corp.
Both projects financed, capex ~A$286m. RCR
estimates NPV (@10% nom, post tax, exchange 0.8) as
A$243m or A$1.33/share, strong upside to A$2/share.
Ongoing A$91m funding from Chinese investors,
including A$30m equity and A$61m in convertible bonds.
Investment Points
Cash Backing (Ac/share)
Project
62.8
524.2
Iron (Fe) Classification Ta2O5
Market capitalisation (undiluted) (A$m)
Corporate (A$m)
Drilling - RAB (m)
Drilling - Other/Diamond (m)
215
358.8
HSBC Custody Nominees (12.6%), R Healy (5.8%), National Nom (5.1%)
146.3
Land holding ('000 ha)*
104.8
31
Fully diluted (m)
422.7
www.galaxyresources.com.au
GXYO
2.6
17 November 2010
276.4
GXY.AU
2.6
Funding from JV partners (A$m)
Shares on issue (pr end) (m shares)
4.2
28.6
00
9.2
191
0
212
8.9
3.7
212
3.17
27.0 20.0
7.1
2.0
191
44.4
0.0
0.5Exploration and Evaluation (A$m)
145 145
5,000
0
Capital Raisings (A$m)
Exploration/(Expl.+ Corporate) (%)
0
191
Lithium, Tantalum, Manganese, Iron
Australia (WA), China (Shanghai), Mongolia
Production
Exchanges: ASX:GXY
Convertible notes (m)*
YEAR END: June1.45
0.91
Operating Costs (US$/t LiCarb)*
Capital Profile
Options and warrants (m)
52 week range (A$/share) to
24
Share price (A$)
Number of shares (m) 191
Galaxy Resources Limited
Mt Cattlin began Li concentrate production in Oct '10, with full output
expected to be ~8.2ktpa Li2O. GXY has strenghtened its ties to China,
via an A$91m share and bond issue, and listing in Hong Kong, ahead
of building the Jiangsu Lithium Carbonate Plant.
2011F
na 170008500
A$ 1.45
2010a
na 1063
nana nana
0
Production and Financial Forecasts
2012F
Lithium Carbonate Production (t)*
1.2
Sep-10a
2.0
35.5
4350
Dec-10F
0.4Meas, Ind, Inf
5,000 20,000
145
30.0
Mt
Ore
0 0
104.896.9
StatusType
JV
X Ren (Non Exec)
KC Kwan (Ind)
A Tse (Exec)
naBIF
Reserves and Resources/Mineralised MaterialCode for reporting mineral resources - Australian: (JORC)
Aus (WA)
Various
Jiangsu Li Carb Plant 100% Li
Aus (WA)
50%/20%
100%
na
GMC
100% 15.9
Project
Ownership/ Target
1.08
Partner
Mt Cattlin
Key Projects
Metal
Mt Cattlin Spodumene 100% Crush, HMS
Project
Location
Aus (SA)PegmatiteLi, Ta
na Palabora na Early Expl
Early/Mid Explna
Mt Cattlin Proved, probable 100% 11.4 1.05 0.4
Aus (WA)100% U,REE,Base
0
0.2
0.4
0.6
0.8
1
1.2
1.4
1.6
1.8
Nov-
09
Dec-
09
Jan-1
0
Mar-
10
Apr-
10
May-
10
Jun-1
0
Jul-10
Aug-1
0
Sep-1
0
Oct-10
Sh
are
Pri
ce
($/S
hare
)
GXY - Galaxy Resources Limited
Source: Bloomberg
Overview: Galaxy Resources plans to become one of the world‟s leading producers of lithium. It has two Li projects under construction, the Mt Cattlin Mine in WA and a value-adding Li carbonate plant at Jiangsu in China. Li is an essential component of some batteries, of the type used to power electric and hybrid vehicles. Mt Cattlin Spodumene Project (Li, Ta; WA):: will be the world‟s second largest hard rock producer of lithium. The mine is 2km north of Ravensthorpe (WA). Mineralisation is spodumene (LiAlSi2O6) and tantalite in a flat lying pegmatite. Mining will be open cut, to produce a spodumene concentrate and tantalite by-product. Ore processing will be at a rate of 1mtpa averaging 1.1% Li2O (or 3.4mtpa including waste at strip ratio 2.4:1) and produce 137ktpa of spodumene concentrate at 6.0% Li2O (upgrade x6) and 56klbspa of contained tantalum (Ta2O5) in concentrate. Mine life is 16 years, with a reserve of 11.37mt @ 1.05% Li2O and 147ppm Ta2O5. Capital cost is A$79m and cash operating cost is expected to be A$41/t ore (DFS revenue projection A$71/t ore). Spodumene concentrate production began early Oct ‟10. First shipments via Esperance to China, for processing at the company‟s lithium carbonate plant (see below) are expected Nov ‟10 (first two shipments to be processed at third party facility while plant is made ready). Tantalum concentrate will be shipped from Fremantle. There is resource and exploration upside in the project area.. Jiangsu Lithium Plant (China): Designed to add value to the Mt Cattlin concentrate, the plant will be close to the Zhangjiagang Port in Jiangsu Province near Shanghai. Nameplate output will be 17ktpa „EV‟ battery grade (99.9%) lithium carbonate (Li2CO3), plus some „EV Plus‟ grade (99.99%) making GXY the largest lithium producer in China. Capex is expected to be A$72.5m (AU/RMB 6.6). Production expected 2Q11. GXY has a feasibility study for adding a Li ion battery plant to the complex, producing 350kpa units for E-bikes in China. Offtake agreements: These are in place for 100% of Jiangsu output. Customers are Chinese Li cathode producers and Mitsubishi Corporation. GXY says the former are increasing capacity over the coming 12-24 months, and appreciate the security of supply offered by Jiangsu. Terms are commercially confidential. Corporate: A share issue to Creat Resource Holdings in April 2010 raised A$33m. A loan of A$130m (US$105m) was drawn down from Austrian Bank RZB and the China Development Bank in September 2009, for Mt Cattlin and Jiangsu capex (combined A$151.5m including working capital). Further Jiangsu funding should come from an A$61.5m convertible bond issue at A$1.56 conversion, and share placement of A$30m at A$1.39/share, to China-based investors (including Fengli Group, and a founder of Geely Auto Holdings). Tranche 1 of bonds (A$32m) expected Nov ‟10 and the remaining funds in Jan ‟11. A Hong Kong listing is planned for 1Q11 and four new directors with Chinese corporate experience have been appointed. Investment Comment: Galaxy is now a Li producer. It is well funded and supported in China, a major Li market. Its share price is highly leveraged to the price of battery grade (i.e high quality) lithium carbonate. Prices are forecast to increase due to technological advances, and strong environmental policies in China. Li-ion battery output increased 29% year-on-year from 2007 to 2008. World Li Carb demand is ~100ktpa, with 20-25ktpa in China; price is US$5,500-$6,000/t, or higher for better grades (added US$3k/t for 99.9% pure). GXY estimates revenue from the Cattlin-Jiansu operations will be A$143mpa for 16 years, with pre-tax net of A$69mpa. At 17ktpa this indicates GXY is expecting LiCarb at US$8,412/t costing US$4,353/t. At capex A$151.5m, RCR estimates NPV (@10% nominal exchange 0.8) is A$286m or A$1.33/share, close to the current sp, and value of bond and share issues. Further progress at Jiangsu, shipments from Mt Cattlin and an increase in Li prices towards US$/10,000/t could see the stock approach A$2.00.

Resource Capital Research
Rare and Minor Metals Company Review, December Q 2010. Disclaimer and disclosure attached. Copyright© 2010 by Resource Capital Research Pty Ltd. All rights reserved. 20
Plan of Mt Cattlin Spodumene Mine: proposed pit outline, lithium resource blocks and drill intercepts. Production has commenced, with ramp up to 137ktpa concentrate grading 6% Li2O and ~0.02% Ta2O5.
Galaxy Resources, valuation of the Mt Cattlin Mine and Jiangsu Lithium Carbonate Plant: sensitivity analysis is for the Li Carb price; GXY base case for price is US$8,412/t.
Galaxy Minerals valuation based on operating Mt Cattlin mine and expected Jiangsu lithium carbonate plant
Equity
LONG TERM LITHIUM CARBONATE PRICE^ :US$/t 4,000 6,000 8,000 10,000 12,000
EXCHANGE RATE :AUUS 0.80 0.80 0.80 0.80 0.80
MT CATTLIN/JIANGSU NPV @ 10% NOMINAL* :A$m 100% -125 59 243 427 611
MT CATTLIN/JIANGSU NPV @ 10% NOMINAL* :US$m 100% -100 47 195 342 489
NPV/SHARE :A$/share -0.58 0.27 1.13 1.99 2.85
* Includes a discount of 15% of the project valuation (Jiangsu development discount): 15%
^Mt Cattlin produces ~56klbs/pa Ta2O5 in concentrate. Tantalum price forecast is US$85/lb to 4Q13, thence US$65/lb long term.
Key Assumptions*
RESOURCE ESTIMATES
Tantalum (Ta2O5)
Mt % kt ppm
Current Mt Cattlin Reserve 11.4 1.05 120 147
Current Mt Cattlin Resource (incl reserve) 15.9 1.08 172 161
Resource upside for 20 years prod'n 4 1.08 43 161
Total conceptual resource 20 1.08 216 161
MINING METHOD Open pit
PROCESS METHOD Spodume mineral concentration At Mt Cattlin, WA
Lithium carbonate production Expected at Jiangsu, China (or interim 3rd party plant)
PRODUCTION RATE :mtpa 1.0 Head grade 1.1% Li2O. 3.4mtpa including waste (strip 2.4:1)
:contained metal 8.22ktpa Li2O As concentrate grading 6% Li2O, with 56klbspa Ta2O5
:lithium carbonate 17ktpa Expected at Jiangsu
CAPITAL COSTS :A$m 79 Plus expected A$72.5m for Jiangsu
OPERATING COSTS :A$/t 41 Mt Cattlin only, tonne ore
:US$/t 4,353 Li Carb at Jiangsu, backed out from GXY revenue projections
TAX :% 30 Australia
ROYALTY :% 4 WA
MINE LIFE :Years 16 Conceptual 20 year resource modelled
COMMISSION DATE : 3Q10 Mt Cattlin Mine. Jiangsu from 2Q11.
* These figures are preliminary and may be refined with ongoing production at Mt Cattlin and the announcement of final costs for the Jiangsu LiCarb plant.
Sensitivity
Lithium (Li2O)
Mt Cattlin Li-Ta spodumene mine, WA
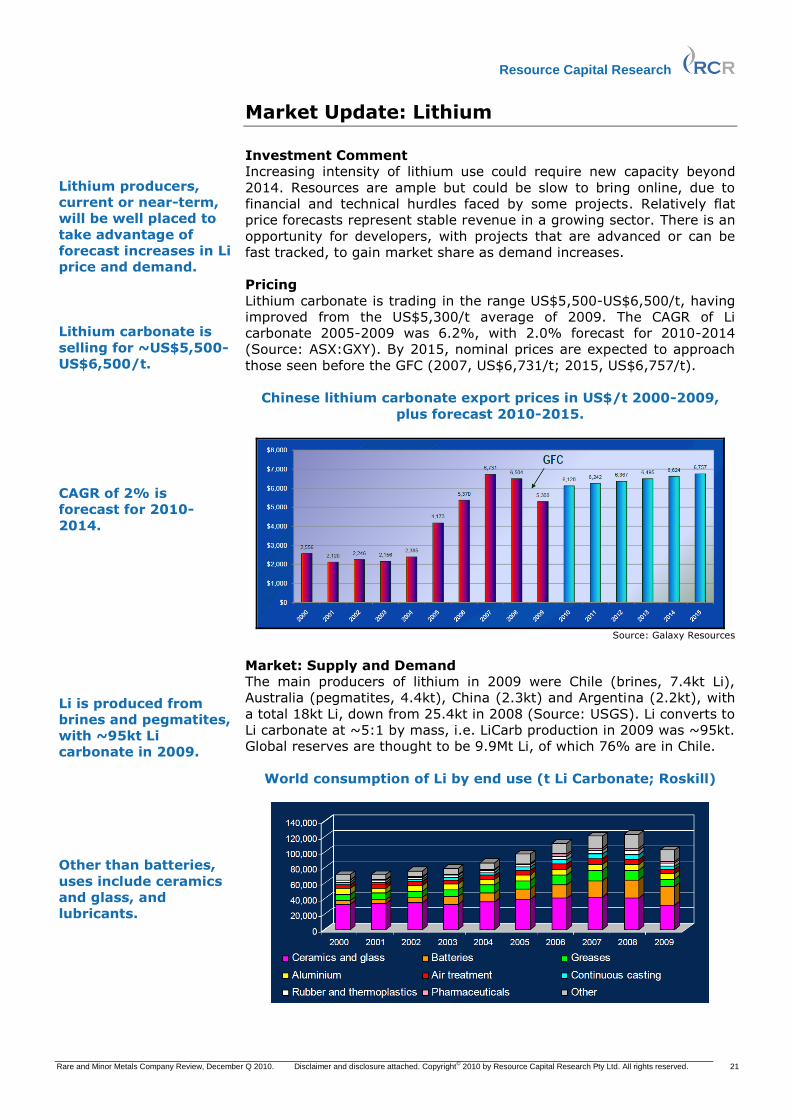
Resource Capital Research
Rare and Minor Metals Company Review, December Q 2010. Disclaimer and disclosure attached. Copyright© 2010 by Resource Capital Research Pty Ltd. All rights reserved. 21
Market Update: Lithium
Investment Comment
Increasing intensity of lithium use could require new capacity beyond
2014. Resources are ample but could be slow to bring online, due to
financial and technical hurdles faced by some projects. Relatively flat
price forecasts represent stable revenue in a growing sector. There is an
opportunity for developers, with projects that are advanced or can be
fast tracked, to gain market share as demand increases.
Pricing
Lithium carbonate is trading in the range US$5,500-US$6,500/t, having
improved from the US$5,300/t average of 2009. The CAGR of Li
carbonate 2005-2009 was 6.2%, with 2.0% forecast for 2010-2014
(Source: ASX:GXY). By 2015, nominal prices are expected to approach
those seen before the GFC (2007, US$6,731/t; 2015, US$6,757/t).
Chinese lithium carbonate export prices in US$/t 2000-2009,
plus forecast 2010-2015.
Source: Galaxy Resources
Market: Supply and Demand
The main producers of lithium in 2009 were Chile (brines, 7.4kt Li),
Australia (pegmatites, 4.4kt), China (2.3kt) and Argentina (2.2kt), with
a total 18kt Li, down from 25.4kt in 2008 (Source: USGS). Li converts to
Li carbonate at ~5:1 by mass, i.e. LiCarb production in 2009 was ~95kt.
Global reserves are thought to be 9.9Mt Li, of which 76% are in Chile.
World consumption of Li by end use (t Li Carbonate; Roskill)
Lithium producers,
current or near-term,
will be well placed to
take advantage of
forecast increases in Li
price and demand.
Lithium carbonate is
selling for ~US$5,500-
US$6,500/t.
CAGR of 2% is
forecast for 2010-
2014.
Li is produced from
brines and pegmatites,
with ~95kt Li
carbonate in 2009.
Other than batteries,
uses include ceramics
and glass, and
lubricants.
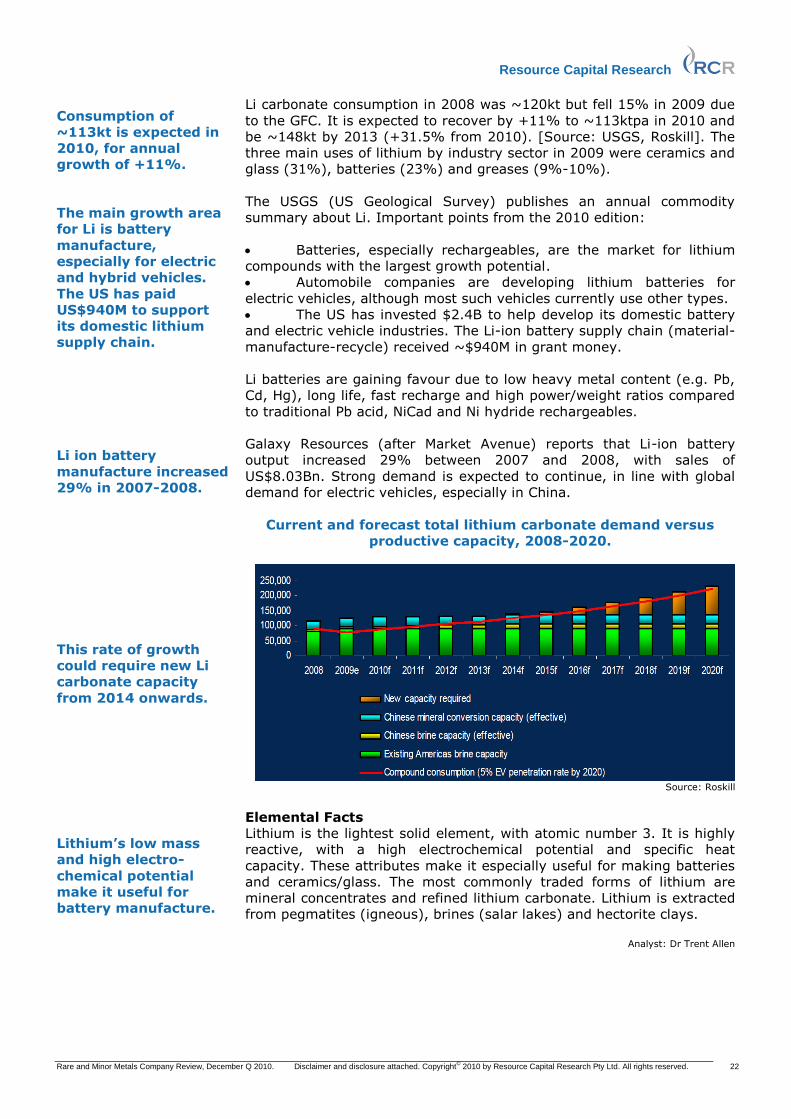
Resource Capital Research
Rare and Minor Metals Company Review, December Q 2010. Disclaimer and disclosure attached. Copyright© 2010 by Resource Capital Research Pty Ltd. All rights reserved. 22
Li carbonate consumption in 2008 was ~120kt but fell 15% in 2009 due
to the GFC. It is expected to recover by +11% to ~113ktpa in 2010 and
be ~148kt by 2013 (+31.5% from 2010). [Source: USGS, Roskill]. The
three main uses of lithium by industry sector in 2009 were ceramics and
glass (31%), batteries (23%) and greases (9%-10%).
The USGS (US Geological Survey) publishes an annual commodity
summary about Li. Important points from the 2010 edition:
Batteries, especially rechargeables, are the market for lithium
compounds with the largest growth potential.
Automobile companies are developing lithium batteries for
electric vehicles, although most such vehicles currently use other types.
The US has invested $2.4B to help develop its domestic battery
and electric vehicle industries. The Li-ion battery supply chain (material-
manufacture-recycle) received ~$940M in grant money.
Li batteries are gaining favour due to low heavy metal content (e.g. Pb,
Cd, Hg), long life, fast recharge and high power/weight ratios compared
to traditional Pb acid, NiCad and Ni hydride rechargeables.
Galaxy Resources (after Market Avenue) reports that Li-ion battery
output increased 29% between 2007 and 2008, with sales of
US$8.03Bn. Strong demand is expected to continue, in line with global
demand for electric vehicles, especially in China.
Current and forecast total lithium carbonate demand versus
productive capacity, 2008-2020.
Source: Roskill
Elemental Facts
Lithium is the lightest solid element, with atomic number 3. It is highly
reactive, with a high electrochemical potential and specific heat
capacity. These attributes make it especially useful for making batteries
and ceramics/glass. The most commonly traded forms of lithium are
mineral concentrates and refined lithium carbonate. Lithium is extracted
from pegmatites (igneous), brines (salar lakes) and hectorite clays.
Analyst: Dr Trent Allen
Consumption of
~113kt is expected in
2010, for annual
growth of +11%.
The main growth area
for Li is battery
manufacture,
especially for electric
and hybrid vehicles.
The US has paid
US$940M to support
its domestic lithium
supply chain.
Li ion battery
manufacture increased
29% in 2007-2008.
This rate of growth
could require new Li
carbonate capacity
from 2014 onwards.
Lithium‟s low mass
and high electro-
chemical potential
make it useful for
battery manufacture.
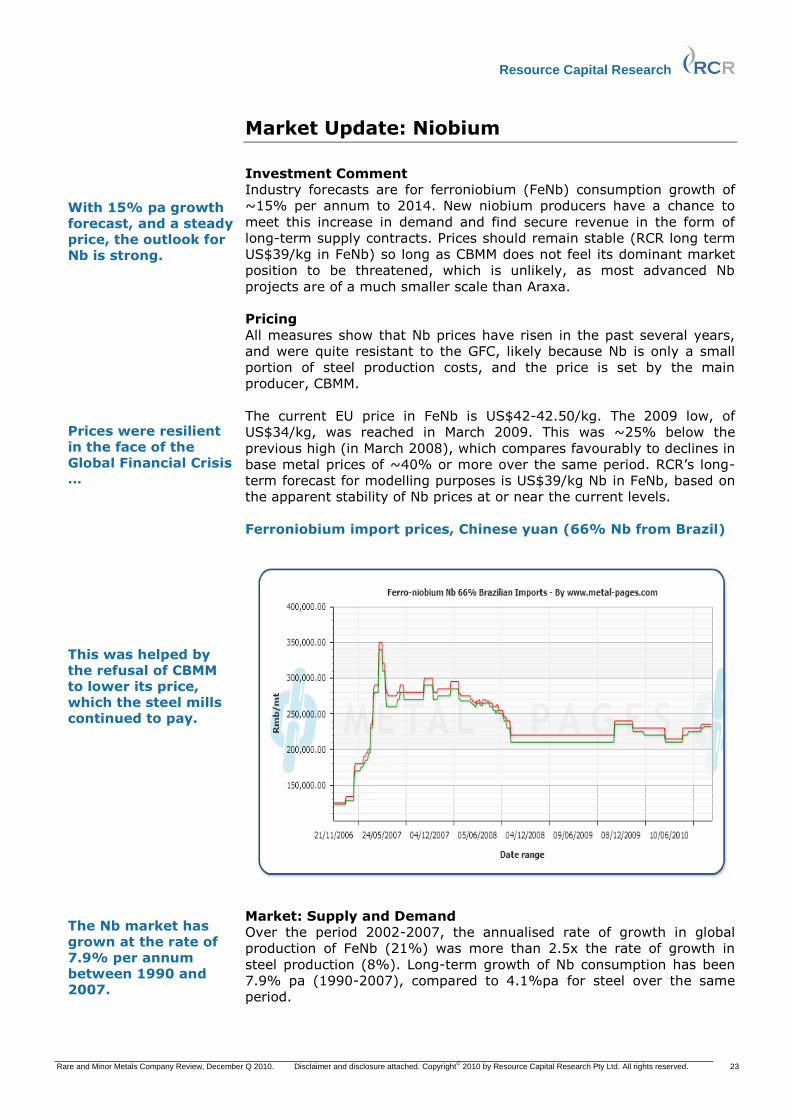
Resource Capital Research
Rare and Minor Metals Company Review, December Q 2010. Disclaimer and disclosure attached. Copyright© 2010 by Resource Capital Research Pty Ltd. All rights reserved. 23
Market Update: Niobium
Investment Comment
Industry forecasts are for ferroniobium (FeNb) consumption growth of
~15% per annum to 2014. New niobium producers have a chance to
meet this increase in demand and find secure revenue in the form of
long-term supply contracts. Prices should remain stable (RCR long term
US$39/kg in FeNb) so long as CBMM does not feel its dominant market
position to be threatened, which is unlikely, as most advanced Nb
projects are of a much smaller scale than Araxa.
Pricing
All measures show that Nb prices have risen in the past several years,
and were quite resistant to the GFC, likely because Nb is only a small
portion of steel production costs, and the price is set by the main
producer, CBMM.
The current EU price in FeNb is US$42-42.50/kg. The 2009 low, of
US$34/kg, was reached in March 2009. This was ~25% below the
previous high (in March 2008), which compares favourably to declines in
base metal prices of ~40% or more over the same period. RCR‟s long-
term forecast for modelling purposes is US$39/kg Nb in FeNb, based on
the apparent stability of Nb prices at or near the current levels.
Ferroniobium import prices, Chinese yuan (66% Nb from Brazil)
Market: Supply and Demand
Over the period 2002-2007, the annualised rate of growth in global
production of FeNb (21%) was more than 2.5x the rate of growth in
steel production (8%). Long-term growth of Nb consumption has been
7.9% pa (1990-2007), compared to 4.1%pa for steel over the same
period.
With 15% pa growth forecast, and a steady price, the outlook for Nb is strong. Prices were resilient in the face of the Global Financial Crisis … This was helped by the refusal of CBMM to lower its price, which the steel mills continued to pay. The Nb market has grown at the rate of 7.9% per annum between 1990 and 2007.
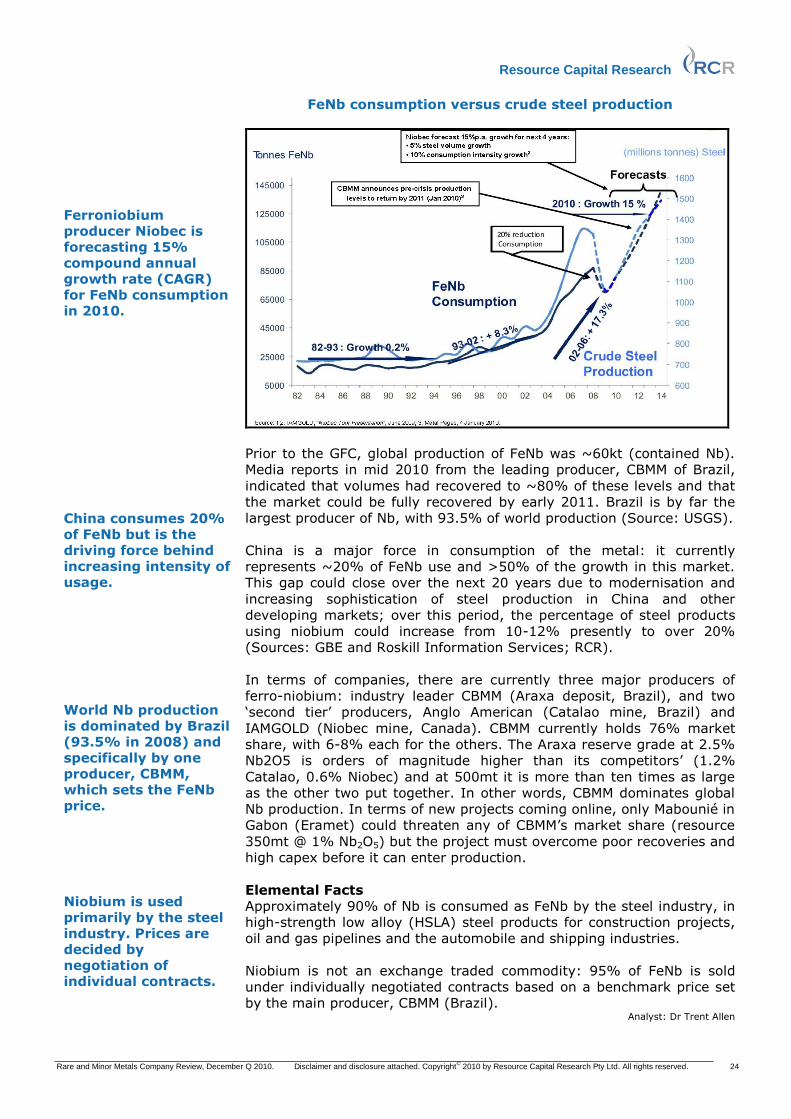
Resource Capital Research
Rare and Minor Metals Company Review, December Q 2010. Disclaimer and disclosure attached. Copyright© 2010 by Resource Capital Research Pty Ltd. All rights reserved. 24
FeNb consumption versus crude steel production
Prior to the GFC, global production of FeNb was ~60kt (contained Nb).
Media reports in mid 2010 from the leading producer, CBMM of Brazil,
indicated that volumes had recovered to ~80% of these levels and that
the market could be fully recovered by early 2011. Brazil is by far the
largest producer of Nb, with 93.5% of world production (Source: USGS).
China is a major force in consumption of the metal: it currently
represents ~20% of FeNb use and >50% of the growth in this market.
This gap could close over the next 20 years due to modernisation and
increasing sophistication of steel production in China and other
developing markets; over this period, the percentage of steel products
using niobium could increase from 10-12% presently to over 20%
(Sources: GBE and Roskill Information Services; RCR).
In terms of companies, there are currently three major producers of
ferro-niobium: industry leader CBMM (Araxa deposit, Brazil), and two
„second tier‟ producers, Anglo American (Catalao mine, Brazil) and
IAMGOLD (Niobec mine, Canada). CBMM currently holds 76% market
share, with 6-8% each for the others. The Araxa reserve grade at 2.5%
Nb2O5 is orders of magnitude higher than its competitors‟ (1.2%
Catalao, 0.6% Niobec) and at 500mt it is more than ten times as large
as the other two put together. In other words, CBMM dominates global
Nb production. In terms of new projects coming online, only Mabounié in
Gabon (Eramet) could threaten any of CBMM‟s market share (resource
350mt @ 1% Nb2O5) but the project must overcome poor recoveries and
high capex before it can enter production.
Elemental Facts
Approximately 90% of Nb is consumed as FeNb by the steel industry, in
high-strength low alloy (HSLA) steel products for construction projects,
oil and gas pipelines and the automobile and shipping industries.
Niobium is not an exchange traded commodity: 95% of FeNb is sold
under individually negotiated contracts based on a benchmark price set
by the main producer, CBMM (Brazil). Analyst: Dr Trent Allen
Ferroniobium producer Niobec is forecasting 15% compound annual growth rate (CAGR) for FeNb consumption in 2010. China consumes 20% of FeNb but is the driving force behind increasing intensity of usage. World Nb production is dominated by Brazil (93.5% in 2008) and specifically by one producer, CBMM, which sets the FeNb price. Niobium is used primarily by the steel industry. Prices are decided by negotiation of individual contracts.

Resource Capital Research
Rare and Minor Metals Company Review, December Q 2010. Disclaimer and disclosure attached. Copyright© 2010 by Resource Capital Research Pty Ltd. All rights reserved. 25
Market Update: Tantalum
Investment Comment
A tantalum supply shortfall has lifted prices and is expected to last until
at least 2013. This could benefit companies that can provide a long-term
supply of ethically produced tantalum. RCR‟s long-term price forecast,
based on the assumptions of Ta industry participants (e.g. ASX:GBE) is
US$143/kg (US$65/lb) Ta2O5.
Pricing
The current price of Ta as tantalite (30% Ta2O5) is US$80-95/lb Ta2O5
(Metal Pages). This is (on average) 154% higher than the 2009 low
(August, 2009; US$33.00-36.00/lb Ta2O5), which was the lowest price
since March 2007 (US$32.22-34.33/lb Ta2O5).
The increase is recent and is due largely to anticipation of a supply
shortage as the market is starved of DRC tantalite. This shortage is
expected to last until at least 2013 (Source: Gippsland Minerals).
Tantalite basis 30% Ta2O5
Market: Supply and Demand
Before the GFC, global Ta2O5 consumption was estimated to be 6mlbs
per annum. Industry commentators suggest that the market is growing
at ~ 7% per annum (Sources: GBE, Gippsland Ltd).
Leading commercial consumers are HC Starck GmbH ( part of German
conglomerate Bayer AG), as well as Cabot Corporation (USA), Ulba OJSC
(Kazakhstan), Mitsui-Kinzoku (Japan) and Ningxia Non-Ferrous Metals
(China) plus various other Chinese groups.
The supply deficit in Ta markets could last beyond 2013.
Tantalum prices are commonly reported as lbs of its main ore mineral, tantalite. Ta prices have soared 150% in the past year, partly due to international measures taken against the DRC, which supplies “conflict tantalum”. Ta consumers are manufacturers of advanced technology, in Europe, Asia and the USA.

Resource Capital Research
Rare and Minor Metals Company Review, December Q 2010. Disclaimer and disclosure attached. Copyright© 2010 by Resource Capital Research Pty Ltd. All rights reserved. 26
Until recently, the state of play in tantalum production was quite
unclear. According to the USGS, world mine production of Ta metal in
2008 and 2009 was ~1.16kt-1.17kt. From 2005-2008, approximately
equal proportions were supplied as ores and concentrates, metal, and
scrap.
For concentrates, 53% was supplied by Australia. The major Ta metal
producer was Brazil (23%) and the biggest secondary producer (waste
and scrap) was China (27%).
Until 2009, the major corporate producer of tantalum was Talison
Minerals from its Wodinga mine in WA‟s Pilbara. However, this closed
during the GFC. It is uncertain when or if this mine will re-open.
Obviously, the downturn in Ta-intensive industries during the GFC led to
Wodinga‟s closure and prevented any problems with undersupply.
The market is complicated by the considerable black market for Ta
(about 20% of the global market), illegally supplied by artisanal mines
in the Democratic Republic of Congo (DRC) and allegedly used to fund a
civil war in that country, ie. “conflict tantalum”.
In July 2010, however, the US Congress passed the Financial Stability
Act, which requires US companies to disclose if their products contain
tantalum (and tin, tungsten or gold) that is sourced from the DRC or
adjoining countries. This should prevent the use of DRC material and,
due to the stringent supply chain reporting requirements of the Act, may
also turn buyers away from the adjoining countries (being Uganda,
Rwanda, Burundi, Kenya, Tanzania, Zambia, Angola, Republic of Congo
[Brazzaville], Sudan and the Central African Republic).
Elemental Facts
Tantalum is used in diverse high technology applications. It is resistant
to corrosion, has a low thermal coefficient of expansion, and a high
dielectric constant, so its main uses are in capacitors (e.g. for consumer
electronics), chemical plant and equipment, aviation turbine blades and,
as tantalum carbide, for cutting tools. The majority of the world‟s
tantalum is sold via long-term offtake agreements. Analyst: Dr Trent Allen
Brazil and Australia were major producers of tantalum from 2005-2008 but the latter has ceased production. DRC illegal production complicates the market but the US Conflict Minerals Bill should remedy the problem.
Tantalum is used in
high-tech applications
such as capacitors
and alloys.

Resource Capital Research
Rare and Minor Metals Company Review, December Q 2010. Disclaimer and disclosure attached. Copyright© 2010 by Resource Capital Research Pty Ltd. All rights reserved. 27
Market Update: Tungsten
Investment Comment
Industry participants and commentators are bullish about the medium-
term outlook for tungsten. For example, Icon Resources (III:ASX)
recently stated: “The market price for [concentrates and APT] has
improved from mid-2009 returning to pre-GFC levels. Recent market
analysis has projected longer-term strength for tungsten, particularly for
non-Chinese supply beyond 2012, with supply shortages indicated from
2013.” Annual Report 2010.
These forecasts are based partly on concern about security of supply for
manufacturers, in view of China‟s policy of falling export quotas and high
tariffs (e.g. 20% on ferrotungsten), and its intent to boost
manufacturing. This scenario favours existing producers, and companies
with tungsten projects that can enter production within 2-3 years.
Pricing
Prices have recovered to pre-GFC levels, during which they had a
relatively soft landing due to simultaneous cuts in demand and
production. For mine modelling, RCR has used US$150/mtu contained
tungsten in 65% concentrate.
The current price of ferrotungsten in Europe at 75% W is US$385-
400/mtu (of contained W), APT to China (FOB) is US$297-302/mtu and
concentrate in China at 65% W is US$156-158/mtu (contained W).
These figures are typical of the value-add for increased tungsten
processing. Concentrate prices are up 56% year-on-year, 2009-2010,
and a healthy 19% quarter-on quarter.
Tungsten Industry Price Projections.
Source: Hazelwood Resources and CRU.
Companies with advanced tungsten developments could benefit from elevated prices, flowing from Chinese control (i.e. ~81%) over the current supply. Prices held steady during the GFC due to synchronous falls in supply and demand. Concentrate prices are up 56% Y-O-Y. The outlook to 2013 is positive, with further price increases predicted by most commentators. There is perceived to be upwards price risk due to pressure from China (decreasing export quotas and growing demand).

Resource Capital Research
Rare and Minor Metals Company Review, December Q 2010. Disclaimer and disclosure attached. Copyright© 2010 by Resource Capital Research Pty Ltd. All rights reserved. 28
Market: Supply and Demand
China is the metal's prime consumer. For example, global consumption
of tungsten in 2007 was 62.9kt, of which China accounted for 31.6%, or
19.8kt. Its consumption of the metal has more than doubled over the
last decade. From 1998 to end-2007, global consumption of tungsten
grew at 5.8% per annum, with the other significant tungsten consumers
being the U.S., Western Europe and Japan. Consumption fell below 60kt
in 2009 but is widely forecast to exceed 60kt in 2010, and approach
80kt in 2013 (e.g. CRU).
China dominated world tungsten production in 2009 (~81%).
China81%
Other6%
Russia4%
Canada3%
Austria2%
Bolivia2%
Portugal2%
Source: USGS.
Global tungsten metal production in 2008 was 55.9kt (USGS) and an
estimated 58kt in 2009 (an increase of ~3.8%). Of the 2009 estimate,
China accounted for 81%, producing 47kt. It was followed by Russia
(2.4kt), Canada (2kt) and Austria (1kt). The 2008-2009 increase was
accounted for by China (+3.5kt), while the rest of the world decreased
output by 1.4kt due to the Global Financial Crisis.
Elemental Facts
Tungsten is the hardest metal, and has a high density (19.25g/cc;
slightly less than gold, 19.3g/cc), melting point and tensile strength.
Tungsten is mined from or adjacent to igneous rocks (e.g. in skarns). It
has two economically important minerals: wolframite ((Fe,Mn)WO4) and
scheelite (CaWO4). The majority of the world‟s 2.8Mt economic reserves
are held by China (with 1.8Mt or 64%. Source :USGS).
Tungsten is primarily used in wear-resistant cemented carbides aka
hardmetals (56%) and steel/alloys (20%), as well as in lighting,
heating, and welding applications. Tungsten chemical compounds are
used in catalysts, inorganic pigments, and high-temperature lubricants.
Tungsten is sold in five common forms – APT (ammonium
paratungstate), ferrotungsten, tungsten concentrate (usually 65%
WO3), and tungsten carbide and oxides. Prices are quoted in $US or
RMB and the main units are mtu (metric tonne units, of 10kg WO3, ie
7.9kg W) and kilograms. It is usually sold on long-term contract.
Analyst: Dr Trent Allen
The world‟s largest consumer of tungsten is China, which used 31.6% of the 2007 total of 62.9kt. Global 2009 mine production was ~58kt, of which China accounted for ~81%. China increased production in the GFC, while the rest of the world cut back. The main application for tungsten is in „hardmetal‟, as tungsten carbide. In China, steel-making accounts for the highest % use. Ferrotungsten is used for steelmaking, while APT feeds into the cemented carbide and chemical stream.
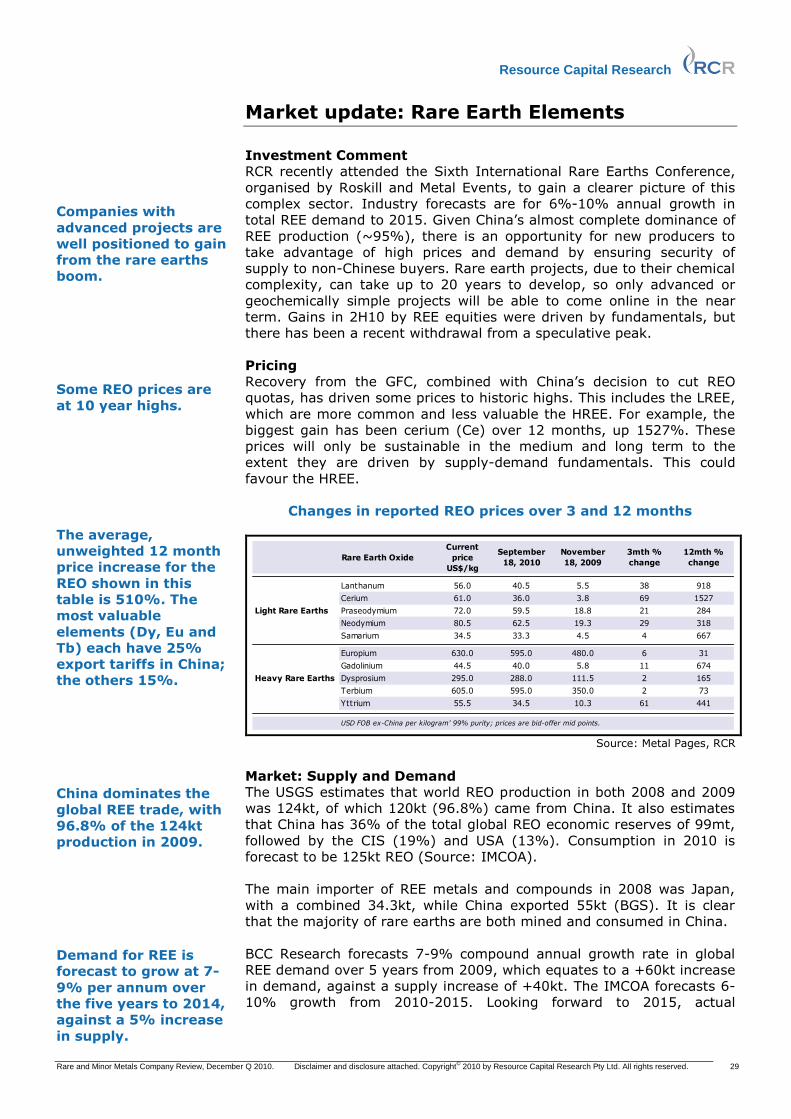
Resource Capital Research
Rare and Minor Metals Company Review, December Q 2010. Disclaimer and disclosure attached. Copyright© 2010 by Resource Capital Research Pty Ltd. All rights reserved. 29
Market update: Rare Earth Elements
Investment Comment
RCR recently attended the Sixth International Rare Earths Conference,
organised by Roskill and Metal Events, to gain a clearer picture of this
complex sector. Industry forecasts are for 6%-10% annual growth in
total REE demand to 2015. Given China‟s almost complete dominance of
REE production (~95%), there is an opportunity for new producers to
take advantage of high prices and demand by ensuring security of
supply to non-Chinese buyers. Rare earth projects, due to their chemical
complexity, can take up to 20 years to develop, so only advanced or
geochemically simple projects will be able to come online in the near
term. Gains in 2H10 by REE equities were driven by fundamentals, but
there has been a recent withdrawal from a speculative peak.
Pricing
Recovery from the GFC, combined with China‟s decision to cut REO
quotas, has driven some prices to historic highs. This includes the LREE,
which are more common and less valuable the HREE. For example, the
biggest gain has been cerium (Ce) over 12 months, up 1527%. These
prices will only be sustainable in the medium and long term to the
extent they are driven by supply-demand fundamentals. This could
favour the HREE.
Changes in reported REO prices over 3 and 12 months
Rare Earth Oxide
Current
price
US$/kg
September
18, 2010
November
18, 2009
3mth %
change
12mth %
change
Lanthanum 56.0 40.5 5.5 38 918
Cerium 61.0 36.0 3.8 69 1527
Praseodymium 72.0 59.5 18.8 21 284
Neodymium 80.5 62.5 19.3 29 318
Samarium 34.5 33.3 4.5 4 667
Europium 630.0 595.0 480.0 6 31
Gadolinium 44.5 40.0 5.8 11 674
Dysprosium 295.0 288.0 111.5 2 165
Terbium 605.0 595.0 350.0 2 73
Yttrium 55.5 34.5 10.3 61 441
Light Rare Earths
Heavy Rare Earths
USD FOB ex-China per kilogram' 99% purity; prices are bid-offer mid points.
Source: Metal Pages, RCR
Market: Supply and Demand
The USGS estimates that world REO production in both 2008 and 2009
was 124kt, of which 120kt (96.8%) came from China. It also estimates
that China has 36% of the total global REO economic reserves of 99mt,
followed by the CIS (19%) and USA (13%). Consumption in 2010 is
forecast to be 125kt REO (Source: IMCOA).
The main importer of REE metals and compounds in 2008 was Japan,
with a combined 34.3kt, while China exported 55kt (BGS). It is clear
that the majority of rare earths are both mined and consumed in China.
BCC Research forecasts 7-9% compound annual growth rate in global
REE demand over 5 years from 2009, which equates to a +60kt increase
in demand, against a supply increase of +40kt. The IMCOA forecasts 6-
10% growth from 2010-2015. Looking forward to 2015, actual
Companies with
advanced projects are
well positioned to gain
from the rare earths
boom.
Some REO prices are
at 10 year highs.
The average,
unweighted 12 month
price increase for the
REO shown in this
table is 510%. The
most valuable
elements (Dy, Eu and
Tb) each have 25%
export tariffs in China;
the others 15%.
China dominates the
global REE trade, with
96.8% of the 124kt
production in 2009.
Demand for REE is
forecast to grow at 7-
9% per annum over
the five years to 2014,
against a 5% increase
in supply.

Resource Capital Research
Rare and Minor Metals Company Review, December Q 2010. Disclaimer and disclosure attached. Copyright© 2010 by Resource Capital Research Pty Ltd. All rights reserved. 30
consumption is forecast to be 180-185kt TREO (total rare earth oxides)
by both BCC and the IMCOA. However, more than this will need to be
produced, as the mined REO ratios do not match the spectrum of
demand, creating pinch points for some elements (e.g. dysprosium for
magnets) and excess of others (e.g. the more common cerium).
Accordingly, it is forecast that supply will have to be in the range of 200-
210kt REO. Recently (August 2010) the China Society of Rare Earths
stated China could supply 160-170kt REO in 2015; sufficient for its own
needs (120kt) plus some exports, but 30-50kt short of global demand.
Rare earths, forecast supply and demand curves
Source: IMCOA, Roskill
China‟s REO export quota for 2H10 was 7,976t, a 64.2% decrease from
the 22,282t REO allocated in 1H10 to both Chinese and foreign-owned
companies and a 72% drop from the 28,417t allocated in 2H09. This
brought the export quota for 2010 down to 30,258t REO, -40% from the
2009 quota (Metal Pages, July 2010). China‟s reasoning is that it wants
to conserve REE resources and add value to them in China. It is also
seeking to reduce the inefficiency, environmental damage and REE
smuggling that are a consequence of having numerous small-scale
unregulated producers (e.g. the REE clay mines of southern China).
In Sep-Oct ‟10 there were reports that REE exports from China to Japan
had ceased, and that China was using its dominant market position to
gain leverage in political disputes. This drove a speculative surge in
share prices for many REE stocks, which has since cooled due to
reassurances from China and a US Dept. of Defence (DOD) report that
China‟s monopoly poses no threat to US national security.
Elemental Facts
The rare earth elements (REE) are the 15 lanthanoid elements (atomic
numbers 57 to 71). They are divided into the light rare earths (LREE,
lanthanum to samarium) and heavy rare earths (HREE, europium to
lutetium). Many deposits are related to alkaline igneous rocks or
weathered materials such as laterites. REE are used in high growth
sectors: energy, electronics and technology, and the environment, e.g.
they are a component in some rechargeable batteries and the magnets
in electric motors. REE are also used as phosphors in energy-efficient
light globes, and in the screens of LCD displays. In 2010, according to
the IMCOA, uses of REO (rare earth oxides) will include magnets (21%),
catalysts (20%), alloys (18%), polishing (15%) and glass (9%). Analyst: Dr Trent Allen
This could create
severe undersupply of
some elements,
especially the scarce
middle and heavy rare
earths.
This graph shows the
looming supply issues
for the REE market.
Demand growth must
be met by production
outside China.
China has dramatically
cut export quotas for
2H10 …
… which led to a jump
in equity prices,
though the market has
recently cooled.
The main REE minerals
are bastnäsite and
monazite
REE have numerous
high growth
applications.
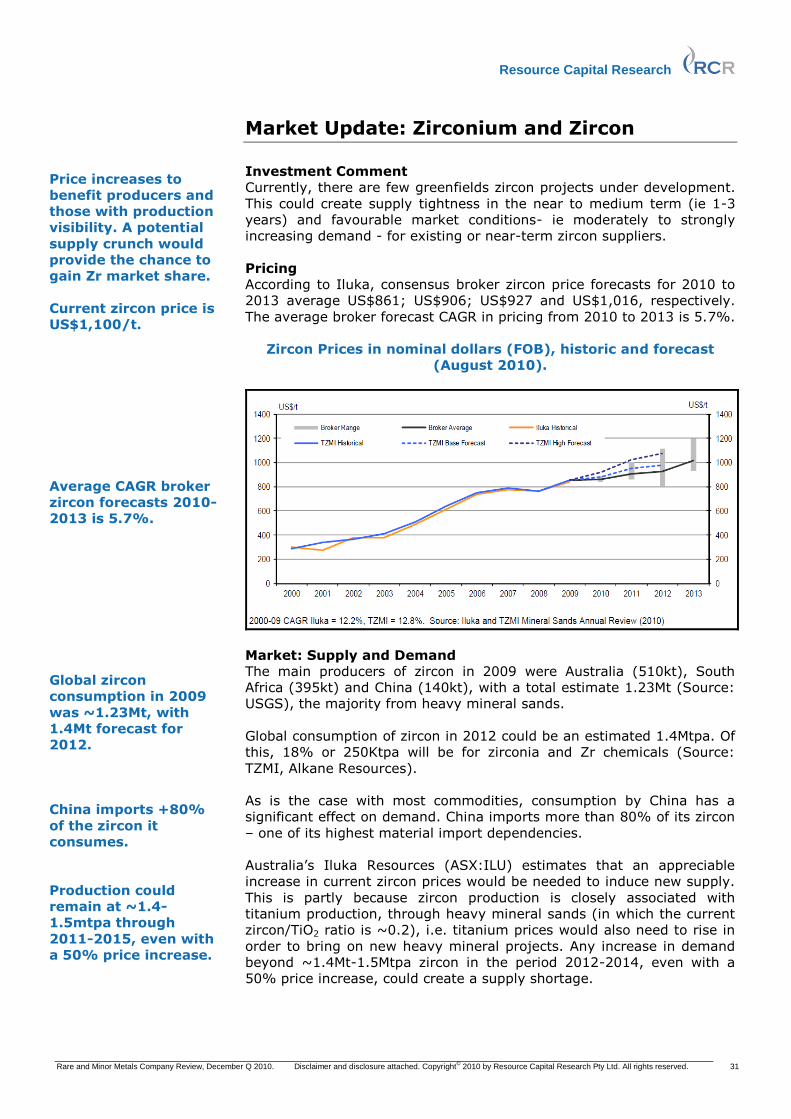
Resource Capital Research
Rare and Minor Metals Company Review, December Q 2010. Disclaimer and disclosure attached. Copyright© 2010 by Resource Capital Research Pty Ltd. All rights reserved. 31
Market Update: Zirconium and Zircon
Investment Comment
Currently, there are few greenfields zircon projects under development.
This could create supply tightness in the near to medium term (ie 1-3
years) and favourable market conditions- ie moderately to strongly
increasing demand - for existing or near-term zircon suppliers.
Pricing
According to Iluka, consensus broker zircon price forecasts for 2010 to
2013 average US$861; US$906; US$927 and US$1,016, respectively.
The average broker forecast CAGR in pricing from 2010 to 2013 is 5.7%.
Zircon Prices in nominal dollars (FOB), historic and forecast
(August 2010).
Market: Supply and Demand
The main producers of zircon in 2009 were Australia (510kt), South
Africa (395kt) and China (140kt), with a total estimate 1.23Mt (Source:
USGS), the majority from heavy mineral sands.
Global consumption of zircon in 2012 could be an estimated 1.4Mtpa. Of
this, 18% or 250Ktpa will be for zirconia and Zr chemicals (Source:
TZMI, Alkane Resources).
As is the case with most commodities, consumption by China has a
significant effect on demand. China imports more than 80% of its zircon
– one of its highest material import dependencies.
Australia‟s Iluka Resources (ASX:ILU) estimates that an appreciable
increase in current zircon prices would be needed to induce new supply.
This is partly because zircon production is closely associated with
titanium production, through heavy mineral sands (in which the current
zircon/TiO2 ratio is ~0.2), i.e. titanium prices would also need to rise in
order to bring on new heavy mineral projects. Any increase in demand
beyond ~1.4Mt-1.5Mtpa zircon in the period 2012-2014, even with a
50% price increase, could create a supply shortage.
Price increases to
benefit producers and
those with production
visibility. A potential
supply crunch would
provide the chance to
gain Zr market share.
Current zircon price is
US$1,100/t.
Average CAGR broker
zircon forecasts 2010-
2013 is 5.7%.
Global zircon
consumption in 2009
was ~1.23Mt, with
1.4Mt forecast for
2012.
China imports +80%
of the zircon it
consumes.
Production could
remain at ~1.4-
1.5mtpa through
2011-2015, even with
a 50% price increase.
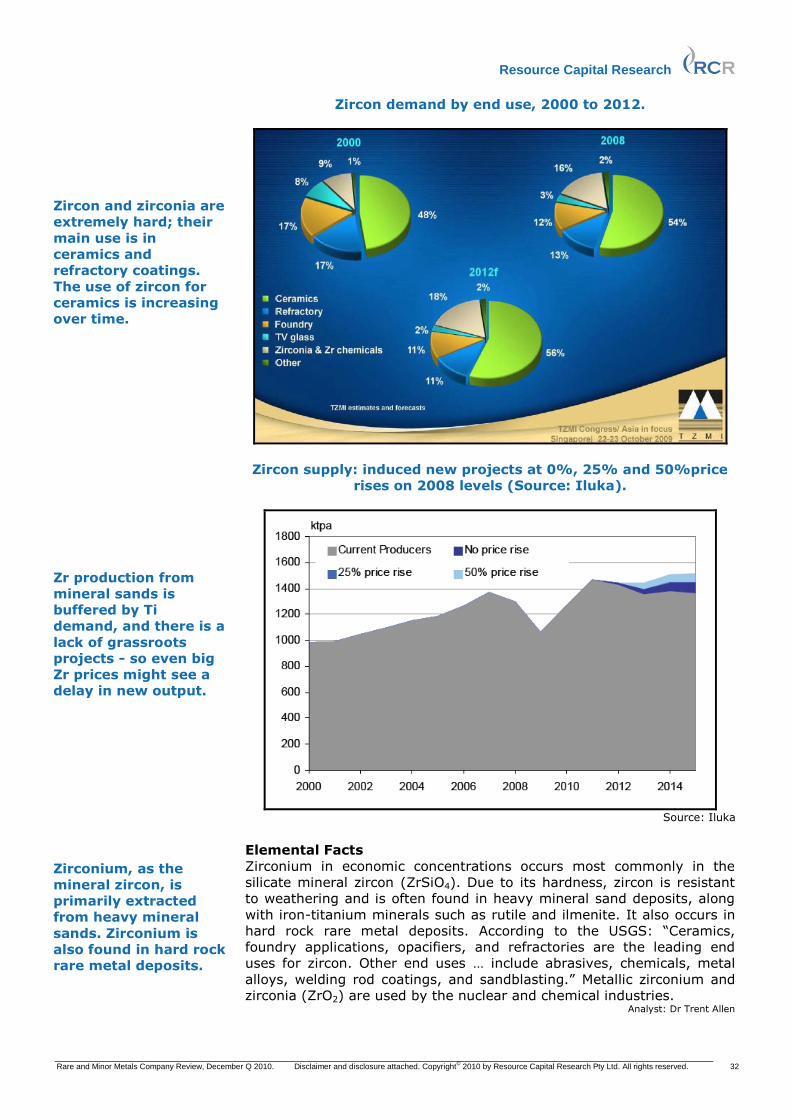
Resource Capital Research
Rare and Minor Metals Company Review, December Q 2010. Disclaimer and disclosure attached. Copyright© 2010 by Resource Capital Research Pty Ltd. All rights reserved. 32
Zircon demand by end use, 2000 to 2012.
Zircon supply: induced new projects at 0%, 25% and 50%price
rises on 2008 levels (Source: Iluka).
Source: Iluka
Elemental Facts
Zirconium in economic concentrations occurs most commonly in the
silicate mineral zircon (ZrSiO4). Due to its hardness, zircon is resistant
to weathering and is often found in heavy mineral sand deposits, along
with iron-titanium minerals such as rutile and ilmenite. It also occurs in
hard rock rare metal deposits. According to the USGS: “Ceramics,
foundry applications, opacifiers, and refractories are the leading end
uses for zircon. Other end uses … include abrasives, chemicals, metal
alloys, welding rod coatings, and sandblasting.” Metallic zirconium and
zirconia (ZrO2) are used by the nuclear and chemical industries. Analyst: Dr Trent Allen
Zircon and zirconia are
extremely hard; their
main use is in
ceramics and
refractory coatings.
The use of zircon for
ceramics is increasing
over time.
Zr production from
mineral sands is
buffered by Ti
demand, and there is a
lack of grassroots
projects - so even big
Zr prices might see a
delay in new output.
Zirconium, as the
mineral zircon, is
primarily extracted
from heavy mineral
sands. Zirconium is
also found in hard rock
rare metal deposits.
Resource Capital Research
Rare and Minor Metals Company Review, December Q 2010. Disclaimer and disclosure attached. Copyright© 2010 by Resource Capital Research Pty Ltd. All rights reserved. 33
Report Contributors Trent Allen: Trent has a BSc (Hons) and a PhD from the University of Sydney, specialising in the
petrology, trace-element geochemistry and economic geology of alkaline igneous rocks. His
Australian mining industry experience includes several years with Newcrest‟s Cadia Valley
gold/copper mines, where he was engaged in resource definition and geotechnical engineering.
Trent has also worked as an exploration consultant, university lecturer in geology and civil
engineering, and as a journalist and newspaper editor.
Tony Parry: Tony has extensive experience in metallurgical process development, (working with MIM
Limited for five years) and in mining equity research, equity sales and mining corporate finance
(working in London for five years and subsequently Perth). He was a founding Director and CEO of
an ASX listed exploration company and has been engaged extensively as a strategic planning
consultant to many small-medium enterprises. Tony‟s qualifications include a BSc (Hons) in
Metallurgy and a PhD in Metallurgy from the University of NSW.
John Wilson: John has a background in mining, finance and equity research. He worked on Wall
Street for 6 years and has covered US, Australian and Latin American mining stocks. He has also
worked with BHP in their minerals division. Qualifications include an MBA from the Wharton School
of the University of Pennsylvania and a Bachelor of Engineering from the University of Sydney.

Resource Capital Research
Rare and Minor Metals Company Review, December Q 2010. Disclaimer and disclosure attached. Copyright© 2010 by Resource Capital Research Pty Ltd. All rights reserved. 34
Disclosure and Disclaimer
Resource Capital Research ACN 111 622 489 www.rcresearch.com.au
Suite 1306
183 Kent Street Sydney, NSW 2000
Tel: +612 9252 9405
Fax: +612 9251 2859 Email: [email protected]
Disclosure and Disclaimer Important Information
Resource Capital Research Pty Limited (referred to as “we”, “our”, or “RCR” herein) ACN 111 622 489 holds an Australian Financial Services Licence (AFS Licence number 325340). General advice is provided by RCR‟s Authorised Representatives Dr Tony Parry (Authorised Representative number 328842) and Dr Trent Allen (Authorised Representative number 331960). The FSG is available at www.rcresearch.com.au. All references to currency are in Australian dollars unless otherwise noted.
This report and its contents are intended to be used or viewed only by persons resident and located in the United States, Canada and Australia, and therein only where RCR‟s services and products may lawfully be offered. The information provided in this report is not intended for distribution to, or use by, any person or entity in any jurisdiction or country where such distribution or use would be contrary to law or regulation or which would subject RCR or its affiliates to any registration requirement within such jurisdiction or country.
This report and its contents are not intended to constitute a solicitation for the purchase of securities or an offer of securities. The information provided in this report has been prepared without taking account of your particular objectives, financial situation or needs. You should, before acting on the information provided in this report, consider the appropriateness of the purchase or sale of the securities of the companies that are the subject of this report having regard to these matters and, if appropriate, seek professional financial, investment and taxation advice. RCR does not guarantee the performance of any investment discussed or recommended in this report. Any information in this report relating to the distribution history or performance history of the securities of the companies that are the subject of this report, should not be taken as an indication of the future value or performance of the relevant securities.
In preparing this report, RCR analysts have relied upon certain information provided by management of the companies that are the subject of this report or otherwise made publicly available by such companies. The information presented and opinions expressed herein are given as of the date hereof and are subject to change. We hereby disclaim any obligation to advise you of any change after the date hereof in any matter set forth in this report. THE INFORMATION PRESENTED, WHILE OBTAINED FROM SOURCES WE BELIEVE RELIABLE, IS CHECKED BUT NOT GUARANTEED AGAINST ERRORS OR OMISSIONS AND WE MAKE NO WARRANTY OR REPRESENTATION, EXPRESSED OR IMPLIED, AND DISCLAIM AND NEGATE ALL OTHER WARRANTIES OR LIABILITY CONCERNING THE ACCURACY, COMPLETENESS OR RELIABILITY OF, OR ANY FAILURE TO UPDATE, ANY CONTENT OR INFORMATION HEREIN.
This report and the information filed on which it is based may include estimates and projections which constitute forward looking statements that express an expectation or belief as to future events, results or returns. No guarantee of future events, results or returns is given or implied by RCR. Estimates and projections contained herein, whether or not our own, are based on assumptions that we believe to be reasonable at the time of publication, however, such forward-looking statements are subject to risks, uncertainties and other factors which could cause actual results to differ materially from the estimates and projections provided to RCR or contained within this report.
This report may, from time to time, contain information or material obtained from outside sources with the permission of the original author or links to web sites or references to products, services or publications other than those of RCR. The use or inclusion of such information, material, links or references does not imply our endorsement or approval thereof, nor do we warrant, in any manner, the accuracy of completeness of any information presented therein.
RCR, its affiliates and their respective officers, directors and employees may hold positions in the securities of the companies featured in this report and may purchase and/or sell them from time to time and RCR and its affiliates may also from time to time perform investment banking or other services for, or solicit investment banking or other business from, entities mentioned in this report. Arafura Resources Ltd, Galaxy Resources Ltd, Globe Metals & Mining Ltd, Greenland Minerals and Energy Ltd and Gunson Resources Ltd commissioned RCR to compile their company reviews in this report, while Crossland Uranium Mines Ltd commissioned a report in the September Quarter 2010 Uranium Sector Review. In consideration, RCR received from each a cash consultancy fee of less than $15,000. RCR may receive referral fees from issuing companies or their advisors in respect of investors that RCR refers to companies looking to raise capital. Those fees vary, but are generally between 0 - 1% of the value of capital raised from referrals made by RCR. RCR received referral fees in relation to recent capital raisings for Globe Uranium Limited, PepinNini Minerals Limited and Uranex NL and may receive fees in relation to Adamus Resources and Eleckra Mines. At the date of this report, neither RCR, nor any of its associates, hold any interests or entitlements in shares mentioned in this report with the exception that either or both of John Wilson (either directly or through Resource Capital Investments Pty Limited (RCI)), or RCI, as trustee of the Resource Capital Investments Fund owns shares in BHP, Rio Tinto, Greenland Minerals and Energy Ltd, and Gunson Resources Ltd.
Analyst Certification: All observations, conclusions and opinions expressed in this report reflect the personal views of RCR analysts and no part of the analyst‟s or RCR‟s compensation was, is, or will be, directly or indirectly related to specific recommendations or views expressed in the report. Officers, directors, consultants, employees and independent contractors of RCR are prohibited from trading in the securities of U.S. companies that are, or are expected to be, the subject of research reports or other investment advice transmitted to RCR clients for a blackout window of 14 days extending before and after the date such report is transmitted to clients or released to the market.
Cautionary Note to U.S. Investors Concerning Estimates of Measured, Indicated and Inferred Resources: RCR publishes mineral resources based on
standards recognized and required under securities legislation where listed mining and exploration companies make their exchange filings and uses the terms “measured", "indicated" and "inferred" mineral resources. U.S. investors are advised that while such terms are recognized and required under foreign securities legislation, the SEC allows disclosure only of mineral deposits that can be economically and legally extracted. United States investors are cautioned not to assume that all or any part of measured, indicated or inferred resources can be converted into reserves or economically or legally mined. We recommend that US investors consult Securities and Exchange Commission Industry Guide 7 – “Description of Property by Issuers Engaged or to Be Engaged in Significant Mining Operations” for further information about the use of defined terms and the presentation of information included in this report.
Resource Capital Research Suite 1306 183 Kent Street Sydney, NSW 2000
T: +612 9252 9405 F: +612 9251 2859 E: [email protected]
ACN 111 622 489
www.rcresearch.com.au