rapidly growing international staffing company investor ... 360 investor... · •management team...
TRANSCRIPT

Investor PresentationMay 2018
NASDAQ: STAF
Rapidly growing international staffing company
NASDAQ: STAF
FORWARD-LOOKING STATEMENTS
Forward-Looking Statements
This presentation contains forward-looking statements within the meaning of Section 27A of the Securities Act of 1933 and
Section 21E of the Securities Exchange Act of 1934, including statements regarding the business of the Company and its
industry generally, business strategy and prospects. These statements are based on the Company’s estimates, projections,
beliefs and assumptions and are not guarantees of future performance. These forward-looking statements are subject to
various risks and uncertainties, which may cause actual results to differ materially from the forward-looking statements. The
Company disclaims any obligation to update these forward-looking statements except as required by law.
Non-GAAP Financial Measures
The Company uses financial measures which are not calculated and presented in accordance with US generally accepted
accounting principles (“GAAP”) in evaluating its financial and operational decision making regarding potential acquisitions and
presenting the operating and financial performance of the Company, as well as a means to evaluate period-to period
comparison. The Company presents these non-GAAP financial measures because it believes them to be an important
supplemental measure of performance that is commonly used by securities analysts, investors and other interested parties in
the evaluation of companies in our industry. We refer you to the reconciliations in this presentation and applicable earnings
releases issued by the Company for those respective periods. The Company defines Adjusted EBITDA as earnings (or loss) from
continuing operations before interest expense, income taxes, depreciation and amortization, and amortization of non-cash
stock-based compensation, non-recurring acquisition and restructuring expenses and goodwill impairment charges.
2

NASDAQ: STAF
• Staffing solution company executing an international buy-and-build strategy in the US and UK
o 8 acquisitions completed since 2013
• Primary focus:
o Temporary staffing - representing ~ 90% of total revenue
o Permanent placements - representing ~ 10% of total revenue
COMPANY & INDUSTRY OVERVIEW
$429B global market growing 6% annually
~100,000 staffing companies globally
~15,000 US companies <$20M in revenue
3
NASDAQ:
Headquarters:
Employees:
Customers:
STAF
New York, US
~ 5,000 temporary ~ 300 internal
~1,500
• Consolidation model: three segments
o Commercial Staffing (US): commercial staffing solutions
o Professional Staffing (US): accounting / finance, information technology, engineering, and administration
staffing solutions
o Professional Staffing (UK): accounting / finance, information technology, engineering, and administration
staffing solutions

NASDAQ: STAF
• International footprint and disciplined M&A strategyo Highly fragmented market provides acquisition opportunities and
ability to scaleo High client retention and strong recurring revenue
• Impressive revenue growth:
INVESTMENT HIGHLIGHTS
• 2018 March pro-forma trailing twelve months (TTM) assumes that acquisitions of CBSbutler and firstPRO
had closed on January 1, 2017. 4
US: 17 offices in 8 States
2013March Pro Forma TTM*
2018 2019 goal
Nearly $0 $240M $500M
• Recent business realignment designed to drive focus,
organic growth and profitability
• Strengthened and streamlined financial positiono Closed largest capital raise, through a $40M senior noteo Renegotiated existing $25M accounts receivable facility in the USo Renegotiated existing £11.5M ($16M) facility limit in the UK
UK: 2 London offices
• Management team with significant operational and M&A
experience

NASDAQ: STAF
BUSINESS UNITS
Focused on United States and United Kingdom: • Well developed temporary staffing markets
• Flexible labor laws
• Culturally aligned
• Allows management time to be optimized - leading to better performance
and returns
• Expects to focus principally on US targets going forward
ACQUISITIONS: Verticals / Location / Year
Commercial
Engineering
Administration
Accounting & Finance
Information Technology
Information Technology
Accounting & Finance
Information Technology
Engineering Engineering
Administration
Accounting & Finance
Information Technology
Accounting & Finance
Information Technology
US US UK UK US UK US
2014 * 2014 2014** 2015 2015 2017 2017
Pro Forma * Revenue Split by Location (2017)
66%
34%
US UK
* The 2017 pro-forma assumes that acquisitions of CBSbutler and firstPRO had closed on January 1, 2017. 5
(*- includes acquisition of CSI) (** - includes acquisition of Poolia)

NASDAQ: STAF
REALIGNMENT OF ORGANIZATIONAL STRUCTURE
United States
Commercial Staffing Professional Staffing
United Kingdom
Professional Staffing
New corporate structure to enhance customer focus, drive revenue growth, maximize efficiencies, and support accountability and ownership
40%
60%
Commercial
Professional
Pro Forma * Revenue Split by Segment (2017)
* The 2017 pro-forma assumes that acquisitions of CBSbutler and firstPRO had closed on January 1, 2017. 6

NASDAQ: STAF
BUSINESS MODEL
Strategically focused on five strategic verticals that represent sub-segments of the staffing industry
FIVE STRATEGIC PILLARS
7
Acc
ou
nti
ng
&
Fin
ance
Info
rmat
ion
Te
chn
olo
gy
Engi
ne
eri
ng
Ad
min
istr
atio
n
Co
mm
erc
ialPROFESSIONAL & COMMERCIAL

NASDAQ: STAF
• Build a profitable, international staffing firm with revenues
in excess of $500M
• Execute disciplined acquisition strategy, supplemented by
strong organic growth
• Use “Intelligent Integration” approach to maximize value,
mitigate attrition and increase support of sales teams
• Capitalize on highly experienced executive management
team
• Drive shareholder value
STRATEGIC GOALS
… through a disciplined acquisition strategy
8

NASDAQ: STAF
• Robust pipeline of highly selective targets
• Must fit within at least one of five strategic pillars
• Must be accretive, no turn-arounds
o Sustainable margins
o Recurring revenues
o Quality customers
o Reliable employees
• Objective: 95% temporary / 5% permanent revenue mix (80% / 20% gross profit mix)
• Sellers receive cash, stock, notes plus performance-based incentives
DISCIPLINED ACQUISITION CRITERIA
Acc
ou
nti
ng
&
Fin
ance
Info
rmat
ion
Te
chn
olo
gy
Engi
ne
eri
ng
Ad
min
istr
atio
n
Co
mm
erc
ial
… positioned to take advantage of market opportunities
9

NASDAQ: STAF
• Shift toward more temporary workers is expected to be
a permanent change to jobs market
• Structural change largely driven by demand for IT
• US staffing market grew 5% CAGR during 2013-2016 vs.
GDP CAGR of 2.2%*
• US staffing market expected to grow to $147 billion by
2018*
US Professional Staffing Industry Revenue
Commercial vs. Professional Staffing Trend
* Source: Global Staffing Industry Market Estimates and Forecast, October 2017 Update (Staffing Industry Analysts)
STAFFING EMPLOYMENT TRENDS: UNITED STATES
Shift Toward Higher Margin & Scalable Segments: Professional & Temporary Staffing
10
$49 $54 $56 $60 $64
$74
2011 2012 2013 2014 2015 2016
(Dollars in Billions)
64%
36%
1995: Industry Revenue$55 Billion
Commercial Professional
45% 55%
2016: Industry Revenue$134 Billion
Commercial Professional

NASDAQ: STAF
In 2017, the Company changed its fiscal year end to December. All periods shown are for 12 months.
HISTORICAL FINANCIAL PERFORMANCE
11
The 2018 pro-forma TTM assumes that acquisitions of CBSbutler and firstPRO had closed on January 1, 2017.
Revenue, Gross Profit & Gross Margin($ Millions)
Adjusted EBITDA & EBITDA Margin($ Millions)
$(2.7)
$0.8
$4.1
$2.7
$5.1
$7.4$8.0
$10.3
1.9%
2.8%
3.8% 3.8%
4.3%
-2
-1
0
1
2
3
4
5
$(3.0)
$(1.0)
$1.0
$3.0
$5.0
$7.0
$9.0
$11.0
May2014
May2015
May2016
Dec2015
Dec2016
Dec2017
TTMMar2018
PF TTMMar2018
Adjusted EBITDA EBITDA Margin
$41.2
$128.8
$165.6
$144.4
$181.5$192.7
$207.8
$239.9
$9.1
$22.5
$29.0$25.3
$31.5
$36.7$41.0
$49.2
$0
$10
$20
$30
$40
$50
$60
$70
$80
$0
$50
$100
$150
$200
$250
$300
May2014
May2015
May2016
Dec2015
Dec2016
Dec2017
TTMMar2018
PF TTMMar2018
Revenue Gross Profit
17.5%
17.4%
19.1%19.7%
20.5%%
%
%
%
%
%
%
%
NASDAQ: STAF
12
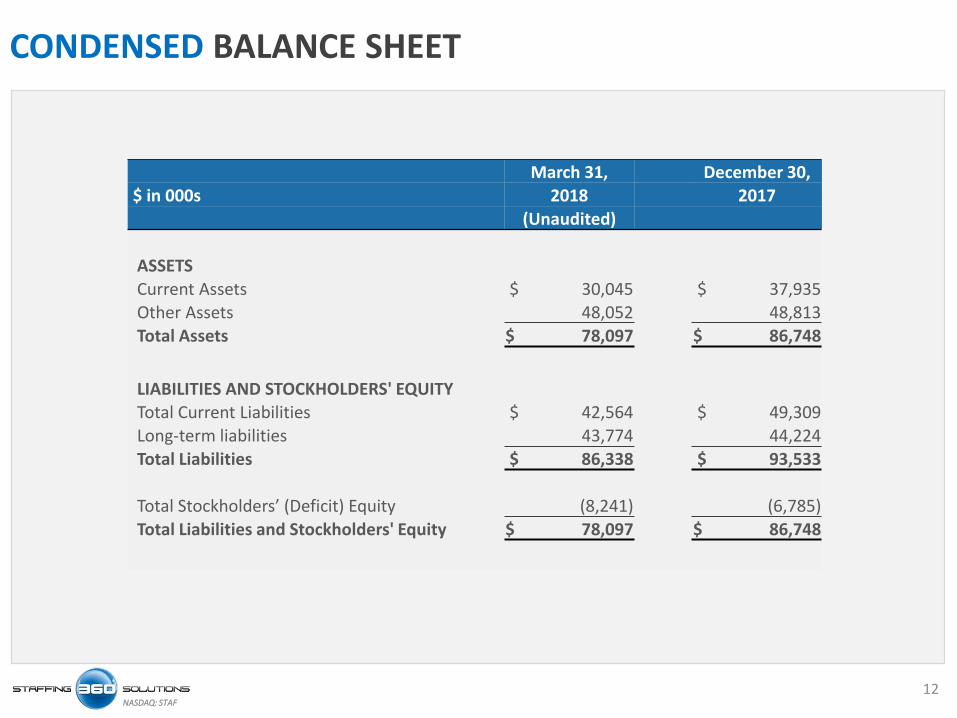
CONDENSED BALANCE SHEET
March 31, December 30,
$ in 000s 2018 2017
(Unaudited)
ASSETS
Current Assets $ 30,045 $ 37,935Other Assets 48,052 48,813
Total Assets $ 78,097 $ 86,748
LIABILITIES AND STOCKHOLDERS' EQUITYTotal Current Liabilities $ 42,564 $ 49,309Long-term liabilities 43,774 44,224
Total Liabilities $ 86,338 $ 93,533
Total Stockholders’ (Deficit) Equity (8,241) (6,785)
Total Liabilities and Stockholders' Equity $ 78,097 $ 86,748

NASDAQ: STAF
For additional information and transactions that may have occurred subsequent to the balance sheet date, please see Staffing 360 Solutions’ filing with the SEC.
13
CAPITALIZATION TABLE
$ in 000’s March 31, 2018
Accounts Receivable Based Facilities $16,269
Term Loans 40,000
Total Debt $56,269
Series A Preferred Stock 1,663,008
Stock Options 125,400
Warrants (Weighted Average Strike Price of $5.03) 925,934
Restricted shares 475,759
Common Stock 4,058,285

NASDAQ: STAF
EXECUTIVE MANAGEMENT TEAM
• Extensive financial, M&A and turn-around experience over a 30-year career.
• Former CFO of the Americas for Monster Worldwide Inc., (Nasdaq: MWW), in addition to leading the 2003 IPO of Hudson Global Inc. (Nasdaq: HSON).
14
Brendan FloodChairman & ChiefExecutive Officer
• Over 20 years of financial experience at both private and public companies, including Vice President of Financial Planning and Chief Accounting Officer of Novitex Enterprise Solutions and Acting CFO at Cengage Learning, Inc. (formerly Thomson Learning of Thomson Reuters).
• Certified Public Accountant who began his career at PricewaterhouseCoopers LLP.
David FaimanChief Financial Officer
• 25 years in practice, most recently corporate governance and M&A for GE Capital and CA Technologies via Axiom Global.
• Assistant General Counsel at Smith & Wesson and Senior Legal Counsel at Presstek, Inc.
Christopher LutzoGeneral Counsel
• Over 20 years of operational management, sales, and recruiting experience in the staffing and customer service industries of Monroe Staffing. In addition to creating solutions for clients, Paul oversees the professional development, Corporate Safety, and employee-directed giving programs.
Paul PolitoPresident, Commercial Staffing
• Over 20 years in the staffing industry including experience in Senior Leadership roles, M&A, Change Management & business integration space.
• Former Group COO and Executive Board member of Kellan Group Plc, an AIM listed multi-sector professional staffing business.
Mark DarbyPresident, Professional Staffing (UK)

NASDAQ: STAF
Committed to driving growth, profits and shareholder value
• Highly focused M&A STRATEGY – with 8 acquisitions completed to date
• Grew from nearly zero revenue in 2013 to approx. $240M in annualized revenue through March
2018*; goal of GROWING TO $500M within the next two years
• Recent business segment REALIGNMENT TO DRIVE PROFITABILITY and organic growth
• STRONGER BALANCE SHEET positions the company well to take advantage of opportunities of a
fragmented staffing market
• Led by a MANAGEMENT TEAM with significant operational and M&A experience
KEY TAKEAWAYS
• 2018 March pro-forma trailing twelve months (TTM) reflected here assumes that acquisitions of CBSbutler
and firstPRO had closed on January 1, 2017. 15

NASDAQ: STAF
Staffing 360 Solutions, Inc.
Brendan FloodChairman & [email protected]
David FaimanChief Financial [email protected]
Investor Relations:The Equity Group, Inc.
Lena [email protected] / (212) 836-9611
Devin [email protected] / (212) 836-9608
CONTACT US
16
Headquarters:641 Lexington Ave, Suite 2701New York, NY 10022646-507-5710
UK Office:3rd floor3 London Wall BuildingsLondon Wall, London EC2M 5SY+44 (0) 207 464 1550

NASDAQ: STAF
December 31, 2017 to January 1, 2017 to TTM Period Ended January 1, 2017 to January 2, 2016 to
March 31, 2018 April 1, 2017 March 31, 2018 December 30, 2017 December 31, 2016
(Unaudited) (Unaudited) (Unaudited) (Unaudited) (Unaudited)
$000s
Revenue $55,791 $40,712 $207,729 $192,650 $181,487
Gross Profit $11,581 $7,326 $40,996 $36,741 $31,562
Gross Margin 20.8% 18.0% 19.7% 19.1% 17.4%
Loss from Operations ($405) ($557) ($5,062) ($5,214) ($2,816)
Net Loss ($1,271) ($3,081) ($16,681) ($18,491) ($7,580)
Adjustments:
Interest Expense $1,955 $502 $5,198 $3,745 $2,554
Provision for Income Taxes 152 5 1,079 932 42
Depreciation and Amortization 920 1,319 5,912 6,311 5,302
EBITDA 1,756 (1,255) (4,492) (7,503) 318
Acquisition, Capital Raising and Other
Non-Recurring Expenses 847 531 2,455 2,139 4,290
Other Non-Cash Charges 373 294 1,409 1,330 781
Debt Extinguishment Costs - 1,368 4,764 6,132 -
Restructuring Charges - - 780 780 19
Impairment of Goodwill - - 4,790 4,790 -
Change in fair value of warrant liability (538) 92 (630) -
Gain on intercompany note (575) - (575) - -
Other (Income) Expense (250) (2) (525) (277) (334)
Adjusted EBITDA $1,613 $1,028 $7,976 $7,391 $5,074
Adjusted EBITDA Margin 2.9% 2.5% 3.8% 3.8% 2.8%
TTM Adjusted EBITDA $7,976 $5,390 $7,976 $7,391 $5,074
Pro Forma TTM Adjusted EBITDA $10,340 N/A $10,340 $10,848 N/A
APPENDIX
17

Investor PresentationMay 2018
NASDAQ: STAF
Rapidly growing international staffing company