rapid soft spot analysis using the sciex routine ... notes/rapid-soft-spot-analysis... · rapid...
TRANSCRIPT

p 1
Rapid Soft Spot Analysis using the SCIEX Routine
Biotransform Solution
Rapidly Identify Top Metabolites with the SCIEX X500R QTOF System and MetabolitePilotTM 2.0 Software
Shaokun Pang and Ian Moore SCIEX, 71 Four Valley Dr. Concord, ON, Canada Key Challenges in Soft Spot Analysis and
Metabolite ID
• Increasing productivity in early drug discovery with a
higher-throughput soft spot identification assay
• Maintaining data quality for both qualitative and
quantitative analysis in a high-throughput
environment
• Extensive manual data interpretation to assign
structures and identify soft spots
Key Features of the X500R QTOF System for Soft
Spot Analysis
• Compact benchtop system featuring easy-to-use
SCIEX OS for control and acquisition which enables
quick setup and data acquisition even for non-mass
spec experts
• Robustness with the renowned Turbo VTM
source
• Independent calibrant delivery path for high accuracy and reliability in results even across large sample batches
• Intelligent and flexible data acquisition strategies featuring: SWATH® Acquisition for data independent acquisition (DIA) and real-time multiple mass-defect filtering (MDF) for information-dependent acquisition (IDA)
• Speed and Resolution – Ultra-high pressure liquid chromatography (UHPLC) with its narrower chromatographic peaks (~5 sec) are becoming standard in drug discovery and development labs. The X500R can keep up with UHPLC by collecting up to 100 MS/MS scans per second without compromising resolution
• Robust mass accuracy - Six heater drones throughout the TOF path maintain mass stability through longer runs
Key Features of MetabolitePilotTM 2.0 Software for Soft Spot Analysis
• Automatic structure proposals of metabolites are generated and presented with relative evidence for quick, easy review and confirmation
• Multiple peak finding strategies utilizing MS and MS/MS for both targeted and untargeted identification of drug related metabolites
• Advanced peak finding algorithms optimized for SCIEX accurate mass platforms and integrated MS/MS fragment interpretation and structural assignment tools
• High throughput batch processing (up to 200 rows) plus the ability to import batches from a spreadsheet and create processing methods on the fly
• Multiple sample correlation function for time course studies and inter-species comparison of metabolites
The SCIEX Routine Biotransform Solution featuring the X500R QTOF System and ExionLC
TM with MetabolitePilot
TM 2.0 software.

p 2
Introduction
Liver microsome studies are used to model hepatic
oxidative metabolism in vivo. In early discovery,
compounds susceptible to rapid clearance are typically
avoided. Rational drug design can overcome the issue of
rapid clearance and extend the therapeutic concentration
of a drug. Structural information about the sites or ‘soft
spots’ of oxidative metabolism is required to establish
structure-metabolism relationships and guide medicinal
chemistry efforts to overcome instability. For scientists
working in this area, increasing sample throughput and
minimizing the time spent on data processing and
structural interpretation are important to accelerate early
drug discovery.
In this tech note we employ the Routine Biotransform
Solution featuring the X500R QTOF System with
MetabolitePilotTM
2.0 software to study the oxidative
metabolism of four model compounds. Data was acquired
with both data dependent and data independent strategies
and to increase sample throughput a short 50 mm column
and a 5 minute gradient were used. Generic and predicted
metabolite peak finding strategies were used in
MetabolitePilot software and the automatic structure
proposal feature was used to speed data review.
Experimental
Haloperidol, buspirone, midazolam and verapamil
reference standard solutions (1 mg/mL) were purchased
from Sigma-Aldrich. Rat liver microsomes (RLM) and
Rapid Start NADPH regenerating system were purchased
from Xenotech.
Sample Preparation Incubations
Compounds were first diluted in methanol to 100 mM. The concentration of organic solvent was 1% in the final incubations. Starting incubation volume was 500 µL and contained 1 mg/mL RLM, 10 µM substrate and 1.47 mM NADPH regenerating system in 100 mM potassium phosphate buffer pH 7.4. At 5, 15, 30, 60 and 90 minutes 50 µL aliquots of the mixture were taken and quenched with an equal volume of cold acetonitrile. The mixture was vortexed for 1 min and then centrifuged at 15000 rpm for 10 minutes. The supernatant was then analyzed on the X500R. The control sample (t=0) was prepared by quenching the microsomes first before adding substrate. RLM blank time point controls were prepared by incubating a mixture without substrate and taking aliquots at different time points.
Mass Spectrometry Data Collection
Data was collected on a SCIEX X500R QTOF System
with SCIEX OS 1.2 using both IDA and SWATH®
acquisition. TOF MS acquisition covered m/z 100 to 1000,
with 100 ms accumulation time. Data independent
acquisition was performed using SWATH® acquisition
with 7 variable windows sized to cover Phase I pathways.
Total scan time for the SWATH acquisition method was
325 msec. IDA data were acquired with dynamic
background subtraction, intensity threshold 1000 cps,
exclude isotope ± 3 Da, mass tolerance ± 50 mDa and 50
ms accumulation time.
Chromatography
Samples were chromatographed on a SCIEX ExionLCTM
AD system using a Phenomenex Kinetex C18 column (2.0
x 50 mm), 2.6 µm. Elution was performed using a linear
gradient from 5% to 40% B over 4 mins, then to 95% B at
4.5 min and held at 95% B until 5 min. The column was
returned to 5% B at 5.25 min. Total run time was 6
minutes. Mobile phase A was water with 0.1% formic acid
and mobile phase B was acetonitrile with 0.1% formic
acid. The flow rate was 400 µL/min, the column was kept
at 40 °C and 2 µL was injected.
Data Processing
Data was processed in MetabolitePilot 2.0 software using
the installed Phase I biotransformation list. A sample to
control ratio of >3 was used. TOF MS was used to find
metabolites using both the predicted and generic peak
finding (mass defect filter on) algorithms. For the
compounds haloperidol and midazolam the isotope
pattern algorithm filter was also used. The LC-MS and
MS/MS (XIC) threshold and MS/MS threshold was set to
3000 and 500 cps respectively. The Advanced MSMS
filter was used for SWATH data processing.
Figure 1. The molecular structures of the compounds used in this study.

p 3
Results
Each parent compound eluted between 2.9 and 3.7
minutes. An example chromatogram of the SWATH®
Acquisition from the 30 min incubation of verapamil is
shown in Figure 2A and 15 min incubation of buspirone in
2B. The verapamil chromatogram shows the parent,
oxidized and de-methylated metabolite TOF MS XICs.
Each peak has a width of approximately 5 seconds, and
the variable window SWATH Acquisition approach allowed
the collection of at least 12 data points across each peak.
Each peak is well resolved using the 50 mm Kinetex C18
column and 5 min gradient. Similarly the oxidized
metabolites of buspirone are also well resolved.
Figure 2. LCMS chromatogram from the SWATH® Acquisition of the 30 min incubation of verapamil (A) and 15 min incubation of buspirone (B). The verapamil chromatogram (A) shows the parent (pink), de-methylated (blue) and oxidized metabolites (red) are well resolved. Similarly the buspirone chromatogram (B) shows the oxidized metabolites (blue) are well resolved and resolved from the parent (pink).
Excellent mass accuracy and resolution were achieved in
both MS and MS/MS scans (Figure 3). The high mass
accuracy obtained in MS/MS scans greatly facilitates
structure elucidation because it allows unambiguous
assignment of elemental composition. As can be seen
from the number of points across the peaks in figure 2 the
data independent acquisition (SWATH Acquisition) is
performed with enough speed to allow quantitation (>10
points) in both MS and MSMS at the resolution and mass
accuracy seen in figure 3.
Figure 3. Mass accuracy and resolution in TOF MS and TOF MSMS. Panel A shows the MS scan of the haloperidol parent (blue trace) with a near perfect match of the theoretical isotope pattern (pink). The product ion spectrum of the major oxidized metabolite is shown in panel B with the ppm error and resolution for mass fragments 181.0656 (C10H10FO2
+) and 356.1213 (C21H20ClFNO
+). Excellent mass
accuracy and > 30K resolution allow easy assignment of elemental composition, even to the product ions.
Data were processed in MetabolitePilotTM
2.0 software
with the auto-assign option and using the t = 0 sample and
RLM blank as controls. Each results table was then sorted
based on MS peak area to identify the top metabolites
formed at each time point. The auto-assign function of
MetabolitePilot software will generate structural proposals
for metabolites with: one or more cleavages, one
biotransformation and metabolites with a combination of
one cleavage and one biotransformation. This feature
helps to speed up metabolite assignment because the
user only needs to review and confirm the proposed
metabolite structure using the MS/MS interpretation tool.
An example of the interpretation workspace is shown in
figure 4 (page 5) for the major oxidized metabolite of
midazolam. There are several possible sites of oxidation
and each candidate is represented with a line in the
structure candidates tab. The top structure from the
assignment algorithm is shown as rank 1 and the other
possibilities are shown below. The strength of the
evidence of the other candidates is shown relative to rank
1 and is represented as a histogram. In the case of

p 4
1’-hydroxymidazolam the metabolite structure was
confirmed by matching the MSMS spectrum with one
previously reported.2 However, not all candidates can be
distinguished based on MSMS, such as oxidation on an
aromatic ring and are presented with the same relative
evidence (blue histogram, rank 3) and are best
represented with a Markush structure.
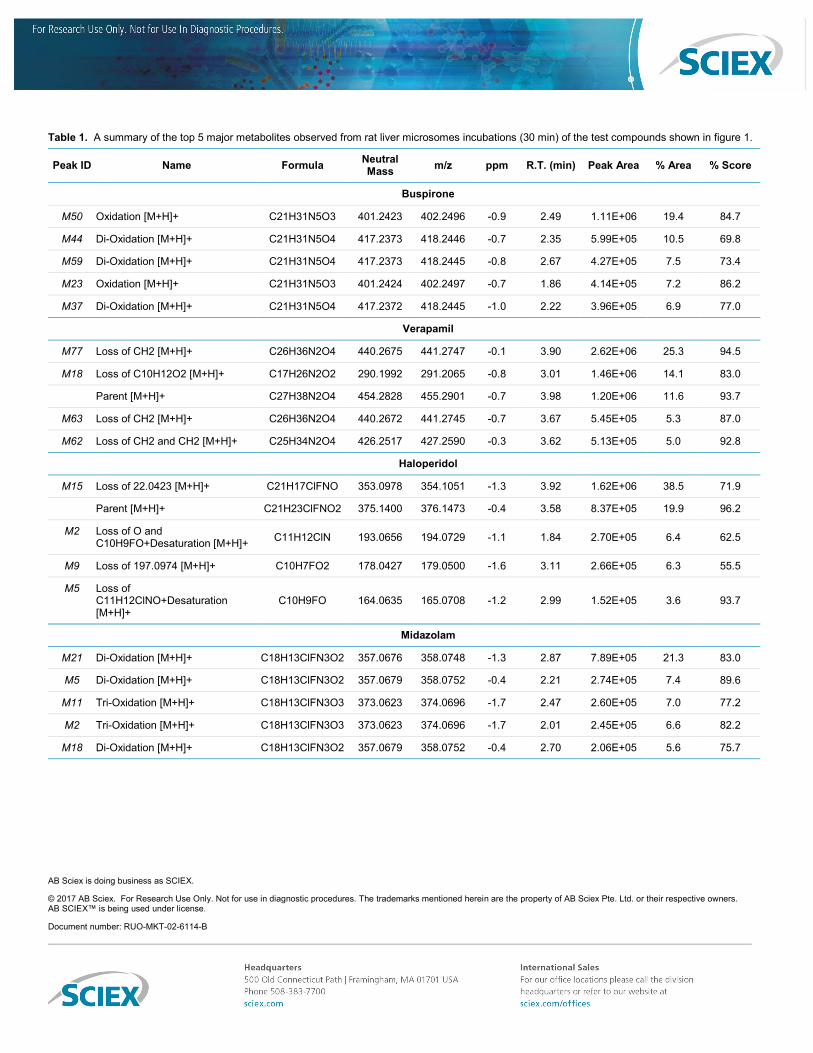
The top 5 metabolites found for each compound after 30
minutes are shown in Table 1 (page 6). Buspirone
metabolites included: 6’-OH, 3’-OH and di-oxidations,
verapamil included: N- and O-demethylation and C-N
bond cleavage, haloperidol included: pyridine oxidation, C-
N bond cleavage and oxidation and midazolam
metabolites included: di- and tri-oxidation.
There were no differences observed in the top 10
metabolites found by either IDA or SWATH® Acquisition
for each compound. However as observed previously1,
there were differences in the number of MSMS spectra
acquired between the two techniques for metabolites 11 to
20 (based on TOFMS peak intensity) for each compound.
Not all metabolites in this intensity range had associated
MSMS spectra with IDA acquisition while 100% of the
metabolites had MSMS spectra when using SWATH
Acquisition. The absence of product ion spectra for some
metabolites would require reacquisition of the sample
targeting the specific metabolite precursor ion. Another
advantage of SWATH Acquisition is the collection of
isotope pattern information in the product ion spectrum,
which can be used for metabolite peak finding (figure 5).
The correlation workspace was used to compare and
confirm metabolites across multiple time points using the
processed results tables. After selecting the samples for
correlation the software automatically tabulates the
abundance of each metabolite across all samples and
overlays all chromatographic, MS, and MS/MS data.
Figure 6 shows an example correlation plot for the
oxidized metabolites of buspirone from 5 to 90 mins and
shows the correlation in a linear plot. A bar graph and
table views are also available in the correlation
workspace.
Conclusions
Rapid detection and characterization of major metabolites
is required for lead optimization in fast paced drug
discovery environments. Rat liver microsome incubations
of haloperidol, verapamil, buspirone and midazolam have
shown that the X500R QTOF system combined with
MetabolitePilotTM
2.0 software is a powerful solution for
rapid soft spot analysis. Both IDA and variable window
SWATH Acquisition techniques are suitable for high
throughput acquisition and SWATH Acquisition offers the
benefit of collecting product ion spectra for all detectable
metabolite precursor ions and capturing product ion
isotope pattern information. Data processing is speeded
by the automatic structure proposal feature and integrated
MS/MS fragment interpretation tool that performs fragment
assignments all in a single integrated workspace.
Figure 5. An example of the isotope pattern information collected in the product ion spectrum using SWATH® Acquisition (Top) versus IDA (Bottom). The 338.0492 product ion of the 1’-midazolam carboxylic acid metabolite (m/z 356.0597) is shown.
References
1. Comparison of Information-Dependent Acquisition, SWATH, and MS
All Techniques in Metabolite Identification Study
Employing Ultrahigh-Performance Liquid Chromatography–Quadrupole Time-of-Flight Mass Spectrometry. Xiaochun Zhu, et al. Analytical Chemistry 2014 86 (2), 1202-1209 2. Sensitive and specific determination of midazolam and 1-hydroxymidazolam in human serum by liquid chromatography–electrospray mass spectrometry. P Marquet et al. Journal of Chromatography B: Biomedical Sciences and Applications, Volume 734, Issue 1, 1999, Pages 137-144.

p 5
Figure 4. The interpretation workspace of MetabolitePilotTM
2.0 software showing data from the 15 minute incubation of midazolam. There are 2 mono-oxidized products among the 10 major metabolites at this time point, the product ion spectrum and structure candidates tab is shown for the 3.12 min mono-oxidized metabolite. There are many possible sites of oxidation on the midazolam structure that could represent the metabolite at this retention time, each regioisomer is represented as a line in the structural candidates table and the evidence for each proposal is represented relative to the top proposal (1’-hydroxymidazolam). The MSMS spectrum of the proposed 1’-hydroxymidazolam metabolite matches one previously reported.
2
Figure 6. MetabolitePilotTM
2.0 software correlation workspace with an example correlation plot for the oxidized metabolites of buspirone from 5 to 90 min incubation time points. The correlation is shown in a linear plot with overlays of chromatographic, MS, and MS/MS data, bar graph and table views are also available in this correlation workspace.
p 6
Table 1. A summary of the top 5 major metabolites observed from rat liver microsomes incubations (30 min) of the test compounds shown in figure 1.
Peak ID Name Formula Neutral Mass
m/z ppm R.T. (min) Peak Area % Area % Score
Buspirone
M50 Oxidation [M+H]+ C21H31N5O3 401.2423 402.2496 -0.9 2.49 1.11E+06 19.4 84.7
M44 Di-Oxidation [M+H]+ C21H31N5O4 417.2373 418.2446 -0.7 2.35 5.99E+05 10.5 69.8
M59 Di-Oxidation [M+H]+ C21H31N5O4 417.2373 418.2445 -0.8 2.67 4.27E+05 7.5 73.4
M23 Oxidation [M+H]+ C21H31N5O3 401.2424 402.2497 -0.7 1.86 4.14E+05 7.2 86.2
M37 Di-Oxidation [M+H]+ C21H31N5O4 417.2372 418.2445 -1.0 2.22 3.96E+05 6.9 77.0
Verapamil
M77 Loss of CH2 [M+H]+ C26H36N2O4 440.2675 441.2747 -0.1 3.90 2.62E+06 25.3 94.5
M18 Loss of C10H12O2 [M+H]+ C17H26N2O2 290.1992 291.2065 -0.8 3.01 1.46E+06 14.1 83.0
Parent [M+H]+ C27H38N2O4 454.2828 455.2901 -0.7 3.98 1.20E+06 11.6 93.7
M63 Loss of CH2 [M+H]+ C26H36N2O4 440.2672 441.2745 -0.7 3.67 5.45E+05 5.3 87.0
M62 Loss of CH2 and CH2 [M+H]+ C25H34N2O4 426.2517 427.2590 -0.3 3.62 5.13E+05 5.0 92.8
Haloperidol
M15 Loss of 22.0423 [M+H]+ C21H17ClFNO 353.0978 354.1051 -1.3 3.92 1.62E+06 38.5 71.9
Parent [M+H]+ C21H23ClFNO2 375.1400 376.1473 -0.4 3.58 8.37E+05 19.9 96.2
M2 Loss of O and C10H9FO+Desaturation [M+H]+
C11H12ClN 193.0656 194.0729 -1.1 1.84 2.70E+05 6.4 62.5
M9 Loss of 197.0974 [M+H]+ C10H7FO2 178.0427 179.0500 -1.6 3.11 2.66E+05 6.3 55.5
M5 Loss of C11H12ClNO+Desaturation [M+H]+
C10H9FO 164.0635 165.0708 -1.2 2.99 1.52E+05 3.6 93.7
Midazolam
M21 Di-Oxidation [M+H]+ C18H13ClFN3O2 357.0676 358.0748 -1.3 2.87 7.89E+05 21.3 83.0
M5 Di-Oxidation [M+H]+ C18H13ClFN3O2 357.0679 358.0752 -0.4 2.21 2.74E+05 7.4 89.6
M11 Tri-Oxidation [M+H]+ C18H13ClFN3O3 373.0623 374.0696 -1.7 2.47 2.60E+05 7.0 77.2
M2 Tri-Oxidation [M+H]+ C18H13ClFN3O3 373.0623 374.0696 -1.7 2.01 2.45E+05 6.6 82.2
M18 Di-Oxidation [M+H]+ C18H13ClFN3O2 357.0679 358.0752 -0.4 2.70 2.06E+05 5.6 75.7
AB Sciex is doing business as SCIEX.
© 2017 AB Sciex. For Research Use Only. Not for use in diagnostic procedures. The trademarks mentioned herein are the property of AB Sciex Pte. Ltd. or their respective owners. AB SCIEX™ is being used under license.
Document number: RUO-MKT-02-6114-B