rapid, sensitive, and easy uhplc-ms/ms analysis of ... … · rapid, sensitive, and easy...
TRANSCRIPT

Rapid, sensitive, and easy UHPLC-MS/MS analysis of fungicides in fruit juices with QuEChERS
APPLICATION NOTE 21691
KeywordsFood safety, Quantitation, Fungicides, Small molecule, Conazole, Carbendazim, Thiabendazole, Imazalil, Fenbuconazole, Dfenoconazole, Conazole, Fruit juice, Apple juice, Orange juice, UHPLC, QuEChERS, Vanquish GOLD UHPLC column, Vanquish Flex Binary UHPLC system, TSQ Endura triple quadrupole mass spectrometer
AuthorAaron Lamb and Brian King, Thermo Fisher Scientific, Runcorn, UK
Application benefits • Quantitation of relevant fungicides in fruit juices down to below 1 ng/mL level without SPE workup
• Simplified extraction procedure with QUECHERS sample treatment only
• UHPLC-MS/MS analysis with sub-four minute gradients
Goal To develop a rapid and sensitive assay for the quantitation of fungicides in fruit juices (orange and apple) with a separation gradient time of less than four minutes. To achieve a lower limit of quantification of 1 ng/mL for fungicides in fruit juice matrices while reducing cost per sample with a simple QuEChERS extraction. Recovery of all fungicides is required to be greater than 70%–120% with an RSD of less than 20%, in line with SANTE guidelines.1
Introduction Methyl 2-benzimidazole carbamate, most commonly known as carbendazim, is a widely used broad-spectrum benzimidazole fungicide and a decomposition product of benomyl. Carbendazim is used to control plant diseases in cereals and fruit, including citrus fruits, bananas, strawberries, pineapples, and pome fruits. Although not permitted for use to treat citrus

2
range of commercial prepared juices, it was possible to develop a fast sample preparation protocol that allowed the analysis of these fungicides by UHPLC-MS/MS down to 1 ng/mL levels within four minutes without the need for further sample cleanup or post-extraction concentration.
The Thermo Scientific™ Hypersep™ Dispersive SPE (QuEChERS) products are available in a range of formats to meet different application requirements. Both extraction tubes and dispersive SPE were used in this analysis to provide a straightforward cleanup of difficult matrices. By using the Thermo Scientific™ Vanquish™ Flex UHPLC platform, the detection of the specific fungicides was quantitated with excellent retention time reproducibility with RSD of 0.05% compared to typical values of 0.1% for competitors.
The Thermo Scientific™ Hypersil GOLD™ VANQUISH™ column has an endcapped ultra-pure porous silica material giving exceptional peak shape and resolution for HPLC and LC-MS. The Vanquish GOLD column and the capabilities of the Vanquish Flex UHPLC platform allow a combination of high separation efficiency and fast analysis to give increased sample throughput compared to methods with multi-step liquid extraction and SPE steps.
The Thermo Scientific™ TSQ Endura™ triple quadrupole mass spectrometer has ultrafast selected-reaction monitoring (SRM) of 500 SRM/s, with up to 30,000 definable SRMs. This enables quantification of more compounds in less time. The ion optics, RF-lens, ion beam guide with neutral blocker, and quadrupole mass filter combine to reduce noise and increase sensitivity for enhanced quantitative performance.
fruit in the USA and Australia, it is permitted in the EU, and European Regulation 559/2011 sets a limit for carbendazim and benomyl (sum of carbendazim and benomyl expressed as carbendazim) at 0.2 mg/kg in oranges. Incidences of MRL exceedance have been common in the EU, with 23 Rapid Alert Notifications in 2011 for levels of carbendazim as high at 4 mg/kg in fruit, vegetables, and herbs from Africa, S. America, and Asia.2 Orange juice from Brazil imported into the USA has been found to contain carbendazim, and an action limit of 0.01 mg/kg (10 ng/mL) has been applied by the FDA.3 Many methods in widespread use for monitoring carbendazim have been developed for multi-residue determination of fungicides and employ a variety of sample preparation and cleanup techniques. In recent years the QuEChERS (Quick, Easy, Cheap, Effective, Rugged and Safe) method has become widely adopted for handling fruit such as oranges. These methods usually use this process as a sample pretreatment prior to the utilization of an instrumental technique, such as column switching, to give further cleanup or a precursor to a lengthy SPE extraction.
For higher analytical throughput, recent methods have utilized sub-10 minute separation gradients. Legacy methods in continued to use longer run times. Existing methods can quantify these fungicides to >10 ng/mL with a multi-step sample preparation but none are able to use a simple extraction with a UHPLC-MS/MS separation gradient of less than 4 minutes to quantify at 1 ng/mL levels.
Other related fungicides, the conazoles, are also used for treatment of fruit and they are more stable than carbendazim so have a longer-term impact. All these fungicides can be found in fruit that has been sprayed during cultivation and is then used to produce commercial juices and fruit drinks. These can vary widely in source or type (Figure 1).
In these cases, the LLOQ is limited to 10 ng/mL for the conazole fungicides. To decrease this level further, the use of SPE and sample dry down is required. The retention of these less polar compounds is longer and the methods require acceleration to give a cycle time of 5 minutes.
The method developed was designed to determine the levels of these fungicides in orange juice with a minimum amount of sample cleanup. Using QuEChERS with a
Figure 1. Structures of carbendazim and conazole fungicides.
CH³
O
O
OCH³NH
HNN
NH
N
N
S
N
NCl
ClOH²C
N
N
N
N Cl
N
NN
Cl
ClO
O
imazalilthiabendazolecarbendazim
fenbuconazole difenoconazole
3
All chromatography and MS data was processed using Thermo Scientific™ Chromeleon™ CDS software, which provides chromatography labs with compliance-ready data management, unified instrument control, and simplified analysis and data reporting for chromatography and mass spectrometry.
The method developed was able to exceed the sensitivity of a competitive QuEChERS method by giving 1 ng/mL sensitivity for all the fungicides investigated. This was achieved without a separate SPE step and any dry down concentration. The runtime of < 4 minutes compared to 10 minutes for an online method and 7.2 minutes for a comparable UHPLC method.
Experimental Recommended consumables • Deionized water, 18.2 MΩ•cm resistivity from Thermo Scientific™ Smart2Pure™ system (P/N 5012984)
• Fisher Scientific™ Optima™ UHPLC-MS grade methanol (P/N A458-1)
• Fisher Scientific™ Optima™ UHPLC-MS grade acetonitrile (P/N A956-1)
• Fisher Scientific Analytical grade formic acid (P/N F/1900/PB08)
• Fisher Scientific Analytical grade ammonia (P/N A/3295/PB05)
• Hypersil GOLD VANQUISH C18 UHPLC column 50 mm × 2.1 mm, 1.9 µm (P/N 25002-052130-V)
• Thermo Scientific™ Virtuoso™ Vial Identification System (P/N 60180-VT100)
• Virtuoso vial, clear 2 mL kit with septa and cap (P/N 60180-VT402)
• HyperSep Dispersive SPE (QuEChERS) 50 mL Tube 25-pk (P/N 60105-316)
• HyperSep Dispersive SPE Clean Up 15 mL Tube 25-pk (P/N 60105-327)
• Thermo Scientific 22 mL Storage Vials Kit 200-pk (P/N 22-CV-CP)
• 50 mL Centrifuge tubes (P/N 05-539-13)
• 15 mL Centrifuge tubes (P/N 11849650)
• Fisherbrand™ Adapt-a-Rack™ (blue) (P/N 15340370)
Standards The reference grade standards used were purchased from a reputable supplier: • Carbendazim • Thiabendazole • Imazalil • Fenbuconazole • Difenoconazole (internal standard)
Samples All juices were purchased from a local supermarket.
Sample handling equipment• Benchtop centrifuge with 50 mL and 15 mL dual tube rotor • Vortex mixer
Stock solution preparation Standard stock solutions Separate stock solutions, fungicide standards, and the internal standard were prepared at 10 mg/mL in 100% glacial acetic acid.
Calibration stock solutions A mixed fungicide solution was then prepared at 10 µg/mL from the fungicide 10 mg/mL stock solution in a 5:95 methanol/water 0.1% formic acid solution. From this mixed standard, spiking solutions were prepared at 1.0, 2.5, 5, 10, 25, 50, and 100.0 ng/mL.
Quality control (QC) stock solutions A separate preparation of the mixed standard was used to make quality control spiking solutions (3.0, 40.0, and 80.0 ng/mL) in in a 5:95 methanol/water 0.1% formic acid solution.
Internal standard stock solution An internal standard solution spiking solution was prepared at 1,000 ng/mL
Standard and QC preparation Calibration curve preparation The appropriate calibration standard (2.5 mL) was added to the juice and made up to volume in a 50 mL volumetric flask. Three 15 mL sub-aliquots were taken of each QC and transferred to separate labeled vials and to these solutions 750 µL of the internal standard was added and the vials were mixed well.

Time (min) %A %B
0 90 104 5 956 5 956.1 90 1010 90 10
Table 1. LC gradient conditions.
4
Extraction procedure The following QuEChERS procedure was followed:
Transfer 15 mL of sample to 50 mL QuEChERS extraction tubes + 15 mL acetonitrile.
Vortex until homogeneous and leave to stand for 10 minutes and vortex once more.
Centrifuge at 7,400 rpm for 2 minutes.
Transfer 10 mL of top layer to dispersive SPE QuEChERS tubes, vortex until homogeneous, and then centrifuge at
7,400 rpm for 2 minutes.
Dilute the supernatant 250 µL + 750 µL of 5% methanol/95% 0.1% ammonia solution.
Samples/standards and QCs The appropriate QC standard (1.25 mL) was added to the juice, 750 µL of the internal standard was added, and the vials were mixed well.
Matrix blank preparation The dilution solution (1.25 mL) was added to 15 mL of juice matrices and made up to volume in a 25 mL volumetric flask. The dilution solution was 95:5:0.1 v/v/v water/methanol/ammonia. A 15 mL sub-aliquot was taken and transferred to separate labeled vials and mixed well.
Mobile phase blanks To 950 µL of acetonitrile, 50 µL of 95:5:0.1 v/v/v water/methanol/ammonia was added. Then, 250 µL of this solution was diluted with 750 µL of 95:5:0.1 v/v/v water/methanol/ ammonia to produce the blank solution.
Matrix post-spiked standard preparation Matrix blanks (900 µL) were transferred to separate autosampler vials. These were spiked with 50 µL of the appropriate QC standard as well as 50 µL of the internal standard. Then, 250 µL of this solution was diluted with 750 µL of 95:5:0.1 v/v/v water/methanol/ammonia to produce the matrix-matched post-spiked solutions.
Separation conditions Instrumentation Analyses were performed using a Vanquish Flex Binary UHPLC system consisting of:• System Base Vanquish Flex (P/N VF-S01-A)• Binary Pump F (P/N VF-P10-A-01)• Split Sampler FT (P/N VF-A10-A)• Column Compartment H (P/N VH-C10-A)• Active Pre-heater (P/N 6732.0110)
Column: Hypersil GOLD VANQUISH C18 UHPLC column 50 mm × 2.1 mm 1.9 µm (PN 25002-052130-V)Mobile phase A: Water/0.5% formic acidMobile phase B: Methanol/0.5% formic acidGradient: Table 1
Flow rate: 0.4 mL/min Column temperature: 40°C Column thermostatting mode: Still Air Pre-heater: On 32°C Injection details: 20 µL Injection wash solvent: 20:80 methanol/water (v/v)
MS conditions Instrumentation Mass analysis was performed with the TSQ Endura MS. Instrumental conditions are listed in Table 2 and the compound transition details are listed in Table 3.
Results and discussionExtraction of juices Methods for the analysis of fungicides in fruit juices sometimes utilize a three-step process of non-optimized QuEChERS matrix cleanup, dry down, and reconstitution followed by SPE. This is time-consuming and expensive in terms of labor and material expenditure. In this modified QuEChERS method, we demonstrate a simple optimized QuEChERS matrix cleanup followed by UHPLC-MS/MS analysis. The use of the salting out step with a mix of magnesium sulfate, sodium chloride, and sodium citrate was shown to provide an initial cleanup that was refined by the use of a selective dispersive SPE step to remove matrix contaminants prior to dilution and injection into the UHPLC system. This eliminated the dry down/reconstitution and further SPE steps, saving time and money.
Method optimization During method development, the injection volume of QuEChERS extract was initially set at 50 µL but due to the high acetonitrile concentration the early eluting components showed peak tailing and broadening even after dilution. The injection volume was evaluated at levels between 50 µL and 5 µL. A volume of 20 µL was found to
5
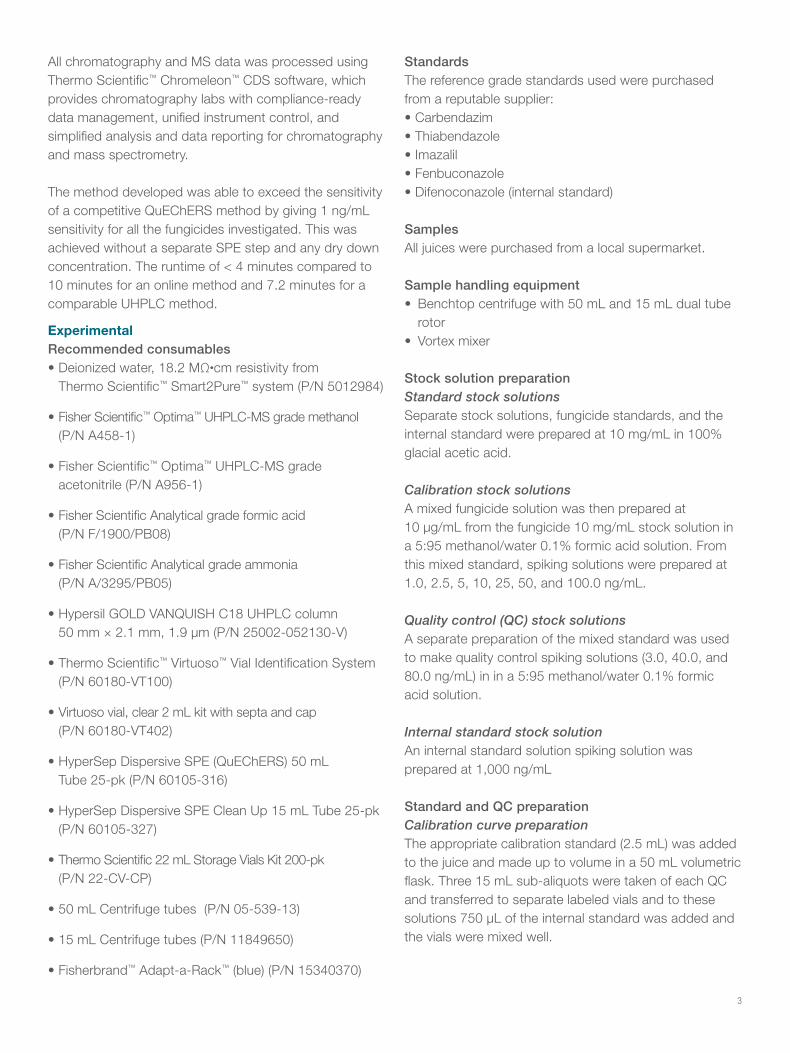
Ionization conditions HESI
Polarity PositiveSpray voltage 3500 VVaporiser temperature 400°CSheath gas pressure 50 ArbAux gas pressure 15 ArbCapillary temp 350°CCollision pressure 1.5 mTorrScan time 0.25 sQ1 (FWHM) 0.7Q3 (FWHM) 0.7
Table 2. MS source and analyzer conditions.
Compound Carbendazim Thiabendazole Imazalil Fenbuconazole Difenoconazole
Precursor (m/z) 192.1 202.1 297.1 337.1 406.1Product (m/z) (1) 160.1 175.1 159.0 125.0 251.0Confirmation (m/z) (2) 132.1 131.2 176.1 194.0 188.1Collision energy 1 (V) 33 36 22 29 28Collision energy 2 (V) 20 28 26 19 46
Table 3. Compound transition details.
Data processing The Thermo Scientific™ Chromeleon™ 7.2 SR4 Chromatography Data System was used for data acquisition and analysis.
give the most reproducible peak shape while maintaining method sensitivity. This was maintained for all batches.
Dilution of the acetonitrile QuEChERS extracts in 95:5:0.1 v/v/v water/methanol/ammonia rather than mobile phase starting conditions was found to improve peak shape for the earlier eluting peaks. The basic solution gave better chromatography and consistent signal response.
Injection of the calibration and QC matrix standards showed excellent retention time reproducibility with %RSD of between 0.05% and 0.16% for the four fungicides. All the standards’ retentions showed excellent stability on the programmed gradient for 22 samples (Table 4).
6
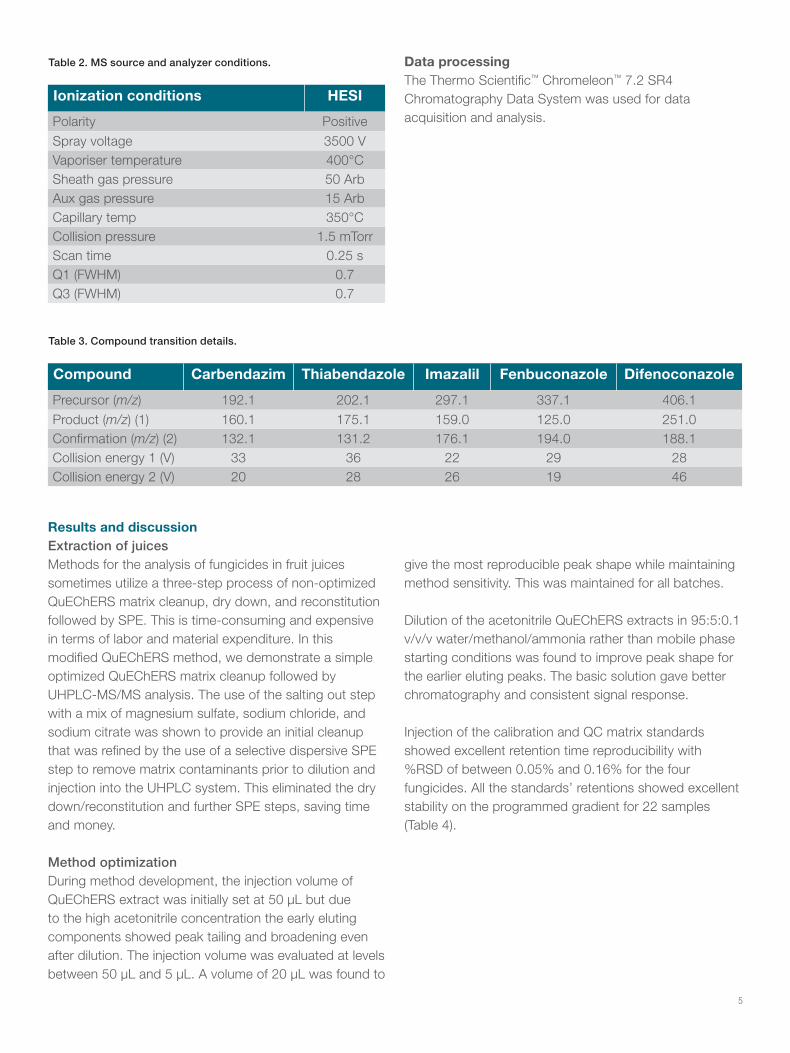
Figure 2. Representative chromatogram for Low QC batch with IS and extracted ion chromatograms.
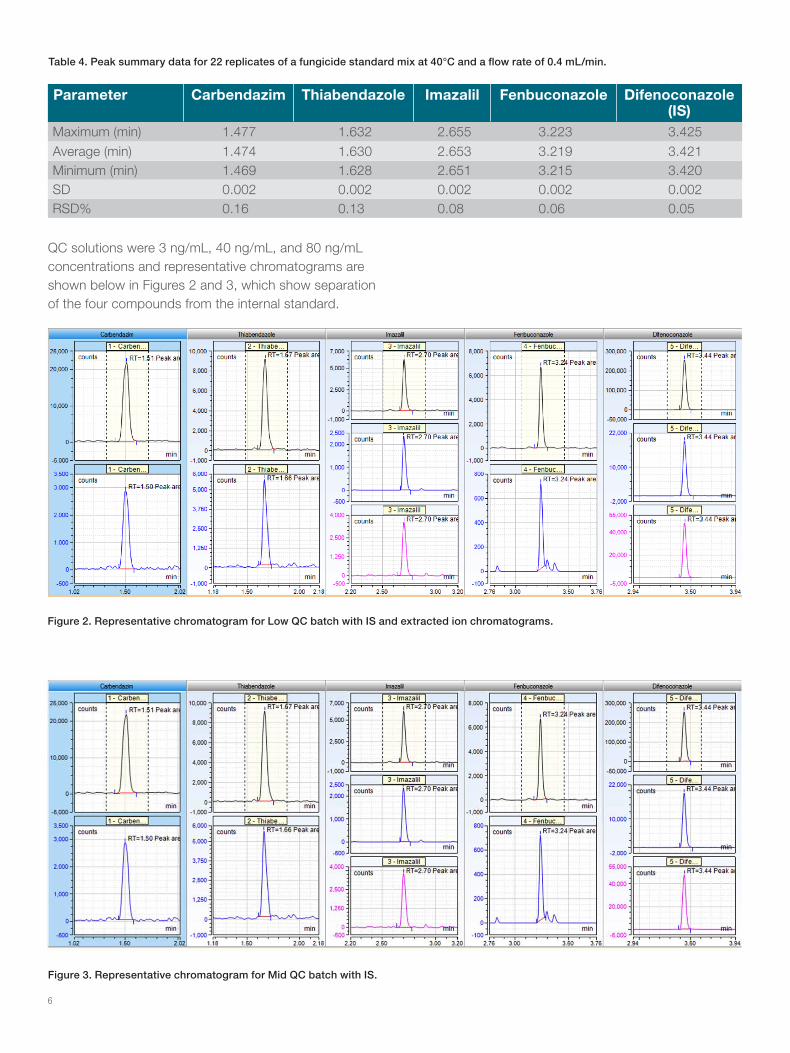
Parameter Carbendazim Thiabendazole Imazalil Fenbuconazole Difenoconazole(IS)
Maximum (min) 1.477 1.632 2.655 3.223 3.425Average (min) 1.474 1.630 2.653 3.219 3.421Minimum (min) 1.469 1.628 2.651 3.215 3.420SD 0.002 0.002 0.002 0.002 0.002RSD% 0.16 0.13 0.08 0.06 0.05
Table 4. Peak summary data for 22 replicates of a fungicide standard mix at 40°C and a flow rate of 0.4 mL/min.
QC solutions were 3 ng/mL, 40 ng/mL, and 80 ng/mL concentrations and representative chromatograms are shown below in Figures 2 and 3, which show separation of the four compounds from the internal standard.
Figure 3. Representative chromatogram for Mid QC batch with IS.

7
UHPLC Calibration Linearity The calibration linearity was investigated by carrying out injections of matrix-matched calibration standards for 1.0 to 100 ng/mL. The results from the calibration line accuracy versus the true value were within 100 ± 20% for all compounds across the range (Table 5).
% Accuracy relative to true amount
Compound 1 2.5 5 10 25 50 100Carbendazim 82.2 95.3 95.2 100.7 94.7 98.6 100.9Thiabendazole 97.5 90.3 91.6 92.1 94.8 97.2 103.6Imazalil 117.0 90.8 89.8 104.6 102.4 93.9 103.1Fenbuconazole 113.0 98.7 89.8 98.0 94.4 88.2 107.4
Table 5. Calibration line accuracy % of true concentration.
The matrix-matched calibrations were prepared in duplicate. When plotting the calibration curve, the coefficient of determination was >0.997 for all fungicides (Figure 4).
Component Calibration Line
Peak Name: CarbendazimRet. Time: 1.477 minCoefficient of determination: 0.99993
Peak Name: ThiabendazoleRet. Time: 1.632 minCoefficient of determination: 0.99971
Peak Name: ImazalilRet. Time: 2.651 minCoefficient of determination: 0.99953
Peak Name: FenbuconazoleRet. Time: 3.219Coefficient of determination: 0.99707
Figure 4. Calibration lines for four fungicides.
Area
0 100
100
200
300
400
500550
20 30 40 50 60 70 80 90 100 110 120Amount
Area
0 100
20
40
60
80
100
120
140
160
180
20 30 40 50 60 70 80 90 100 110 120Amount
Area
0 100.0
10.0
20.0
30.0
40.0
50.0
60.0
70.0
80.0
20 30 40 50 60 70 80 90 100 110 120Amount
Area
0 100.0
10.0
20.0
30.0
40.0
50.0
60.0
70.0
80.0
20 30 40 50 60 70 80 90 100 110 120Amount
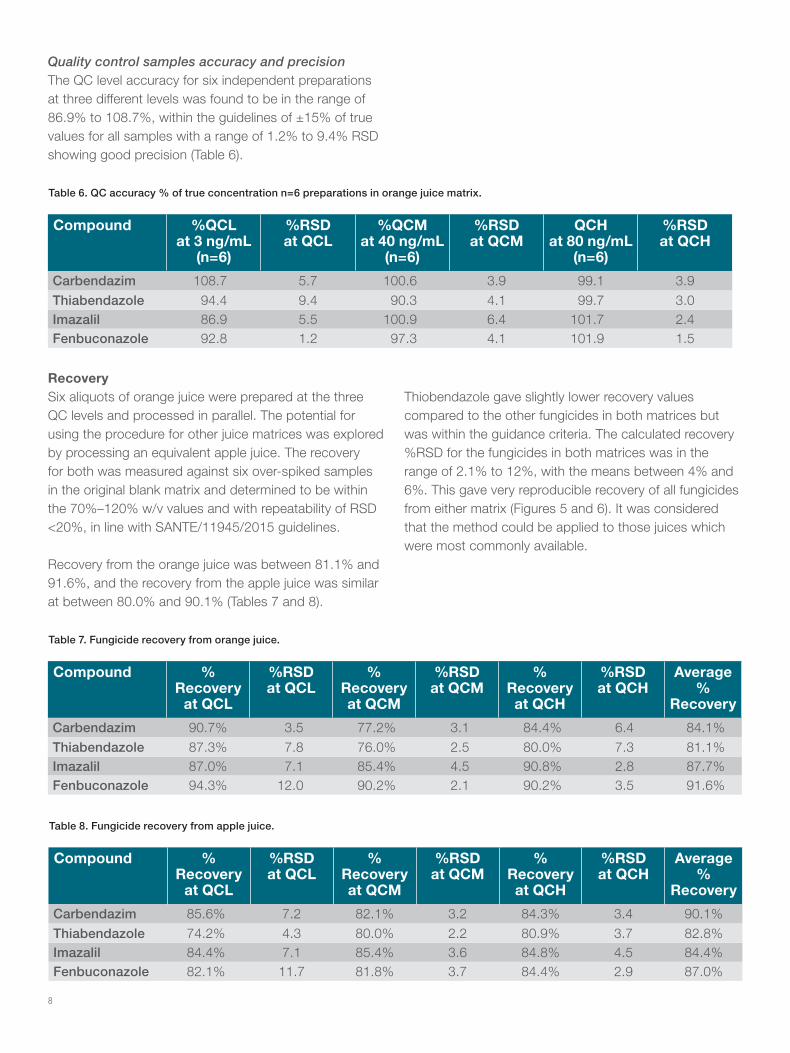
Quality control samples accuracy and precision The QC level accuracy for six independent preparations at three different levels was found to be in the range of 86.9% to 108.7%, within the guidelines of ±15% of true values for all samples with a range of 1.2% to 9.4% RSD showing good precision (Table 6).
Compound %QCL at 3 ng/mL
(n=6)
%RSD at QCL
%QCM at 40 ng/mL
(n=6)
%RSD at QCM
QCH at 80 ng/mL
(n=6)
%RSD at QCH
Carbendazim 108.7 5.7 100.6 3.9 99.1 3.9Thiabendazole 94.4 9.4 90.3 4.1 99.7 3.0Imazalil 86.9 5.5 100.9 6.4 101.7 2.4Fenbuconazole 92.8 1.2 97.3 4.1 101.9 1.5
Table 6. QC accuracy % of true concentration n=6 preparations in orange juice matrix.
Recovery Six aliquots of orange juice were prepared at the three QC levels and processed in parallel. The potential for using the procedure for other juice matrices was explored by processing an equivalent apple juice. The recovery for both was measured against six over-spiked samples in the original blank matrix and determined to be within the 70%–120% w/v values and with repeatability of RSD <20%, in line with SANTE/11945/2015 guidelines.
Recovery from the orange juice was between 81.1% and 91.6%, and the recovery from the apple juice was similar at between 80.0% and 90.1% (Tables 7 and 8).
Thiobendazole gave slightly lower recovery values compared to the other fungicides in both matrices but was within the guidance criteria. The calculated recovery %RSD for the fungicides in both matrices was in the range of 2.1% to 12%, with the means between 4% and 6%. This gave very reproducible recovery of all fungicides from either matrix (Figures 5 and 6). It was considered that the method could be applied to those juices which were most commonly available.
Compound % Recovery
at QCL
%RSD at QCL
% Recovery at QCM
%RSD at QCM
% Recovery at QCH
%RSD at QCH
Average %
Recovery
Carbendazim 90.7% 3.5 77.2% 3.1 84.4% 6.4 84.1%Thiabendazole 87.3% 7.8 76.0% 2.5 80.0% 7.3 81.1%Imazalil 87.0% 7.1 85.4% 4.5 90.8% 2.8 87.7%Fenbuconazole 94.3% 12.0 90.2% 2.1 90.2% 3.5 91.6%
Table 7. Fungicide recovery from orange juice.
Compound % Recovery
at QCL
%RSD at QCL
% Recovery at QCM
%RSD at QCM
% Recovery at QCH
%RSD at QCH
Average %
Recovery
Carbendazim 85.6% 7.2 82.1% 3.2 84.3% 3.4 90.1%Thiabendazole 74.2% 4.3 80.0% 2.2 80.9% 3.7 82.8%Imazalil 84.4% 7.1 85.4% 3.6 84.8% 4.5 84.4%Fenbuconazole 82.1% 11.7 81.8% 3.7 84.4% 2.9 87.0%
Table 8. Fungicide recovery from apple juice.
8
9
Recovery
Carbendazim Thiabendazole Imazalil Fenbuconazole70%
75%
80%
85%
90%
95%
100%
Fungicide
Figure 5. Recovery and RSD comparisons for four fungicides in orange juice matched-matrix QC samples.
Recovery
Carbendazim Thiabendazole Imazalil Fenbuconazole70%
75%
80%
85%
90%
95%
100%
Fungicide
Figure 6. Recovery and RSD comparisons for four fungicides in an apple juice matrix-matched QC samples.
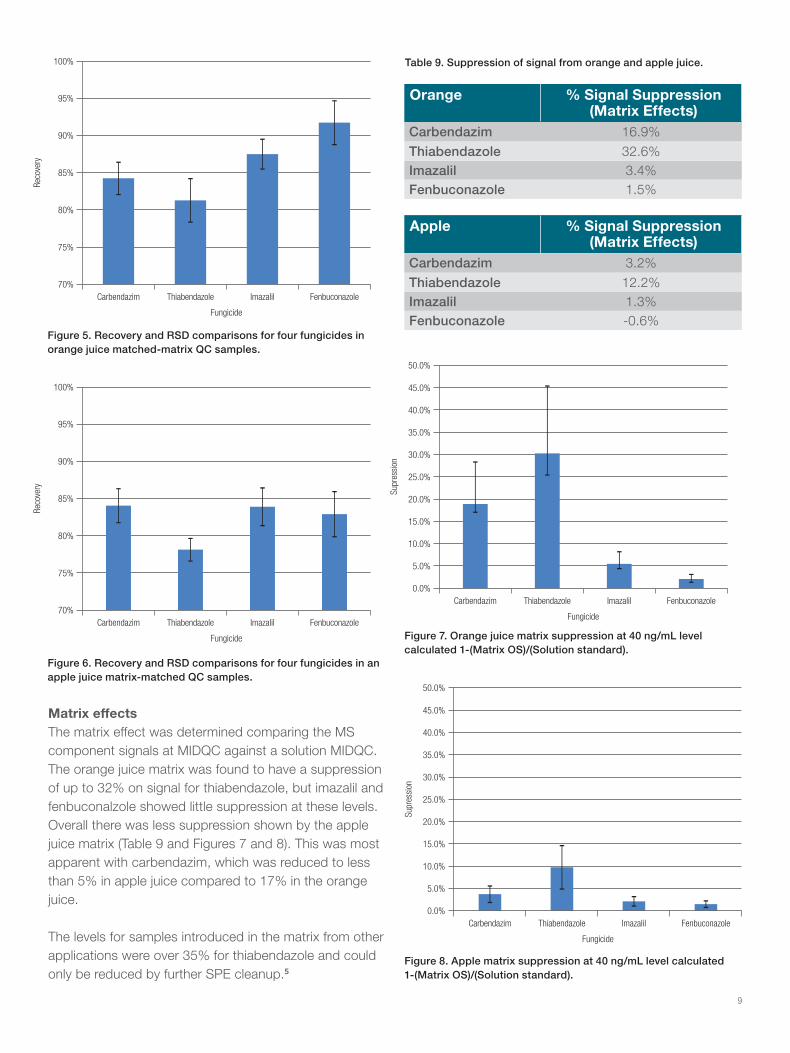
Matrix effects The matrix effect was determined comparing the MS component signals at MIDQC against a solution MIDQC. The orange juice matrix was found to have a suppression of up to 32% on signal for thiabendazole, but imazalil and fenbuconalzole showed little suppression at these levels. Overall there was less suppression shown by the apple juice matrix (Table 9 and Figures 7 and 8). This was most apparent with carbendazim, which was reduced to less than 5% in apple juice compared to 17% in the orange juice.
The levels for samples introduced in the matrix from other applications were over 35% for thiabendazole and could only be reduced by further SPE cleanup.5
Orange % Signal Suppression (Matrix Effects)
Carbendazim 16.9%Thiabendazole 32.6%Imazalil 3.4%Fenbuconazole 1.5%
Table 9. Suppression of signal from orange and apple juice.
Apple % Signal Suppression (Matrix Effects)
Carbendazim 3.2%Thiabendazole 12.2%Imazalil 1.3%Fenbuconazole -0.6%
Supression
Carbendazim Thiabendazole Imazalil Fenbuconazole0.0%
5.0%
10.0%
15.0%
20.0%
25.0%
30.0%
35.0%
40.0%
45.0%
50.0%
Fungicide
Figure 7. Orange juice matrix suppression at 40 ng/mL level calculated 1-(Matrix OS)/(Solution standard).
Supression
Carbendazim Thiabendazole Imazalil Fenbuconazole0.0%
5.0%
10.0%
15.0%
20.0%
25.0%
30.0%
35.0%
40.0%
45.0%
50.0%
Fungicide
Figure 8. Apple matrix suppression at 40 ng/mL level calculated 1-(Matrix OS)/(Solution standard).

10
The matrix effects were less with apple juice compared to orange juice, which had some effects on the thiabendazole and carbendazim. As these are early eluting peaks, it would be more likely that polar matrix components will be present as part of the injection solution.
Detection Limits The calibration curve for all four fungicides was confirmed for a linear range of 1 ng/mL to 100 ng/mL. Below 1 ng/mL, replicates of 0.5 ng/mL standard in orange juice matrix were run and the presence of all five fungicides confirmed at this level.
To determine the method detection limit for the components this was calculated by the equation5:
Detection limit = S∙t(n – 1, 1 - α = 0.99)
The symbol S represents the standard deviation of replicate analyses, n represents the number of replicates,
t(n - 1, 1 - α = 0.99) represents the Student’s t value for the 99% confidence level with n – 1 degrees of freedom.
Using this value and the response from seven replicates of the 1 ng/mL standard calibration solution, it was determined that the method detection limit for each fungicide could be quantified at levels below 0.5 ng/mL (Table 10).
Carbendazim ng/mL
Thiabendazole ng/mL
Imazalil ng/mL
Fenbuconazole ng/mL
0.325 0.231 0.399 0.381
Table 10. MDL for seven replicate injections at 1 ng/mL level.
The extracted ion chromatograms showed sufficient response for quantification and confirming peaks. The fenbuconazole confirmation peak showed a small doublet
Figure 9. Extracted ion chromatograms at 1 ng/mL.
at this low 1 ng/mL level but retained 100% confirmation and calibration (Figure 9).

Find out more at thermoscientific.com/quechers For Research Use Only. Not for use in diagnostic procedures. ©2017 Thermo Fisher Scientific Inc. All rights reserved. All trademarks are the property of Thermo Fisher Scientific and its subsidiaries. This information is presented as an example of the capabilities of Thermo Fisher Scientific products. It is not intended to encourage use of these products in any manners that might infringe the intellectual property rights of others. Specifications, terms and pricing are subject to change. Not all products are available in all countries. Please consult your local sales representatives for details. AN21691-EN 0917S
Conclusions• A lower limit of quantification of 1 ng/mL for carbendazim, imazalil, and fenbuconazole from a fruit juice matrix with only a QuEChERS sample preparation procedure was determined.
• Rapid separation of the target fungicides of this Application Note in less than four minutes was achieved by using 50 mm columns packed with Vanquish GOLD 1.9 µm C18 materials.
• The QuEChERS method was used without further sample preparation, such as SPE, evaporation, and resuspension, to give lower costs and faster workup.
• Recovery of all fungicides tested in this Application Note and using the modified QuEChERS method was greater than 75% with a RSD of <5% for the QC samples.
References1. Guidance document on analytical quality control and method validation and method
validation procedures for pesticides residue analysis in food and feed. European Commission SANTE/11945/2015 2015 rev 0.
2. Hollosi, L.; Bousova, K.; Ates, E.; Mittendorf, K. Thermo Fisher Scientific Application Note AN52252: Determination of Carbendazim and Benomyl Residues in Oranges and Orange Juice by Automated Online Sample Preparation Using TLX-LC-MS/MS, 2012.
3. GB 14870-1994: Maximum Residue Limits of Carbendazim in Foods; Standardization Administration of China (SAC), General Administration of Quality Supervision, Inspection and Quarantine of the People’s Republic of China: Beijing, 1994.
4. Fernandes V.C.; Domingues V.F.; Mateus, N. Determination of Pesticides in Fruit and Fruit Juices by Chromatographic Methods. J. Chromatogr. Sci., 2011, 49, 715-730.
5. Xiongfeng, H.; Qun, X.; Rohrer, J. Thermo Fisher Scientific Application Note AN 1067: Determination of Carbendazim in Orange Juice, 2016.
6. Dioumaeva, I. Agilent Application Note: 5991-0051EN: LC/MS/MS of Fungicides and Metabolites in Orange Juice with Agilent Bond Elut™ Plexa™ and Poroshell™ 120, 2012.
7. Young, M.S.; van Tran, K.; Shia, J.C.; Burgess, J.A.; Mullen, L.; Fountain, K.J. Waters Corporation Application Note 720004457EN: QuEChERS Sample Preparation for LC/MS and LC/UV Determination of Carbendazim and Other Conazole Fungicides in Orange Juice, 2012.
Comparative results For comparison, application alternatives to manual SPE have been suggested by direct injection onto turbulent flow columns2 or by means of automation.4 These methods have been applied to single fungicides and require expensive additional hardware.
The analysis of three fungicides with SPE and LC-MS/MS was shown to give an LLOQ limit of 2 ng/mL for carbendazim and two other conazole fungicides but required extensive SPE followed by dry down and concentration steps to meet the detection limits.6
The application of QuEChERS alone has been proposed before5 but was able to reach lower limits of 1 ng/mL only with carbendazim and showed 10 ng/mL with other conazole fungicides in a similar matrix.
This modified QuEChERS method required only a bench centrifuge for processing, and consumable use was limited to the solvents used for the extractions from the 50 mL tubes. Tube racking was found to make the workflow much easier to control for the batch process.
The method used here meets the major requirements of the EC guidelines on analytical quality control for pesticides residues analysis in food and drink1 and has shown applicability within related matrices.