rapid process assessment overview. ultriva’s rapid process assessment (rpa) consists of a...
TRANSCRIPT

Rapid Process Assessment Overview

Rapid Process Assessment Overview
• Ultriva’s Rapid Process Assessment (RPA) consists of a structured Business Process Analysis (BPA) engagement focused on a specific process environment led by a seasoned business analyst trained on the latest BPA solutions. We differentiate our RPA engagement from those of traditional consulting companies in the following ways:– Low Cost… our engagements are from 3 to 5 days not the 4 to 6 weeks
typically required by most consulting companies– Actionable Business Intelligence… deliverables from our engagements provide
business and technical decision makers with the information they need to make informed decisions on priorities and investments immediately following the engagement
– Creation of a Process System of Record… we leave behind everything your organization needs to manage your process on a go-forward basis
– Re-usable Engagement Artifacts… all deliverables from our engagements run on native Microsoft desktop solutions (Visio/Excel/PowerPoint)
2

Customer RPA Support Requirements
• Ultriva consultant(s) will facilitate each process mapping and analysis event. Each process mapping and analysis event will last approximately 3 – 4 hours.
• The following customer resource participation will be required in each process mapping and analysis session:– Process Owner: This individual has overall operational and financial
responsibility for the process area/business process being assessed.– Process Leader: This individual manages the team of resources that are
responsible for the day-to-day execution/support of the process area/business process being assessed.
– Process Expert(s): This individual(s) have responsibility for successful execution of the business process.
• Customer must provide the following facility support:– Pre-cleared access to plant.– Dedicated conference room for the three day RPA event .– Overhead projector.– Dry erase board and pens.
3
Customer Data Requirements
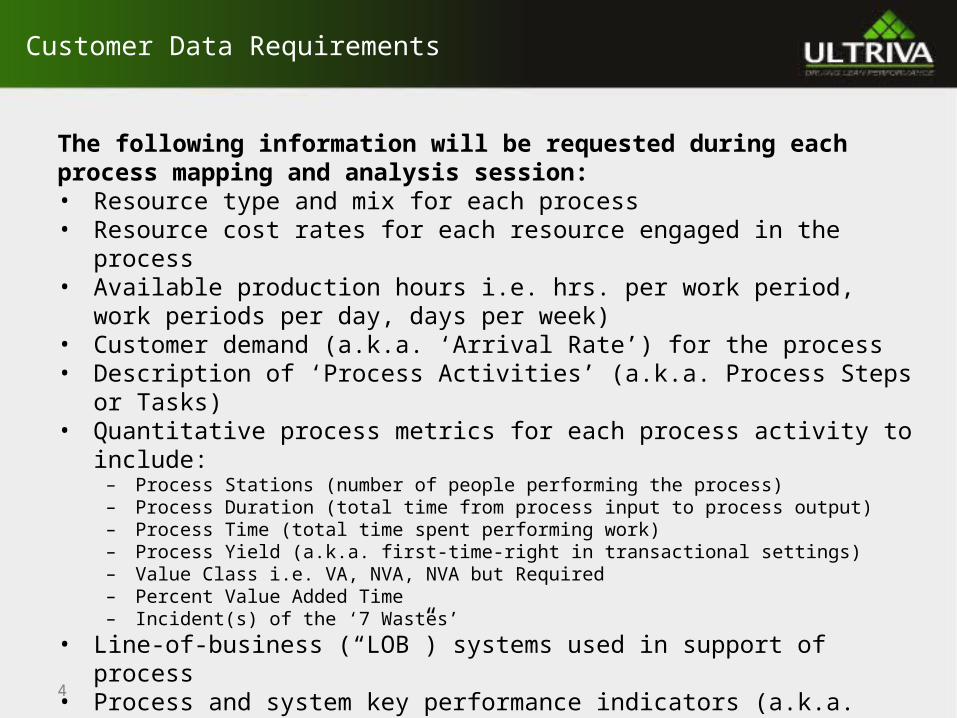
The following information will be requested during each process mapping and analysis session:• Resource type and mix for each process• Resource cost rates for each resource engaged in the process• Available production hours i.e. hrs. per work period, work periods per day, days per
week)• Customer demand (a.k.a. ‘Arrival Rate’) for the process• Description of ‘Process Activities’ (a.k.a. Process Steps or Tasks) • Quantitative process metrics for each process activity to include:
– Process Stations (number of people performing the process)– Process Duration (total time from process input to process output) – Process Time (total time spent performing work)– Process Yield (a.k.a. first-time-right in transactional settings)– Value Class i.e. VA, NVA, NVA but Required– Percent Value Added Time– Incident(s) of the ‘7 Wastes’
• Line-of-business (“LOB”) systems used in support of process• Process and system key performance indicators (a.k.a. KPI)• ‘Business Intelligence’ tools/reports used to monitor/manage the processNote: ‘Process Duration’ & ‘Process Time’ can be in the form of a ‘Constant’, ‘Range’ or ‘Estimate’ 4

RPA Schedule
• Day 1– RPA Project Kick-off– Plant Tour– Current-state Mapping & Analysis
• Material Forecasting/Planning• Material Procurement
• Day 2– Current-state Mapping & Analysis
• Supplier Management • Material Receiving• Inventory Control• 3PL/Consignment Management
• Day 3– Management Review of Preliminary Assessment Results– Edits/Revisions to Assessment– RPA Management Outbrief with Executive Sponsor and RPA
Participants
5
Rapid Process Assessment Overview
6
Rapid Process Assessment Methodology
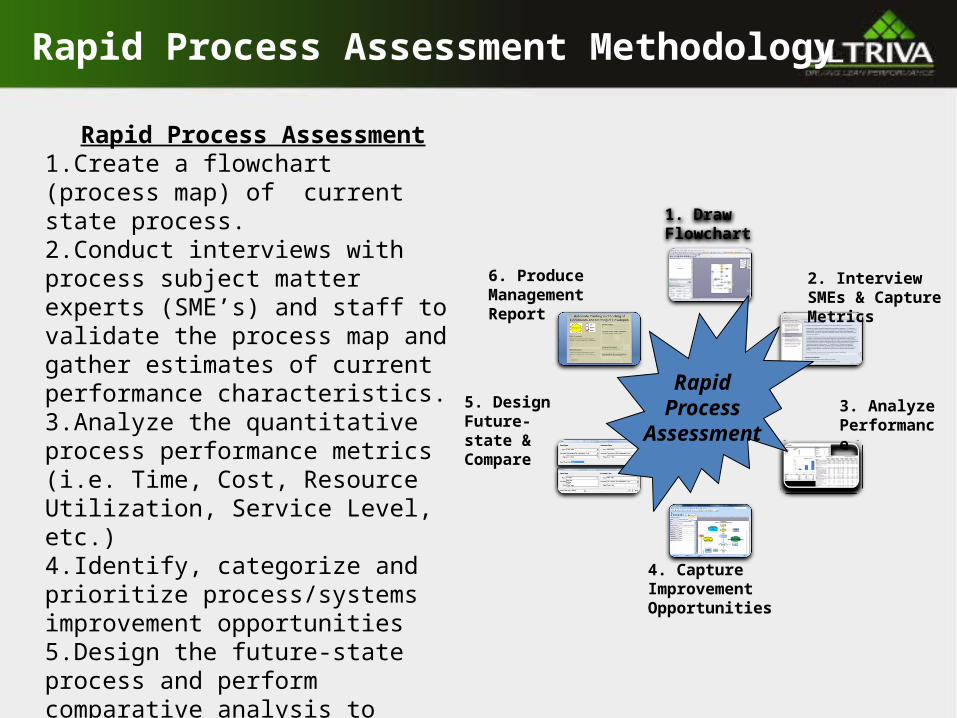
Rapid Process Assessment1.Create a flowchart (process map) of current state process.2.Conduct interviews with process subject matter experts (SME’s) and staff to validate the process map and gather estimates of current performance characteristics.3.Analyze the quantitative process performance metrics (i.e. Time, Cost, Resource Utilization, Service Level, etc.) 4.Identify, categorize and prioritize process/systems improvement opportunities5.Design the future-state process and perform comparative analysis to current state.6.Summarize findings and recommendations and create management outbrief report
1. DrawFlowchart
2. Interview SMEs & Capture Metrics
3. Analyze Performance
4. Capture Improvement Opportunities
5. Design Future-state & Compare
6. ProduceManagement Report
RapidProcess
Assessment

Rapid Process Assessment Supports DMAIC
8
Materials Management
Processes
Define
Create Flow Chart of Current-state Process
Measure
Configure Flow Chart with Process Attributes
& Capture Process Metrics
Analyze
Perform Summary and Detailed Analysis of
Current-state Performance
Improve
Design Improved Process,
Perform Comparative Analysis, Validate &
Report to Management
Control
Audit New Current-state & Repeat
Improvement Cycle As Required
Defi
ne:
Crea
te Fl
ow
Char
t of
Curr
ent-
stat
e Pr
oces
s
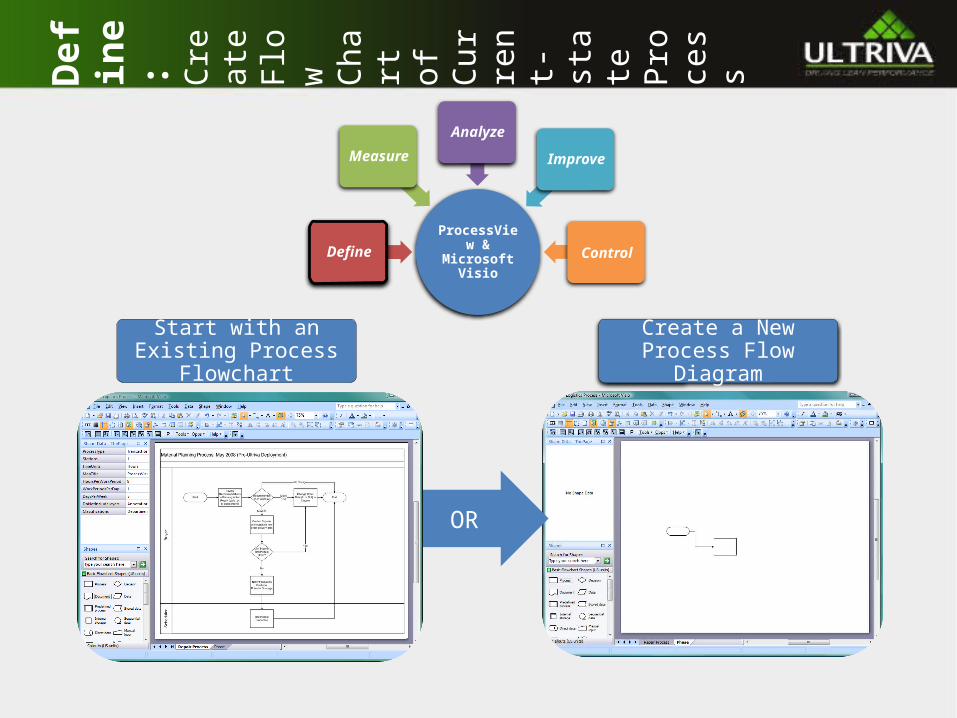
ProcessView & Microsoft VisioDefine
Measure
Analyze
Improve
Control
Create a New Process Flow Diagram
OR
Start with an Existing Process Flowchart
Mea
sure
: Confi
gure
Fl
ow
Char
t With
Pr
oces
s Att
ribu
tes
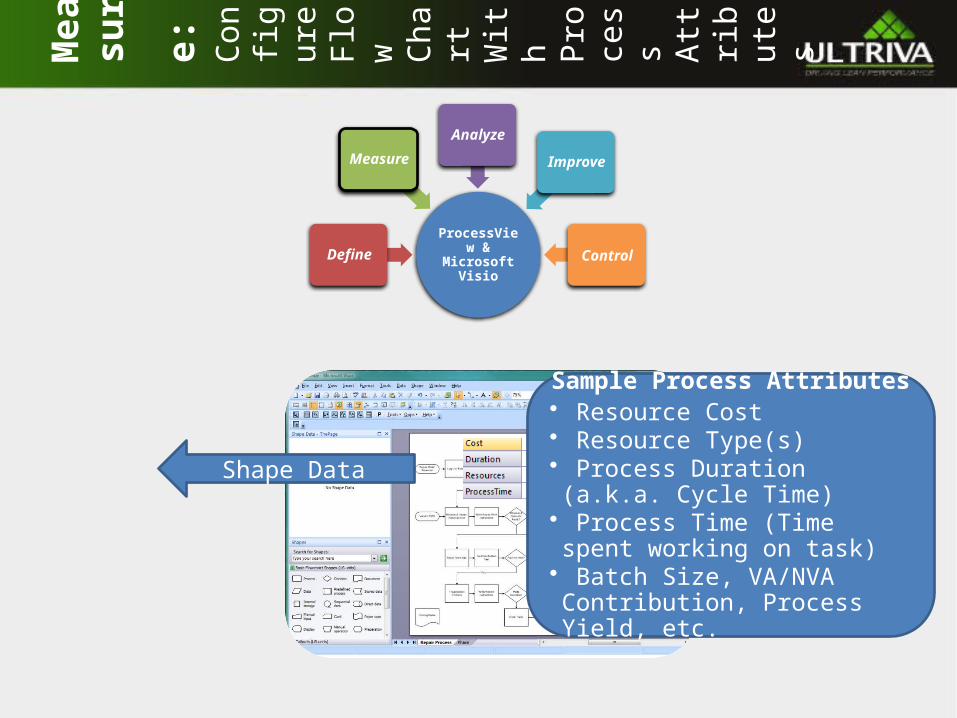
Shape Data
Sample Process Attributes• Resource Cost• Resource Type(s) • Process Duration (a.k.a. Cycle
Time)• Process Time (Time spent working
on task)• Batch Size, VA/NVA Contribution,
Process Yield, etc.
ProcessView & Microsoft VisioDefine
Measure
Analyze
Improve
Control
Primary Unit Self-Test OK?
Contact Field Rep Replacement Authorization
ProcessTime (10,30) minutes
Duration (0.5,8) hours
Obtain Replacement Unit
ProcessTime 1,(0.5.2) hours
Duration (1,5) hours
Establish Communications
ProcessTime 0
Duration (2,3) minutes
Begin Transmitting
ProcessTime 0
Duration (5,8) minutes
Yes
Enter Field Repair Order
ProcessTime 3,(2,8) minutes
Duration (5,10) minutes
No6.2%
Mea
sure
: Capt
ure
Proc
ess
Met
ric
s &
Pa
th
Prob
abili
tie
s
ProcessView & Microsoft VisioDefine
Measure
Analyze
Improve
Control
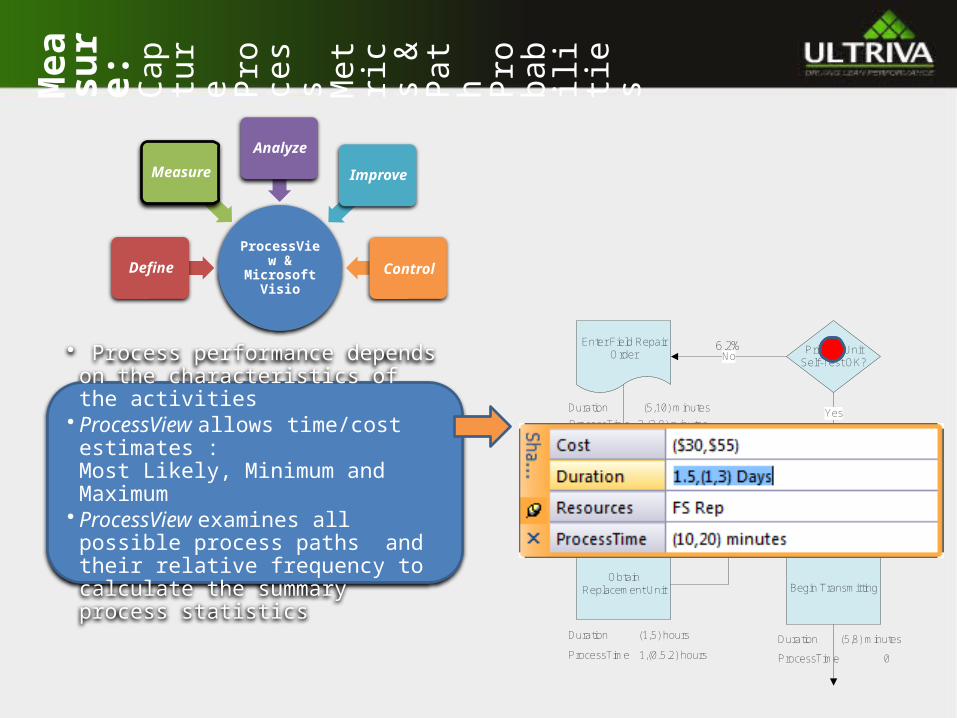
• Process performance depends on the characteristics of the activities
• ProcessView allows time/cost estimates :Most Likely, Minimum and Maximum
• ProcessView examines all possible process paths and their relative frequency to calculate the summary process statistics
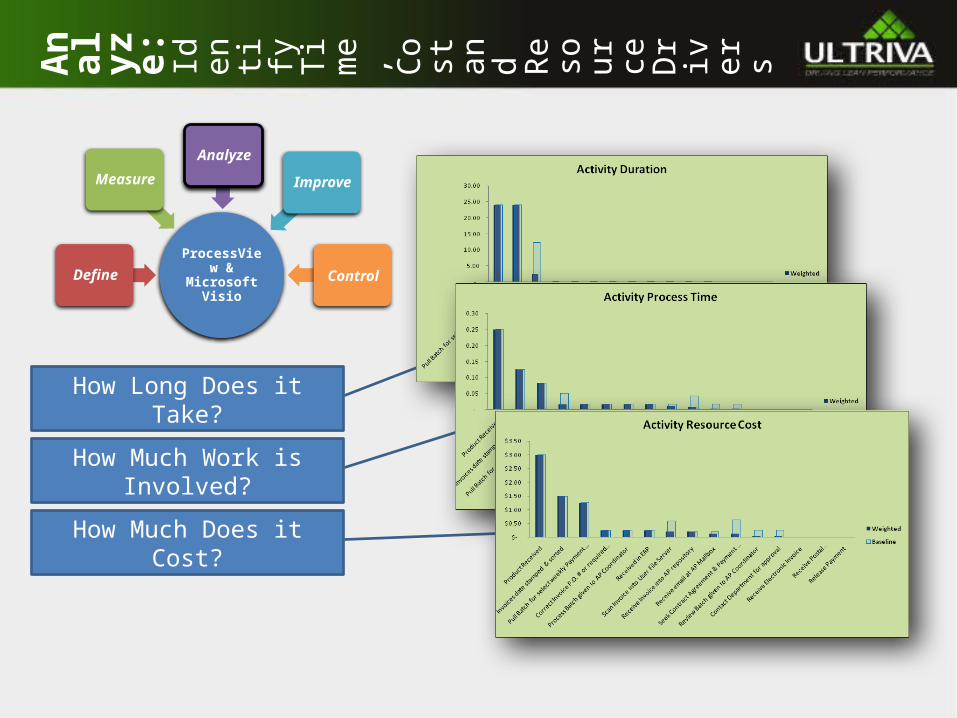
How Long Does it Take?
How Much Work is Involved?
How Much Does it Cost?
An aly
ze:
Ide
ntif
y Ti me
, Cos
t an d Res
our
ce
Dri
ver
s
ProcessView & Microsoft VisioDefine
Measure
Analyze
Improve
Control
Primary Unit Self-Test OK?
Contact Field Rep Replacement Authorization
ProcessTime (10,30) minutes
Duration (0.5,8) hours
Obtain Replacement Unit
ProcessTime 1,(0.5.2) hours
Duration (1,5) hours
Establish Communications
ProcessTime 0
Duration (2,3) minutes
Begin Transmitting
ProcessTime 0
Duration (5,8) minutes
Yes
Enter Field Repair Order
ProcessTime 3,(2,8) minutes
Duration (5,10) minutes
No6.2%
Anal
yze:
Id
ent
ify
the
Bott
len
eck
&
Impa
ct o
f Q
ueui
ng
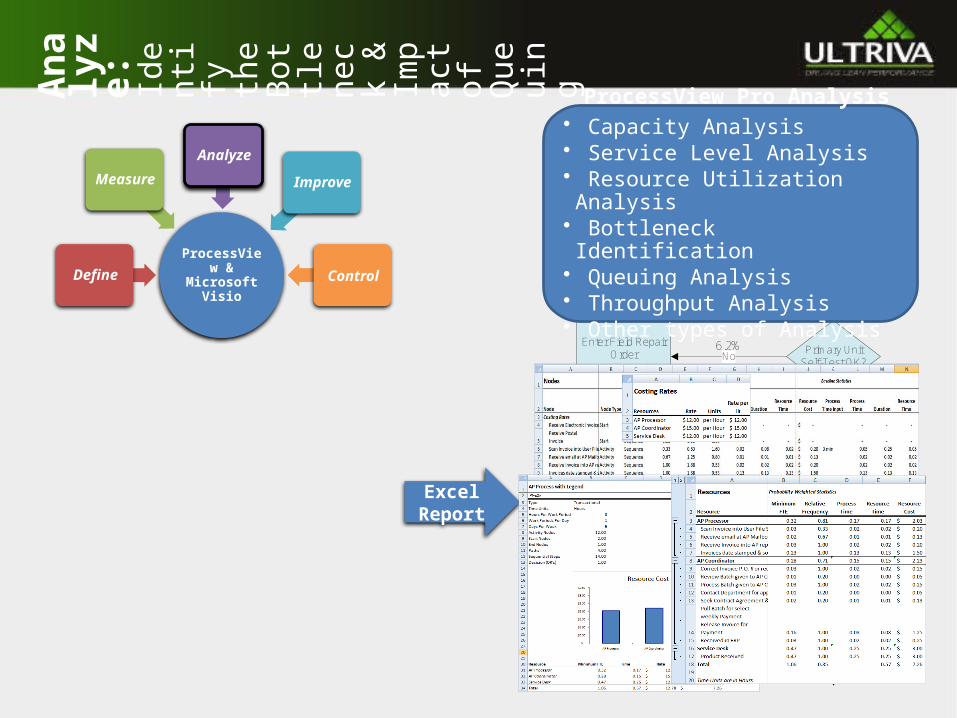
Excel Report
ProcessView Pro Analysis• Capacity Analysis• Service Level Analysis• Resource Utilization Analysis• Bottleneck Identification• Queuing Analysis• Throughput Analysis• Other types of Analysis
ProcessView & Microsoft VisioDefine
Measure
Analyze
Improve
Control

Unit Availability Logistics
Repair Order Received
Log Unit Failure
Vendor RMR UnitReceive & Inspect
Returned Unit
In-Field Repair?
Conduct In-Field Diagnostics
Perform Repair & Test Procedure
In-Field Repair Successful?
Return to Service
Scrap & Replace
Return Unit for Repair
Obvious & Cosmetic Faults?
Repair Obvious & Cosmetic Faults
Fault Verification Test
Fault Verified?
Troubleshoot Problem
Write Rework Instructions
Order Parts
Repair UnitParts
Available?
Recertification Test
Unit Certified?
Update Unit Service Record
Yes Yes
Yes
NEOF
Yes
Yes
NoSetup Test LogicEngineering Review Test
Results
Write Repair Work Instructions
Costing Rates
SummaryStatistics
Repair Order Received
Log Unit Failure
Vendor RMR UnitReceive & Inspect
Returned Unit
In-Field Repair?
Conduct In-Field Diagnostics
Perform Repair & Test Procedure
In-Field Repair Successful?
Return to Service
Scrap & Replace
Return Unit for Repair
Obvious & Cosmetic Faults?
Repair Obvious & Cosmetic Faults
Fault Verification Test
Fault Verified?
Troubleshoot Problem
Write Rework Instructions
Order Parts
Repair UnitParts
Available?
Recertification Test
Unit Certified?
Update Unit Service Record
Yes
Yes
NEOF
Yes
Yes
NoSetup Test LogicEngineering Review Test
Results
Write Repair Work Instructions
Costing Rates
Depot Repair Summary Statistics
Bottleneck
Repair Obvious & Cosmetic
Faults
Total Cost $ 2,099.51
Process Time 11.65
Cycle Time 37.35
Duration 63.84
Arrival Rate 0.6451
TimeUnits Hrs
Case: Depot Repair
Anal
yze:
Co
mp
are
Base
Ca
se
vs.
Alte
rnat
e Sc
ena
rio
Flow
cha
rts
ProcessViewDefine
Measure
Analyze
Improve
Control
Define Alternate Scenario
Unit Availability Logistics
Repair Order Received
Log Unit Failure
Vendor RMR UnitReceive & Inspect
Returned Unit
In-Field Repair?
Conduct In-Field Diagnostics
Perform Repair & Test Procedure
In-Field Repair Successful?
Return to Service
Scrap & Replace
Return Unit for Repair
Obvious & Cosmetic Faults?
Repair Obvious & Cosmetic Faults
Fault Verification Test
Fault Verified?
Troubleshoot Problem
Write Rework Instructions
Order Parts
Repair UnitParts
Available?
Recertification Test
Unit Certified?
Update Unit Service Record
Yes Yes
Yes
NEOF
Yes
Yes
NoSetup Test LogicEngineering Review Test
Results
Write Repair Work Instructions
Costing Rates
SummaryStatistics
Repair Order Received
Log Unit FailureIn-Field Repair?
Conduct In-Field Diagnostics
Perform Repair & Test Procedure
In-Field Repair Successful?
Return to ServiceUpdate Unit
Service RecordYes Yes
Costing Rates
Field Repair Summary Statistics
Bottleneck
Perform Repair &
Test Procedure
Total Cost $ 225.78
Process Time 4.24
Cycle Time 5.09
Duration 9.10
Arrival Rate 0.0972
TimeUnits Hrs
Case: Field Repair
Analyze Changes in Performance Metrics
Use ProcessView Paths Report to define the Base Case: Repair Unit at the Depot
Run a ProcessView Comparison Report

Repair Operations
Testing
Induction
Field Service
MRO Logistics
Repair Order Received
ArrivalRate 22 per week
Log Unit Failure
Vendor RMR
ArrivalRate 9 per week
Receive & Inspect Returned Unit
In-Field Repair?
Conduct In-Field Diagnostics
Perform Repair & Test Procedure
In-Field Repair Successful?
Return to Service
Scrap & Replace
Ship Unit for Repair
Obvious & Cosmetic Faults?
Repair Obvious & Cosmetic Faults
Fault Verification Test
Fault Verified?
Troubleshoot Problem
Write Rework Instructions
Order Parts
Repair UnitParts
Available?
Recertification Test
Unit Certified?
Update Unit Service Record
Yes26%
Yes68%
Yes30%
NEOF35%
Yes
Yes60%
No6%
Setup Test LogicEngineering Review Test
Results
Write Repair Work Instructions
Costing Rates
MfgSpc $41.30 per hour
TestEng $68.30 per hour
FSRep $53.30 per hour
SummaryStatistics
Bottleneck
Repair Obvious & Cosmetic
Faults
Total Cost $ 2,122.19
Process Time 10.42
Cycle Time 63.00
Duration 86.71
Arrival Rate 0.775
TimeUnits Hrs
Ship Repaired Unit
ProcessView helps you capture information about each Improvement
Opportunity
Imp
rove
: Capt
ure
Im
pro
vem
ent
O
ppor
tuni
ties
&
Det
ail
s in
Vi
sio
Add Improvement Opportunity Shapes to the Flowchart
ProcessViewDefine
Measure
Analyze
Improve
Control
Root Cause Analysis of
Scrap
Increase Proportion of Repairs Done
In Field
Eliminate Pink Copy
Create Std Repair
Instructions

Repair Operations
Testing
Induction
Field Service
MRO Logistics
Repair Order Received
ArrivalRate 22 per week
Log Unit Failure
Vendor RMR
ArrivalRate 9 per week
Receive & Inspect Returned Unit
In-Field Repair?
Conduct In-Field Diagnostics
Perform Repair & Test Procedure
In-Field Repair Successful?
Return to Service
Scrap & Replace
Ship Unit for Repair
Obvious & Cosmetic Faults?
Repair Obvious & Cosmetic Faults
Fault Verification Test
Fault Verified?
Troubleshoot Problem
Write Rework Instructions
Order Parts
Repair UnitParts
Available?
Recertification Test
Unit Certified?
Update Unit Service Record
Yes26%
Yes68%
Yes30%
NEOF35%
Yes
Yes60%
No6%
Setup Test LogicEngineering Review Test
Results
Create Std Repair
Instructions
Root Cause Analysis of
Scrap
Write Repair Work Instructions
Costing Rates
MfgSpc $41.30 per hour
TestEng $68.30 per hour
FSRep $53.30 per hour
SummaryStatistics
Bottleneck
Repair Obvious & Cosmetic
Faults
Total Cost $ 2,122.19
Process Time 10.42
Cycle Time 63.00
Duration 86.71
Arrival Rate 0.775
TimeUnits Hrs
Increase Proportion of Repairs Done
In Field
Ship Repaired Unit
Eliminate Pink Copy
Imp
rove
: Prod
uce
Au
tom
ated
M
ana
gem
ent
O
utbr
ief
s in
Po
wer
Poin
t
ProcessViewDefine
Measure
Analyze
Improve
Control
Select Management Outbrief ReportProcessView Writes Outbrief to PowerPoint
Select Improvements for Reporting
2/2/2010
Event Description:
Reason for Event
Process Owner:
Dir. Manufacting
Potential Team Leaders & Members:
Implementation Cost:Type Implementation Cost Here
Resultant Cost Savings/Avoidance:Type Savings/Cost Avoidance Here
Standardize repair lineups for common repairs
Reduce rework, improve quality, eliminate unnecessary operations
•Manufacturing IE
Create Std Repair Instructions
Create Std Repair
Instructions
2/2/2010
Event Description:
Reason for Event
Process Owner:
Dr. Mfg
Potential Team Leaders & Members:
Implementation Cost:Type Implementation Cost Here
Resultant Cost Savings/Avoidance:Type Savings/Cost Avoidance Here
Find root causes for having to scrap vs. repair units
Reduce cost
•Chief Engineer, Field Svc Rep, Mfg IE, Cost Analyst
Root Cause Analysis of Scrap
Root Cause Analysis of
Scrap
ProcessView
2/2/2010
Event Description:
Reason for Event
Process Owner:
Dir. Engineering
Potential Team Leaders & Members:
Implementation Cost:Type Implementation Cost Here
Resultant Cost Savings/Avoidance:Type Savings/Cost Avoidance Here
Increase the repairability and capability for in-field repair
Reduce Cycle Time, Cost; Increase Unit Availability
•Eng. Design, Field Svc Mgr., Cost Analyst, Qualtiy
Increase Proportion of Repairs Done In Field
Increase Proportion of Repairs Done
In Field
2/2/2010
Event Description:
Reason for Event
Process Owner:
Dir. Logistics Field Services
Potential Team Leaders & Members:
Implementation Cost:Type Implementation Cost Here
Resultant Cost Savings/Avoidance:Type Savings/Cost Avoidance Here
Eliminate the legace filing of the "pink copy"
Reduce waste, overhead
•APAC Field Svc Mgr,APAC FS Rep,APAC QA Rep
Eliminate Pink Copy
Eliminate Pink Copy
Next Steps
17
Contact us to schedule your assessment today:
Greg [email protected]
Ultriva Main [email protected]