rapid determination of flavonoids and phenolic acids in
TRANSCRIPT

Food Chemistry 228 (2017) 106–115
Contents lists available at ScienceDirect
Food Chemistry
journal homepage: www.elsevier .com/locate / foodchem
Rapid determination of flavonoids and phenolic acids in grape juices andwines by RP-HPLC/DAD: Method validation and characterization ofcommercial products of the new Brazilian varieties of grape
http://dx.doi.org/10.1016/j.foodchem.2017.01.1370308-8146/� 2017 Elsevier Ltd. All rights reserved.
⇑ Corresponding author.E-mail address: [email protected] (M.d.S. Lima).
Carla Valéria da Silva Padilha a,d, Gabriela Aquino Miskinis a, Marcelo Eduardo Alves Olinda de Souza a,Giuliano Elias Pereira b, Débora de Oliveira c, Marilde Terezinha Bordignon-Luiz d, Marcos dos Santos Lima a,⇑a Instituto Federal do Sertão Pernambucano, Departamento de Tecnologia em Alimentos, Campus Petrolina, Rod. BR 407 Km 08, S/N, Jardim São Paulo, CEP 56314-520 Petrolina,PE, Brazilb Empresa Brasileira de Pesquisa Agropecuária – Embrapa Semiárido/Uva e Vinho, Rodovia BR 428, Km 152, CP 23, CEP 56302-970 Petrolina, PE, BrazilcUniversidade Federal de Santa Catarina, Departamento de Engenharia Química e de Alimentos, Campus Trindade, Trindade, 88040-900 Florianópolis, SC, BrazildUniversidade Federal de Santa Catarina, Departamento de Ciência e Tecnologia de Alimentos, Rod. Admar Gonzaga 1346, Itacorubi, 88034-001 Florianópolis, SC, Brazil
a r t i c l e i n f o
Article history:Received 23 November 2016Received in revised form 26 January 2017Accepted 27 January 2017Available online 30 January 2017
Keywords:Bioactive compoundsAntioxidant activityVitis labrusca L.Reactive oxygen species
a b s t r a c t
A method for rapid determination of phenolic compounds by reversed-phase high-performance liquidchromatography (RP-HPLC), using a new column of faster resolution was validated and used to charac-terize commercial products produced with new grape Brazilian varieties of Northeast of Brazil. Thein vitro antioxidant activity was also measured. The method showed linearity (R > 0.9995), good precision(CV% < 2.78), recovery (91.8–105.1%) and limits of detection (0.04–0.85 mg L�1) and quantification (0.04–1.41 mg L�1) according to other methods previously published with the difference of a run time of only25 min. The results obtained in the characterization of the samples differed for juices and wines fromother world regions, mainly because of the high values of (�)-epigallocatechin and trans-caftaric acid.The products analyzed showed high antioxidant activity, especially the wine samples with values higherthan those from wines of different regions of the world.
� 2017 Elsevier Ltd. All rights reserved.
1. Introduction
Phenolic compounds are important plant metabolites present ingrapes and derivatives such as wine and juices. These substancesare related to sensory characteristics, chemical stability and asso-ciated with various health benefits for consumers of such products(Camargo, Regitano d’Arce, Biasoto, & Shahidi, 2014; Garrido &Borges, 2013; Toaldo et al., 2015). In terms of quantity, the majorphenolics present in wines and juices belongs to the families of fla-vanols, anthocyanins and phenolic acids (Granato, Koot, Schnitzler,& van Ruth, 2015; Leeuw, Kevers, Pincemail, Defraigne, & Dommes,2014; Lima et al., 2014).
The main flavanols found in wines and grape juices are catechin,epicatechin, epigallocatechin and procyanidins B1, B2 and B3, com-pounds associated with taste and various bioactive properties asin vitro antioxidant activity and in vivo antimicrobial and anti-inflammatory (Granato, Carrapeiro, Fogliano, & van Ruth, 2016;Leeuw et al., 2014; Scola et al., 2010). Anthocyanins are the main
substances responsible for the color in wine and grape juices.The main anthocyanins present in wines and juices are malvidin,cyanidin, peonidin, delphinidin, petunidin and pelargonidin, whichvarieties Vitis vinifera L. and Vitis labrusca L. predominate in theforms of 3-monoglucoside and 3,5-diglucoside, respectively(Garrido & Borges, 2013; Lambri et al., 2015; Nixdorf & Hermosín-Gutiérrez, 2010). In products made from hybrid varieties(Vitis vinifera L. � Vitis labrusca L.) the presence of anthocyaninsoccurs in a mixture of mono and diglucosides (Granato et al.,2015; Lima et al., 2014). Phenolic acids are divided into hydroxy-benzoic (HBA) and hydroxycinnamic (HCA). The main HBA acidspresent in juices and wines are protocatechuich, vanillin, gallicand syringic, and the main HCA are q-coumaric, caffeic, ferulic,and cis and trans cinnamic acid: caftaric, cutaric and fertaric(Garrido & Borges, 2013; Granato et al., 2016; Leeuw et al., 2014;Toaldo et al., 2015).
The Sub-middle São Francisco Valley (SFV), located in theNortheast of Brazil, is a Brazilian region that has invested in theproduction of grape juices with new Brazilian varieties developedto produce high quality juices, as the ‘‘Isabel Precoce” (Vitislabrusca L.) and hybryds (Vitis vinifera L. � Vitis labrusca L.) ‘‘BRS
C.V.d.S. Padilha et al. / Food Chemistry 228 (2017) 106–115 107
Violeta”, ‘‘BRS Cora” and ‘‘BRS Magna” (Lima et al., 2014), wherecurrently five companies produce about 1.5 million liters/year ofcommercial juices with these varieties. Grape juice in this regionhave been highlighted by the good bioactive content, high antiox-idant activity associated with phenolic compounds, improving theergogenic effect in recreational runners, in vivo antioxidant activityand possible reduction of inflammatory markers associated withits consumption (Camargo et al., 2014; Lima et al., 2014, 2015;Natividade, Corrêa, Souza, Pereira, & Lima, 2013; Silva et al.,2015; Toscano et al., 2015). Because Brazil is a large consumer ofVitis labrusca L. wines and hybrids, three companies in the SFVbegan producing wines with the new Brazilian grape varieties.There was not found information on the phenolic compositionand potential bioactive of the products of this region.
In recent years methods for rapid determination of phenoliccompounds in grape juice and wine have been published. In mostcases these compounds are analyzed by Reversed-Phase High-Performance Liquid Chromatography (RP-HPLC) using a RP-C18column types Core-Shell or rapid resolution (RR) for separatingcompounds (Dias, David, & David, 2016; Fontana, Antoniolli, &Bottini, 2016; Manns & Mansfield, 2012). However, it was notfound studies describing a methodology for determination of phe-nolic compounds in wines and grape juices using an RR type col-umn RP-C18 (100 � 4.6, 3.5 lm), being necessary to carry outwork to implement this type of column for analysis in these matri-ces as its presents an option for quick analysis. The rapid separa-tion of compounds on reversed phase columns decreases theruntime of the methods, the use of solvents and ultraviolet detec-tors lamps (UV), photodiode array (DAD) and fluorescence (FD),while minimizing wear on various HPLC system components.
In this context, the objective of this study was to validate amethodology for rapid determination of flavanols, anthocyaninsand phenolic acids in grape juice and wine by RP-HPLC/DAD usinga new column RR RP-C18 type (100 � 4.6 mm, 3.5 lm) and then toapply the validated method to characterize samples of grape juiceand commercial wines produced with the new grape Brazilian vari-eties. In addition, in vitro activity of the studied compounds wasmeasured.
2. Material and methods
2.1. Chemicals and standards
Trolox (6-hydroxy-2,5,7,8-tetramethylchroman-2-carboxylicacid), 2,20 -azino-bis (3-ethylbenzothiazoline-6-sulphonic acid)(ABTS) and 2,2-diphenyl-1-picrylhydrazyl (DPPH) radicals werepurchased from Sigma-Aldrich (St. Louis, MO, USA). Folin-Ciocalteu reagent, ethyl alcohol, phosphoric acid, monopotassiumphosphate and potassium persulfate were obtained from Merck(Darmstadt, Germany). Methanol was supplied by J.T. Baker(Phillipsburg, NJ, USA). Ultrapure water obtained from a Milli-Qsystem (Millipore, Bedford, MA, USA) was used to prepare allsolutions. Standards included gallic, syringic, q-coumaric, caffeicand trans-caftaric acid, (+)-catechin, (�)-epicatechin gallate,(�)-epigallocatechin, procyanidin B1 and B2, cyanidin3,5-diglucoside, malvidin 3,5-diglucoside, pelargonidin 3,5-diglucoside from Sigma-Aldrich (St. Louis, MO, USA). Malvidin3-O-glucoside and peonidin 3-O-glucoside from Extrasyntese(Genay, France).
2.2. Samples
To validate the methodology, commercial samples of grapejuice and wine from new cultivars of Brazilian grapes from SFVwere analyzed. The samples characterization was carried out using
the previously validated method, where 8 commercial productsfrom local industries were collected. For each sample 3 bottles ofdifferent batches were purchased, totalizing 24 samples. The com-mercial products correspond to 5 labels of grape juice, coded asGJA, GJB, GJC, GJD e GJE and 3 of red wines, coded as WF, WG, WH.
According to the information by the industries the juices wereelaborated with the grapes: Isabel Precoce e BRS Cora (samplesGJA and GJB); Isabel Precoce e BRS Magna (sample GJC) e IsabelPrecoce e BRS Violeta (samples GJD and GJE). The grapes used inthe preparation of the wines were: Isabel Precoce e BRS Cora (sam-ples WF and WG) and Isabel Precoce e Bordô (sample WH). Classi-cal analyses of pH, soluble solids and titratable acidity were carriedout for samples of grape juice. Values varied from 3.07 to 3.58(pH); 16.3 to 21.9 �Brix (soluble solids); and 5.8 to 8.6 g L�1 of tar-taric acid equivalent (titratable acidity). Samples of wine variedfrom 3.51 to 3.89 (pH) and 5.0 to 8.1 g L�1 tartaric acid equivalent(titratable acidity), respectively.
2.3. Instruments and conditions
Analyses were performed using an Agilent 1260 Infinity LC Sys-tem (Santa Clara – USA) equipped with a model G1311C quater-nary solvent pump and degasser, a thermostatted columncompartment (G1316A), autosampler (G1329B) and a diode arraydetector – DAD (G1315D). The data collect and analyses were car-ried out using the software OpenLAB CDS ChemStation Edition(Agilent Technologies, Santa Clara – USA).
The chromatographic conditions used were adapted from theearlier methodology described by Manns and Mansfield (2012).The detection of compounds was performed at 220 nm for (+)-catechin, (�)-epigallocatechin, (�)-epicatechin gallate, procyani-din B1 and procyanidin B2; 280 nm for gallic acid and syringic acid;320 nm for caftaric acid, caffeic acid and q-coumaric acid; and520 nm for malvidin 3,5-diglucoside, cyanidin 3,5-diglucoside,pelargonidin 3,5-diglucoside, peonidin 3-O-glucoside and malvidin3-O-glucoside.
The chromatograms obtained for the standard solutions of the15 studied phenolic compounds and their respective retentiontime are presented in Fig. 1. The column used was a Zorbax EclipsePlus RP-C18 (100 � 4.6 mm, 3.5 lm) (rapid resolution column) andthe pre-column was a Zorbax C18 (12.6 � 4.6 mm, 5 lm), bothmanufactured by Zorbax (USA). The oven temperature was main-tained at 35 �C, the injection volume was 20 lL (grape juice/winepreviously diluted 500 lL + 1000 lL in phase A and membrane fil-tration of 0.45 lm (Chromafil� Xtra, Macherey-Nagel – Germany))and the flow rate was 0.8 mL min�1. The gradient used in the sep-aration was 0–5 min: 5% B; 5–14 min: 23% B; 14–22 min: 26% B;22–25 min: 80% B, where solvent A was 0.1 M phosphoric acidsolution (pH 2.0) and solvent B was methanol acidified whitH3PO4 0.5%.
2.4. Method validation
The validation parameters, according to the guide for validationand analytical quality control published of the Ministry of Agricul-ture of Brazil (BRASIL, 2011), employing assays with standard solu-tions, blank samples and spiked samples, were calibration curvelinearity, specificity, precision, accuracy, recovery and limits ofdetection and quantification.
2.4.1. LinearityAn external standard calibration methodology was applied. Five
solutions with different concentrations of phenolic compoundswere prepared by consecutive dilutions in the mobile phase A froma stock solution. Calibration curves for concentration versus

Fig. 1. Chromatograms of the phenolic compounds and their respective retention time (RT). (1) Gallic acid (RT: 3.89); (2) Procyanidin B1 (RT: 6.81); (3) (�)-Epigallocatechin(RT:7.31); (4) (+)-Catechin (RT: 7.65); (5) Procyanidin B2 (RT: 8.26); (6) t-Caftaric acid (RT: 7.13); (7) Syringic acid (RT: 10.48); (8) p-Coumaric acid (RT: 13.08); (9) Cafeic acid(RT: 9.46); (10) (�)-Epicatechin gallate (RT: 14.07); (11) Cyanidin 3,5-diglucoside (RT: 9.28); (12) Pelargonidin 3,5-diglucoside (RT: 10.47); (13) Malvidin 3,5-diglucoside (RT:12.34); (14) Peonidin 3-O-glucoside (RT: 18.34); (15) Malvidin 3-O-glucoside (RT: 19.12).
108 C.V.d.S. Padilha et al. / Food Chemistry 228 (2017) 106–115
response ratio were plotted for each analyte determined from theregression analysis using the least squares method.
2.4.2. SpecificityTo assess the specificity of the method were injected samples of
red wine and grape juice. The peaks in the chromatogram obtainedfor the compounds examined were subjected to the threshold testfor assessing the purity of peak, settling the purity factor limitP990 (match factor), with software OpenLAB CDS 3D UV (AgilentTechnologies, USA). The match factor represents the degree of sim-ilarity between the spectra. The comparison of two spectra givesthe match factor, which was defined as:
MatchFactor ¼103 � P
x� y�P
x�P
y
n
� �� �2
Px2 �
Px�P
x
n
� �� �� P
y2 �P
y�P
y
n
� �� �
The values x and y are measured absorbance in the first and sec-ond spectrum, respectively, at the same wavelength; n is the num-ber of data points and R the sum of the data. Generally, valuesabove 990 indicate that the spectra are similar. Values between900 and 990 indicate there is some similarity, and below 900 indi-cate the spectra are different (Agilent, 2008).
2.4.3. Precision and recoveryThe precision was evaluated by the variation coefficient (VC%)
obtained from the results of six injections from the mixture ofgrape juice/wine spiked by the addition of external standards ofstudied compounds. The study of recovery was performed by spik-ing the same sample of grape juice/wine with standard solutionswithin the concentrations range. The recovery was calculated com-paring the values obtained for each compound ‘‘spiked” in relationto the initial value contained in sample.
2.4.4. Limit of detection (LOD) and limit of quantification (LOQ)The LOD and LOQ were obtained considering the method
described by Hubaux and Vos (1970). Three standards were pre-
pared at concentrations close to the LOD estimated and analyzedin triplicate. An analytical curve was constructed by plotting thevalues obtained from the analysis of the standards versus theactual values, obtaining the slope of the curve, intercept and coef-ficient of correlation. The residual standard deviation (RSD) wascalculated by comparing the values obtained in the analysis ofthe actual values. LOD and LOQ were established as 3 and 10 timesthe RSD, respectively, added with the intercept of the curve.
2.5. Determination of the bioactive content: total phenolics and totalmonomeric anthocyanins
The total phenolics content of the red wine and grape juice weredetermined at 765 nm after reacting with Folin-Ciocalteu reagent(Singleton & Rossi, 1965). Gallic acid was used as the standardand the phenolic concentrations in wine and juice samples wereexpressed as mg of gallic acid equivalents (GAE)/L of wine/grapejuice.
The total monomeric anthocyanins content was determinedthrough the pH-differential method described by Giusti andWrolstad (2001). The samples were diluted with buffer solutionsof KCl 0.025 M (pH 1.0) and CH3COONa 0.4 M (pH 4.5) and absor-bance measurements were performed at 520 and 700 nm, respec-tively. The total monomeric anthocyanins content was expressedas malvidin-3-glucoside equivalents in mg L�1.
2.6. Antioxidant activity
The in vitro antioxidant assays were carried out to determinethe free radical scavenging capacity using the DPPH radical (2,2-diphenyl-1-picrylhydrazyl), ABTS radical (2,20-azinobis-(3-ethylbenzothiazoline-6-sulfonic acid)) and hydrogen peroxide, accord-ing to the standard methods (Kim, Guo, & Packer, 2002; Re et al.,1999; Ruch, Cheng, & Klaunig, 1989). All analyses were performedin triplicate. The analytical standard (Trolox) was used to constructthe calibration curves (0.2–2.0 mM L�1). The results wereexpressed as Trolox equivalents per litre of product(mM TEAC L�1).

C.V.d.S. Padilha et al. / Food Chemistry 228 (2017) 106–115 109
ABTS: The ABTS radical (1 mM) was formed through the reactionof 7 mM ABTS in 140 mM potassium persulfate in the absence oflight for 16 h. The solution was then diluted in ethanol until anabsorbance of 0.700 ± 0.05. The ABTS radical scavenging activityof the samples was determined through the rate of decay in theabsorbance at 734 nm determined at time t = 0 min and at timet = 6 min after the addition of samples.
DPPH: The DPPH method the antioxidant activity of the sampleswas assessed through the rate of decay in the absorbance at517 nm. The DPPH radical solution (1 mM) was prepared in etha-nol and diluted to an absorbance of 0.900 ± 0.05. The absorbanceof the DPPH solution was determined at time t = 0 min and30 min after the addition of sample.
Hydrogen Peroxide Scavenging Activity (H2O2): A solution0.4 mol L�1 of hydrogen peroxide was prepared in phosphate buf-fer (pH 7.4) and its concentration was determined spectrophoto-metrically from absorption at 230 nm. The grape juice and redwine samples (0.4 mL) were mixed with hydrogen peroxide solu-tion (0.6 mL), and the final volume was completed to 3 mL withthe phosphate buffer. The absorbance value of the reaction mixturewas recorded at 230 nm and determined 10 min later against ablank solution containing the phosphate buffer. The scavengingactivity was calculated with the equation:
H2O2 scavenging activityð%Þ ¼ ½ðABSControl � ABSSampleÞ=ðABSControlÞ� � 100
where ABS Control is the absorbance of H2O2 radical + phosphate buf-fer and ABS Sample is the absorbance of H2O2 + sample or Trolox. Allanalyses were performed in triplicate.
2.7. Statistical analysis
Statistical analysis was performed using SPSS version 17.0 forWindows (SPSS, Chicago, USA). The results obtained in the samplescharacterization were previously evaluated in terms of normality,by Shapiro-Wilk test, and then were submitted to analysis of vari-ance (ANOVA) and Tukey test with a probability of error of 5%(Granato, Calado, & Jarvis, 2014).
3. Results and discussion
3.1. Method validation
Before validation of the method, different elution gradientswere studied for obtaining the best conditions for compounds sep-aration in the column used.
3.1.1. Linearity and specificityThe values obtained for the correlation coefficient (R) and purity
factor of the peaks (match factor) are shown in Table 1. The R-values for 15 analyzed phenolic compounds ranged from 0.9995to 1.0000 and demonstrated good linearity curves and calibration.According the values of R for calibration curves must be greaterthan 0.99, which confirms that the linearity obtained in this workfor the response to external standards is adequate for its intendedpurpose.
The specificity is the ability to have a method for measuring asubstance exactly in the presence of other components that maybe present in the sample, such as impurities, degradation productsand other matrix components (Eurochem, 2014). In this method,the specificity was evaluated with use of the threshold test usingthe spectral purity factor (match factor) for the compounds studiedin real matrices, as shown in Fig. 2 for a peak of epigallocatechin ingrape juice. The values obtained for purity factor were P990 forsyringic acid, caffeic acid, q-coumaric acid, caftaric acid, catechin
gallate, epicatechin, epigallocatechin, procyanidin B2 and peonidin3-glucoside (Table 1), indicating that the peaks obtained for thesecompounds are pure. For procyanidin B1 and malvidin 3,5-diglucoside purity factor values were 955 and 909, respectively,and indicated that there was a good possibility that the peaksobtained for these compounds are pure. The compounds of gallicacid and malvidin-3-glycoside had purity factor lower than 900,suggesting the possible existence of interference from other sub-stances in the same retention time.
Results for specificity were considered suitable for the intendedpurposes, since most of the peaks obtained for the compoundsstudied showed good spectral purity. It is also noteworthy the goodseparation obtained for simultaneous analysis of 15 phenolic com-pounds studied in a single run of 25 min.
The method used in this study was considered fast since inmethods of phenolic compounds determinations in grape juiceand wine by RP-HPLC using classical columns type RP-C18column (250 � 4.6 mm, 5 lm) runtimes times vary from 43 to86 min (Obón, Díaz-García & Castellar, 2011). Methods usingcolumns RR (150 � 4.6 mm, 3 mM) and Core-Shell(100 � 4.6 mm, 2.6 mM) runtimes covered ranged from 14 to55 min (Manns & Mansfield, 2012; Natividade et al., 2013;Tarola, Milano, & Giannetti, 2007).
3.1.2. Precision and recoveryThe values obtained for the precision (CV%) of analyzed com-
pounds ranged from 0.09 to 2.78 in grape juice matrix and from0.11 to 0.66 for red wine (Table 1). The CV% values obtained forthe 15 studied phenolic compounds were lower than the maxi-mum limit of 20% recommended by brazilian law for the concen-tration ranges studied here.
The results for the percentage of recovery of compound (RC%) inthe spiked samples are shown in Fig. 3. The RC values ranged from94.8 to 105.1 for matrix of grape juice and 91.8 to 104.5 for redwines. These values are in accordance with the limits acceptableby brazilian legislation, which is 90–107%, and were also similarto those obtained in several studies that validated methods fordetermination of phenolic compounds in wine and grape juicefor RP-HPLC with UV detection (UV) light emitting diode arrange-ments (DAD), fluorescence (FD) and mass spectrum (MS)(Natividade et al., 2013; Tarola et al., 2007).
3.1.3. Limit of detection and limit of quantificationTo obtain the LOD and LOQ values, the standard deviation val-
ues of the residues (RSD) were multiplied for 3 and 10, respec-tively, and added to the intercept of the curve next to theestimated LOD (Hubaux & Vos, 1970).
For the 15 phenolic compounds studied, the LOD and LOQ ran-ged from 0.04 to 0.85 mg L�1 and 0.04 to 1.41 mg L�1, respectively(Table 1). The LOD and LOQ values obtained in this study are inagreement with those found in other validation studies for analysisof phenolic compounds in juices and wines by HPLC-UV (Tarolaet al., 2007), HPLC-DAD (Manns & Mansfield, 2012), HPLC-DAD-FD (Natividade et al., 2013; Silva et al., 2015) and HPLC-DAD-MS,demonstrating that the studied method has good sensitivity forquantifying these compounds.
The terms limit of quantitation (LOQ) and limit of detection(LOD) is used to demonstrate the ability of the method of quanti-fying/detecting low concentrations of a substance (Eurachem,2014). The LOD and LOQ values obtained in the validation of thismethod are considered suitable for the intended purpose, sincethey were smaller than the minimum values normally reportedin the literature for characterization of samples of wine and grapejuice (Granato et al., 2015; Leeuw et al., 2014; Lima et al., 2014;Toaldo et al., 2015).
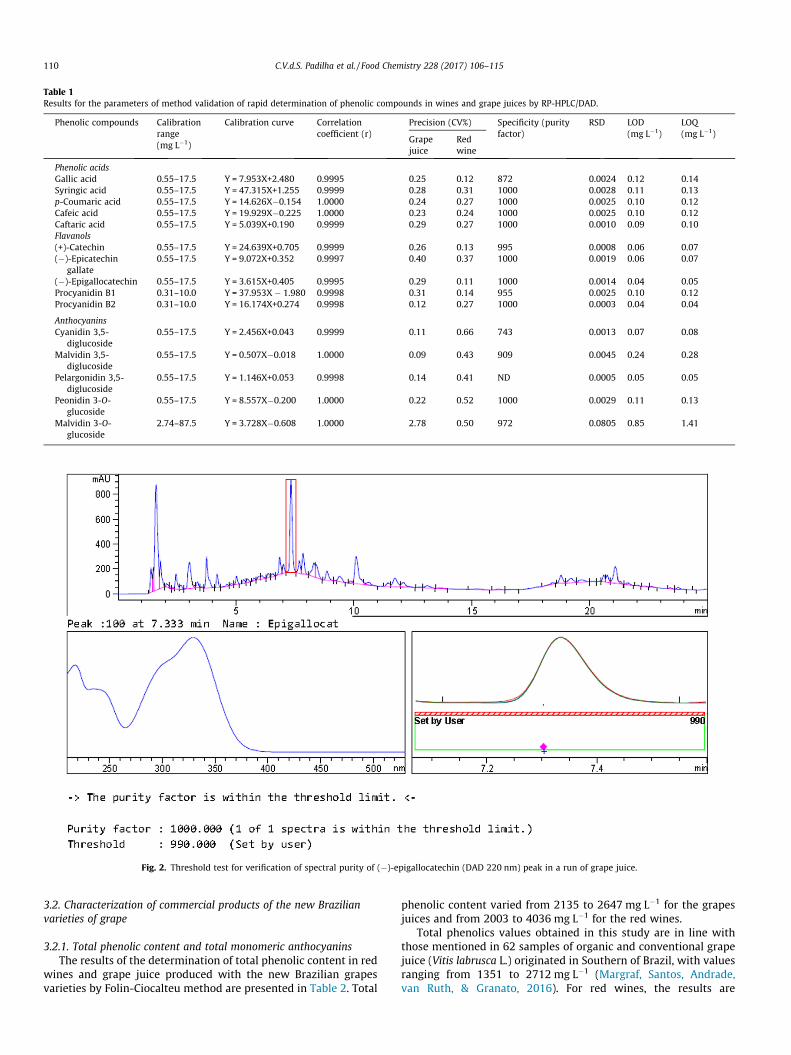
Table 1Results for the parameters of method validation of rapid determination of phenolic compounds in wines and grape juices by RP-HPLC/DAD.
Phenolic compounds Calibrationrange(mg L�1)
Calibration curve Correlationcoefficient (r)
Precision (CV%) Specificity (purityfactor)
RSD LOD(mg L�1)
LOQ(mg L�1)
Grapejuice
Redwine
Phenolic acidsGallic acid 0.55–17.5 Y = 7.953X+2.480 0.9995 0.25 0.12 872 0.0024 0.12 0.14Syringic acid 0.55–17.5 Y = 47.315X+1.255 0.9999 0.28 0.31 1000 0.0028 0.11 0.13p-Coumaric acid 0.55–17.5 Y = 14.626X�0.154 1.0000 0.24 0.27 1000 0.0025 0.10 0.12Cafeic acid 0.55–17.5 Y = 19.929X�0.225 1.0000 0.23 0.24 1000 0.0025 0.10 0.12Caftaric acid 0.55–17.5 Y = 5.039X+0.190 0.9999 0.29 0.27 1000 0.0010 0.09 0.10Flavanols(+)-Catechin 0.55–17.5 Y = 24.639X+0.705 0.9999 0.26 0.13 995 0.0008 0.06 0.07(�)-Epicatechin
gallate0.55–17.5 Y = 9.072X+0.352 0.9997 0.40 0.37 1000 0.0019 0.06 0.07
(�)-Epigallocatechin 0.55–17.5 Y = 3.615X+0.405 0.9995 0.29 0.11 1000 0.0014 0.04 0.05Procyanidin B1 0.31–10.0 Y = 37.953X � 1.980 0.9998 0.31 0.14 955 0.0025 0.10 0.12Procyanidin B2 0.31–10.0 Y = 16.174X+0.274 0.9998 0.12 0.27 1000 0.0003 0.04 0.04
AnthocyaninsCyanidin 3,5-
diglucoside0.55–17.5 Y = 2.456X+0.043 0.9999 0.11 0.66 743 0.0013 0.07 0.08
Malvidin 3,5-diglucoside
0.55–17.5 Y = 0.507X�0.018 1.0000 0.09 0.43 909 0.0045 0.24 0.28
Pelargonidin 3,5-diglucoside
0.55–17.5 Y = 1.146X+0.053 0.9998 0.14 0.41 ND 0.0005 0.05 0.05
Peonidin 3-O-glucoside
0.55–17.5 Y = 8.557X�0.200 1.0000 0.22 0.52 1000 0.0029 0.11 0.13
Malvidin 3-O-glucoside
2.74–87.5 Y = 3.728X�0.608 1.0000 2.78 0.50 972 0.0805 0.85 1.41
Fig. 2. Threshold test for verification of spectral purity of (�)-epigallocatechin (DAD 220 nm) peak in a run of grape juice.
110 C.V.d.S. Padilha et al. / Food Chemistry 228 (2017) 106–115
3.2. Characterization of commercial products of the new Brazilianvarieties of grape
3.2.1. Total phenolic content and total monomeric anthocyaninsThe results of the determination of total phenolic content in red
wines and grape juice produced with the new Brazilian grapesvarieties by Folin-Ciocalteu method are presented in Table 2. Total
phenolic content varied from 2135 to 2647 mg L�1 for the grapesjuices and from 2003 to 4036 mg L�1 for the red wines.
Total phenolics values obtained in this study are in line withthose mentioned in 62 samples of organic and conventional grapejuice (Vitis labrusca L.) originated in Southern of Brazil, with valuesranging from 1351 to 2712 mg L�1 (Margraf, Santos, Andrade,van Ruth, & Granato, 2016). For red wines, the results are

Fig. 3. Individual recovery percentage obtained for the six replicates of spiked grape juices and red wines samples analyzed under within-reproducibility conditions. (1)Gallic acid; (2) Syringic acid; (3) q-coumaric acid; (4) Cafeic acid; (5) t-Caftaric acid; (6) (+)-Catechin; (7) (�)-Epicatechin gallate; (8) (�)-Epigallocatechin; (9) Procyanidin B1;(10) Procyanidin B2; (11) Cyanidin 3,5-diglucoside; (12) Malvidin 3,5-diglucoside; (13) Pelargonidin 3,5-diglucoside; (14) Peonidin 3-O-glucoside; (15) Malvidin 3-O-glucoside.
Table 2Individual phenolic compounds of commercial grapes juices and red wines from Brazilian new cultivars (Vitis labrusca L. and hybrids) planted in the São Francisco’s Valley,Northeastern Brazil.
Phenolic compounds Grape Juice Wine
GJA GJB GJC GJD GJE WF WG WH
Phenolic acidsGallic acid 4.5 ± 0.4c 3.6 ± 2.9c 16.7 ± 3.5b 7.6 ± 1.2c 6.5 ± 1.0c 26.4 ± 1.1a 24.7 ± 1.0a 16.9 ± 2.6bSyringic acid 1.1 ± 0.1c 1.9 ± 1.0c 5.1 ± 0.5a 5.6 ± 0.4a 2.5 ± 0.3b 2.1 ± 0.2ab 2.0 ± 0.1ab 1.1 ± 0.3cp-Coumaric acid 2.2 ± 0.1e 2.6 ± 2.0de 10.0 ± 3.2bc 7.2 ± 1.8 cd 4.3 ± 0.1de 2.6 ± 0.1de 15.8 ± 0.1a 13.7 ± 2.8abCafeic acid 3.1 ± 0.4d 5.1 ± 2.7 cd 12.8 ± 1.7ab 14.9 ± 1.3a 6.7 ± 0.1bcd 3.6 ± 0.1d 18.8 ± 0.1a 11.7 ± 6.2abcCaftaric acid 274.9 ± 21.5abc 233.9 ± 179.4abc 365.5 ± 47.6a 343.0 ± 22.2ab 290.7 ± 0.3ab 6.6 ± 5.9d 167.4 ± 0.9bcd 91.3 ± 21.4 cdP
phenolic acids 285.8 ± 22.5 247.1 ± 188.0 410.1 ± 56.5 378.4 ± 26.9 310.7 ± 1.8 41.3 ± 7.4 228.7 ± 2.2 134.7 ± 33.3
Flavanols(+)-Catechin 9.4 ± 0.6b 9.1 ± 0.9b 15.0 ± 1.4b 7.4 ± 3.6b 13.6 ± 0.2b 9.8 ± 4.3b 12.8 ± 0.2b 24.5 ± 5.5a(�)-Epicatechin gallate ND 0.9 ± 0.9a ND ND 0.7 ± 0.1a 3.3 ± 3.1a ND 1.7 ± 0.9a(�)-Epigallocatechin 275.1 ± 21.5ab 232.9 ± 176.9ab 368.2 ± 46.7a 349.1 ± 25.9a 284.4 ± 0.1ab 217.7 ± 5.1ab 265.1 ± 0.0ab 128.5 ± 27.0bProcianidin B1 7.1 ± 0.0abc 4.4 ± 3.1c 9.9 ± 0.9ab 5.4 ± 2.5bc 4.2 ± 0.2bc 11.0 ± 0.3a 7.6 ± 0.0abc 6.9 ± 2.4abcProcianidin B2 5.8 ± 0.1d 9.5 ± 3.8 cd 17.0 ± 1.7ab 10.3 ± 4.9 cd 8.9 ± 0.4d 29.3 ± 0.2a 23.6 ± 0.0ab 26.3 ± 4.3aP
flavanols 297.4 ± 22.2 256.8 ± 185.6 410.1 ± 50.7 372.2 ± 36.9 311.8 ± 1.0 271.1 ± 13.0 309.1 ± 0.2 187.9 ± 40.1
AnthocyaninsCyanidin 3,5-diglucoside ND 12.8 ± 9.9bc 1.5 ± 0.5 cd 4.2 ± 1.5bcd 25.1 ± 0.0a 0.8 ± 0.8d 6.0 ± 0.0bcd 13.2 ± 5.4bMalvidin 3,5-diglucoside 8.9 ± 0.5c 9.8 ± 1.2c 11.9 ± 1.5c 17.3 ± 5.1c 136.5 ± 0.0a ND 12.2 ± 0.0c 53.7 ± 20.5bPelargonidin 3,5-
diglucosideND ND ND ND ND ND ND ND
Peonidin 3-O-glucoside 1.6 ± 0.2ab 1.5 ± 0.9ab 2.2 ± 0.9b 0.7 ± 0.1c 5.1 ± 0.0a 0.4 ± 0.1c 0.4 ± 0.0c 0.4 ± 0.1cMalvidin 3-O-glucoside 10.5 ± 1.3c 12.5 ± 3.8b 10.7 ± 3.0c 3.3 ± 0.6c 36.8 ± 0.0c 7.7 ± 0.8a 6.9 ± 0.0c 2.4 ± 0.0cP
anthocyanin 21.0 ± 2.0 36.6 ± 15.8 26.3 ± 5.9 25.5 ± 7.3 203.5 ± 0.0 8.9 ± 1.7 25.5 ± 0.0 69.7 ± 26.0
Total monomericanthocyanins�
88.4 ± 1.4c 177.9 ± 2.5bc 95.5 ± 32.1c 122.6 ± 58.0bc 370.8 ± 125.1a 59.2 ± 4.0c 201.0 ± 63.3bc 284.6 ± 120.8ab
Total phenolics§ 2507 ± 287bcd 2221 ± 256cde 2579 ± 150bc 2647 ± 287b 2135 ± 100de 4036 ± 133a 2607 ± 246bc 2003 ± 257e
Bold values refer to the sum of each colunm.Means followed by the same letters in the same lines do not differ by Tukey test at 5% probability.� Total monomeric anthocyanins quantified by the technic of difference of pH and expressed as equivalent to malvidin 3-glucoside.§ Total phenolics measured with Folin–Ciocalteu expressed as mg L�1 equivalent to gallic acid.
C.V.d.S. Padilha et al. / Food Chemistry 228 (2017) 106–115 111
consistent with the reported in the literature for commercialred wines of different world regions (range 282–3476 mg L�1)(Leeuw et al., 2014).
The values obtained for total monomeric anthocyanins by pH-differential method are also shown in Table 2. For the grape juicevalues ranged from 88.4 to 370.8 mg L�1. For red wines the antho-cyanins monomeric values ranged from 59.2 to 284.6 mg L�1. The
total monomeric anthocyanins concentrations obtained in juicesare in accordance to the reported in the literature for commercialgrape juice produced from Vitis labrusca L. cultivars in differentregions of Brazil, whose values ranged from 74 to 424 mg L�1
(Margraf et al., 2016). For wines, the values are consistent withthose reported by Lima et al. (2011) to Vitis labrusca L. cultivarBordô originated from the South State of Paraná, South of Brazil.
112 C.V.d.S. Padilha et al. / Food Chemistry 228 (2017) 106–115
3.2.2. Phenolic acidsThe results obtained for phenolic acids are shown in Table 2.
The total amount of phenolic acids ranged from 247.1 to410.1 mg L�1 for the grape juice, and 41.3 to 228.7 mg L�1 forwines. Regarding individual phenolic acids, caftaric acid was themajor compound, with values ranging from 233.9 to 365.5 mg L�1
in samples of grape juice and 6.6 to 167.4 mg L�1 in wines.Other studies that have characterized phenolic acids in grape
juice and red wine Vitis labrusca L. cultivars also mentioned the caf-taric acid as the main phenolic acid (Magro et al., 2016; Nixdorf &Hermosín-Gutiérrez, 2010; Toaldo et al., 2015). According to Pennaand Daudt (2001), caftaric acid is readily oxidisable during wineproduction steps, especially in fermentations, which could explainthe lower values found in wine samples compared with grapejuice.
The caftaric acid values obtained in the wine samples studied(6.6–167 mg L�1) are in accordance with those mentioned byNixdorf and Hermosín-Gutiérrez (2010) for wines of the varietyIsabel (Vitis labrusca) produced in South of Brazil and with therange found in wine (Vitis vinifera L.) cultivars of several classicalas Cabernet Sauvignon, Merlot, Malbec and Pinot Noir producedin several traditional countries in the production of wines likeFrance, Argentina, Chile, Italy and United States, whose values ran-ged from 23.1 to 105.6 mg L�1 (Leeuw et al., 2014).
Samples of grape juice presented values of caftaric acid (233.9–365.5 mg L�1) greater than those reported in the literature for sev-eral samples of grape juice (L. Vitis labrusca and Vitis vinifera L.),conventional, organic and biodynamic, originated from South andSoutheast of Brazil, Spain and other European countries, whoseaverage values ranged from 6.0 to 222.9 mg L�1 (Granato et al.,2015; Moreno-Montoro, Olalla-Herrera, Gimenez-Martinez,Navarro-Alarcon, & Rufián-Henares, 2015; Toaldo et al., 2015) sug-gesting that this compound may be an important chemical markerfor grape juices of the new brazilian varieties produced in the SãoFrancisco Valley (SFV), Northeast of Brazil. It is noteworthy that instudies that characterized phenolic compounds in grape juices pro-duced in Brazil’s Northeast was not evaluated the presence of caf-taric acid (Lima et al., 2014, 2015; Natividade et al., 2013; Silvaet al., 2015).
For hydroxybenzoic, gallic and syringic acids average values ofthe samples of juices range from 3.6 to 16.7 and 1.1 to 5.6 mg L�1,respectively. In wines values ranged from 1.1 to 16.9 and 2.1 to26.4 mg L�1 for syringic and gallic acids, respectively. For hydrox-ycinnamic q-coumaric and caffeic acids, average values in grapejuices ranged from 3.1 to 14.9 and 2.2 to 10 mg L�1, respectively.In wines average values for caffeic and q-coumaric acids rangedfrom 3.6 to 18.8 and 2.6 to 15.8 mg L�1, respectively.
The values obtained for the gallic, syringic, q-coumaric and caf-feic acids in samples of grape juice and wine studied are in accor-dance with those mentioned in various characterizations of grapejuices and wines produced with Vitis labrusca L. classical varietieslike Isabel, Bordô and Concord (Lima et al., 2011; Magro et al.,2016; Margraf et al., 2016; Nixdorf & Hermosín-Gutiérrez, 2010;Toaldo et al., 2015) and the above-mentioned amounts for juicesnew brazilian grape varieties cultivated in the Northeast of Brazil(Lima et al., 2014; Silva et al., 2015).
3.2.3. FlavanolsThe total flavanols quantified ranged from 256.8 to
410.1 mg L�1 in grape juice and 187.9 to 309.1 mg L�1 in red wine(Table 2). Among the main individually quantified flavanol com-pound was found epigallocatechin whose concentration variedfrom 275.1 to 368.2 mg L�1 and 128.5 to 217.7 mg L�1 for samplesin grape juice and red wine, respectively.
The epigallocatechin (PubChem CID: 72277) is a compoundunder study in grapes and derived products, which is usually fea-
tured in green tea (Camellia sinensis L.) (El-Shahawi, Hamza,Bahaffi, Al-Sibaai, & Abduljabbar, 2012). In derivatives of grapeusually the epigallocatechin gallate, as mentioned by Mattivi,Vrhovsek, Masuero, and Trainotti (2009) is referred as a majormonomeric flavanols present in Vitis vinifera grape skin extractsas Cabernet Sauvignon, Merlot, Syrah, Pinot Noir, Teroldego andMarzemino.
The epigallocatechin values obtained in the samples of wineand commercial grape juices of SFV were considered high becauserepresented between 5.37 and 14.27% of the total phenolics con-tent, respectively, indicating that this compound can deal with amajor chemical marker which characterizes the products of thisregion.
The procyanidin B2 values in grape juices ranged from 5.8 to17.0 mg L�1 and from 23.6 to 29.3 mg L�1 in wines. For procyanidinB1 values in the grape juice samples (5.8–17 mg L�1) were lowerthan in wine (23.6–29.3 mg L�1). For catechin values obtained ran-ged from 7.4 to 15 mg L�1 and 9.8 to 24.5 mg L�1 in samples ofgrape juice and wine, respectively. Regarding epicatechin gallatevalues ranged from not detected to 3.3 mg L�1 in all samples.
The values found in this study to procyanidin B1 and B2, cate-chin and epicatechin gallate are in accordance with the range ofvalues mentioned in several works that characterized grape juicesand red wines from classic Vitis labrusca cultivars as Isabel, Bordôand Concord in the South and Southeast of Brazil (Granato et al.,2015; Lima et al., 2011; Toaldo et al., 2015); also being accordingto the values mentioned above for grape juices of new varietiesof brazilian grapes planted in the Northeast of Brazil (Lima et al.,2014; Silva et al., 2015).
3.2.4. Individual anthocyaninsThe total number of individual anthocyanins quantified by
HPLC ranged from 8.9 to 203.5 mg L�1 in analyzed samples of wineand grape juice (Table 2). Among the main anthocyanins found insamples, in decreasing order, were malvidin 3.5-diglucoside,malvidin-3-O-glucoside and cyanidin 3,5-diglucoside, whichshowed heterogeneous profile in the studied commercial products,as previously noted by Lima et al. (2014) to the new brazilian juicegrape varieties.
For malvidin 3,5-diglucoside values ranged from 8.9 to136.5 mg L�1 and <LD to 53.7 mg L�1 in samples of juices andwines, respectively. The malvidin-3-O-glucoside showed valuesranging from 3.3 to 36.8 and 2.4 to 7.7 mg L�1 in grape juice andwine samples, respectively. For cyanidin 3,5-diglucoside in grapejuice and wine the range of values found varied from <LD to 13.2and 25.1 to 0.8 mg L�1, respectively.
The values obtained for anthocyanins in grape juice and winestudied here are in agreement with the values found for a rangeof commercial juices and wines produced with from V. labruscacultivars and hybrids derived from Brazil (Granato et al., 2015;Lago-Vanzela et al., 2013; Lima et al., 2015; Nixdorf & Hermosín-Gutiérrez, 2010).
3.2.5. Antioxidant activityThe in vitro antioxidant activity of grape juice and wine was
measured by sequestering methods of free radicals (DPPH andABTS) and reactive oxygen species (H2O2), both expressed as equiv-alent to Trolox in millimoles per liter of sample (mM TEAC L�1)(Fig. 4).
In grape juice samples, antioxidant activity (AOX) measured byDPPH and ABTS ranged from 10.03 to 14.38 and 12.47 to18.13 TEAC mM L�1, respectively. In red wines the values rangedfrom 10.89 to 18.28 and 17.65 to 29.21 mM TEAC L�1 to DPPHand ABTS, respectively.
The AOX-values obtained by DPPH and ABTS in the grape juicesamples studied are accordance on various papers that character-

Fig. 4. Mean values for antioxidant activity of juices produced from new Brazilian grape cultivars planted in the Sub-middle São Francisco Valley, Brazil. Mean bars followedby the same letters between juices do not differ according to the Tukey test at 5% probability.
C.V.d.S. Padilha et al. / Food Chemistry 228 (2017) 106–115 113
ized grape juices from different regions of origin, species, cultivars,cultivation systems and process conditions where the values AOXnormally reach up to 27 mM TEAC L�1 (Granato et al., 2016). Withexceptions for juices of the new brazilian grape varieties planted inthe Northeast of Brazil and juices (Vitis labrusca L.) originated fromSanta Catarina – Brazil where are mentioned values of up to54.19 mM TEAC L�1 to DPPH and ABTS (Lima et al., 2014; Toaldoet al., 2015).
Regarding the wine samples studied the AOX values were highbecause the highest value of AOX (DPPH and ABTS) found in the lit-erature was 23.17 mM TEAC L�1 in wine Vitis vinifera L. of SantaCatarina, South Brazil by the method with ABTS (Gris et al.,2011). In a study conducted by Leeuw et al. (2014) were evaluated38 classic varieties of wine samples as Cabernet Sauvignon, Merlot,Syrah, Pinot Noir and Malbec from countries like France, Italy, Uni-ted States, Chile, Australia and Argentina, where the AOX valuesranged from 3.71 to 7.67 TEAC mM L�1 by the method with DPPH.In wine cultivar Isabel (Vitis labrusca L.) produced in the states ofParaná and Rio Grande do Sul, South Brazil, the AOX values ranged2.6–6.3 mM TEAC L�1 measured with DPPH (Nixdorf & Hermosín-Gutiérrez, 2010), highlighting the high antioxidant activityobtained in commercial wines analyzed in this study.
A wide variety of in vitro antioxidant activity measurementmethods have been used for characterization of grape juice and
wine. In addition to the DPPH and ABTS, methods such as OxygenRadical Absorbance Capacity (ORAC), ThioBarbituric Acid ReactiveSubstances (TBARS) and Ferric Reducing Antioxidant Power (FRAP)has been widely used (Granato, Katayama, & Castro, 2011; Granatoet al., 2016; Gris et al., 2011; Lima et al., 2014). Few studies in theliterature have measured the antioxidant activity of productsderived from the grape by the sequestering method of hydrogenperoxide.
The ability of the samples analyzed in this study to eliminatehydrogen peroxide (H2O2) is shown in Fig. 4. The scavenging activ-ity of hydrogen peroxide ranged from 66.81 to 88.52 and 61.39 to69.54 mM TEAC L�1 in samples of wine and grape juices,respectively.
Camargo et al. (2014) evaluated the antioxidant activity ofwaste processing of grape juices (BRS Cora and Isabel Precoce)and wines (Syrah and Tempranillo) originated from the Sub-middle São Francisco Valley (SFV), Northeast Brazil, using H2O2
sequestering method and found values ranging from 143 to 167and 43.2 to 75.8 mM TEAC kg�1 by dry weight for waste grapejuices and wines, respectively.
Reactive oxygen species (ROS) include radicals such as superox-ide anion (O2
��), hydroxyl radical (HO�), perhydroxyl radical (HOO�)and non-radical hydrogen peroxide (H2O2) are associated with var-ious pathological mechanisms that contribute with diseases such
114 C.V.d.S. Padilha et al. / Food Chemistry 228 (2017) 106–115
as diabetes, cancer, cardiovascular and neurodegenerative diseases(Roleira et al., 2015). It is widely known that foods rich in phenoliccompounds, such as grape juice and wine, are usually associatedwith prevention of various diseases in humans where antioxidantactivity is related to protection mechanisms, including serving onthe inhibition of ROS (Oroian & Escriche, 2015; Roleira et al.,2015). Based on the above, there is a need to conduct larger studiescorrelating in vitro antioxidant activity for the sequesteringmethod of H2O2 radical in grape juice and wine with any protectionmechanisms to the health of consumers.
The H2O2 antioxidant activity of juices and wines studied herecan be considered high, suggesting that products made with newgrape varieties from Northeastern Brazil may have a great abilityin inhibiting ROS.
4. Conclusions
Based on the results obtained for the validation parameters, themethod for rapid determination of 15 phenolic compounds in wineand juices by RP-HPLC-DAD using a new rapid resolution columnof the type RP-C18 (100 � 4.6 mm, 3.5 lm) proved to be suitablefor use in research on these subjects. The method showed linearity,precision, accuracy, recovery and limits of detection and quantifi-cation according to other methods previously published for thedetermination of phenolic compounds by RP-HPLC, with the differ-ence of having a runtime of only 25 min. The applicability of thevalidated method was verified by characterization of phenoliccompounds in grape juices and commercial wines from new brazil-ian grape varieties, where the results differed from the productsstudied juices and wines from other world regions, mainly becauseof the high values of (�)-epigallocatechin and trans-caftaric acid.Regarding the bioactive potential, the samples showed highantioxidant activity, especially the red wine samples with the val-ues higher than of wines from different world regions. The H2O2
antioxidant activity of studied juices and wines was consideredhigh, suggesting that products made with new grape varieties ofBrazilian Northeast of Brazil may have a great ability in inhibitingROS.
Acknowledgments
The authors would like to acknowledge the Conselho Nacionalde Desenvolvimento Científico e Tecnológico (CNPq) for grantinga scholarship and the Instituto Federal do Sertão Pernambucanofor the financial support.
References
Agilent (2008). Agilent ChemStation for LC 3D Systems: Understanding YourSpectra Module. Agilent Technologies, Inc., Ed. 06/08 Waldbronn, Germany,46p. Accessible in: https://www.agilent.com/cs/library/usermanuals/Public/G2180-90024_spectra_ebook.pdf.
BRASIL (2011). Ministério da Agricultura, Pecuária e Abastecimento. Guia deValidação e Controle de Qualidade Analítica: Fármacos em Produtos paraAlimentação Animal e Medicamentos Veterinários. Secretaria de DefesaAgropecuária, Brasília, 2011. Available in: http://www.agricultura.gov.br/arq_editor/file/Laboratorio/Guia-de-validacao-controle-de-qualidade-analitica.pdf.
Camargo, A. C., Regitano d’Arce, M. A. B., Biasoto, A. C. T., & Shahidi, F. (2014). Lowmolecular weight phenolics of grape juice and wine-making by-products:Antioxidant activities and inhibition of oxidation of human LDL-cholesterol andDNA strand breakage. Journal of Agricultural and Food Chemistry, 62(50),12159–12171.
Dias, F. de. S., David, J. M., & David, J. P. (2016). Determination of phenolic acids andquercetin in Brazilian red wines from Vale do São Francisco region using liquid-liquid ultrasound-assisted extraction and HPLC-DAD-MS. Journal of the BrazilianChemical Society, 26(7), 1055–1059.
El-Shahawi, M. S., Hamza, A., Bahaffi, S. O., Al-Sibaai, A. A., & Abduljabbar, T. N.(2012). Analysis of some selected catechins and caffeine in green tea by highperformance liquid chromatography. Food Chemistry, 134, 2268–2275.
Eurachem Guide: The Fitness for Purpose of Analytical Methods – A LaboratoryGuide to Method Validation and Related Topics, (2nd ed. 2014). ISBN 978-91-87461-59-0. Available from http://www.eurachem.org.
Fontana, A. R., Antoniolli, A., & Bottini, R. (2016). Development of a highperformance liquid chromatography method based on a core-shell columnapproach for the rapid determination of multiclass polyphenols in grapepomaces. Food Chemistry, 192, 1–8.
Garrido, J., & Borges, F. (2013). Wine and grape polyphenols – A chemicalperspective. Food Research International, 54(2), 1844–1858.
Giusti, M. M., & Wrolstad, R. E. (2001). Characterization and measurement ofanthocyanins by UV–Visible spectroscopy. In Current protocols in food analyticalchemistry. New York, USA: John Wiley and Sons Inc.
Granato, D., Calado, V. M. A., & Jarvis, B. (2014). Observations on the use of statisticalmethods in Food Science and Technology. Food Research International, 55,137–149.
Granato, D., Carrapeiro, M. M., Fogliano, V., & van Ruth, S. M. (2016). Effects ofgeographical origin, varietal and farming system on the chemical compositionand functional properties of purple grape juices: A review. Trends in Food Scienceand Technology, 52, 31–48.
Granato, D., Katayama, F. C. U., & Castro, I. A. (2011). Phenolic composition of SouthAmerican red wines classified according to their antioxidant activity, retail priceand sensory quality. Food Chemistry, 129(2), 366–373.
Granato, D., Koot, A., Schnitzler, E., & van Ruth, S. M. (2015). Authentication ofgeographical origin and crop system of grape juices by phenolic compounds andantioxidant activity using chemometrics. Journal of Food Science, 80(3),C584–C593.
Gris, E. F., Mattivi, F., Ferreira, E. A., Vrhovsek, U., Pedrosa, R. C., & Bordignon-Luiz, M.T. (2011). Proanthocyanidin profile and antioxidant capacity of Brazilian Vitisvinifera red wines. Food Chemistry, 126(1), 213–220.
Hubaux, A., & Vos, G. (1970). Decision and detection limits for linear calibrationcurves. Analytical Chemistry, 42, 849–855.
Kim, Y. K., Guo, Q., & Packer, L. (2002). Free radical scavenging activity of redginseng aqueous extracts. Toxicology, 172(2), 149–156.
Lago-Vanzela, E. S., Rebello, L. P. G., Ramos, A. M., Stringheta, P. C., Da-Silva, R.,García-Romero, E., ... Hermosín-Gutiérrez, I. (2013). Chromatic characteristicsand color-related phenolic composition of Brazilian young red wines made fromthe hybrid grape cultivar BRS Violeta (‘‘BRS Rúbea”�‘‘IAC 1398–21”). FoodResearch International, 54(1), 33–43.
Lambri, M., Torchio, F., Colangelo, D., Río Segade, S., Giacosa, S., De Faveri, D. M., &Rolle, L. (2015). Influence of different berry thermal treatment conditions, grapeanthocyanin profile, and skin hardness on the extraction of anthocyanincompounds in the colored grape juice production. Food Research International,77, 584–590.
Leeuw, R., Kevers, C., Pincemail, J., Defraigne, J. O., & Dommes, J. (2014). Antioxidantcapacity and phenolic composition of red wines from various grape varieties:Specificity of Pinot Noir. Journal of Food Composition and Analysis, 36(1–2),40–50.
Lima, D. B., Agustini, B. C., Silva, E. G., Gaensly, F., Cordeiro, R. B., Fávero, M. L. D., ...Bonfim, T. M. B. (2011). Evaluation of phenolic compounds content and in vitroantioxidant activity of red wines produced from Vitis labrusca grapes. FoodScience and Technology, 31(3), 793–800.
Lima, M. D. S., Silani, I. D. S. V., Toaldo, I. M., Corrêa, L. C., Biasoto, A. C. T., Pereira, G.E., ... Ninow, J. L. (2014). Phenolic compounds, organic acids and antioxidantactivity of grape juices produced from new Brazilian varieties planted in theNortheast Region of Brazil. Food Chemistry, 161, 94–103.
Lima, M. S., da Conceição Prudêncio Dutra, M., Toaldo, I. M., Corrêa, L. C., Pereira, G.E., de Oliveira ... Ninow, J. L. (2015). Phenolic compounds, organic acids andantioxidant activity of grape juices produced in industrial scale by differentprocesses of maceration. Food Chemistry, 188, 384–392.
Magro, L., Goetze, D., Ribeiro, C. T., Paludo, N., Rodrigues, E., Hertz, P. F., ... Rodrigues,R. C. (2016). Identification of bioactive compounds from Vitis labrusca L. varietyconcord grape juice treated with commercial enzymes: improved yield andquality parameters. Food and Bioprocess Technology, 9(2), 365–377.
Manns, D. C., & Mansfield, A. K. (2012). A core-shell column approach to acomprehensive high-performance liquid chromatography phenolic analysis ofVitis vinifera L. and interspecific hybrid grape juices, wines, and other matricesfollowing either solid phase extraction or direct injection. Journal ofChromatography A, 1251, 111–121.
Margraf, T., Santos, É. N. T., Andrade, E. F., van Ruth, S. M., & Granato, D. (2016).Effects of geographical origin, variety and farming system on the chemicalmarkers and in vitro antioxidant capacity of Brazilian purple grape juices. FoodResearch International, 82, 145–155.
Mattivi, F., Vrhovsek, U., Masuero, D., & Trainotti, D. (2009). Differences in theamount and structure of extractable skin and seed tannins amongst red grapevarieties. Australian Journal of Grape and Wine Research, 15(1), 27–35.
Moreno-Montoro, M., Olalla-Herrera, M., Gimenez-Martinez, R., Navarro-Alarcon,M., & Rufián-Henares, J. A. (2015). Phenolic compounds and antioxidant activityof Spanish commercial grape juices. Journal of Food Composition and Analysis, 38,19–26.
Natividade, M. M. P., Corrêa, L. C., Souza, S. V. C., Pereira, G. E., & Lima, L. C. D. O.(2013). Simultaneous analysis of 25 phenolic compounds in grape juice forHPLC: Method validation and characterization of São Francisco Valley samples.Microchemical Journal, 110, 665–674.
Nixdorf, S. L., & Hermosín-Gutiérrez, I. (2010). Brazilian red wines made from thehybrid grape cultivar Isabel: Phenolic composition and antioxidant capacity.Analytica Chimica Acta, 659(1–2), 208–215.

C.V.d.S. Padilha et al. / Food Chemistry 228 (2017) 106–115 115
Òbon, J. M., Díaz-Garcia, M. C., & Castelllar, M. R. (2011). Red fruit juice quality andauthenticity control by HPLC. Journal of Food Composition and Analysis, 24(6),760–771.
Oroian, M., & Escriche, I. (2015). Antioxidants: Characterization, natural sources,extraction and analysis. Food Research International, 74, 10–36.
Penna, N. G., & Daudt, C. E. (2001). Comportamento de ésteres hidroxicinâmicosMaterial e Métodos. Pesquisa Agropecuária Brasileira, 1, 983–989.
Re, R., Pellegrini, N., Proteggente, A., Pannala, A., Yang, M., & Rice-Evans, C. (1999).Antioxidant activity applying an improved ABTS radical cation decolorizationassay. Free Radical Biology and Medicine, 26(9–10), 1231–1237.
Roleira, F. M. F., Tavares-Da-Silva, E. J., Varela, C. L., Costa, S. C., Silva, T., Garrido, J., &Borges, F. (2015). Plant derived and dietary phenolic antioxidants: Anticancerproperties. Food Chemistry, 183, 235–258.
Ruch, R. J., Cheng, S. J., & Klaunig, J. E. (1989). Prevention of cytotoxicity andinhibition of intercellular communication by antioxidant catechins isolatedfrom Chinese green tea. Carcinogen, 10, 1003–1008.
Silva, J. K., Cazarin, C. B. B., Correa, L. C., Batista, Â. G., Furlan, C. P. B., Biasoto, A. C. T.,... Maróstica Junior, M. R. (2015). Bioactive compounds of juices from two
Brazilian grape cultivars. Journal of the Science of Food and Agriculture, 96,1990–1996.
Scola, G., Conte, D., Spada, P. W. D. S., Dani, C., Vanderlinde, R., Funchal, C., &Salvador, M. (2010). Flavan-3-ol compounds fromwine wastes with in vitro andin vivo antioxidant activity. Nutrients, 2(10), 1048–1059.
Singleton, V. L., & Rossi, J. A. (1965). Colorimetry of total phenolics withphosphomolybdic phosphotungstic acid reagents. American Journal of Enologyand Viticulture, 16, 144–158.
Tarola, A. M., Milano, F., & Giannetti, V. (2007). Simultaneous determination ofphenolic compounds in red wines by HPLC-UV. Analytical Letters, 40(12),2433–2445.
Toaldo, I. M., Cruz, F. A., Alves, T., de, L., Gois, J. S., Borges, D. L. G., ... Bordignon-Luiz,M. T. (2015). Bioactive potential of Vitis labrusca L. grape juices from theSouthern Region of Brazil: Phenolic and elemental composition and effect onlipid peroxidation in healthy subjects. Food Chemistry, 173, 527–535.
Toscano, L. T., Tavares, R. L., Toscano, L. T., da Silva, C. S. O., de Almeida, A. E. M.,Biasoto, A. C. T., ... Silva, A. S. (2015). Potential ergogenic activity of grape juice inrunners. Applied Physiology, Nutrition & Metabolism, 40(9), 899–906.