rapid assessment program rap bulletin assessment … · email: [email protected] blanca león,...
TRANSCRIPT

RAP BULLETIN OF BIOLOGICAL ASSESSMENT SIXTEEN July 2000 1
16Rapid Assessment ProgramPrograma de Evaluación Rápida
RAP Bulletinof BiologicalAssessment
Boletín RAP
de Evaluación
Biológica
CENTER FOR APPLIED BIODIVERSITY SCIENCE (CABS)
CONSERVATION INTERNATIONAL (CI)
CI-PROPETEN
CONSEJO NACIONAL DE AREAS PROTEGIDAS
(CONAP)
CENTRO DE ESTUDIOS CONSERVACIONISTAS
(CECON)
ASOCIACION GUATEMALTECA PARA LA
CONSERVACION NATURAL (CÄNAN K�AAX)
COMISION NACIONAL DEL MEDIO AMBIENTE
(CONAMA)
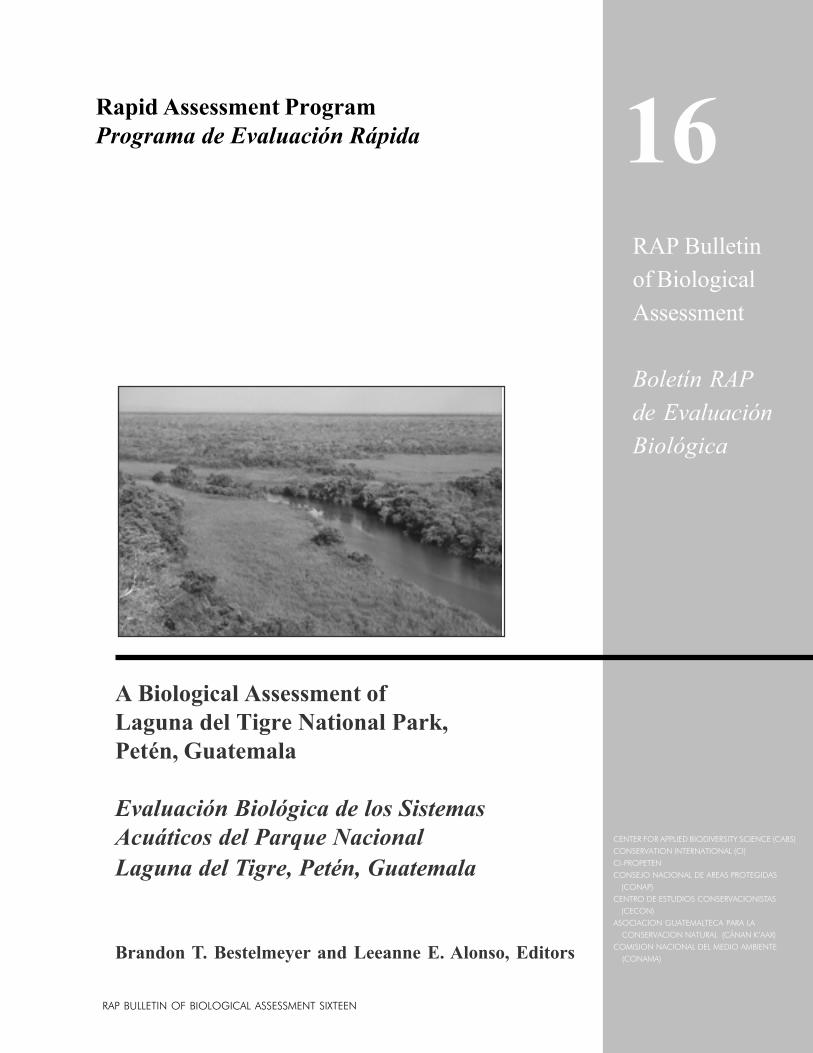
A Biological Assessment ofLaguna del Tigre National Park,Petén, Guatemala
Evaluación Biológica de los SistemasAcuáticos del Parque NacionalLaguna del Tigre, Petén, Guatemala
Brandon T. Bestelmeyer and Leeanne E. Alonso, Editors

RAP BULLETIN OF BIOLOGICAL ASSESSMENT SIXTEEN July 2000 1
16Rapid Assessment ProgramPrograma de Evaluación Rápida
RAP Bulletinof BiologicalAssessment
Boletín RAPde EvaluaciónBiológica
CENTER FOR APPLIED BIODIVERSITY SCIENCE (CABS)
CONSERVATION INTERNATIONAL (CI)
CI-PROPETEN
CONSEJO NACIONAL DE AREAS PROTEGIDAS
(CONAP)
CENTRO DE ESTUDIOS CONSERVACIONISTAS
(CECON)
ASOCIACION GUATEMALTECA PARA LA
CONSERVACION NATURAL (CÄNAN K’AAX)
COMISION NACIONAL DEL MEDIO AMBIENTE
(CONAMA)
A Biological Assessment ofLaguna del Tigre National Park,Petén, Guatemala
Evaluación Biológica de los SistemasAcuáticos del Parque NacionalLaguna del Tigre, Petén, Guatemala
Brandon T. Bestelmeyer and Leeanne E. Alonso, Editors

CONSERVATION INTERNATIONAL Rapid Assessment Program2
RAP Bulletin of Biological Assessment is published by:
Conservation International
Center for Applied Biodiversity Science
Department of Conservation Biology
2501 M Street, NW, Suite 200
Washington, DC 20037
USA
202-429-5660 tel
202-887-0193 fax
www.conservation.org
Editors: Brandon T. Bestelmeyer and Leeanne E. Alonso
Assistant Editors: Debbie Gowensmith and Carlos Rodríguez
Olivet
Design: Glenda P. Fábregas
Cover photographs: Leeanne E. Alonso
Translator: Monica Mack of Absolute Translations
Secondary translators: Francisco Castañeda Moya, Christian
Barrientos, Carlos Rodríguez Olivet, Alejandro Queral-Regil
and Glenda P. Fábregas
Conservation International is a private, non-profit organiza-
tion exempt from federal income tax under section 501 c(3) of
the Internal Revenue Code.
ISBN 1-881173-33-X
©2000 by Conservation International.
All rights reserved.
Library of Congress Card Catalog Number 00-102039
The designations of geographical entities in this publication,
and the presentation of the material, do not imply the
expression of any opinion whatsoever on the part of Conser-
vation International or its supporting organizations concerning
the legal status of any country, territory, or area, or of its
authorities, or concerning the delimitation of its frontiers or
boundaries.
Any opinions expressed in the RAP Bulletin of Biological
Assessment Series are those of the writers and do not necessar-
ily reflect those of Conservation International or its co-
publishers.
RAP Bulletin of Biological Assessment was formerly RAP
Working Papers. Numbers 1-13 of this series were published
under the previous series title.
Suggested citation:
Brandon T. Bestelmeyer and Leeanne E. Alonso (eds.). 2000.
A Biological Assessment of Laguna del Tigre National Park,
Petén, Guatemala. RAP Bulletin of Biological Assessment 16,
Conservation International, Washington, DC.
(symbol)Printed on recycled paper.
This study was funded by CI-USAID, the Global Environmental
Facility and The Rufford Foundation.
El Boletín RAP de Evaluación biológica es publicado por:
Conservation International
Centro para la ciencia de biodiversidad aplicada
Departamento de biología de conservación
2501 M Street, NW, Suite 200
Washington, DC 20037
USA
202-429-5660 tel
202-887-0193 fax
www.conservation.org
Editores: Brandon Bestelmeyer y Leeanne E. Alonso
Editores Asistentes: Debbie Gowensmith y Carlos Rodríguez Olivet
Diseño: Glenda P. Fábregas
Fotos de la carátula: Leeanne E. Alonso
Traductor: Monica Mack de Absolute Translations
Traductores secundarions: Francisco Castañeda Moya, Christian
Barrientos, Carlos Rodríguez Olivet, Alejandro Queral-Regil y
Glenda P. Fábregas
Conservation International es una organización privada, no
lucrativa exenta del impuesto sobre la renta federal bajo la Sección
501 c(3) del Código de Rentas Internas.
ISBN 1-881173-33-X
©2000 por Conservation International.
Todos los derechos reservados.
Biblioteca de número de catálogo de tarjetas del Congreso
00-1002039
Las designaciones de entidades geográficas en esta publicación y la
presentación de material no implican la expresión de ninguna
opinión por parte de Conservation International o sus
organizaciones patrocinadoras conscerniente a la condición legal de
cualquier país, territorio o área o sus autoridades, o conscerniente a
la delimitación de sus fronteras o límites.
Cualquiera de las opiniones expresadas en el Boletín RAP de las
series de evaluación biológica pertenecen a los escritores y no
necesariamente reflejan las de los miembros de Conservation
International o sus co editores.
El Boletín RAP de Evaluación biológica inicialmente
Documentación de trabajo de RAP. Los números 1-13 de esta serie
fueron publicados bajo el título anterior de series.
Cita sugerida:
Brandon Bestelmeyer y Leeanne E. Alonso (eds.). 2000.
Evaluación Biológica de los Sistemas Acuáticos del Parque
Nacional Laguna del Tigre, Petén, Guatemala. Boletín RAP de
Evaluación Biológica 16, Conservation International, Washington,
DC.
(symbol)Impreso en papel reciclado.
Este estudio fue financiado por CI-USAID y the Global Environ-
mental Facility y la Fundación Rufford.
3 RAP BULLETIN OF BIOLOGICAL ASSESSMENT SIXTEEN July 2000
TTTTTABLE OF CONTENTSABLE OF CONTENTSABLE OF CONTENTSABLE OF CONTENTSABLE OF CONTENTS
5 Participants
8 Organizational Profiles
11 Acknowledgments
12 Report at a Glance
14 Executive Summary
1 4 Introduction14 Chapter summaries17 A comparison of RAP results with previous
studies1 8 Research and conservation recommendations
20 Chapters
84 Expedition Itinerary and Gazetteer
86 Glossary
Images and Maps from the RAP Expedition
6. A rapid assessment of avifaunal diversity inaquatic habitats of Laguna del Tigre NationalPark, Petén, GuatemalaEdgar Selvin Pérez and Miriam LorenaCastillo Villeda
7. The herpetofauna of Laguna del Tigre NationalPark, Petén, Guatemala, with an emphasis onpopulations of the Morelet’s crocodile(Crocodylus moreletii)Francisco Castañeda Moya, Oscar Lara, andAlejandro Queral-Regil
8. The mammal fauna of Laguna del Tigre NationalPark, Petén, Guatemala, with an emphasis onsmall mammalsHeliot Zarza and Sergio G. Pérez
9. The ants (Hymenoptera: Formicidae) of Lagunadel Tigre National Park, Petén, GuatemalaBrandon T. Bestelmeyer, Leeanne E. Alonso, andRoy R. Snelling
1. Introduction to the RAP expedition to Lagunadel Tigre National Park, Petén, GuatemalaBrandon T. Bestelmeyer
2. The aquatic habitats of Laguna del TigreNational Park, Petén, Guatemala: waterquality, phytoplankton populations, andinsects associated with the plant SalviniaauriculataKarin Herrera, Ana Cristina Bailey, MarcosCallisto, and Jorge Ordoñez
3. The aquatic macrophyte communities ofLaguna del Tigre National Park, Petén,GuatemalaBlanca León and Julio Morales Can
4. An ichthyological survey of Laguna del TigreNational Park, Petén, GuatemalaPhilip W. Willink, Christian Barrientos,Herman A. Kihn, and Barry Chernoff
5. Hydrocarbon contamination and DNA damagein fish from Laguna del Tigre National Park,Petén, GuatemalaChristopher W. Theodorakis and John W.Bickham
Maps of the Usumacinta Basin and GuatemalaMap of RAP sampling sitesAerial photos of RAP sitesMap of the Maya Biosphere Reserve,
including Laguna del Tigre National ParkImages from the RAP expedition
20
26
35
41
49
56
61
67
75
87888990
92
93 Spanish version

CONSERVATION INTERNATIONAL Rapid Assessment Program4
183 Appendices
APPENDIX 1Aquatic sampling points of the RAP expeditionto Laguna del Tigre National Park, Petén,Guatemala.
APPENDIX 2Terrestrial sampling points of the RAP expedi-tion to Laguna del Tigre National Park, Petén,Guatemala.
APPENDIX 3Phytoplankton species identified at each aquaticsampling point in Laguna del Tigre NationalPark, Petén, Guatemala.
APPENDIX 4Density (organisms/liter) of phytoplanktonidentified at each sample point, organized byclass.
APPENDIX 5Aquatic insects associated with Salviniaauriculata, by sampling point, in Laguna delTigre National Park, Petén, Guatemala.
APPENDIX 6Plant taxa recorded in and around marshes andriparian forests in Laguna del Tigre NationalPark, Petén, Guatemala.
APPENDIX 7Fish species believed to occur in the Río SanPedro and the upper Río Candelaria basins inPetén, Guatemala.
APPENDIX 8List of fish species captured during the 1999 RAPexpedition to Laguna del Tigre National Park,Petén, Guatemala, and the focal sampling point atwhich they were collected.
APPENDIX 9List of fish species captured during the 1999 RAPexpedition to Laguna del Tigre National Park,Petén, Guatemala, and the macrohabitat in whichthey were collected.
APPENDIX 10Detailed methodology for DNA strand breakage andflow cytometry assays.
APPENDIX 11Bird species found in Laguna del Tigre NationalPark, Petén, Guatemala, during the RAP survey.
APPENDIX 12Amphibian and reptile species of Laguna del TigreNational Park, Petén, Guatemala.
APPENDIX 13Mammal species recorded within each focal area inLaguna del Tigre National Park, Petén, Guatemala.
APPENDIX 14Ant (Hymenoptera: Formicidae) species recorded inLaguna de Tigre National Park, Petén, Guatemala.
185
187
188
191
194
196
199
202
204
206
208
215
217
219

5 RAP BULLETIN OF BIOLOGICAL ASSESSMENT SIXTEEN July 2000
PARTICIPANTS
Leeanne E. Alonso, Ph.D. (myrmecology [ants])Rapid Assessment ProgramConservation International2501 M Street, NW, Suite 200Washington, DC 20037 USAemail: [email protected]
Ana Cristina Bailey (entomology)Laboratorio de Ecología SistemáticaUniversidad del Valle de Guatemala18 Avenida 11-95 Zona 15, VH. IIIApdo. Postal 8201901 Ciudad Guatemala, Guatemalaemail: [email protected]
Christian Barrientos (ichthyology, RAP protocol)CI-ProPeténCalle CentralCiudad FloresEl Petén, Guatemalaemail: [email protected]
Brandon T. Bestelmeyer, Ph.D. (myrmecology,international team leader)Department of BiologyMSC 3AF, Box 30001New Mexico State UniversityLas Cruces, NM 80003 USAemail: [email protected]
Marcos Callisto, Ph.D. (limnology)Universidade Federal de Minas Gerais ICB,Depto. Biologia GeralCP. 486, CEP. 30.161-970Belo Horizonte, MG, Brasilemail: [email protected]
Francisco Castañeda Moya (herpetology, national teamleader, RAP protocol)CI-ProPeténCalle CentralCiudad FloresEl Petén, Guatemalaemail: [email protected]
Miriam Lorena Castillo Villeda (ornithology)CI-ProPeténCalle CentralCiudad FloresEl Petén, Guatemalaemail: [email protected]
Barry Chernoff, Ph.D. (ichthyology)Department of ZoologyField MuseumRoosevelt Road at Lakeshore DriveChicago, IL 60605 USAemail: [email protected]
Javier Garcia Esquivel (RAP protocol)CONAPVilla 5 4-50, Zona 4Edificio Maya4º Nivel,Ciudad Guatemala, Guatemala
Karin Herrera (limnology)Universidad de San Carlos de Guatemala2o Nivel, Edificio T-12Ciudad UniversitariaZona 12Ciudad Guatemala, Guatemalaemail: [email protected]
CONSERVATION INTERNATIONAL Rapid Assessment Program6
Herman A. Kihn, M.Sc. (ichthyology)Centro de Estudios Conservacionistas (CECON)Unidad de InvestigaciónVida SilvestreAvenida Reforma 0-78, Zona 10Ciudad Guatemala, Guatemala
Oscar Lara, M.Sc. (herpetology, RAP protocol)CONAP4a. calle 6-17 z. 1Ciudad Guatemala, Guatemalaemail: [email protected] de BiologíaUniversidad de San Carlos de GuatemalaEdificio T-10Ciudad Universitaria, zona 12Ciudad Guatemala, Guatemalaemail: [email protected]
Blanca León, Ph.D. (botany)Museo de Historia NaturalUniversidad Nacional Mayor de San MarcosAv. Arenales 1256, Apartado 14-0434Lima-14 Peruemail: [email protected]
Mario Mancilla (RAP protocol)CANANKAXBarrio el RedentorColonia Itzá, Frente al Salón Social San BenitoPetén, Guatemalae-mail: [email protected]
Julio Morales Can (botany)Universidad de San Carlos de GuatemalaEdificio T-13, Ciudad UniversitariaZona 12Ciudad Guatemala, Guatemalaemail: [email protected]
Jorge Ordoñez (entomology)Proyecto FaunaCI-Guatemala7a-avenida 3-33Zona 9, Edificio Torre Empresarial4o nivel, oficina 406Ciudad de Guatemala, Guatemalaemail: [email protected] [email protected]
Ismael Ponciano (RAP protocol)Centro de Estudios Conservacionistas (CECON)Unidad de InvestigaciónVida SilvestreAvenida Reforma 0-78, Zona 10Ciudad Guatemala, Guatemala
Sergio G. Pérez (mammalogy)Colecciones ZoologicasMuseo de Historia NaturalUniversidad de San Carlos de GuatemalaCalle Mariscal Cruz 1-56Zona 10Ciudad Guatemala, Guatemalaemail: [email protected]

RAP BULLETIN OF BIOLOGICAL ASSESSMENT SIXTEEN July 2000 7
Alejandro Queral-Regil, M.Sc. (herpetology)11700 Old Columbia Pike, Suite 1902Silver Spring, MD 20904 USAfax: 202-547-6009email: [email protected]
Carlos Rodriguez Olivet (RAP protocol)CI-Guatemala7a-avenida 3-33Zona 9, Edificio Torre Empresarial4o nivel, oficina 406Ciudad de Guatemala, Guatemalaemail: [email protected]
Edgar Selvin Pérez (ornithology)Escuela de BiologíaUniversidad de San Carlos de GuatemalaEdificio T-10Ciudad Universitaria, zona 12Ciudad Guatemala, Guatemalaemail: [email protected]
Christopher W. Theodorakis, Ph.D. (toxicology)Texas Tech UniversityThe Institute of Environmental and Human HealthP.O. Box 41163Lubbock, TX 79409-1163 USAfax: 806-885-4577email: [email protected]
Philip W. Willink, Ph.D. (ichthyology)Fish DivisionField MuseumRoosevelt Road at Lakeshore DriveChicago, IL 60605 USAemail: [email protected]
Heliot Zarza (mammalogy)Instituto de Ecología, UNAMCircuito Ext. s/n junto al Jardín Botánico, CUAp. Postal 70-275, 04510México D.F., Méxicofax: 56 22 98 95email: [email protected]

CONSERVATION INTERNATIONAL Rapid Assessment Program8
ORGANIZAT IONAL PROFIL ES
CONSERVATION INTERNATIONALCONSERVATION INTERNATIONALCONSERVATION INTERNATIONALCONSERVATION INTERNATIONALCONSERVATION INTERNATIONALConservation International (CI) is an international, non-profitorganization based in Washington, DC. CI acts on the beliefthat the Earth’s natural heritage must be maintained if futuregenerations are to thrive spiritually, culturally, and economi-cally. Our mission is to conserve biological diversity and theecological processes that support life on earth and todemonstrate that human societies are able to live harmoni-ously with nature.
Conservation International2501 M Street, NW, Suite 200Washington, DC 20037 USA202-429-5660 (telephone)202-887-0193 (fax)http://www.conservation.org
CONSERVATION INTERNATIONAL - PROPETENCONSERVATION INTERNATIONAL - PROPETENCONSERVATION INTERNATIONAL - PROPETENCONSERVATION INTERNATIONAL - PROPETENCONSERVATION INTERNATIONAL - PROPETEN
In response to increasing threats to Guatemala’s biodiversityin its nothernmost department of the Petén, CI established aGuatemalan branch, locally known as ProPetén, in 1991. CI-ProPetén works with local communities to conserve biologicaldiversity by increasing environmental awareness and bydeveloping economic alternatives for local communities.ProPetén strives to demonstrate that local communities canlive within the Petén’s remaining forests without destroyingthem. CI-ProPetén’s efforts focus on the 1.6 million hectare(4 million acre) Maya Biosphere Reserve (MBR). Thereserve contains the majority of the forests of the largerMaya Forest, which extends into Belize and Mexico. Established in 1990, the MBR protects a number ofecosystems, most notably Laguna del Tigre National Park(LTNP), Central America’s largest freshwater wetland. LTNPhas been one of ProPetén’s highest priorities in the last threeyears. Working closely with local, national, and international
stakeholders, ProPetén has helped to create a viable parkmanagement infrastructure and has provided policy guidelinesto national authorities to mitigate impacts from humanactivities in the region. Both ProPetén scientific staff and itsScarlet Macaw Biological Station, located on the southernfrontier of Laguna del Tigre National Park, were utilizedduring the RAP expedition.
CI-ProPeténCalle CentralCiudad FloresEl Petén, Guatemala502-926-1370 (telephone)502-926-0495 (fax)
CECON: EL CENTRO DE ESTUDIOSCECON: EL CENTRO DE ESTUDIOSCECON: EL CENTRO DE ESTUDIOSCECON: EL CENTRO DE ESTUDIOSCECON: EL CENTRO DE ESTUDIOSCONSERVACIONISTAS (CENTER FORCONSERVACIONISTAS (CENTER FORCONSERVACIONISTAS (CENTER FORCONSERVACIONISTAS (CENTER FORCONSERVACIONISTAS (CENTER FORCONSERVATION STUDIES)CONSERVATION STUDIES)CONSERVATION STUDIES)CONSERVATION STUDIES)CONSERVATION STUDIES)
The Center for Conservation Studies (CECON) is aninstitution of the University of San Carlos located inGuatemala City. CECON has the following as its principalpurposes: 1) to undertake basic biological studies in Guate-mala and use such studies as a basis for national conservationefforts, which include defining policies that the nationalgovernment can use for better management of Guatemala’sprotected areas; 2) to rationally and technically manage asystem of biotopes and other protected areas for theconservation of wildlife biodiversity; and 3) to lead a nationaleffort to promote biological themes with an emphasis onconservation. CECON manages four protected biotopes in the MayaBiosphere Reserve (MBR): Laguna el Tigre-Río Escondido,Cerro Cahuí, Naachtún-Dos Lagunas, and Zotz-San MiguelLa Palotada. The Laguna del Tigre Biotope is located in thelarger Laguna del Tigre National Park and is regarded as one of

RAP BULLETIN OF BIOLOGICAL ASSESSMENT SIXTEEN July 2000 9
Guatemala’s most critical habitats. In an effort to gathermore information on the regions and use such information asa basis for future protection efforts against human activity inthe regions, CECON has played a critical role in the Lagunadel Tigre RAP expedition. Personnel from the institute andan outpost in the park were utilized during the expedition.
Centro de Estudios Conservacionistas (CECON)Avenida Reforma 0-63, Zona 10Ciudad Guatemala, Guatemala502-334-7662 (telephone)502- 334-7664 (fax)
CONAP: CONSEJO NACIONAL DE AREASCONAP: CONSEJO NACIONAL DE AREASCONAP: CONSEJO NACIONAL DE AREASCONAP: CONSEJO NACIONAL DE AREASCONAP: CONSEJO NACIONAL DE AREASPROTEGIDAS (NATIONAL COUNCIL FORPROTEGIDAS (NATIONAL COUNCIL FORPROTEGIDAS (NATIONAL COUNCIL FORPROTEGIDAS (NATIONAL COUNCIL FORPROTEGIDAS (NATIONAL COUNCIL FORPROTECTED AREAS)PROTECTED AREAS)PROTECTED AREAS)PROTECTED AREAS)PROTECTED AREAS)
Founded in 1989 as an office of the presidency of Guate-mala, the National Council for Protected Areas (CONAP) isin charge of administering all of Guatemala’s protected areas.These areas, comprised of at least eighty-one units, containjust under two million hectares, or about eighteen percent ofGuatemala’s territory. The largest unit within this system ofprotected areas is the Maya Biosphere Reserve (MBR),located in the northern Petén. Under the Maya BiosphereProject and other major initiatives in the Petén, the govern-ment of Guatemala—via CONAP—has made the region thehighest priority for national and international conservationinvestments. In 1996, CONAP declared Laguna del TigreNational Park (LTNP) and Sierra del Lacandon National Park(SLNP) its highest national priotrities. Since that time,CONAP has worked with local and international agencies—CI-ProPetén among them—to put into place managementsystems that reconcile human economic necessity witheffective conservation.
CONAMA: LA COMISION NACIONAL DELMEDIO AMBIENTE (NATIONAL COMMISSIONOF THE ENVIRONMENT)
The National Commission of the Environment (CONAMA)is a governmental agency under the executive branch of theGuatemalan government. The agency acts as an assessor,coordinator, and facilitator for all necessary actions neededto protect and improve the environment. To achieve itsgoals, it works through the various government ministries,the Secretary General of Economic Planning, variousautonomous and semi-autonomous agencies, municipalities,and the country’s private sector.
La Comisión Nacional del Medio Ambiente (CONAMA)7a. Avenida 7-09, Zona 9Ciudad Guatemala, Guatemala 01013
CÄNAN K�AAX: ASOCIACIONGUATEMALTECA PARA LA CONSERVACIONNATURAL (GUATEMALAN ASSOCIATIONFOR NATURAL CONSERVATION)
The Guatemalan Association for Natural Conservation(CÄNAN K’AAX) is a not-for-profit organization whosemembers are almost all from the Petén region. CÄNANK’AAX was formed to respond through a local perspective
Consejo Nacional de AreasProtegidas (CONAP)Villa 5 4-50, Zona 4Edificio Maya4º NivelCiudad Guatemala, Guatemala502-332-0465 (telephone)502-332-0464 (fax)

CONSERVATION INTERNATIONAL Rapid Assessment Program10
to the conservation challenges and management of protectedareas in the Petén and the larger Maya Forest. It derives itsname from the Maya Itza word for “Guardian of theForest.”
The philosophy of the association is based in theprinciple of healthy co-existence between human beings andthe environment. To realize this philosophy, its actions arebased in the development and strengthening of the capacityand attitudes of civil society and the government in order tomanage natural resources in a more sustainable manner,particularly with regards to protected areas. Presently, theassociation is dedicating itself to the co-management ofLaguna del Tigre National Park in conjunction with CONAP.
Barrio el RedentorColonia Iztá, Frente al Salón San BenitoPetén, Guatemala502-926-3732 (telephone)
ESTACION BIOLOGICA LAS GUACAMAYASESTACION BIOLOGICA LAS GUACAMAYASESTACION BIOLOGICA LAS GUACAMAYASESTACION BIOLOGICA LAS GUACAMAYASESTACION BIOLOGICA LAS GUACAMAYAS(THE SCARLET MACAW BIOLOGICAL RE-(THE SCARLET MACAW BIOLOGICAL RE-(THE SCARLET MACAW BIOLOGICAL RE-(THE SCARLET MACAW BIOLOGICAL RE-(THE SCARLET MACAW BIOLOGICAL RE-SEARCH STATION)SEARCH STATION)SEARCH STATION)SEARCH STATION)SEARCH STATION)
The Scarlet Macaw Biological Research Station, named aftera threatened bird species within Laguna del Tigre NationalPark, was established in 1996 and is a base of operations forCI’s broad conservation efforts in the most remote andthreatened sections of this protected area. The field stationaddresses both the short- and long-term conservation needsof the park. By creating a permanent and well-equippedfacility, high-quality personnel can be brought into theremote area for extended periods, enabling extensiveecological and species research to take place, which isordinarily difficult in such a remote region. Presently,collaboration with the University of San Carlos in Guate-mala provides field-based education opportunities for
Guatemalan students. Research partnerships with U.S.-based universities are also under negotiation.
Send inquiries to:CI-ProPeténCalle CentralCiudad FloresEl Péten, Guatemala502-926-1370 (telephone)502-926-0495 (fax)

11 RAP BULLETIN OF BIOLOGICAL ASSESSMENT SIXTEEN July 2000
ACKNOWLEDGMENTS
We thank Juventino Galvez, Oscar Lara, and Javier García Esquivel at the regional office of the Consejo Nacional de AreasProtegidas for their participation, dedication, and cooperation in making this expedition possible and successful. We also thankHerman Kihn and the Centro de Estudios Conservacionistas of the University of San Carlos for coordinating our use of theLaguna del Tigre Biotope and for participating in the expedition. Thanks also to Mario Mancilla and CÄNAN K’AAX for theirparticipation.
The staff at CI-ProPetén, especially Miriam Castillo, Rosita Contreras, Jorge Ordoñez, and Juan Mañuel Burgos, organizedthe logistics of the expedition. Imelda López Ascencio and Gloria Reyes Méndoza fed us extremely well, y siempre con muchastortillas deliciosas! Manuel Alvarado provided us with boats and boatmen. We thank Francisco Bosoc, Baudilio Choc, RaquelQuixchán, Victor Cohuog, David Figueroa, Carlos Girón, Federico Godoy, Ramón Manzanero, Cesar Morales, Ramiro Lucero,Roman Santiago, and José Soza for their untiring efforts in the field, for their good humor and friendship, and for sharing theirknowledge of the beautiful place in which they live. Without these friends our work would not have been possible.
We thank the following people for assistance with species identifications and other support: Mary Anne Rogers, KevinSwagel and Reeve M. Bailey (Chapter 4); Rodrigo Medellín, Fernando Cervantes, and Yolanda Hortelano (Chapter 8); andWilliam P. MacKay, John T. Longino, and Phil S. Ward (Chapter 9).
Finally, we thank Jim Nations of CI-Washington and Carlos Rodriguez and Carlos Soza of CI-ProPetén for their guidance andsupport of this endeavor. This research was supported by grants from the U.S. Agency for International Development and the Global EnvironmentalFacility to CI-ProPetén and by a grant from the Rufford Foundation to the Rapid Assessment Program (RAP) of ConservationInternational. We also thank Jay Fahn, Leslie Lee, and David and Janet Shores for supporting AquaRAP studies.

CONSERVATION INTERNATIONAL Rapid Assessment Program12
REPORT AT A GLANCE
A BIOLOGICAL ASSESSMENT OF LAGUNADEL TIGRE NATIONAL PARK, PETEN,GUATEMALA
1) Dates of StudiesRAP Expedition: 8 – 30 April, 1999
2) Description of LocationLaguna del Tigre National Park (LTNP) is located within theMaya Forest, a largely dry forest system that extends fromsouthern Mexico through northern Guatemala and Belize.LTNP occupies more than 289,000 hectares of the MayaBiosphere Reserve (MBR), which is the largest system ofmanaged and protected areas of the Maya Forest. Within theMBR, the park is the largest protected core area. Thewestern portion of the park is characterized by floodedsavanna wetlands and lagoons. The wetland areas wereincluded as “Wetlands of International Importance” underthe Ramsar convention in 1990 and 1999. The easternportion has more relief and possesses tall upland forestsinterspersed by low-lying forests of shorter stature anddenser undergrowth. Tall riparian forests and sawgrassmarshes line rivers within the park. The largest river withinthe park, the Río San Pedro, defines its southern boundary.This river is a tributary of the Río Usumacinta, which drainsthe Usumacinta Basin into the Gulf of Mexico. Other riverswithin the park are tributaries of the Río San Pedro,including the Río Sacluc in the east and the Río Escondido tothe west. The Río Candelaria is an independent affluent ofthe Laguna de Terminos.
3) Reason for RAP StudiesDespite the strategic importance of LTNP as a coreconservation area within the MBR, the park is extremelythreatened due to the development of core areas for oilexploitation. Human colonization of the park along roads
created for oil operations is also pressuring the park’ssystems. Additional colonization is occurring along rivercourses, particularly the Río San Pedro and Río Escondido.Some consequences of this colonization include deforesta-tion for slash-and-burn agriculture; the escape of fires intonon-target areas such as sawgrass marshes; and unregulatedhunting, fishing, and pollution. The effects of such activitieson biological diversity are likely to become severe unlessimmediate action is taken to preserve the integrity ofdesignated core areas of the MBR. Our studies highlight theregional importance of LTNP, ascertain the specific nature ofthe threats to its biological diversity, and suggest manage-ment options for areas within the park.
4) Major ResultsA great variety of both aquatic and terrestrial habitats andtaxa were observed in the course of the RAP sampling,including marshes, lagoons, rivers, streams, regeneratingforests, and pristine forests. Each habitat was evaluated withrespect to phytoplankton, aquatic insects, fish, amphibians,reptiles, ants, birds, and mammals. Environmental heteroge-neity was recognized differently by each taxon. For sometaxa, marshes were important; for others, lagoons, rivers, orcomplex forests were important. In total, we observed 647 species. We recorded rangeextensions for one mammal, three birds, and two ant species.This RAP survey provided the first species lists of ants andphytoplankton for LTNP. Remarkably, the park harborssixteen vertebrate species that are of international concernand that are listed by the International Union for theConservation of Nature (IUCN) and/or the Convention onthe International Trade of Endangered Species of Wild Faunaand Flora (CITES). Also, an extremely rare freshwater reefhabitat, composed of living and dead bivalve molluscs, wasdiscovered on the Río San Pedro. This reef harbored a uniqueassemblage of plants and animals.

RAP BULLETIN OF BIOLOGICAL ASSESSMENT SIXTEEN July 2000 13
Overall, the diversity within taxa and the representationof endemic, rare, or endangered species was great, underscor-ing the park’s value for conservation in Central America andthe park’s potential to maintain longterm ecological integrity.Further, an ecotoxicological assessment of two fish speciesrevealed an impact of mutagenic contaminants within someof the park’s aquatic ecosystems. This result confirms theneed for more intensive toxicological studies.
Numbers of species recorded:Phytoplankton: 71 speciesAquatic insects associated with Salvinia auriculata: 44 speciesPlants: 130 speciesFish: 41 speciesBirds: 173 speciesReptiles and amphibians: 36 speciesMammals: 40 speciesAnts: 112 species
New records for the region or Guatemala:Birds: 3 speciesReptiles: 1 speciesMammals: 1 speciesAnts: 2 species
5) Conservation RecommendationsLTNP as a whole needs immediate protection from defores-tation and fires in order to preserve its current high levels ofbiodiversity. Several areas within the park are of particularimportance and are threatened: flooded savannas in andaround the Laguna del Tigre Biotope, sawgrass marshesalong the ríos San Pedro and Escondido, and lagoons alongthe Xan-Flor de Luna road. The areas near the GuacamayasBiological Station, including the region near El Perú, enjoy
relatively good protection; this should be maintained. Areasnot currently inside the park boundaries but that are uniqueand should be protected include the Río Sacluc, varzea(inundated) forests near Paso Caballos, sawgrass marshessouth of the Río San Pedro, mangroves along the Río SanPedro, and a freshwater reef system east of El Naranjo.

CONSERVATION INTERNATIONAL Rapid Assessment Program14
EXECUTIVE SUMMARY
INTRODUCTION
Laguna del Tigre National Park (LTNP) and the Laguna delTigre Biotope within it are core conservation areas withinthe Maya Biosphere Reserve (MBR). These areas containamong the last remaining large tracts of Central AmericanMaya Forest. This forest and the diverse habitats it containsare in danger of disappearing within this century givencurrent rates of deforestation. The value of LTNP emergesfrom its relatively pristine state and its central locationwithin the MBR. With the advent of road-building and otherdevelopment in the area, the park’s forests, wetlands, andrivers—and the biodiversity that these habitats harbor—areunder increasing pressure from human colonization and thedevelopment of oil extraction facilities within the park. Theprimary objectives of this Conservation International (CI)Rapid Assessment Program (RAP) expedition were toaugment the LTNP biodiversity database, highlight thepark’s regional importance, evaluate the nature of the threatsto animals and plants within the park, and provide thisinformation to natural resource managers and decision-makers. Other objectives included bringing internationalattention to an important scientific resource, theGuacamayas Biological Station (GBS), a research stationlocated near the southern boundary the park, and traininglocal students in species identification and ecologicalmonitoring techniques. The ecological work focused ondocumenting the biodiversity value of several aquatic andterrestrial taxa in the park, investigating the relationshipsbetween taxa and different habitats and areas of the park inorder to ascertain those areas’ conservation value, andevaluating the potential effects of ongoing deforestation andpetroleum development on LTNP’s biodiversity. Through-out this project, CI has worked closely with scientists fromCI-ProPetén (CI’s Guatemala program), the Consejo
Nacional de Areas Protegidas (CONAP), and the Centro deEstudios Conservacionistas (CECON) of the University ofSan Carlos. This project was made possible by generousgrants from USAID to CI-ProPetén and from the RuffordFoundation to RAP.
This RAP expedition was unique in its emphasis onsimultaneously providing data for both aquatic and terres-trial systems. In order to characterize patterns of speciesdiversity, we sampled the following taxonomic groups:aquatic plants, fishes, phytoplankton and aquatic insects,aquatic reptiles, aquatic/riparian birds, ants, bats, androdents. Each of these taxonomic groups represent impor-tant components of biodiversity in the region and reflect awide array of ecological variation that affects biodiversity asa whole. In addition, we examined the toxicological effects ofcontaminants on individuals of two fish species using novelmolecular techniques. This component allowed us toevaluate the threats by pollution on the park’s biodiversityand on human populations connected with the park.
The RAP team examined taxa within four focal areas ofthe park that harbor varying kinds and amounts of terrestrialand aquatic habitats. These areas included sites near GBSand along the ríos San Pedro and Sacluc; within the Lagunadel Tigre Biotope along the Río Escondido; near the LagunaFlor de Luna and the Xan Petroleum operation, whereecotoxicological studies were concentrated; and finally in thevicinity of the ríos Chocop and Candelaria (see Map 3).
CHAPTER SUMMARIES
Limnology and Water Quality
The limnologists, in conjunction with botanists, provided afirst-ever classification of the diverse aquatic macrohabitats

RAP BULLETIN OF BIOLOGICAL ASSESSMENT SIXTEEN July 2000 15
of LTNP. Eight distinct habitat types representing springs,deep rivers, marshes, and lagoons were classified. Thevarying physico-chemical characteristics of these habitatsare the basis of the aquatic diversity of the park. The pH ofthe park’s waters ranged from acid (6.78) to alkaline (8.30),from turbid and dark to aquamarine, and from eutrophic tooligotrophic. This diversity is based in the common karsticgeology of the region. One unexpected discovery was thepresence of a freshwater, mollusk-based reef in the Río SanPedro near the town of El Naranjo. This reef, which mayserve to filter pollutants from the river, harbors a uniqueassemblage of invertebrates and is thus of great conservationvalue. The water quality of the park was generally good.Coliform bacteria were detected in 37% of the samples, butfecal coliform bacteria were detected in only 13% of thesamples and were associated with the use of water bodies bysettlers.
Phytoplankton composition also may be used toevaluate water quality and generally reflects variation in thephysico-chemical characteristics of aquatic habitats. Fifty-nine genera and 71 species and morphospecies wererecorded. Diatoms (Bacillariophycea), followed bychlorophytes (Chlorophyceae) and cyanophytes (Cyano-phyceae) dominated the samples. Most taxa were cosmo-politan in their distributions. Several lagoons and samplepoints in the ríos Escondido and San Pedro harboredphytoplankton species that are indicative of pollution (e.g.Microcystis aeruginosa and Synedra ulna), but high densitiesof these species were observed only at two points in the RíoSan Pedro, one site in the Río Escondido, and in the Lagunala Pista. Multivariate analyses revealed that the single mostimportant source of variation determining phytoplanktoniccomposition was pH, and the second was conductivity.Neither variable, however, was able to explain much of thevariation.
In an intensive study of an insect-plant association, 44morphospecies and 26 families of insects were found toinhabit a single aquatic plant species, Salvinia auriculata.This result highlights the great diversity of insects in thelittoral aquatic systems of the park.
Aquatic Plants
RAP botanists recorded 67 families, 120 genera, and 130species of aquatic macrophytes. Overall, the composition ofthis flora is similar to neighboring areas in the YucatánPeninsula. Two general vegetation types, marshes (sibal,mainly herbaceous plants) and riparian forest (characterizedby woody plants), form a mosaic within LTNP. Marshes,dominated by the coarse, grasslike herb Cladium jamaicense,were found to have the highest diversity of aquatic andterrestrial plants and appear to be in a constant state ofsuccession.
The Cyperaceae and Fabaceae were the most diversefamilies in LTNP, and Utricularia, an aquatic floating plantthat feeds on small invertebrates, was the most species-richgenus. The tree known as pucté (Bucida buceras) dominatesriverine forest. Associations of pucté with other plantspecies define five riparian habitat types in the park. A fewindividuals of coastal mangrove (Rhizophora mangle) foundalong the Río San Pedro may be remnants of the Pleistocene,when this area was mostly under the ocean. This populationis the most continental known in the Yucatán region. Sincethese trees are found outside the park, the mangroves maynot be protected from destruction of their habitat. Amongterrestrial habitats, the oak-dominated (Quercus oleiodes)encinal habitat is also rare. The molluscan reef habitat notedearlier harbors the rare aquatic plant Vallisneria americana.
Fishes
Fish diversity was found to have changed little from aprevious survey performed more than sixty years ago.Forty-one species of fish were recorded, and three of theseare new records for the Río San Pedro Basin. Two specieswere undescribed. Overall, many of the taxa found in thepark are endemic to the Usumacinta drainage, and protectionof the park would help to protect 25% of this fauna. Themost species-rich area was the Río San Pedro, but mostspecies were homogeneously distributed throughout thepark. Lagoons, for instance, harbored 12 species, irrespec-tive of the level of disturbance to the surrounding vegetationor the level of use by humans. Several habitats are particu-larly important to fish populations in LTNP. Sawgrassmarshes composed of Cladium jamaicense (sibal) arebreeding sites for cichlids and catfish and are abundant onthe ríos San Pedro and Escondido. A varzea-type, orflooded-forest, habitat near Paso Caballos is an importantnursery for Brycon and is generally a little-known habitat inCentral America. Finally, small streams are unique fishhabitats but are threatened by both pollution and siltationdue to deforestation. Overfishing and habitat loss to fire areimportant threats to this economically and aestheticallyvaluable fauna.
Toxicology
In addition to assessing the diversity of the fish fauna, teammembers examined the effects of toxic compounds on twowidespread fish species: Cichlisoma synspilum andThorychthys meeki. Individual fish were examined in a pondadjacent to the Xan 3 oil well and at varying distances (from5 km to 67 km) away from the source of contaminants underthe hypothesis that the oil facility was the origin of toxiccompounds. To characterize exposure to toxic compounds,two subcellular measures were used: DNA strand breakageand chromosomal breakage. These measures indicate
CONSERVATION INTERNATIONAL Rapid Assessment Program16
exposure to compounds such as polycyclic aromatichydrocarbons (PAHs), a contaminant associated with oilextraction. These techniques are unique in that they measurethe effect of exposure to toxic compounds directly, thusindicating the degree to which populations of different kindsof organisms are affected by contamination.
Some fish at the Xan 3 site showed signs of fin rot,which indicates that these individuals were stressed,possibly due to contaminant exposure. Chromosomalbreakage in C. synspilum was greater at Xan 3 than at themost distant site (in the Río San Pedro near LGBS) but wasnot greater at Xan 3 than at a nearer site. No variation inDNA breakage was apparent in C. synspilum, however. Incontrast, T. meeki exhibited high values of DNA breakage atXan 3, Laguna Buena Vista, and Laguna Guayacán and lowvalues in the Río San Pedro and Laguna Flor de Luna, whichwas the third nearest site to Xan 3 and was nearer thanGuayacán. Chromosomal breakage, however, did not vary inthis species.
Assessments of the concentration of PAHs in thesediments where fish were collected revealed that concentra-tions at Xan 3 were similar to those at reference sites. PAHconcentrations were higher at Laguna Buena Vista than atany other site. It is likely that a source of contamination isacting on fish populations, but the source or identity of thecontaminant(s) will take more work to determine. It ispossible that other kinds of contaminants which we did notmeasure are affecting fish populations, and it is unclear howthese effects may be related to either oil extraction or otherhuman influences. Nonetheless, the role of oil extraction inproducing the toxic effects cannot be ruled out. For example,patterns of redistribution of contaminants and their effectsmay be related to temporally varying hydrological connec-tions with respect to the timing of the release of contami-nants as well as the behavior of the animal species examined.Our results support the notion that contamination isoccurring in LTNP and that more intensive studies arewarranted.
Birds
The bird fauna of LTNP is exceptionally rich and consists ofseveral species of international concern. As a consequence,the wetlands of the western portion of LTNP were includedin the Ramsar list of globally important wetlands in 1990and 1999. We observed 173 species, including 11 newrecords for the park. A total of 256 species have been listedfor the park. For the first time in 10 years, a jabiru (Jabirumycteria), which is the largest bird in the Americas and isvery rare, was observed. In addition, important distributionextensions for the fork-tailed flycatcher (Tyrannus savannamonachus), the gray-breasted crake (Laterallus exilis), andthe vermilion flycatcher (Pyrocephalus rubinus) weredocumented. The western part of the park, with its flooded
savannas and shallow ponds (playones), contains uniquehabitats for wetland birds. Additionally, the Río Escondidoand Laguna la Lampara are important sites. Forest special-ists including the great curassow (Crax rubra), wrens(Trogloditidae), and woodcreepers (Dendrocolaptidae) wereabundant in bosque alto on hills and in closed riparian(gallery) forests. Overall, patterns of topography andvegetation structure are closely related to patterns ofvariation in the composition of birds within LTNP. Preserva-tion of the diversity of habitat types within LTNP,particularly the wetlands and bosques altos, is key toconserving its great bird diversity.
Aquatic Reptiles
Reptiles were surveyed near water bodies throughout thepark, with a focus on populations of the Morelet’s crocodile(Crocodylus moreletii). This animal is classified as “datadeficient”—that is, understudied—by the InternationalUnion for the Conservation of Nature (IUCN) and may be indanger of extinction due to overhunting and habitat loss. In87.14 km of shoreline surveyed, 130 crocodiles wereobserved. Lagoons had higher densities than did rivers; of thelagoons, the Flor de Luna area and La Pista had the highestdensities. The combined densities in the lagoons along theXan-Flor de Luna road are the highest yet recorded inGuatemala. The Laguna el Perú and Río Sacluc had arelatively high representation of adults, which are essentialfor the maintenance of breeding populations in the park. Asdo several fish species, crocodiles use sawgrass marsh (sibal)habitats for nesting, cover, and food; therefore, this habitat isparticularly important. Overall, crocodile populations in thepark are healthy, and monitoring programs should beinitiated immediately.
In addition, 14 species of amphibians and 22 species ofreptiles were observed. The most abundant amphibian wasthe fringe-toed foamfrog (Leptodactylus melanotus), and themost abundant reptile was the striped basilisk (Basiliscusvittatus), a Central American endemic. The beautiful andendangered Central American river turtle, or tortuga blanca(Dermatemys mawii), was observed during the expedition.The herpetology team also captured the striped spotbellysnake (Coniophanes quinquevittatus), a species that hadnever before been documented in this area. Additionalrecords of note include the red-eyed leaf-frog (Agalychniscallidryas), Baudin’s treefrog (Smilisca baudinii),Mesoamerican slider (Trachemys scripta), and Northerngiant musk turtle (Staurotypus triporcatus).
Mammals
Despite the short period of time and the difficult circum-stances for studies of mammals, 40 species were recorded,which is 30% of the potential number of species in LTNP.

RAP BULLETIN OF BIOLOGICAL ASSESSMENT SIXTEEN July 2000 17
Twenty-three species of bats, two species of primates, threespecies of carnivores, one species of perissodactyl, threespecies of artiodactyls, and eight species of rodents wereobserved. Among the bats, three species were common,including Artibeus intermedius (a large fruit-eating bat),Carollia brevicauda, and A. lituratus. Two Yucatán-endemicrodents were captured: the Yucatán deer mouse (Peromyscusyucatanicus)—a new record for Guatemala—and the spinypocket mouse (Heteromys gaumeri). There were noapparent differences in mammal diversity among the fourlocalities observed in the park. Populations of Mexicanhowler monkeys (Alouatta pigra) and Geoffroy’s spidermonkeys (Ateles geoffroyi) were abundant throughout theselocalities, suggesting that many areas of the park arerelatively undisturbed from the mammalian point of view.Other rare or endangered species including Baird’s tapir(Tapirus bairdii), collared peccary (Tayassu tajacu), and redbrocket deer (Mazama americana) were also observed in thepark. These were observed near the GBS station along theRío San Pedro, suggesting that this area may be especiallyimportant for mammal conservation in LTNP.
Ants
As for mammals, the time available and the time of yearmade it difficult to obtain a complete ant sample. Neverthe-less, an impressive 112 species and 39 genera were recorded.These values are greater than those recorded in several otherstudies in the region. As in other Neotropical sites, the genusPheidole contained the largest number of species, but severalarboreal genera were also highly diverse. Three speciesendemic to the Maya Forest region were recorded, includingSericomyrmex aztecus, Xenomyrmex skwarrae, andOdontomachus yucatecus. One extremely rare ant genus,Thaumatomyrmex, was discovered for the first time inGuatemala. Species richness was highest in relatively openor disturbed habitats, contrary to our expectations. This waslikely due to the high microhabitat diversity of these sites. Adisturbed habitat was relatively similar to a nearby pristineforest site, which is consistent with the suggestion that therecovery of Neotropical ant faunas from disturbance israpid. Overall, ant composition was very patchy andturnover rates between sites very high, precluding anassessment of species-habitat associations and suggestingthat overall richness was much higher than that recorded.More intensive studies are needed to ascertain whichhabitats have the greatest representation of rare or uniquespecies, but our preliminary results suggest that the bosquesaltos harbor a high number of canopy and litter ant speciesand thus may be of particularly high conservation value.
A COMPARISON OF RAP RESULTS WITHPREVIOUS STUDIES
A previous survey conducted by CI-ProPetén (Méndez etal., 1998) addressed some of the same objectives as our RAPbut focused on several different sites and distinct taxa. Taxaobserved by Méndez et al. (1998) but not observed in thisRAP included butterflies and terrestrial plant communities.Birds and amphibians were also studied. Méndez et al.considered how varying topographic characteristics indifferent zones of LTNP corresponded to patterns ofbiological diversity in a west-east gradient of increasingtopographic relief across the park. Their objective was toprovide a prioritization of the park’s habitats. Theyrecognized three geographic components of the park at thisbroad scale: 1) the western area of the park, consisting of anopen-canopy forest matrix with patches of tall, closed-canopy bosque alto forest; 2) a central area that is similar tothe western area but with flooded savanna to the north; and3) an eastern area with a greater cover of bosque alto andpatches of open forest, marshland, and oak forest(encinales). Méndez et al. found that most plant specieswere canopy species, and this group contained a highnumber of species found in the eastern area but nowhere elsein the park (i.e. “exclusive” species). Most of the bosquesaltos in which these trees reside were on hills of 100-170 m.Méndez et al. recorded 219 species of birds, 60 of whichwere habitat-restricted in some way. They found that thecentral area had the highest number of exclusive bird species.The greatest richness of amphibians was found in the centralarea, and this was attributed to the area’s ecotonal naturewithin the park. Of the 97 species of butterflies that wererecorded, species richness was greatest in the eastern andcentral areas, and the eastern area harbored the largestnumber of exclusive species.
Finally, cluster analyses based on species compositionrevealed that the eastern portion of the park clustered awayfrom the western and central areas of the park for all taxaexamined, indicating the uniqueness of the eastern area.Méndez et al. concluded that the topographic gradient wasrelated to patterns of biodiversity in LTNP. Although theeastern, most topographically varied part of the park wasrichest overall in exclusive species, it was also afforded thegreatest protection in the park. The western area, on theother hand, is least rich in exclusive species but is under-protected. Méndez et al. considered the western area to beextremely fragile due to the extreme vulnerability of the richaquatic systems found there and the threat posed bypetroleum development to those systems’ species.
In many cases, the RAP results agree with those ofMéndez et al. The bosque alto and several aquatic habitatspresent in the Río San Pedro focal area in the eastern part ofLTNP were recognized for their importance to groups suchas fish, mammals, and ants. Wetland and lagoon habitats
CONSERVATION INTERNATIONAL Rapid Assessment Program18
found in central and western parts of the park (i.e. the RíoEscondido and Flor de Luna focal areas), however, were alsorecognized as essential for the conservation of aquatic birdsand the Morelet’s crocodile. Further, some areas notcurrently located within the park’s boundaries should beconsidered in the region’s management. Overall, the value ofparticular habitats depends upon the taxa considered.Viewed in this way, and considering the status of LTNP as acore area within the MBR, all of the park’s habitats warrantprotection.
RESEARCH AND CONSERVATIONRECOMMENDATIONS
Our observations lead us to believe that LTNP is a criticalcore area within the MBR. It is an important reservoir oftropical dry forest habitats and wetlands that harbor bioticcommunities and individual species of great regional andglobal conservation value. Our studies in LTNP bring to lightspecific information needs that can be provided only bymore intensive studies in the park. Nonetheless, we can offerseveral specific recommendations for the park’s manage-ment. The basis for the following recommendations can befound in the text of the executive summary and in thefollowing chapters. Recommendations are not listed in orderof priority. We first provide recommendations for furtherscientific research in the park, noting that the GBS is an ideallocation from which to launch these investigations, thenconservation recommendations.
Scientific research priorities:
• Additional research determining the hydrologicallinkages throughout the park’s landscapes and theirseasonal dynamics will be a necessary first step tobuilding an understanding of the aquatic systems of thepark, including the flow of contaminants and thedispersal and population dynamics of species.
• Considering the intense seasonal dynamics of tropicaldry forest areas such as LTNP, studies of bothterrestrial and aquatic systems should be conducted atdifferent times of year, particularly during the wetseason when aquatic systems are better connected andwhen many terrestrial organisms are reproducing.
• More detailed studies of the relationships betweentopography, soils (particularly soil depth), and plantand animal communities are needed to provide a morefine-scale view of patterns of biodiversity for purposesof prioritization. Considering the high degree ofincursion of settlers into the park, such studies will aidin the optimal allocation of protection for habitats ininvaded areas.
Specific conservation recommendations for LTNP:
• Reduce the rate of deforestation and the burning ofhabitats such as sawgrass marshes (sibales), with theultimate goal of halting deforestation and deliberateburning altogether inside LTNP. The ecological integrityof LTNP, as a core area of the MBR, must be main-tained if the MBR as a whole is to persist and flourish.
• Immediately conserve particular areas of relativelypristine bosque alto (high forest). Current levels ofprotection afforded to areas near the GBS and along theRío San Pedro should be maintained, and forested areasfarther from this protected zone, such as El Perú or nearthe Laguna Guayacán, should be monitored carefully.Human disturbance of the forests in the San Pedro areashould be minimized in order to favor populations oflarge mammals.
• Protect several unique aquatic habitats within the park,and, for management purposes, include within the parkother aquatic and terrestrial habitats that are nowoutside the park. These include the varzea-like floodedforests near Paso Caballos and along the Río Sacluc, thesawgrass marsh (sibal) habitats along the southernmargin of the Río San Pedro and along the RíoEscondido, the molluscan reef system at the “rapids”area on the Río San Pedro near El Naranjo, the mangroveremnant along the Río San Pedro, and the encinalvegetation along the Río Sacluc. Of particular concern isthe widening of canals into sawgrass marsh habitat alongthe Río Escondido, associated with boat passage, whichshould be controlled.
• Initiate a water-quality monitoring program within thepark. Of particular interest are areas that are used byhuman populations, including tributary springs alongthe Río San Pedro and lagoons on the Xan-Flor de Lunaroad. Specifically, the levels and effects of fecalcontamination and agricultural runoff should beexamined.
• Investigate the determinants of stress and genotoxicityto fish—revealed in this assessment—at Xan 3 and inother lagoons. Several questions remain unanswered:What contaminants are involved? What are the sourcesof these contaminants? What is the role of hydrology indetermining the redistribution of the contaminants?How does species behavior determine the toxic effectsof the contaminants?
• Monitor species populations within the park in order toassess trends in their health. Of particular concern arethose populations that are small and/or exploited by

RAP BULLETIN OF BIOLOGICAL ASSESSMENT SIXTEEN July 2000 19
humans. Specifically, the dynamics of food fishes suchas Petenia splendida and Brycon guatemalensis(especially in the heavily exploited Río San Pedro)should be monitored. A conservation and monitoringprogram for crocodiles (Crocodylus moreletii) shouldfocus on sites where they are currently abundant,including the Río Sacluc, Laguna el Perú, and Laguna laPista. Finally, bird populations should be monitored,especially in aquatic habitats in the central and westernparts of the park due to this area’s internationalsignificance and the threats posed to its habitats by oilextraction and human colonization.
The condition, threats, and conservation actions werecommend are summarized by habitat type in Table i.
Table i. Summary of the conservation importance, threats, overall habitat condition, and management recommendations for theprincipal habitat types of Laguna del Tigre National Park and Biotope.
We hope these recommendations provide some guidance inthe management of LTNP, and we encourage interestedparties to contact the authors of this report if furtherclarification is desired.
L I TERATURE C ITED
Méndez, C., C. Barrientos, F. Castañeda, and R. Rodas.1998. Programa de Monitoreo, Unidad de ManejoLaguna del Tigre: Los Estudios Base para suEstablecimiento. CI-ProPetén, Conservation Interna-tional, Washington, DC, USA.
Habitat Types ofConcern
Location(s) ConservationImportance
Threats Habitat Condition Recommendations
Rivers, tributaries, andcaños
Río San Pedro/Sacluc, and RíoEscondido
High richness of aquaticplants, fishes
Pollution, especially oftributaries, overfishing
Variable, poorernear settlements
Monitor, regulate human wastepractices and fishing pressure.
Rapids/freshwater reefs
Río San Pedro Unique freshwater reefsystem of bivalve mollusksand associated diversity
Pollution, overharvest ofmollusks
Still good Include in LTNP, monitor andregulate mollusc harvest and riverpollution.
Lagoons Flor de Luna, RíoChocop
High densities of Morelet’scrocodiles, unique aquaticbirds
Pollution, petroleumcontamination
Variable, onelagoon near an oilwell may bepolluted
Prohibit human use of certainlagoons, monitor contaminationlevels.
Oxbow lagoons Río Escondido High richness of aquaticplants
Erosion due to passage ofboats in canals
Variable Regulate use of boats and perhapsboat size or speed in park.
Sawgrass (sibal)marshes
All High richness of aquaticbirds, nurseries for fishspecies
Burning Variable, manydamaged by fire
Include more marshland in park,prevent spread of fires intomarshes, regulate burning in park.
Varzea-type forest Río SanPedro/Sacluc
Nurseries for fish species Human settlements Unknown Include in LTNP, more studiesneeded.
Bosque alto All High richness of ants,mammals
Deforestation, burning Variable, manydamaged by fire
Control burning and protectrelatively pristine patches.
Encinal Río Sacluc Unique plants, likely uniqueanimals
Deforestation,fragmentation
Unknown Include areas along Río Sacluc inLTNP.
CONSERVATION INTERNATIONAL Rapid Assessment Program20
CHAPTER 1
INTRODUCTION TO THE RAPEXPEDITION TO LAGUNA DELTIGRE NATIONAL PARK, PETEN,GUATEMALA
Brandon T. Bestelmeyer
LAGUNA DEL TIGRE NATIONAL PARK,LAGUNA DEL TIGRE NATIONAL PARK,LAGUNA DEL TIGRE NATIONAL PARK,LAGUNA DEL TIGRE NATIONAL PARK,LAGUNA DEL TIGRE NATIONAL PARK,PETEN, GUATEMALAPETEN, GUATEMALAPETEN, GUATEMALAPETEN, GUATEMALAPETEN, GUATEMALA
Laguna del Tigre National Park (LTNP) is a core area of theMaya Biosphere Reserve (MBR), and the threats facing itunderscore the need for both research and conservationefforts in the park. The biosphere reserve concept holds thatconservation and development can be balanced by the carefuldesign and management of reserve networks. The function ofcore areas, as opposed to extractive or buffer zones in whichhuman economic activity may occur, is to preserve represen-tatives of minimally disturbed ecosystems that serve as abenchmark for regional monitoring efforts and that protectwild populations. According to Batisse (1986), “Theprotection against any action that could endanger theconservation role assigned to the core area must…be fullyensured.” The role of this RAP is to assess the value ofLTNP as a core area of the MBR and to evaluate the threatsto its role as a core area.
The park is part of the Maya Forest, which containsCentral America’s largest remaining tropical forest ecosys-tems. The forest expands from southern Mexico (especiallyChiapas, Campeche, and Quintana Roo states) throughnorthern Guatemala and Belize and forms a natural biogeo-graphic and cultural unit (Nations et al., 1998). The 16,000-km2 MBR in the Petén department of northern Guatemalacontains the largest system of managed and protected areasin the Maya Forest. LTNP, with an area of 289,912 hectares,is the largest and most important protected core area withinthis reserve.
Despite its protected status, the park is increasinglythreatened by colonization and development and is beingdeforested at a rate of 0.57% per year (1995-1997 data;Sader, 1999). As a consequence, 50% of the forest hasalready been lost, and one projection estimates that 98%
of the original forest in the Petén may be lost by the year2010 if current deforestation rates are not reduced (Canteo,1996).
ECOLOGICAL CHARACTERISTICS OF LTNP
The park lies within a zone characterized as tropical dryforest (Murphy and Lugo, 1995; Campbell, 1998). Whiletropical moist forests have received a great deal of attentionfrom ecologists and conservationists, tropical dry forestecosystems—Neotropical dry forests in particular—arelittle studied, intensively used by humans, and extremelyendangered by development throughout the world (Mooneyet al., 1995; Gentry, 1995). For this reason, the Maya Foresthas global significance.
The topography of the area is low and flat, withmaximum elevations not exceeding 300 m. The area isunderlain by limestone rocks of Miocene age, giving rise tothe karstic landscape typified by limestone cliffs along largeriver courses, well-drained hills with thinner soils sur-rounded by lower-lying areas with deep soils (known asbajos), and few streams but numerous water holes that arisefrom depressions in the limestone (Wallace, 1997). Smallerlimestone sinks are known as aguadas, and larger ones areakalchés or lagoons (Campbell, 1998). The wetlands of thewestern portion of the park are believed to be the largestthat remain in Central America (Wallace, 1997). Thesewetlands are also the largest in Guatemala and are recognizedunder the Ramsar convention for their internationalimportance.
As in all tropical dry forest ecosystems, the contrastbetween the wet and dry seasons is an ecological feature ofoverriding significance (Murphy and Lugo, 1995). Theannual precipitation of the region averages 1600 mm peryear, but little precipitation may fall in the January-to-Aprildry season, when temperatures may exceed 40° C. This

RAP BULLETIN OF BIOLOGICAL ASSESSMENT SIXTEEN July 2000 21
period presents an important challenge to many of the moisttropical-derived organisms in the park. In addition, theseasonality in precipitation interacts with topography toproduce extreme variations in environmental conditions. Forexample, bajos may be flooded during the wet season butdrought-stressed during the dry season (Whitacre, 1998).Water persists in the large lagoons throughout the year(Campbell, 1998) and are thus critical features of the park’slandscape and ecology.
Perhaps the most important axis of natural terrestrialenvironmental variation is between the low-lying, seasonallyflooded forests and the well-drained uplands located onlimestone bluffs. Whitacre (1998) reports that both foresttree and bird composition vary dramatically between thesetopographic conditions, such that areas with similartopography located miles apart are much more similar thanareas of differing topography only one hundred miles apart.Upland forests (bosques altos) tend to be taller withabundant leaf litter and little undergrowth. Low-lying forests(bosques bajos) tend to be shorter (15 m to 20 m) andpossess a dense undergrowth of shrubs, palms, and herbs.This variation is likely a strong influence on patterns ofbiodiversity in the region (Méndez et al., 1998).
The aquatic systems within the park are less wellunderstood than the terrestrial systems. The major water-course in the park is the Río San Pedro, which is a majortributary of the Río Usumacinta. The Río Sacluc is atributary of the San Pedro and drains areas to the southeastof the park. The Río Escondido is another tributary of theSan Pedro that drains areas within and around the Laguna delTigre Biotope in the western portion of LTNP. The RíoChocop drains the center of the park to the San Pedro, andthe Río Candelaria is an independent affluent of the Lagunade Términos. The hydrological relationships among theserivers and the many lagoons—especially their subterraneanlinkages, which may be an important component in karsticlandscapes—are unknown. Furthermore, there are likelyseasonally varying linkages among water bodies withconnections in the wet season that are not apparent in thedry season, during which our sampling took place. Suchlinkages should have important consequences both for thedispersal dynamics of plant and animal populations as wellas for the spread of pollutants. These hydrological featuresshould be an important priority for future research in thepark.
Historical changes in climate and vegetation structurehave left an important imprint on the ecology of the Peténforests as well. The region has been subjected to a great dealof climatic instability through the Holocene. For example,Leyden (1984) relates that vegetation in the region wasdominated by pine-oak formations at the height of the lastglacial period and that a period of increased aridity occurredfrom 2200 to 1140 years ago. More recent changes tovegetation are associated with the rise of the Mayan culture.
During the late Classic period (AD 600 to 850), the Mayareached peak population densities of 200 persons per squarekm (Culbert and Rice, 1990), and this suggests that extensiveagricultural conversion of the landscape was needed tosupport them. As a consequence, the tropical forests weobserve today are probably no older than 1000 years(Méndez, 1999). Understanding current ecological patternswithin the Maya Forest requires us to be cognizant of theinfluence of these historical processes.
HISTORY OF LTNP
LTNP is administered by the Consejo Nacional de AreasProtegidas (CONAP), the Guatemalan government’s naturalresource agency. CONAP is responsible for protecting andconserving Guatemala’s natural heritage, which it doesthrough promoting sustainable use of natural resources andthrough conserving wildlife populations and ecosystemsthroughout the country. The Laguna del Tigre Biotope, acore area located within the park, is administered byGuatemala’s University of San Carlos through its localconservation and research center, the Centro de EstudiosConservacionistas (CECON).
Ponciano (1998) relates the following history of thebiotope and the park. CONAP was founded in 1989, andone of its first actions was to incorporate the pre-existingTikal National Park, Laguna del Tigre Biotope, El ZotzBiotope, and Dos Lagunas Biotope into the MBR. Addi-tionally, the Laguna del Tigre and Sierra del LacandonNational Parks were created. The creation of the MBR wascatalyzed by two events: 1) the proposal of the “RutaMaya” reserve network for conservation and tourism in aNational Geographic article and 2) the threat posed byimmigration and development due to a highway developmentproject connecting Flores with Cadenas to the south. TheGerman government was financing this project but, based onan environmental impact assessment, decided to suspendfunds until the reserve was created. CONAP was able tocreate the reserve because it had strong political support andbecause a democratic government was in place at the time.The reserve was intended to harbor strictly protected coreareas (national parks and biotopes), multiple-use (e.g.extractive) zones between these core areas, and a buffer zonein which private holdings may occur (Gretzinger, 1998). Thepark was registered as a Ramsar site of important wetlandsin 1990 and 1999.
CONSERVATION CHALLENGES FOR LTNP
Population growth and immigration to the Petén havecomplicated sustainable management and biodiversityconservation. Population growth is estimated to be 7% to10% per annum, largely due to the immigration of poverty-
CONSERVATION INTERNATIONAL Rapid Assessment Program22
stricken farmers from the highlands to the south (Nations etal., 1998) as well as the repatriation of Guatemalan citizensfrom Mexico who fled the country during the 30-year civilwar that ended in 1996 (Ponciano, 1998). As a consequenceof these pressures, colonization has occurred within coreareas and has proven difficult to manage throughout thereserve.
Recent immigrants have imported agricultural practices(broad-scale slash-and-burn techniques) from the highlandsthat are nonsustainable in the context of lowland forests.The unregulated and illegal harvest of valuable timber speciesand other products threatens to diminish the capacity of theforest to support human populations through nondestruc-tive practices.
As in similar situations elsewhere, land tenure rightsand natural resource concessions granted at the communitylevel, enforcement of management policies, and expandedmarkets for forest products will be required in order to slowforest loss. Regulatory activities in the Petén, however, havebeen difficult to implement. Managed extraction of commer-cially valuable trees such as mahogany (Swieteniamacrophylla) and Spanish cedar (Cedrela odorata), as wellas nontimber forest products such as chicle (used in chewinggum), allspice, xate (a fern used in flower arrangements), andpotpourri derived from forest products can provide incomefor Peteneros in the setting of a semi-intact forest. Whighamet al.’s (1998) studies of birds in Quintana Roo suggest thatselective logging does not affect bird communities adversely(see also Whitacre, 1998). This may be due, in part, to thebird’s adaptations to periodic natural disturbances in theregion such as those caused by hurricanes. Furthermore,management of clearing and planting practices in agriculturallandscapes (Warkentin et al., 1995) in conjunction with thepreservation of intact old-growth forest areas kept out offarming cycles (Whitacre, 1998) may preserve a great deal ofthe Petén’s biodiversity. These management alternativesshould be explored further in order to develop the mostappropriate strategy to preserve Petén’s biodiversity.
An additional development challenge arises from thefact that 40% of the reserve overlaps with areas defined ashaving petroleum development potential (Ponciano, 1998).Basic Petroleum Inc. had rights to develop petroleumoperations within the park before the biosphere’s creation in1990. Rosenfeld (1999) reports that Basic has been grantedrights to explore for petroleum in approximately 55% of thearea within LTNP. The direct effects of Basic’s petroleumoperations on the park are unknown, but it is clear that thecreation of roads into previously unsettled areas hasexacerbated forest clearing within the park (Rosenfeld,1999). Agreements between conservation interests and theMinistry of Energy and Mines about how to proceed withdevelopment have yet to be reached.
In response to the threats posed by petroleumdevelopment and human colonization within the park, a
major research/monitoring program was initiated in LTNP byCI-ProPetén in collaboration with CONAP and CECON(Mendez et al., 1998). This study documented for the firsttime the great diversity of plants, diurnal butterflies, reptilesand amphibians, and birds within the park. The vegetationsurvey performed in this study laid the groundwork for theterrestrial study effort presented here, and the data ofMendez et al. (1998) as a whole complement the informa-tion on aquatic fauna and flora and the terrestrial data onants and mammals. It is hoped that our efforts, in combina-tion with this previous survey, will help call attention to thevalue of LTNP’s biodiversity, provide direction and impetusfor more intensive studies in the region, and aid landmanagers in conservation and management of LTNP’sbiodiversity.
GENERAL STUDY DESIGN
We conducted this study at the end of the dry season inorder to facilitate mobility through the park and to bettersample certain groups such as fish and aquatic birds.Sampling was centered around four focal areas (see Map 3).The first was centered at Las Guacamayas BiologicalStation, which is located at the confluence between the RíoSan Pedro and the Río Sacluc. Sampling was conducted nearthe headwaters of and along the Río San Pedro and onnearby portions of the Río Sacluc. The second focal area waslocated along the Río Escondido to the west, which flowsinto the Río San Pedro from the north and passes throughpart of the Laguna del Tigre Biotope. The third focal areawas centered on a system of lagoons near the northeastcorner of the Laguna del Tigre Biotope. These lagoons arenear the Xan petroleum fields currently operating inside thepark. Toxicological studies were focused here in severallagoons located at varying distances from the Xan oil wells.The fourth and final area was centered at the Río Chocop,which includes several other lagoons as well as the RíoCandelaria. Together, these focal areas represent a breadth ofhabitats found within the park, including areas that arerelatively undisturbed and areas that are threatened bycontamination and agricultural development.
Within each focal area, samples were collected atseveral sample points (or georeference points) representingdifferent macrohabitats found in the area. Samples werecollected by each group within a few hundred meters of asample point. Sample points generally occur within a fewkilometers of a point that defines the center of each focalarea; this is the focal point (see asterisks in Appendix 1 andAppendix 2). This design will allow for hierarchical analysesof relationships among taxa at two spatial scales.
A classification of aquatic and terrestrial macrohabitatsis used here as the foundation for comparisons among taxaand among regions within the park. These macrohabitattypes are described below.

RAP BULLETIN OF BIOLOGICAL ASSESSMENT SIXTEEN July 2000 23
Aquatic MacrohabitatsThere are few studies of aquatic habitats within the park. Inthis survey, we sampled aquatic habitats and organisms atthree to twelve sample points in each focal area. Appendix 1presents a preliminary classification of the aquaticmacrohabitats by RAP team members. Discussions of thecharacteristics of these macrohabitats may be found inChapters 2 and 3 and are summarized in Table 1.1.
Terrestrial MacrohabitatsTerrestrial macrohabitat types are based upon vegetationclassifications recognized by Mendez et al. (1998). Fromone to three sample points were examined by terrestrialecologists within each focal area, and these sample pointsinclude the focal point (Appendix 2). Detailed descriptionsof terrestrial macrohabitat types may be found in Table 1.2.
Note that aquatic groups were able to sample manymore points than terrestrial groups. This is due to differ-ences in the effort needed to adequately sample differentkinds of organisms at each point.
REPORTING OF RESULTS
In the chapters that follow, the results for each taxon orsubstudy of the RAP expedition are provided as self-contained manuscripts. Each study and the resultingpresentation necessarily employ a slightly different
organization, depending upon the difficulty in gathering andrelating information about the focal taxon. Several analyticalfeatures, however, are shared in all taxon-based chapters inorder to evaluate a group’s diversity. Some or all of thesemeasures may be used in a particular chapter, dependingupon their utility given the data at hand. First, speciesrichness is measured as the number of species. Second,species diversity (in the strict sense) is measured as thedistribution of abundance among species. A more evendistribution of individuals among species and a greaternumber of species generally lead to higher diversity values.Third, similarity (or conversely, complementarity) in speciescomposition at a site is measured using similarity indices orusing clustering or ordination techniques. Two sites that aredissimilar in the identity or abundances of the speciesoccupying them have a greater combined diversity than twohabitats that are relatively more similar. This is reflected inclustering and ordination diagrams by the distances betweenthe samples in the diagram. And finally, we use the presenceand abundance of globally or regionally rare or endemicspecies, such as those protected in international agreementsincluding the Convention on the International Trade ofEndangered Species of Wild Fauna and Flora (CITES)appendices and the International Union for the Conservationof Nature (IUCN) Red List. This requires information on thebroad-scale distribution of taxa and may not be available forcertain understudied groups such as plankton.
Table 1.1. Descriptions of aquatic macrohabitats in Laguna del Tigre National Park, classified for the firsttime in this study.
Macrohabitat Type CharacteristicsRiverine systems (ríos) River embayments (bahias) Pockets of slower-moving water along the edges of rivers. Permanent river (permanentes) Deep portions of rivers that never dry, usually with a bed
composed of limestone rocks. River rapids (rápidos) Fast-moving portions of rivers, often with rocky substrate,
and in the case of the San Pedro, bivalve-based reefs. Seasonal rivers (someras) Small or shallow rivers or stretches of river that are
seasonally dry. May have a variety of substrates, anddeeper pockets may contain water year-round but may belargely stagnant in the dry season.
Non-riverine systems Tributaries (tributarios, riachuelos) Small, often spring-fed, streams that feed rivers. Fast-
moving, highly oxygenated waters. Caños Narrow, lotic environments connected to rivers from
marshes. Waters are turbid, almost stagnant. Oxbow lagoons (lagunas meándricas) Lagoons formed by sharp river bends that become
detached from the river course and exist as isolatedlagoons alongside it.
Lagoons (lagunas) Also known as alkachés or aguadas, lagoons formed bydepressions in limestone. Waters may be clear or turbid.
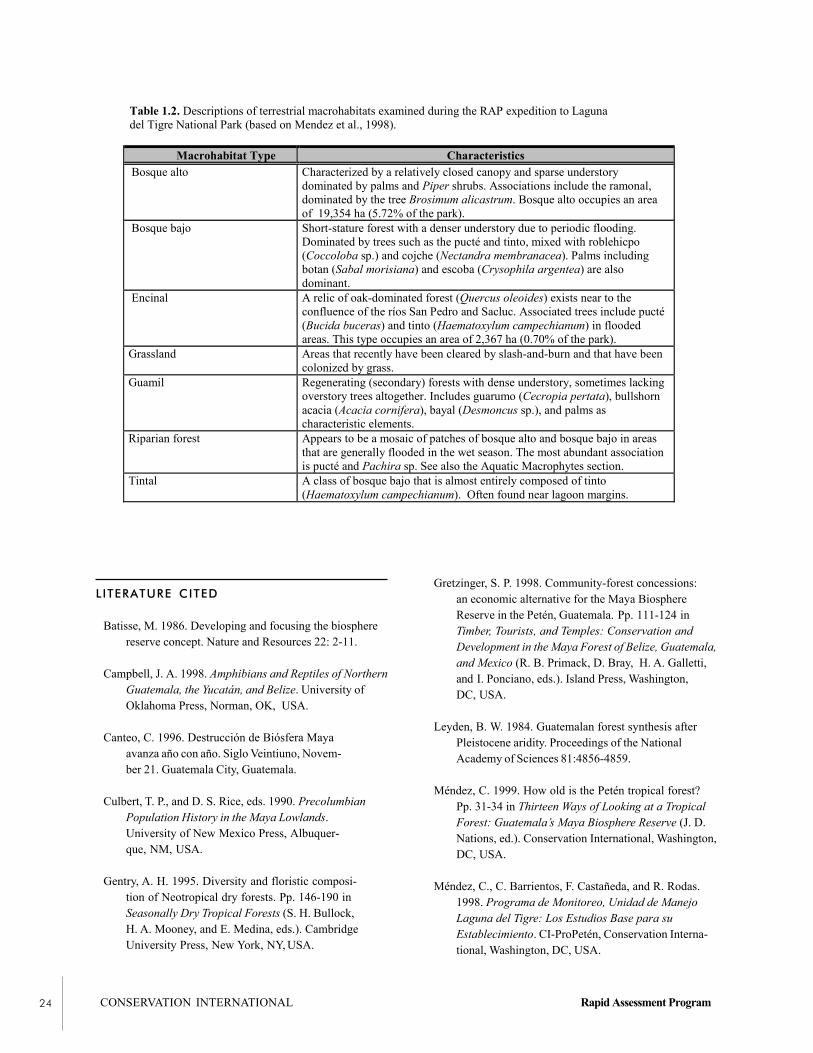
CONSERVATION INTERNATIONAL Rapid Assessment Program24
LITERATURE CITED
Batisse, M. 1986. Developing and focusing the biospherereserve concept. Nature and Resources 22: 2-11.
Campbell, J. A. 1998. Amphibians and Reptiles of NorthernGuatemala, the Yucatán, and Belize. University ofOklahoma Press, Norman, OK, USA.
Canteo, C. 1996. Destrucción de Biósfera Mayaavanza año con año. Siglo Veintiuno, Novem-ber 21. Guatemala City, Guatemala.
Culbert, T. P., and D. S. Rice, eds. 1990. PrecolumbianPopulation History in the Maya Lowlands.University of New Mexico Press, Albuquer-que, NM, USA.
Gentry, A. H. 1995. Diversity and floristic composi-tion of Neotropical dry forests. Pp. 146-190 inSeasonally Dry Tropical Forests (S. H. Bullock,H. A. Mooney, and E. Medina, eds.). CambridgeUniversity Press, New York, NY, USA.
Gretzinger, S. P. 1998. Community-forest concessions:an economic alternative for the Maya BiosphereReserve in the Petén, Guatemala. Pp. 111-124 inTimber, Tourists, and Temples: Conservation andDevelopment in the Maya Forest of Belize, Guatemala,and Mexico (R. B. Primack, D. Bray, H. A. Galletti,and I. Ponciano, eds.). Island Press, Washington,DC, USA.
Leyden, B. W. 1984. Guatemalan forest synthesis afterPleistocene aridity. Proceedings of the NationalAcademy of Sciences 81:4856-4859.
Méndez, C. 1999. How old is the Petén tropical forest?Pp. 31-34 in Thirteen Ways of Looking at a TropicalForest: Guatemala’s Maya Biosphere Reserve (J. D.Nations, ed.). Conservation International, Washington,DC, USA.
Méndez, C., C. Barrientos, F. Castañeda, and R. Rodas.1998. Programa de Monitoreo, Unidad de ManejoLaguna del Tigre: Los Estudios Base para suEstablecimiento. CI-ProPetén, Conservation Interna-tional, Washington, DC, USA.
Table 1.2. Descriptions of terrestrial macrohabitats examined during the RAP expedition to Lagunadel Tigre National Park (based on Mendez et al., 1998).
Macrohabitat Type Characteristics Bosque alto Characterized by a relatively closed canopy and sparse understory
dominated by palms and Piper shrubs. Associations include the ramonal,dominated by the tree Brosimum alicastrum. Bosque alto occupies an areaof 19,354 ha (5.72% of the park).
Bosque bajo Short-stature forest with a denser understory due to periodic flooding.Dominated by trees such as the pucté and tinto, mixed with roblehicpo(Coccoloba sp.) and cojche (Nectandra membranacea). Palms includingbotan (Sabal morisiana) and escoba (Crysophila argentea) are alsodominant.
Encinal A relic of oak-dominated forest (Quercus oleoides) exists near to theconfluence of the ríos San Pedro and Sacluc. Associated trees include pucté(Bucida buceras) and tinto (Haematoxylum campechianum) in floodedareas. This type occupies an area of 2,367 ha (0.70% of the park).
Grassland Areas that recently have been cleared by slash-and-burn and that have beencolonized by grass.
Guamil Regenerating (secondary) forests with dense understory, sometimes lackingoverstory trees altogether. Includes guarumo (Cecropia pertata), bullshornacacia (Acacia cornifera), bayal (Desmoncus sp.), and palms ascharacteristic elements.
Riparian forest Appears to be a mosaic of patches of bosque alto and bosque bajo in areasthat are generally flooded in the wet season. The most abundant associationis pucté and Pachira sp. See also the Aquatic Macrophytes section.
Tintal A class of bosque bajo that is almost entirely composed of tinto(Haematoxylum campechianum). Often found near lagoon margins.

RAP BULLETIN OF BIOLOGICAL ASSESSMENT SIXTEEN July 2000 25
Mooney, H. A., S. H. Bullock, and E. Medina. 1995.Introduction. Pp. 1-8 in Seasonally Dry TropicalForests (S. H. Bullock, H. A. Mooney, and E.Medina, eds). Cambridge University Press, New York,NY, USA.
Murphy, P. G., and A. E. Lugo. 1995. Dry forests ofCentral America and the Caribbean. Pp. 9-34 inSeasonally Dry Tropical Forests (S. H. Bullock, H. A.Mooney, and E. Medina, eds.). Cambridge UniversityPress, New York, NY, USA.
Nations, J. D., R. B. Primack, and D. Bray. 1998. Introduc-tion: the Maya forest. Pp. xiii-xx in Timber, Tourists,and Temples: Conservation and Development in theMaya Forest of Belize, Guatemala, and Mexico (R. B.Primack, D. Bray, H. A. Galletti, and I. Ponciano,eds.). Island Press, Washington, DC, USA.
Ponciano, I. 1998. Forestry policy and protected areas inthe Petén, Guatemala. Pp. 99-110 in Timber, Tourists,and Temples: Conservation and Development in theMaya Forest of Belize, Guatemala, and Mexico (R. B.Primack, D. Bray, H. A. Galletti, and I. Ponciano,eds.). Island Press, Washington, DC, USA.
Rosenfeld, A. 1999. Oil exploration in the forest. Pp. 68-76 in Thirteen Ways of Looking at a Tropical Forest:Guatemala’s Maya Biosphere Reserve (J. D. Nations,ed.). Conservation International, Washington, DC,USA.
Sader, S. 1999. Deforestation trends in northern Guate-mala: a view from space. Pp. 26-30 in Thirteen Waysof Looking at a Tropical Forest: Guatemala’s MayaBiosphere Reserve (J. D. Nations, ed.). ConservationInternational, Washington, DC, USA.
Wallace, D. R. 1997. Central American landscapes. Pp. 72-96 in Central America: A Cultural and NaturalHistory (A. G. Coates, ed.). Yale University Press,New Haven, CT, USA.
Warkentin, I. G., R. Greenberg, and J. Salgado Ortiz. 1995.Songbird use of gallery woodlands in recently clearedand older settled landscapes of the Selva Lacandona,Chiapas, Mexico. Conservation Biology 9: 1095-1106.
Whigham, D. F., J. F. Lynch, and M. B. Dickinson. 1998.Dynamics and ecology of natural and managed forestsin Quintana Roo, Mexico. Pp. 267-282 in Timber,Tourists, and Temples: Conservation and Develop-ment in the Maya Forest of Belize, Guatemala, andMexico (R. B. Primack, D. Bray, H. A. Galletti, and I.Ponciano, eds.). Island Press, Washington, DC, USA.
Whitacre, D. F. 1998. The Peregrine Fund’s Maya Project:ecological research, habitat conservation, and develop-ment of human resources in the Maya forest. Pp. 241-266 in Timber, Tourists, and Temples: Conservationand Development in the Maya Forest of Belize,Guatemala, and Mexico (R. B. Primack, D. Bray, H.A. Galletti, and I. Ponciano, eds.). Island Press,Washington, DC, USA.

CONSERVATION INTERNATIONAL Rapid Assessment Program26
CHAPTER 2
THE AQUATIC HABITATS OFLAGUNA DEL TIGRE NATIONALPARK, PETEN, GUATEMALA: WATERQUALITY, PHYTOPLANKTONPOPULATIONS, AND INSECTSASSOCIATED WITH THE PLANTSALVINIA AURICULATA
Karin Herrera, Ana Cristina Bailey, Marcos Callisto, andJorge Ordoñez
ABSTRACT
• Water bodies in Laguna del Tigre National Park (LTNP)were classified according to eight macrohabitat types(refer to Table 1.1). The physico-chemical properties,water quality, phytoplanktonic flora, and insectsassociated with the aquatic plant Salvinia auriculata arereported for each water body examined.
• The pH of the park’s waters ranged from acid (6.78) toalkaline (8.30), from turbid and dark to aquamarine, andfrom eutrophic to oligotrophic. The water quality ofthe park was generally good. Coliform bacteria weredetected in 37% of the samples, but fecal coliformbacteria were detected in only 13% of the samples.
• A freshwater, mollusk-based reef was discovered in theRío San Pedro near the town of El Naranjo.
• Fifty-nine genera and 71 species and morphospecies ofphytoplankton were recorded. Diatoms(Bacillariophycea), followed by chlorophytes(Chlorophyceae) and cyanophytes (Cyanophyceae),dominated the samples. Multivariate analyses revealedthat the single most important source of variationdetermining phytoplanktonic composition was pH, andthe second was conductivity.
• Forty-four morphospecies and 26 families of insectswere found on Salvinia auriculata. This resulthighlights the great diversity of insects in the littoralaquatic systems of the park.
• The molluscan reef should be conserved, and a water-quality monitoring program should be initiated.
INTRODUCTION
The results of a limnological assessment of Laguna del TigreNational Park (LTNP) are presented, including the following:1) descriptions of aquatic macrohabitats encountered duringthe study (refer to Table 1.1 and Appendix 1); 2) anevaluation of water quality using biotic measures such as thepresence of coliform bacteria and Escherichia coli as well asabiotic measures; and 3) an evaluation of patterns in thediversity of phytoplankton within the park. In addition tothis limnological component, we examined the compositionof insects associated with floating plants, specificallySalvinia auriculata.
This limnological study is intended to serve as the basisfor more intensive monitoring studies of aquatic systems inthe park. The monitoring of aquatic organisms such asplankton and insects has certain advantages over chemicalanalysis in determinations of the health of aquatic ecosys-tems (UNESCO, 1971). Benthic insects, for example,maintain a relatively stable composition that is determinedby responses to average conditions in their aquatic environ-ment over time, whereas chemical analyses only reflectwater quality at the time samples were taken, which may bequite variable depending upon the time of day or year(McCafferty, 1998). Monitoring using plankton and aquaticinsects may represent a good option for recording environ-mental changes in LTNP, as they have in other freshwatersystems in Guatemala (Basterrechea, 1986, 1988, 1991;Herrera, 1999). Furthermore, these organisms are importantin their own right. Plankton are fundamental components ofthe aquatic food chain, and aquatic insects are among theprincipal groups of organisms that convert vegetable materialinto animal tissue in freshwater ecosystems. Thus, theseorganisms form the support for the existence of manyorganisms including fish, amphibians, and birds (Merritt andCummins, 1984).

RAP BULLETIN OF BIOLOGICAL ASSESSMENT SIXTEEN July 2000 27
Although several studies have considered aquatic inverte-brates in Guatemala, including studies of the Río Polochic bythe biology department of the Universidad del Valle and byBasterrechea and Torres (1992) in LTNP, this is the firststudy in Guatemala to consider the relationships betweeninsects and the floating plants Salvinia auriculata. S.auriculata is a relatively common and easily sampled aquaticplant in lotic aquatic systems in LTNP (see León andMorales Can, this volume) and thus serves as an idealsubstrate from which to gather aquatic insects and toconsider their relationships to the environment. Theobjective of this component of the limnological study is toexamine the feasibility of more intensive studies of insectson aquatic plants as a monitoring tool for LTNP.
METHODS
Water Quality
Samples of water and sediment at 33 sample points in fivefocal areas were usually taken near the margins of waterbodies (see sample depths in Table 2.1). Temperature, pH,electrical conductivity, and dissolved oxygen values wereobtained using portable instruments. Depth at each pointwas measured using a handmade depth gauge. Transparencyof water column was measured using a Secchi disk.Alkalinity was determined using the Gran method, modifiedby Carmouze.
Table 2.1. Limnological results at each sampling point.
SamplePoint
SampleDepth(m)
Max.Depth(m)
Visibility(m)
Temp.(°C)
pH Oxygen(mg/L - %saturation)
ConductivityMS/cm
SP1 2.10 2.20 1.95 27.5 7.15 5.80 - 84.5 0.81SP2 3.30 3.90 2.55 25.9 7.03 6.10 - 78.0 1.02SP3 1.75 5.40 1.75 24.8 6.89 4.72 - 58.0 1.22SP4 2.12 6.60 2.12 27.5 7.33 7.36 - 95.0 1.55SP5 1.75 7.10 1.75 28.3 7.33 7.67 - 110 1.32SP6 1.65 6.10 1.65 29.5 7.20 7.77 - 103 1.98SP7 0.80 4.10 0.80 28.1 7.40 * 1.51SP8 2.60 2.60 1.45 29.5 7.41 * 1.48SP9 2.33 9.00 1.45 29.5 7.43 * 1.42SP10 0.95 7.85 0.95 29.6 7.36 8.09 - 103.7 1.66SP11 3.00 5.10 1.30 29.9 7.47 * 1.44SP12 0.50 3.10 2.50 29.3 7.67 * 1.37E1 1.45 1.45 1.45 29.3 7.76 * 0.63E2 0.85 0.85 0.85 29.8 7.27 * 1.57E3 1.50 1.50 1.30 29.7 7.20 * 1.54E5 0.40 0.40 0.40 29.6 7.02 * 1.62E6 0.70 0.70 0.70 29.1 6.99 * 1.70E7 2.80 2.80 1.30 29.4 7.46 * 1.90E8 3.75 3.75 2.00 29.2 7.50 * 1.81E9 0.20 0.20 0.20 27.3 7.57 * 0.73E10 0.40 0.40 0.40 29.5 7.73 5.88 - 70.0 1.49E11 0.50 0.50 0.50 25.4 8.30 4.24 - 53.5 1.95F1 0.80 0.80 0.70 29.0 8.23 7.42 - 96.9 0.33F2 1.05 1.05 1.0 29.3 7.96 6.36 - 46.5 1.98F5 A 1.05 1.05 1.05 26.5 7.84 0.02 - 0.5 0.92F5 B 0.9 0.9 0.9 26.8 7.84 0.95 - 9.5 0.91F5 C 0.45 0.45 0.45 26.5 7.84 1.45 - 19.3 0.90F5 D 0.30 0.30 0.30 26.3 7.84 1.40 - 17.4 0.89C1 0.40 0.40 0.40 26.3 7.06 0.85 - 8.30 1.27C2 1.85 1.85 1.85 30.0 7.16 8.51 - 106.5 1.06C3 1.50 1.50 1.50 28.7 7.20 6.78 - 91.0 0.63Ca1 1.45 1.45 1.45 25.3 6.84 2.80 - 40.7 1.41Ca2 0.35 0.35 0.35 25.9 6.78 2.66 - 33.5 0.67(* data not available).

CONSERVATION INTERNATIONAL Rapid Assessment Program28
Additionally, the presence or absence of micro-organisms that indicate water polluted by human waste,including total coliforms, fecal coliforms, and Escherichiacoli, was determined. In the field only a qualitative test(Ready Cult Coliforms 100) was possible and is reportedhere. The addition of a chromogenic substrate that bindswith coliform bacteria and an MUG fluorescent substratethat is highly specific to E. coli permits the simultaneousdetection of total and fecal coliforms and E. coli. Thepresence of total coliforms was indicated if the solutionturned blue-green. The presence of fecal coliforms wasdetected by a blue fluorescence and by a positive Indolreaction.
Phytoplankton
Plankton samples were taken at the water surface. Sampleswere obtained by filtering 100 L or 50 L of water through a20-mm net; then samples were preserved in lugol. Sedgwick-Rafter chambers (100x and 450x magnification) were used tocount and identify phytoplankton species andmorphospecies. Patterns of species and generic richnesswere compared among sample points, and patterns ofspecies composition and abundance among sample pointswere explored using multivariate techniques. Non-metricmultidimensional scaling (NMMS; McCune and Mefford,1999) was used to characterize patterns of change inphytoplankton composition and abundance across LTNP.Of the many multivariate techniques available, this techniqueis especially appropriate for characterizing differences inspecies composition among samples.
Aquatic Insects Associated with Salvinia auriculata
In order to sample aquatic insects inhabiting Salviniaauriculata, we used a 25x25-cm quadrat. At each samplingpoint where we observed S. auriculata, we placed thequadrat over a randomly determined portion of the plant andcollected all parts of the plant that fell within the quadrat.We placed the collected S. auriculata into a plastic bag withsome water and, in the lab, washed the plant materialcarefully through a 250-mm net. We discarded all the largeplant parts and kept the smaller material, including parts ofthe roots and the insects caught in the net. This sample wasfixed in a solution of 80% formol. Insects in the sampleswere separated and identified to genus and, where possible,to morphospecies.
RESULTS AND DISCUSSION
Below, we present general results for coliform sampling,patterns of phytoplankton diversity, and a description ofthe aquatic insects gathered from Salvinia auriculata. A
description of macrohabitat characteristics, water quality,phytoplankton diversity, and aquatic insects for each focalarea follows.
Coliforms: General Considerations
The results of qualitative tests for the presence or absence ofcoliform bacteria at the sampling points are presented inTable 2.2. It will be necessary to continue this investigationin greater detail in order to reach conclusions regarding themanagement of water resources in LTNP. These results,however, provide a cursory view of the impact of humanactivities on water bodies in the park. About 37% of thesample points revealed the presence of total coliforms, and13.3% of the points revealed fecal coliforms. Patterns ofwater quality within the park is discussed below.
Table 2.2. Results of a qualitative determinationof coliform presence at the sampling points.
Sample Point Total Coliforms FecalColiforms
SP1 – –SP2 – –SP3 – –SP4 – –SP5 – –SP6 – –SP7 – –SP8 – –SP9 – –SP10 – –SP11 – –SP12 – –E1 + –E2 + –E3 – –E5 + –E6 – –E7 – –E8 + –E9 – –E10 + +E11 + +F1 + +F2 + +F5 – –C1 + –C2 – –C3 – –CA1 + –CA2 + –
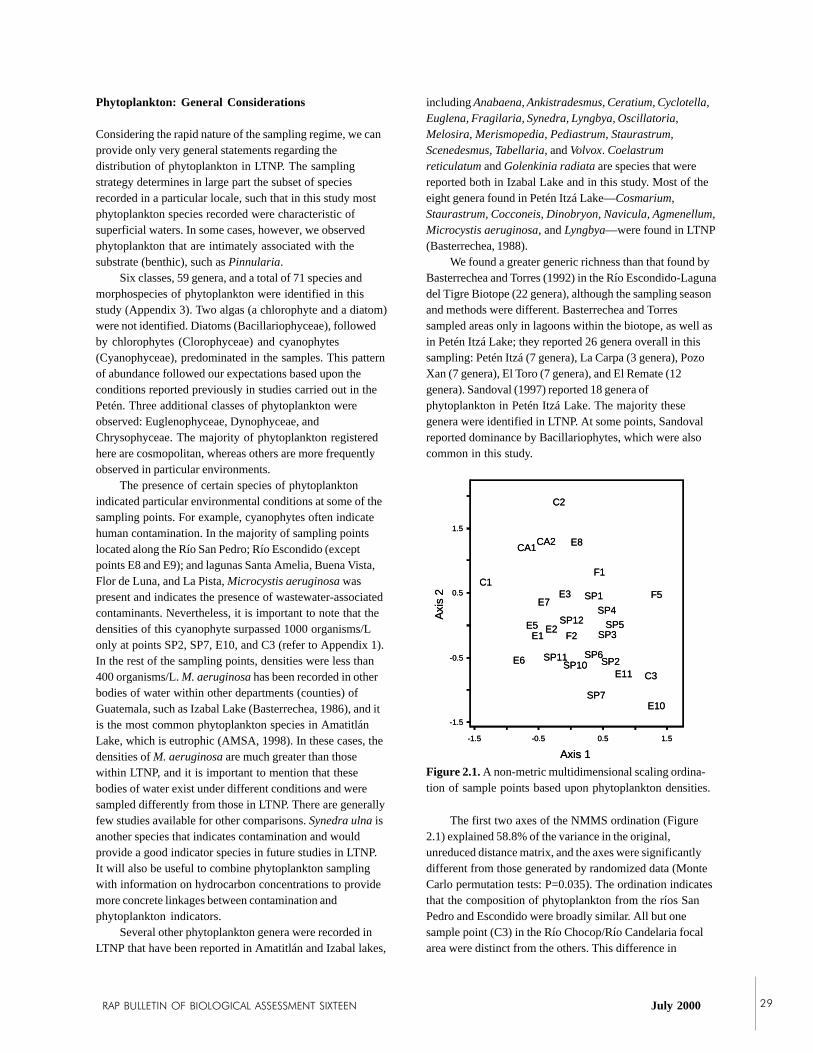
RAP BULLETIN OF BIOLOGICAL ASSESSMENT SIXTEEN July 2000 29
Phytoplankton: General Considerations
Considering the rapid nature of the sampling regime, we canprovide only very general statements regarding thedistribution of phytoplankton in LTNP. The samplingstrategy determines in large part the subset of speciesrecorded in a particular locale, such that in this study mostphytoplankton species recorded were characteristic ofsuperficial waters. In some cases, however, we observedphytoplankton that are intimately associated with thesubstrate (benthic), such as Pinnularia.
Six classes, 59 genera, and a total of 71 species andmorphospecies of phytoplankton were identified in thisstudy (Appendix 3). Two algas (a chlorophyte and a diatom)were not identified. Diatoms (Bacillariophyceae), followedby chlorophytes (Clorophyceae) and cyanophytes(Cyanophyceae), predominated in the samples. This patternof abundance followed our expectations based upon theconditions reported previously in studies carried out in thePetén. Three additional classes of phytoplankton wereobserved: Euglenophyceae, Dynophyceae, andChrysophyceae. The majority of phytoplankton registeredhere are cosmopolitan, whereas others are more frequentlyobserved in particular environments.
The presence of certain species of phytoplanktonindicated particular environmental conditions at some of thesampling points. For example, cyanophytes often indicatehuman contamination. In the majority of sampling pointslocated along the Río San Pedro; Río Escondido (exceptpoints E8 and E9); and lagunas Santa Amelia, Buena Vista,Flor de Luna, and La Pista, Microcystis aeruginosa waspresent and indicates the presence of wastewater-associatedcontaminants. Nevertheless, it is important to note that thedensities of this cyanophyte surpassed 1000 organisms/Lonly at points SP2, SP7, E10, and C3 (refer to Appendix 1).In the rest of the sampling points, densities were less than400 organisms/L. M. aeruginosa has been recorded in otherbodies of water within other departments (counties) ofGuatemala, such as Izabal Lake (Basterrechea, 1986), and itis the most common phytoplankton species in AmatitlánLake, which is eutrophic (AMSA, 1998). In these cases, thedensities of M. aeruginosa are much greater than thosewithin LTNP, and it is important to mention that thesebodies of water exist under different conditions and weresampled differently from those in LTNP. There are generallyfew studies available for other comparisons. Synedra ulna isanother species that indicates contamination and wouldprovide a good indicator species in future studies in LTNP.It will also be useful to combine phytoplankton samplingwith information on hydrocarbon concentrations to providemore concrete linkages between contamination andphytoplankton indicators.
Several other phytoplankton genera were recorded inLTNP that have been reported in Amatitlán and Izabal lakes,
including Anabaena, Ankistradesmus, Ceratium, Cyclotella,Euglena, Fragilaria, Synedra, Lyngbya, Oscillatoria,Melosira, Merismopedia, Pediastrum, Staurastrum,Scenedesmus, Tabellaria, and Volvox. Coelastrumreticulatum and Golenkinia radiata are species that werereported both in Izabal Lake and in this study. Most of theeight genera found in Petén Itzá Lake—Cosmarium,Staurastrum, Cocconeis, Dinobryon, Navicula, Agmenellum,Microcystis aeruginosa, and Lyngbya—were found in LTNP(Basterrechea, 1988).
We found a greater generic richness than that found byBasterrechea and Torres (1992) in the Río Escondido-Lagunadel Tigre Biotope (22 genera), although the sampling seasonand methods were different. Basterrechea and Torressampled areas only in lagoons within the biotope, as well asin Petén Itzá Lake; they reported 26 genera overall in thissampling: Petén Itzá (7 genera), La Carpa (3 genera), PozoXan (7 genera), El Toro (7 genera), and El Remate (12genera). Sandoval (1997) reported 18 genera ofphytoplankton in Petén Itzá Lake. The majority thesegenera were identified in LTNP. At some points, Sandovalreported dominance by Bacillariophytes, which were alsocommon in this study.
The first two axes of the NMMS ordination (Figure2.1) explained 58.8% of the variance in the original,unreduced distance matrix, and the axes were significantlydifferent from those generated by randomized data (MonteCarlo permutation tests: P=0.035). The ordination indicatesthat the composition of phytoplankton from the ríos SanPedro and Escondido were broadly similar. All but onesample point (C3) in the Río Chocop/Río Candelaria focalarea were distinct from the others. This difference in
SP1
SP2
SP3
SP4
SP5
SP6
SP7
SP10SP11
SP12
E1E2
E3
E5
E6
E7
E8
E10
E11
F1
F2
F5C1
C2
C3
CA1CA2
-1.5
-1.5
-0.5 0.5 1.5
-0.5
0.5
1.5
Axis 1
Axi
s 2 SP1
SP2
SP3
SP4
SP5
SP6
SP7
SP10SP11
SP12
E1E2
E3
E5
E6
E7
E8
E10
E11
F1
F2
F5C1
C2
C3
CA1CA2
-1.5
-1.5
-0.5 0.5 1.5
-0.5
0.5
1.5
Axis 1
Axi
s 2
Figure 2.1. A non-metric multidimensional scaling ordina-tion of sample points based upon phytoplankton densities.

CONSERVATION INTERNATIONAL Rapid Assessment Program30
Río San Pedro River Focal AreaClassification of macrohabitatsAt the 12 sample stations along the Río San Pedro (withprefix S), five distinct macrohabitat types were encountered(Table 2.3; refer to Appendix 1).
Figure 2.2. Patterns of richness of insect orders inhabiting Salvinia auriculata in samples in the Río San Pedro focal area of LTNP.
composition is related to the generally low richness in all ofthe Chocop/Candelaria samples except C3, which wasrelatively species rich (Appendix 3). Despite the ecologicalsimilarities between lagunas Guayacán (C2) and La Pista(C3) (see below), as well as their spatial proximity, theselagoons harbored distinct phytoplankton floras. NMMS axisscores were regressed upon environmental variables fromTable 2.1 to explore which environmental variables are bestcorrelated with patterns in plankton composition. Axis 1scores positively correlated with only pH (R2=0.14; F=4.13;df=1, 25; P=0.053), and axis 2 scores positively correlatedwith conductivity (R2=0.15; F=4.46; df=1, 25; P=0.045).None of the environmental variables was able to explain agreat deal of variation in species composition.
In most cases, the phytoplankton densities obtainedwere not particularly high (Appendix 4). It will be importantto continue monitoring these and other sites within LTNP toevaluate changes in nutrient loads and other physico-chemical parameters and their effects on phytoplanktonproductivity.
Aquatic Insects Associated with Salvinia auriculata
S. auriculata was sufficiently common only at the Río SanPedro focal area for insect sampling. Insects were sampledfrom Arroyo Yalá (SP1), Paso Caballos (SP2), La Pista(SP3), El Sibalito (SP4), El Caracol (SP6), Río San Juan(SP7), and La Caleta (SP8) (see Appendix 5). In thesesamples, we identified 5 orders, 26 families, and 44morphospecies. The order with the largest number offamilies represented was Coleoptera (10), andEphemeroptera was represented by the least number (2;Figure 2.2).
It is important to mention that because the plants aremobile, there are occasionally connections between aquaticplants and the shoreline; therefore, many of the speciesinhabiting floating aquatic plants may also be semi-aquatic orterrestrial. Such processes may explain the presence of someColeopterans such as the Scolitids. Despite the limitedduration and extent of sampling, insect species richness on S.auriculata was considerable and indicates that moreintensive descriptive studies and monitoring of this systemare warranted.
Habitat characteristics, water quality, and phytoplanktondiversityThe Río San Pedro is characterized by a relatively lowcurrent velocity. In the Río Sacluc (SP11), water levels werequite low. Sediment samples revealed considerable erosion ofthe river margin, probably due to the constant passing ofboats.
Some general abiotic characteristics of samples from theríos San Pedro and Sacluc are presented in Table 2.3 andinclude the following:• The maximum depth of the central channel was found in
front of the Scarlet Macaw Biological Station (7.10 m;Table 2.1), and the minimum was found in front of theArroyo Yala (2.20 m).
• Samples were taken in the littoral zone of the rivers atdepths ranging from 0.95 m to 3.30 m.
• Transparency values indicated that the euphotic zonereached the river bottom at 50% of the sample points.
������������
������
��������
����������������������������
������������
������
��������
��������
���������������������������
��������������������
������������
������������
���������
��������������������������������
���������������
���������
����������������������������
��������
������������������������
����������������
����������������
���������
0
2
4
6
8
Hemipt
era
Odona
ta
Ephem
erop
tera
Coleop
tera
Dipter
a
Orders
Mo
rph
o-s
pec
ies

RAP BULLETIN OF BIOLOGICAL ASSESSMENT SIXTEEN July 2000 31
• Water temperature was high, varying between 24.8° Cand 29.6° C.
• Dissolved oxygen concentrations were comparativelyhigh at nearly all of the sample points.
• The waters of the Río San Pedro possess a compara-tively high electrical conductivity. This characteristic isprobably due to the karstic landscape through which theriver flows. These waters may be classified as “hard”due to the high concentrations of calcium carbonate,which, in turn, may be related to the high conductivityvalues observed.
• Surprisingly, the pH of the water is neutral to slightlyalkaline. Considering the geomorphological characteris-tics of this karstic region, we expected to observe astrongly alkaline pH (>8.5). The relatively largequantities of organic material in the water and highwater temperatures may result in accelerated activity bydecomposers (bacterias, fungi, and yeast). Theproduction of organic acids in these alkaline waters mayproduce a nearly neutral pH (pH 8). The fast-runningsprings at arroyo La Pista (SP3) had colder water, amore acid pH, and greater electrical conductivity whencompared to the San Pedro.
• The qualitative test for total coliforms, fecal coliforms,and E. coli was negative in all the samples that weretested.
The number of phytoplankton species found ateach sampling point was similar (Appendix 3), but thepoint with the lowest richness was SP 10. Genera suchas Tetraëdron (SP2, SP3); Kirchneriella (SP2, SP3, andSP4); Synura (SP1, SP2, SP3, and SP6); and Dinobryon(SP3, SP4, and SP5) were recorded only within thisfocal area.
Notes on other invertebratesThere appeared to be a high diversity of macroinvertebratesassociated with Salvinia auriculata. About 44 distinct taxarepresenting herbivore, detritivore, predator, and raspingtrophic groups were recorded (Appendix 3). Miners that usesediment as well as living foliar tissue were also present.Approximately 10 morphospecies of adult Odonates werealso collected.
A molluscan reefIn a section of the Río San Pedro referred to locally as the“rapids,” we noted the presence of freshwater reefscomposed of bivalve molluscs. This type of aquatic systemis unique in the region and is generally uncommon in theNeotropics. The river bottom is composed of a 35-cm-deeplayer of bivalve shells. Organic sediments were absent.Living bivalves were found on the surface of the reef. Thefish Cichlasoma sunsphilium was associated with the reefand fed upon the periphyton growing on the shells. Insidethe shells various nymphs of Ephemeroptera (Baetidae) andTrichoptera as well as other bivalves, gastropods, andplatyhelminths were found. We conclude that these shellsare important microhabitats for aquatic invertebratesinhabiting the river bottom in this area.
In a stretch of river with low current, aquaticmacrophytes were observed (Nymphaea ampla andValisneria americana), forming another microhabitat forinvertebrates. Within that stretch was an accumulation offine organic material. The qualitative test for total and fecalcoliforms and E. coli was positive, coinciding with humansettlements near to the shoreline. Additionally, we identifiedthe greatest richness of phytoplankton at this point (44species), and densities were highest in the classesBacillariophyceae, followed by Cianophyceae. This was oneof the few points to harbor Tetraëdron (Appendix 3, 4).
Habitat characteristics, water quality, and phytoplanktondiversityThe Río Escondido has relatively steep banks and a narrowriver margin. The shores are composed mostly of forest,disturbed forest, and sibal. A large section of the sibal wasbeing burned during our survey. The forest at thenortheasternmost station, Punto Icaco (E8), had a relativelyclosed canopy forest of different character than theremaining parts of the Río Escondido.
The Río Escondido ends as a shallow channel andmarsh system, above which are relatively deep sections thatwiden and narrow regularly. The bottom is principally softmud, but at Punto Icaco there was much detritus, logs, and
Macrohabitat Type Sample PointsPermanent river SP 1, 4, 5, 9, 11Tributaries SP 2, 3, 6, 7Caños SP 8River embayments SP 10River rapids SP 12
Bottom TypesSediments with large particlesof organic material
SP1, 3
Sediments with small particlesof organic material and elevatedamounts of interstitial water(typical areas of deposition)
SP7, 8, 9, 10
Current VelocitySlow waters, almost stagnant SP1, 7a, 11Waters with current SP2, 3, 7b (springs)
Areas with a High Diversity ofAquatic Macrophytes
SP1, 2, 3, 6, 7
Areas without AquaticMacrophytes
SP4, 5, 8, 9, 10, 11
Table 2.3. Description of sampling points along the RíoSan Pedro.
Río Escondido Focal AreaClassification of macrohabitatsAt the 10 sample stations along the Río Escondido (withprefix E), four macrohabitat types were encountered(Table 2.4).

CONSERVATION INTERNATIONAL Rapid Assessment Program32
leaf litter. Oxbow lagoons and dead arms comprise manyhabitats to the sides of the Río Escondido, often throughsibal habitats rather than in forest. These habitats are nowshallow and have very soft mud and mud/marl bottoms.Characteristics of the Río Escondido area are summarized inTable 2.4 and include the following:• The lowest depths were recorded in the lagoons and
embayments, and the greatest depth in the river was atE8.
• Transparency reached the bottom at all samplingpoints.
• In general, the waters here had high temperatures (from26° C to 29.8° C), and the pH values were neutral toslightly alkaline (6.99 to 7.76).
• Sediments had high levels of organic material andinterstitial water.
• Electrical conductivity in the principal channel of theRío Escondido was low at 1 MS/cm. On the other hand,embayments had very high conductivity values.
• The presence of total coliforms was recorded at E1, E2,E5, and E8, and the presence of total and fecalcoliforms and E. coli was recorded at E10 and E11. Nocontamination of fecal origin was detected at the otherpoints.
• The greatest richness of phytoplankton was recorded atpoints E1 (38 spp.) and E5 (35 spp.). It rained duringthe sampling of this river, increasing its flow, so it ispossible that the phytoplankton sampling was affectedby dilution. This may have resulted in a general slightreduction in species richness when compared tosamples taken from the San Pedro. Some genera ofphytoplankton recorded here, such as Cosmarium (E1,E2, and E6) and Mallomonas (E1, E2, E5, E7, and E8),were not found in the San Pedro.
Flor de Luna Focal AreaClassification of macrohabitatsWater bodies at this site consisted exclusively of lagoons,three of which were sampled (F1, F2, and F5). Habitatcharacteristics, water quality, and planktonic communities arediscussed below for each lagoon individually.
Laguna Flor de Luna (F5)• This lagoon is shallow (1.05 m) with very high surface-
to-volume ratio. This favors the mixing of the entirewater column due to the action of wind (principallynortheast winds).
• The lagoon was homothermic (26.3° C to 26.8° C),electrical conductivity was less than 1 MS/cm, and thepH was neutral to slightly alkaline. The qualitativeanalysis for total and fecal coliforms and E. coli wasnegative.
• During the collection of sediment samples, the presenceof hydrogen sulfide gas was detected. This gas, togetherwith methane gas (CH
4), results in the chemical reduction
of inorganic nutrients in the water because reduction isfavored in the hypoxic or anoxic environment at thesediment-water interface. For this reason, benthicmacroinvertebrates were not observed in the sediments.However, water striders (Gerridae) were abundant on thesurface of leaves and in the flowers of Nymphea amplathroughout the lagoon.
• Thirty-four species of phytoplankton were recordedhere. This was one of the few points at whichTetraëdron, Micrasterias, Staurastrum, and Spirogyrawere recorded.
Laguna Santa Amelia (F2)• This lagoon was also shallow (1 m), favoring wind-
generated mixing.• As in Flor de Luna, the lagoon was homothermic (27.7°
C to 29.3° C).• Electrical conductivity ranged from 1.85 and 2 MS/cm.• Oxygen saturation was from 8.6% to 46.5% at the
surface.• The water exhibited a naturally dark color; nevertheless,
transparency persisted to the lagoon bottom.• Collection of the sediment revealed the presence of
hydrogen sulfide gas, and no benthic macroinvertebrateswere observed. Nymphea ampla was abundant acrossthe lagoon.
• Tests for the presence of total and fecal coliforms and E.coli were positive, which indicated fecal contaminationby humans and livestock. The waters of the lagoonappear to be used for human consumption, and contami-nation levels in the lagoon should be monitored. Severaluncommon phytoplankton genera were found here,including Staurastrum, Spirogyra, and Mallomonas.
Macrohabitat Type Sample PointsPermanent river E3, 8, 11River embayments E1, 2Ephemeral (shallow) river E10Oxbow lagoons E5, 6, 7, 9
Bottom TypesSediments with large particles oforganic material
none
Sediments with small particles oforganic material and elevatedamounts of interstitial water(typical areas of deposition)
all except E11
Rocky bottom E11Current Velocity
Slow waters, almost stagnant E1, 2, 7, 8, 10Waters with current E3, 9, 11
Areas with a High Diversity ofAquatic Macrophytes
E3, 8, 10
Areas without AquaticMacrophytes
the remainder
Table 2.4. Description of sampling points along the RíoEscondido.
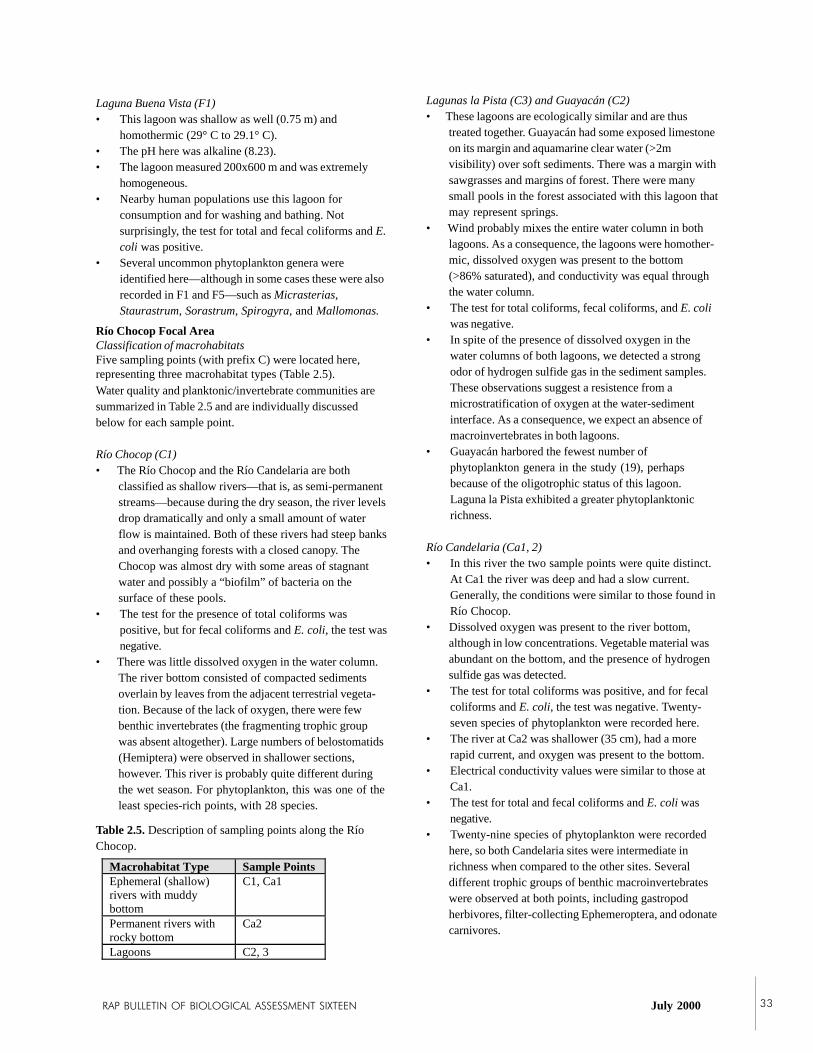
RAP BULLETIN OF BIOLOGICAL ASSESSMENT SIXTEEN July 2000 33
Laguna Buena Vista (F1)• This lagoon was shallow as well (0.75 m) and
homothermic (29° C to 29.1° C).• The pH here was alkaline (8.23).• The lagoon measured 200x600 m and was extremely
homogeneous.• Nearby human populations use this lagoon for
consumption and for washing and bathing. Notsurprisingly, the test for total and fecal coliforms and E.coli was positive.
• Several uncommon phytoplankton genera wereidentified here—although in some cases these were alsorecorded in F1 and F5—such as Micrasterias,Staurastrum, Sorastrum, Spirogyra, and Mallomonas.
Water quality and planktonic/invertebrate communities aresummarized in Table 2.5 and are individually discussedbelow for each sample point.
Río Chocop (C1)• The Río Chocop and the Río Candelaria are both
classified as shallow rivers—that is, as semi-permanentstreams—because during the dry season, the river levelsdrop dramatically and only a small amount of waterflow is maintained. Both of these rivers had steep banksand overhanging forests with a closed canopy. TheChocop was almost dry with some areas of stagnantwater and possibly a “biofilm” of bacteria on thesurface of these pools.
• The test for the presence of total coliforms waspositive, but for fecal coliforms and E. coli, the test wasnegative.
• There was little dissolved oxygen in the water column.The river bottom consisted of compacted sedimentsoverlain by leaves from the adjacent terrestrial vegeta-tion. Because of the lack of oxygen, there were fewbenthic invertebrates (the fragmenting trophic groupwas absent altogether). Large numbers of belostomatids(Hemiptera) were observed in shallower sections,however. This river is probably quite different duringthe wet season. For phytoplankton, this was one of theleast species-rich points, with 28 species.
Lagunas la Pista (C3) and Guayacán (C2)• These lagoons are ecologically similar and are thus
treated together. Guayacán had some exposed limestoneon its margin and aquamarine clear water (>2mvisibility) over soft sediments. There was a margin withsawgrasses and margins of forest. There were manysmall pools in the forest associated with this lagoon thatmay represent springs.
• Wind probably mixes the entire water column in bothlagoons. As a consequence, the lagoons were homother-mic, dissolved oxygen was present to the bottom(>86% saturated), and conductivity was equal throughthe water column.
• The test for total coliforms, fecal coliforms, and E. coliwas negative.
• In spite of the presence of dissolved oxygen in thewater columns of both lagoons, we detected a strongodor of hydrogen sulfide gas in the sediment samples.These observations suggest a resistence from amicrostratification of oxygen at the water-sedimentinterface. As a consequence, we expect an absence ofmacroinvertebrates in both lagoons.
• Guayacán harbored the fewest number ofphytoplankton genera in the study (19), perhapsbecause of the oligotrophic status of this lagoon.Laguna la Pista exhibited a greater phytoplanktonicrichness.
Río Candelaria (Ca1, 2)• In this river the two sample points were quite distinct.
At Ca1 the river was deep and had a slow current.Generally, the conditions were similar to those found inRío Chocop.
• Dissolved oxygen was present to the river bottom,although in low concentrations. Vegetable material wasabundant on the bottom, and the presence of hydrogensulfide gas was detected.
• The test for total coliforms was positive, and for fecalcoliforms and E. coli, the test was negative. Twenty-seven species of phytoplankton were recorded here.
• The river at Ca2 was shallower (35 cm), had a morerapid current, and oxygen was present to the bottom.
• Electrical conductivity values were similar to those atCa1.
• The test for total and fecal coliforms and E. coli wasnegative.
• Twenty-nine species of phytoplankton were recordedhere, so both Candelaria sites were intermediate inrichness when compared to the other sites. Severaldifferent trophic groups of benthic macroinvertebrateswere observed at both points, including gastropodherbivores, filter-collecting Ephemeroptera, and odonatecarnivores.
Macrohabitat Type Sample PointsEphemeral (shallow)rivers with muddybottom
C1, Ca1
Permanent rivers withrocky bottom
Ca2
Lagoons C2, 3
Río Chocop Focal AreaClassification of macrohabitatsFive sampling points (with prefix C) were located here,representing three macrohabitat types (Table 2.5).
Table 2.5. Description of sampling points along the RíoChocop.

CONSERVATION INTERNATIONAL Rapid Assessment Program34
CONCLUSIONS AND RECOMMENDATIONS
With respect to the conservation and management of aquaticecosystems in the park, two recommendations are offered:
• There is an urgent need to conserve the rapids of theRío San Pedro. These rapids possess a unique freshwa-ter reef system that may also serve an importantfunction by filtering suspended particles from the water.
• Many lagoons and streams within the park are littlecontaminated, and action should be taken to ensure theircontinued health.
With respect to future studies and monitoring the aquaticsystems within the region, five recommendations are offered:
• Future studies should be executed at the basin scale andshould be conducted over longer periods, encompassingthe variation between the dry and wet seasons. Samplesshould be taken at different depths, and total anddissolved nutrients should be considered.
• The effects of human activities on the landscape, suchas agriculture and the subsequent runoff of chemicalsand waste, need to be evaluated at the basin scale.
• For phytoplankton monitoring, it would be useful tostandardize sampling times among different samplepoints in order to avoid the effects of diel variation inthe movement of plankton in the water column. Thiswould reduce bias in comparisons among samples.
• Densities of coliform bacteria should be monitored andquantified in order to track accurately the degree of fecalcontamination in the park and to identify those areasthat are sources of contamination throughout the park.
• More intensive monitoring of aquatic insect populationsneeds to be initiated, and samples should be taken atdifferent times of year in order to understand the effectsof natural temporal variation and how this may interactwith spatial variation caused by both natural andanthropogenic processes.
LITERATURE CITED
AMSA. 1998. Listado de Géneros Determinados de Algasen el Lago de Amatitlan. Secretaria de la República deGuatemala.
Basterrechea, M. 1986. Limnología del Lago de Amatitlán.Revista de Biologia Brasileira 46: 461-468.
Basterrechea, M. 1988. Limnología del Lago Petén Itzá,Guatemala. Revista de Biología Tropical 35: 123-127.
Basterrechea, M. 1991. Evaluación del Impacto Ambientalde la Exploración Sísmica en la Cuenca del Lago deIzabal. Guatemala.
Basterrechea, M., and M. Torres. 1992. Hidrología yLimnología de los Humedales del Biotopo RíoEscondido-Laguna del Tigre, Petén-Guatemala.Centro de Estudios Conservacionistas y FundaciónMario Dary, Guatemala.
Herrera, K. 1999. Indicadores de la calidad del agua del RíoPolochic y de la integridad biológica del Lago deIzabal. Master’s thesis. Departamento de Biología,Universidad del Valle de Guatemala.
McCafferty, P. 1998. Aquatic Entomology. Jones andBartlett Publishers, Sudbury, MA, USA.
McCune, B., and M. J. Mefford. 1999. PC-ORD.Multivariate Analysis of Ecological Data, version 4.0.MjM Software Design, Gleneden Beach, OR, USA.
Merritt, R. W., and K. W. Cummins. 1984. An Introductionto the Aquatic Insects of North America, 2nd ed.Kendall-Hunt Publishing Company, IA, USA.
Sandoval, K. 1997. Fitoplancton como indicadores decontaminación en tres regiones del Lago Petén Iztá.Informe final, Programa E.D.C. Escuela de Biología,Universidad de San Carlos de Guatemala.
UNESCO. 1971. Memorias del Seminario sobreIndicadores Biológicos del Plankton. Oficina Regionalde Ciencia y Tecnología para América Latina y elCaribe, Montevideo, Uruguay.
35 RAP BULLETIN OF BIOLOGICAL ASSESSMENT SIXTEEN July 2000
ABSTRACT
• A vascular flora of more than 130 species, 120 genera,and 67 families was recorded in and adjacent to aquatichabitats in Laguna del Tigre National Park (LTNP).This flora is similar in composition to that of neighbor-ing areas in the Yucatán Peninsula, but it will benecessary to expand the study in order to provide moreprecise comparisons.
• LTNP’s vegetation includes a variety of communitiessuch as tall- or medium-statured riparian forests, shortforests (bosques bajos), flooded palm savanna, andremnants of mangroves.
• A population of Vallisneria americana associated withbivalve reef rapids was unique. Another site withsmaller bivalve deposits in the Río Escondido wasespecially rich in species. Natural disturbance such asseasonal flooding and erosion cause communities to behighly dynamic.
• Anthropogenic disturbances such as fire are altering thenatural extent and composition of vegetation in LTNP.
INTRODUCTION
Guatemala is one of the few countries in Central Americathat has a well-studied flora and a long history of botanicalcollection (e.g. Standley, 1924-1964; Williams, 1966-1975).Nevertheless, few studies specifically address the vascularaquatic flora (e.g. de Poll, 1983).
For the Guatemalan Petén, the first botanical studieswere performed in the first part of the 20th century andwere associated with archeological explorations (Lundell,
1937). For this reason, the interest in understanding thecultural changes of the past has been tied to interpretationsof changes in forest cover (Deevey et al., 1979; Islebe et al.,1996). These interpretive studies of historical, social, andenvironmental changes are based in paleolimnologicalstudies; however, this work does little to broaden ourknowledge of the current aquatic macroflora of the region.
The heterogeneity of the terrestrial forest vegetation inthe Petén is unquestionable (Deevey et al., 1979). Theseasonal flooding that occurs in marshes and the distur-bances it produces also creates a great deal of heterogeneityin the expression of floristic elements of aquatic plantcommunities.
Laguna del Tigre National Park (LTNP) is associatedwith the presence of extensive areas of marshland, locatedamong a broad range of types of aquatic habitats (Table 3.1)in which the macrophytes constitute the most conspicuouselements. Our objective is to describe the relationshipsbetween the aquatic flora and these macrohabitats and todescribe the communities formed within them.
METHODS
Aquatic macrophytes were defined in this study as vascularplants that are permanently submerged in water (trueaquatics) and plants with roots in supersaturated or floodedsoils with the rest of the plant being emergent (amphibious).
Macrohabitat definitions were based on the hydrologyof the sample points (see Herrera et al., this volume). Withrespect to aquatic macrophytes, six macrohabitats wererecognized: rivers, streams, lagoons, oxbow lagoons, caños,and rapids (freshwater reefs). Of these, the rivermacrohabitat was subdivided into those exhibiting perma-nent (deep) water, ephemeral (shallow) water, and rapidsdepending upon the volume of water and substrate type.The rapids constitute a part of permanent river habitats.
CHAPTER 3
THE AQUATIC MACROPHYTECOMMUNITIES OF LAGUNA DELTIGRE NATIONAL PARK, PETEN,GUATEMALA
Blanca León and Julio Morales Can

CONSERVATION INTERNATIONAL Rapid Assessment Program36
Aquatic vegetation types were classified by physiog-nomy and were subdivided according to associationsobserved within transects. Two vegetation types wererecognized in this study: riparian forest and marsh. Woodyplants characterize riparian forests, while herbaceous plantscharacterize marshes. Names used for associations employedlocal terminology recognized in previous studies (Morales,unpublished).
We established temporary transects among the twovegetation types. Along each transect, we recorded thecomposition of macrophytes found within 50x50-cmquadrats. In lotic (i.e. running water) environments, quadratswere randomly placed along the riverbank at 10-m intervals.In lentic (i.e. standing water) environments, quadrats wereplaced across the maximum diameter of the water body atsimilar intervals. For each quadrat, we recorded the depth ofthe substrate, distance to shore, and the species of plantsvisible within two meters of the quadrat. To sample riparianforest, three transects (100 m in length) were establishedalong the riverbank, each separated by 100 m. Along thesetransects we recorded all woody individuals that had morethan 50% of their root mass in the water.
Voucher specimens of all fertile vascular plants that werecorded were collected. Plants were prepared in a plantpress and later placed in alcohol in preparation for final ovendrying. Identifications were performed using collections atthe Field Museum of Chicago, USA.
RESULTS AND DISCUSSION
Floristic Composition of LTNP
A total of 67 families, 120 genera, and more than 130 speciesof vascular plants were recorded in marshes, riparian forests,and seasonally flooded forests (Appendix 6). Of these, 33families include aquatic and/or amphibious species, and theother 34 are represented by terrestrial species, both woodyand herbaceous, as well as epiphytes that can tolerate shortperiods of flooding.
The most diverse families were the Cyperaceae andFabaceae, both of which contain terrestrial and amphibiousspecies. The Cyperaceae and legumes also contain the mostconspicuous elements of both marshes and riparian forests.Among the Cyperaceae, Cladium jamaicense (sibal) is thedominant element of marsh landscape. This plant formsextensive, dense colonies, and its basal parts form asubstrate that favors the establishment of terrestrial plantseedlings such as those of the Asclepiadaceae,Cucurbitaceae, and Passifloraceae families. Among thelegumes, Mimosa pigra and Haemotoxylum campecheanum(tinto) are dominant components of riparian forest. Otherdominant families include the palms (Arecaceae) and grasses(Poaceae). Both are important in terrestrial and aquatichabitats.
The composition of the aquatic and amphibious plantsreflects linkages to the Mexican flora (Lot and Novelo, 1990;Martínez and Novelo, 1993); there are no taxa that areendemic to the study area. A few species are known onlyfrom Central America, including Cabomba palaeformis andHaemotoxylum campecheanum. The most speciose genus ofthe aquatic plants was Utricularia, and the most speciose ofthe amphibious plants was Eleocharis.
Fifty-four of the species recorded in the park areaquatic or amphibious (Appendix 6). Nine species possessflowers that are strictly aquatic: Brassenia schreberi,Cabomba palaeformis, Najas wrightiana, Nymphaea ampla,Pistia stratiotes, Utricularia foliosa, U. gibba, U. sp., andVallisneria americana. These species represent six families:Araceae, Cabombaceae, Hydrocharitaceae, Lentibulariaceae,Najadaceae, and Nymphaeaceae. Two were floating plants:Salvinia auriculata and S. minima. For the entire state ofCampeche, and in the Yucatán Peninsula, Lot et al. (1993)mentioned 33 plants with strictly aquatic flowers. It ispossible that we did not record several families that may existin the park, including the Ceratophyllaceae, Lemnaceae,Menyanthaceae, and Sphenocleaceae.
Vegetation Types
The plains of the Yucatán Peninsula—particularly the“forested wetlands”—have rich marshlands (Lot andNovelo, 1990). These forested wetlands occur as a mosaicwith marshes (herbaceous wetlands) in both the park and thebiotope. The abundance of each of these vegetation typesvaries, in part, due to processes such as the seasonalvariation in precipitation that modifies the saturation of thesubstrate as well as human disturbances. The hydrologicalproperties of the area undoubtedly play an important role inmaintaining the mosaic (Lugo et al., 1990).
MarshMarsh is without doubt the vegetation type most dominatedby truly aquatic vegetation. Marsh occupies the lowestparts of the park and is probably associated with sedimentsdeposited by the river or at the eroded margins of lenticenvironments. These plants also form small communitiesalong banks which are dominated by riparian forest. Thepresence of truly aquatic plants is, in part, related to thedepth and type of substrate, the level of a site’s protectionfrom strong currents, and the frequency of disturbance.Amphibious species dominate the marshes.
Marshes in LTNP are composed of various associationsdominated by Cladium jamaicense (the association calledsibal). C. jamaicense and Phragmites australis (sibal-carrizo)exist largely along the Río San Pedro to the mouth of the RíoEscondido. The C. jamaicense and Typha domingensisassociation (sibal-tul) is apparently rare and occurs only atArroyo la Pista (SP3). The C. jamaicense and Acoelorraphe
RAP BULLETIN OF BIOLOGICAL ASSESSMENT SIXTEEN July 2000 37
wrightii association (sibal-tasiste) dominates the margins ofthe Río Escondido.
Marsh represents the most diverse vegetation typewith respect to the numbers of aquatic and amphibiousspecies as well as to terrestrial taxa such as theAsclepiadaceae, Convolvulaceae, Cucurbitaceae, andPassifloraceae. Terrestrial vegetation is favored in sibal thathas recently burned, usually during the dry season. Firesburn heterogeneously in sibal, leaving a mosaic of heavilyburned areas mixed with areas in which only the upper partsof plants have burned. The heterogeneity produced by fire isalso reflected in the regrowth of woody species located onthe banks of the marsh.
Another factor that affects the marsh and its biota isthe change in drainage patterns due to the construction ofroads. One can observe bodies of water along the accessroutes to the lagoons that are filled with grasses andsawgrass.
Forested WetlandsThis type of marsh is difficult to delimit during the dryseason because only the lowest limit of its extent can beobserved during this period. In Mexico this type of marsh isrecognized in various classes, including tall and mediumriparian forest, short riparian forests, wetland palm thickets,and mangroves (Lot and Novelo, 1990). All four of thesetypes are present in LTNP.
The tall riparian forest is dominated by Pachiraaquatica, Inga vera, Lonchocarpus hondurensis, andPhitecellobium sp. and can be seen near the GuacamayasBiological Station (LGBS) on the Río San Pedro. These areamong the tallest forests in the area, but the trees rarelyexceed 30 m due to the absence of deep soils. Short riparianforest comprised the majority of the forested areas weexamined. They are represented by diverse associationswhich are dominated by Haematoxylum campechianum(tintal), which occurs at the Laguna Flor de Luna (F1).Additionally, the Bucida buceras and Pachira aquatica(pucte-zapote bobo) association occurs in parts of the ríosSan Pedro and Sacluc; the B. buceras and Metopium (pucte-chechen negro) association occurs at Laguna Guayacán (F5);and B. buceras and Diospyros occurs in the upper part ofthe Río Escondido, where Chrysobalanus icaco andMetopium sp. were also found. The most common associa-tion was the Bucida-Pachira, especially along the Río SanPedro (SP6, SP9, and the rapids) and the Río Sacluc (Table3.1). In general, the riparian forest is less species-rich inaquatic macrophytes than the marsh (Table 3.1). Neverthe-less, other species—some of which have economic impor-tance for local populations (e.g. Calophyllum brasiliense)—may appear in this forest in a cyclic fashion.
The flooded palm thicket is conspicuously developedin the middle and upper Río Escondido. The “tasistal”describes one of its principal associations—that in which
Acoelorraphe wrightii is dominant and is accompanied byherbs such as Cladium jamaicense, Osmunda regalis var.spectabilis, or trees of Pachira aquatica.
The mangrove is not developed in the study area. Onlya few individuals of Rhizophora mangle occupy the marginsof the Río San Pedro and are surrounded by an altered“sibal.” This isolated population is the most continentalknown form of the peninsula (Nicholas Brokaw, pers.comm.). It is located outside the park and consequentlyreceives no official protection.
All vegetation types are subjected to burning, eitherdirectly through the use of fire for deer hunting or indirectlythrough fires that escape adjacent slash-and-burn agriculturalplots. The effects of fire in marshland and its impact onbiodiversity was difficult to evaluate in this short-termstudy. SP7 was burned one year before the study, and SP13was burned four years before the study (Table 3.1). In theformer, we recorded 17 species; in the latter, we recorded 19species. Both shared the majority of their species. It wouldbe useful to record the impact of these disturbances overlonger periods. Equally interesting would be a studydocumenting the survival probability of certain plant specieswhen their aerial parts are lost during fires. We observed thatin partially burned clusters of basal branches, the pseudo-bulbs of the orchids Eulophia and Habenaria can survive.
Aquatic Macrohabitats and Their Floral Characteristics
Based on the characteristics of the river bed and theseasonality of flow, riverine habitats can be subdivided intopermanent river, seasonal river, and rapid macrohabitats(refer to Table 1.1).
Permanent (deep) river was sampled in six localities:four in the Río San Pedro, one in the Río Sacluc, and one inthe Río Escondido (Table 3.1). These areas are characterizedby beds of calcic rock, deep waters, and water flowthroughout the year. This habitat sustains a mosaic ofriparian forest types and marshes. The greatest variation inaquatic environments, vegetation types, and numbers ofaquatic macrophyte species was found in the Río San Pedro.Our records suggest that the river macrohabitat is one of themost diverse even though the majority of its species are notunique to this macrohabitat.
The shallow river macrohabitat was sampled in threelocations in three different focal areas (Table 3.1). Of these,only E10 was in an area that was extensively modified byhuman activity. This sample point was surrounded by adepauperate secondary forest, dominated by Bucida buceraswith Mimosa pigra shrubs. Floating aquatic plants werelimited to Salvinia minima. In the case of the ríos Chocopand Candelaria, each had riparian forests characterized bydistinct associations that were apparently undisturbed. Theriparian forest at Chocop harbored Bucida buceras andMatayba, while the forest at Candelaria consisted of the
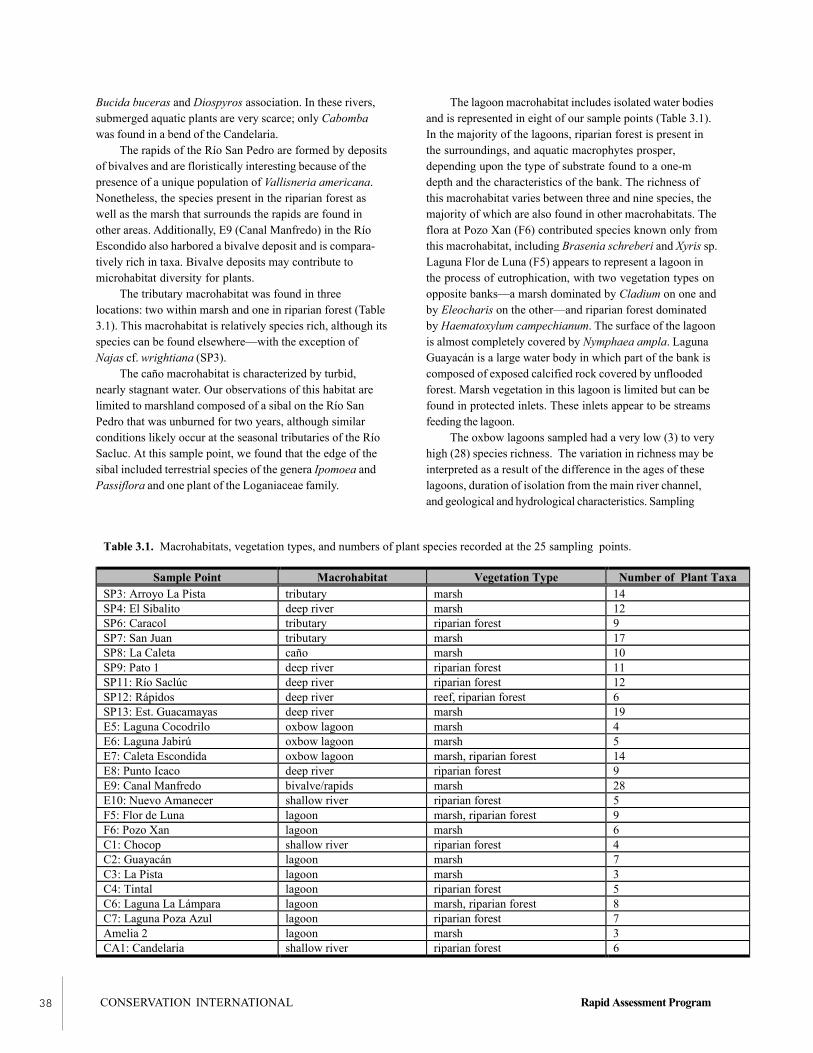
CONSERVATION INTERNATIONAL Rapid Assessment Program38
Table 3.1. Macrohabitats, vegetation types, and numbers of plant species recorded at the 25 sampling points.
Sample Point Macrohabitat Vegetation Type Number of Plant TaxaSP3: Arroyo La Pista tributary marsh 14SP4: El Sibalito deep river marsh 12SP6: Caracol tributary riparian forest 9SP7: San Juan tributary marsh 17SP8: La Caleta caño marsh 10SP9: Pato 1 deep river riparian forest 11SP11: Río Saclúc deep river riparian forest 12SP12: Rápidos deep river reef, riparian forest 6SP13: Est. Guacamayas deep river marsh 19E5: Laguna Cocodrilo oxbow lagoon marsh 4E6: Laguna Jabirú oxbow lagoon marsh 5E7: Caleta Escondida oxbow lagoon marsh, riparian forest 14E8: Punto Icaco deep river riparian forest 9E9: Canal Manfredo bivalve/rapids marsh 28E10: Nuevo Amanecer shallow river riparian forest 5F5: Flor de Luna lagoon marsh, riparian forest 9F6: Pozo Xan lagoon marsh 6C1: Chocop shallow river riparian forest 4C2: Guayacán lagoon marsh 7C3: La Pista lagoon marsh 3C4: Tintal lagoon riparian forest 5C6: Laguna La Lámpara lagoon marsh, riparian forest 8C7: Laguna Poza Azul lagoon riparian forest 7Amelia 2 lagoon marsh 3CA1: Candelaria shallow river riparian forest 6
Bucida buceras and Diospyros association. In these rivers,submerged aquatic plants are very scarce; only Cabombawas found in a bend of the Candelaria.
The rapids of the Río San Pedro are formed by depositsof bivalves and are floristically interesting because of thepresence of a unique population of Vallisneria americana.Nonetheless, the species present in the riparian forest aswell as the marsh that surrounds the rapids are found inother areas. Additionally, E9 (Canal Manfredo) in the RíoEscondido also harbored a bivalve deposit and is compara-tively rich in taxa. Bivalve deposits may contribute tomicrohabitat diversity for plants.
The tributary macrohabitat was found in threelocations: two within marsh and one in riparian forest (Table3.1). This macrohabitat is relatively species rich, although itsspecies can be found elsewhere—with the exception ofNajas cf. wrightiana (SP3).
The caño macrohabitat is characterized by turbid,nearly stagnant water. Our observations of this habitat arelimited to marshland composed of a sibal on the Río SanPedro that was unburned for two years, although similarconditions likely occur at the seasonal tributaries of the RíoSacluc. At this sample point, we found that the edge of thesibal included terrestrial species of the genera Ipomoea andPassiflora and one plant of the Loganiaceae family.
The lagoon macrohabitat includes isolated water bodiesand is represented in eight of our sample points (Table 3.1).In the majority of the lagoons, riparian forest is present inthe surroundings, and aquatic macrophytes prosper,depending upon the type of substrate found to a one-mdepth and the characteristics of the bank. The richness ofthis macrohabitat varies between three and nine species, themajority of which are also found in other macrohabitats. Theflora at Pozo Xan (F6) contributed species known only fromthis macrohabitat, including Brasenia schreberi and Xyris sp.Laguna Flor de Luna (F5) appears to represent a lagoon inthe process of eutrophication, with two vegetation types onopposite banks—a marsh dominated by Cladium on one andby Eleocharis on the other—and riparian forest dominatedby Haematoxylum campechianum. The surface of the lagoonis almost completely covered by Nymphaea ampla. LagunaGuayacán is a large water body in which part of the bank iscomposed of exposed calcified rock covered by unfloodedforest. Marsh vegetation in this lagoon is limited but can befound in protected inlets. These inlets appear to be streamsfeeding the lagoon.
The oxbow lagoons sampled had a very low (3) to veryhigh (28) species richness. The variation in richness may beinterpreted as a result of the difference in the ages of theselagoons, duration of isolation from the main river channel,and geological and hydrological characteristics. Sampling
RAP BULLETIN OF BIOLOGICAL ASSESSMENT SIXTEEN July 2000 39
point E9 (Canal Manfredo) included species found nowhereelse in this study, such as two species of Utricularia,Sagittaria lanciforme, Hydrocotyle cf. bonariensis, and anorchid, among others.
CONCLUSIONS AND RECOMMENDATIONS
• It should be a priority to understand the physicalcharacteristics and hydrology of the areas within andaround the park in order to better understand theprocesses that determine the heterogeneity of vegetationin marshes, as well as to manage and prevent contamina-tion of the watersheds.
• The impact of oil development activities should beevaluated, and the changes generated by the construc-tion of roads and their effects on water drainage shouldbe considered.
• Future biological studies should evaluate the richnessand composition in each watershed in the area andshould relate these patterns to broad-scale patternsacross the Yucatán Peninsula.
• It should be a priority to recognize and distinguish thenatural and anthropogenic processes that affect theaquatic ecosystems of the park.
• Fire constitutes one the most important perturbationsin the park and affects all types aquatic environments.Medium to long-term studies should be directed atdetermining the effects of fire on plant populations inmarshes as well as riparian forests.
• Riparian vegetation that occurs along shallow riverssuch as the Chocop and Candelaria differs from thatoccurring alongside larger, deeper rivers such as the SanPedro. Thus, each of these forest types should beconserved with similar effort. The presence ofArthrostylidium sp. along the Candelaria should be causefor concern because the species spreads aggressively inareas subjected to burning.
• The Río Sacluc should be incorporated within the LTNPso that the oak (Quercus sp.) forest (encinal) there maybe protected, as well as the riparian forests that connectwith the San Pedro.
• Areas with bivalve deposits in the Río Escondido arespecies rich and vulnerable to destruction due to erosion
caused by the passage of motor boats, widening of thechannel, and fire. The rapids of the Río San Pedroharbors unique populations, and this area should beconserved.
• There is a potential threat of petroleum contaminationin Río Escondido because the pipeline passes near theheadwaters of this river. Considering the devastatingeffect an oil spill could have throughout the watershed,a plan should be created to prevent such an event.
LITERATURE CITED
Deevey, E. S., D. S. Rice, P. M. Rice, H. H. Vaughan, M.Brenner, and M. Flannery. 1979. Mayan urbanism:impact on a tropical karst environment. Science 206:298-306.
Islebe, G. A., H. Hooghiemstra, M. Brenner, D. A. Hodell,and J. Curtis. 1996. A Holocene vegetation history oflowland Guatemala (Lake Petén-Itza). Doctoraldissertation. Amsterdam, the Netherlands.
Lot, A., and A. Novelo. 1990. Forested wetlands ofMexico. Pp. 287-298 in Ecosystems of the World 15:Forested Wetlands (A. E. Lugo, M. Brinson, and S.Brown, eds.). Elsevier, Amsterdam, the Netherlands.
Lot, A., A. Novelo, and P. Ramirez-García. 1993. Diver-sity of Mexican aquatic vascular plant flora. Pp. 577-591 in Biological Diversity of Mexico: Origins andDistribution (T. P. Ramamoorthy, R. Bye, A. Lot, andJ. Fa, eds.). Oxford University Press, New York, NY,USA.
Lugo, A. E., M. Brinson, and S. Brown. 1990. Synthesisand search for paradigms in wetland ecology. Pp. 447-460 in Ecosystems of the World 15: Forested Wetlands(A. E. Lugo, M. Brinson, and S. Brown, eds.).Elsevier, Amsterdam, the Netherlands.
Lundell, C. L. 1937. The vegetation of Petén. Publication478. Carnegie Institution of Washington, Washington,DC, USA.
Martínez, M., and A. Novelo. 1993. La vegetación acuáticadel Estado de Tamaulipas, México. Anales Inst. Biol.Univ. Nac. Autón. México, Ser. Bot. 64: 59-86.
Morales Can, J. 1998. Tesis de bachillerato. UniversidadNacional de San Carlos, Guatemala.
CONSERVATION INTERNATIONAL Rapid Assessment Program40
de Poll, E. 1983. Plantas acuáticas de la region El Estor,Izabal. Universidad de San Carlos de Guatemala,Facultad de Ciencias Quimicas y Farmacia. Escuelade Biologia, Guatemala.
Standley, P. 1924-1964. Flora of Guatemala. FieldianaBotany Vol. 24. Field Museum of Natural History,Chicago, IL, USA.
Williams, L. O. 1966-1975. Flora of Guatemala. FieldianaBotany Vol. 24. Field Museum of Natural History,Chicago, IL, USA.
41 RAP BULLETIN OF BIOLOGICAL ASSESSMENT SIXTEEN July 2000
ABSTRACT
• Freshwater fishes were collected at 48 localities withinfive regional focal points in Laguna del Tigre NationalPark (LTNP) and the biotope.
• Forty-one fish species were captured out of 55 knownor suspected to occur within the region. Several speciescaptured represent new records for the Río San PedroBasin in Guatemala (including Batrachoides goldmani,Mugil curema, and Aplodinotus grunniens). Two exoticspecies were found: the tilapia (Oreochromis sp.) andthe grass carp (Ctenopharyngodon idella). Twoundescribed species were captured, one ariid catfish andone belonging to the genus Atherinella.
• Our results show that most of the species known fromthe Río San Pedro 60 years ago are still present.
• The Río San Pedro focal point is the most diverse, butwith a few exceptions, most species are distributedhomogeneously among regions within the basin oramong macrohabitats. The lagoon habitats all seemed tohave about a dozen species regardless of the distur-bance to marginal vegetation, human use, or proximityto roads.
INTRODUCTION
The fishes living in the fresh waters of the Petén ofGuatemala and Mexico represent a relatively well-knownand well-described ichthyofauna. Largely beginning with thepublications of Alfreid Gúnther (1868) based upon thecollections of Osberd Salvin in 1859, there has been a seriesof seminal papers dealing with the fishes of this interesting
CHAPTER 4
AN ICHTHYOLOGICAL SURVEY OFLAGUNA DEL TIGRE NATIONALPARK, PETEN, GUATEMALA
Philip W. Willink, Christian Barrientos, Herman A.Kihn, and Barry Chernoff
region. C. Tate Regan (1906-08) was the first to recognizeand establish biogeographic provinces for fishes of Mexicoand Central America. Carl L. Hubbs made critical explora-tions of the southern Petén, Lake Petén-Itza, and the RíoSan Pedro in 1935. His collections form an important basisof comparison for our survey. Since Hubbs, many specieshave been described, and debates about the nature ofbiogeographic provinces have ensued (Miller, 1976).
The Río San Pedro is a major tributary of the RíoUsumacinta. The Río Candelaria is an independent affluentof the Laguna de Términos. The fishes of these basins areknown to be comprised of 48 species, based upon docu-mented museum specimens. In addition, knowledgeablesources and collections from the Río Pasión at Sayaxchésuggest five additional species, to which we add two exotics.This brings the known and potential ichthyofauna up to 55species. These species are listed in Appendix 7. Thisichthyofauna is comprised of species that live primarily infresh waters in addition to those that freely extend theirranges from marine or estuarine habitats into fresh waters,such as the mullets (Mugil spp.).
Most components of the ichthyofauna found in Lagunadel Tigre National Park (LTNP) and the biotope belong to abroadly distributed group of fishes found between the RíoCoatzacoalcos in the north and the Río Polochic/RíoSarstoon in the south. This general distribution has beenreferred to as the Río Usumacinta Province by Regan (1906-08) and Miller (1966, 1976). Although Bussing (1987) hasincluded the Río Motagua in the Río Usumacinta Province,this has received little attention. However, Chernoff (1986)found that a monophyletic group of Atherinella includes thespecies found in the Motagua, Petén-Itza, and theUsumacinta-to-Coatzacoalcos drainages. Other presumablymonophyletic groups (e.g. Phallichthys and Xiphophorus)also include the Motagua in their Usumacinta Provincedistributions. These sister-group relationships, including the

CONSERVATION INTERNATIONAL Rapid Assessment Program42
Figure 4.1. Species accumulation curve for fishes collectedduring the 1999 RAP expedition to Laguna del Tigre NationalPark, Petén, Guatemala.
Río Motagua, hypothesize the presence of commonancestors once inhabiting the Motagua and Usumacintaregions, followed by some degree of local evolution after thetwo regions became isolated, probably during the LowerTertiary (Rosen and Bailey, 1959; Rosen, 1979; Weyl,1980).
With the exception of Lake Petén-Itza and related lakes,there is little or no local endemism of fishes within Peténproper. This includes LTNP and the biotope. But we notethat there is a large degree of endemism at the level of theUsumacinta Province sensu Regan (1906-08). Thus,protected areas within the larger province must be estab-lished in order to conserve this interesting fauna. One of ourobjectives was to discover whether LTNP and the biotopecan serve this purpose. This is particularly importantbecause similar habitats have been totally or highly degradedin the neighboring Mexican states of Campeche and Tabascodue to cattle ranching and oil exploration.
The purpose of this survey was threefold: 1) todocument the biodiversity of fishes in LTNP and thebiotope; 2) to document, using rapid assessment protocols,the diversity of fishes associated with the focal points andmacrohabitats; and 3) to identify as far as possible the stateof health of the habitats, critical regions for maintenance ofbiodiversity, and potential or actual threats and theirpotential impacts.
METHODS
During the course of 20 days, 48 collections of fishes weremade (Appendices 8-9). Fishes were captured using thefollowing methods:• seines (5 m x 2 m x 3.4 mm; 1.3 m x 1 m x 1.75 mm);• cast nets (2 m, 1.5 m);• experimental gill nets (48 m);• bottom trawl (3 m); and• dip nets.Seining was very difficult because we did not find anybeaches or clear areas to pull the seines.
All fish specimens collected were initially preserved in10% formalin solution, then were transferred to 70% ethanolfor archival storage. Identifications were made in thelaboratory with the aid of original descriptions and morerecent revisionary studies (Regan, 1905; Rosen and Bailey,1959, 1963; Hubbs and Miller, 1960; Miller, 1960; Rivas,1962; Suttkus, 1963; Deckert and Greenfield, 1987;Greenfield and Thomerson, 1997; and others). Specimenswere deposited in the Field Museum in Chicago and theMuseo de Historia Natural, Universidad de San Carlos deGuatemala. To locate the diversity of fishes, as many habitattypes as possible were sampled (refer to Table 1.1). Theareas sampled were treated hierarchically. At the top level ofthe hierarchy are the focal areas described in the “Expedition
Itinerary and Gazetteer.” Within these focal areas, the entireaquatic sciences team coordinated studies at a finer scale(sample or georeference points). Our 48 samples mostlycorrespond to 40 georeference points (Appendix 1, 8). Afew of the samples are outside of these coordinated samplingregimes. Simpson’s Similarity Indices (number of taxa sharedbetween two groups/number of taxa in the smaller group)were used to make comparisons among macrohabitats, focalareas, and gear types. We chose Simpson’s Similarity Indexbecause it emphasizes presences of taxa by using the numberof species in the smaller group in the denominator (Chernoffet al., 1999). We consider absences of taxa to be ambiguousbecause a given taxa may actually be absent or it may havebeen present but avoided detection.
RESULTS AND DISCUSSION
Sampling Effectiveness
Although approximately 55 fish species are believed toinhabit the region surveyed (Appendix 7), we collected 41(Appendix 8). Some of the fishes not collected are uncom-mon in the area. Examples include Ictiobus meridionalis andGobiomorus dormitor. Others are large fishes whichprobably swim through the larger rivers but do not stay inany particular spot too long. These are difficult to collectduring short surveys but are sometimes caught by localfishermen or those doing longterm studies. Examples includeAnguilla rostrata, Mugil cephalus, and Centropomusundecimalis. The species accumulation curve demonstratesthat we reached the asymptote after eight days, and webelieve that the taxa collected are a good representation ofwhich species were there at the time (Figure 4.1).
0
5
10
15
20
25
30
35
40
45
1 3 5 7 9 11 13 15 17
Time (Days)
Cu
mu
lati
ve N
um
ber
of
Sp
ecie
s
RAP BULLETIN OF BIOLOGICAL ASSESSMENT SIXTEEN July 2000 43
Focal Points (see Expedition Itinerary and Gazetteer)
Río San PedroFish DiversityFrom the Río San Pedro, we collected 38 fish species duringthe RAP survey (Appendix 8) out of an estimated 55species for the region. Fourteen of the species collected werecichlids. The second most dominant group was poeciliids,with 8 species. Ten species were collected throughout thefocal point and in a variety of macrohabitats. They includeAstyanax aeneus, Cichlasoma pasionis, Belonesox belizanus,Cichlasoma synspilum, Cichlasoma helleri, Gambusiasexradiata, Cichlasoma heterospilum, Petenia splendida,Cichlasoma meeki, and Poecilia mexicana.
Batrachoides goldmani, Mugil curema, andAplodinotus grunniens are first official records for thesespecies in this Guatemala basin. In comparison to Hubbs’collections from 1935, diversity and numbers do not appearto have changed significantly.
Several habitats here are especially noteworthy for themaintenance of fish diversity and are discussed below.
1) Lowland, varzea-like, inundated forests near PasoCaballos and along the Río Sacluc are critical as nursery areasfor young fishes and probably function as areas in whichfishes, such as Brycon spp., eat and disperse seeds. Thistype of habitat is unrecognized and undescribed inMesoamerica.
2) Sibal (dominated by Cladium jamaicense) isprobably an important microhabitat for cichlids and catfish.It probably also serves as a nursery ground for fishes whichspawn concordantly with rising water levels and which feedon the seeds. Even during the dry season, water is an integralpart of the sibal because the water penetrates all the wayinto the sibal. Leaf litter in the river bottom may provide animportant food source for fishes, as microflora often growson the leaves. Leaves may also provide cover for smallfishes.
3) Tributaries entering the Río San Pedro from thenorth side of the river (Paso Caballos, SP2; Arroyo La Pista,SP3) were very clear and shallow and fast-running. Arroyola Pista was over rocky substrate, almost forming riffleswith downed logs. However, fish diversity was relativelylow, with only 12 species total. In Arroyo la Pista, weobserved huge aggregations of Dorosoma petenense, about60 mm in length, schooling and flashing over the rocks.These stream habitats are possibly threatened due to habitatmodification and pollution.
ObservationsGars and Hyphessobrycon were trawled up from the bottom.Gars were abundant and may be the dominant piscivore.Many fishes, including gars and Petenia, were full of eggs orhad enlarged testes, indicating that they were preparing toreproduce. Specimens of Atherinella alvarezi were collected.
Although a few specimens were collected by Hubbs in 1935,the species has not been captured during more recentcollections from the Río Pasión or near Sayaxché.
ThreatsHuman encroachment, in the form of burning of sibals,pollution of springs, and deforestation, is significant.
FragilityFragility is high for the sibal and varzea because they arefragmented.
Río EscondidoFish DiversityOnly 27 fish species of the 55 were found among all themacrohabitats within the Río Escondido focal point (Appen-dix 8). The species of the Río Escondido contain the 10common species (Table 4.1) plus Atractosteus tropicus,Dorosoma petenense, Cichlasoma friedrichsthalii, andCathorops aguadulce, among others.
ObservationsMany of the fishes were in reproductive condition.
ThreatsThe major threats include burning of the sibal and destructionof the forest. We witnessed burning sibal and active conver-sion of forest habitats for pasture and for agriculture. Theseactivities tend to increase siltation of the river as well aseliminate important nursery areas and shadier coolermicrohabitats for fish to live within.
FragilityThe sibal and forest habitats are fragile because their standsare becoming smaller and/or degraded. Almost all of theforested margin has been inhabited by people because thiszone affords solid ground and is near the waterway. Thefragility of the river from the perspective of providingadequate habitats for fishes to survive is unknown at thistime.
Flor de LunaFish DiversityOf the 55 species, 22 were found within the Flor de Lunafocal point (Appendix 8). The fauna found within the lagoonswas a subset of the Río San Pedro, including the 10 mostcommon species.
ThreatsAt the Xan oil facilities, there is a potential threat ofpetroleum contamination from a functioning well adjacent tothe lagoon and marsh. It was noted that fishes collected fortoxicology had a high incidence of fin rot and that one cichlidhad a fibrous mass on its liver.
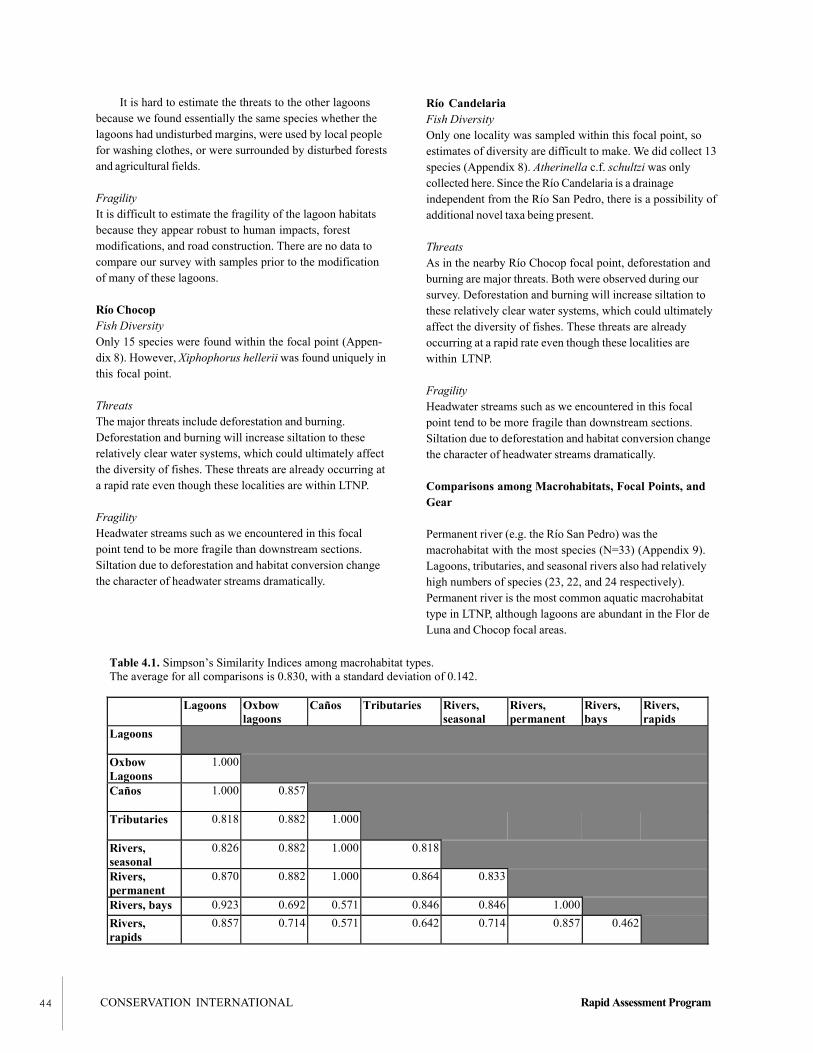
CONSERVATION INTERNATIONAL Rapid Assessment Program44
It is hard to estimate the threats to the other lagoonsbecause we found essentially the same species whether thelagoons had undisturbed margins, were used by local peoplefor washing clothes, or were surrounded by disturbed forestsand agricultural fields.
FragilityIt is difficult to estimate the fragility of the lagoon habitatsbecause they appear robust to human impacts, forestmodifications, and road construction. There are no data tocompare our survey with samples prior to the modificationof many of these lagoons.
Río ChocopFish DiversityOnly 15 species were found within the focal point (Appen-dix 8). However, Xiphophorus hellerii was found uniquely inthis focal point.
ThreatsThe major threats include deforestation and burning.Deforestation and burning will increase siltation to theserelatively clear water systems, which could ultimately affectthe diversity of fishes. These threats are already occurring ata rapid rate even though these localities are within LTNP.
FragilityHeadwater streams such as we encountered in this focalpoint tend to be more fragile than downstream sections.Siltation due to deforestation and habitat conversion changethe character of headwater streams dramatically.
Río CandelariaFish DiversityOnly one locality was sampled within this focal point, soestimates of diversity are difficult to make. We did collect 13species (Appendix 8). Atherinella c.f. schultzi was onlycollected here. Since the Río Candelaria is a drainageindependent from the Río San Pedro, there is a possibility ofadditional novel taxa being present.
ThreatsAs in the nearby Río Chocop focal point, deforestation andburning are major threats. Both were observed during oursurvey. Deforestation and burning will increase siltation tothese relatively clear water systems, which could ultimatelyaffect the diversity of fishes. These threats are alreadyoccurring at a rapid rate even though these localities arewithin LTNP.
FragilityHeadwater streams such as we encountered in this focalpoint tend to be more fragile than downstream sections.Siltation due to deforestation and habitat conversion changethe character of headwater streams dramatically.
Comparisons among Macrohabitats, Focal Points, andGear
Permanent river (e.g. the Río San Pedro) was themacrohabitat with the most species (N=33) (Appendix 9).Lagoons, tributaries, and seasonal rivers also had relativelyhigh numbers of species (23, 22, and 24 respectively).Permanent river is the most common aquatic macrohabitattype in LTNP, although lagoons are abundant in the Flor deLuna and Chocop focal areas.
Table 4.1. Simpson’s Similarity Indices among macrohabitat types.The average for all comparisons is 0.830, with a standard deviation of 0.142.
Lagoons Oxbowlagoons
Caños Tributaries Rivers,seasonal
Rivers,permanent
Rivers,bays
Rivers,rapids
Lagoons
OxbowLagoons
1.000
Caños 1.000 0.857
Tributaries 0.818 0.882 1.000
Rivers,seasonal
0.826 0.882 1.000 0.818
Rivers,permanent
0.870 0.882 1.000 0.864 0.833
Rivers, bays 0.923 0.692 0.571 0.846 0.846 1.000Rivers,rapids
0.857 0.714 0.571 0.642 0.714 0.857 0.462

RAP BULLETIN OF BIOLOGICAL ASSESSMENT SIXTEEN July 2000 45
Overall, the similarity among macrohabitats is high(mean Simpson’s Similarity Index = 0.830; standarddeviation = 0.142; Table 4.1). This indicates that there are alarge number of shared species among the macrohabitats.Certain macrohabitats differ more strongly in speciescomposition—most notably rivers/bays versus oxbowlagoons, rivers/bays versus caños, and all macrohabitatsversus rivers/rapids. The low similarity indices between therivers/bays, oxbow lagoons, and caños was a surprisebecause they are often near each other and superficiallyappear to be very similar macrohabitats. All are slow waterareas along the edges of rivers. We believe that the lowindices are most likely an artefact of the low number ofspecies collected in these macrohabitats when compared tothe others (Appendix 9). Similarity indices tend to be lowwhen comparing subsets with small sample sizes (Chernoffet al., 1999). A similar explanation may account for the lowsimilarity between the rivers/rapids and other macrohabitats.An additional factor leading to the distinctness of the rapidsis the presence of species that were collected only or largelyin the rapids, including Batrachoides goldmani, Cichlasomalentiginosum, and Cichlasoma bifasciatum. The rapids, withtheir swift current, rocky substrate, and bivalves, is a raremacrohabitat within the surveyed area.
The Río San Pedro focal area had the greatest richnessof fishes. Only three species were found outside the SanPedro (Appendix 8). Based on Simpson’s Similarity Indices,
the San Pedro, Escondido, and Flor de Luna were verysimilar (Table 4.2) and therefore represent the same fauna.The Río Escondido and Flor de Luna focal areas areessentially subsets of the San Pedro.
The mean similarity among all focal areas is 0.873(standard deviation = 0.111). Most of the lower values arefrom comparisons of other areas with the Candelaria orChocop. We attribute some of these strong differences to thefact that Candelaria is in a different drainage and that itharbors distinct macrohabitat types. The Candelaria’shabitat is most similar to the Chocop’s, but their similarityis low (Table 4.2). Again, this may be due to the low numberof species collected in these areas (<16 species each) incomparison to the number of species collected in other areas(>21 species each; Appendix 8).
Using Simpson’s Similarity Indices to compare geartypes demonstrates that the same species were collectedwhen using the seine, cast net, or trawl (Table 4.3). Fewerspecies were collected with the trawl (Figure 4.2), but thesewere a subset of those collected by the seine and cast net.Similarity was lower in contrasts with the gillnet (Table 4.3).This is due to the relatively large number of taxa collectedexclusively with gillnets (e.g. Mugil curema, most of thecatfishes, Aplodinotus grunniens; Figure 4.2). Only twospecies (Brycon guatemalensis and Petenia splendida) werecaught with hook and line, and we used this methodinfrequently; there is little we can say about this gear type.
Table 4.2. Simpson’s Similarity Indices among focal areas.The average for all comparisons is 0.873, with a standard deviation of 0.111.
San Pedro Escondido Flor de Luna Chocop CandelariaSan Pedro
Escondido 0.963
Flor de Luna 1.000 1.000
Chocop 0.867 0.933 0.733
Candelaria 0.846 0.923 0.769 0.692
Table 4.3. Simpson’s Similarity Indices among gear types.The average for all comparisons is 0.694, with a standard deviation of 0.251.
Seine Cast Net Trawl Gillnet Hook & LineSeineCast Net 0.935Trawl 1.000 1.000Gillnet 0.529 0.471 0.500Hook & Line 0.500 0.500 0.500 1.000

CONSERVATION INTERNATIONAL Rapid Assessment Program46
Figure 4.2. Number of fish species collected byeach gear type used during the 1999 RAP expeditionto Laguna del Tigre National Park, Petén, Guate-mala. Solid is the total number of species collectedby the gear type. Stippled is the number of speciescollected only by the gear type.
Overall, it is important to use a variety of collectiontechniques in order to inventory the complete fauna in aparticular area.
In summary, we consider each of the focal regions tocontain subsets of the ichthyofauna found within the RíoSan Pedro. Except for the fishes that prefer large riverhabitats—the ictalurid and ariid catfishes, Mugil,Aplodinotus, etc.—most of the fishes are distributed insmaller sets homogeneously among macrohabitats and focalregions. The exceptions to this pattern include Xiphophorushellerii, Heterandria bimaculata, and Atherinella cf. schultzi,which were found in headwater habitats. The rapids/reef areaalso had two species, Cichlasoma lentiginosum andBatrachoides goldmani, that were not found elsewhere.
CONSERVATION CONSIDERATIONS
The homogeneity of fish species distribution amongmacrohabitats and among focal regions suggests that ageneral plan for conservation of fish biodiversity can easilybe put into place in LTNP. We recommend that a sample ofeach of the types of macrohabitats be set aside as conserva-tion areas—especially the reef and headwater habitats.
Introduced Taxa
Two non-native species were observed: Oreochromis sp.,which is an African cichlid (no specimens kept), andCtenopharyngodon idella, which is an Asian minnow. Thesespecies have been introduced throughout the world in orderto control aquatic vegetation and to serve as a food source.They have not, as far as we know, been introduced into
northern Guatemala. But they have been introduced intosome of the neighboring states of Mexico. It is probable thatthese fishes swam through the Usumacinta and up the SanPedro into LTNP. This is a graphic example of theinterconnectedness of aquatic systems across nationalboundaries, and it highlights the need for ecoregion-basedmanagement strategies. Any conservation initiatives orintroduction of exotics must take into consideration themobility of the fauna.
Biogeographic Considerations
If we include Oreochromis sp., then we recorded 42 speciesduring the LTNP ichthyological survey. Of these, 34 areendemic to the Usumacinta province. These endemic taxainclude nine cichlids (Cichlasoma bifasciatum, C. helleri, C.heterospilum, C. lentiginosum, C. meeki, C. pasionis, C.pearsei, C. synspilum, and Petenia splendida), all of whichare used for food. Another six species we recorded (Astyanaxaeneus, Brycon guatemalensis, Rhamdia guatemalensis,Belonesox belizanus, Poecilia mexicana, and Cichlasomarobertsoni) are found in the Usumacinta, Motagua, andpossibly other drainages. Two species (Ctenopharyngodonidella and Oreochromis sp.) were introduced. In short, manyof the taxa we collected are found only in the Usumacintadrainage.
Two hundred or more species are estimated to exist inthe Usumacinta-Grijalva drainage (Miller, 1976). We believethere are 58 species (56 native, 2 introduced) in the northernlowlands of Guatemala within the Usumacinta Basin. These58 Guatemalan species represent 29% of the totalUsumacinta fish fauna. LTNP occupies a large area of theGuatemalan northern lowlands, and it is relatively unmodi-fied. Other portions of the Usumacinta drainage are in dangerof being developed. Preservation of LTNP would help toprotect a quarter of the Usumacinta fish fauna. This issignificant because of the high degree of global endemismwithin the Usumacinta drainage and apparent environmentaldamage beyond the park boundaries, including Mexico.
SUMMARY OF FINDINGS ANDCONCLUSIONS
The following are general conclusions that result from ourinterpretations of fish distributions among the five regionalfocal points.
• We collected 41 species of freshwater fishes out of apotential 55 species thought to inhabit this region.Fishes that we did not collect include Centropomusundecimalis (reported by fishermen and fromSayaxché), Rivulus tenuis (reported in previous studies),Tarpon atlanticus and Hyporhampus mexicanus
�������������������
������������������
0
5
10
15
20
25
30
35
Seine Castnet Trawl Gillnet Hook andLine
Type of Gear
Sp
ecie
s

RAP BULLETIN OF BIOLOGICAL ASSESSMENT SIXTEEN July 2000 47
(reported from Sayaxché), Ictiobus meridionalis (knownfrom the Río Pasión), and Rhamdia laticauda (knownfrom the Río Pasión and the Río Negro).
• We identified two introduced species of fishes, collectedby fishermen: the tilapia (Oreochromis sp., nospecimens kept) and the grass carp (Ctenopharyngodonidella). This is the first official record for the latterspecies in northern Guatemala.
• The mullet (Mugil curema) is the first record of thespecies from the San Pedro and the Usumacinta Basinof Guatemala.
• The freshwater drum (Aplodinotus grunniens) and thetoadfish (Batrachoides goldmani) are first records fromthe San Pedro Basin.
• The fish fauna is more or less homogeneously distrib-uted among the five regional focal points and among theeight macrohabitats. We could not unambiguouslyidentify any special patterns among major componentsor communities of fishes.
• There was a group of 10 species found among mostfocal points and macrohabitats. This group includesAstyanax aeneus, Belonesox belizanus, Cichlasomahelleri, C. heterospilum, C. meeki, C. pasionis, C.synspilum, Gambusia sexradiata, Petenia splendida, andPoecilia mexicana.
• Certain small groups of species were only found inparticular macrohabitats. The following are examples:rapids/reef—Cichlasoma lentiginosum, Batrachoidesgoldmani, and to a large extent Cichlasoma bifasciatum;headwaters with current—Xiphophorus hellerii andHeterandria bimaculata; main channel of the Río SanPedro—Brycon guatemalensis, ariid and ictaluridcatfishes, Mugil curema, Aplodinotus grunniens, andEugerres mexicanus.
• Lagoon faunas were remarkably similar despitedifferences in the proximity to human inhabitation,roads, or other major disturbances.
• The heterogeneity of macrohabitats is low. The riverhabitats and the lagoon habitats are very similar. Therivers and lagoons had very narrow margins.
• The fish fauna is basically the same as that found frombrief surveys 60 years ago. We found no evidence ofextinctions. But it should be noted that two exoticspecies have been introduced.
CONSERVATION RECOMMENDATIONS
These results suggest several specific recommendations forthe conservation of fish populations and habitats within thepark. Recommendations are not listed in order of priority.
• To develop an integrated conservation plan of the areascontaining large numbers of lagoons, a hydrologicalstudy is necessary to provide critical information about
the connection of lagoons, ponds, and sibals during theseasons of inundation. What are the roles or sources ofthe fish faunas in these relatively isolated habitats? Setsof lagoons and sibals should be identified as critical forthe maintenance of biodiversity.
• Park managers should recognize the critical nature of thelowland varzea-like forest and the sibal habitats for thereproduction of fishes and for the service as nurseryhabitat for larval and juvenile fishes. These habitatsmust be considered fragile and threatened due to humanmodification, especially through burning. We recom-mend that the strip of unmodified sibal on the southside of the Río San Pedro and the unmodified varzeaalong the Río Sacluc and below Paso Caballos in thevicinity of the Las Guacamayas Biological Station beincluded within the park.
• The human impact on the Río San Pedro, both inMexico and Guatemala, should be studied because therehas been much deterioration of natural habitats along theriver margins on the southern border of LTNP.
• According to preliminary studies by hydroecologists,the molluscan reef filters the water between the LasGuacamayas Biological Station and the town of ElNaranjo. These types of reefs are rarely found infreshwater and have a unique fish community associatedwith them. This macrohabitat region must be protectedin order to secure the health of the riverine ichthyofaunaon the southwestern part of the park and also to securegood quality water for the people of El Naranjo.
• Studies on the population dynamics of many species offood fishes must be implemented immediately in orderto protect the ichthyofauna from human-basedpressures due to subsistence and some commercialfishing. The pressure mainly comes from unregulatedgill netting, hook and line fishing, cast netting, andspearfishing. The principal targets are Peteniasplendida, other cichlids, Brycon guatemalensis, and thelarge catfishes. We note that one of the main sources offishing pressure occurs during the Easter Holy Weekwhen fishermen exploit the resources very heavilythroughout the basin.
• Data on the human use of fishes within the park andwithin the biotope are needed immediately in order topredict future demands on native populations offreshwater fishes as the human inhabitation of theseregions increases.
• A sound conservation plan will require informationabout the ecology of the fish community during seasonsother than the dry season.

CONSERVATION INTERNATIONAL Rapid Assessment Program48
• The lowland habitats of rivers and lagoons within LTNPand the biotope should be compared with similarhabitats within the Usumacinta province of bothGuatemala and Mexico, and elsewhere in the MBR.LTNP and the biotope may serve as a suitable conserva-tion area for this broadly distributed fish community.
• Heavy deforestation and destruction of sibal should beavoided because it may adversely affect aquatic habitatswithin the basin due to increased siltation of theremaining waterways.
LITERATURE CITED
Bussing, W. L. 1987. Peces de las Aguas Continentales deCosta Rica. Editorial de la Universidad de Costa Rica,San Jose, Costa Rica.
Chernoff, B. 1986. Phylogenetic relationships andreclassification of menidiine silverside fishes, withemphasis on the tribe Membradini. Proceedings of theAcademy of Natural Sciences of Philadelphia 138:189-249.
Chernoff, B., P. W. Willink, J. Sarmiento, A. Machado-Allison, N. Menezes, and H. Ortega. 1999. Geo-graphic and macrohabitat partitioning of fishes inTahuamanu-Manuripi region, upper Río Orthon basin,Bolivia. Pp. 51-67 in A Biological Assessment of theAquatic Ecosystems of the Upper Río Orthon Basin,Pando, Bolivia (B. Chernoff and P. W. Willink, eds.).Bulletin of Biological Assessment 15. ConservationInternational, Washington, DC, USA.
Collette, B. B., and J. L. Russo. 1981. A revision of thescaly toadfishes, genus Batrachoides, with descrip-tions of two new species from the eastern Pacific.Bulletin of Marine Science 31: 197-233.
Deckert, G. D., and D. W. Greenfield. 1987. A review ofthe western Atlantic species of the genera Diapterusand Eugerres (Pisces: Gerreidae). Copeia 1987: 182-194.
Greenfield, D. W., and J. E. Thomerson. 1997. Fishes of theContinental Waters of Belize. The University Press ofFlorida, Gainesville, FL, USA.
Gúnther, A. 1868. An account of the fishes of the states ofCentral America, based on collections made by Capt.J. M. Dow, F. Goodman, Esq., and O. Salvin, Esq.Transactions of the Zoological Society of London 6:377-494.
Hubbs, C. L., and R. R. Miller. 1960. Potamarius, a newgenus of ariid catfishes from the fresh waters ofMiddle America. Copeia 1960: 101-112.
Miller, R. R. 1960. Systematics and biology of the gizzardshad (Dorosoma cepedianum) and related fishes.Fishery Bulletin 173: 371-392.
Miller, R. R. 1966. Geographical distribution of CentralAmerican fishes. Copeia 1966: 773-802.
Miller, R. R. 1976. Geographical distribution of CentralAmerican fishes, with addendum. Pp. 125-156 inInvestigations of the Ichthyofauna of NicaraguanLakes (T. B. Thorson, ed.). University of NebraskaPress, Lincoln, NE, USA.
Regan, C. T. 1905. A revision of the fishes of the Americancichlid genus Cichlasoma and of the allied genera.Annals and Magazine of Natural History, Series 7, 16:60-77, 225-243, 316-340, 433-445.
Regan, C. T. 1906-08. Pisces, in Biologia Centrali-Americana 8: 1-203.
Rivas, L. R. 1962. Cichlasoma pasionis, a new species ofcichlid fish of the Thorichthys group, from the Río dela Pasión, Guatemala. Quarterly Journal of the FloridaAcademy of Sciences 25:147-156.
Rosen, D. E. 1979. Fishes from the uplands and intermont-ane basins of Guatemala: revisionary studies andcomparative geography. Bulletin of the AmericanMuseum of Natural History 162: 267-375.
Rosen, D. E., and R. M. Bailey. 1959. Middle-Americanpoeciliid fishes of the genera Carlhubbsia andPhallichthys, with descriptions of two new species.Zoologica 44: 1-44.
Rosen, D. E., and R. M. Bailey. 1963. The poeciliid fishes(Cyprinodontiformes), their structure, zoogeography,and systematics. Bulletin of the American Museum ofNatural History 126: 1-176.
Suttkus, R. D. 1963. Order Lepisostei. Pp. 61-88 in Fishesof the Western North Atlantic, Part 3 (H. B. Bigelow,ed.). Sears Foundation for Marine Research, YaleUniversity, New Haven, CT, USA.
Weyl, R. 1980. Geology of Central America. GebruderBorntraeger, Berlin, Germany.

49 RAP BULLETIN OF BIOLOGICAL ASSESSMENT SIXTEEN July 2000
ABSTRACT
• Sediment and tissue samples from two species of fish(Thorichthys meeki and Cichlasoma synspilum) werecollected from a lagoon immediately adjacent to the Xan3 oil facility, as well as from four reference sites(Laguna Flor de Luna, Laguna Buena Vista, LagunaGuayacán, and Río Escondido and Río San Pedro).Sediment was used to determine levels of polycyclicaromatic hydrocarbons (PAHs), which are chemicalsindicative of petroleum pollution. Tissues were used toassay the level of DNA damage, which is indicative ofexposure to PAHs and several other pollutants.
• DNA damage was analyzed using agarose gel electrophoresis (to determine DNA strand breakage) and flowcytometry (to determine chromosomal breakage).
• The sediment PAH concentrations from the lagoon atXan 3 were not significantly higher than the referencesites, but those of Laguna Buena Vista were markedlyhigher than any other site.
• For T. meeki, the levels of DNA strand breakage werehigher in the Xan 3 populations than in those from theFlor de Luna and Río San Pedro. For C. synspilum, thelevels of chromosomal breakage were greater in Xan 3than in the Río San Pedro site. In both cases the amountof DNA damage in Buena Vista was intermediatebetween Xan 3 and the other reference sites.
• Further research on the park’s hydrological connectionsand their effects on contaminant redistribution, as wellas on the levels of other contaminants, is warranted.
CHAPTER 5
HYDROCARBON CONTAMINATIONAND DNA DAMAGE IN FISH FROMLAGUNA DEL TIGRE NATIONALPARK, PETEN, GUATEMALA
Christopher W. Theodorakis and John W. Bickham
INTRODUCTION
One potential threat to the biota of Laguna del TigreNational Park (LTNP) that has not yet been addressed is theimpact of oil extraction activities in the Xan oil fields. Theprimary concern is that such activities might result inaccidental contamination of the surrounding environment.Environmental contamination may have adverse impacts onpopulations and communities (Newman and Jagoe, 1996).First, it could result in a decrease in reproductive success oran increase in mortality of affected organisms. This may leadto reductions in the population density of some or allspecies present. Some species may be more resistant to theeffects of contamination than others. This could result inchanges in community structure (species composition andrelative abundance). Environments exposed to oil oftenpossess fewer species than uncontaminated habitats becauserelatively few species are able to tolerate exposure to oil-associated contaminants (Newman and Jagoe, 1996).
Aquatic ecosystems are particularly susceptible tocontamination for several reasons. First, terrestrial runoffand atmospheric deposition tend to remove contaminantsfrom terrestrial to aquatic systems (Pritchard, 1993).Second, because of their highly permeable skin and gills, fishand other aquatic organisms are particularly susceptible tothe effects of contamination (Pritchard, 1993). Manyhydrocarbons are readily degraded in an aerobic environ-ment, but the aquatic environment frequently contains littleor no oxygen. Therefore, contaminants can persist in aquaticecosystems for far longer than in terrestrial systems (Ashokand Saxena, 1995). Finally, contaminated aquatic organismspose an important health risk for people consuming them orthe water in which they live.
Here we evaluate the effects of hydrocarbon contamina-tion on the physiological state of fishes as a consequence ofoil extraction activities around the Xan oil wells in LTNP.We addressed this by examining fishes in lagoons located at

CONSERVATION INTERNATIONAL Rapid Assessment Program50
different distances from the Xan oil wells. We hypothesizedthat the concentration of hydrocarbon contaminants wouldbe highest near the Xan 3 oil facility and that this patternwould be paralleled by increasing physiological damage tofish individuals. There are many natural variables that cancontribute to variation in biological systems across an area.Thus, if differences were found between Xan 3 and thereference areas, it would be difficult to determine if thesedifferences were due to contaminant effects or to othersources of environmental variation. Parallel patterns ofincreasing damage to fish individuals alongside increasingconcentrations of hydrocarbons among the sites (i.e. atoxicological assessment) would provide strong evidence thatcontamination is affecting fish populations.
To determine the levels of contaminants in theenvironment, levels of polycyclic aromatic hydrocarbons(PAHs) were measured. These compounds are characteristiccomponents of petroleum contamination that accumulate inthe sediment (Mille et al., 1998). The analysis includes adetermination of PAH concentrations in both water andsediment.
The assessment of the effects of these compounds onfish focused on physiological consequences for a number ofreasons. First, it is frequently difficult to infer the bodytissue concentrations and toxic effects of contaminants fromtheir environmental concentrations (McCarthy and Shugart,1990). This is because the availability of certain chemicalsfor uptake into fish tissues (“bioavailability”) is oftendetermined by environmental variables (e.g. the amount ofnaturally occurring hydrocarbons in the water and sediment).Also, environmental contaminants are usually present ascomplex mixtures, and the toxicity of these mixtures maynot be accurately predicted from measurements of concen-trations of single chemicals (McCarthy and Shugart, 1990).Therefore, measurements of the physiological responses offishes living in these environments are needed to rigorouslyevaluate the impacts of hydrocarbon contamination.The particular physiological response used for this assess-ment was DNA (deoxyribonucleic acid) damage. This typeof damage has been found to be characteristic of PAH andpetroleum contaminant exposure (Bickham, 1990; Shugart,1988). The two measures used to evaluate DNA damagewere DNA strand breakage and chromosomal damage,measured as variation in cell-to-cell variation in DNAcontent. DNA is a double-stranded molecule, and exposureto PAHs can cause breaks in the DNA strands (Shugart etal., 1992). This is because PAHs chemically bind to DNA,and DNA repair enzymes remove portions of the strand thatcontains this modification. Subsequent enzymes fill in thesegaps, but until they do, there remain temporary strandbreaks (Hoeijmakers, 1993). If the breaks are on only one ofthe DNA strands (single-strand breaks), the DNA chromo-some remains intact, but the integrity is compromised. Ifstrand breaks occur on two adjacent strands, the chromo-
some may become fragmented. One way of measuring thisfragmentation is to determine the cell-to-cell variation inDNA content (Bickham, 1990). When chromosomes arefragmented, cell division may result in an unequal distribu-tion of DNA strands among daughter cells. This results in anincrease in cell-to-cell variation in DNA content. Thus,exposure to PAH and petroleum contamination is indicatedby both an increase in the amount of single-strand breakageand cell-to-cell variation in DNA content.
DNA damage can lead to tumor formation in fish(Bauman, 1998) or a shortened life span (Agarwal and Sohal,1996). It may also have a detrimental effect on fertility andimmune function (Theodorakis et al., 1996; O’Connor et al.,1996). This is because cells that are rapidly dividing areparticularly prone to DNA damage, and organs, gonads, anddeveloping embryos which form white blood cells have highrates of cell division. Thus, DNA damage may indicateincreased mortality in species populations in addition to thepresence of toxic contaminants.
METHODS
Sample Collection
Fish and sediment samples were collected in a lagoonadjacent to an oil-pumping facility which is hypothesized tobe a source of contaminants in the study area, Xan 3, and atthree lagoons occurring at varying distances from Xan 3(Buena Vista, 5.63 km; Flor de Luna, 13.46 km; andGuayacán, 39.51 km). Additionally, a collection in the RíoSan Pedro (66.89 km from Xan 3) served as a distant, andlikely uncontaminated, control site. Fish were collected usinga cast net and were transported back to camp alive. Thelength of each fish was measured, and the fish wereanesthetized. Liver, spleen, and blood samples werecollected and frozen and preserved in liquid nitrogen. Waterand sediment samples were also taken from the collectionsites.
DNA Strand Breakage Analysis
DNA from liver tissues was extracted to determine thenumber of DNA single-strand breaks (Theodorakis andShugart, 1993). DNA samples were analyzed by agarose gelelectrophoresis in order to determine the average length ofthe DNA molecules. The length is inversely related to thenumber of single-strand breaks; if there are more breaks, thenthe average length of the DNA molecules will be lower.
Chromosomal Damage Analysis
Chromosomal damage was assessed by determining theamount of cell-to-cell variation in DNA content (Bickham,

RAP BULLETIN OF BIOLOGICAL ASSESSMENT SIXTEEN July 2000 51
1990). Nuclei were isolated from blood and spleen tissues,and the variation in DNA content was evaluated using a flowcytometer, which measures relative amounts of DNA inindividual nuclei. A more detailed description of the methodsfor electrophoresis and flow cytometry can be found inAppendix 10.
Contaminant Analysis
Water and sediment samples were extracted with organicsolvents (hexane/acetone or methylene chloride). Sampleswere concentrated by evaporation under nitrogen gas andanalyzed by high-pressure liquid chromatography or gaschromatography.
RESULTS AND DISCUSSION
Physiological Condition and DNA Damage Analyses
The number of each species collected at each site is reportedin Table 5.1. The only fish that showed external indication ofdisease (fin rot) were those collected from the Xan 3 lagoon.Fin rot is caused by a bacterial infection that leads to erosionof the fins. It is usually not seen in wild fish populationsexcept under stressful conditions. Petroleum hydrocarbonsand other pollutants may increase the occurrence of fin rotand other bacterial infections by suppressing the immuneresponse in fish. This condition is cause for concern becausefin erosion impairs a fish’s ability to swim and maneuver andis usually a symptom of a more widespread bacterialinfection. For captive fish, if left untreated, individuals withfin rot usually die from systemic infection.
Two common species, Thorichthys meeki andCichlasoma synspilum, were used for analysis of DNAstrand breakage and chromosomal damage analysis. Non-
parametric statistical analyses (Kruskal-Wallis) were used totest for significant differences between sites. For C.synspilum, the variation in DNA content between cells (areflection of the amount of chromosomal damage) wasgreater in fish from the Xan 3 than from the Río San Pedro,and this difference was statistically significant (Table 5.2; P< 0.05). The amount of chromosomal damage in fish fromLaguna Buena Vista was not different from that of Xan 3. Incontrast, there were no statistically significant differences inthe amount of chromosomal damage between any T. meekipopulations.
There were no statistically significant differences in theamount of DNA strand breakage between any C. synspilumpopulations. However, the amount of DNA strand breakagein the Xan 3 T. meeki population was higher than in the Florde Luna and Río San Pedro populations, although thisdifference was not significantly different from populationsinhabiting lagunas Buena Vista or Guayacán (Table 5.2). Nofish from Río Escondido were collected for analysis.
The differing patterns of DNA damage between C.synspilum and T. meeki could stem from a number of causes.First, there could be differential exposure to differentgenotoxic compounds as a result of differences in habitat useor food preferences. Unfortunately, there is very littleinformation of this type for Neotropical cichlids. Also, theremay be differences in the molecular physiology of the twospecies. Again, such information is absent. It is clear thatmore research is needed in the natural history and physiol-ogy of Neotropical fish before definitive conclusions can bedrawn as to differences between these two species.Additionally, the dissimilarity in genotoxic responsesbetween species could be mediated by differences in theflow cytometry and DNA damage. This could be related todifferences in sensitivities of the assays or the type ofdamage that they measure.
Table 5.1. Number of each species collected from Xan 3 and four reference sites.
Species F6: Xan 3 F1: LagunaBuena Vista
F5: Laguna Florde Luna
C2: LagunaGuayacán
SP2: Río SanPedro
Thorichthys meeki 12 14 20 17 18Cichlasomasynspilum
6 8 0 0 14
C. uropthalmus 7 0 0 0 0Astianyx fasctiatum 0 14 0 11 0Poecilia mexicana 0 0 0 10 0Gambusia sexradiata 0 0 23 0 0G. yucatana 0 28 0 0 0
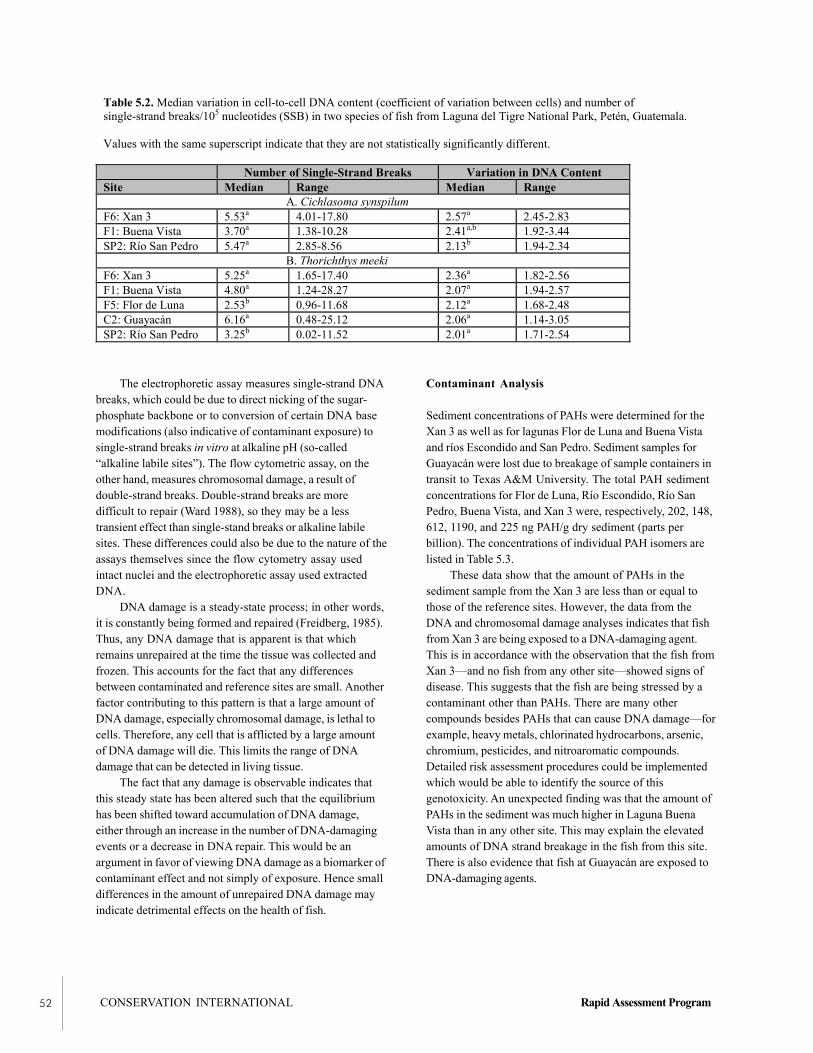
CONSERVATION INTERNATIONAL Rapid Assessment Program52
The electrophoretic assay measures single-strand DNAbreaks, which could be due to direct nicking of the sugar-phosphate backbone or to conversion of certain DNA basemodifications (also indicative of contaminant exposure) tosingle-strand breaks in vitro at alkaline pH (so-called“alkaline labile sites”). The flow cytometric assay, on theother hand, measures chromosomal damage, a result ofdouble-strand breaks. Double-strand breaks are moredifficult to repair (Ward 1988), so they may be a lesstransient effect than single-stand breaks or alkaline labilesites. These differences could also be due to the nature of theassays themselves since the flow cytometry assay usedintact nuclei and the electrophoretic assay used extractedDNA.
DNA damage is a steady-state process; in other words,it is constantly being formed and repaired (Freidberg, 1985).Thus, any DNA damage that is apparent is that whichremains unrepaired at the time the tissue was collected andfrozen. This accounts for the fact that any differencesbetween contaminated and reference sites are small. Anotherfactor contributing to this pattern is that a large amount ofDNA damage, especially chromosomal damage, is lethal tocells. Therefore, any cell that is afflicted by a large amountof DNA damage will die. This limits the range of DNAdamage that can be detected in living tissue.
The fact that any damage is observable indicates thatthis steady state has been altered such that the equilibriumhas been shifted toward accumulation of DNA damage,either through an increase in the number of DNA-damagingevents or a decrease in DNA repair. This would be anargument in favor of viewing DNA damage as a biomarker ofcontaminant effect and not simply of exposure. Hence smalldifferences in the amount of unrepaired DNA damage mayindicate detrimental effects on the health of fish.
Contaminant Analysis
Sediment concentrations of PAHs were determined for theXan 3 as well as for lagunas Flor de Luna and Buena Vistaand ríos Escondido and San Pedro. Sediment samples forGuayacán were lost due to breakage of sample containers intransit to Texas A&M University. The total PAH sedimentconcentrations for Flor de Luna, Río Escondido, Río SanPedro, Buena Vista, and Xan 3 were, respectively, 202, 148,612, 1190, and 225 ng PAH/g dry sediment (parts perbillion). The concentrations of individual PAH isomers arelisted in Table 5.3.
These data show that the amount of PAHs in thesediment sample from the Xan 3 are less than or equal tothose of the reference sites. However, the data from theDNA and chromosomal damage analyses indicates that fishfrom Xan 3 are being exposed to a DNA-damaging agent.This is in accordance with the observation that the fish fromXan 3—and no fish from any other site—showed signs ofdisease. This suggests that the fish are being stressed by acontaminant other than PAHs. There are many othercompounds besides PAHs that can cause DNA damage—forexample, heavy metals, chlorinated hydrocarbons, arsenic,chromium, pesticides, and nitroaromatic compounds.Detailed risk assessment procedures could be implementedwhich would be able to identify the source of thisgenotoxicity. An unexpected finding was that the amount ofPAHs in the sediment was much higher in Laguna BuenaVista than in any other site. This may explain the elevatedamounts of DNA strand breakage in the fish from this site.There is also evidence that fish at Guayacán are exposed toDNA-damaging agents.
Table 5.2. Median variation in cell-to-cell DNA content (coefficient of variation between cells) and number ofsingle-strand breaks/105 nucleotides (SSB) in two species of fish from Laguna del Tigre National Park, Petén, Guatemala.
Values with the same superscript indicate that they are not statistically significantly different.
Number of Single-Strand Breaks Variation in DNA ContentSite Median Range Median Range A. Cichlasoma synspilumF6: Xan 3 5.53a 4.01-17.80 2.57a 2.45-2.83F1: Buena Vista 3.70a 1.38-10.28 2.41a,b 1.92-3.44SP2: Río San Pedro 5.47a 2.85-8.56 2.13b 1.94-2.34 B. Thorichthys meekiF6: Xan 3 5.25a 1.65-17.40 2.36a 1.82-2.56F1: Buena Vista 4.80a 1.24-28.27 2.07a 1.94-2.57F5: Flor de Luna 2.53b 0.96-11.68 2.12a 1.68-2.48C2: Guayacán 6.16a 0.48-25.12 2.06a 1.14-3.05SP2: Río San Pedro 3.25b 0.02-11.52 2.01a 1.71-2.54

RAP BULLETIN OF BIOLOGICAL ASSESSMENT SIXTEEN July 2000 53
Table 5.3. Sediment concentrations of polycyclic aromatic hydrocarbons.
Surrogate-Corrected Concentration (ng PAH/g dry sediment)a
CompoundF6: Xan 3 F1: Buena
VistaF5: Flor de
LunaC2: Guayacán SP2: Río San
PedroNaphthalene 6.1 15.4 2.8 56.0 2.4C1-Naphthalenes 9.7 25.2 3.9 44.1 3.0C2-Naphthalenes 13.6 90.1 21.5 44.0 6.7C3-Naphthalenes 17.1 54.4 11.2 23.4 7.2C4-Naphthalenes 13.9 85.4 11.6 34.1 8.8Biphenyl 2.7 5.3 0.7 11.9 0.8Acenaphthylene BMDLb 0.7 BMDLb BMDLb BMDLb
Acenaphthene 2.3 9.7 0.9 6.0 0.8Fluorene 5.5 29.2 1.8 17.0 1.8C1-Fluorenes 11.3 37.6 3.6 9.5 3.2C2-Fluorenes 27.5 190.0 17.0 75.7 15.2C3-Fluorenes 13.0 53.5 9.3 18.6 13.9Phenanthrene 15.4 69.3 12.2 23.7 12.7Anthracene 1.4 5.8 0.5 4.6 0.8C1-Phenanthrenes/Anthracenes 18.3 94.8 29.0 34.8 16.8C2-Phenanthrenes/Anthracenes 15.1 72.7 13.0 17.7 14.4C3-Phenanthrenes/Anthracenes 4.6 29.8 6.9 7.1 4.7C4-Phenanthrenes/Anthracenes 3.0 17.8 5.4 3.8 1.9Dibenzothiophene 1.1 12.8 1.7 5.5 1.3C1-Dibenzothiophenes 4.5 31.0 4.6 4.2 4.7C2-Dibenzothiophenes 6.9 52.4 8.5 7.5 7.5C3-Dibenzothiophenes 4.5 42.5 4.4 3.8 3.5Fluoranthene 1.8 17.6 2.3 10.0 2.4Pyrene 1.5 13.5 2.0 8.4 2.4C1-Fluoranthenes/Pyrenes 1.5 4.2 BMDLb 6.0 0.7Benz(a)anthracene 0.3 1.8 0.2 3.3 0.2Chrysene 0.3 2.1 0.3 3.1 0.3C1-Chrysenes 4.9 16.4 2.6 6.1 1.2C2-Chrysenes 10.9 37.4 16.8 14.9 1.7C3-Chrysenes 2.8 49.3 1.1 24.5 2.0C4-Chrysenes 0.7 11.0 1.3 3.4 2.8Benzo(b)fluoranthene 0.6 1.8 0.7 2.8 0.5Benzo(k)fluoranthene BMDLb 2.1 0.8 2.7 0.3Benzo(e)pyrene 0.4 1.6 0.4 1.3 0.4Benzo(a)pyrene 0.3 0.8 0.7 1.5 0.4Perylene BMDLb 4.4 BMDLb 64.2 BMDLb
Indeno(1,2,3-c,d)pyrene BMDLb 1.5 0.7 BMDLb BMDLb
Dibenzo(a,h)anthracene BMDLb BMDLb 0.5 BMDLb BMDLb
Benzo(g,h,i)perylene BMDLb 1.1 BMDLb BMDLb BMDLb
Total PAHs 225 1190 202 612 148Spiked Surrogate % Recovery
Surrogate % RecoveryNaphthalene-d8 88 75 74 72 83Acenaphthene-d10 95 102 97 78 109Phenanthrene-d10 108 71 103 96 117Chrysene-d12 70 65 72 62 77Perylene-d12 81 51 92 62 87a Each sediment sample was spiked with a sediment PAH, and concentrations were normalized for % recovery of surrogate.b Below minimum detection limit.
CONSERVATION INTERNATIONAL Rapid Assessment Program54
CONCLUSIONS AND RECOMMENDATIONS
The hypothesis that the Xan 3 oil facility has an impact onthe surrounding environment cannot be rejected becausethere was some evidence of stress and DNA damage in fishfrom the adjacent lagoon. We conclude that the amount ofDNA damage in the fish at Xan 3 was greater than at RíoSan Pedro, with intermediate results for fish occupying thelagoons in the vicinity of Xan 3. The finding of higher PAHconcentrations in Laguna Buena Vista than in any other sitewas unexpected. This result may be due to the complexpatterns of water interchange among lagoons during the wetseason or to other contaminant sources. The concentrationsof individual PAHs in the sediment, however, were muchlower than the US EPA’s criteria for protection of benthicinvertebrates, which are based on short-term toxicity tests ofsingle chemicals (US EPA, 1991a, 1991b, 1991c). However,the longterm effects of exposure to multiple chemicals onenvironmental and human health are unknown. Of particularconcern is the fact that the local human population heavilyuses Buena Vista for fishing, bathing, laundering, andrecreation. Although the data do not indicate an extremethreat to environmental and human health, they do suggestthat improved management should be initiated.
We recommend that an environmental monitoringprogram be initiated and a detailed ecological and human-health risk assessment be carried out in order to addressseveral issues, which include the following:
• a determination of the source of stress, fin disease, andgenotoxicity in the fish from the lagoons adjacent to theXan oil facility;
• a more detailed screening of the possible contaminantsat the Xan oil facility;
• a determination of the origin of the PAHs in LagunaBuena Vista and, more generally, studies of theseasonally varying hydrological connections around theXan oil facility so the redistribution patterns ofpotential contaminants can be understood; and
• an assessment of any possible health effects from PAHexposure in the local population inhabiting the areassurrounding the Xan facility.
LITERATURE CITED
Agarwal, S., and R. S. Sohal. 1994. DNA oxidative damageand life expectancy in houseflies. Proceedings of theNational Academy of Sciences 91: 12,332-12,335.
Ashok, B. T., and S. Saxena. 1995. Biodegradation ofpolycyclic aromatic-hydrocarbons—a review. Journalof Scientific & Industrial Research 54: 443-451.
Bauman, P. C. 1998. Epizootics of cancer in fish associatedwith genotoxins in sediment and water. MutationResearch—Reviews in Mutation Research 411: 227-233.
Bickham, J. W. 1990. Flow cytometry as a technique tomonitor the effects of environmental genotoxins onwildlife populations. Pp 97-108 in In Situ Evaluationof Biological Hazard of Environmental Pollutants (S.Sandhu, W. R. Lower, F. J. DeSerres, W. A. Suk, andR. R. Tice, eds.). Environmental Research Series Vol.38. Plenum Press, New York, NY, USA.
Bickham, J. W., J. A. Mazet, J. Blake, M. J. Smolen, Y.Lou, and B. E. Ballachey. 1998. Flow cytometricdetermination of genotoxic effects of exposure topetroleum in mink and sea otters. Ecotoxicology 7:191-199.
Freeman, S. E., and B. D. Thompson. 1990. Quantitationof ultraviolet radiation-induced cyclobutyl pyrimidinedimers in DNA by video and photographic densitom-etry. Analytical Biochemistry 186: 222-228.
Freidberg, E. C. 1985. DNA Repair. Plenum Press, NewYork, NY, USA.
Hoeijmakers, J. H. J. 1993. Nucleotide excision repair II,from yeast to mammals. Trends in Genetics 9: 211-217.
McCarthy, J. F., and L. R. Shugart. 1990. Biomarkers ofenvironmental contamination. Pp. 3-16 in Biomarkersof Environmental Contamination (J. F. McCarthy andL. R. Shugart, eds.). Lewis Publishers, Boca Raton,FL, USA.
Mille, G., D. Munoz, F. Jacquot, L. Rivet, and J. C.Bertrand. 1998. The Amoco Cadiz oil spill: evolutionof petroleum hydrocarbons in the Iie Grande saltmarshes (Brittany) after a 13-year period. EstuarineCoastal and Shelf Science 47: 547-559.
RAP BULLETIN OF BIOLOGICAL ASSESSMENT SIXTEEN July 2000 55
Newman, M. C., and C. H. Jagoe (eds.). 1996.Ecotoxicology: A Hierarchical Treatment. LewisPublishers, Boca Raton, FL, USA.
O’Connor, A., C. Nishigori, D. Yarosh, L. Alas, J. Kibitel,L. Burley, P. Cox, C. Bucana, S. Ullrich, and M. 1996.DNA double strand breaks in epidermal cells causeimmune suppression in vivo and cytokine productionin vitro. Journal of Immunology 157: 271-278.
Pritchard, J. B. 1993. Aquatic toxicology—past, present,and prospects. Environmental Health Perspectives100: 249-257.
Shugart, L. R. 1988. An alkaline unwinding assay for thedetection of DNA damage in aquatic organisms.Marine Environmental Research 24: 321-325.
Shugart, L. R., J. Bickham, G. Jackim, G. McMahon, W.Ridley, J. Stein, and S. Steinert. 1992. DNA alter-ations. Pp. 125-154 in Biomarkers: Biochemical,Physiological, and Histological Markers of Anthropo-genic Stress (R. J. Huggett, R. A. Kimerle, P. M.Mehrle Jr., H. L. Bergman, eds.). Lewis Publishers,Boca Raton, FL, USA.
Theodorakis, C. W., B. G. Blaylock, and L. R. Shugart.1996. Genetic ecotoxicology I: DNA integrity andreproduction in mosquitofish exposed in situ toradionuclides. Ecotoxicology 5: 1-14.
Theodorakis, C. W., and L. R. Shugart. 1993. Detection ofgenotoxic insult as DNA strand breaks in fish bloodcells by agarose gel electrophoresis. EnvironmentalToxicology and Chemistry 13: 1023-1031.
Theodorakis, C. W., S. J. D’Surney, J. W. Bickham, T. B.Lyne, B. P. Bradley, W. E. Hawkins, W. L. Farkas, J.F. McCarthy, and L. R. Shugart. 1992. Sequentialexpression of biomarkers in bluegill sunfish exposed tocontaminated sediment. Ecotoxicology 1:45-73.
U.S. Environmental Protection Agency. 1991a. Proposedsediment quality criteria for the protection of benthicorganisms: Acenapthene. U.S. EPA, Washington, DC,USA.
U.S. Environmental Protection Agency. 1991b. Proposedsediment quality criteria for the protection of benthicorganisms: Fluoranthene. U.S. EPA, Washington, DC,USA.
U.S. Environmental Protection Agency. 1991c. Proposedsediment quality criteria for the protection of benthicorganisms: Nanthrene. U.S. EPA, Washington, DC,USA.
Vindelov, L. L., I. J. Christianson, N. Keiding, M. Prang-Thomsen, and N. I. Nissen. 1983. Long-term storageof samples for flow cytometric DNA analysis.Cytometry 3: 317-320.
Vindelov, L. L., and I. J. Christensen. 1990. A review oftechniques and results obtained in one laboratory byan integrated system of methods designed for routineclinical flow cytometric DNA analysis. Cytometry11: 753-770.
Ward, J.F. 1988. DNA damage produced by ionizing-radiation in mammalian-cells-identities, mechanisms offormation, and repairability. Prog. Nucl. Acid. Res.Mol. Biol. 35: 95-125.

CONSERVATION INTERNATIONAL Rapid Assessment Program56
ABSTRACT
• A total of 173 bird species were recorded in Laguna delTigre National Park (LTNP), approximately 60.7% ofthe total number of species (N=285) reported from thepark. Of these, 157 were reported in point counts; theremainder from nonsystematic counts.
• Eleven new records of birds for the park’s official listwere recorded, for a total of 296 bird species. The newrecords include Aramus guarauma, Calidris minutilla, C.melanotus, C. fuscicollis, Cyanocorax yucatanicus,Cardinalis cardinalis, Cyanocorax yucatanicus, andHimantopus mexicanus. Distribution extensions werealso recorded for three of the new records: Tyrannussavana monachus, Laterallus exilis, and Pyrocephalusrubinus.
• Overall, ciconiiforms (large wading birds) were distrib-uted widely across the park; they were most abundant inthe marshes of the Río Escondido and the open canopyforest of the Río Sacluc and Río San Pedro. Forestspecialists were especially numerous on hills in closedforests of the eastern San Pedro area; these include Craxrubra, Agriocharis ocellata, Automolus ochrolaemus,dendrocolaptids, and trogloditids.
• The principle source of variation in species compositionin the park is the contrast between the western portions,including the biotope and the surrounding wetlands, andthe forested areas of the central (Chocop/Candelaria) andeastern (Río San Pedro/Sacluc) portions of the park. Thewestern area was unique and contained many speciesfound only there, including Calidris minutilla, C.fusciola, C.melanotus, Himantopus mexicanus,Laterallus exillis, Phorphyrula martinica, Jacana
CHAPTER 6
A RAPID ASSESSMENT OF AVIFAUNALDIVERSITY IN AQUATIC HABITATS OFLAGUNA DEL TIGRE NATIONAL PARK,PETEN, GUATEMALA
Edgar Selvin Pérez and Miriam Lorena Castillo Villeda
spinosa (associated with playones, or shallow stagnantwaters), Tyrannus savana monachus, and Pyrocephalusrubinus (associated with flooded savannas in LaLámpara).
INTRODUCTION
Laguna del Tigre National Park represents a very importantinternational wetland area for Guatemala. The park wasregistered as a Ramsar site in 1990 and is also included in theMontreaux 1993 register. The former listing was necessarybecause of the threat posed by petroleum exploitation in thepark (Carbonell et al., 1998). The goal of this study was todocument and compare the diversity of wetland birds indifferent areas within LTNP and to contribute to thedevelopment of monitoring studies of birds in this importantwetland area.
Three important avian habitat types can be distinguishedin the LTNP wetlands: 1) riparian forests; 2) floodedsavannas, swamps, or wetlands; and 3) zones of disturbance(petroleum operations, agriculture, houses, etc). Thesehabitats and the microhabitats they contain tend to supportdistinct bird guilds, including species that use low riparianand wetland trees and bushes; shallows with weedyvegetation; tall and solid emergent vegetation; low entangle-ments in vegetation, usually in open areas; and tall trees inriparian areas. Thus, vegetation structure is expected to be amajor determinant of species composition patterns forwetland birds (Zigûenza, 1994).
A previous baseline survey of birds for a monitoringprogram in LTNP (Mendez et al., 1998) recorded 41 novelrecords for a total of 285 species, including a new record forthe Petén (Zenaida asiatica) and the range extension of thegreater potoo (Nyctibius grandis). Our objective was tocomplement this effort by broadening the number of

RAP BULLETIN OF BIOLOGICAL ASSESSMENT SIXTEEN July 2000 57
vegetation associations and areas sampled within LTNP. Wealso provide a focus on the relationships between birds andaquatic habitats that has not been seen in previous studies.
METHODS
Birds were sampled in three broad habitat types. Riparianareas were sampled along the ríos San Pedro, Sacluc,Candelaria, Chocop, and parts of the Río Escondido. Threemacrohabitat types within riparian areas were considered.We studied open and closed riparian forest, marshes incombination with riparian forest, flooded savanna composedof sawgrass (sibal), trees (e.g. Crescentia sp.), tasiste(Acoelorraphe wrightii), and grasses. This lattermacrohabitat was most common in the Río Escondido areaand in certain lagoons such as La Lámpara. Second, marsh/wetlands were surveyed, exemplified by the vegetation ofthe Río Escondido within the biotope and at its confluencewith the Río San Pedro. This category of habitat was theleast common of the three habitat types. Finally, areas ofdisturbed and regenerating vegetation (guamiles) such asthose near settlements, oil operations, and abandonedagricultural fields were examined.
Sampling was centered at the four focal points used inthis RAP survey (refer to “Expedition Intinerary andGazetteer”). As for the reptile and amphibian sampling(Castañeda Moya et al. this volume), the use of discretesampling points was inappropriate because birds usehabitats over relatively broad scales. Thus, we sampled birdsalong transects in bodies of water using 20 point counts perlocation. The individual sample units treated here include theRío San Pedro, Río Sacluc, Río Escondido, Laguna Flor deLuna, Río Chocop, Río Candelaria, and Laguna la Lámpara(Table 6.1, Appendix 1). At the Río Chocop we were able tosample only 10 points. For surveys on rivers, the pointcounts were distributed along the length of the river. Forlagoon surveys, point counts were taken while walking alongthe water’s edge.
In order to choose the most effective and convenientmethods for sampling aquatic bird species in the park, weinitially compared three sampling strategies. Audiovisualpoint counts were conducted by establishing 10 pointsequally spread over a distance of three km (i.e. one pointcount every 300 m.) that were surveyed in a single session.Species seen or heard were recorded during 10 min at eachpoint. Birds were also sampled by traveling at a constantspeed (10 km/h) on a motorboat and recording every birdseen or heard over a three-km swath. Finally, we sampledbirds at night along three-km transects in order to recordnocturnal perching sites, especially for communal species.For each sampling scheme, we recorded the habitat type inwhich each species was found and their behavior in thathabitat (e.g. feeding, perching).
After an initial evaluation of these methods, we decidedto use audiovisual point counts alone. This method provedto be the most effective for recording the greatest number ofspecies in different kinds of habitats as well as for identify-ing very active birds such as wrens, woodcreepers, parrots,and cracids. Our census was aided by the use of a directionalmicrophone to record calls that were not immediatelyrecognizable. Nonsystematic observations were alsorecorded but not included in the data analysis.
RESULTS AND DISCUSSION
We recorded a total of 2103 individuals in 173 species, 42families, and 17 orders (Appendix 11). Most individualswere passeriformes. The number of species tallied corre-sponds to 60.7% of the avifauna reportedly found in thepark (Mendez et al., 1998).
New species records for LTNP include Aramusguarauma, Calidris minutilla, C. melanotus, C. fuscicollis,Cyanocorax yucatanicus, Cardinalis cardinalis, Cyanocoraxyucatanicus, and Himantopus mexicanus. The ranges ofdistribution were expanded for Tyrannus savana monachus,Laterallus exilis, and Pyrocephalus rubinus (based on mapsin Howell and Webb 1995). Jabiru mycteria was observedand had not been recorded in this area for 10 years (HermanA. Kihn, pers. com.).
Table 6.1. Distribution of sampling intensity per focal point,Laguna del Tigre National Park, Petén.
Focal Areas Extent of Sampling Types of HabitatSampled
Río San Pedro From Paso Caballos(SP2) to La Caleta(SP8)
Gallery forestconnected with highforest on hills,marshland
Río Sacluc Almost the entire RíoSacluc
Open and closedgallery forests
RíoEscondido
Almost two-thirds ofthe river (whennavigable)
Open and closedgallery forests,sawgrass marsh,flooded grassland,caños, burned areas
Laguna Florde Luna
Laguna Flor de Luna Open gallery forests,flooded savanna,“guamiles,” andsawgrass marshes
Río Chocop Parts of the ríosChocop andCandelaria;separately, Laguna laLámpara
Open and closedgallery forests,marshes, disturbedareas (oil operations,guamiles, burnedareas), vegetation raftswith Nymphea

CONSERVATION INTERNATIONAL Rapid Assessment Program58
0
20
40
60
80
100
SAN PEDRO
SACLUC
ESCONDIDO
FLOR D
E LUNA
CHOCOP
CANDELARIA
LAMPARA
# of spp.
# exclusive spp.
Figure 6.1. Patterns of bird species richness and the numbersof exclusive species (found in no other sample) among thesample areas in Laguna del Tigre National Park.
Avifaunal Comparisons Among Focal Areas
Overall, bird species were homogeneously distributed acrossthe park. The greatest richness was found along the SanPedro, Sacluc, and Escondido rivers, while relatively fewerspecies were observed on the Chocop and Candelaria rivers(Figure 6.1). The latter may be due to the small area ofclosed gallery forest there. The high species richness foundon the San Pedro and Sacluc rivers may be due to favorableweather conditions during sampling and the proximity of thelarge bosques altos. Many forest specialist bird species (c.f.Whitacre, 1996) were recorded in these areas, includingwoodcreepers, trogons, motmots, guans, chachalacas,curassows, and certain flycatchers. Some of these specieswere found only at these sites, such as Xiphorynchusflavigaster, Agriocharis ocellata, Crax rubra, and Trogonmassena.
The Río Escondido area harbored several riparianmacrohabitats, including sawgrass marshes, open galleryforest, and closed gallery forest (i.e. Punto Icaco, E8). Theadjacent zones on the west side of the park, together withthe Laguna la Lámpara, represent a unique habitat composedof swamps and flooded savannas. These habitats harbor birdspecies such as Rostramus sociabilis, Laterallus exillis,Aramus guarauma, and Jabiru mycteria.
The central area of the park, represented here by theChocop/Candelaria focal area, presented unique bird speciessuch as Dendrocygna anabatina (the black-bellied whistling-duck), which was observed in a lagoon near Pozo Xan 1.This zone had closed gallery forests and harbored primaryforest species such Micrastur semitorquatus and Xenopsminutus, which were also recorded in the ríos Sacluc and SanPedro during prior surveys (Pérez, 1998).
The jacana (Jacana spinosa) is strongly associated withfloating vegetation and was recorded only in lagoonspossessing the waterlily Nymphea ampla and in the shallowwetlands of the Río Escondido, where it occurred withPorphirula martinica, Laterallus ruber, and L. exillis.Busarellus nigricollis and Rostramus sociabilis wererecorded in isolated lagoons and were associated withemergent vegetation in sawgrass marshes.
Analyses of similarity revealed that there was generallya high degree of similarity in species composition amongsample areas (Table 6.2). The San Pedro and Sacluc areasshared 60 species due to their proximity. The majority of theavifauna of the Río Escondido and Laguna la Lámpara wasfound in the San Pedro, and most of these species wereassociated with the open gallery forests and forestedwetlands (see Léon and Morales Can, this volume). Speciesinhabiting the flooded grasslands, however, were not foundin the San Pedro area; these include Tyrannus savanamonachus, Pyrocephalus rubinus, and Aramus guarauma.Of the sites visited, only La Lámpara exhibited flooded
Table 6.2. Numbers and percentages of shared species among the study sites. NS is the number of species shared, % isthe percentage of species of the smaller fauna shared with the larger fauna in each comparison (Simpson’s SimilarityIndex).
RíoCandelaria
RíoChocop
Río Escondido Flor de Luna Laguna laLámpara
Río San Pedro
NS % NS % NS % NS % NS % NS %
Chocop 20 64.51
Escondido 22 48.88 15 48.38
Flor de Luna 20 44.44 11 35.48 31 66
Lámpara 13 35.13 5 16.13 29 78.38 19 51.35
San Pedro 28 62.22 16 51.61 45 64.28 26 55.31 28 75.67
Sacluc 30 66.67 26 83.87 38 54.28 30 63.83 25 67.57 60 69
RAP BULLETIN OF BIOLOGICAL ASSESSMENT SIXTEEN July 2000 59
grasslands, composed primarily of Cladium jamaicense andother species of Cyperaceae, grasses, trees (Crescentiaalata), and tasiste (Aceolorapphe wrightii) in certain areas.This type of habitat is also called “campería” by localinhabitants. A small number of families had settled on theedge of this lagoon. A combination of stresses due tovariation in climate (Kushlan et al., 1995) and local anthro-pogenic alteration may threaten the existence of criticalhabitats here.
The closed gallery forest type is shared among the ríosChocop, Candelaria, and Sacluc; as a consequence, theavifauna of these sites is similar (Table 6.2) The aquatic birdspecies of this type of gallery forest are typified by thepresence of kingfishers such as Chloroceryle americana andC. aenea, which frequent low perches located near bodies ofwater.
Avifaunal Distribution Among Macrohabitats
Riparian forestThe largest number of bird species (117) was recorded inthis type of habitat. There are two types of riparian forest:closed and open. In closed gallery forest, a large number offlycatcher species is associated with the undergrowth. Otherspecies that are typical of this habitat include Thryothorusmaculipectus, several woodcreepers (Dendrocinchlahomochroa, D. autumnalis, Automolus ochrolaemus,Xiphorynchus flavigaster, Xenops minutus), Micrasturruficollis, Platyrhynchus cancrominus, two kingfishers(Chloroceryle americana, C. aenea), Geotrygon montana,and Columba nigrirostris. Studies on the use of birds asbiological indicators indicate that bird species that forage inthe middle and undergrowth strata of mature forests (i.e.woodcreepers, wrens, and tyrant flycatchers) are sensitiveto habitat disturbance (Whitacre, 1996). This is due to thefact that these sedentary species are exposed to the effectsof disturbance to a greater degree than those speciesinhabiting the upper canopy (Levey, 1990).
Open gallery forest (including forested wetlands) is themost common forest type in this area, found along the ríosSan Pedro, Sacluc, and Escondido, and near all the lagoonswe observed. This habitat harbored the majority of specieswe recorded. The complex forest structure presentsopportunities for a variety of foraging niches, includingcanopy insectivores, hawkers (flycatchers and swallows),large wading birds (Ciconiiformes) that hunt along the riveredge, and predators such as hawks and kingfishers—most ofwhich require tall vegetation. Inhabitants of this type offorest include raptors (Busarellus nigricollis, Pandionhaliaetus, and Rostramus sociabilis); ciconiiforms (Ardeaherodias, Egretta thula, E. caerulescens, E. alba, Butoridesstriatus, Tigrisoma mexicanum, Cochlearius cochlearius,Nycticorax violaceus, Anhinga anhinga, and Phalacrocoraxolivaeus); flycatchers (Miozetetes imilis, Pitangus
sulphuratus, Megarhynchus pitanga, and Legatusleucophaius); and doves (Columba speciosa and C.cayenensis).
Threatened species such as the scarlet macaw (Aramacao) were recorded in open forest near a hillside near theChocop focal area. Previous studies (Pérez, 1998) suggestthat many of the macaw’s preferred food plants occupy thishabitat, including ramón (Brosimium alicastrum), membersof the Zapotaceae (Pouteria spp.), vines of the familyBignoniaceae (malerio bayo, malerio blanco, guaya [Talisiaolivaeriformes] and jocote jobo [Spondias spp.]), as well asthe tree species in which the macaws make their nests, suchas Acacia glomerosa. This tree is associated with floodedlowlands, often near lagoons. Slash-and-burn agriculture isthe primary threat to riparian forests of the park.
Flooded savannaThis type of habitat was recorded only in an area nearLaguna la Lámpara. Species exclusive to this site includeTyrannus savana monachus, Pyrocephalus rubinus, andAramus guarauma. Other species common in the area areTyrannus melancholicus, Myiozetetes similis, Megarynchuspitanga, Agelaius phoeniceus, Columba speciosa, C.flavirostris, and C. cayenensis. This unique habitat typemay be threatened by human colonization around thelagoon—especially by fires started during the dry season toclear land for agriculture.
Flooded grasslandsThis habitat is also known as wet savanna, salt marsh, floodplains, or sibal. It is one of the most extensive tropicalecosystem types (Dugan 1992). Flooded grassland is foundexclusively on the Río Escondido. It was also one of themost distinct in terms of bird species composition. There isa high diversity of microhabitats in this habitat due to itsvarying hydrological characteristics. For example, sandybanks are suitable habitat for species such as Calidrismelanotus, C. minutilla, C. fuscicollis, Laterallus exilis, L.ruber, and Tringa flavipes. We recorded most of the egretspecies observed in this survey in this habitat, as well asColumba spp. and the snail kite (Rostramus sociabilis),which depends principally on aquatic snails (Pomacea sp.).The jabiru (Jabiru mycteria) was observed here as well. Thishabitat is threatened by development due to the proximityof roads and the oil facilities; in particular, the widening ofthe river canal for navigation would be detrimental.
CONCLUSIONS AND RECOMMENDATIONS
We judge the overall health of avian biodiversity in thepark’s gallery forests to be intermediate. The abundance ofgeneralist species that are indicative of disturbance was notas great as in similar studies of guamil sites in the Lacandona

CONSERVATION INTERNATIONAL Rapid Assessment Program60
jungle of nearby Chiapas, Mexico (Warkentin et al., 1995).Continued forest disturbance and loss, however, is imminentif the agricultural activity of colonists continues unabated. Inthis regard, the central area of LTNP (i.e. Flor de Luna andChocop focal areas) is likely to be most affected bycolonization due to the presence of roads in this zone andtheir proximity to wetland habitats. Due to the uniquenessof the bird fauna in this zone, the impacts of habitatdestruction here will have disasterous consequences for thepark’s avifauna (Méndez et al., 1998).
Our observations suggest that critical habitats for aquaticbirds in LTNP, including both wetlands and bosque alto/riparian forests, are rare in the core areas of the MayaBiosphere Reserve (MBR; Carbonell et al., 1998). The strictconservation of such habitats in core areas should be animportant consideration in the design and management in theMBR (Méndez et al., 1998). To this end, it is imperativethat future studies in the park provide a more detailedunderstanding of what constitutes different avian habitatsand their distributions (rather than relying on simplezonations). We offer several specific recommendations forstudies and conservation of birds within LTNP in noparticular order of importance:
• Investigate the effects on the bird populations of channelwidening in the Río Escondido.
• Investigate the association between Tyrannus savanamonachus and Pyrocephalus rubinus with floodedsavanna habitats of La Lámpara.
• Implement a monitoring program to document changes inbird diversity along disturbance gradients in differenthabitat types and use these data to establish tolerancelimits for particular bird species.
• Provide a unified, regional perspective for managementof the wetland avifauna of the western MBR.
• Provide a detailed classification of avian habitats forareas throughout the MBR.
LITERATURE CITED
Carbonell, M., O. Lara, J. Fernández-Porto, and others.1998. Convention on Wetlands. Proceedings of theOrientation of Management. Ramsar Site: Laguna delTigre, Guatemala. Gland, Switzerland.
Dugan, P. J. (ed.) 1992. Conservation of Wetlands: AnAnalysis of Actual Issues and the Necessary Actions.IUCN, Switzerland.
Howell, S., and S. Webb. 1995. A Guide to Birds of Méxicoand Northern Central America. Oxford UniversityPress, New York, NY, USA.
Kushlan J. A., G. Morales, and P. Frohing. 1985. Foragingniche relations of wading birds in tropical westsavannas. Pp. 663-682 in Neotropical Ornithology.Ornithological Monographs 36.
Levey, D. 1990. Habitat-dependent fruiting behaviour of anunderstorey tree, Miconia centrodesma, and tropicaltreefall gaps as keystone habitats for frugivores inCosta Rica. Journal of Tropical Ecology 6: 409-420.
Méndez, C., C. Barrientos, F. Casteneda, and R. Rodas.1998. Programa de Monitoreo, Unidad de ManejoLaguna del Tigre. Los Estudios Base para suEstablecimiento. CI/ProPetén, Conservation Interna-tional, Guatemala.
Pérez E. S. 1998. Evaluation of available habitat for thescarlet macaw (Ara macao) in Petén, Guatemala. Tésisde Licenciatura. Universidad de San Carlos deGuatemala, Facultad de Ciencias, Químicas yFarmacia, Escuela de Biología.
Warkentin I. G., T. Russell, and J. Salgado. 1995. Songbirduse of gallery woodlands in recently cleared and oldersettled landscapes of the Selva Lacandona, Chiapas,México. Conservation Biology 9: 1095-1106.
Whitacre, D. 1996. Ecological Monitoring Program for theMayan Biosphere Reserve. Draft. The PeregrineFoundation.
Zigûenza R. 1994. Evaluación de las fluctuacionespoblacionales de 31 especeis de aves en el área deprotección especial Manchon-huamuchal. Tésis deLicenciatura. Universidad de San Carlos de Guatemala,Facultad de Ciencias, Químicas y Farmacia, Escuela deBiología.

61 RAP BULLETIN OF BIOLOGICAL ASSESSMENT SIXTEEN July 2000
ABSTRACTABSTRACTABSTRACTABSTRACTABSTRACT
Population Study of Crocodylus moreletii
• The densities of C. moreletii recorded along the Xan-Flor de Luna road and in Laguna la Pista are the highestyet recorded in Guatemala.
• Laguna la Pista, Laguna el Perú, and the Río Sacluc areideal sites in which to implement a managementprogram for Crocodylus moreletii in Laguna del TigreNational Park (LTNP) due to the high percentages ofadults at these sites as well as the infrastructureavailable to researchers.
• The sibal (stands of Cladium jamaicense) habitat wasmost often used by C. moreletii in LTNP. This habitatlikely offers suitable insolation, food availability, andprotection for this species.
• Transects of 500 m sampled in 150 min appears to be agood sampling strategy for C. moreletti in areas withinLTNP.
Survey of Herpetofauna in Riparian Vegetation
• There is a gradient of decreasing herpetofaunalabundance from the shorelines of water bodies to theforest interior during the dry season in LTNP.
• The species of reptiles and amphibians recorded inLTNP have broad distributions within the YucatánPeninsula and exhibit little specificity to the Petén area.Dermatemys mawii, however, is a regional endemic andshould be a focus of park managers.
CHAPTER 7
THE HERPETOFAUNA OF LAGUNADEL TIGRE NATIONAL PARK,PETEN, GUATEMALA, WITH ANEMPHASIS ON POPULATIONS OFTHE MORELET�S CROCODILE(CROCODYLUS MORELETII)
Francisco Castañeda Moya, Oscar Lara, andAlejandro Queral-Regil
INTRODUCTIONINTRODUCTIONINTRODUCTIONINTRODUCTIONINTRODUCTION
The Guatemalan herpetofauna is extremely rich. Campbelland Vannini (1989) listed 326 species for Guatemala, and160 of these occur in the Petén region (Campbell, 1998).However, during the last ten years, there have been severaltaxonomic revisions and phylogenetic analyses that haverevealed a richer herpetofauna than was previously thought(Campbell and Mendelson, 1998). Currently we know of145 species of amphibians and 242 species of reptiles for atotal of 387 species in Guatemala, although recent estimatessuggest that there may be more than 400 species (Campbelland Mendelson, 1998).
Despite these studies, the herpetofauna of the Peténand of Laguna del Tigre National Park specifically is poorlyknown. Recently, Mendez et al. (1998) conducted a surveyof the plants, birds, and amphibians and reptiles of the park.This study provided baseline data on herpetofauna, althoughthe geographic scope of this study was very limited.
An important component of the herpetofauna of thePetén is Morelet’s crocodile (Crocodylus moreletii). C.moreletii is an endemic species of the Yucatán Peninsula andis listed in the IUCN Red Book (1996) as data deficient andin Appendix I of CITES. Previous population studies of C.moreletii in Guatemala have shown that the persistence ofthe species in the area is threatened by illegal hunting and byincreased destruction of habitat due to human encroachment(Lara, 1990; Castañeda, 1997).
METHODS
Population Study of Crocodylus moreletii
Sampling of crocodiles took place in the following sites:1) San Pedro focal area: Río San Pedro (ca. 38 km along
the river, from the community of Paso Caballos to the

CONSERVATION INTERNATIONAL Rapid Assessment Program62
community of El Buen Samaritano) and Río Sacluc (ca. 7 kmfrom the confluence with the Río San Pedro to the end of theRío Sacluc).
2) Río Escondido focal area (ca. 29 km covering most ofthe navigable section of the river).
3) Flor de Luna focal area (ca. 1.3 km of shoreline ofLaguna Flor de Luna and ca. 1 km of shoreline of LagunaVista Hermosa).
4) Río Chocop focal area: Laguna Tintal (C4, 1.4 km ofshoreline); La Pista (C3; 2 km of shoreline); LagunaGuayacán (C2; 1.3 km of shoreline); and several otheraguadas (small ponds) and lagoons along the Xan-Flor deLuna road (refer to “Expedition Itinerary and Gazetteer”).
5) In addition, a sample was taken at Laguna el Perú (5km of shoreline), which is near the El Perú archeological site(a trail to the site begins near SP10).
We conducted the population census of Crocodylusmoreletii by shining spotlights along the shorelines of riversand lagoons from an inflatable boat with an outboard motor.We counted any visible crocodile. We attempted to captureevery animal we saw, although they were often out of reachfrom the boat. We categorized both observed and capturedanimals as neonates, juveniles, sub-adults, or adults based onapproximate body size (Castañeda, 1998). We estimated thesize of every individual using the relationship between eye-nostril distance and total length (following Lara, 1990).
In order to determine types of habitat used, we alsorecorded the habitat in which an animal was first observed.The habitat types considered were 1) water: those records offloating individuals not on the shoreline or in vegetation; 2)riparian forest: those records in arborescent vegetation onthe shorelines of water bodies; 3) guamil: secondary-growthvegetation lacking trees; 4) sibal: stands of sawgrass(Cladium jamaicense) in marsh vegetation; and 5) emergentvegetation.
Survey of Herpetofauna in Riparian Vegetation
The herpetofauna occupying the banks of rivers wasexamined at terrestrial sample points along the Río SanPedro (SPT1), Río Sacluc (SPT5), and Río Escondido (ET2,ET3; refer to “Expedition Itinerary and Gazetteer”).
We laid out belt transects 500 m in length and 5 m wideat the shoreline of these three rivers. Each transect wasdivided into five smaller 100-m transects. We standardizedsampling efforts by limiting the search to 30 min for every100 m. In addition, opportunistic observations in areassampled for crocodiles were recorded.
RESULTS
Population Study of Crocodylus moreletii
Overall, 130 individuals of C. moreletii were recorded in87.14 km of surveys in water bodies of LTNP. The averagedensity at sample points was 4.3 crocodiles/km. Closedaquatic systems had a greater average density whencompared to open systems (rivers; Table 7.1). Among openaquatic systems, the Río Sacluc possessed a greater densitythan the Río San Pedro or Río Escondido. The lagoons of theFlor de Luna focal area and the Laguna la Pista (SP3) had thegreatest densities among the closed aquatic systems. Thepopulation structure of C. moreletii in LTNP is biasedtoward younger age classes (Figure 7.1).
The Laguna el Perú had the highest percentage ofadults, constituting 32.26% of all adults in the study,followed by the Río Sacluc (Table 7.2). Laguna la Pista alsocontained a large number of adults and exhibited the largestpercentage of sub-adults in the study (ca. 46% of all sub-adults). In the Río Escondido, as in the San Pedro, weobserved a high percentage of neonates as well as juveniles.Samples from many lagoons in the Flor de Luna and RíoChocop focal areas exhibited low numbers; in these areas,most individuals were juveniles.
The largest percentage of habitat records of C. moreletiiwere in sibal (39%), followed by water away from shore(31%), riparian forest (25%), emergent vegetation (4%), andguamil (1%; Table 7.3). Adults had similar patterns ofabundance among habitats, with relatively high values inwater, riparian forest, and sibal (Table 7.2). On the otherhand, neonates and juveniles were most strongly associatedwith sibal.
Survey of Herpetofauna in Riparian Vegetation
We found a total of 14 amphibian species and 22 species ofreptiles (including Crocodylus moreletii; Appendix 12) alongthe sample transects. We recorded 240 individual reptilesand amphibians, excluding C. moreletii. The most abundant
Figure 7.1. The number of individuals of Crocodylus moreletii,by age class, observed during surveys within Laguna del TigreNational Park.
.
���������������������������������������
�����������������������������������������������������������������
���������������������������������������������������������������������������������������������������������������������
31
13
22
40
24
0
5
10
15
20
25
30
35
40
45
1
Age categories#
ind
ivid
ual
s
Adult���
Subadult���
Neonate���
Juvenile Unknown

RAP BULLETIN OF BIOLOGICAL ASSESSMENT SIXTEEN July 2000 63
Table 7.1. Estimated densities for Crocodylus moreletii in Laguna del Tigre National Park, Petén, Guatemala.
amphibian species were the fringe-toed foamfrog(Leptodactylus melanonotus; 119 individuals), Hylamicrocephala (25), and Ranaberlandieri (24). These specieswere found along all the transects sampled. The mostabundant species of reptiles were the striped basilisk(Basiliscus vittatus; 12) and Norops bourgeai (7). Amongturtles, Kinosternon leucostomum was the most abundant,although most individuals of this species were recorded asanecdotal observations. We found the highest species richnessin the Río San Pedro (17 species), followed by the Río Sacluc(13) and the Río Escondido (11; Appendix 12). With respectto abundance, however, the highest values were observed inthe Río Sacluc (123), followed by the Río San Pedro (68) andRío Escondido (40).
DISCUSSION
Population Study of Crocodylus moreletii
C. moreletii is commonly called the “marsh lizard” (lagartopantanero) due to its preference for these habitats (Alvarezdel Toro, 1974). This explains the relatively high densities ofthis species in lagoons and other closed aquatic systems whencompared to open aquatic systems such as rivers.
Within the zone of surrounding the Las GuacamayasBiological Station, the Río Sacluc is one of the most importantsites for the reproduction of this species (Castañeda, 1998).The densities recorded in this study (two individuals/km),when compared to values in other rivers such as the San Pedro(0.60) and Escondido (0.76), confirm the importance of theRío Sacluc in the region. The densities recorded in thecombined lagoons along the Xan-Flor de Luna road (12.28)and Laguna la Pista (11) are the highest densities recorded inGuatemala. The only other studies available for comparison—
those of Lara (1990) and Castañeda (1998)—reported arange of densities from 0 - 5.9.
The lagunas El Perú and La Pista and the Río Sacluc areideal sites from which to initiate management programs forC. moreletii within LTNP for the following reasons: 1) LaPista is easy to access and is relatively near the CONAPcontrol post; 2) El Perú is adjacent to a monitoring post ofCI-ProPetén, has facilities, and has a large number of adultindividuals; and 3) Río Sacluc is near the biological station.The fact that each of these sites has a large proportion ofadult individuals is an important factor to consider inmanaging the reproductive success of C. moreletii.The lagoons and ponds along the Xan-Flor de Luna road areof great interest not only because of the number of animals,but also because these are excellent sites in which to studymigration patterns of this species. The majority of therecorded animals were juveniles that possibly migrated fromother sites, which is consistent with the animals’ ages.
By comparing density values obtained by Castañeda(1998) in the ríos Sacluc (4.35 individuals/km) and San Pedro(2.10) with those recorded in this study in the samelocations (2.00 and 0.61 respectively), we see that the valuesmay differ but that the Sacluc maintains a greater density inboth samples. This variation may be due to the use of amore intensive sampling design in a smaller area byCastañeda (1998; two transects and eight surveys), while inthis study ten transects were sampled only once, allowingfor greater coverage of the park.
The population structure recorded in this study isatypical in that sub-adults were the smallest class. Stablepopulations typically have adults as the smallest age class(see references in Castañeda, 1998). This might be explainedby a more secretive behavior of sub-adults or by thepossibility that adults were migrating from natal areas toother sites in search of territories.
Open Aquatic SystemsSample point Length (km) # individuals Individuals/kmRío San Pedro 38 23 0.61Río Sacluc 7 14 2.00Río Escondido 29 22 0.76TOTAL 74 59 Average= 1.12
Closed Aquatic SystemsLaguna Flor de Luna 1.3 5 3.85Laguna Vista Hermosa 1 3 3.00Laguna Tintal 1.4 5 3.57Laguna la Pista 2 22 11.00Laguna Guayacán 1.3 2 1.54Laguna el Perú 5 22 4.40Other lagoons along Flor de Lunaroad
1.14 14 12.28
TOTAL 13.14 73 Average= 5.66GRAND TOTAL 87.14 130 Average= 4.30
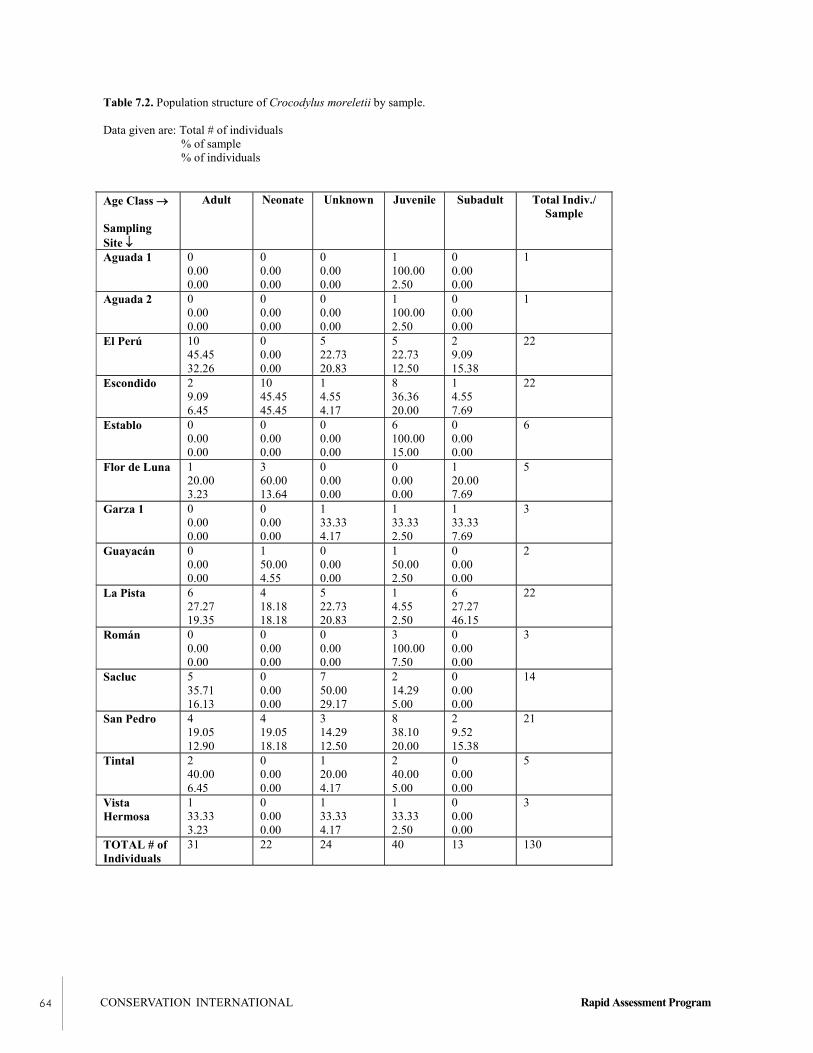
CONSERVATION INTERNATIONAL Rapid Assessment Program64
Table 7.2. Population structure of Crocodylus moreletii by sample.
Data given are: Total # of individuals% of sample% of individuals
Age Class →
SamplingSite ↓
Adult Neonate Unknown Juvenile Subadult Total Indiv./Sample
Aguada 1 00.000.00
00.000.00
00.000.00
1100.002.50
00.000.00
1
Aguada 2 00.000.00
00.000.00
00.000.00
1100.002.50
00.000.00
1
El Perú 1045.4532.26
00.000.00
522.7320.83
522.7312.50
29.0915.38
22
Escondido 29.096.45
1045.4545.45
14.554.17
836.3620.00
14.557.69
22
Establo 00.000.00
00.000.00
00.000.00
6100.0015.00
00.000.00
6
Flor de Luna 120.003.23
360.0013.64
00.000.00
00.000.00
120.007.69
5
Garza 1 00.000.00
00.000.00
133.334.17
133.332.50
133.337.69
3
Guayacán 00.000.00
150.004.55
00.000.00
150.002.50
00.000.00
2
La Pista 627.2719.35
418.1818.18
522.7320.83
14.552.50
627.2746.15
22
Román 00.000.00
00.000.00
00.000.00
3100.007.50
00.000.00
3
Sacluc 535.7116.13
00.000.00
750.0029.17
214.295.00
00.000.00
14
San Pedro 419.0512.90
419.0518.18
314.2912.50
838.1020.00
29.5215.38
21
Tintal 240.006.45
00.000.00
120.004.17
240.005.00
00.000.00
5
VistaHermosa
133.333.23
00.000.00
133.334.17
133.332.50
00.000.00
3
TOTAL # ofIndividuals
31 22 24 40 13 130

RAP BULLETIN OF BIOLOGICAL ASSESSMENT SIXTEEN July 2000 65
The similarity of the abundance patterns between theadults and the “unknown” class (Table 7.2, 7.3) with respectto sample points and habitats suggests that in many casesthe unknowns were likely adults. It is possible that theseindividuals have had negative experiences due to humanpresence in the area, which includes hunting (Castañeda,1998), and thus tend to hide before they can be tallied. Thelagunas El Perú and La Pista and the Río Sacluc may beconsidered important conservation areas for C. moreletiiwithin LTNP due to the high proportion of adults that theypossess—especially because the reproductive success ofcrocodile populations depends on a large number of breedingadults. In this regard, it is also important to note that Lagunala Pista also had a large number of sub-adults that willcontribute to the breeding population if they survive tomaturity. The relatively high proportions of young found inthe Río Escondido, Río San Pedro, and Laguna la Pista maybe due to earlier eclosion from eggs at these sites or tovarying reproductive success among crocodile populations.The influence of human activity on crocodile reproduction isan important topic for study in LTNP.
The sibal (marsh) vegetation type is relatively commonin LTNP and is an important habitat for animal species suchas fish and turtles, as well as for crocodiles which nest inthis vegetation. The importance of this habitat may bereflected in the relatively high use of sibal by crocodilesrecorded in this study (Table 7.3). It is possible thatcrocodiles use sibal for other reasons, including its relatively
Table 7.3. Habitat use of Crocodylus moreletii by age class.
Age classHabitat Body of
WaterAdults Neonates Unknown Juvenile Subadults Habitat
TotalsOpen water Lagoon 13 0 7 11 3 34
River 4 1 1 0 0 6Total 17 1 8 11 3 40Riparian forest Lagoon 1 1 3 4 1 10
River 5 3 7 7 1 23Total 6 4 10 11 2 33Emergent Lagoon 0 0 0 4 0 4vegetation River 0 0 0 1 0 1Total 0 0 0 5 0 5Guamil Lagoon 0 0 0 1 0 1
River 0 0 0 0 0 0Total 0 0 0 1 0 1Sibal Lagoon 6 7 3 3 6 25
River 2 10 3 9 2 26Total 8 17 6 12 8 51Overall total 31 22 24 40 13 130
high levels of insolation throughout much of the day, theincreased food availability due to the use of sibal by fish, thereduced accessibility for humans, and its reduced level ofdisturbance.
Despite the importance of sibals within the park, thishabitat is extensively burned each year, and this processconstitutes a major threat to C. moreletii populations in theregion (Castañeda, 1998).
Adults were often associated with open water,possibly because our study corresponded to the crocodiles’mating season that begins in March in Mexico (Alvarez delToro, 1982). In the case of LTNP, this period may begin inMarch or April (Castañeda, 1998). Adults were often foundin lagoons, perhaps due to the reduced accessibility oflagoons to humans when compared to rivers.
Survey of Herpetofauna in Riparian Vegetation
The overall high abundance of specimens recorded along theRío Sacluc is due to the high abundance of the fringe-toedfoamfrog (Leptodactylus melanonotus), which is a commonspecies with a broad distribution in LTNP. The majority ofanimals were detected on the shorelines of water bodies, andfew were found at greater than five meters inland from theshoreline. This is likely due to the dependence of theherpetofauna on areas near water during the dry season(Mendez et al., 1998).
It is apparent that modifying the transect designemployed by Méndez et al. (1998) of 200 m sampled in 120

CONSERVATION INTERNATIONAL Rapid Assessment Program66
min to a strategy of sampling 500 m in 150 min was moreefficient. However, more intensive survey efforts are neededin LTNP. New records for the area, such as the stripedspotbelly snake (Coniophanes quinquevittatus) found in thissurvey, are likely to emerge from such efforts.
Other threatened reptiles of the Petén that wereobserved during these surveys include the Central Americanriver turtle (Dermatemys mawii), whose populations aredeclining due to hunting (Campbell, 1998), and the boa (Boaconstrictor). D. mawii is listed by the IUCN as endangered,and both reptiles are CITES Appendix II listees. Along withMorelet’s crocodile, these species should be a focus offuture surveys and species-based management plans withinthe park.
RECOMMENDATIONS
• Monitor Crocodylus moreletii in LTNP, emphasizingthe Río Sacluc and lagunas El Perú and La Pista.
• Initiate a captive management program for C. morelettiin which wild-reared eggs are collected and incubatedunder controlled conditions. This will help to reduce theimpact of natural losses, and the surplus may be used asan economic alternative for local human populations.
• Use the 500 m/150 min transect sampling strategy,employing both visual and auditory signs, for futureherpetofaunal inventory and monitoring efforts inLTNP.
• Include the Central American river turtle (Dermatemysmawii) and the boa (Boa constrictor) in monitoringprograms.
LITERATURE CITED
Alvarez del Toro, M. 1974. Estudio Comparativo de losCrocodylia de México. Ed. Inst. Instituto Mexicano deRecursos Naturales Renovables, A.C. Mexico.
Alvarez del Toro, M. 1982. Los Reptiles de Chiapas.Instituto de Historia Natural del Estado,Departamento de Zoología.
Campbell, J. A. 1998. Amphibians and Reptiles of NorthernGuatemala, the Yucatán, and Belize. The Universityof Oklahoma Press, Norman, OK, USA.
Campbell, J. A., and J. R. Mendelson III. 1998.Documentación de los anfibios y reptiles de Guate-mala. Mesoamericana 3:21.
Campbell, J. A., and J. P. Vannini. 1989. Distribution ofamphibians and reptiles in Guatemala and Belize.Proceedings of the Western Foundation of VertebrateZoology 4:1-21.
Castañeda, F. 1997. Estatus y manejo propuesto deCrocodylus moreletii en el Departamento de El Petén,Guatemala. Pp. 52-57 in Memorias de la 4ta. ReuniónRegional del Grupo de Especialistas de Cocodrilos deAmérica Latina y el Caribe. Centro Regional deInnovación Agroindustrial, S.C. Villahermosa,Tabasco.
Castañeda, F. 1998. Situación actual y plan de manejo paraCrocodylus moreletii en el área de influencia de laEstación Biológica Las Guacamayas, Departamentode Petén, Guatemala. Tésis de Licenciatura enBiología, Facultad de Ciencias Químicas y Farmacia,Universidad de San Carlos, Guatemala.
Lara, O. 1990. Estimación del tamaño y estructura de lapoblación de Crocodylus moreletii en los lagos Petén-Itza, Sal-Petén, Peténchel y Yaxhá, El Petén, Guate-mala. Tésis de Maestría, Universidad Nacional,Heredia, Costa Rica.
Méndez, C., C. Barrientos, F. Casteñeda, and R. Rodas.1998. Programa de Monitoreo, Unidad de ManejoLaguna del Tigre. Los Estudios Base para suEstablecimiento. CI-ProPetén, Conservation Interna-tional, Washington, DC, USA.

67 RAP BULLETIN OF BIOLOGICAL ASSESSMENT SIXTEEN July 2000
ABSTRACT
• The mammal fauna was surveyed in four focal areas ofLaguna del Tigre National Park (LTNP). The studyfocused on small mammals.
• Bats were captured with mist nets and rodents withsnap traps. Other mammals were recorded by tracksand sign.
• A total of 40 species of mammals were identified froma potential list of 130 for the park. There were nosignificant differences in bat diversity among the fourfocal areas. Rodent species showed specific habitatassociations as has been reported previously in otherstudies.
• We report a new species record for Guatemala: the deermouse Peromyscus yucatanicus. Another regionalendemic, the spiny pocket mouse Heteromys guameri,was also observed. Several rare and/or threatened largemammals, including tapir and the red brocket deer wereobserved near the Las Guacamayas Biological Station.This area may be of great conservation value formammals.
INTRODUCTION
Deforestation produces loss and fragmentation of mammalhabitats and is one of the worst threats to mammalianbiodiversity worldwide. It produces a significant change inthe composition and relative abundance of mammal species,reflected in the local extinction of rare species (Williams andMarsh, 1998) and in increases in the abundance of generalistor opportunist species (Malcolm, 1997). For example,disturbances often lead to the invasion of species that
CHAPTER 8
THE MAMMAL FAUNA OF LAGUNADEL TIGRE NATIONAL PARK, PETEN,GUATEMALA, WITH AN EMPHASISON SMALL MAMMALS
Heliot Zarza and Sergio G. Perez
generally benefit from human activities, such as rabbits(Sylvilagus spp.) and the coyote (Canis latrans; Garrott etal., 1993).
Among mammals, bats are important components ofbiodiversity in tropical forests and may represent up to 60%of the local mammal fauna (Eisenberg, 1989). They aretrophically diverse, including species that feed on inverte-brates and vertebrates, pollen, nectar, fruit and blood(Wilson, 1989). The Neotropical forests have the greatestdiversity of bats in the world. Of the 75 genera present inthe Neotropics, 48 belong to the Family Phyllostomidae(Wilson, 1989). The diversity of phyllostomid bats isreflected in the numbers of species and their diversity ofdiets (Gardner, 1977), and these characteristics make themgood biological indicators (Fenton et al., 1992).
The composition and relative abundance of bats aredetermined by the complexity and heterogeneity of thehabitat (LaVal and Fitch, 1977). If the habitat maintains ahigh complexity and heterogeneity, it can provide a greatnumber of niches per unit of space (August, 1983). Thus,patterns of bat composition and diversity have greatpotential as detectors of habitat disturbance in tropicalforests (Amín and Medellín, in press). A study inLacandona, Mexico (Medellín et al., in press), foundsignificantly higher values of bat diversity in places withlittle perturbation and higher abundance of the subfamilyPhyllostominae in undisturbed habitats. Similar patternswere reported for eastern Quintana Roo, Mexico (Fenton etal., 1992). It has been proposed that the identity of thesingle most abundant bat species can also be indicative ofdisturbance. For example, the bat genus Artibeus is moreabundant in undisturbed tropical rainforest because it isassociated with high trees such as the amates (Ficus spp.)and jobos (Spondias spp.). In moderately disturbedconditions, the genus Carollia is dominant; in heavilydisturbed habitat, the single most abundant genus is Sturnira(Amín and Medellín, in press).

CONSERVATION INTERNATIONAL Rapid Assessment Program68
Small, non-volant mammals such as rodents arefunctionally important groups in tropical forests andconstitute between 15% and 25% of the mammal fauna inNeotropical forests (Voss and Emmons, 1996). Rodentsinfluence plant communities by dispersing seeds, areimportant food sources for predators (Dirzo and Miranda,1990), and are sensitive to habitat changes. Large Neotropi-cal forest mammals such as tapir, jaguar, and monkeys maybe especially sensitive to habitat change and human activitydue to their rarity, susceptibility to hunting, and timidity(Reid, 1997).
METHODS
A list of species that could potentially occur in LTNP wascompiled from range maps and distribution descriptions inHall (1981), Emmons and Feer (1997), and Reid (1997);these were compared with the collection data we obtained.
Sampling of Rodents
We established 540-m transects near the focal point of eachfocal area and sampled rodents using 90 snap traps (VictorRat Trap and Museum Special Mammal Trap) distributed inpairs at 45 stations located every 12 m along the transect.Traps were baited in the afternoon with a mixture of peanutbutter, raisins, crushed oats, and bacon and were checked inthe early morning (Jones et al., 1996). Traps were operatedtwo to three nights per transect. Each captured rodent wasidentified and prepared in the field as a study skin andvouchers were placed in liquid formol. All specimens arestored in the Zoological Collections of the Museum ofNatural History of the University of San Carlos.
Sampling of Bats
We used four mist nets measuring 2.6x12 m, placed in a “T”configuration to optimize capture effort (Kunz et al., 1996).Nets were placed in a different location each night, wereopened at sunset (ca. 18:30 hrs), and were closed four hourslater (ca. 22:30 hrs). This is the period during which bats aremost active (Fleming et al., 1972; Willig, 1986). Eachcaptured bat was identified to species using Medellín et al.(1997) and freed in the same site. In some cases, bats wereprepared as study specimens and deposited in the Zoologi-cal Collections of the Museum of Natural History of theUniversity of San Carlos.
The capture effort and the relative abundance werecalculated with the method proposed by Medellín (1993),where captures per total net meters per hour are used toestimate relative abundance. To estimate bat speciesrichness, we created species accumulation curves usingEstimateS 5 software (Colwell, 1999), using the species-
richness estimator ACE (Abundance-based CoverageEstimator of species richness) that is based on those specieswith 10 or fewer individuals in the sample. We calculated thediversity of the localities using the Shannon-Wienerdiversity index, and these values were compared among focalareas using a one way ANOVA (Zar, 1984). We alsoconsidered the bat community according to feeding habit.Each species was classified into different diet categoriesfollowing Medellín (1994).
Other Mammals
The majority of large mammals are difficult to observe. Weused tracks, fur, feces, carcasses, or skeletal remains andburrows (Aranda, 1981) to provide data on the presence andabsence larger mammals. We conducted daily visual surveysalong trails in order to sight mammals.
RESULTS AND DISCUSSION
Bats
We recorded 39% of the potential species (based on maps)of bats (23 species) for LTNP (Appendix 13). Two hundredand twenty-one individuals and 20 species were capturedwith a sampling effort of 684 meters of net for 57 hours (14nights). The average effort per night was 3.7 hours with 44meters of net (Table 8.2). We captured and identified threespecies without mist nets, which were not considered in theanalyses.
The greatest capture rate was observed at the Río SanPedro focal area, which contrasts with the lowest valuesrecorded in Flor de Luna and Río Chocop focal areas (Table8.1). These low values probably represent “lunar phobia,”i.e. a negative influence on bat activity due to the moon beingfull during sampling in both localities (Morrison, 1978). Thebat species accumulation curve (Figure 8.1) shows thatduring the first eight nights, 19 species were collected. These
0
5
10
15
20
25
30
0 1 2 3 4 5 6 7 8 9 10 11 12 13 14
Nights
Spe
cies
Figure 8.1. Species accumulation curve for bats in LTNP. Thelower curve (open circles) indicates the observed accumulation,and the upper curve (solid diamonds) indicates the estimatedaccumulation from the abundance-based coverage estimator(ACE).

RAP BULLETIN OF BIOLOGICAL ASSESSMENT SIXTEEN July 2000 69
represented 95% of the total species captured in the study.In the next six nights, only one species was added. The ACEestimator of species richness was 26.5.
There was no significant difference in diversity of thebat communities of the four localities (F = 1.116, p>0.05, n= 12). Total diversity was H’ = 1.471 for the four localitiescombined. Between the localities, Río Escondido had thehighest value of diversity (Table 8.2). The highest evennesswas found in Río Chocop (E = 0.94), perhaps due to the lownumber of species (S = 8) and to the low abundance (two tothree individuals/species).
The 20 species of bats captured belonged to fourfamilies. The family Phyllostomidae was the most abundant,with 198 individuals of 17 species, and was present in alllocalities. Four species (three phyllostomids and onemormoopid) were common in all localities. The relativeabundance (Table 8.3) shows that the dominant species ofthe community are Artibeus intermedius, Carolliabrevicauda, and A. lituratus. These species comprised 54%
of the total bats (see also Appendix 13). A second, lessabundant group consists of 11 species, some of which maybe considered common (e.g. Sturnira lilium, Dermanuraphaeotis), and others which are less often captured (e.g.Uroderma bilobatum). A third group of rare species consistsof six species captured only once that together represent2.7% of the bats captured (e.g. Chrotopterus auritus, Mimoncrenulatum).
Among the more abundant species (A. intermedius, C.brevicauda, and A. lituratus), two are dominant in undis-turbed habitat: A. intermedius and A. lituratus; the other, C.brevicauda, is dominant in moderately disturbed conditions.The abundance of each of these species is < 25% of the totalfor all bats captured, suggesting that the habitat is undis-turbed according to the criteria of Amín and Medellín (inpress).
Bats captured in this study represented a variety oftrophic groups (Figure 8.2). Insectivores comprised 43% ofspecies, followed by frugivores at 39%, carnivores at 8.7%,
Table 8.2. Relative abundance and dominance of bats in Laguna del Tigre National Park, Petén, Guatemala.
Rank Species Number of Individ. Ind/N-m/h
1 Artibeus intermedius 48 0.0063692 Carollia brevicauda 41 0.0054413 Artibeus lituratus 30 0.0039814 Sturnira lilium 20 0.0026545 Dermanura phaeotis 17 0.0022566 Pteronotus parnellii 16 0.0021237 Artibeus jamaicensis 10 0.0013278 Glossophaga commissarisi 8 0.0010629 Dermanura watsoni 7 0.00092910 Rhynchonycteris naso 5 0.00066311 Tonatia evotis 4 0.00053112 Desmodus rotundus 3 0.00039813 Mimon bennettii 3 0.00039814 Uroderma bilobatum 2 0.00026515 Mormoops megalophylla 1 0.00013316 Micronycteris schmidtorum 1 0.00013317 Chrotopterus auritus 1 0.00013318 Centurio senex 1 0.00013319 Mimon crenulatum 1 0.00013320 Tonatia brasiliense 1 0.000133
Table 8.1. Capture effort and success using mist nets in Laguna del Tigre National Park, Petén, Guatemala.
San Pedro Sacluc Escondido Flor deLuna
Chocop Total Average Avg/night
Net-m 144 144 96 132 144 660 132 44.00Nights 3 3 2 3 3 14 2.8 0.93Hours 12 12 8 12 12 56 11.2 3.73# bats 100 38 38 19 25 220 44 14.67# species 14 10 12 8 8 20 10.4Net-m/h 1728 1728 768 1584 1728 7536#bats/N-m/h 0.05787 0.02199 0.049479 0.01199 0.01446 0.029193#species/N-m/h 0.00810 0.00578 0.015625 0.00505 0.00463 0.002654

CONSERVATION INTERNATIONAL Rapid Assessment Program70
nectarivores at 4.3%, and sanguivores at 4.3%. In theirstudies of tropical forest bats, Wilson et al. (1997) and Amín(1996) reported that the frugivores were the largest trophicgroup (50%), followed by insectivores (23%). Our resultsmay differ from theirs because our sampling points wereclose to bodies of water, where insectivores are generallymore abundant (Kunz and Kurta, 1988).
Analysis of Bat Diversity by Sites (Table 8.3)
Río San Pedro Focal AreaIn this locality we recorded the highest number of species(15 species) and captures (138 individual). This locality wassubdivided into two points for sampling—the Río San Pedroand the Río Sacluc—because of the contrasting vegetationbetween them. Along the Río San Pedro, sampling wascarried out in riparian forest (SPT1-3) and bosque alto(SPT6; refer to Table 1.2, Appendix 2); here we captured100 individuals of 14 species in three nights. The mostabundant species were Artibeus intermedius, Carolliabrevicauda, A. lituratus, and Sturnira lilium. In Río Sacluc,the nets were placed in encinal (SPT4-5), and 38 individualsof 10 species were captured. The most abundant specieshere were A. lituratus, C. brevicauda, and A. intermedius.The capture success here was half that in the bosque altohabitat (Table 8.1). There was no statistically significantdifference among the focal areas (San Pedro vs. Sacluc:
t 0.05(2),74.34=1.933, tobs=1.352, P >0.005), but thediversity values were slightly higher in Río San Pedro (Table11). The only wrinkle-faced bat (Centurio senex) observedwas captured at the Río Sacluc site. One black mastiff bat(Molussus ater) was found under a camping tent in the LasGuacamayas Biological Station (SP13), and one group of theproboscis bats (Rhynchonycteris naso; five to six individu-als) was observed on a tree trunk directly above water. In theLaguna el Perú, we also observed a greater fishing bat(Noctilio leporinus).
Río EscondidoHere we sampled in bosque alto with some natural openareas (ET 1-2). The forest was burned ca. 20 years ago. Wecaptured 39 individuals and 13 species. The most abundantspecies were Artibeus intermedius and Sturnira lilium.Richness values were similar to those at Río San Pedro,although abundance was lower. Capture success here wasslightly higher than at Río Sacluc (Table 8.1). This localityexhibited the highest richness values (Table 8.2). Weobserved a group of greater white-lined bats (Saccopteryxbilineata) that was using a hollow log of matapalos (Ficussp.) as a roost.
Laguna Flor de LunaBosque bajo consisting of tintales was sampled here (FT 1-3). We captured 19 individuals from eight species. Duringthe first night of sampling, we obtained the highest numberof individuals; the most abundant species were Pteronotusparnellii and Sturnira lilium. Capture success here was thelowest of all the focal areas (Table 8.1). Richness, abun-dance, and capture success decreased after the second nightof sampling, probably due to the influence of a full moon(Morrison, 1978).
Río ChocopBosque alto was sampled here, and dominant plant specieswere Mataiba sp., Chrysophila sp., and some sapoteceas(Manilkara sapota and Pouteria sp.). We captured 25individuals and eight species. The dominant species wereArtibeus intermedius and Pteronotus parnellii. These results
Frugivores9 spp. (39%)
Sanguivores1 sp. (4%)
Carnivores2 spp. (9%)
Insectivores10 spp. (44%)
Nectarivores1 sp. (4%)
Table 8.3. Richness and diversity of bats by focal area in Laguna del Tigre National Park, Petén, Guatemala.
H’ = the Shannon-Wiener Index
Focal Area # Ind. # Spp. Diversity (H’) EvennessRío San Pedro 100 14 1.6897 0.8270Río Sacluc 38 10 1.3514 0.9050Río Escondido 38 12 1.8475 0.9173Laguna Flor de Luna 19 8 1.1769 0.8993Río Chocop 25 8 1.2899 0.9404Overall values 220 20 1.4711 0.8978
Figure 8.2. The percentage of bat species belonging todifferent trophic groups in LTNP.
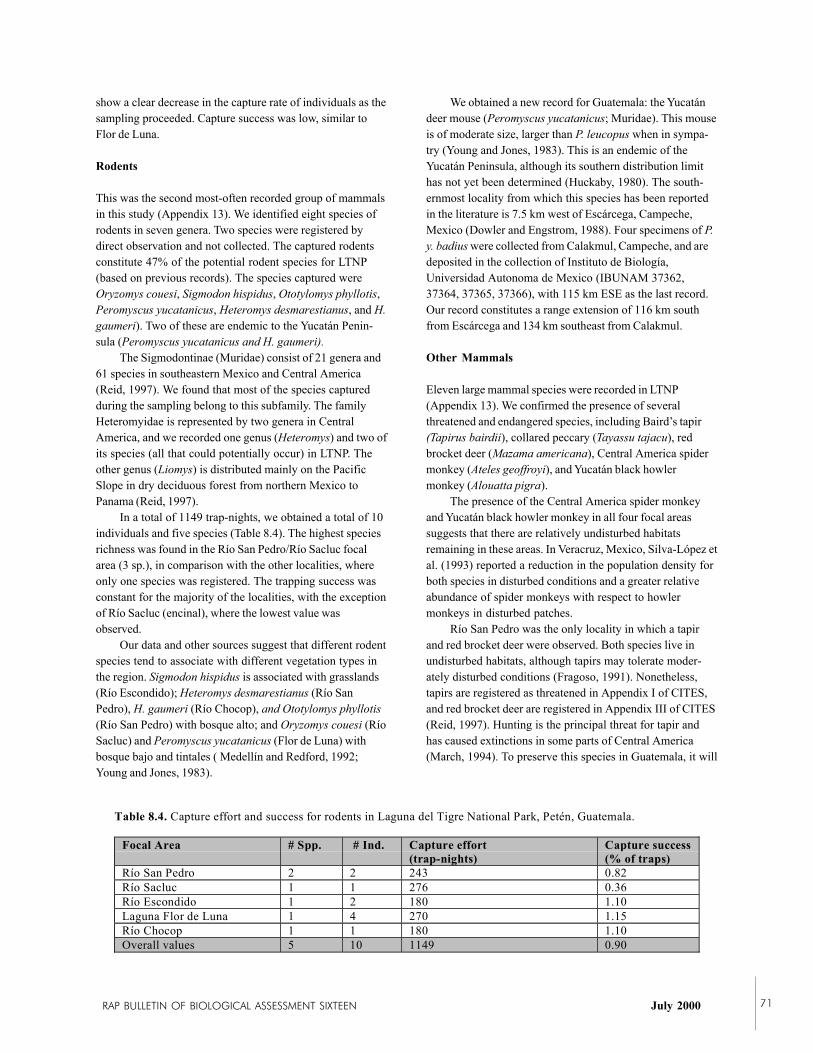
RAP BULLETIN OF BIOLOGICAL ASSESSMENT SIXTEEN July 2000 71
show a clear decrease in the capture rate of individuals as thesampling proceeded. Capture success was low, similar toFlor de Luna.
Rodents
This was the second most-often recorded group of mammalsin this study (Appendix 13). We identified eight species ofrodents in seven genera. Two species were registered bydirect observation and not collected. The captured rodentsconstitute 47% of the potential rodent species for LTNP(based on previous records). The species captured wereOryzomys couesi, Sigmodon hispidus, Ototylomys phyllotis,Peromyscus yucatanicus, Heteromys desmarestianus, and H.gaumeri). Two of these are endemic to the Yucatán Penin-sula (Peromyscus yucatanicus and H. gaumeri).
The Sigmodontinae (Muridae) consist of 21 genera and61 species in southeastern Mexico and Central America(Reid, 1997). We found that most of the species capturedduring the sampling belong to this subfamily. The familyHeteromyidae is represented by two genera in CentralAmerica, and we recorded one genus (Heteromys) and two ofits species (all that could potentially occur) in LTNP. Theother genus (Liomys) is distributed mainly on the PacificSlope in dry deciduous forest from northern Mexico toPanama (Reid, 1997).
In a total of 1149 trap-nights, we obtained a total of 10individuals and five species (Table 8.4). The highest speciesrichness was found in the Río San Pedro/Río Sacluc focalarea (3 sp.), in comparison with the other localities, whereonly one species was registered. The trapping success wasconstant for the majority of the localities, with the exceptionof Río Sacluc (encinal), where the lowest value wasobserved.
Our data and other sources suggest that different rodentspecies tend to associate with different vegetation types inthe region. Sigmodon hispidus is associated with grasslands(Río Escondido); Heteromys desmarestianus (Río SanPedro), H. gaumeri (Río Chocop), and Ototylomys phyllotis(Río San Pedro) with bosque alto; and Oryzomys couesi (RíoSacluc) and Peromyscus yucatanicus (Flor de Luna) withbosque bajo and tintales ( Medellín and Redford, 1992;Young and Jones, 1983).
We obtained a new record for Guatemala: the Yucatándeer mouse (Peromyscus yucatanicus; Muridae). This mouseis of moderate size, larger than P. leucopus when in sympa-try (Young and Jones, 1983). This is an endemic of theYucatán Peninsula, although its southern distribution limithas not yet been determined (Huckaby, 1980). The south-ernmost locality from which this species has been reportedin the literature is 7.5 km west of Escárcega, Campeche,Mexico (Dowler and Engstrom, 1988). Four specimens of P.y. badius were collected from Calakmul, Campeche, and aredeposited in the collection of Instituto de Biología,Universidad Autonoma de Mexico (IBUNAM 37362,37364, 37365, 37366), with 115 km ESE as the last record.Our record constitutes a range extension of 116 km southfrom Escárcega and 134 km southeast from Calakmul.
Other Mammals
Eleven large mammal species were recorded in LTNP(Appendix 13). We confirmed the presence of severalthreatened and endangered species, including Baird’s tapir(Tapirus bairdii), collared peccary (Tayassu tajacu), redbrocket deer (Mazama americana), Central America spidermonkey (Ateles geoffroyi), and Yucatán black howlermonkey (Alouatta pigra).
The presence of the Central America spider monkeyand Yucatán black howler monkey in all four focal areassuggests that there are relatively undisturbed habitatsremaining in these areas. In Veracruz, Mexico, Silva-López etal. (1993) reported a reduction in the population density forboth species in disturbed conditions and a greater relativeabundance of spider monkeys with respect to howlermonkeys in disturbed patches.
Río San Pedro was the only locality in which a tapirand red brocket deer were observed. Both species live inundisturbed habitats, although tapirs may tolerate moder-ately disturbed conditions (Fragoso, 1991). Nonetheless,tapirs are registered as threatened in Appendix I of CITES,and red brocket deer are registered in Appendix III of CITES(Reid, 1997). Hunting is the principal threat for tapir andhas caused extinctions in some parts of Central America(March, 1994). To preserve this species in Guatemala, it will
Table 8.4. Capture effort and success for rodents in Laguna del Tigre National Park, Petén, Guatemala.
Focal Area # Spp. # Ind. Capture effort(trap-nights)
Capture success(% of traps)
Río San Pedro 2 2 243 0.82Río Sacluc 1 1 276 0.36Río Escondido 1 2 180 1.10Laguna Flor de Luna 1 4 270 1.15Río Chocop 1 1 180 1.10Overall values 5 10 1149 0.90

CONSERVATION INTERNATIONAL Rapid Assessment Program72
be necessary to conserve populations in the Maya Bio-sphere Reserve (Matola et al., 1997) and in LTNP inparticular.
Although we did not record jaguar (Panthera onca) inLTNP, a recent rapid assessment identified areas containingviable populations of jaguars in Guatemala. The mostimportant population in Guatemala was judged to resideinside the MBR, specifically in LTNP and Sierra delLacandon National Park (McNab and Polisar, in press).
CONCLUSIONS AND RECOMMENDATIONS
Three conclusions emerge from this work and other studiesconducted in the region:
• LTNP is an important refuge of high mammal diversityand harbors populations of several threatened andendangered species due to its great area, habitatheterogeneity, and relatively pristine state.
• Within LTNP, the Río San Pedro focal area is perhapsthe most important conservation area because of itscomparatively high bat abundance and richness, and thepresence of threatened and endangered species.
• LTNP represents one of the few places in the regionwhere longterm viable populations of large mammalssuch as tapir and jaguar can be supported.
• The principal factors that threaten the populations ofwild mammals of LTNP are slash-and-burn agriculture,hunting, and the expansion of human settlements,although the impacts of these factors in different partsof the park are little understood. To improve ourunderstanding of these processes, a monitoring programevaluating the impact of humans on mammal popula-tions in LTNP should be initiated. To organize such amonitoring program and manage mammal populationsfor the long term, it will be necessary to developregional collaborations with Mexico and Belize with theobjective of maintaining the existence of biologicalcorridors in order to avoid the genetic isolation ofpopulations. One focus of such a program shouldemphasize charismatic species such as the tapir andjaguar in order to guarantee their permanence inGuatemala.
LITERATURE CITED
Amín, M. 1996. Ecología de comunidades de murciélagosen bosque tropical y hábitats modificados en la SelvaLacandona, Chiapas. Tesis de Licenciatura.Universidad Nacional Autónoma de México.
Amín, M., and R. A. Medellín. In press. Bats as indicatorsof habitat disturbance. In Single Species Approaches toConservation: What Works, What Doesn’t and WhyIsland Press, Washington, DC, USA.
Aranda, J. M. 1981. Rastros de los mamíferos silvestres deMéxico. Manual de campo. Instituto Nacional deInvestigaciones sobre Recursos Bióticos, México.
August, P. V. 1983. The role of habitat complexity andheterogeneity structuring tropical mammal communi-ties. Ecology 64:1495-1507.
Colwell, R. K. 1999. EstimateS 5. Statistical Estimation ofSpecies Richness and Shared Species from Samples.Web site: viceroy.eeb.uconn.edu/estimates.
Dirzo, R., and A. Miranda. 1990. Contemporary Neotropi-cal defaunation and forest structure, function, anddiversity: A sequel to John Terborgh. ConservationBiology 4: 444-447.
Dowler, R. C., and M. D. Engstrom. 1988. Distributionalrecords of mammals from the southwestern YucatánPeninsula of Mexico. Annals of Carnegie Museum57:159-166.
Eisenberg, J. F. 1989. Mammals of the Neotropics: TheNorthern Neotropics: Panama, Colombia, Venezuela,Suriname, French Guiana. Vol 1. University ofChicago Press, Chicago, IL, USA.
Emmons, L. H., and F. Feer. 1997. Neotropical RainforestMammals: A Field Guide. Second edition. TheUniversity of Chicago Press, Chicago, IL, USA.
Fenton, M. B., L. Acharya, D. Audet, M. B. C. Hickey, C.Merriman, M. K. Obrist, D. M. Syme, and B. Adkins.1992. Phyllostomid bats (Chiroptera: Phyllostomidae)as indicators of habitat disruption in the Neotropics.Biotropica 24: 440-446.
Fleming, T. H., E. T. Hooper, and D. E. Wilson. 1972.Three Central American bat communities: structure,reproductive cycles, and movement patterns. Ecology53: 555-569.

RAP BULLETIN OF BIOLOGICAL ASSESSMENT SIXTEEN July 2000 73
Fragoso, J. M. 1991. The effect of selective logging onBaird’s tapir. Pp. 295-304 in Latin America Mammal-ogy: History, Biodiversity, and Conservation (M. A.Mares and D. J. Schmidly, eds.). University ofOklahoma Press, Norman, OK, USA.
Gardner, A. L. 1977. Feeding habits. Pp. 351-364 inBiology of Bats of the New World: FamilyPhyllostomidae Part II (R. J. Baker, J. K. Jones, andD. C. Carter, eds.). Special Publications, Museum,Texas Tech University, Lubbock, TX, USA.
Garrott, R. A., P. J. White, and C. A. Vanderbilt White.1993. Overabundance: an issue for conservationbiologists? Conservation Biology 7: 946-949.
Hall, E. R. 1981. The Mammals of North America, Vol. 1.John Wiley and Sons.
Huckaby, D. C. 1980. Species limits in the Peromyscusmexicanus group (Mammalian: Rodentia: Muridea).Contributions Sciences National History Museum,Los Angeles 326: 1-24.
Jones, C., W. J. McShea, M. J. Conroy, and T. H. Kunz.1996. Capturing mammals. Pp. 115-155 in Measuringand Monitoring Biological Diversity: StandardMethods for Mammals (D. Wilson, J. R. Cole, J. D.Nichols, R. Rudran, and M. S. Foster, eds.).Smithsonian Institution Press, Washington, DC, USA.
Kunz, T. H., and A. Kurta. 1988. Capture methods andholding devices. Pp. 1-29 in Ecological and BehaviorMethods for Study of Bats (T. H. Kunz, ed.).Smithsonian Institution Press, Washington, DC, USA.
Kunz, T. H., D. W. Thomas, G. C. Richards, C. R.Tidemann, E. D. Pierson, and P. A. Racey. 1996.Observational techniques for bats. Pp. 105-114 inMeasuring and Monitoring Biological Diversity:Standard Methods for Mammals (D. Wilson, J. R.Cole, J. D. Nichols, R. Rudran, and M. S. Foster,eds.). Smithsonian Institution Press, Washington, DC,USA.
LaVal, R. K., and H. S. Fitch. 1977. Structure, movement,and reproduction in three Costa Rican bat communi-ties. Occasional Papers, Museum of Natural History,University of Kansas 69:1-28.
Malcolm, J. R. 1997. Biomass and diversity of smallmammals in Amazonian Forest fragments. Pp. 207-221 in Tropical Forest Remnants: Ecology, Manage-ment, and Conservation of Fragmented Communities(W. F. Laurace and R. O. Bierregaard, eds.). TheUniversity of Chicago Press, Chicago, IL, USA.
March, I. J. 1994. Situación actual del tapir en México.Centro de Investigaciones Ecológicas del Sureste (SerieMonográfica No. 1).
Matola, S., A. D. Cuarón, and H. Rubio-Torgler. 1997.Status and action plan of Baird’s tapir (Tapirusbairdi). In Tapir: Status and Conservation Action Plan(D. M. Brooks, R. E. Bodmer, and S. Matola, eds.).The IUCN/SSC Tapir Specialist Group Report. Website: http://www.tapirback.com/tapirgal/iucn-ssc/actions97/cover.htm.
McNab, R. B., and J. Polisar. In press. A participatorymethodology for a rapid assessment of jaguar(Panthera onca) distributions in Guatemala. WildlifeConservation Society.
Medellín, R. A. 1993. Estructura y diversidad de unacomunidad de murciélagos en el trópico húmedomexicano. Pp. 333-354 in Avances en el Estudio de losMamíferos Méxicanos (R. A. Medellín and G.Ceballos, eds.). Publicaciones Especiales, AsociaciónMexicana de Mastozoología, A. C. 1:1-464.
Medellín, R. A. 1994. Mammals diversity and conserva-tion in the Selva Lacandona, Chiapas, México.Conservation Biology 8:788-799.
Medellín, R. A., H. Arita, and O. Sánchez. 1997.Identificación de los murciélagos de México. clave decampo. Asociación Mexicana de Mastozoología, A.C.Publicaciones Especiales No 2. México.
Medellín, R. A., M. Equihua, and M. A. Amín. In press.Bat diversity and abundance as indicators of distur-bance in Neotropical rainforest. Conservation Biology.
Medellín, R. A., and K. H. Redford. 1992. The role ofmammals in Neotropical forest-savanna boundaries.Pp. 519-548 in Nature and Dynamics of Forest-Savanna Boundaries (P.A. Furley, J. Procyor, andJ.A. Ratter, eds.). Chapman & Hall.
Morrison, D. W. 1978. Lunar phobia in a tropical fruit bat,Artibeus jamaicensis (Chiroptera: Phyllostomidae).Animal Behaviour 26:852-855.

CONSERVATION INTERNATIONAL Rapid Assessment Program74
Reid, F. A. 1997. A Field Guide to the Mammals of CentralAmerica and Southeast Mexico. Oxford UniversityPress, New York, NY, USA.
Silva-López, G., J. Benítez-Rodríguez, and J. Jimenéz-Huerta. 1993. Uso del hábitat por monos araña (Atelesgeoffroyi) y aullador (Alouatta palliata) en áreasperturbadas. Pp. 421-435 in Avances en el Estudio delos Mamíferos Méxicanos (R. A. Medellín and G.Ceballos, eds.). Publicaciones Especiales, AsociaciónMexicana de Mastozoología, A.C. 1:1-464.
Voss, R. S., and L. H. Emmons. 1996. Mammaliandiversity in Neotropical lowland rainforest: apreliminary assessment. Bulletin American Museumof Natural History 230:1-115.
Williams, S. E., and H. Marsh. 1998. Changes in smallmammal assemblage structure across a rain forest/openforest ecotone. Journal of Tropical Ecology 14:187-198.
Willig, M. R. 1986. Bat community in South America: atenacious chimera. Revista Chilena de Historia Natural59: 151-168.
Wilson, D. E. 1989. Bats. Pp. 365-382 in Tropical RainForest Ecosystems: Biogeographical and EcologicalStudies (H. Lieth and M. J. A. Werger, eds.). ElsevierScience Publications, Amsterdam, the Netherlands.
Wilson, D. E., R. Baker, S. Solari, and J. J. Rodríguez.1997. Bats: Biodiversity assessment in the LowerUrubamba Region. Pp. 293-301 in BiodiversityAssessment and Monitoring of the Lower UrubambaRegion, Peru: San Martin-3 and Cashiriari-2 WellSites (F. Dallmeier and A. Alonso, eds.). SI/MABSeries # 1. Smithsonian Institution/MAB BiodiversityProgram, Washington, DC, USA.
Wilson, D. E., and D. M. Reeder. 1993. Mammal species ofthe world: a taxonomic and geographic reference. 2nd.ed. Smithsonian Institution Press, Washington, DC,USA.
Young, C. J., and J. K. Jones. 1983. Peromyscusyucatanicus. Mammalian Species 196: 1-3.
Zar, J. H. 1984. Biostatistical Analysis. 2nd. Ed. PrenticeHall. Englewood Cliffs, NJ, USA.

75 RAP BULLETIN OF BIOLOGICAL ASSESSMENT SIXTEEN July 2000
ABSTRACT
• We recorded 112 species and 39 genera of ants inLaguna del Tigre National Park (LTNP). These valuesare greater than those recorded in several other studiesin the region.
• The genus Pheidole contained the largest number ofspecies, but several arboreal genera were also highlydiverse.
• Three ant species endemic to the Maya Forest regionwere recorded, including Sericomyrmex aztecus,Xenomyrmex skwarrae, and Odontomachus yucatecus.One extremely rare ant genus, Thaumatomyrmex, wasdiscovered for the first time in Guatemala.
• Species richness was highest in relatively open ordisturbed habitats, contrary to our expectations. Thiswas likely due to the high microhabitat diversity ofthese sites. A disturbed habitat was relatively similar toa nearby pristine forest site, which is consistent withthe suggestion that the recovery of Neotropical antfaunas from disturbance is rapid.
• Turnover rates of ant composition between sites isvery high, precluding an assessment of species-habitatassociations. The overall richness of the LTNP antfauna is likely to be much higher than that recorded.
INTRODUCTION
Insects are believed to be the most speciose group oforganisms on Earth (May, 1988). This group reaches itsgreatest diversity in tropical forests (Erwin and Scott, 1980),
CHAPTER 9
THE ANTS (HYMENOPTERA:FORMICIDAE) OF LAGUNA DELTIGRE NATIONAL PARK, PETEN,GUATEMALA
Brandon T. Bestelmeyer, Leeanne E. Alonso, andRoy R. Snelling
so the increasing rate of tropical deforestation may result insevere reductions in insect diversity worldwide. For thisreason, surveys that document patterns of insect diversityamong tropical forests are needed to prioritize the conserva-tion of tropical regions and habitats within regions (Hailaand Margules, 1996). Another consequence of the greatdiversity of insects is that it is often logistically difficult toconsider all insects simultaneously in such surveys. Thus,ecologists often rely on information provided by one ormore groups of insects to characterize patterns of insectdiversity across landscapes and regions.
Ants (Hymenoptera: Formicidae) are one group thatmay be useful for characterizing the responses of terrestrialinsects. Ants are extremely conspicuous, abundant, active,and diverse elements of Neotropical forests. Because antsare social insects, ants taken as a whole are very flexible intheir responses to differences in their environments in timeand space (Wilson, 1987). As a consequence of thisflexibility, ants are very successful in even the mostdisturbed habitats. Ants may be found nesting and foragingin nearly all parts of terrestrial ecosystems, from deep in thesoil column to the leaf litter-soil interface to twigs and leaveson the litter surface to bushes, epiphytes, and tree canopies.
The species composition and richness of ant communi-ties, however, may reveal strong responses to natural habitatvariation and habitat disturbances (Andersen, 1991;Bestelmeyer and Wiens, 1996; Vasconcelos, 1999) becausedifferent species may be closely associated with particularsoil conditions (Johnson, 1992), microclimates (Perfecto andVandermeer, 1996), and even the presence of particular plantspecies (Alonso, 1998), all of which may be altered byhuman economic activities. In tropical forests in particular,canopy cover is an important correlate of more proximateenvironmental features that determine the distribution andabundance of ant species (MacKay, 1991; Perfecto andSnelling, 1995). The responses of ants to such variation can

CONSERVATION INTERNATIONAL Rapid Assessment Program76
be used to evaluate both the conservation value of particularareas as well as the effects of human land use onbiodiversity.
No studies of ant communities have yet been reportedfor the forests of the Petén in Guatemala, and our primaryobjective in this rapid assessment was to provide a firstglimpse of the richness and composition of the ant fauna inLaguna del Tigre National Park (LTNP) in a biogeographiccontext. We also sought to provide a preliminary assessmentof the relationships between habitat variation and variationin ant community composition and richness. Specifically, wefocused on the contrast between 1) closed-canopy habitatsthat characterize bosque alto, 2) relatively open-canopyhabitats including encinales and tintales that are produced bynatural processes, and 3) guamiles that are produced bysecondary succession following deforestation. We hypoth-esized that open-canopy habitats would have lower speciesrichness and altered community composition when com-pared to closed-canopy habitats in the context of thistropical forest, as was found by MacKay (1991) andVasconcelos (1999). We did not, however, sample inten-sively in recently disturbed pasture habitats. Such an effortwould be redundant as several studies have amply demon-strated the consequences of such drastic changes in vegeta-tion on ant diversity (Greenslade and Greenslade, 1977;Quiroz-Robledo and Valenzuela-Gonzales, 1995;Vasconcelos, 1999). We did observe patterns of ant speciesdominance in grassland habitats, however, for comparisonwith other studies in the region. We use this body ofinformation to highlight the regional importance of the parkand to attempt to identify some of the processes that maysupport or threaten ant and other arthropod populations inthe park. Our observations are intended to suggest fruitfulavenues for more intensive studies in the park as well as toprovide tentative information on patterns of ant speciesrichness in the absence of such studies.
STUDY AREAS AND METHODS
Ants and environmental variables were sampled alongtransects in one or more habitat types in each focal area(refer to “Expedition Itinerary and Gazetteer”). No attemptwas made to characterize the ant fauna of focal areas becauseeach focal area contained a variety of distinct habitat typesthat could not be sampled adequately in the time provided.Ant species respond to habitat variation occurring at veryfine scales, so our principal objective was to examine ant-habitat associations in distinct habitat types. Pitfall trappingwas used to gather standardized samples for quantitativecomparisons, following procedures in Bestelmeyer et al. (inpress). One pitfall trap (75 mm diameter) was placed at 10points along a 90-m transect at 10-m intervals (see Table9.4). Traps were opened for about 48 hrs. Pitfall trapping
was performed at five terrestrial sample points: SPT1(guamil habitat; see Table 1.2); SPT4 (encinal habitat); SPT6(bosque alto, ramonal habitat); ET1 (recently burnedramonal); and FT1 (bosque bajo, tintal habitat).
In addition, Winkler litter extraction was performed atSPT1 and SPT6. Litter extraction was performed using the“mini-Winkler” design, following methods outlined inBestelmeyer et al. (in press). All leaf litter and twigs within1-m2 quadrats at 10 stations per transect were sampled.Litter samples were taken at least 2 m from pitfall traplocations.
Tuna baits were used to sample scavenging/omnivorousant species and to provide information on the foragingbehavior of some species at ET1, ET2 (grassland habitatonly), FT1, CT1 (bosque alto), and CT4 (bosque alto). Aone-half-teaspoon-sized bait of canned tuna (ca. 3 g) wasplaced at 10 points (10-m spacing) along a 90-m transect.Baiting occurred in the late afternoon or at night during theperiods of peak ant activity during the study. The number ofindividuals per ant species was recorded at each bait 45minutes after bait placement or repeatedly over a two-hourperiod (10, 30, 60, 90, and 120 minutes after placement),depending upon the objectives of a particular baiting session.
Finally, direct sampling was used to record the presenceof ant species in each focal area. Direct sampling wasperformed along 90-m transects in all sampled points, andopportunistic sampling occurred throughout the focal studyarea. Direct sampling involved searching the ground and litterfor nests by sweeping away the leaf litter from a 1-m2 plot(at least five plots/transect) and visually searching for ants;breaking open suitable fallen twigs, branches, and trunks;searching under stones; and searching on leaves, on andunder tree bark, and in epiphytes up to ca. 2 m. These datawere not used for comparisons because habitats andtransects differed greatly in the composition of microhabitatelements and because different amounts of time wereavailable to search in different sites.
Species and genera were preliminarily categorizedaccording to functional groups based upon field observationsand reports in the literature. The functional groupings followAndersen (1995) and Bestelmeyer and Wiens (1996).Further, species were classified according the type ofgeographic distribution that they exhibited based ondistribution information in Kempf (1972), Brandão (1991),Longino (online), and Ward (online). Six types of rangeswere recognized here: Mayan Forest (forest in the YucatánPeninsula of Mexico, northern Guatemala, and westernBelize), northern Central American (southern Mexico–Honduras), Central American (southern Mexico–Colombia),broad Central American (southern United States–CentralAmerica), Neotropical (southern Mexico–northern Argen-tina), and broad Neotropical (southern United States–midSouth America).
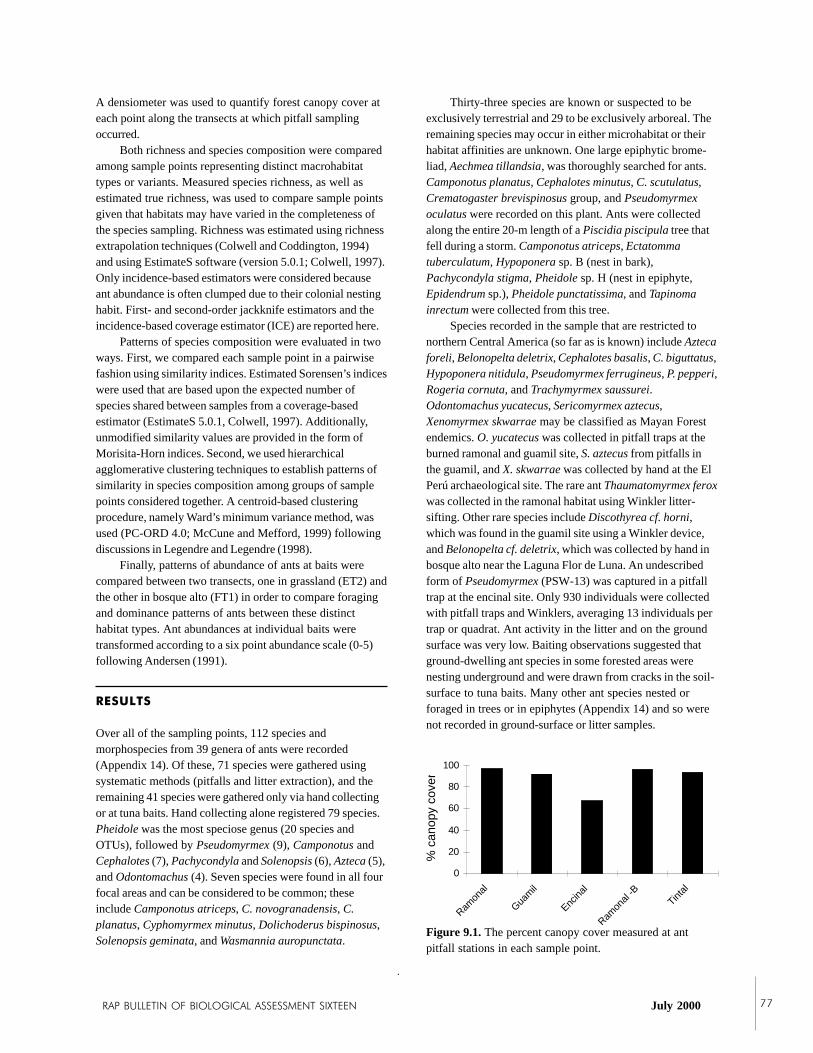
RAP BULLETIN OF BIOLOGICAL ASSESSMENT SIXTEEN July 2000 77
A densiometer was used to quantify forest canopy cover ateach point along the transects at which pitfall samplingoccurred.
Both richness and species composition were comparedamong sample points representing distinct macrohabitattypes or variants. Measured species richness, as well asestimated true richness, was used to compare sample pointsgiven that habitats may have varied in the completeness ofthe species sampling. Richness was estimated using richnessextrapolation techniques (Colwell and Coddington, 1994)and using EstimateS software (version 5.0.1; Colwell, 1997).Only incidence-based estimators were considered becauseant abundance is often clumped due to their colonial nestinghabit. First- and second-order jackknife estimators and theincidence-based coverage estimator (ICE) are reported here.
Patterns of species composition were evaluated in twoways. First, we compared each sample point in a pairwisefashion using similarity indices. Estimated Sorensen’s indiceswere used that are based upon the expected number ofspecies shared between samples from a coverage-basedestimator (EstimateS 5.0.1, Colwell, 1997). Additionally,unmodified similarity values are provided in the form ofMorisita-Horn indices. Second, we used hierarchicalagglomerative clustering techniques to establish patterns ofsimilarity in species composition among groups of samplepoints considered together. A centroid-based clusteringprocedure, namely Ward’s minimum variance method, wasused (PC-ORD 4.0; McCune and Mefford, 1999) followingdiscussions in Legendre and Legendre (1998).
Finally, patterns of abundance of ants at baits werecompared between two transects, one in grassland (ET2) andthe other in bosque alto (FT1) in order to compare foragingand dominance patterns of ants between these distincthabitat types. Ant abundances at individual baits weretransformed according to a six point abundance scale (0-5)following Andersen (1991).
RESULTS
Over all of the sampling points, 112 species andmorphospecies from 39 genera of ants were recorded(Appendix 14). Of these, 71 species were gathered usingsystematic methods (pitfalls and litter extraction), and theremaining 41 species were gathered only via hand collectingor at tuna baits. Hand collecting alone registered 79 species.Pheidole was the most speciose genus (20 species andOTUs), followed by Pseudomyrmex (9), Camponotus andCephalotes (7), Pachycondyla and Solenopsis (6), Azteca (5),and Odontomachus (4). Seven species were found in all fourfocal areas and can be considered to be common; theseinclude Camponotus atriceps, C. novogranadensis, C.planatus, Cyphomyrmex minutus, Dolichoderus bispinosus,Solenopsis geminata, and Wasmannia auropunctata.
Thirty-three species are known or suspected to beexclusively terrestrial and 29 to be exclusively arboreal. Theremaining species may occur in either microhabitat or theirhabitat affinities are unknown. One large epiphytic brome-liad, Aechmea tillandsia, was thoroughly searched for ants.Camponotus planatus, Cephalotes minutus, C. scutulatus,Crematogaster brevispinosus group, and Pseudomyrmexoculatus were recorded on this plant. Ants were collectedalong the entire 20-m length of a Piscidia piscipula tree thatfell during a storm. Camponotus atriceps, Ectatommatuberculatum, Hypoponera sp. B (nest in bark),Pachycondyla stigma, Pheidole sp. H (nest in epiphyte,Epidendrum sp.), Pheidole punctatissima, and Tapinomainrectum were collected from this tree.
Species recorded in the sample that are restricted tonorthern Central America (so far as is known) include Aztecaforeli, Belonopelta deletrix, Cephalotes basalis, C. biguttatus,Hypoponera nitidula, Pseudomyrmex ferrugineus, P. pepperi,Rogeria cornuta, and Trachymyrmex saussurei.Odontomachus yucatecus, Sericomyrmex aztecus,Xenomyrmex skwarrae may be classified as Mayan Forestendemics. O. yucatecus was collected in pitfall traps at theburned ramonal and guamil site, S. aztecus from pitfalls inthe guamil, and X. skwarrae was collected by hand at the ElPerú archaeological site. The rare ant Thaumatomyrmex feroxwas collected in the ramonal habitat using Winkler litter-sifting. Other rare species include Discothyrea cf. horni,which was found in the guamil site using a Winkler device,and Belonopelta cf. deletrix, which was collected by hand inbosque alto near the Laguna Flor de Luna. An undescribedform of Pseudomyrmex (PSW-13) was captured in a pitfalltrap at the encinal site. Only 930 individuals were collectedwith pitfall traps and Winklers, averaging 13 individuals pertrap or quadrat. Ant activity in the litter and on the groundsurface was very low. Baiting observations suggested thatground-dwelling ant species in some forested areas werenesting underground and were drawn from cracks in the soil-surface to tuna baits. Many other ant species nested orforaged in trees or in epiphytes (Appendix 14) and so werenot recorded in ground-surface or litter samples.
.
0
20
40
60
80
100
Ramon
al
Guam
il
Encina
l
Ramon
al -B
Tintal
% c
anop
y co
ver
Figure 9.1. The percent canopy cover measured at antpitfall stations in each sample point.

CONSERVATION INTERNATIONAL Rapid Assessment Program78
Distance (Objective Function)5.7E+00 1.4E+01 2.1E+01 2.9E+01 3.7E+01
ENCINAL
RAMON-B
TINTAL
GUAMIL
RAMONAL
Distance (Objective Function)5.7E+00 1.4E+01 2.1E+01 2.9E+01 3.7E+01
ENCINAL
RAMON-B
TINTAL
GUAMIL
RAMONAL
Canopy-cover measurements at pitfall transectsindicate that the guamil and tintal habitats had only slightlylower canopy cover than the ramonal and burned ramonalhabitats (Figure 9.1). Canopy cover values ranged from 92-97% in these habitats. The encinal had an appreciably lowercanopy cover at ca. 67%.
Measured richness was greatest in the tintal habitat,followed by the guamil habitat (Figure 9.2). Jacknife-richness estimators also suggest that richness was highest inthese habitats. The ICE estimator indicated that the burnedramonal habitat was most rich, followed by the guamil andtintal habitats.
The expected similarity between habitats was lowoverall, ranging from 0.195-0.510 (Table 9.1). The encinal-tintal habitat comparison exhibited the greatest similarityvalue, whereas the ramonal and burned ramonal were themost distinct habitat pair. The ramonal-guamil pair and theencinal-burned ramonal pair also had high similarity values.The Morisita-Horn index, which includes a measure ofabundance, produced a different pattern. Using this metric,the encinal and burned ramonal habitat were most similar,followed by the ramonal-guamil pairs and encinal-tintalpairs, whereas the other pairs showed generally lowsimilarity. The cluster analysis revealed two distinctclusters, one containing the encinal, burned ramonal, andtintal habitats and guamil and ramonal in the other (Figure9.3). The relatively high similarity between the encinal andburned ramonal observed in the Morisita-Horn indices isapparent in the cluster diagram.
Bait data from the bosque alto and grassland revealedlarge differences in the dominance of ant species (Figure 9.4).In the bosque alto transect, Dolichoderus bispinosus andPheidole spp. increased in abundance at baits with time,while Paratrechina sp. B reached a peak at 30 min after baitplacement and declined thereafter. In the grassland transect,Solenopsis geminata was extremely dominant and theabundance of Pheidole sp. A gradually declined with time.
0
10
20
30
40
50
60
Ramon
al
Guam
il
Encina
l
Ramon
al-B
Tintal
Num
ber
of S
peci
es
Figure 9.2. Ant species richness patterns among the samplepoints. Solid circle = measured richness, solid square = first-order jackknife estimator, open square = second-orderjackknife estimator, x = incidence-based coverage estimator.
The abundance of Forelius sp. and Dorymyrmex sp.increased through time as soil-surface temperatures increasedduring the baiting session.
0
4
8
12
16
10 30 50 70 90
Dolichoderus Wasmannia
Paratrechina Pheidole
Odontomachus Forelius
0
5
10
15
20
25
30
10 30 50 70 90 110 130
Solenopsis Paratrechina
Pheidole Dorymyrmex
Forelius
a) Bosque alto
b) GrasslandAbu
nda
nce
scor
e
Minutes after bait placement
0
4
8
12
16
10 30 50 70 90
Dolichoderus Wasmannia
Paratrechina Pheidole
Odontomachus Forelius
0
5
10
15
20
25
30
10 30 50 70 90 110 130
Solenopsis Paratrechina
Pheidole Dorymyrmex
Forelius
a) Bosque alto
b) GrasslandAbu
nda
nce
scor
e
Minutes after bait placement
Figure 9.4. Patterns of ant dominance with time after baitplacement on the ground surface at tuna-bait transects in abosque alto and grassland habitats. Ant abundance scores arethe sums of transformed abundances at all 10 baits (see text).
Figure 9.3. Cluster analysis of the sample points, based onant species composition, using Ward’s clustering procedure.

RAP BULLETIN OF BIOLOGICAL ASSESSMENT SIXTEEN July 2000 79
DISCUSSION
Ant activity during the sampling period was low, so it islikely that the species richness values are greatly underesti-mated. Many ant species may have been completely inactiveabove ground due to the generally harsh and unproductiveconditions that characterize the dry season (see also Janzenand Schoener, 1968; Levings, 1983; Bestelmeyer and Wiens,1996). During tropical dry seasons, some ant species maydescend from the litter stratum into the soil column wherethey cannot be sampled using either pitfall traps or leaf-litterextraction (Levings and Windsor, 1982; Harada andBandeira, 1994). Thus, direct sampling supplemented bytuna baiting (which draws ants through cracks in the soilsurface) appears to have been the most efficient combinationof sampling procedures under the conditions present duringthis study, especially when preparation and post-processingtime are taken into account.
In spite of these limitations, the number of antsrecorded in LTNP compares favorably with the results of
other studies (Table 9.2). Although the number of habitattypes sampled and the scales over which samples weretaken differ among these studies, some comparisons may bemade with caution. The species and generic richness valuesin this study are similar to or greater than those recorded instudies performed in the tropical forests of Mexico andCosta Rica, but are less than those from studies in Panama-nian and the Brazilian Amazon forests. Overall, this patternsuggests a bell-shaped richness curve through the Neotropi-cal forests, with a peak in the southern Central Americathrough the Brazilian Amazon. Further studies employingstandardized collecting techniques and sampling designs willbe needed to determine the validity of this pattern. If aunimodal (or other) relationship is supported, it might serveas a basis from which to anticipate and evaluate antbiodiversity in tropical localities.
Few species appear to be endemic to the Mayanforests, although comparable data from other studies arelacking. Several genera were commonly found in other antsurveys in Central American forests but were not foundhere, including Adelomyrmex, Leptogenys, and Oligomyrmex,
Table 9.1. Patterns of similarity of ant communities among habitat types based on pitfall trap data.Values in cells are Sorensen’s indices, based upon the expected number of species shared between samplesfrom a coverage-based estimator. Values in parentheses are Morisita-Horn indices based upon observed data.
Ramonal Guamil Encinal Ramonal-BRamonal --Guamil 0.460 (0.215) --Encinal 0.212 (0.020) 0.285 (0.178) --Ramonal-B 0.195 (0.130) 0.280 (0.116) 0.409 (0.635) --Tintal 0.237 (0.054) 0.320 (0.072) 0.510 (0.201) 0.286 (0.114)
Table 9.2. A comparison of ant species richness and generic richness among Neotropical regions based upon publishedsurveys.
These particular studies were selected to represent regions because they were broadly similar to the study presentedhere (i.e. an evaluation of landscape-level heterogeneity). Scale represents the maximum distance between samples.When values were not reported, a broad estimate of scale (followed by a “?”) is provided based upon information inthe text where this was possible. Entries are in descending order of latitude.
Species Richness Generic Richness Scale/# Habitats Location103 46* w/in10 km?/2 Veracruz, Mexico1
87 32 w/in 2 km?/3 Chiapas, Mexico2
112 39 ca. 80 km/5 LTNP, Guatemala3
109 31 w/in 35 km/4 Sarapaqui, Costa Rica4
127 49 ?/elevation gradient BCI, Panama5
156 49 ?/3 Trombetas, Brazil6
184 45 ?/3 Amazonas, Brazil7
104 30 ca. 10 km/4 Salta, Argentina8
*Generic richness values were adjusted if generic synomyms were recognized in species lists.1Quiroz-Robledo and Valenzuela-Gonzales, 1995 2MacKay, 19913 This study 4Roth et al., 1994 5Levings, 1983 6Vasconcelos, 1999 7Majer and Delabie, 1994 8Bestelmeyer and Wiens, 1996
CONSERVATION INTERNATIONAL Rapid Assessment Program80
and to a lesser extent Megalomyrmex and Proceratium. Onthe other hand, several genera were recorded in this studythat have not often been recorded in other regional studies,including Belonopelta, Discothyrea, Thaumatomyrmex, andXenomyrmex. The record of Thaumatomyrmex ferox isespecially noteworthy. This ant was referred to as the“miracle ant” by Wilson and Hölldobler (1995) for its rarityand beauty. Fewer than 100 specimens are known to exist inmuseums, and this represents the first record that we knowof from Guatemala.
Contrary to our expectations, ant richness was notgreatest in the closed-canopy habitats, but was greatest inhabitats that were slightly more open and, in the case of theguamil, more disturbed (Figure 9.2). The richness of therelatively open encinal habitat was similar to that in theclosed-canopy ramonal habitat. Furthermore, ant communitycomposition of the open or disturbed habitats did not differsystematically from that of more closed-canopy or “pris-tine” habitats (i.e. ramonal). This result may be accountedfor by the fact that previous studies of the effects of forestdisturbance, including those of MacKay (1991) andVasconcelos (1999), considered habitats that were morerecently or more severely disturbed than those consideredhere. MacKay (1991), for example, observed a 50%reduction in species richness in slashed-and-burned Chiapanforest and attributed this loss to the loss of arboreal species.In contrast, the disturbed sites in this study had abundantcanopy cover (Figure 9.1). The recovery of mature-forestant communities may take as little as 13 to 24 years afterdisturbance (Roth et al., 1994; Vasconcelos, 1999), and theguamil habitat studied here was estimated to be disturbed>20 years ago (Francisco Bosoc, pers. comm.). Further, ourstudy also considered ant communities occurring in naturallyopen forest types in the region. Populations of many antspecies now present in the forests of the Petén may beinsensitive to moderate differences in vegetation structurebecause these ants have been exposed to historical increasesin regional aridity as well as widespread anthropogenicdisturbances (Méndez, 1999). For similar reasons, thegreater ant richness observed in the guamil and tintal habitatsmay be due to the fact that the ants inhabiting these sites arebetter able to cope with dry-season conditions. Theobserved richness of the ramonal habitat might be greaterthan disturbed sites if it were sampled in a wetter time ofyear or if it were compared to more recently disturbed sites.Unfortunately, the statistical power of this study is too lowto identify particular species that may decline when bosquealto is converted to guamil. It is likely that litter-dwellingcryptic species and some litter-inhabiting specialistpredators and arboreal species (Appendix 14) would bemost affected (see Bestelmeyer and Wiens, 1996).
The relatively high similarity between the ramonal andguamil habitats may be governed by their spatial proximityrather than habitat structure or disturbance history. Such an
effect was noted by Feener and Schupp (1998) andBestelmeyer (2000). The similarity of the burned ramonaland encinal habitats cannot be attributed to spatial proxim-ity, and it is unclear what may have caused this pattern.
The relative dominance of Solenopsis geminata in thegrassland habitat (Figure 9.4) has been observed in otherstudies conducted in Central America (Perfecto, 1991;Perfecto and Vandermeer, 1996). This ant is favored by thewarm, well-insolated conditions in deforested habitats. Thepresence of Forelius and Dorymyrmex, which are dominantarid-zone genera, in the grassland and other disturbedhabitats was surprising. We were not able to locate recordsof these genera in similar habitats in studies conductedfurther south in Central America. The presence of thesegenera in the Petén forests may be related to the relativearidity of many of the natural microhabitats in the region andto their proximity to arid areas to the north. Dorymyrmex,Forelius, and Solenopsis are characteristic of Nearcticdeserts, and their combined dominance in the grasslandunderscores the immense shift in environmental conditionshere when compared to the forest (see also Quiroz-Robledoand Valenzuela-Gonzáles, 1995).
CONCLUSIONS AND RECOMMENDATIONS
It is fruitful to view patterns of ant diversity with respect tothe kinds of microhabitats available for different ant speciesto occupy . Generally, ant richness appears to be at amaximum when several kinds of microhabitats—suitable leaflitter and twigs, patches of bare ground, fallen limbs andlogs, epiphytes, bushes, and trees of various species, forexample—are abundant in an area. The reduction orelimination of these ant habitats in an area results in declinesin ant richness and increased dominance by highly competi-tive ant species. Furthermore, frequent natural or anthropo-genic disturbances will eliminate ant species from areas evenwhen suitable habitats are available.
Evidence presented here and in studies cited abovesuggests that the recovery of suitable microhabitats fortropical forest ants following disturbance may be rapid. Therecovery of both the forest and its microhabitats is contin-gent upon the degree of agricultural use and soil erosion. Soilerosion may be significant in Petén forests due to the thinsoils on slopes and the crests of hills (Beach, 1998). Inaddition, the recolonization of ants to microhabitatsnecessarily depends upon the presence and proximity ofsource populations. The relationship between sourcepopulation distribution and colonization rates have yet to beconsidered in detail, but it is likely that there are thresholdamounts of deforestation beyond which colonization by antspecies will be limited (Roth et al., 1994), metapopulationdynamics are disrupted, and region-wide extinctions mayoccur (Hanski and Gilpin, 1996). Rapid assessment surveys

RAP BULLETIN OF BIOLOGICAL ASSESSMENT SIXTEEN July 2000 81
and short-duration studies of the effects of habitat alterationon ant communities cannot hope to detect such thresholds orregional effects. The best we can do in this case is to becognizant of the potential for these effects. Despite therelatively good colonization abilities of ants and some otherinsect species, deforestation threatens the extinction of theirpopulations. At this point, however, ant diversity within thepark is high, and every effort should be made to maintain it.
The management of forests within LTNP for antconservation should emphasize the preservation of a varietyof habitats. One way to achieve this is to conserve the breadthof topographic gradients, which are generally recognized asimportant determinants of ant diversity in tropical landscapes(e.g. Olson, 1994) and of biodiversity in LTNP in particular(Mendez et al., 1998). Epiphytes and other canopy micro-habitats available in tall trees may contain many unique antspecies (Longino and Nadkarni, 1990), thus bosques altosshould be targeted for additional studies and conservation.
Ant community composition is very patchy andturnover rates are very high (Table 9.1), so more intensivestudies will be needed to disentangle the effects of spatialpattern and environmental factors on ant diversity. Antsrespond in important and informative ways to landscapevariation and would provide a useful focal taxon in moreextensive surveys and monitoring. Ants respond to processessuch as topographic variation, flooding patterns, and succes-sion and can thus indicate environmental patchiness anddynamics that are important for land managers. Understandingthe relationships between animal distributions, drainage, andfire will be needed to identify priority conservation areaswithin the park’s terrestrial habitats.
SPECIFIC CONSERVATIONRECOMMENDATIONS
• Highly complex bosques altos in areas such as El Perúand Laguna Guayacán that appear to have sufferedrelatively little previous damage should be protectedvigorously and examined in greater detail—especially thecanopy ant communities.
• The conservation of a variety of habitat types—wherehabitat types are defined according to vegetation,topography, and soil characteristics—is likely to be agood strategy for conserving ants and other terrestrialarthropods. In LTNP, remote sensing technologies can aidthis process.
• The ant fauna of bosques altos and other sites should besurveyed at a wetter time of year, such as at thebeginning of the wet season. Malaise traps should beused to capture volant sexual forms during this period, in
addition to traditional techniques. This will likely leadto a more complete record of the park’s ant (and insect)fauna.
• Additional survey and monitoring efforts shouldexamine the role of drainage and topography, soilvariation, and fire history on ant and other animalcommunities in the park.
• Replicated surveys in natural habitat types such asencinales and selva baja are needed to provide moredetailed assessments of the complementarity of antfaunas between habitat types in the park.
LITERATURE CITED
Alonso, L. E. 1998. Spatial and temporal variation in theant occupants of a facultative ant-plant. Biotropica30: 210-213.
Andersen, A. N. 1991. Sampling communities of ground-foraging ants: pitfall catches compared with quadratcounts in an Australian tropical savanna. AustralianJournal of Ecology 16: 273-279.
Andersen, A. N. 1995. A classification of Australian antcommunities, based on functional groups whichparallel plant life-forms in relation to stress anddisturbance. Journal of Biogeography 22: 15-29.
Beach, T. 1998. Soil catenas, tropical deforestation, andancient and contemporary soil erosion in the Petén,Guatemala. Physical Geography 19: 378-405.
Belshaw, R., and B. Bolton. 1993. The effect of forestdisturbance on the leaf litter ant fauna of Ghana.Biodiversity and Conservation 2: 656-666.
Bestelmeyer, B. T. 2000. A multiscale perspective on antdiversity in semiarid landscapes. Dissertation.Colorado State University, Fort Collins, CO, USA.
Bestelmeyer, B. T., and J. A. Wiens. 1996. The effects ofland use on the structure of ground-foraging antcommunities in the Argentine Chaco. EcologicalApplications 6:1225-1240.
CONSERVATION INTERNATIONAL Rapid Assessment Program82
Bestelmeyer, B.T., D. Agosti, L. Alonso, C. R. Brandão,W. L. Brown Jr., J. H. C. Delabie, and R. Silvestre. Inpress. Field techniques: an overview, description, andevaluation of sampling techniques. In Measuring andMonitoring Biodiversity: Standard Techniques forGround-Dwelling Ants (D. Agosti, J. Majer, T.Schultz, and L. Alonso, eds.). Smithsonian InstitutionPress, Washington, DC, USA.
Brandão, C. R. F. 1991. Adendos ao catálogo abreviado dasformigas da região neotropical Hymenoptera:Formicidae. Revista Brasileira de Entomología 35:319-412.
Colwell, R. K. 1997. EstimateS 5. Statistical Estimation ofSpecies Richness and Shared Species from Samples.Web site: http://viceroy.eeb.uconn.edu/estimates.
Colwell, R. K., and J. A. Coddington. 1994. Estimatingterrestrial biodiversity through extrapolation.Philosophical Transactions of the Royal Society ofLondon 345:101-118.
Erwin, T. L., and J. C. Scott. 1980. Seasonal and sizepatterns, trophic structure, and richness of Coleopterain the tropical arboreal ecosystem: the fauna of thetree Luehua seemanni Triana and Planch in the CanalZone of Panama. Coleopterists Bulletin 34: 305-322.
Feener, D. H., and E. W. Schupp. 1998. Effects of treefallgaps on the patchiness and species richness ofneotropical ant assemblages. Oecologia 116:191-201.
Greenslade, P. J. M., and P. Greenslade. 1977. Some effectsof vegetation cover and disturbance on a tropical antfauna. Insectes Sociaux 24: 163-182.
Haila, Y., and C. R. Margules. 1996. Survey research inconservation biology. Ecography 19:323-331.
Hanski, I., and M. Gilpin, eds. 1996. MetapopulationDynamics: Ecology, Genetics, and Evolution.Academic Press, New York, NY, USA.
Harada, A. Y., and A. G. Bandeira. 1994. Estratificacão edensidade de invertebrados em solo arenoso sobfloresta primária e plantios arbóreos na Amazoniacentral durante estacão seca. Acta Amazonica 24: 103-118.
Janzen, D. H., and T. W. Schoener. 1968. Differences ininsect abundance and diversity between wetter anddrier sites during a tropical dry season. Ecology 49:96-110.
Johnson, R. A. 1992. Soil texture as an influence on thedistribution of the desert seed-harvester antsPogonomyrmex rugosus and Messor pergandei.Oecologia 89:118-124.
Kempf, W. W. 1972. Catálogo abreviado das formigas daregião neotropical Hymenoptera: Formicidae. StudiaEntomológica 15:3-344.
Legendre, P., and L. Legendre. 1998. Numerical Ecology,2nd English ed. Elsevier, Amsterdam, the Netherlands.
Levings, S. C. 1983. Seasonal, annual, and among-sitevariation in the ground ant community of a deciduoustropical forest: some causes of patchy speciesdistributions. Ecological Monographs 53: 435-455.
Levings, S. C., and D. M. Windsor. 1982. Seasonal andannual variation in litter arthropod populations. Pp.355-387 in The Ecology of a Tropical Forest: SeasonalRhythms and Long-term Changes (E. G. Leigh Jr., A.S. Rand, and D. M. Windsor, eds). SmithsonianInsitution Press, Washington, DC, USA.
Longino, J. T. Online. www.evergreen.edu/user/serv_res/research/arthropod/AntsofCostaRica.html).
Longino, J. T., and N. Nadkarni. 1990. A comparison ofground and canopy leaf litter ants (Hymenoptera:Formicidae) in a neotropical montane forest. Psyche97:81-93.
May, R. M. 1988. How many species are there on Earth?Science 241:1141-1148.
MacKay, W. P. 1991. Impact of slashing and burning of atropical rainforest on the native ant fauna(Hymenoptera:Formicidae). Sociobiology 3: 257-268.
McCune, B., and M. J. Mefford. 1999. PC-ORD.Multivariate Analysis of Ecological Data, version 4.0.MjM Software Design, Gleneden Beach, OR, USA.
Méndez, C. 1999. How old is the Petén tropical forest?Pp. 31-34 in Thirteen Ways of Looking at a TropicalForest: Guatemala’s Maya Biosphere Reserve (J. D.Nations, ed.). Conservation International, Washington,DC, USA.
Olson, D. M. 1994. The distribution of leaf litter inverte-brates along a Neotropical altitudinal gradient. Journalof Tropical Ecology 10: 129-150.

RAP BULLETIN OF BIOLOGICAL ASSESSMENT SIXTEEN July 2000 83
Perfecto, I. 1991. Dynamics of Solenopsis geminata in atropical fallow field after ploughing. Oikos 62: 139-144.
Perfecto, I., and R. R. Snelling. 1995. Biodiversity and thetransformation of a tropical agroecosystem: ants incoffee plantations. Ecological Applications 5: 1084-1097.
Perfecto, I., and J. Vandermeer 1996. Microclimaticchanges and the indirect loss of ant diversity in atropical agroecosystem. Oecologia 108: 577-582.
Quiroz-Robledo, L., and J. Valenzuela-Gonzalez. 1995. Acomparison of ground ant communities in a tropicalrainforest and adjacent grassland in Los Tuxtlas,Veracruz, Mexico. Southwestern Entomologist 20:203-213.
Roth, D. S., I. Perfecto, and B. Rathcke. 1994. The effectsof management systems on ground-foraging antdiversity in Costa Rica. Ecological Applications 4:423-436.
Vasconcelos, H. L. 1999. Effects of forest disturbance onthe structure of ground-foraging ant communities incentral Amazonia. Biodiversity and Conservation 8:409-420.
Ward, P.S. Online. entomology.ucdavis.edu/faculty/ward/pseudo.html.
Wilson, E. O. 1987. Causes of ecological success: the caseof the ants. The sixth Tansley lecture. Journal ofAnimal Ecology 56: 1-9.
Wilson, E. O., and B. Hölldobler. 1995. Journey to the Ants.Belknap Press, Cambridge, MA, USA.

CONSERVATION INTERNATIONAL Rapid Assessment Program84
Dates Events8 April Arrival to Las Guacamayas Biological Station* (
9-14 April Studies at Focal Area 1; Río San Pedro/Sacluc si
15 April Transfer to El Naranjo, sampling of Rapids site (
16-19 April Sampling at Focal Area 2; Río Escondido (170 18
20-22 April Sampling of Focal Area 3; Flor de Luna (17°35.
23-25 April Sampling of Focal Area 4; Río Chocop (17°36.13
26 April Return to Las Guacamayas Biological Station
27-29 April Preliminary report and specimen preparation
29 April Presentation of preliminary results to CONAP
30 April Return to Flores for departure of participants
* Refer to Map 1 for site locations.
Principal RAP Sampling Sites in Laguna del TigreNational Park, Petén, Guatemala
The following four principal sites, or focal areas, weresurveyed during the RAP expedition to LTNP. Fieldwork was undertaken from one camp at each site. Notall taxonomic groups were surveyed at each site. SeeAppendices 1 and 2 for specific sampling locationcoordinates and macrohabitat types.
Focal Area 1: Las Guacamayas Biological Station/Río San Pedro and Río Sacluc(17°14.75’ N, 90°32.80’ W)The Las Guacamayas Biological Station is located atthe confluence of the ríos San Pedro and Sacluc. Wetraveled by pickup trucks to the road’s end at the RíoSacluc and were then transported by boat seven km to
the station. The station is outfitted with dormitories, akitchen and eating area, and bathrooms with showers.
Aquatic habitats in the area include deep riversbordered by sawgrass marsh or riparian forest andsprings feeding the San Pedro. Terrestrial habitats inthe area include unflooded, tall forests on hills orbosques altos (one very close to the station), regener-ating forests or guamiles, varzea-type forest near thevillage of Paso Caballos to the east, and a drier oakforest (encinal) along the Río Sacluc. The areaimmediately around the station is comparativelyundisturbed due in part to the presence of the station,which has served to discourage illegal settlement.Several settlements occur within the park’s boundariesalong the San Pedro to the west. We observed nosettlements on the Sacluc between the boat landingand the station.
EXPEDITION ITINERARY ANDGAZETTEER
RAP BULLETIN OF BIOLOGICAL ASSESSMENT SIXTEEN July 2000 85
The RapidsAlthough not part of our original sampling plan, wepassed a series of rapids on our way to El Naranjo. Inpart of the rapids we found that the bottom consistedof a reef made of bivalve shells (mollusks) mixed withliving individuals. This area was quite unique andconstitutes an important discovery.
Focal Area 2: Río Escondido(170 18.78’ N; 900 52.15’ W)We camped along the west side of the Río Escondidojust south of the Laguna del Tigre Biotope. The nameof the river, “hidden river,” is appropriate; followingthe river north from its confluence with the San Pedro,it appears to dead-end in a lagoon surrounded by agreat marsh. In fact, the river continues northward butas a shallow, narrow canal passing through a greatwetland. Eventually, the river deepens and widens andbecomes navigable. We took advantage of an aban-doned settlement to provide shelter and set camp.Aquatic habitats here are diverse, including deepstretches of river, marshland canals, oxbow lagoons,and small inlets. Terrestrial habitats found here includepreviously burned bosque alto, guamiles, grasslandsresulting from slash-and-burn practices, and a tallriparian forest at the northern limit of our samplinghere where the river becomes narrow. Eight familieslive along the Río Escondido to the north of our camp,and some settlements probably occur within theboundaries of the biotope.
Focal Area 3: Laguna Flor de Luna(17°35.97’ N, 90°53.84’ W)Here we camped at the end of a road alongside theLaguna Flor de Luna. This road passes a militarycheckpoint and the Xan oil fields. Aquatic habitatshere included only lagoons. Samples of fish tissue andbenthic sediment examined in toxicological analyseswere taken in lagoons at different distances from theXan fields. Terrestrial habitats were sampled aroundFlor de Luna and included bosque alto and inundatedforest (bosque bajo) which was dominated by the tintotree (Haematoxylum campechianum) in areas closestto the lagoon (tintales). We observed no settlementsnear Flor de Luna, but several exist near lagoons to thesoutheast.
Focal Area 4: Río Chocop(17°36.13’ N, 90°24.53’ W)This camp was located at a CONAP monitoring postwhere the Río Chocop passes the road. Anothermilitary checkpoint is located on the route to thestation; this is intended to prevent the illegal coloniza-tion of the area. Aquatic habitats found in the areaincluded two small, shallow rivers—the Río Chocopand the nearby Río Candelaria—as well as severallagoons. Terrestrial habitats sampled included bosquebajo/tintales and bosques altos. Areas along the roadaround Santa Amelia are occupied by several families,have been severely disturbed, and are regenerating orare currently used for crops or pastures.

CONSERVATION INTERNATIONAL Rapid Assessment Program86
Aguada: Small limestone sinks that forms ponds thatmay not contain water during the dry season.
Akalché: Larger limestone sinks that form lagoons andoften contain water throughout the year.
Arroyo: Spanish for “stream.”
Bosque alto: Upland forests with tall trees, a densecanopy, little undergrowth, and abundant leaf litter.
Bosque bajo: A short (15-20 m) statured forest with anopen canopy relative to bosque alto, and an abundant,dense undergrowth of palms, shrubs, and herbs.
Caño: A body of stagnant, turbid water through whichmarshes are connected to a river.
Community: A group of species, usually delimited bytaxonomic affiliation, that occupy a locality.
Complementarity: A measure of the degree to whichspecies composition (i.e. the identity of species)differs between two areas. A high complementarityindicates that few species are shared and that speciesrichness of the two sites together is much higher thanin either one alone.
Encinales: Oak-dominated forests.
Endemic: Native to, and restricted to, a particulargeographic region.
GLOSSARY
Fragility: A qualitative measure of the degree towhich the communities or ecosystems are able to resistor recover from a perturbation.
Guamil: Local vernacular term for an area of young(usually 1-20 years) regenerating vegetation whereforest vegetation has been disturbed.
Karstic: Pertaining to irregular limestone strata thatare permeated by underground streams and sinks.
Laguna: Spanish for “lagoon.”
Miocene: A geologic epoch during the Tertiary period,from ca. 26 to 5 million years before present.
Morphospecies: Informal species groups, used whenorganisms cannot be assigned to a formally describedspecies.
Río: Spanish for “river.”
Varzea: Lowland inundated forests.

RAP BULLETIN OF BIOLOGICAL ASSESSMENT SIXTEEN July 2000 87
El Petén
Guatemala
Laguna del TigreNational Park
Map 1. The primary rivers of Guatemala, Belize, and southern Mexico, with RAP survey siteslocated on and near the Río San Pedro.Mapa 1. Los ríos principales de Guatemala, Belice y el sur de México, con los lugares de muestreodel RAP localizados en o cerca del Río San Pedro.
Río San Pedro
Río Candelaria
Río Usumacinta
Río GrijalvaVillahermosa
Río
Coatza
coalc
os
Belize City
Río Pasión
Río Sarstún
Río MotaguaRío Polochic
Guatemala City
Guatemala
Mexico
HondurasPacific Ocean
Gulf of MexicoYucatán Peninsula
Belize N
Laguna de Términos
Belize
Rive
r
Río
Hond
o
Map 2. Location of the Petén region andLaguna del Tigre National Park within Guatemala.Mapa 2. Localización de la región del Petén y elParque Nacional Laguna del Tigre en Guatemala.

CONSERVATION INTERNATIONAL Rapid Assessment Program88
FPO
Map 3. Laguna del Tigre National Park and Laguna del Tigre Biotope boundaries, with sitessampled during the 1999 RAP expedition.
Mapa 3. Parque Nacional Laguna del Tigre y las fronteras Biotopes de la Laguna del Tigre, conlas localidades de muestreo durante la expedicón RAP en el 1999.
Laguna del Tigre National Park and Biotope limits/Parque Nacional Laguna del Tigre y los delBiotopo
Roads/Carreteras
Rivers/Ríos
Pipeline of Basic Resources/Oleoducto de Basic Resources
Sites where toxicology samples were taken/Lugares donde se tomaron muestras toxicología
Aquatic and terrestrial sampling points/Puntos de muestreo aquáticos y terrestres

RAP BULLETIN OF BIOLOGICAL ASSESSMENT SIXTEEN July 2000 89
The Río San Pedro, flanked by inundated areas and sibal.
Oil operations near lagoons in Laguna del Tigre National Park.Operaciones petroleras cerca de lagunas en el Parque Nacional Lagunadel Tigre.
Encroachment and oil road near the Río San Pedro wherethe rapids, including the mollusk reef, is located.Invasiones y camino petrolero cerca del Río San Pedro dondese localizan los rápidos, incluyendo el arrecife de moluscos.
A unique molluscan reef system was discovered at the rapids areaof the Río San Pedro near the town of El Naranjo.Un sistema único de arrecife de moluscos fue descubierto en elárea de los rápidos en el Río San Pedro cerca de El Naranjo.
Mangroves along the Río San Pedro are the furthest inlandpopulation in Guatemala.Manglares a lo largo del Río San Pedro, únicos individuos que sehan localizado tierra adentro en Guatemala.El Río San Pedro, rodeado por áreas inundadas y sibal.
C. B
arri
ento
sA
. Q
uera
l-R
egil
Aerial photos produced by/Fotos aereas producidas por: Conservation InternationalIn cooperation with/En cooperación con: USAID and Intel CorporationResearchers/Investigadores: Dana Slaymaker, University of Massachusetts; John Musinsky, CI

CONSERVATION INTERNATIONAL Rapid Assessment Program90
FPO
MAYA BIOSPHERE RESERVA MAP

RAP BULLETIN OF BIOLOGICAL ASSESSMENT SIXTEEN July 2000 91
FPO
MAYA BIOSPHERE RESERVA MAP

CONSERVATION INTERNATIONAL Rapid Assessment Program92
Oil operations within Laguna del TigreNational Park.Operaciones de petróleo dentro del ParqueNacional Laguna del Tigre.
An example of tintal (bosque bajo), which isa relatively short-statured forest with denseundergrowth.Un ejemplo de tintal (bosque bajo), unbosque con árboles de baja estatura y conmaleza densa.
One of the twenty bat species (here,Carollia brevicauda) found during theRAP expedition to LTNP.Una de las veinte especies de murciélagos(aquí, Carollia brevicauda) encontrada enla expedición RAP en el PNLT.
The burning of dry forest and sawgrass marshes (sibales)poses a great threat to the biodiversity of LTNP.La quemazón de bosque seco y sibales es una amenaza muyseria a la biodiversidad del PNLT.
RAP scientists study aquatic plants growing along a naturalspring in LTNP.Científicos de RAP estudian plantas acuáticas creciendo alo largo de un manantial natural del PNLT.
Petenia splendida (Blanco) exhibits color polymorphism inthe park and is subject to heavy fishing pressure.Petenia splendida (Blanco) muestra polimorfismo cromáticoen el parque y es sujeto a la pesca excesiva.
RAP scientists study the Morelet’s crocodile (Crocodylusmoreletii), which is understudied and may be in danger ofextinction.Científicos de RAP estudian el cocodrilo de Morelet(Crocodylus moreletii), el cuál no ha sido estudiado mucho yestá en peligro de extinción.
L.
Alo
nso
L.
Alo
nso
L.
Alo
nso
L.
Alo
nso
B. B
este
lmey
er
B. B
este
lmey
er
A.
Que
ral-
Reg
il
93 BOLETIN RAP DE EVALUACION BIOLOGICA DIECISEIS Julio 2000
95 Participantes
98 Perfil de la organización
101 Reconocimientos
102 Informe preliminar
104 Resumen ejecutivo
104 Introducción107 Resúmenes de capítulos108 Una comparación de los resultados del
RAP con estudios anteriores109 Recomendaciones de investigación y
conservación
111 Capítulos
1. Introducción a la Expedición del RAP al ParqueNacional Laguna del Tigre, Petén, Guatemala.Brandon T. Bestelmeyer
2. Los hábitats acuáticos del Parque NacionalLaguna del Tigre, Petén, Guatemala: calidad delagua, poblaciones de fitoplancton, e insectosasociados con la planta Salvinia auriculata.Karin Herrera, Ana Cristina Bailey, MarcosCallisto, y Jorge Ordoñez
3. Las comunidades acuáticas de macrófitos delParque Nacional Laguna del Tigre, Petén,Guatemala.Blanca León y Julio Morales Can
4. Un estudio ictiológico del Parque NacionalLaguna del Tigre, Petén, Guatemala.Philip W. Willink, Christian Barrientos, HermanA. Kihn y Barry Chernoff
5. Contaminación de hidrocarbono y daño al ADNen los peces del Parque Nacional Laguna delTigre, Petén, Guatemala.Christopher W. Theodorakis y John W. Bickham
87888990
92
180 Itinerario de expedición yDiccionario Geográfico
182 Glosario
87 Imágenes y mapas de la Expedición del RAP
111
118
128
134
143
150
156
163
171
TTTTTABLABLABLABLABLA DE CONTENIDOA DE CONTENIDOA DE CONTENIDOA DE CONTENIDOA DE CONTENIDO
6. Una evaluación rápida de diversidad de laavifauna en hábitats acuáticos del ParqueNacional Laguna del Tigre, Petén, Guatemala.Edgar Selvin Pérez y Miriam LorenaCastillo Villeda
7. La herpetofauna del Parque Nacional Lagunadel Tigre, Petén, Guatemala, con énfasis en laspoblaciones del cocodrilo pantanero(Crocodylus moreletii).Francisco Castañeda Moya, Oscar Lara yAlejandro Queral-Regil
8. La fauna mamífera del Parque Nacional Lagunadel Tigre, Petén, Guatemala, con énfasis enmamíferos pequeños.Heliot Zarza y Sergio G. Pérez
9. Las hormigas (Hymenoptera: Formicidae) delParque Nacional Laguna del Tigre, Petén,Guatemala.Brandon Bestelmeyer, Leeanne E. Alonso yRoy R. Snelling
Mapas de la Cuenca de Usumancinta y GuatemalaMapas de lugares de Muestro del RAPFotografías aéreas de los lugares del RAPMapa de la Reserva de la Biósfera Maya,
incluyendo el Parque Nacional Laguna delTigre
Imágenes de la Expedición del RAP
CONSERVATION INTERNATIONAL Programa de Evaluación Rápida94
188 APENDICE 3Especies de fitoplancton identificadas encada punto acuático en el Parque NacionalLaguna del Tigre, Petén, Guatemala.
191 APENDICE 4Densidad (organismos/basura) defitoplancton identificada en cada punto demuestreo, organizada por clase.
194 APENDICE 5Insectos acuáticos asociados con Salviniaauriculata, por punto de muestreo en elParque Nacional Laguna del Tigre, Petén,Guatemala.
196 APENDICE 6Taxones de plantas registrados en yalrededor de los bosques anegados yribereños en el Parque Nacional Lagunadel Tigre, Petén, Guatemala.
199 APENDICE 7Especies de peces que cree, existen en elRío San Pedro y en la cuenca superior delRío Candelaria en Petén, Guatemala.
185 APENDICE 1Puntos acuáticos de muestreo de laExpedición RAP del Parque NacionalLaguna del Tigre, Petén, Guatemala.
187 APENDICE 2Puntos terrestres de muestreo de laExpedición RAP al Parque NacionalLaguna del Tigre, Petén, Guatemala.
202 APENDICE 8Lista de especies de peces capturados durantela Expedición RAP de 1999 en el ParqueNacional Laguna del Tigre, Petén, Guatemala,y el punto focal de muestreo en el cual fueronrecolectados.
204 APENDICE 9Lista de especies de peces capturados durantela Expedición RAP de 1999 en el ParqueNacional Laguna del Tigre, Petén, Guatemala,y el macrohábitat en donde fueronrecolectados.
206 APENDICE 10Metodología detallada para ensayos deseparación de filamentos de ADN ycitometría de flujo.
208 APENDICE 11Especies de aves que se encontraron en elParque Nacional Laguna del Tigre, Petén,Guatemala, durante la Expedición de RAP de1999.
215 APENDICE 12Especies de anfibios y reptiles del ParqueNacional Laguna del Tigre, Petén, Guatemala.
217 APENDICE 13Especies de mamíferos registradas dentro decada área focal en el Parque Nacional Lagunadel Tigre, Petén, Guatemala.
219 APENDICE 14Especies de hormigas (Hymenoptera:Formicidae) registradas en el Parque NacionalLaguna del Tigre, Petén, Guatemala.
183 Apéndices

95 BOLETIN RAP DE EVALUACION BIOLOGICA DIECISEIS Julio 2000
PARTICIPANTES
Leeanne E. Alonso, Ph.D. (mirmecología [hormigas])Programa de evaluación rápidaConservation International2501 M Street, NW, Suite 200Washington, DC 20037 USAemail: [email protected]
Ana Cristina Bailey (entomología)Laboratorio de Ecología SistemáticaUniversidad del Valle de Guatemala18 Avenida 11-95 Zona 15, VH. IIIApdo. Postal 8201901 Ciudad Guatemala, Guatemalaemail: [email protected]
Christian Barrientos (ictiología, protocolo RAP)CI-ProPeténCalle CentralCiudad FloresEl Petén, Guatemalaemail: [email protected]
Brandon T. Bestelmeyer, Ph.D. (mirmecología,jefe de equipo internacional)Departamento de BiologíaMSC 3AF, Box 30001New Mexico State UniversityLas Cruces, NM 80003 USAemail: [email protected]
Marcos Callisto, Ph.D. (limnología)Universidade Federal de Minas Gerais ICB,Depto. Biología GeneralCP. 486, CEP. 30.161-970Belo Horizonte, MG, Brasilemail: [email protected]
Francisco Castañeda Moya (herpetología, jefe del equiponacional, protocolo RAP)CI-ProPeténCalle CentralCiudad FloresEl Petén, Guatemalaemail: [email protected]
Miriam Lorena Castillo Villeda (ornitología)CI-ProPeténCalle CentralCiudad FloresEl Petén, Guatemalaemail: [email protected]
Barry Chernoff, Ph.D. (ictiología)Departamento de ZoologíaField MuseumRoosevelt Road at Lakeshore DriveChicago, IL 60605 USAemail: [email protected]
Javier García Esquivel (protocolo RAP)CONAPVía 5 4-50, Zona 4Edificio Maya4º Nivel,Ciudad Guatemala, Guatemala
Karin Herrera (limnología)Universidad de San Carlos de Guatemala2o Nivel, Edificio T-12Ciudad UniversitariaZona 12Ciudad Guatemala, Guatemalaemail: [email protected]

CONSERVATION INTERNATIONAL Programa de Evaluación Rápida96
Herman A. Kihn, M.Sc. (ictiología)Centro de Estudios Conservacionistas (CECON)Unidad de InvestigaciónVida SilvestreAvenida Reforma 0-63, Zona 10Ciudad Guatemala, Guatemala
Oscar Lara, M.Sc. (herpetología, protocolo RAP)CONAP4a. calle 6-17 z. 1Ciudad Guatemala, Guatemalaemail: [email protected] de BiologíaUniversidad de San Carlos de GuatemalaEdificio T-10Ciudad Universitaria, zona 12Ciudad Guatemala, Guatemalaemail: [email protected]
Blanca León, Ph.D. (botánica)Museo de Historia NaturalUniversidad Nacional Mayor de San MarcosAv. Arenales 1256, Apartado 14-0434Lima-14 Perúemail: [email protected]
Mario Mancilla (protocolo RAP)Asociación para la Conservación de la NaturalezaCANANKAXBarrio el RedentorColonia Itzá, Frente al Salón Social San BenitoPetén, Guatemalae-mail: [email protected]
Julio Morales Can (botánica)Universidad de San Carlos de GuatemalaEdificio T-13, Ciudad UniversitariaZona 12Ciudad Guatemala, Guatemalaemail: [email protected]
Jorge Ordóñez (entomología)Proyecto FaunaCI-Guatemala7a-avenida 3-33Zona 9, Edificio Torre Empresarial4o nivel, oficina 406Ciudad de Guatemala, Guatemalaemail: [email protected] [email protected]
Ismael Ponciano (protocolo RAP)Centro de Estudios Conservacionistas (CECON)Unidad de InvestigaciónVida SilvestreAvenida Reforma 0-78, Zona 10Ciudad Guatemala, Guatemala
Sergio G. Pérez (mastozoología)Colecciones ZoológicasMuseo de Historia NaturalUniversidad de San Carlos de GuatemalaCalle Mariscal Cruz 1-56Zona 10Ciudad Guatemala, Guatemalaemail: [email protected]

RAP BULETIM DE AVALIÇÁO BIOLÓGICA Octubro 2000 97
Alejandro Queral-Regil, M.Sc. (herpetología)11700 Old Columbia Pike, Suite 1902Silver Spring, MD 20904 USAfax: 202-547-6009email: [email protected]
Carlos Rodríguez Olivet (protocolo RAP)CI-Guatemala7a-avenida 3-33Zona 9, Edificio Torre Empresarial4o nivel, oficina 406Ciudad de Guatemala, Guatemalaemail: [email protected]
Edgar Selvin Pérez (ornitología)Escuela de BiologíaUniversidad de San Carlos de GuatemalaEdificio T-10Ciudad Universitaria, zona 12Ciudad Guatemala, Guatemalaemail: [email protected]
Christopher W. Theodorakis, Ph.D. (toxicología)Texas Tech UniversityThe Institute of Environmental and Human HealthP.O. Box 41163Lubbock, TX 79409-1163 USAfax: 806-885-4577email: [email protected]
Philip W. Willink, Ph.D. (ictiología)Fish DivisionField MuseumRoosevelt Road at Lakeshore DriveChicago, IL 60605 USAemail: [email protected]
Heliot Zarza (mastozoología)Instituto de Ecología, UNAMCircuito Ext. s/n junto al Jardín Botánico, CUAp. Postal 70-275, 04510México D.F., Méxicofax: 56 22 98 95email: [email protected]

CONSERVATION INTERNATIONAL Programa de Evaluación Rápida98
CONSERVATION INTERNATIONALCONSERVATION INTERNATIONALCONSERVATION INTERNATIONALCONSERVATION INTERNATIONALCONSERVATION INTERNATIONAL
Conservation International (CI) es una organizacióninternacional sin fines de lucro, localizada en Washington,DC. CI actúa con la creencia de que el patrimonio nacionalnatural de la Tierra debe mantenerse si las generacionesfuturas desean enriquecerse espiritual, cultural yeconómicamente. Nuestra misión es conservar los procesosbiológicos y ecológicos que dan apoyo a la vida de la tierrapara demostrar que las sociedades humanas pueden vivir enarmonía con la naturaleza.
Conservation International2501 M Street, NW, Suite 200Washington, DC 20037 USA202-429-5660 (Teléfono)202-887-0193 (Fax)http://www.conservation.org
CONSERVATION INTERNATIONAL -CONSERVATION INTERNATIONAL -CONSERVATION INTERNATIONAL -CONSERVATION INTERNATIONAL -CONSERVATION INTERNATIONAL -PROPETENPROPETENPROPETENPROPETENPROPETEN
En respuesta a las crecientes amenazas a la biodiversidad deGuatemala en el Departamento de Petén, en el norte del país,CI estableció una oficina en Guatemala, localmente conocidacomo ProPetén, en 1991. CI-ProPetén trabaja concomunidades locales para conservar la diversidad biológicaincrementando la conciencia ambiental y desarrollandoalternativas económicas para las comunidades locales.ProPetén se esfuerza en demostrar que las comunidadeslocales pueden vivir dentro de los bosques que aún existen enPetén sin destruirlos. Los esfuerzos de CI-ProPetén seenfocan en las 1.6 millones de hectáreas (4 millones de acres)de la Reserva de la Biósfera Maya (RBM). La reservacontiene la mayor parte de los bosques de la Selva Maya, lacual se extiende a Belice y México.
Establecida en 1990, la RBM incluye un gran número deecosistemas. El más importante es el Parque NacionalLaguna del Tigre (PNLT), el humedal de agua dulce másgrande de Centro América. El PNLT ha sido una de lasprioridades de ProPetén en los últimos tres años. Al trabajarmuy de cerca con colaboradores locales, nacionales einternacionales, ProPetén ha ayudado a crear unainfraestructura de manejo viable para el parque y haproporcionado lineamientos de políticas a las autoridadesnacionales que mitiguen los impactos de las actividadeshumanas en la región. Tanto el personal científico deProPetén como su Estación Biológica Las Guacamayas,ubicada en la frontera sur del PNLT, fueron utilizadasdurante la Expedición RAP.
CI-ProPeténCalle CentralCiudad FloresEl Petén, Guatemala502-926-1370 (Teléfono)502-926-0495 (Fax)
CECON: CENTRO DE ESTUDIOSCECON: CENTRO DE ESTUDIOSCECON: CENTRO DE ESTUDIOSCECON: CENTRO DE ESTUDIOSCECON: CENTRO DE ESTUDIOSCONSERVACIONISTASCONSERVACIONISTASCONSERVACIONISTASCONSERVACIONISTASCONSERVACIONISTAS
El Centro de Estudios Conservacionistas (CECON) es unainstitución de la Universidad de San Carlos de Guatemala,ubicada en la Ciudad de Guatemala. CECON tiene comopropósitos principales los siguientes: 1) Llevar a caboestudios biológicos básicos en Guatemala y utilizar dichosestudios como base para los esfuerzos nacionales deconservación, los que incluyen definir políticas que elGobierno Nacional puede utilizar para un mejor manejo delas áreas protegidas de Guatemala; 2) manejar racional ytécnicamente un sistema de biotopos y otras áreas protegi-das para la conservación de la vida silvestre y 3) dirigir un
PERFIL DE LA ORGANIZACION

BOLETIN RAP DE EVALUACION BIOLOGICA DIECISEIS Julio 2000 99
esfuerzo nacional para promover los temas biológicos conénfasis en la conservación. CECON maneja cuatro biotopos protegidos en la Reservade la Biósfera Maya (RBM): Laguna el Tigre-Río Escondido,Cerro Cahuí, Naachtún-Dos Lagunas, y Zotz-San Miguel LaPalotada. El Biotopo Laguna del Tigre se encuentra ubicado enel parque más grande, Parque Nacional Laguna del Tigre y esconsiderado uno de los hábitats más críticos de Guatemala. Enun esfuerzo por divulgar y utilizar más información como unabase para futuros esfuerzos de protección contra la actividadhumana en la región, CECON desempeñó un papel crítico enla Expedición RAP del Parque Nacional Laguna del Tigre.
Centro de Estudios ConservacionistasAvenida Reforma 0-63, Zona 10Ciudad Guatemala, Guatemala502-334-7662 (Teléfono)502- 334-7664 (Fax)
CONAP: CONSEJO NACIONAL DE ÁREASCONAP: CONSEJO NACIONAL DE ÁREASCONAP: CONSEJO NACIONAL DE ÁREASCONAP: CONSEJO NACIONAL DE ÁREASCONAP: CONSEJO NACIONAL DE ÁREASPROTEGIDASPROTEGIDASPROTEGIDASPROTEGIDASPROTEGIDAS
Fundado en 1989 como una oficina de la Presidencia deGuatemala, el Consejo Nacional de Áreas Protegidas(CONAP) está a cargo de administrar todas las áreasprotegidas de Guatemala. Estas áreas comprenden por lomenos ochenta y un unidades que contienen menos de dosmillones de hectáreas o cerca del dieciocho por ciento delterritorio de Guatemala. La unidad más grande dentro de estesistema de áreas protegidas es la Reserva de la Biósfera Maya(RBM), ubicada en la parte norte de Petén. Bajo el proyectode la Biósfera Maya y otras grandes iniciativas en Petén, elgobierno de Guatemala —a través del CONAP—ha hecho dela región una prioridad para las inversiones nacionales einternacionales. En 1996, el CONAP declaró al Parque
Nacional Laguna del Tigre (PNLT) y al Parque NacionalSierra del Lacandón (PNSL) sus prioridades más grandes.Desde entonces, el CONAP ha trabajado con agencias localese internacionales—CI-ProPetén entre ellas—para poner enorden los sistemas de manejo y para que reconcilien lanecesidad económica humana con la conservación efectiva.
Consejo Nacional de Areas Protegidas (CONAP)4a calle 6-17 Zona 1Ciudad Guatemala, Guatemala502-220-1821 (teléfono)502-220-1827 (fax)Agradecemos a Juventino Gálvez, Oscar Lara y Javier GarcíaEsquivel miembros del Consejo Nacional de Areas
CONAMA: COMISION NACIONAL DEL MEDIOCONAMA: COMISION NACIONAL DEL MEDIOCONAMA: COMISION NACIONAL DEL MEDIOCONAMA: COMISION NACIONAL DEL MEDIOCONAMA: COMISION NACIONAL DEL MEDIOAMBIENTEAMBIENTEAMBIENTEAMBIENTEAMBIENTE
La Comisión Nacional del Medio Ambiente (CONAMA) esuna institución gubernamental bajo el poder ejecutivo delgobierno de Guatemala. La agencia asesoria, coordina, yfacilita las acciones necesarias para proteger y mejorar elmedio ambiente. Para alcanzar estas metas, la institucióntrabaja con diferentes ministerios del gobierno, con laSecretaría General de Planeación Económica, diferentesagencias autónomas y semi-autónomas, municipalidades, y elsector privado del gobierno.
Comisión Nacional del Medio Ambiente (CONAMA)7a. Avenida 7-09, Zona 13Ciudad Guatemala, Guatemala 01013502-440-7916 (teléfono/fax)502-440-7917

CONSERVATION INTERNATIONAL Programa de Evaluación Rápida100
CCCCCÄNAN K�AAX: ASOCIACION GUATEMALTECANAN K�AAX: ASOCIACION GUATEMALTECANAN K�AAX: ASOCIACION GUATEMALTECANAN K�AAX: ASOCIACION GUATEMALTECANAN K�AAX: ASOCIACION GUATEMALTECAPPPPPARA LA CONSERVARA LA CONSERVARA LA CONSERVARA LA CONSERVARA LA CONSERVAAAAACION NACION NACION NACION NACION NATURALTURALTURALTURALTURAL
La Asociación Guatemalteca para la Conservación Natural(CÄNAN K’AAX) es una organización sin fines de lucrocuyos miembros son, en su mayor parte, de la región delPetén. CÄNAN K’AAX fue formada para responder a losdesafíos de conservación y administración de áreasprotegidas en el Petén y la Selva Maya usando unaperspectiva local. La asociación deriva su nombre de lapalabra Maya Itzá que significa “Guardiánes de la Selva.”
La filosofía de la asociación está basada en el principio deuna co-existencia sana entre los seres humanos y el medioambiente. Para realizar esta filosofía, sus acciones estánbasadas en el desarrollo y fortalecimiento de la capacidad yactitudes de la sociedad civil y el gobierno para asíadministrar los recursos naturales de una manera sustentable,y en particular con referencia a áreas protegidas.Actualmente, la asociación se dedica a la co-administracióndel Parque Nacional Laguna del Tigre conjuntamente conCONAP.
Barrio el RedentorColonia Itzá, Frente al Salón San BenitoPetén, Guatemala502-926-3732 (teléfono)502-926-3733
ESTACION BIOLOGICA LAS GUACAMAYASESTACION BIOLOGICA LAS GUACAMAYASESTACION BIOLOGICA LAS GUACAMAYASESTACION BIOLOGICA LAS GUACAMAYASESTACION BIOLOGICA LAS GUACAMAYAS
La Estación Biológica Las Guacamayas cuyo nombre seorigino por la especie Ara macao (Guacamayo rojo) quehabita el Parque Nacional Laguna del Tigre y que seencuentra en peligro de extinción, fue establecida
originalmente en 1996, convirtiendose en el eje de operacionesde Propetén/CI en el área este del PNLT. Se concibió para funcionar como un centro de investigacióny capacitación dentro del PNLT, teniendo como objetivogeneral el apoyo al manejo del PNLT a través de la generaciónde información científica sobre los recursos naturales,promoviendo de esto forma de uso sostenible de los mismos. Su implementación es uno estrategico encaminado apreservar la mayor diversidad posible de ecosistemas, hábitatsy especies en esta parte de la zona núcleo. Su misión es servir como base para la conservación en elEste del Parque Nacional Laguna del Tigre, a través deactividades de investigación de campo a estudiantesguatemaltecos. Actualmente se encuentra en negociación lacooperación con universidades de Estados Unidos.
Para más información envíe sus preguntas a:
CI-ProPeténCalle CentralCiudad FloresEl Péten, Guatemala502-926-1370 (teléfono)502-926-0495 (fax)

101 BOLETIN RAP DE EVALUACION BIOLOGICA DIECISEIS Julio 2000
Protegidas por su participación, dedicación y cooperación para hacer de esta expedición una realidad y un éxito. Además,agradecemos a Herman Kihn y al Centro de Estudios Conservacionistas de la Universidad de San Carlos de Guatemala porcoordinar el uso del Biotopo de la Laguna del Tigre y por participar en la expedición. Gracias además, a Mario Mancilla y aCÄNAN K’AAX por su participación.
Al personal de CI-ProPetén, especialmente a Miriam Castillo, Rosita Contreras, Jorge Ordóñez y Juan Manuel Burgos,quienes organizaron la logística de la expedición. A Imelda López Ascencio y a Gloria Reyes Mendoza quienes nos alimentaron deuna forma extremadamente maravillosa, y siempre con muchas tortillas deliciosas! A Manuel Alvarado quien nos facilitó lanchas ylancheros. Agradecemos también a Francisco Bosoc, Baudilio Choc, Raquel Quixchán, Víctor Cohuog, David Figueroa, CarlosGirón, Federico Godoy, Ramón Manzanero, César Morales, Ramiro Lucero, Román Santiago y José Soza por sus constantesesfuerzos en el campo, su buen humor y amistad, y por compartir su conocimiento sobre este hermoso lugar en el que viven. Sinestos amigos, nuestro trabajo no hubiera sido posible.
Agradecemos a las siguientes personas por su ayuda en la identificación de especies entre otros: Mary Anne Rogers, KevinSwagel y Reeve M. Bailey (Capítulo 4); Rodrigo Medellín, Fernando Cervantes y Yolanda Hortelano (Capítulo 8) y William P.MacKay, John T. Longino y Phil S. Ward (Capítulo 9).
Finalmente, agradecemos a Jim Nations de CI-Washington, a Carlos Rodríguez y Carlos Soza de CI-ProPetén por su guía yapoyo en este esfuerzo. Esta investigación fue financiada por una donación de la Agencia Internacional para el Desarrollo (USAID), otorgada a CI-ProPetén y por una donación de Rufford Foundation para el Programa de Evaluación Rápida (RAP) de Conservation Interna-tional. Además agradecemos a Jay Fahn, Leslie Lee, David y a Janet Shores por apoyar los estudios de AquaRAP.
RECONOCIMIENTOS
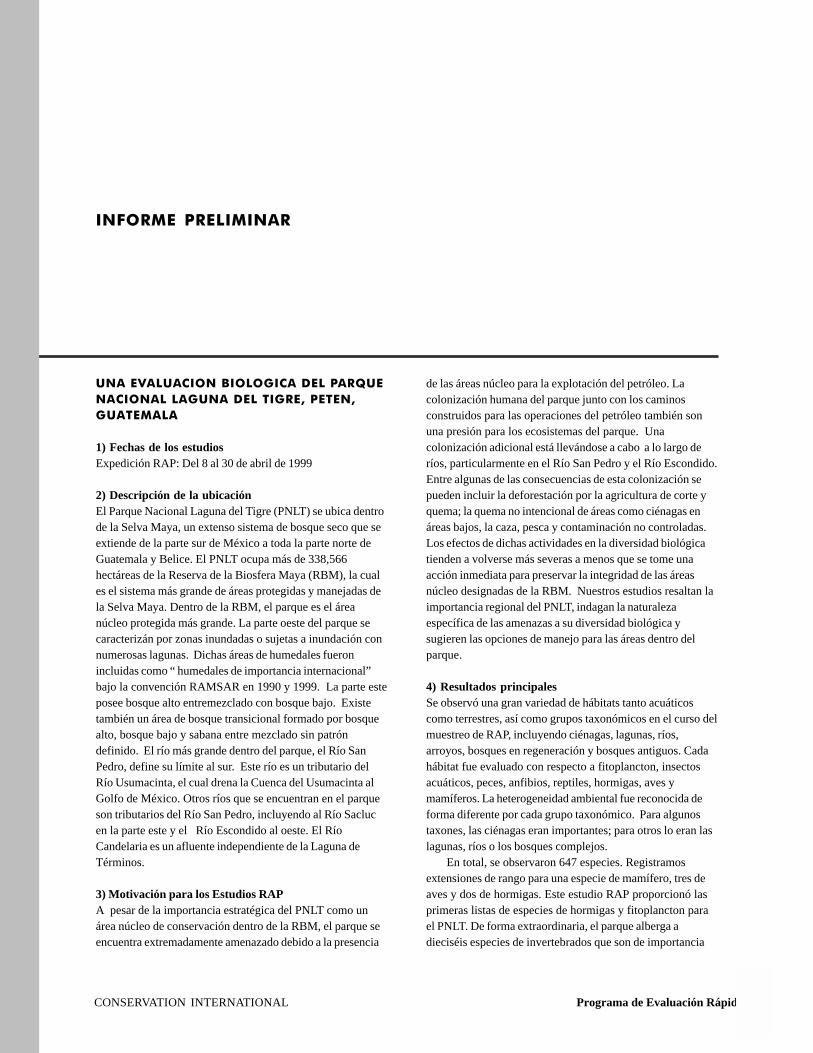
CONSERVATION INTERNATIONAL Programa de Evaluación Rápida102
INFORME PRELIMINAR
UNA EVALUACION BIOLOGICA DEL PARQUENACIONAL LAGUNA DEL TIGRE, PETEN,GUATEMALA
1) Fechas de los estudiosExpedición RAP: Del 8 al 30 de abril de 1999
2) Descripción de la ubicaciónEl Parque Nacional Laguna del Tigre (PNLT) se ubica dentrode la Selva Maya, un extenso sistema de bosque seco que seextiende de la parte sur de México a toda la parte norte deGuatemala y Belice. El PNLT ocupa más de 338,566hectáreas de la Reserva de la Biosfera Maya (RBM), la cuales el sistema más grande de áreas protegidas y manejadas dela Selva Maya. Dentro de la RBM, el parque es el áreanúcleo protegida más grande. La parte oeste del parque secaracterizán por zonas inundadas o sujetas a inundación connumerosas lagunas. Dichas áreas de humedales fueronincluidas como “ humedales de importancia internacional”bajo la convención RAMSAR en 1990 y 1999. La parte esteposee bosque alto entremezclado con bosque bajo. Existetambién un área de bosque transicional formado por bosquealto, bosque bajo y sabana entre mezclado sin patróndefinido. El río más grande dentro del parque, el Río SanPedro, define su límite al sur. Este río es un tributario delRío Usumacinta, el cual drena la Cuenca del Usumacinta alGolfo de México. Otros ríos que se encuentran en el parqueson tributarios del Río San Pedro, incluyendo al Río Saclucen la parte este y el Río Escondido al oeste. El RíoCandelaria es un afluente independiente de la Laguna deTérminos.
3) Motivación para los Estudios RAPA pesar de la importancia estratégica del PNLT como unárea núcleo de conservación dentro de la RBM, el parque seencuentra extremadamente amenazado debido a la presencia
de las áreas núcleo para la explotación del petróleo. Lacolonización humana del parque junto con los caminosconstruidos para las operaciones del petróleo también sonuna presión para los ecosistemas del parque. Unacolonización adicional está llevándose a cabo a lo largo deríos, particularmente en el Río San Pedro y el Río Escondido.Entre algunas de las consecuencias de esta colonización sepueden incluir la deforestación por la agricultura de corte yquema; la quema no intencional de áreas como ciénagas enáreas bajos, la caza, pesca y contaminación no controladas.Los efectos de dichas actividades en la diversidad biológicatienden a volverse más severas a menos que se tome unaacción inmediata para preservar la integridad de las áreasnúcleo designadas de la RBM. Nuestros estudios resaltan laimportancia regional del PNLT, indagan la naturalezaespecífica de las amenazas a su diversidad biológica ysugieren las opciones de manejo para las áreas dentro delparque.
4) Resultados principalesSe observó una gran variedad de hábitats tanto acuáticoscomo terrestres, así como grupos taxonómicos en el curso delmuestreo de RAP, incluyendo ciénagas, lagunas, ríos,arroyos, bosques en regeneración y bosques antiguos. Cadahábitat fue evaluado con respecto a fitoplancton, insectosacuáticos, peces, anfibios, reptiles, hormigas, aves ymamíferos. La heterogeneidad ambiental fue reconocida deforma diferente por cada grupo taxonómico. Para algunostaxones, las ciénagas eran importantes; para otros lo eran laslagunas, ríos o los bosques complejos. En total, se observaron 647 especies. Registramosextensiones de rango para una especie de mamífero, tres deaves y dos de hormigas. Este estudio RAP proporcionó lasprimeras listas de especies de hormigas y fitoplancton parael PNLT. De forma extraordinaria, el parque alberga adieciséis especies de invertebrados que son de importancia
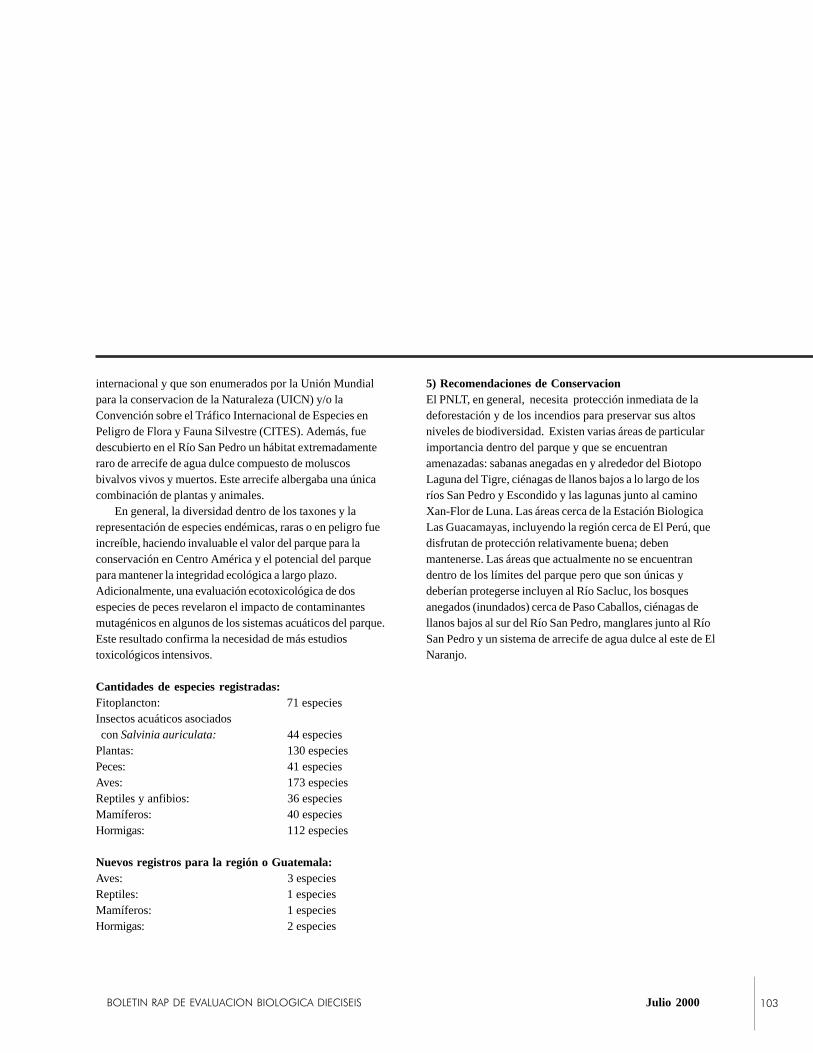
BOLETIN RAP DE EVALUACION BIOLOGICA DIECISEIS Julio 2000 103
internacional y que son enumerados por la Unión Mundialpara la conservacion de la Naturaleza (UICN) y/o laConvención sobre el Tráfico Internacional de Especies enPeligro de Flora y Fauna Silvestre (CITES). Además, fuedescubierto en el Río San Pedro un hábitat extremadamenteraro de arrecife de agua dulce compuesto de moluscosbivalvos vivos y muertos. Este arrecife albergaba una únicacombinación de plantas y animales. En general, la diversidad dentro de los taxones y larepresentación de especies endémicas, raras o en peligro fueincreíble, haciendo invaluable el valor del parque para laconservación en Centro América y el potencial del parquepara mantener la integridad ecológica a largo plazo.Adicionalmente, una evaluación ecotoxicológica de dosespecies de peces revelaron el impacto de contaminantesmutagénicos en algunos de los sistemas acuáticos del parque.Este resultado confirma la necesidad de más estudiostoxicológicos intensivos.
Cantidades de especies registradas:Fitoplancton: 71 especiesInsectos acuáticos asociados con Salvinia auriculata: 44 especiesPlantas: 130 especiesPeces: 41 especiesAves: 173 especiesReptiles y anfibios: 36 especiesMamíferos: 40 especiesHormigas: 112 especies
Nuevos registros para la región o Guatemala:Aves: 3 especiesReptiles: 1 especiesMamíferos: 1 especiesHormigas: 2 especies
5) Recomendaciones de ConservacionEl PNLT, en general, necesita protección inmediata de ladeforestación y de los incendios para preservar sus altosniveles de biodiversidad. Existen varias áreas de particularimportancia dentro del parque y que se encuentranamenazadas: sabanas anegadas en y alrededor del BiotopoLaguna del Tigre, ciénagas de llanos bajos a lo largo de losríos San Pedro y Escondido y las lagunas junto al caminoXan-Flor de Luna. Las áreas cerca de la Estación BiologicaLas Guacamayas, incluyendo la región cerca de El Perú, quedisfrutan de protección relativamente buena; debenmantenerse. Las áreas que actualmente no se encuentrandentro de los límites del parque pero que son únicas ydeberían protegerse incluyen al Río Sacluc, los bosquesanegados (inundados) cerca de Paso Caballos, ciénagas dellanos bajos al sur del Río San Pedro, manglares junto al RíoSan Pedro y un sistema de arrecife de agua dulce al este de ElNaranjo.
CONSERVATION INTERNATIONAL Programa de Evaluación Rápida���
��������,�����#�
��� ��������
Dentro del Parque Nacional Laguna del Tigre (PNLT) y elBiotopo Laguna del Tigre, se encuentran parte de las áreasnúcleo de conservación dentro de la Reserva de la BiósferaMaya (RBM). Estas áreas contienen entre sí las últimasgrandes huellas de la Selva Maya de Centro América. Estaselva y los diversos hábitats que ésta contiene se encuentranen peligro de desaparecer en este siglo dadas las tasasactuales de deforestación. El valor del PNLT surge de suestado relativamente primitivo y su ubicación central dentrode la RBM. Con el advenimiento de la construcción de lascarreteras y otro desarrollo en el área, las selvas, humedalesy ríos del parque—y la biodiversidad que estos hábitatsalbergan—se encuentran bajo una creciente presión de lacolonización humana y el desarrollo de las instalaciones deextracción de petróleo dentro del parque. Los objetivosprincipales de la Expedición del Programa de EvaluaciónRápida (RAP) de Conservation International (CI) fueronaumentar la base de datos de la biodiversidad del PNLT,resaltar la importancia regional del parque, evaluar lanaturaleza de las amenazas de los animales y plantas dentrodel parque, y proporcionar información a losadministradores de recursos naturales y a los encargados dela toma de decisiones. Otros objetivos incluyeron atraer laatención internacional a un recurso científico importante,Estación Biológica Las Guacamayas (EBG), una estación deinvestigación ubicada cerca del límite sur del parque, ycapacitar a estudiantes locales en la identificación de especiesy en técnicas de monitoreo ecológico. El trabajo ecológico seenfocó en la documentación de los valores de la biodiversidadde varios taxa acuáticos y terrestres en el parque,investigando las relaciones entre los taxa y diferenteshábitats y áreas del parque para asegurarse del valor deconservación de estas áreas y de evaluar los efectos
potenciales de la creciente deforestación y desarrollopetrolero en la biodiversidad del PNLT. A lo largo de esteproyecto, CI ha trabajado muy de cerca con científicos deCI-ProPetén (Programa CI de Guatemala), el ConsejoNacional de Áreas Protegidas (CONAP) y el Centro deEstudios Conservacionistas (CECON) de la Universidad deSan Carlos de Guatemala. Este Proyecto fue posible debido agenerosas donaciones de USAID para CI-ProPetén y de laFundación Rufford para el RAP.
Esta expedición RAP fue única en su énfasis deproporcionar simultáneamente datos tanto para los sistemasacuáticos como terrestres. Para caracterizar los patrones dela diversidad de especies, muestreamos los siguientes grupostaxonómicos: plantas acuáticas, peces, fitoplancton einsectos acuáticos, reptiles acuáticos, aves acuáticas,ribereñas hormigas, murciélagos y roedores. Cada uno deestos grupos taxonómicos representan componentesimportantes de biodiversidad en la región y reflejan unaamplia variación ecológica que afectan la biodiversidad engeneral. Se encontraron contaminantes de dos especies depeces utilizando novedosas técnicas moleculares. Estecomponente nos permitió evaluar las amenazas debido a lacontaminación en la biodiversidad del parque y en laspoblaciones humanas relacionadas con el parque.
El equipo RAP examinó a los taxa dentro de las cuatroáreas focales del parque que albergan varios tipos de hábitatsacuáticos y terrestres. Estas áreas incluyeron sitios cerca della EBG junto a los Ríos San Pedro y Sacluc; dentro delBiotopo Laguna del Tigre junto a Río Escondido; cerca de laLaguna Flor de Luna y la petrolera ubicada en el pozo Xan,donde se concentraron los estudios ecotoxicológicos yfinalmente en las cercanías de los Ríos Chocop y Candelaria(consulte el Mapa 3).
���������������������� ���������������������� Julio 2000 ���
���������������������
Limnología y calidad del agua
Los limnólogos juntamente con los botánicosproporcionaron una clasificación de primer plano en diversosmacrohábitats acuáticos del PNLT. Se clasificaron a ochotipos diferentes de hábitats representando fuentes de agua,ríos profundos, ciénagas y lagunas. Las característicasfisicoquímicas de estos hábitats son la base de la diversidadacuática del parque. El pH de las aguas del parque osciló deácido (6.78) a alcalino (8.30) y sus aguas de turbias yoscuras a acuamarinas y de eutrópicas a oligotrópicas. Estadiversidad se basa en la geología cárstica común de la región.Uno de los descubrimientos más inesperados fue la presenciade un arrecife de moluscos de agua fresca en el Río San Pedrocerca del pueblo El Naranjo. Este arrecife, el cual puedeservir para filtrar contaminantes del río, alberga una únicamezcla de invertebrados y por esto es de un gran valorbiológico. La calidad del agua del parque generalmente fuebuena. Las bacterias coliformes fue detectado en un 37% delas muestras, pero la bacteria fecal coliforme se detectó enúnicamente el 13% de las muestras y fueron asociados con eluso de de los cuerpos de agua de parte de los colonizadores.
La composición del fitoplancton también puedeutilizarse para evaluar la calidad del agua y generalmenterefleja la variación en las características fisicoquímicas de loshábitats acuáticos. Se registraron cincuenta y nuevecategorías y 71 especies y morfoespecies. Las diatomeas(Bacillarioficea), seguido de clorofitas (Cloroficeae) ycianofitas (Cianoficeae) dominaron las muestras. La mayoríade taxones eran heterogéneos en sus distribuciones. Variaslagunas y puntos de muestreo en los Ríos Escondido y SanPedro albergaban especies de fitoplancton que sonindicadores de contaminación (por ejemplo: Microcystisaeruginosa y Synedra ulna), pero altas densidades de estasespecies se observaron sólo en dos puntos en el Río SanPedro, un sitio en el Río Escondido, y en la Laguna la Pista.Los análisis multivariables revelaron que la única fuente másimportante de variación que determina la composición defitoplancton era el pH, y el segundo lo era la conductividad.Ninguno era variable; sin embargo, ambos explican muchosobre la variación.
En un estudio intensivo de asociación de plantas einsectos, se encontraron 44 morfoespecies y 26 familias deinsectos que habitaban en una sola especie de plantaacuática, Salvinia auriculata. Este resultado resalta la grandiversidad de insectos en los sistemas litorales acuáticos delparque.
Plantas acuáticas
Los botánicos del RAP registraron 67 familias, 120 clases y
130 especies de macrófitas acuáticas. En general, lacomposición de esta flora es similar a áreas vecinas en laPenínsula de Yucatán. Dos tipos generales de vegetación,ciénagas (sibal, principalmente plantas herbáceas) y bosquesribereños (caracterizados por plantas madereras), forman unmosaico dentro del PNLT. Las ciénagas, dominadas por lahierba espesa parecida al llano, Cladium jamaicense, seencontró que tenían la diversidad más alta de plantasacuáticas y terrestres y parecen encontrarse en un estadoconstante de sucesión.
Ciperaceae y Fabaceae fueron las familias más diversasen el PNLT y Utricularia, una planta acuática que sealimenta de pequeños invertebrados, fue el género con másdiversidad de especies. El árbol conocido como pucté(Bucida buceras) domina el bosque ribereño. Lasasociaciones de pucté con otras especies de plantas definencinco tipos de hábitats ribereños en el parque. Seencontraron unos cuantos individuos de manglar costero(Rhizophora mangle) junto al Río San Pedro, que pueden serresiduos de Pleistoceno, cuando esta área se encontraba en sumayoría bajo el océano. Esta población es la más continentalen la región de Yucatán. Debido a que estos árboles seencuentran fuera del parque, puede ser que los manglares noestén protegidos de la destrucción de su hábitat. Entre loshábitats terrestres es raro encontrar el hábitat de encinaldominado por roble (Quercus oleiodes). El hábitat dearrecife de moluscos mencionado anteriormente alberga larara planta acuática Vallisneria americana.
Peces
Se encontró que la diversidad de peces ha cambiado pocodesde un estudio que se realizó hace más de sesenta años. Seregistraron cuarenta y un especies, y tres de estas sonregistros nuevos para la Cuenca del Río San Pedro. Dosespecies no habían sido descritas. En general, muchos de lostaxones encontrados en el parque son endémicos a la cuencadel Usumacinta y la protección del parque ayudaría aproteger el 25% de esta fauna. El área más rica en especiesfue la del Río San Pedro, pero la mayoría de las especiesestaba homogéneamente distribuidas a lo largo del parque.Las lagunas, por ejemplo, albergaban 12 especies, sin teneren cuenta el disturbio en la vegetación a su alrededor. Varioshábitats son particularmente importantes para laspoblaciones de peces en el PNLT. Las ciénagas de llanosbajos compuestos de Cladium jamaicense (sibal) son sitiosde reproducción para cíclidos y pez gato , los cuales sonabundantes en los Ríos San Pedro y Escondido. Un tipo devarzea o bosque anegado, hábitat cerca de Paso Caballos, esun criadero importante para Brycon y que generalmente esun hábitat poco conocido en Centro América. Finalmente,pequeños riachuelos son hábitats únicos pero que se venamenazados tanto por la contaminación como por lasedimentación debido a la deforestación. La sobre pesca y la

CONSERVATION INTERNATIONAL Programa de Evaluación Rápida���
pérdida del hábitat por incendios son serias amenazas paraesta fauna económica y estéticamente importante.
Toxicología
Aparte de evaluar la diversidad de peces, los miembros delequipo examinaron los efectos de compuestos tóxicos en dosespecies de peces de amplia distribución: Cichlasomasynspilum y Thorychthys meeki. Se examinaron peces enforma individual en una laguna adyacente al pozo petroleroXan 3 y a distancias variables (de 5 km a 67 km) desde lafuente de contaminantes bajo la hipótesis de que lainstalación de petróleo es el origen de los compuestostóxicos. Para caracterizar la exposición a los compuestostóxicos, se utilizaron dos medidas celulares: Fragmentaciónde filamentos de ADN y división de cromosomas. Estasmedidas indican la exposición a compuestos tales comohidrocarbonos aromáticos policíclicos (PAH), uncontaminante asociado con la extracción de petróleo. Estastécnicas son únicas en el sentido de que éstas pueden medirel efecto de la exposición a compuestos tóxicos de formadirecta, indicando así el grado al cual se ven afectadas por lacontaminación las poblaciones de diferentes organismos.
Algunos peces en el sitio Xan 3 mostraron signos dedeformación de aletas, lo que indica un stress en estosindividuos, posiblemente debido a la exposición decontaminantes. La división de cromosomas en C. synspilumfue mayor en Xan 3 que en el sitio más distante (en el RíoSan Pedro cerca de EBG) pero no fue mayor en Xan 3 que enel sitio más cercano. Sin embargo, no se notó ningunavariación aparente en la fragmentación de ADN en C.synspilum. En contraste, T. meeki exhibió altos valores derompimimiento de ADN en Xan 3, Laguna Buena Vista y enla Laguna Guayacán y bajos valores en el Río San Pedro yen la Laguna Flor de Luna, la cual fue el tercer sitio máscercano a Xan 3 y más cerca que Guayacán. Sin embargo, lafragmentación de cromosomas no varió en esta especie.
Las evaluaciones de la concentración de PAH en lossedimentos en donde se recolectaron los peces revelaron quelas concentraciones en Xan 3 eran similares a aquéllas en lossitios de referencia. Las concentraciones de PAH eranmayores en la Laguna Buena Vista que en cualquier otrositio. Parece ser más una fuente de contaminación que estáactuando en las poblaciones de peces, pero tomará mástrabajo determinar la fuente o identidad de loscontaminantes. Es posible que otros tipos de contaminantes,los cuales no medimos, estén afectando las poblaciones depeces, y no está clara la forma en que estos efectos puedanrelacionarse con la extracción de petróleo u otras influenciashumanas. No obstante, no puede descartarse la extracción depetróleo como explicación de los efectos tóxicos. Porejemplo, los patrones de redistribución de los contaminantesy sus efectos, puede relacionarse con las conexioneshidrológicas temporalmente variables con respecto a la
temporización de la liberación de contaminantes, así como elcomportamiento de las especies animales examinadas.Nuestros resultados apoyan la noción de que lacontaminación sí está sucediendo en el PNLT y que esnecesario conducir estudios más intensivos.
Aves
La fauna de aves del PNLT es excepcionalmente rica y yconsiste de varias especies de importancia internacional.Como consecuencia, los humedales de la parte oeste delPNLT se incluyeron en la lista de Ramsar de los humedalesmundialmente importantes en 1990 y 1999. Observamos a173 especies, incluyendo 11 nuevos registros para el parque.Se han enumerado un total de 256 especies para el parque.Por primera vez en 10 años, se observó un jabirú (Jabirumycteria), la cual es el ave más grande en América y es muyrara. Adicionalmente, fueron documentadas las extensionesde importante distribución para el mosquerito de cola detenedor (Tyrannus savanna monachus), la codorniz depecho gris (Laterallus exilis) y el mosquerito vermillón(Pyrocephalus rubinus). La parte oeste del parque, con sussabanas anegadas y lagunas poco profundas (playones),contiene hábitats únicos para aves de los humedales.Adicionalmente, son sitios importantes el Río Escondido yla Laguna La Lámpara. Los especialistas de Selva incluyen,el gran guaco (Crax rubra), reyezuelos (Trogloditidae) yaves trepadoras de árboles (Dendrocolaptidae) comoabundantes en el bosque alto de las colinas y en los bosquesribereños cercanos (galería). En general, los patrones de latopografía y la estructura de la vegetación se encuentran muyrelacionados con los patrones de la variación en lacomposición de las aves dentro del PNLT. La conservaciónde los tipos de hábitat dentro del PNLT, particularmente loshumedales y bosques altos, es clave para conservar su grandiversidad de aves.
Reptiles acuáticos
Los reptiles fueron investigados en aguas cercanas a lo largodel parque, con un enfoque hacia las poblaciones delcocodrilo pantanero (Crocodylus moreletii). Este animal seclasifica como un animal “deficiente en datos”—es decir, queno se ha estudiado lo suficiente—por la Unión Mundial parala Naturaleza (IUCN) y puede estar en peligro de extincióndebido al exceso de caza y la pérdida de hábitat. En 87.14 kmde la orilla de playa estudiada se observaron 130 cocodrilos.Las lagunas tenían densidades más altas que los ríos. De laslagunas, el área de Flor de Luna y La Pista tenían lasdensidades más altas. Las densidades combinadas en laslagunas junto al camino Xan-Flor de Luna son las más altashasta ahora registradas en Guatemala. La Laguna El Perú y elRío Sacluc tenían una representación relativamente alta deadultos, los cuales son esenciales para el mantenimiento de

�������������� ������������� Octubro 2000 ���
las poblaciones de reproducción en el parque. De la mismamanera que varias especies de peces, los cocodrilos utilizanlos hábitats de ciénagas de llanos bajos (sibal) para elestablecimiento de nidos, cobertura y alimento. Por lo tanto,este hábitat es particularmente importante. En general, laspoblaciones de cocodrilos en el parque son saludables, y losprogramas de monitoreo deberían iniciarse de inmediato.
Adicionalmente, se observaron 14 especies de anfibiosy 22 especies de reptiles. El anfibio más abundante fue larana de franjas oscuras (Leptodactylus melanonotus) y elreptil más abundante fue el cutete rayado (Basiliscusvittatus), una especie endémica de Centro América. La bella,en peligro, tortuga de río americana o tortuga blanca(Dermatemys mawii) fue observada durante la expedición. Elequipo de herpetología también capturó a la culebra vientrepunteado listada (Coniophanes quinquevittatus), unaespecie que nunca ha sido documentada antes en esta área.Registros adicionales de la nota incluyen la rana de ojos rojos(Agalychnis callidryas), la Rana de Baudin (Smiliscabaudinii), jicotea (Trachemys scripta) y la tortuga guao(Staurotypus triporcatus).
Mamíferos
A pesar del corto período de tiempo y de las difícilescircunstancias para el estudio de los mamíferos, seregistraron 40 especies, lo que es un 30% del númeropotencial de especies en el PNLT. Se observaron veintitrésespecies de murciélagos, dos especies de primates, tresespecies de carnívoros, una especie de perisodáctilo, tresespecies de artiodáctilos y ocho especies de roedores. Entrelos murciélagos, fueron comunes tres especies, incluyendo aArtibeus intermedius (un gran murciélago que se alimenta defrutas), Carollia brevicauda y A. lituratus. Dos roedoresendémicos de Yucatán: el ratón venado (Peromyscusyucatanicus)—un nuevo registro para Guatemala—y elpequeño ratón espinoso (Heteromys gaumeri). No hubodiferencias aparentes en la diversidad de mamíferos entre lascuatro localidades observadas en el parque. Eran abundanteslas poblaciones de monos aulladores mexicanos (Alouattapigra) y los monos araña de Geoffroy (Ateles geoffroyi) a lolargo de estas localidades, lo que sugiere que muchas áreasdel parque se encuentran relativamente inalteradas desde elpunto de vista de los mamíferos. También se observaron enel parque otras especies raras y en peligro de extinciónincluyendo el tapir de Baird (Tapirus bairdii), pecarí decollar (Tayassu tajacu) y el venado rojo (Mazamaamericana). Estos se observaron cerca de la EBG junto alRío San Pedro, lo que sugiere que esta área puede serespecialmente importante para la conservación de mamíferosen el PNLT.
Hormigas
Así como para los mamíferos, el tiempo disponible y laépoca del año hizo difícil obtener una muestra completa delas hormigas. No obstante, se registraron 112 especies y 39géneros. Estos valores son mayores que los que seregistraron en muchos otros estudios en la región. Como enlos sitios neotrópicos, el género Pheidole se encontraba enmayor número de especies, aunque, también fueronaltamente diversos varias géneros arbóreos. Se registrarontres especies endémicas de la región de la Selva Maya,incluyendo Sericomyrmex aztecus, Xenomyrmex skwarrae yOdontomachus yucatecus. Un género extremadamente rarode hormiga, Thaumatomyrmex, fue descubierto por primeravez en Guatemala. La riqueza de especies fue la mayor enhábitats relativamente abiertos o alterados, contrario anuestras expectativas. Esto se debió a la alta diversidad demicrohábitats de estos sitios. Un hábitat alterado erarelativamente similar a un sitio cercano de bosque pristino, elcual coincide con la suposición de que la recuperación de lafaunas de hormigas neotrópicas es rápida. En general, lacomposición de las hormigas fue muy irregular y fueron muyaltas las tasas de cambio de especies entre sitios, impidiendouna evaluación de las asociaciones de los hábitats y especies,sugiriendo que la riqueza en general era mucho mayor que laque se registró. Se necesitan estudios más intensivos paraasegurarse cuáles hábitats tienen la mayor representación deespecies raras o únicas, pero nuestros resultadospreliminares sugieren que los bosques altos albergan un grannúmero de especies de hormigas de follaje y de hojarasca,por lo que posee un gran valor para la conservación.
��������� ������������� ������������� �������������������� �� ��
Un estudio anterior llevado a cabo por CI-ProPetén(Méndez et al., 1998) tuvo algunos de los mismos objetivosque nuestro RAP pero se enfocó en varios sitios diferentes ytaxones distintos. Los taxones observados por Méndez etal. (1998) pero que no se observaron en este RAP incluyeroncomunidades de mariposas y de plantas terrestres. Tambiénse estudiaron las aves y los anfibios. Méndez et al. consideróla forma en que las características topográficas varían endiferentes zonas del PNLT correspondientes a patrones dediversidad biológica en una inclinación oeste-este de relievetopográfico creciente a través del parque. Su objetivo eraproporcionar prioridad a los hábitats del parque. Ellosreconocieron tres componentes geográficos del parque enesta amplia escala: 1) el área oeste del parque, lo que consistede una matriz de follaje abierto con parches de selva debosque alto alto, de follaje cerrado; 2) un área central que essimilar al área oeste pero con sabana anegada al norte, y 3)un área este con una mayor cobertura de bosque alto yparches de selva abierta, ciénagas y bosque de roble

CONSERVATION INTERNATIONAL Programa de Evaluación Rápida���
(encinales). Méndez et al. encontró que la mayoría deespecies de plantas eran especies de roble, y que este grupocontenía un gran número de especies encontradas en la parteeste pero en ninguna otra parte del parque (es decir, especies“exclusivas”). La mayoría de los bosques altos en los cualesresiden estos árboles se encontraban en colinas de 100 a 170metros. Méndez et al. registró 219 especies de aves, 60 delas cuales eran de alguna manera restringidos en hábitat. Ellosencontraron que el área central tenía el mayor número deespecies exclusivas de aves. La riqueza más grande deanfibios se encontró en el área central, y esto se atribuyó a lanaturaleza de transición dentro del parque. De las 97especies de mariposas que se registraron, la riqueza de lasespecies fue mayor en las áreas central y este, y el área estealbergaba el mayor número de especies exclusivas.
Finalmente, los análisis de grupos basados en lacomposición de las especies revelaron que la parte este delparque agrupó hacia afuera de las áreas oeste y central delparque para todos los taxones examinados, indicando lascaracterísticas únicas del área este. Méndez et al. concluyóque la inclinación topográfica estaba relacionada con lospatrones de la biodiversidad del PNLT. Aunque el área este,la parte topográficamente más variada del parque era la másrica en general en especies exclusivas, se le proporciona laprotección más grande en el parque. El área oeste, por el otrolado, es la menos rica en especies exclusivas pero seencuentra menos protegida. Méndez et al. consideró que elárea oeste es extremadamente frágil debido a la extremavulnerabilidad de los ricos sistemas acuáticos que seencuentran allí y la amenaza impuesta por el desarrollo delpetróleo a esas especies de los sistemas.
En muchos casos, los resultados del RAP coinciden conlos de Méndez et al. El bosque alto y varios hábitatsacuáticos presentes en el área focal de Río San Pedro que seencuentran en la parte este del PNLT fueron reconocidos porsu importancia para los grupos tales como peces, mamíferosy hormigas. Los hábitats de humedales y lagunasencontrados en las partes central y oeste del parque (esdecir, las áreas focales de Río Escondido y Flor de Luna),sin embargo, también se reconocieron como esenciales para laconservación de aves acuáticas y el cocodrilo pantanero.Adicionalmente, algunas áreas que no se encuentranactualmente localizadas dentro de los límites del parquedeberían considerarse en el manejo de la región. En general, elvalor de los hábitats en lo particular depende de los taxonesconsiderados. Visto de esta manera, y considerando lacondición del PNLT como un área núcleo dentro de la RBM,hay justificación para la protección de todos los hábitats delparque.
������������������������������������ #�����
Nuestras observaciones nos hacen creer que el PNLT es unárea núcleo crítica dentro de la RBM. Es una reservaimportante de hábitats de bosque seco y de humedales quealbergan las comunidades bióticas y especies individuales degran valor conservacionista regional y global. Nuestrosestudios en el PNLT reflejan las necesidades de informaciónespecíficas que sólo podrán ser obtenidas por estudios másintensivos en el parque. No obstante, podemos ofrecer variasrecomendaciones específicas para el manejo del parque. Labase para las siguientes recomendaciones puede encontrarseen el texto del resumen ejecutivo y en los siguientescapítulos. Las recomendaciones no se enumeran en orden deprioridad. Primero proporcionamos recomendaciones parauna futura investigación científica en el parque, haciendonotar que la EBG está en una ubicación ideal desde la cual sepueden realizar estas investigaciones luego vienen lasrecomendaciones de conservación.
Prioridades de investigación científica:
• Investigación adicional determinando las relacioneshidrológicas a lo largo del parque y susdinámicas estacionales que serán un primer pasonecesario para generar un entendimiento de los sistemasacuáticos del parque, incluyendo el flujo de loscontaminantes y de las dinámicas de dispersión ypoblación de las especies.
• Considerando la intensa dinámica estacional de lasáreas de bosque seco tropical tal como el PNLT,deben llevarse a cabo estudios tanto de sistemasterrestres y acuáticos, en diferentes épocas del año,particularmente durante la estación húmeda cuando lossistemas acuáticos están mejor conectados y cuando seestán reproduciendo muchos organismos terrestres.
• Se necesita proporcionar estudios más detallados de lasrelaciones entre la topografía, suelos (particularmente laprofundidad del suelo), y las comunidades de plantas yanimales para proporcionar observaciones a escala másfina de patrones de biodiversidad para propósitos deorden por prioridad. Al considerar el alto grado deincursión de los colonizadores en el parque, dichosestudios ayudarán a la asignación óptima de protecciónpara hábitats en las áreas invadidas.

�������������� ������������� Octubro 2000 ���
• Proteger varios hábitats únicos dentro del parque, ypara propósitos de manejo, incluir dentro del parqueotros hábitats terrestres y acuáticos que ahora seencuentran fuera del parque. Estos incluyen los bosquesanegados tipo varzea cerca de Paso Caballos y junto alRío Sacluc, los hábitats de la ciénaga de llanos bajos(sibal) junto al margen sur del Río San Pedro y junto alRío Escondido, el sistema de arrecifes de moluscos en elárea de los “rápidos” en el Río San Pedro cerca de ElNaranjo, el manglar restante junto al Río San Pedro, yla vegetación de encinos junto al Río Sacluc. Es departicular importancia la ampliación de los canales alhábitat de la ciénaga de llanos bajos junto al RíoEscondido, asociado con el pasaje de lanchas quedebea ser controlado.
• Iniciar un programa de monitoreo de calidad de aguadentro del parque. Son de particular interés las áreasque utilizan las poblaciones humanas, incluyendo lasfuentes de los tributarios junto al Río San Pedro y a laslagunas en el camino de Xan-Flor de Luna. De formaespecífica, deberían examinarse los niveles y efectos dela contaminación y la actividad agrícola.
• Investigar los determinantes de stress y degenotoxicidad en los peces—revelada en estaevaluación—en Xan 3 y en otras lagunas. Aún quedanvarias preguntas sin responder: ¿Qué contaminantesestán involucrados?, ¿Cuáles son las fuentes de estoscontaminantes?, ¿Cuál es el rol de la hidrología endeterminar la redistribución de los contaminantes?, ¿Dequé forma el comportamiento de las especies
La condición, las amenazas y las acciones conservacionistasque recomendamos se resumen por tipo de hábitat en laTabla i. Esperamos que estas recomendacionesproporcionen alguna guía en el manejo del PNLT ymotivamos a los grupos interesados para que contacten a losautores de este informe si desean clarificación adicional.
���� ��� �� ������
Méndez, C., C. Barrientos, F. Castañeda y R. Rodas. 1998.Programa de Monitoreo, Unidad de Manejo Lagunadel Tigre: Los Estudios Base para su Establecimiento.CI-ProPetén, Conservation International, Washington,DC, USA.
• Inmediatamente conservar áreas determinadas delbosque alto primario, no alterado. Deben mantenerselos niveles actuales de protección asignados a las áreascerca de la EBLG, junto al Río San Pedro y las áreasboscosas más allá de esta parte del área protegida, talcomo El Perú o cerca de la Laguna Guayacán, las cualesdeben ser monitoreadas cuidadosamente. La alteraciónhumana de los bosques del área del Río San Pedrodebería minimizarse para favorecer a las grandespoblaciones de mamíferos.
• Monitorear las poblaciones de especies dentro delparque para evaluar las tendencias en su salud. Departicular preocupación lo son aquellas poblaciones queson pequeñas y/o explotadas por los humanos.Específicamente, deberían monitorearse las dinámicasde los peces que se pueden consumir tales como Peteniasplendida y Brycon guatemalensis (especialmente en elfuertemente explotado Río San Pedro). Un programa deconservación y de monitoreo para cocodrilos(Crocodylus moreletii) debería enfocarse en sitios endonde actualmente son abundantes, incluyendo el RíoSacluc, la Laguna el Perú y la Laguna la Pista.Finalmente, las poblaciones de aves deberíanmonitorearse, especialmente en los hábitats acuáticos enlas partes central y oeste del parque debido a que estaárea es de importancia internacional así como lasamenazas impuestas a estos hábitats debido a laextracción del petróleo y a la colonización humana.
Recomendaciones específicas de conservación para elPNLT:
• Reducir la tasa de deforestación y de quema de loshábitats tales como ciénagas de llanos bajos (sibales),con la meta primordial de parar la deforestación y deliberar completamente la quema dentro del PNLT. Laintegridad ecológica del PNLT, como un área núcleo dela RBM, debe mantenerse si la RBM va a persistir yprosperar.

CONSERVATION INTERNATIONAL Programa de Evaluación Rápida���
Tabla i. Resumen de la importancia de conservación, amenazas, condición general del hábitat yrecomendaciones de manejo para los principales tipos de hábitat del Parque Nacional Laguna del Tigre y elBiotopo
Tipos de hábitat deimportancia
Ubicación (es) Importancia para laconservación
Amenazas Condición delhábitat
Recomendaciones
Ríos, tributarios, ycaños
Río San Pedro/Sacluc y RíoEscondido
Gran riqueza de plantasacuáticas, peces
Contaminación,especialmente detributarios, exceso de pesca
Variable, másdeficiente cerca delos asentamientos
Monitorear, regular las prácticasde desperdicio humano y presiónde la pesca
Rápidos/Arrecifes de agua dulce
Río San Pedro Único sistema de arrecife deagua dulce de moluscosbivalvos y diversidadasociada
Contaminación, exceso depesca de moluscos
Aún bueno Incluir en el PNLT, el monitoreoy la regulación de pesca demoluscos y la contaminación delrío
Lagunas Flor de Luna, RíoChocop
Altas densidades decocodrilos pantanero, avesacuáticas únicas
Contaminación,contaminación por petróleo
Variable, unalaguna cerca de unpozo petrolero quepuede estarcontaminado
Prohibir el uso humano de ciertaslagunas, monitorear los nivelesde contaminación
Lagunas de recodo Río Escondido Gran riqueza de plantasacuáticas
Erosión debido al paso delas lanchas en los canales
Variable Regular el uso de lanchas yposiblemente el tamaño o lavelocidad de la lancha en elparque
Ciénagas de llanoscortos (sibal)
Todos Gran riqueza de avesacuáticas, criaderos paraespecies de peces
Quema Variable, muchosdaños por losincendios
Incluir más tierras de ciénagas enel parque, evitar la esparción delos incendios en las ciénagas,regular la quema en el parque
Bosque tipo varzea Río SanPedro/Sacluc
Criaderos para especies depeces
Colonizaciones Desconocido Incluirlo en el PNLT, senecesitan más estudios
Bosque alto Todos Gran riqueza de hormigas,mamíferos
Deforestación, quema Variable, muchosdaños por losincendios
Quema controlada y protegerparches relativamente primitivos
Encinal Río Sacluc Plantas únicas, al igual queanimales únicos
Deforestación,fragmentación
Desconocido Incluir áreas junto al Río Saclucen el PNLT

���� � � � � � ��������������� ���������������������� Julio 2000
��������� +
��� ���������������������������� �������� ������������������������ �����������������
Brandon T. Bestelmeyer
� ������ ��� ��� ��� ����������������� �� ��� �
El Parque Nacional Laguna del Tigre (PNLT) es una zonanúcleo de la Reserva de la Biósfera Maya (RBM), y lasamenazas que enfrenta reflejan la necesidad tanto deinvestigación como de esfuerzos de conservación en elparque. El concepto de reservas de biósfera mantiene que laconservación y el desarrollo pueden equilibrarse por undiseño y manejo cuidadoso de las redes de reservas. Lafunción de las áreas núcleo, al contrario de las zonasextractivas o de amortiguamiento en las cuales puede ocurrirla actividad económica humana, es preservar a losecosistemas representativos mínimamente afectados quesirven como una meta para esfuerzos regionales demonitoreo y que protegen poblaciones silvestres. Deacuerdo con Batisse (1986), “La protección contra cualquieracción que pueda poner en peligro el rol de conservaciónasignado al área núcleo debe... asegurarse completamente”.El objetivo de este RAP es evaluar el valor del PNLT comoun área núcleo de la RBM y evaluar las amenazas paradeterminar su rol como área núcleo.
El parque es parte de la Selva Maya, la cual contiene losecosistemas de bosque tropical restantes de Centro América.El bosque se expande de la parte sur de México(especialmente los estados de Chiapas, Campeche yQuintana Roo) hasta la parte norte de Guatemala y Beliceformando una unidad natural biogeográfica y cultural(Nations et al., 1998). La RBM, de 16,000 km2 , seencuentra en el departamento de El Petén en la parte norte deGuatemala contiene el sistema más grande de áreasmanejadas y protegidas en la Selva Maya. El PNLT, con unárea de 338,566 (incluye Biotopo) hectáreas es el áreanúcleo más grande e importante dentro de esta reserva.
Sin importar su condición como áreas protegida, elparque se encuentra muy amenazado por la colonización y el
desarrollo y se deforesta a una tasa de 0.57% al año (datosde 1995 a 1997; Sader, 1999). Como consecuencia el 50%de la selva se ha perdido y una de las estimaciones de lasproyecciones es que el 98% de la selva original en El Peténdesaparecerá para el año 2010 si las tasas actuales dedeforestación no se reducen (Canteo, 1996).
�� ���� �������� �������������� ����
El parque se encuentra ubicado dentro de una zonacaracterizada como bosque seco tropical (Murphy y Lugo,1995; Campbell, 1998). Debido a que los bosques húmedostropicales han recibido mucha atención de parte de losecologistas y conservacionistas, los ecosistemas de bosqueseco tropical—bosques secos neotrópicos en particular—son menos estudiados, utilizados de forma intensiva porhumanos y extremadamente en peligro por el desarrollo anivel mundial (Mooney et al., 1995; Gentry, 1995). Por estarazón, la Selva Maya tiene importancia global.
La topografía del área es baja y plana, con laselevaciones máximas sin exceder los 300 m. El área estácompuesta de piedra caliza de la edad Miocena, realzando elpaisaje cárstico junto a los cursos de los grandes ríos, colinasbien drenadas con suelos superficiales rodeados por áreasbajas con suelos profundos (conocido como bajos) y unospocos riachuelos pero numerosos agujeros de agua quesurgen de las depresiones de la piedra caliza (Wallace, 1997).Los hundimientos menores de piedra caliza son conocidoscomo aguadas y los más grandes como akalchés o lagunas(Campbell, 1998). Se cree que los humedales de la parteoeste aún permanecen en Centro América (Wallace, 1997).Estos humedales también son los más grandes de Guatemalay son reconocidos bajo la convención de Ramsar por suimportancia internacional.

CONSERVATION INTERNATIONAL Programa de Evaluación Rápida���
Como en todos los ecosistemas de bosque seco tropical,el contraste entre las estaciones secas y húmedas es lacaracterística ecológica temporal de mayor importancia(Murphy y Lugo, 1995). La precipitación anual promedio dela región es de 1600 mm por año, pero pueden ocurrirprecipitaciones ocasionales en la estación seca de enero aabril, cuando las temperaturas pueden exceder 40° C. Esteperíodo representa un reto importante para muchos de losorganismos del trópico húmedo en el parque.Adicionalmente, la estacionalidad en la precipitacióninteractúa con la topografía para producir variacionesextremas en condiciones ambientales. Por ejemplo, los suelosbajos pueden estar inundados durante la estación húmedapero extremadamente secos durante la estación seca(Whitacre, 1998). El agua persiste en grandes lagunas a lolargo del año (Campbell, 1998) y por lo tanto soncaracterísticas del paisaje y ecología del parque.
Posiblemente el eje más importante de la variaciónambiental terrestre natural es entre los bosques bajosinundados estacionalmente y los llanos altos bien drenadosubicados en barrancos de piedra caliza. Whitacre (1998)reporta que tanto la composición arbórea como lacomposición de aves varía dramáticamente entre estascondiciones topográficas, de tal manera que áreas contopografía similar separadas por varias millas son muchomás parecidas que áreas de topografía diferente tan sólo acientos de millas de distancia. Los árboles de bosques altostienden a ser más altos con abundante hojarasca y pocamaleza. Los árboles de bosques bajos tienden a ser más bajos(15 m a 20 m) y poseen mayor densidad de arbustos, palmasy hierba. Esta variación tiende a ser una fuerte influencia enlos patrones de la biodiversidad en la región (Méndez et al.,1998).
Los sistemas acuáticos dentro del parque son menosentendidos que los sistemas terrestres. El curso de agua másimportante en el parque es el Río San Pedro, el cual es untributario mayor del Río Usumacinta. El Río Sacluc es untributario del Río San Pedro y drena áreas al sur este delparque. El Río Escondido es otro tributario del Río SanPedro que drena áreas dentro y alrededor del Biotopo de laLaguna del Tigre en la parte oeste del PNLT. El Río Chocopdrena el centro del parque al Río San Pedro y el RíoCandelaria es un afluente independiente de la Laguna deTérminos. Se desconocen las relaciones hidrológicas entreestos ríos y las muchas lagunas—especialmente unionessubterráneas, las cuales pueden ser un componenteimportante en paisajes cársticos. Adicionalmente, existenalgunas uniones estacionalmente variables similares entre loscuerpos de agua con conexiones en la estación húmeda queno son aparentes en la estación seca, durante la cual se llevóa cabo nuestro muestreo. Dichas uniones deberían tenerconsecuencias importantes tanto para dinámicas dedispersión de poblaciones animales y vegetales así comopara la dispersión de contaminantes. Estas características
deberían ser una prioridad importante para una investigaciónfutura en el parque.
Los cambios históricos en la estructura climática y de lavegetación han dejado también una impresión importante enla ecología de los bosques de El Petén. La región ha estadosujeta a mucha inestabilidad climática a lo largo delHoloceno. Por ejemplo, Leyden (1984) relaciona que lavegetación en la región estaba dominada por formaciones depino y cedro a la altura del último período glacial y que unperíodo y de mayor aridez ocurrió hace casi 2200 a 1140años atrás. Los cambios más recientes a la vegetación sonasociados con el surgimiento de la cultura Maya. Durante laparte final del período Clásico (600 a 850 A.D.), los Mayasalcanzaron densidades máximas de hasta 200 personas porkm2 (Culbert y Rice, 1990), y esto sugiere que la conversiónextensiva agrícola del paisaje fue necesaria para sustentarse.Como consecuencia, los bosques tropicales que observamoshoy día probablemente no tienen más de 1000 años deantiguedad (Méndez, 1999). El entendimiento de lospatrones ecológicos actuales dentro de la Selva Mayarequiere que conozcamos la influencia de estos procesoshistóricos.
����� �����������
El PNLT es administrado por el Consejo Nacional de ÁreasProtegidas (CONAP), la agencia del gobierno de Guatemala acargo de los recursos naturales. CONAP es el enteresponsable de proteger y conservar el patrimonio natural deGuatemala, tareas que logra a través de promover el usosustentable de los recursos naturales y a través de conservarlas poblaciones de vida silvestre y los ecosistemas a lo largodel país. El Biotopo de la Laguna del Tigre, un área núcleolocalizada dentro del parque, es administrada por laUniversidad de San Carlos de Guatemala a través del centrolocal de conservación e investigación , Centro de EstudiosConservacionistas (CECON).
Ponciano (1998) relata la siguiente historia del biotopoy del parque. El CONAP fue fundado en 1989 y una de susprimeras acciones fue incorporar los ya establecidos ParqueNacional Tikal, el Biotopo Laguna del Tigre, el Biotopo ElZotz y el Biotopo Dos Lagunas a la RBM. Adicionalmente,fueron creados los parques nacionales Laguna del Tigre ySierra del Lacandón. La creación de la RBM fue catalizadapor dos eventos: 1) la propuesta de la red de reservas de la“Ruta Maya” para la conservación y el turismo en unartículo de National Geographic, y 2) la amenaza impuestapor la migración y el desarrollo debido a un proyecto dedesarrollo de una carretera que conecta a Flores con Cadenasen el sur. El gobierno alemán estaba financiando esteproyecto, pero basado en una evaluación de impactoambiental, decidió suspender los fondos hasta que se creó lareserva. CONAP pudo crear la reserva debido a que tenía un
�������������� ������������� Octubro 2000 ���
fuerte apoyo político y debido a que en esta época existía ungobierno democrático. La reserva tenía como objetivoalbergar estrictamente áreas núcleo protegidas (parquesnacionales y biotopos), zonas de usos múltiples (porejemplo, extractivas) entre estas zonas núcleos y una zonade amortiguamiento en la cual pueden aparecer tierrasprivadas (Gretzinger, 1998). El parque fue registrado comoun sitio de humedales importantes bajo la convención deRamsar en 1990 y 1999.
������������� #�������� ���������
El crecimiento y la migración a Petén ha complicado elmanejo sustentable y la conservación de la biodiversidad. Elcrecimiento de la población se estima en una tasa anual del7% al 10% , principalmente debido a la migración deagricultores afectados por la pobreza en el sur del país(Nations et al., 1998), así como la repatriación de losciudadanos guatemaltecos refugiados en México quieneshuyeron del país durante la guerra civil que duró 30 años, lacual terminó en 1996 (Ponciano, 1998). Como consecuenciade estas presiones, la colonización sucedió dentro de lasáreas núcleo y ha probado ser difícil de manejar a lo largo dela reserva. Los recientes inmigrantes han traído consigo lasprácticas agrícolas (técnicas de corte y quema a gran escala)de las tierras altas, que no son sostenibles en el contexto delos bosques de tierras bajas. La tala no regulada e ilegal deespecies maderables valiosas y otros productos amenazancon la disminución de la capacidad del bosque de dar apoyo alas poblaciones humanas a través de prácticas nodestructivas.
En situaciones similares en otros lugares, se hanecesitado que los derechos de la tenencia de la tierra y lasconcesiones de recursos naturales sean otorgados a nivel dela comunidad, que existia fortalecimiento de las políticas demanejo y que hallan mercados ampliados para productosforestales con el objeto de frenar la pérdida del bosque. Sinembargo, ha sido muy difícil implementar las actividadesregulatorias en El Petén. La extracción manejada de árbolescomercialmente valiosos tales como la caoba (Swieteniamacrophylla) y el cedro español (Cedrela odorata), así comolos productos forestales no maderables tales como el chicle(utilizado en goma de mascar), xate (un helecho utilizado enarreglos florales) y potpurrí, derivado de productosforestales, pueden proporcionar ingresos a los petenerospara el establecimiento de un bosque semi intacto. Losestudios de Whigham et al. (1998) de aves en Quintana Roosugieren que la tala de madera selectiva no afecta a lascomunidades de forma adversa (consulte también a Whitacre,1998). Esto puede ser en parte, debido a las adaptaciones delas aves a disturbios periódicos naturales en la región, talcomo aquéllos causados por huracanes. Adicionalmente, elmanejo de las prácticas de limpieza y plantación en los
paisajes agrícolas (Warkentin et al., 1995) junto con lapreservación de áreas intactas de bosque antiguo fuera de losciclos de la agricultura (Whitacre, 1998) pueden ayudar apreservar la biodiversidad de Petén. Estas alternativas demanejo deben explorarse además para desarrollar la estrategiaprioritaria para conservar la biodiversidad de Petén.
Un reto adicional de desarrollo surge del hecho de que40% de la reserva se traslapa con áreas definidas conpotencial de desarrollo petrolero (Ponciano, 1998). BasicPetroleum Inc. tenía derechos para desarrollar operacionespetroleras dentro del parque antes de la creación de labiósfera en 1990. Rosenfeld (1999) reporta que a Basic se lehan otorgado los derechos de exploración para la búsquedade petróleo en aproximadamente 55% del área dentro delPNLT. Se desconocen los efectos directos de las operacionespetroleras de Basic en el parque, pero queda claro que lacreación de los caminos a áreas que no han sido colonizadascon anterioridad han exacerbado la tala de bosques dentro delparque (Rosenfeld, 1999). Los acuerdos entre los interesesde conservación y el Ministerio de Energía y Minas acercade la forma de cómo proceder con el desarrollo todavía nohan sido determinados.
En respuesta a las amenazas impuestas por el desarrollopetrolero y la colonización humana dentro del parque, seinició un programa más grande de investigación y monitoreoen el PNLT de parte de CI-ProPetén en colaboración con elCONAP y el CECON (Méndez et al., 1998). Este estudiodocumentó por primera vez la gran diversidad de plantas,mariposas diurnas, reptiles, anfibios, y aves dentro delparque. El estudio de la vegetación llevado a cabo en esteestudio es la base el terreno para el esfuerzo del estudioterrestre presentado aquí, y los datos de Méndez et al.(1998) como conjunto, complementan la información de floray fauna acuática y los datos terrestres de hormigas ymamíferos. Se espera que nuestros esfuerzos, encombinación con este estudio anterior, ayuden a llamar laatención al valor de la biodiversidad del PNLT, proporcionendirección e ímpetu para estudios más intensivos en la región,y ayuden a los administradores de las tierras en laconservación y el manejo de la biodiversidad del PNLT.
���������� ��������������
Llevamos a cabo este estudio al final de la estación seca parafacilitar la movilidad a través del parque y para muestrearmejor ciertos grupos tales como peces y aves acuáticas. Elmuestreo se concentró alrededor de cuatro áreas focales (verel Mapa 3). El primero se enfocó en la Estación BiológicaLas Guacamayas, la cual se localiza en la confluencia entre elRío San Pedro y el Río Sacluc. El muestreo se llevó a cabocerca de las fuentes de agua junto al Río San Pedro y en laspartes cercanas del Río Sacluc. La segunda área focal estabalocalizada junto al Río Escondido al oeste, el cual fluye en el

CONSERVATION INTERNATIONAL Programa de Evaluación Rápida���
Río San Pedro desde el norte y pasa a través del Biotopo dela Laguna del Tigre. La tercera área focal se centró en unsistema de lagunas cerca de la esquina noreste del Biotopo dela Laguna del Tigre. Estas lagunas se encuentran cerca de loscampos petroleros de Xan que actualmente operan dentrodel parque. Los estudios toxicológicos se enfocaron aquí enlagunas localizadas a varias distancias de los pozos depetróleo de Xan. La cuarta área se centraba en el RíoChocop, la cual incluye otras lagunas y el Río Candelaria. Enconjunto, estas áreas focales representan un espacio dehábitats que se encuentran dentro del parque, incluyendoáreas que están amenazadas por la contaminación y eldesarrollo agrícola.
Dentro de cada área focal, se colectó en varios puntosde muestreo (o puntos de georeferencia) que representandiferentes macrohábitats que se encuentran en el área. Lasmuestras fueron recolectadas por cada grupo dentro de unospocos cientos de metros de un punto de muestreo. Lospuntos de muestreo generalmente ocurren a solo kilómetrosdel punto que define el centro de cada una de las áreasfocales; este es el punto focal (consulte los asteriscos en elApéndice 1 y el Apéndice 2). Este diseño permite análisisjerárquicos de relaciones entre los taxones en dos escalasespaciales.
Aquí se utiliza una clasificación de macrohábitatsacuáticos y terrestres como el fundamento de las
comparaciones entre taxones y entre regiones dentro delparque. Estos tipos de macrohábitats se describen acontinuación.
Macrohábitats acuáticosExisten pocos estudios de hábitats dentro del parque. Eneste estudio muestreamos hábitats acuáticos y organismosacuáticos entre tres a doce puntos de muestreo en cada áreafocal. El Apéndice 1 presenta una clasificación preliminar demacrohábitats acuáticos por los miembros del equipo deRAP. Las discusiones de las características de estosmacrohábitats pueden encontrarse en los Capítulos 2 y 3, yse resumen en la Tabla 1.1.
Macrohábitats terrestresLos tipos de macrohábitat terrestres se basan en lasclasificaciones de vegetación reconocidas por Méndez et al.(1998). Ecologos terrestres examinaron entre uno y trespuntos de muestreo dentro de cada área focal (Apéndice 2).En la Tabla 1.2 pueden encontrarse descripciones detalladasde los diferentes macrohábitats terrestres.
Notese que fué posible muestrear los grupos acuáticosen muchos más puntos que los grupos terrestres. Esto sedebe a las diferencias en el esfuerzo que se necesita paramuestrear de forma adecuada los diferentes tipos deorganismos en cada punto.
Tabla 1.1. Descripciones de macrohábitats acuáticos en el Parque Nacional Laguna del Tigre, clasificadospor primera vez en este estudio.
Tipo de macrohábitat CaracterísticasSistemas fluviales (ríos) Secciones acuáticas Bahías de ríos (bahías) Porciones de agua de movimiento lento junto a las orillas
de los ríos. Ríos permanentes (permanentes) Partes profundas de los ríos que nunca se secan,
usualmente con lecho compuesto de piedra caliza. Ríos rápidos (rápidos) Partes de los ríos de movimientos rápidos, frecuentemente
con substratos rocosos, y en el caso de San Pedro,arrecifes conformados de bivalvos.
Ríos estacionales (someros) Ríos pequeños o estacionales o estrechos de ríos que sonestacionalmente secos. Estos pueden tener una variedadde substratos y partes más profundas que pueden conteneragua una vez al año pero pueden estar muy estancados enla estación seca.
Sistemas no fluviales Tributarios (tributarios, riachuelos) Los pequeños riachuelos que alimentan a los ríos
frecuentemente se alimentan de las fuentes. Aguas demovimientos rápidos altamente oxigenadas.
Caños Ambientes lóticos angostos conectados a los ríos desdelas ciénagas. Las aguas son turbias casi estancadas.
Lagunas en recodos (lagunas meándricas) Lagunas formadas por recodos definidos de ríos que sedesprenden de los cursos de los ríos y existen comolagunas aisladas a lo largo de éste.
Lagunas Las lagunas formadas por depresiones en piedra caliza,también conocidas como alkachés o aguadas. Las aguaspueden ser claras o turbias.

�������������� ������������� Octubro 2000 ���
���!� ������������� ���������� ���������
En los siguientes capítulos que sigue, se proporcionan losresultados para cada taxón o sub estudio de RAP comomanuscritos independientes. Cada estudio y la presentaciónresultante necesariamente emplean una organizaciónlevemente diferente, dependiendo de la dificultad en divulgary relacionar información acerca de los taxones focales. Sinembargo, varias características analíticas se comparten entodos los capítulos basados en los taxones para evaluar ladiversidad de un grupo. Algunas o todas estas medidaspueden utilizarse en un capítulo en lo particular,dependiendo de la utilidad dada a los datos disponibles.Primero, la riqueza de las especies se mide como el númerode especies. Segundo, la diversidad de las especies (en elsentido estricto) se mide como la distribución de abundanciaentre las especies. Una distribución más pareja entre lasespecies y un número mayor de especies generalmente lleva
a valores de diversidad más altos. Tercero, de forma similar,la composición de las especies en un sitio, se mide utilizandolos índices de similitud o utilizando las técnicas deordenamiento o agrupamiento. Dos sitios que son diferentesen la abundancia de especies, tienen una mayor diversidadcombinada que los dos hábitats que son relativamente másparecidos. Esto se refleja en los diagramas de agrupamiento yordenamiento por las distancias que se encuentran entre lasmuestras en el diagrama.
Y finalmente, utilizamos la presencia y abundancia deespecies global o regionalmente raras o endémicas, talescomo las que son protegidas por acuerdos internacionalesincluyendo los apéndices de la Convención Internacional deTráfico de Especies de Flora y Fauna Silvestre en Peligro(CITES)y la Lista roja de la Unión Mundial para laNaturaleza (UICN). Esto requiere de información en ladistribución a gran escala los taxa y puede ser que no seencuentre disponible para ciertos grupos que no se hanestudiado lo suficiente tales como el plancton.
Tabla 1.2. Descripciones de macrohábitats terrestres examinados durante la expedición RAP al ParqueNacional Laguna del Tigre (basado en Méndez et al., 1998).
Tipo de macrohábitat CaracterísticasBosque alto Caracterizado por una maleza relativamente cerrada un llano escaso
dominado por palmas y arbustos Trepadores. Asociaciones queincluyen al ramonal, dominados por el árbol Brosimum alicastrum.El bosque alto ocupa un área de 19,354 hectáreas (5.72% delparque).
Bosque bajo El Bosque bajo con un follaje más denso debido a inundacionesperiódicas. Dominado por árboles tales como pucté y tinto,mezclado con roblehicpo (Coccoloba sp.) y cojché (Nectandramembranacea). También son dominantes las palmas incluyendo abotán (Sabal morisiana) y escoba (Crysophila argentea).
Encinal Residuos de un bosque dominado por roble (Quercus oleoides)existen cerca de la confluencia de los ríos San Pedro y Sacluc. Losárboles asociados incluyen el pucté (Bucida buceras) y el tinto(Haematoxylum campechianum) en áreas anegadas. Este tipo ocupaun área de 2,367 hectáreas (0.70% del parque).
Prado Áreas que recientemente han sido limpiadas por corte y quema yhan sido colonizadas con llanos.
Guamil Bosques en regeneración (secundarios) con llanos densos, algunasveces con falta de árboles tupidos en su totalidad. Incluye guarumo(Cecropia petata), acacia (Acacia cornifera), bayal (Desmoncussp.), y palmas con elementos característicos.
Bosques fluviales Parece como un mosaico de parches de bosque alto y bosque bajoen áreas que generalmente se inundan en la estación húmeda. Laasociación más abundante es el pucté y la Pachira sp. Consultetambién la sección de macrófitas acuáticos.
Tintal Una clase de bosque bajo que está casi completamente compuestopor tinto (Haematoxylum campechianum), frecuentemente seencuentra cerca de los márgenes de las lagunas.

CONSERVATION INTERNATIONAL Programa de Evaluación Rápida���
���� ��� �� ������
Batisse, M. 1986. Developing and focusing thebiosphere reserve concept. Nature and Resources 22:2-11.
Campbell, J. A. 1998. Amphibians and Reptiles ofNorthern Guatemala, the Yucatán, andBelize. University of Oklahoma Press,Norman, OK, USA.
Canteo, C. 1996. Destrucción de Biósfera Mayaavanza año con año. Siglo Veintiuno, Novem-ber 21. Guatemala City, Guatemala.
Culbert, T. P. y D. S. Rice, eds. 1990. PrecolumbianPopulation History in the Maya Lowlands.University of New Mexico Press, Albuquer-que, NM, USA.
Gentry, A. H. 1995. Diversity and floristic composi-tion of Neotropical dry forests. Pp. 146-190 inSeasonally Dry Tropical Forests (S. H.Bullock, H. A. Mooney, and E. Medina, eds.).Cambridge University Press, New York, NY, USA.
Gretzinger, S. P. 1998. Community-forest concessions:an economic alternative for the MayaBiosphere Reserve in the Petén, Guatemala.Pp. 111-124 in Timber, Tourists, and Temples:Conservation and Development in the MayaForest of Belize, Guatemala, and Mexico (R.B. Primack, D. Bray, H. A. Galletti, andI. Ponciano, eds.). Island Press, Washington,DC, USA.
Leyden, B. W. 1984. Guatemalan forest synthesis afterPleistocene aridity. Proceedings of the NationalAcademy of Sciences 81:4856-4859.
Méndez, C. 1999. How old is the Petén tropical forest?Pp. 31-34 in Thirteen Ways of Looking at a TropicalForest: Guatemala’s Maya Biosphere Reserve (J. D.Nations, ed.). Conservation International, Washington,DC, USA.
Méndez, C., C. Barrientos, F. Castañeda, and R. Rodas.1998. Programa de Monitoreo, Unidad de ManejoLaguna del Tigre: Los Estudios Base para suEstablecimiento. CI-ProPetén, Conservation Interna-tional, Washington, DC, USA.
Mooney, H. A., S. H. Bullock, and E. Medina. 1995.Introduction. Pp. 1-8 in Seasonally Dry TropicalForests (S. H. Bullock, H. A. Mooney, and E.Medina, eds). Cambridge University Press, New York,NY, USA.
Murphy, P. G. y A. E. Lugo. 1995. Dry forests of CentralAmerica and the Caribbean. Pp. 9-34 in SeasonallyDry Tropical Forests (S. H. Bullock, H. A. Mooney,and E. Medina, eds.). Cambridge University Press,New York, NY, USA.
Nations, J. D., R. B. Primack y D. Bray. 1998. Introduc-tion: the Maya forest. Pp. xiii-xx in Timber, Tourists,and Temples: Conservation and Development in theMaya Forest of Belize, Guatemala, and Mexico (R. B.Primack, D. Bray, H. A. Galletti, and I. Ponciano,eds.). Island Press, Washington, DC, USA.
Ponciano, I. 1998. Forestry policy and protected areas inthe Petén, Guatemala. Pp. 99-110 in Timber, Tourists,and Temples: Conservation and Development in theMaya Forest of Belize, Guatemala, and Mexico (R. B.Primack, D. Bray, H. A. Galletti, and I. Ponciano,eds.). Island Press, Washington, DC, USA.
Rosenfeld, A. 1999. Oil exploration in the forest. Pp. 68-76 in Thirteen Ways of Looking at a Tropical Forest:Guatemala’s Maya Biosphere Reserve (J. D. Nations,ed.). Conservation International, Washington, DC,USA.
Sader, S. 1999. Deforestation trends in northern Guate-mala: a view from space. Pp. 26-30 in Thirteen Waysof Looking at a Tropical Forest: Guatemala’s MayaBiosphere Reserve (J. D. Nations, ed.). ConservationInternational, Washington, DC, USA.
Wallace, D. R. 1997. Central American landscapes. Pp. 72-96 in Central America: A Cultural and NaturalHistory (A. G. Coates, ed.). Yale University Press,New Haven, CT, USA.

�������������� ������������� Octubro 2000 ���
Warkentin, I. G., R. Greenberg y J. Salgado Ortiz. 1995.Songbird use of gallery woodlands in recently clearedand older settled landscapes of the Selva Lacandona,Chiapas, Mexico. Conservation Biology 9: 1095-1106.
Whigham, D. F., J. F. Lynch y M. B. Dickinson. 1998.Dynamics and ecology of natural and managed forestsin Quintana Roo, Mexico. Pp. 267-282 in Timber,Tourists, and Temples: Conservation and Develop-ment in the Maya Forest of Belize, Guatemala, andMexico (R. B. Primack, D. Bray, H. A. Galletti, and I.Ponciano, eds.). Island Press, Washington, DC, USA.
Whitacre, D. F. 1998. The Peregrine Fund’s Maya Project:ecological research, habitat conservation, and develop-ment of human resources in the Maya forest. Pp. 241-266 in Timber, Tourists, and Temples: Conservationand Development in the Maya Forest of Belize,Guatemala, and Mexico (R. B. Primack, D. Bray, H.A. Galletti, and I. Ponciano, eds.). Island Press,Washington, DC, USA.

CONSERVATION INTERNATIONAL Programa de Evaluación Rápida���
��������� *
������!��������������������� ������������������������ ��������������������������������������!������������������������������������������������������������� � ���� ������
Karin Herrera, Ana Cristina Bailey, Marcos Callisto yJorge Ordóñez
������
• Los cuerpos de agua en el Parque Nacional Laguna delTigre (PNLT) fueron clasificados de acuerdo con ochotipos de macrohábitat (refiérase a la Tabla 1.1). Laspropiedades físico-químicas, calidad de agua, flora defitoplancton e insectos asociados con la planta acuáticaSalvinia auriculata se reportan por cada cuerpo de aguaexaminado.
• El pH de las aguas del parque oscilaba de ácido (6.78) aalcalino (8.30), los cuerpos de agua de turbios y oscurosa acuamarinos y de eutrópicos a oligotrópicos. Lacalidad del agua del parque generalmente fue buena. Labacteria coliforme se detectó en el 37% de las muestras,pero la bacteria coliforme fecal se detectó en solamenteel 13% de las muestras.
• Se descubrió un arrecife de agua dulce con moluscos enel Río San Pedro, cerca del pueblo de El Naranjo.
• Se registraron cincuenta y nueve géneros y 71 especiesy morfoespecies de fitoplancton, diatomeas(Bacillariophyceae), seguido por clorofitas(Chlorophyceae) y cianofitos (Cyanophyceae),dominaron las muestras. Análisis multivariadosrevelaron que la única fuente más importante devariación que determina la composición de fitoplanctonfue el pH y la segunda fue la conductividad.
• Se encontraron cuarenta y cuatro morfoespecies y 26familias de insectos en Salvinia auriculata. Esteresultado resalta la gran diversidad de insectos en lossistemas acuáticos litorales del parque.
• El arrecife de moluscos debería conservarse y se debería
��� ��������
Los resultados del estudio limnológico del Parque NacionalLaguna del Tigre (PNLT) se presentan, incluyendo losiguiente: 1) descripciones del macrohábitat acuáticoencontrados en el transcurso de este estudio (referirse a laTabla 1.1 y al Apéndice 1); 2) una evaluación de la calidaddel agua usando variables bioticas tales como la presenciade bacteria colifome y Escherichia coli, así como medidasabióticas; y 3) una evaluación de los patrones de diversidaddel fitoplancton dentro del parque. Además de estoscomponentes limnológicos, examinamos la composición deinsectos asociados con plantas flotantes, y específicamentecon Salvinia auriculata. Este estudio limnológico tiene como propósito servircomo la base para estudios más intensos de monitoreo delos sitemas acuáticos en el parque. El monitoreo deorganismos acuáticos como el plancton e insectos, tieneciertas ventajas sobre análisis químicos para determinar lasalud de ecosistemas acuáticos (UNESCO, 1971). Insectosbénticos, por ejemplo, mantienen una composiciónrelativamente estable que es determinada temporalmente enrespuesta a condiciones más o menos promedio en losambientes acuáticos en los que se encuentran, mientras queanálisis químicos solo reflejan la calidad del agua en elmomento en que se realizó el muestreo, lo cual puede sermuy variable, dependiendo de la hora del día, o latemporada del año (McCafferty, 1998). El uso de planctone insectos acuáticos para monitorear ecosistemas puederepresentar una buena opción para registrar cambiosambientales en el PNLT, como se ha hecho en otrossistemas de agua dulce en Guatemala (Basterrechea, 1986,1988, 1991; Herrera, 1999). Además, estos organismosson importantes por sí mismos. El plancton es uncomponente fundamental de la cadena alimenticia acuática,e insectos acuáticos son el grupo principal de organismos

���������������������� ���������������������� Julio 2000 ���
iniciar un programa de monitoreo de calidad del agua.Aunque varios estudios han considerado los invertebradosacuáticos en Guatemala, incluyendo estudios del RíoPolochic por el departamento de biología de la Universidaddel Valle, y por Basterrechea y Torres (1992), en PNLT, estees el primer estudio en Guatemala que considera lasrelaciones entre insectos y las plantas flotantes Salviniaauriculata. S. auriculata es una planta acuática relativamentecomún y fácil de muestrear en sistemas acuáticos en el PNLT(ver León y Morales Can, este volumen) y por lo tanto sirvecomo un sustrato ideal para colectar insectos acuáticos yconsiderar sus relaciones con el ambiente. El objetivo de este
Tabla 2.1. Resultados limnológicos en cada punto de muestreo (ver texto).
Punto demuestreo
Profundidadde muestreo
(m)
Profundidadmáxima (m)
Visibilidad(m)
Temp.(°C)
pH Oxígeno(mg/L - % desaturación)
ConductividadMS/cm
SP1 2.10 2.20 1.95 27.5 7.15 5.80 - 84.5 0.81SP2 3.30 3.90 2.55 25.9 7.03 6.10 - 78.0 1.02SP3 1.75 5.40 1.75 24.8 6.89 4.72 - 58.0 1.22SP4 2.12 6.60 2.12 27.5 7.33 7.36 - 95.0 1.55SP5 1.75 7.10 1.75 28.3 7.33 7.67 - 110 1.32SP6 1.65 6.10 1.65 29.5 7.20 7.77 - 103 1.98SP7 0.80 4.10 0.80 28.1 7.40 * 1.51SP8 2.60 2.60 1.45 29.5 7.41 * 1.48SP9 2.33 9.00 1.45 29.5 7.43 * 1.42SP10 0.95 7.85 0.95 29.6 7.36 8.09 - 103.7 1.66SP11 3.00 5.10 1.30 29.9 7.47 * 1.44SP12 0.50 3.10 2.50 29.3 7.67 * 1.37E1 1.45 1.45 1.45 29.3 7.76 * 0.63E2 0.85 0.85 0.85 29.8 7.27 * 1.57E3 1.50 1.50 1.30 29.7 7.20 * 1.54E5 0.40 0.40 0.40 29.6 7.02 * 1.62E6 0.70 0.70 0.70 29.1 6.99 * 1.70E7 2.80 2.80 1.30 29.4 7.46 * 1.90E8 3.75 3.75 2.00 29.2 7.50 * 1.81E9 0.20 0.20 0.20 27.3 7.57 * 0.73E10 0.40 0.40 0.40 29.5 7.73 5.88 - 70.0 1.49E11 0.50 0.50 0.50 25.4 8.30 4.24 - 53.5 1.95F1 0.80 0.80 0.70 29.0 8.23 7.42 - 96.9 0.33F2 1.05 1.05 1.0 29.3 7.96 6.36 - 46.5 1.98F5 A 1.05 1.05 1.05 26.5 7.84 0.02 - 0.5 0.92F5 B 0.9 0.9 0.9 26.8 7.84 0.95 - 9.5 0.91F5 C 0.45 0.45 0.45 26.5 7.84 1.45 - 19.3 0.90F5 D 0.30 0.30 0.30 26.3 7.84 1.40 - 17.4 0.89C1 0.40 0.40 0.40 26.3 7.06 0.85 - 8.30 1.27C2 1.85 1.85 1.85 30.0 7.16 8.51 - 106.5 1.06C3 1.50 1.50 1.50 28.7 7.20 6.78 - 91.0 0.63Ca1 1.45 1.45 1.45 25.3 6.84 2.80 - 40.7 1.41Ca2 0.35 0.35 0.35 25.9 6.78 2.66 - 33.5 0.67(* datos no disponibles).
componente del estudio limnológico es examinar lafactibilidad de más estudios intensivos de insectos sobreplantas acuáticas como una herramienta de monitoreo paraPNLT.
�������
Calidad del agua
Se tomaron muestras de agua y sedimento en 33 puntos demuestreo en cinco áreas focales, usualmente cerca de losmárgenes de los cuerpos de agua (ver profundidades demuestras en la Tabla 2.1). Se obtuvieron los valores detemperatura, pH, conductividad eléctrica y de oxígenodisuelto utilizando instrumentos portátiles. La profundidaden cada punto se midió utilizando un medidor de profundi-
que convierten material vegetal a tejido animal enecosistemas de agua dulce. Así, estos organismos forman labase para la existencia de muchos organismos incluyendopeces, anfibios y aves (Merritt y Cummins, 1984).
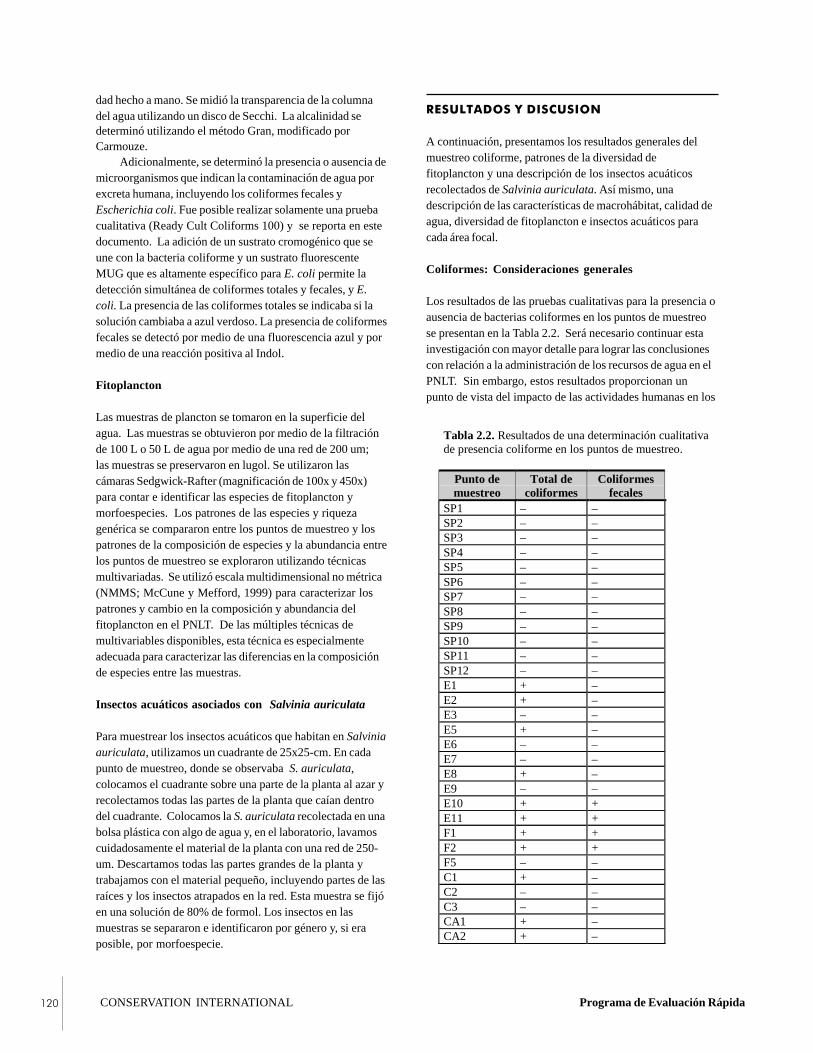
CONSERVATION INTERNATIONAL Programa de Evaluación Rápida���
Adicionalmente, se determinó la presencia o ausencia demicroorganismos que indican la contaminación de agua porexcreta humana, incluyendo los coliformes fecales yEscherichia coli. Fue posible realizar solamente una pruebacualitativa (Ready Cult Coliforms 100) y se reporta en estedocumento. La adición de un sustrato cromogénico que seune con la bacteria coliforme y un sustrato fluorescenteMUG que es altamente específico para E. coli permite ladetección simultánea de coliformes totales y fecales, y E.coli. La presencia de las coliformes totales se indicaba si lasolución cambiaba a azul verdoso. La presencia de coliformesfecales se detectó por medio de una fluorescencia azul y pormedio de una reacción positiva al Indol.
Fitoplancton
Las muestras de plancton se tomaron en la superficie delagua. Las muestras se obtuvieron por medio de la filtraciónde 100 L o 50 L de agua por medio de una red de 200 um;las muestras se preservaron en lugol. Se utilizaron lascámaras Sedgwick-Rafter (magnificación de 100x y 450x)para contar e identificar las especies de fitoplancton ymorfoespecies. Los patrones de las especies y riquezagenérica se compararon entre los puntos de muestreo y lospatrones de la composición de especies y la abundancia entrelos puntos de muestreo se exploraron utilizando técnicasmultivariadas. Se utilizó escala multidimensional no métrica(NMMS; McCune y Mefford, 1999) para caracterizar lospatrones y cambio en la composición y abundancia delfitoplancton en el PNLT. De las múltiples técnicas demultivariables disponibles, esta técnica es especialmenteadecuada para caracterizar las diferencias en la composiciónde especies entre las muestras.
Insectos acuáticos asociados con Salvinia auriculata
Para muestrear los insectos acuáticos que habitan en Salviniaauriculata, utilizamos un cuadrante de 25x25-cm. En cadapunto de muestreo, donde se observaba S. auriculata,colocamos el cuadrante sobre una parte de la planta al azar yrecolectamos todas las partes de la planta que caían dentrodel cuadrante. Colocamos la S. auriculata recolectada en unabolsa plástica con algo de agua y, en el laboratorio, lavamoscuidadosamente el material de la planta con una red de 250-um. Descartamos todas las partes grandes de la planta ytrabajamos con el material pequeño, incluyendo partes de lasraíces y los insectos atrapados en la red. Esta muestra se fijóen una solución de 80% de formol. Los insectos en lasmuestras se separaron e identificaron por género y, si eraposible, por morfoespecie.
���������������������
A continuación, presentamos los resultados generales delmuestreo coliforme, patrones de la diversidad defitoplancton y una descripción de los insectos acuáticosrecolectados de Salvinia auriculata. Así mismo, unadescripción de las características de macrohábitat, calidad deagua, diversidad de fitoplancton e insectos acuáticos paracada área focal.
Coliformes: Consideraciones generales
Los resultados de las pruebas cualitativas para la presencia oausencia de bacterias coliformes en los puntos de muestreose presentan en la Tabla 2.2. Será necesario continuar estainvestigación con mayor detalle para lograr las conclusionescon relación a la administración de los recursos de agua en elPNLT. Sin embargo, estos resultados proporcionan unpunto de vista del impacto de las actividades humanas en los
Tabla 2.2. Resultados de una determinación cualitativade presencia coliforme en los puntos de muestreo.
Punto demuestreo
Total decoliformes
Coliformesfecales
SP1 – –SP2 – –SP3 – –SP4 – –SP5 – –SP6 – –SP7 – –SP8 – –SP9 – –SP10 – –SP11 – –SP12 – –E1 + –E2 + –E3 – –E5 + –E6 – –E7 – –E8 + –E9 – –E10 + +E11 + +F1 + +F2 + +F5 – –C1 + –C2 – –C3 – –CA1 + –CA2 + –
dad hecho a mano. Se midió la transparencia de la columnadel agua utilizando un disco de Secchi. La alcalinidad sedeterminó utilizando el método Gran, modificado porCarmouze.

�������������� ������������� Octubro 2000 ���
cuerpos de agua en el parque. Aproximadamente el 37% delos puntos de muestreo revelaron la presencia de coliformestotales y el 13.3% de los puntos revelaron coliformesfecales. Los patrones de calidad de agua dentro del parque sediscuten posteriormente.
Fitoplancton: Consideraciones generales
Considerando la naturaleza rápida del régimen de muestreo,podemos proporcionar únicamente indicaciones muygenerales en relación a la distribución del fitoplancton enPNLT. La estrategia de muestreo determina en gran parte elsubgrupo de especies registradas en una ubicación enparticular, como la de este estudio, la mayoría de especies defitoplancton registradas fueron características de aguassuperficiales. Sin embargo, en algunos casos, observamosfitoplancton que está íntimamente asociado con el sustrato(béntico), como Pinnularia.
En este estudio se identificaron seis clases, 59 géneros yun total de 71 especies y morfoespecies de fitoplancton(Apéndice 3). No se identificaron dos algas (una clorofita yuna diatomea). Las diatomeas (Bacillariophyceae), seguidopor clorofitas (Clorophyceae) y cianofitos (Cyanophyceae),predominaron en las muestras. Este patrón de abundanciasiguió nuestras expectativas en base a condiciones reportadaspreviamente en estudios realizados en El Petén. Se observa-ron tres clases adicionales de fitoplancton: Euglenophyceae,Dynophyceae y Chrysophyceae. La mayoría defitoplancton registrado aquí es cosmopolita, mientrasque otros son observados con más frecuencia en ambientesespecíficos.
La presencia de determinadas especies de fitoplanctonindicó condiciones ambientales determinadas en algunospuntos de muestreo. Por ejemplo, cianofitas a menudoindican contaminación humana. En la mayoría de los puntosde muestreo ubicados a lo largo del Río San Pedro; RíoEscondido (excepto en los puntos E8 y E9); y lagunas SantaAmelia, Buena Vista, Flor de Luna y La Pista, se presentóMicrocystis aeruginosa lo que indica la presencia decontaminantes asociados con agua. Sin embargo, es impor-tante notar que las densidades de esta cianofita sobrepasó los1000 en organismos/L solamente en SP2, SP7, E10 y C3(refiérase al Apéndice 1). En el resto de los puntos demuestreo, las densidades fueron menores a los 400 organis-mos/L. M. aeruginosa se ha registrado en otros cuerpos deagua dentro de otros departamentos de Guatemala, como enel Lago de Izabal (Basterrechea, 1986) y es la especie defitoplancton más común en el Lago de Amatitlán, el cual eseutrófico (AMSA, 1998). En estos casos, las densidades deM. aeruginosa son mucho mayores que las encontradasdentro del PNLT y es importante mencionar que estoscuerpos de agua existen bajo diferentes condiciones y que semuestrearon en forma diferente de aquellas en el PNLT.
Generalmente existen pocos estudios disponibles para otrascomparaciones. Synedra ulna es otra especie que indicacontaminación y podría proporcionar un buen indicador enfuturos estudios dentro del PNLT. También será útilcombinar el muestreo del fitoplancton con información sobrelas concentraciones de hidrocarbono para proporcionar másvínculos concretos entre los indicadores de contaminación yfitoplancton.
Se registraron otros géneros de fitoplancton en el PNLT,los cuales se han reportado en los lagos de Amatitlán eIzabal, incluyendo Anabaena, Ankistradesmus, Ceratium,Cyclotella, Euglena, Fragilaria, Synedra, Lyngbya,Oscillatoria, Melosira, Merismopedia, Pediastrum,Staurastrum, Scenedesmus, Tabellaria y Volvox. Coelastrumreticulatum y Golenkinia radiata son especies que sereportaron tanto en el Lago de Izabal como en este estudio.La mayoría de los ocho géneros encontrados en el Lago PeténItzá—Cosmarium, Staurastrum, Cocconeis, Dinobryon,Navicula, Agmenellum, Microcystis aeruginosa y Lyngbya—se encontraron en el PNLT (Basterrechea, 1988).
Encontramos una mayor riqueza genérica que laencontrada por Basterrechea y Torres (1992) en el RíoEscondido-Biotopo de la Laguna del Tigre (22 géneros),aunque la temporada y métodos de muestreo fuerondiferentes. Basterrechea y Torres muestrearon áreassolamente en lagunas dentro del biotopo, así como en el LagoPetén Itzá; ellos reportaron 26 géneros en general en estemuestreo: Petén Itzá (7 géneros), La Carpa (3 géneros),Pozo Xan (7 géneros), El Toro (7 géneros) y El Remate (12géneros). Sandoval (1997) reportó 18 géneros defitoplancton en el Lago Petén Itzá. La mayoría de estosgéneros se identificaron en el PNLT. En algunos puntos,Sandoval reportó el dominio de bacilariofitas, las cualesfueron comunes en este estudio.
SP1
SP2
SP3
SP4
SP5
SP6
SP7
SP10SP11
SP12
E1E2
E3
E5
E6
E7
E8
E10
E11
F1
F2
F5C1
C2
C3
CA1CA2
-1.5
-1.5
-0.5 0.5 1.5
-0.5
0.5
1.5
Eje 1
Eje
2 SP1
SP2
SP3
SP4
SP5
SP6
SP7
SP10SP11
SP12
E1E2
E3
E5
E6
E7
E8
E10
E11
F1
F2
F5C1
C2
C3
CA1CA2
-1.5
-1.5
-0.5 0.5 1.5
-0.5
0.5
1.5
Figura 2.1. Una escala no métrica multidimensionalordenando puntos de muestra en base a las densidades defitoplancton (ver texto).

CONSERVATION INTERNATIONAL Programa de Evaluación Rápida���
Los dos primeros ejes del orden NMMS (Figura 2.1)explicaron el 58.8% de la variación en la matriz original condistancia reducida y los ejes fueron significativamentediferentes de aquéllos generados por datos al azar(permutaciones de Monte Carlo: P=0.035). El orden indicaque la composición de fitoplancton de los Ríos San Pedro yEscondido fueron ampliamente similares. Todos, excepto unpunto de muestreo (C3) en el área focal de Río Chocop/RíoCandelaria fueron diferentes a los otros. Esta diferencia en lacomposición se relaciona con la riqueza generalmente baja entodas las muestras de Chocop/Candelaria excepto C3, queera relativamente rica en especies (Apéndice 3). A pesar dela similitud ecológica entre las lagunas Guayacán (C2) y LaPista (C3) (ver a continuación), así como su proximidadespacial, estas lagunas albergaban distintas floras defitoplancton. Los índices del eje NMMS se encontraban endecadencia en las variables ambientales de la Tabla 2.1 paraexplorar qué variables ambientales fueron las mejor relaciona-das con patrones de composición de plancton. El eje 1 indicacorrelatividad positiva solamente con pH (R2=0.14; F=4.13;df=1, 25; P=0.053) y el eje 2 indica correlatividad positivacon la conductividad (R2=0.15; F=4.46; df=1, 25; P=0.045).Ninguna de las variables ambientales pudo explicar en mejorforma la variación en la composición de especies.
En la mayoría de los casos, las densidades defitoplancton obtenidas no fueron particularmente altos(Apéndice 4). Será importante continuar monitoreando estosy otros sitios dentro del PNLT para evaluar los cambios enlas cargas nutrientes y otros patrones fisico-químicos y susefectos sobre la productividad del fitoplancton.
Insectos acuáticos asociados con Salvinia auriculata
S. auriculata fue común solamente en el área focal del RíoSan Pedro para el muestreo de insectos. Los insectos semuestrearon del Arroyo Yalá (SP1), Paso Caballos (SP2), LaPista (SP3), El Sibalito (SP4), El Caracol (SP6), Río San Juan(SP7) y La Caleta (SP8) (ver Apéndice 5). En estasmuestras, identificamos 5 órdenes, 26 familias y 44morfoespecies. El orden con el mayor número de familiasrepresentadas fue Coleóptera (10) y Ephemeróptera fuerepresentada por el menor número (2; Figura 2.2).
Es importante mencionar que debido a que las plantasson móviles, ocasionalmente existen conexiones entre plantasacuáticas y las orillas; por lo tanto, muchas de las especiesque habitan en las plantas acuáticas flotantes tambiénpueden ser semiacuáticas o terrestres. Dichos procesospueden explicar la presencia de algunos Coleópteros comolos Scolítidos. A pesar de la duración limitada y la extensióndel muestreo, la riqueza de las especies de insectos en S.auriculata fue considerable e indica que se garanticen másestudios descriptivos intensos y monitoreo de este sistema.
Área focal del Río San PedroClasificación de macrohábitatsEn las 12 estaciones de muestreo a lo largo del Río SanPedro, se encontraron cinco tipos de macrohábitats diferen-tes (refiérase al Apéndice 1).
Figura 2.2. Patrones de riqueza de órdenes de insectos que habitan la Salvinia auriculata en muestras del área focal del Río SanPedro del PNLT.
0
2
4
6
8
Hemipt
era
Odona
ta
Ephem
erop
tera
Coleop
tera
Dipter
a
Orders
Mo
rph
o-s
pec
ies
SP1 Arroyo Yala
SP2 Paso Caballos
SP3 La Pista
SP4 El Sibalito
SP6 Caracol
SP7 San Juan
SP8 La CaletaHemíptera Odonata Efemeróptera Celeóptera Díptera
Ordenes
Mor
fo e
spec
ies
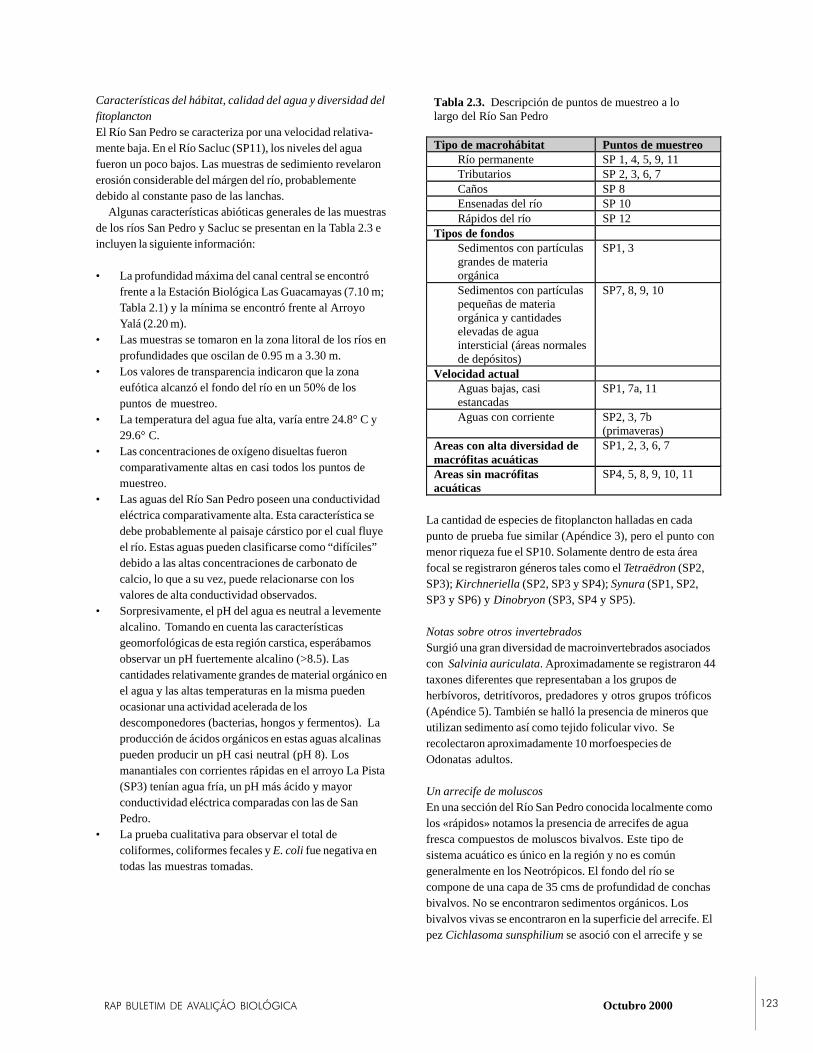
�������������� ������������� Octubro 2000 ���
Características del hábitat, calidad del agua y diversidad delfitoplanctonEl Río San Pedro se caracteriza por una velocidad relativa-mente baja. En el Río Sacluc (SP11), los niveles del aguafueron un poco bajos. Las muestras de sedimiento revelaronerosión considerable del márgen del río, probablementedebido al constante paso de las lanchas. Algunas características abióticas generales de las muestrasde los ríos San Pedro y Sacluc se presentan en la Tabla 2.3 eincluyen la siguiente información:
• La profundidad máxima del canal central se encontrófrente a la Estación Biológica Las Guacamayas (7.10 m;Tabla 2.1) y la mínima se encontró frente al ArroyoYalá (2.20 m).
• Las muestras se tomaron en la zona litoral de los ríos enprofundidades que oscilan de 0.95 m a 3.30 m.
• Los valores de transparencia indicaron que la zonaeufótica alcanzó el fondo del río en un 50% de lospuntos de muestreo.
• La temperatura del agua fue alta, varía entre 24.8° C y29.6° C.
• Las concentraciones de oxígeno disueltas fueroncomparativamente altas en casi todos los puntos demuestreo.
• Las aguas del Río San Pedro poseen una conductividadeléctrica comparativamente alta. Esta característica sedebe probablemente al paisaje cárstico por el cual fluyeel río. Estas aguas pueden clasificarse como “difíciles”debido a las altas concentraciones de carbonato decalcio, lo que a su vez, puede relacionarse con losvalores de alta conductividad observados.
• Sorpresivamente, el pH del agua es neutral a levementealcalino. Tomando en cuenta las característicasgeomorfológicas de esta región carstica, esperábamosobservar un pH fuertemente alcalino (>8.5). Lascantidades relativamente grandes de material orgánico enel agua y las altas temperaturas en la misma puedenocasionar una actividad acelerada de losdescomponedores (bacterias, hongos y fermentos). Laproducción de ácidos orgánicos en estas aguas alcalinaspueden producir un pH casi neutral (pH 8). Losmanantiales con corrientes rápidas en el arroyo La Pista(SP3) tenían agua fría, un pH más ácido y mayorconductividad eléctrica comparadas con las de SanPedro.
• La prueba cualitativa para observar el total decoliformes, coliformes fecales y E. coli fue negativa entodas las muestras tomadas.
La cantidad de especies de fitoplancton halladas en cadapunto de prueba fue similar (Apéndice 3), pero el punto conmenor riqueza fue el SP10. Solamente dentro de esta áreafocal se registraron géneros tales como el Tetraëdron (SP2,SP3); Kirchneriella (SP2, SP3 y SP4); Synura (SP1, SP2,SP3 y SP6) y Dinobryon (SP3, SP4 y SP5).
Notas sobre otros invertebradosSurgió una gran diversidad de macroinvertebrados asociadoscon Salvinia auriculata. Aproximadamente se registraron 44taxones diferentes que representaban a los grupos deherbívoros, detritívoros, predadores y otros grupos tróficos(Apéndice 5). También se halló la presencia de mineros queutilizan sedimento así como tejido folicular vivo. Serecolectaron aproximadamente 10 morfoespecies deOdonatas adultos.
Un arrecife de moluscosEn una sección del Río San Pedro conocida localmente comolos «rápidos» notamos la presencia de arrecifes de aguafresca compuestos de moluscos bivalvos. Este tipo desistema acuático es único en la región y no es comúngeneralmente en los Neotrópicos. El fondo del río secompone de una capa de 35 cms de profundidad de conchasbivalvos. No se encontraron sedimentos orgánicos. Losbivalvos vivas se encontraron en la superficie del arrecife. Elpez Cichlasoma sunsphilium se asoció con el arrecife y se
Tabla 2.3. Descripción de puntos de muestreo a lolargo del Río San Pedro
Tipo de macrohábitat Puntos de muestreoRío permanente SP 1, 4, 5, 9, 11Tributarios SP 2, 3, 6, 7Caños SP 8Ensenadas del río SP 10Rápidos del río SP 12
Tipos de fondosSedimentos con partículasgrandes de materiaorgánica
SP1, 3
Sedimentos con partículaspequeñas de materiaorgánica y cantidadeselevadas de aguaintersticial (áreas normalesde depósitos)
SP7, 8, 9, 10
Velocidad actualAguas bajas, casiestancadas
SP1, 7a, 11
Aguas con corriente SP2, 3, 7b(primaveras)
Areas con alta diversidad demacrófitas acuáticas
SP1, 2, 3, 6, 7
Areas sin macrófitasacuáticas
SP4, 5, 8, 9, 10, 11

CONSERVATION INTERNATIONAL Programa de Evaluación Rápida���
encontró que se alimentaba del perifiton que crecía en lasconchas. Dentro de las conchas se encontraron diferentesninfas de Ephemeróptera (Baetidae) y Trichóptera, así comootros bivalvos, gasterópodos y platelmintos. Concluímosentonces que estas conchas son microhábitats importantespara los invertebrados que habitan el fondo del río en estaárea.
En una extensión del río con corriente baja, se observa-ron macrófitas acuáticas (Nymphaea ampla y Valisneriaamericana), que formaban otro microhábitat para losinvertebrados. Dentro de esa extensión se encontró unaacumulación de material orgánico fino. La prueba cualitativapara los coliformes fecales y E. coli fue positiva, quecoincidía con los asentamientos humanos que se encontrabancerca de la playa. Adicionalmente, identificamos la mayorriqueza de fitoplancton en este punto (44 especies), siendomayores las densidades en las clases de Bacillariophyceae,seguidas por la Cianophyceae. Este fue uno de los pocospuntos en que se encontró Tetraëdron (Apéndices 3, 4).
Area focal del Río EscondidoClasificación de macrohábitatsEn las 10 estaciones de muestreo a lo largo del Río Escondi-do (con prefijo E), se encontraron cuatro tipos demacrohábitats. (Tabla 2.4)
Tabla 2.4. Descripción de puntos de muestreo a lolargo del Río Escondido
Tipo de macrohábitat Puntos de muestraRío permanente E3, 8, 11Ensenadas del río E1, 2Río efímero (noprofundo)
E10
Lagunas oxbow E5, 6, 7, 9Tipos de fondos
Sedimentos conpartículas grandes dematerial orgánico
Ninguno
Sedimentos conpartículas pequeñas dematerial orgánico ycantidades elevadas deagua intersticial (áreastípicas de deposición)
Todos excepto E11
Fondo rocoso E11Velocidad de la corriente
Aguas lentas, casiestancadas
E1, 2, 7, 8, 10
Aguas con corriente E3, 9, 11Areas con una altadiversidad de macrofitosacuáticos
E3, 8, 10
Areas sin macrofitosacuáticos
El resto
Características del hábitat, calidad del agua y diversidad delfitoplanctonEl Río Escondido tiene bancos relativamente empinados y unmargen bastante estrecho. Las playas se componen en sumayoría de bosque, bosque alterado y sibal. Una gransección del sibal estaba siendo quemada durante nuestrainvestigación. El bosque de la estación que se encontraba másal noreste, Punto Icaco (E8) tenía un bosque de doselrelativamente cerrado, diferente en carácter que las partesrestantes del Río Escondido.
El Río Escondido termina en un canal bajo y sistema deciénagas, sobre las cuales se encuentran seccionesrelativamente profundas que se ensanchan y estrechanregularmente. El fondo es principalmente barro suave, peroen el Punto Icaco se encontraron muchos escombros, troncosy hojarasca. Las lagunas del recodo y ramificaciones muertascomprenden muchos hábitats que se encuentran a los ladosdel Río Escondido, con frecuencia a través de los hábitatssibales y no en el bosque. Estos hábitats en la actualidad noson profundos, tienen barro bastante suave y fondos debarro/marga. Las características del área del Río Escondido seresumen en la Tabla 2.4 e incluyen lo siguiente:
• Las profundidades menores se registraron en las lagunasy bahías, y las de mayor profundidad en el río, en E8.
• La transparencia alcanzó el fondo en todos los puntosde prueba.
• En general, las aguas de este lugar tenían temperaturas
altas (desde 26° C hasta 29.8° C) y los valores de pHfueron desde neutrales hasta levemente alcalinos (6.99 a7.76).
• Los sedimentos tienen altos niveles de materia orgánicay agua intersticial.
• La conductividad eléctrica en el canal principal del RíoEscondido fue baja en 1 MS/cm. Por otro lado, lasensenadas tienen valores de conductividad muy altos.
• La presencia de coliformes totales se registró en E1, E2,E5 y E8 y la presencia de coliformes totales y fecales yE. coli se registró en E10 y E11. No se detectó el origende la contaminación fecal en otros puntos.
• La mayor riqueza del fitoplancton se registró en lospuntos E1 (38 spp.) y E5 (35 spp.). Llovió durante elmuestreo de este río, incrementando su corriente, asíque es posible que el muestreo del fitoplancton hayaafectado la disolución. Esto pudo haber ocasionado unareducción general en la riqueza de especies cuando secomparó con las muestras tomadas del San Pedro.Algunos géneros de fitoplancton registrados aquí, comoCosmarium (E1, E2 y E6) y Mallomonas (E1, E2, E5,E7 y E8), no se encontraron en el San Pedro.
Area focal de Flor de Luna
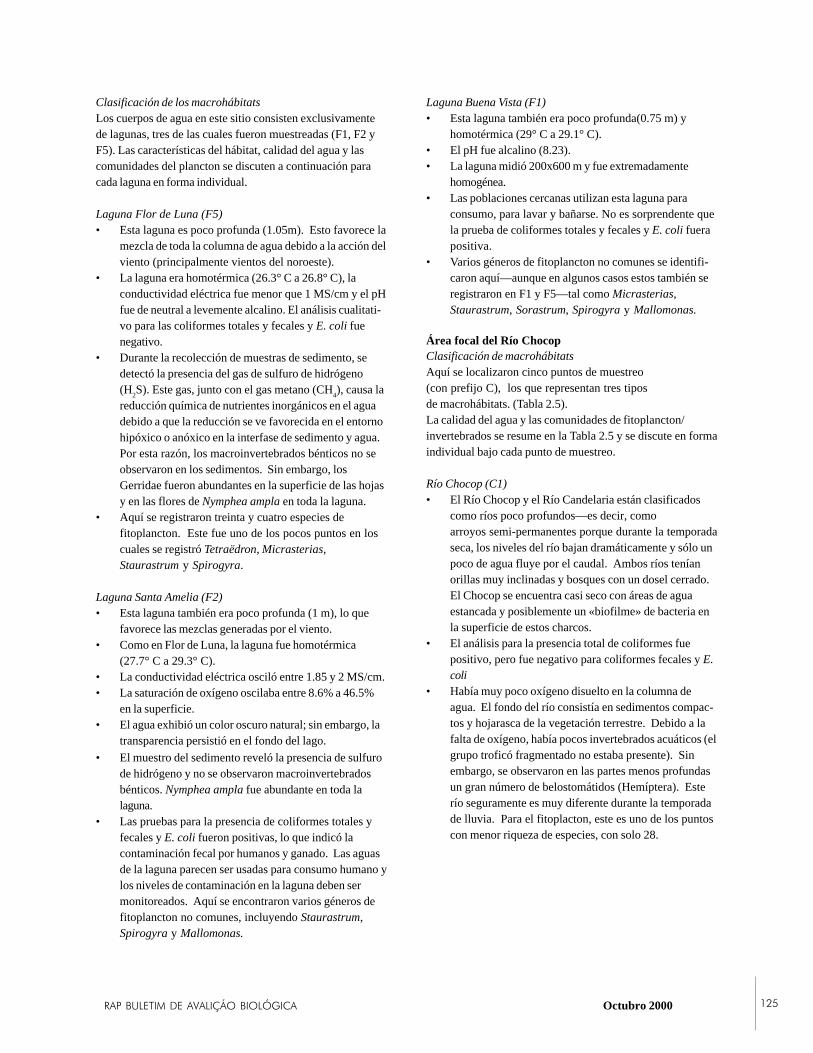
�������������� ������������� Octubro 2000 ���
• El muestro del sedimento reveló la presencia de sulfurode hidrógeno y no se observaron macroinvertebradosbénticos. Nymphea ampla fue abundante en toda lalaguna.
• Las pruebas para la presencia de coliformes totales yfecales y E. coli fueron positivas, lo que indicó lacontaminación fecal por humanos y ganado. Las aguasde la laguna parecen ser usadas para consumo humano ylos niveles de contaminación en la laguna deben sermonitoreados. Aquí se encontraron varios géneros defitoplancton no comunes, incluyendo Staurastrum,Spirogyra y Mallomonas.
Clasificación de los macrohábitatsLos cuerpos de agua en este sitio consisten exclusivamentede lagunas, tres de las cuales fueron muestreadas (F1, F2 yF5). Las características del hábitat, calidad del agua y lascomunidades del plancton se discuten a continuación paracada laguna en forma individual.
Laguna Flor de Luna (F5)• Esta laguna es poco profunda (1.05m). Esto favorece la
mezcla de toda la columna de agua debido a la acción delviento (principalmente vientos del noroeste).
• La laguna era homotérmica (26.3° C a 26.8° C), laconductividad eléctrica fue menor que 1 MS/cm y el pHfue de neutral a levemente alcalino. El análisis cualitati-vo para las coliformes totales y fecales y E. coli fuenegativo.
• Durante la recolección de muestras de sedimento, sedetectó la presencia del gas de sulfuro de hidrógeno(H
2S). Este gas, junto con el gas metano (CH
4), causa la
reducción química de nutrientes inorgánicos en el aguadebido a que la reducción se ve favorecida en el entornohipóxico o anóxico en la interfase de sedimento y agua.Por esta razón, los macroinvertebrados bénticos no seobservaron en los sedimentos. Sin embargo, losGerridae fueron abundantes en la superficie de las hojasy en las flores de Nymphea ampla en toda la laguna.
• Aquí se registraron treinta y cuatro especies defitoplancton. Este fue uno de los pocos puntos en loscuales se registró Tetraëdron, Micrasterias,Staurastrum y Spirogyra.
Laguna Santa Amelia (F2)• Esta laguna también era poco profunda (1 m), lo que
favorece las mezclas generadas por el viento.• Como en Flor de Luna, la laguna fue homotérmica
(27.7° C a 29.3° C).• La conductividad eléctrica osciló entre 1.85 y 2 MS/cm.• La saturación de oxígeno oscilaba entre 8.6% a 46.5%
en la superficie.• El agua exhibió un color oscuro natural; sin embargo, la
transparencia persistió en el fondo del lago.
Laguna Buena Vista (F1)• Esta laguna también era poco profunda(0.75 m) y
homotérmica (29° C a 29.1° C).• El pH fue alcalino (8.23).• La laguna midió 200x600 m y fue extremadamente
homogénea.• Las poblaciones cercanas utilizan esta laguna para
consumo, para lavar y bañarse. No es sorprendente quela prueba de coliformes totales y fecales y E. coli fuerapositiva.
• Varios géneros de fitoplancton no comunes se identifi-caron aquí—aunque en algunos casos estos también seregistraron en F1 y F5—tal como Micrasterias,Staurastrum, Sorastrum, Spirogyra y Mallomonas.
Área focal del Río ChocopClasificación de macrohábitatsAquí se localizaron cinco puntos de muestreo(con prefijo C), los que representan tres tiposde macrohábitats. (Tabla 2.5).La calidad del agua y las comunidades de fitoplancton/invertebrados se resume en la Tabla 2.5 y se discute en formaindividual bajo cada punto de muestreo.
Río Chocop (C1)• El Río Chocop y el Río Candelaria están clasificados
como ríos poco profundos—es decir, comoarroyos semi-permanentes porque durante la temporadaseca, los niveles del río bajan dramáticamente y sólo unpoco de agua fluye por el caudal. Ambos ríos teníanorillas muy inclinadas y bosques con un dosel cerrado.El Chocop se encuentra casi seco con áreas de aguaestancada y posiblemente un «biofilme» de bacteria enla superficie de estos charcos.
• El análisis para la presencia total de coliformes fuepositivo, pero fue negativo para coliformes fecales y E.coli
• Había muy poco oxígeno disuelto en la columna deagua. El fondo del río consistía en sedimentos compac-tos y hojarasca de la vegetación terrestre. Debido a lafalta de oxígeno, había pocos invertebrados acuáticos (elgrupo troficó fragmentado no estaba presente). Sinembargo, se observaron en las partes menos profundasun gran número de belostomátidos (Hemíptera). Esterío seguramente es muy diferente durante la temporadade lluvia. Para el fitoplacton, este es uno de los puntoscon menor riqueza de especies, con solo 28.
CONSERVATION INTERNATIONAL Programa de Evaluación Rápida���
Lagunas la Pista (C3) y Guayacán (C2)• Estas lagunas son ecológicamente similares y por lo
tanto se tratan juntas. Guayacán tenía algunas piedrascalizas en su margen y agua clara (>2m visibilidad)sobre sedimentos suaves. Tenía un margen con guamil ymárgenes de bosque. Habían muchas posas pequeñasen el bosque asociado con esta laguna que puedepresentar buenas condiciones.
• El viento probablemente mezcla toda la columna deagua en ambas lagunas. Como consecuencia, las lagunasfueron homotérmicas, en el fondo se encontraba oxígenodisuelto (>86% saturado) y la conductividad fue igualen toda la columna de agua.
• La prueba de los coliformes totales, coliformes fecales yE. coli fue negativa.
• A pesar de la presencia de oxígeno disuelto en lascolumnas de agua de ambas lagunas, detectamos unfuerte olor de sulfuro de hidrógeno en las muestras desedimento. Estas observaciones sugieren una resisten-cia de una microestratificación de oxígeno en la interfasede agua y sedimento. Como consecuencia, esperamosausencia de macroinvertebrados en ambas lagunas.
• Guayacán albergó el menor número de género defitoplancton en el estudio (19), posiblemente debido alestado oligotrófico de esta laguna. La laguna La Pistamostró una riqueza mayor de fitoplancton.
Río Candelaria (Ca1, 2)• En este río los dos puntos de muestra fueron un poco
diferentes. En Cal, el río fue profundo y tenía pocacorriente. Generalmente, las condiciones fueronsimilares a aquellas encontradas en Río Chocop.
• Se encontró oxígeno disuelto en el fondo del río, aunqueen bajas concentraciones. El material vegetal fueabundante en el fondo y se detectó la presencia de gasde hidrógeno de sulfato.
• La prueba para coliformes totales fue positiva y paracoliformes fecales y E. coli, la prueba fue negativa. Aquíse registraron veintisiete especies de fitoplancton.
• El río en Ca2 fue menos profundo (35 cm), tenía unacorriente más rápida, y había oxígeno en el fondo.
• Los valores de conductividad fueron similares a los deCal.
Tabla 2.5. Descripción de puntos de muestreoa lo largo del Río Chocop
Tipo de macrohábitat Puntos demuestra
Ríos enfímeros (pocoprofundos) con fondooscuro
C1, Ca1
Ríos permanentes confondo rocoso
Ca2
Lagunas C2, 3
• La prueba de coliformes totales y fecales y E. coli fuenegativa.
• En este lugar se registraron veintinueve especies defitoplancton, de tal manera que ambos sitios deCandelaria fueron intermedios en riqueza comparadoscon los otros lugares. Se observaron diferentes grupostróficos de macroinvertebrados bénticos en ambospuntos, incluyendo gasterópodos, herbívoros,efemerópteros y carnívoros odonatos.
��������������� ��������������
Respecto a la conservación y manejo de los ecosistemasacuáticos del parque, se ofrecen dos recomendaciones:
• Existe una urgente necesidad de conservar los rápidosdel Río San Pedro. Estos rápidos poseen un sistemade arrecife de agua dulce único, que también podríarealizar una importante función al filtrar las partículassuspendidas del agua.
• Muchas lagunas y corrientes dentro del parque seencuentran poco contaminadas, y se debería tomaracciones para asegurar su integridad.
Respecto de estudios futuros y el monitoreo de los sistemasacuáticos dentro de la región, se ofrecen cinco recomendacio-nes:
• Los estudios futuros se deben ejecutar a nivel decuenca y se deben conducir por períodos más extensos,acompañando la variación entre las estacioneslluviosa y seca. Se deben tomar muestras en diferen-tes profundidades y se deben considerar nutrientestotales y disueltos.
• Los efectos de las actividades humanas sobre el paisaje,como la agricultura y el derrame de químicos y basura,debe evaluarse a nivel de la cuenca.
• Para el monitoreo del fitoplancton sería útil estandarizarlas horas del muestreo entre diferentes puntos demuestra para evitar los efectos de la variación lumínicaen el movimiento de plancton en la columna de agua.Esto reduciría la subjetividad en las comparaciones entremuestras.
• Las densidades de la bacteria coliforme debe sermonitoreada y cuantificada para rastrear exactamente elgrado de contaminación fecal en el parque e identificaraquellas áreas que son fuente de contaminación en elparque.
�������������� ������������� Octubro 2000 ���
UNESCO. 1971. Memorias del Seminario sobreIndicadores Biológicos del Plankton. Oficina Regionalde Ciencia y Tecnología para América Latina y elCaribe, Montevideo, Uruguay.
• Necesita iniciarse un monitoreo más intenso depoblaciones de insectos acuáticos y las muestras debenser tomadas en diferentes épocas del año para compren-der los efectos de la variación temporal natural y cómoesto puede interacturar con la variación espacialocasionada por los procesos naturales yantropogénicos.
���� ��� �� ������
AMSA. 1998. Listado de Géneros Determinados de Algasen el Lago de Amatitlan. Secretaría de la República deGuatemala.
Basterrechea, M. 1986. Limnología del Lago de Amatitlán.Revista de Biología Brasileira 46: 461-468.
Basterrechea, M. 1988. Limnología del Lago Petén Itzá,Guatemala. Revista de Biología Tropical 35: 123-127.
Basterrechea, M. 1991. Evaluación del Impacto Ambientalde la Exploración Sísmica en la Cuenca del Lago deIzabal. Guatemala.
Basterrechea, M. y M. Torres. 1992. Hidrología yLimnología de los Humedales del Biotopo RíoEscondido-Laguna del Tigre, Petén-Guatemala.Centro de Estudios Conservacionistas y FundaciónMario Dary, Guatemala.
Herrera, K. 1999. Indicadores de la calidad del agua del RíoPolochic y de la integridad biológica del Lago deIzabal. Master’s thesis. Departamento de Biología,Universidad del Valle de Guatemala.
McCafferty, P. 1998. Aquatic Entomology. Jones andBartlett Publishers, Sudbury, MA, USA.
McCune, B. y M. J. Mefford. 1999. PC-ORD. Multivari-ate Analysis of Ecological Data, version 4.0. MjMSoftware Design, Gleneden Beach, OR, USA.
Merritt, R. W. y K. W. Cummins. 1984. An Introduction tothe Aquatic Insects of North America, 2nd ed. Kendall-Hunt Publishing Company, IA, USA.
Sandoval, K. 1997. Fitoplancton como indicadores decontaminación en tres regiones del Lago Petén Iztá.Informe final, Programa E.D.C. Escuela de Biología,Universidad de San Carlos de Guatemala.

CONSERVATION INTERNATIONAL Programa de Evaluación Rápida���
������
• Una flora vascular de más de 130 especies, 120 génerosy 67 familias se registró en y a un lado de los hábitatsacuáticos del Parque Nacional Laguna del Tigre (PNLT).Esta flora es similar en composición a la de las áreasvecinas de la Península de Yucatán, pero será necesarioexpandir el estudio para proporcionar comparacionesmás precisas.
• La vegetación del PNLT incluye una diversidad decomunidades como los bosques ribereños grandes omedianos, bosques bajos, la sabana de palma inundaday el resto del mangle.
• Una población de Vallisneria americana asociada conbivalvos de los rápidos del arrecife fue única. Otro sitiocon depósitos menores de bivalvos del Río Escondidofue especialmente rico en especies. Las inundaciones yerosión ocasionan que las comunidades sean altamentedinámicas.
• Los disturbios antropogénicos como el fuego, estánalterando el hábitat natural y la composición de lavegetación en el PNLT.
��� ��������
Guatemala es uno de los pocos países de Centroamérica quetiene una flora ampliamente estudiada y un largo historial decolección botánica (e.g. Standley, 1924-1964; Williams,1966-1975). Sin embargo, pocos estudios han analizadoespecíficamente la flora vascular acuática (por ejemplo,de Poll, 1983).
Para El Petén guatemalteco, los primeros estudiosbotánicos se realizaron en la primera parte del siglo XX yestaban asociados con exploraciones arqueológicas (Lundell,1937). Por esta razón, el interés en comprender los cambiosculturales del pasado se ha ligado a interpretaciones en loscambios de la cubierta forestal (Deevey et al., 1979; Islebeet al., 1996). Estos estudios interpretativos de cambioshistóricos, sociales y ambientales se basan en estudiospaleolimnológicos. Sin embargo, este trabajo ayuda un pocoa ampliar nuestro conocimiento sobre la macroflora acuáticaactual en la región.
La heterogeneidad de la vegetación del bosque terrestredel Petén no se cuestiona (Deevey et al., 1979). Lasinundaciones debido a la estación lluviosa, y las alteracionesque producen también crean una gran heterogeneidad en laexpresión de elementos florísticos de las comunidades deplantas acuáticas.
El Parque Nacional Laguna del Tigre (PNLT) se asociacon la presencia de áreas extensas de ciénagas, ubicadas entreun amplio rango de tipos de hábitats acuáticos (Tabla 3.1) enlas cuales las macrófitas constituyen los elementos mássobresalientes. Nuestro objetivo es describir las relacionesentre la flora acuática y estos macrohábitats y describir lascomunidades formadas dentro de ellos.
�������
Las macrófitas acuáticas se describieron en este estudiocomo plantas vasculares que se encuentran permanentementesumergidas en agua (verdaderas acuáticas) y plantas conraíces en suelos supersaturados o inundados, con el resto dela planta emergente (anfibias).
��������� )
������������������������������� ������������� ������������������������ �����������������
Blanca León y Julio Morales Can
���������������������� ���������������������� Julio 2000 ���
Las definiciones de los macrohábitats se basaron en lahidrología de los puntos de muestreo (ver Herrera et al., estevolumen). Respecto a los macrófitas acuáticos, sereconocieron seis hábitats: ríos, corrientes, lagunas, lagunasde recodo, caños y rápidos (arrecifes de agua dulce). Deéstos, el macrohábitat del río se subdividió en las aguas(profundas) de exhibición permanente, agua efímeras (noprofunda) y rápidos, dependiendo del volumen de agua ytipo de sustrato. Estos rápidos constituyen una parte dehábitats permanentes de río.
Los tipos de vegetación acuática se clasificaron porfisionomía y se subdividieron según las asociacionesobservadas dentro de los transectos. Se reconocieron dostipos de vegetación en este estudio: bosques ribereños,mientras las plantas herbáceas caracterizan a las ciénagas.Los nombres utilizados para las asociaciones emplearonterminología local reconocida en estudios anteriores(Morales, sin publicar).
Establecimos transectos temporales entre los dos tiposde vegetación. A lo largo de cada transecto, registramos lacomposición de macrófitas encontradas en cuadrantes de50x50 cms. En ambientes lóticos (es decir, agua corriente) loscuadrantes se colocaron aleatoriamente a lo largo del bancodel río a intervalos de 10 metros. En ambientes lénticos (esdecir, aguas estancadas), los cuadrantes se colocaron a lolargo del diámetro máximo del cuerpo del agua a intervalossimilares. Por cada cuadrante, registramos la profundidad delsustrato, la distancia hasta la playa y las especies de plantasvisibles dentro de dos metros del cuadrante. Para podermuestrear el bosque ribereño, se establecieron tres transectos(100 m de longitud) a lo largo del banco del río, cada unoseparado por 100 m. A lo largo de los tres transectos seregistraron todos individuos de plantas leñosas que teníanmás de 50% de su masa de raíz dentro del agua.
Se recolectaron los especímenes de prueba de todas lasplantas vasculares fértiles que registramos. Las plantas seprepararon en una prensa de plantas y posteriormente secolocaron en alcohol para prepararlas y finalmente secarlas.Se realizaron identificaciones utilizando colecciones hechasen el Field Museum de Chicago, USA.
���������������������
Composición de fauna del PNLT
En las ciénagas, bosques ribereños y bosques inundadosdebido a la estación se registraron un total de 67 familias,120 géneros y más de 130 especies de plantas vasculares(Apéndice 6). De éstas, 33 familias incluyen especiesacuáticas y/o anfibias, y las otras 34 están representadas porespecies terrestres, tanto de leñosas como herbáceas,asimismo, las epífitas pueden tolerar cortos períodos deinundaciones.
Entre las familias más diversas se encontrabanCyperaceae y Fabaceae, de las cuales ambas contienenespecies terrestres y anfibias. Cyperaceae y las leguminosastambién contienen los elementos más sobresalientes tanto delas ciénagas como de los bosques ribereños. Entre lasCyperaceae, Cladium jamaicense (sibal) es el elementodominante del paisaje de las ciénagas. Esta planta formacolonias extensas y densas y su base forma un sustrato quefavorece el establecimiento de semillas de plantas terrestres,como las de la familia de las Asclepiadaceae, Cucurbitaceae,y Passifloraceae. Entre las hortalizas, Mimosa pigra yHaemotoxylum compechianum (tinto) son componentesdominantes del bosque ribereño. Entre otras familiasdominantes se incluyen las palmas (Arecaceae) y los llanos(Poaceae). Ambos son importantes en hábitats tantoterrestres como acuáticos.
La composición de las plantas acuáticas y anfibiasrefleja vínculos con la flora mexicana (Lot y Novelo, 1990;Martínez y Novelo, 1993); no hay taxa que sean endémicasen el área de estudio. Pocas especies se conocen solamentede Centroamérica, incluyendo la Cabomba palaeformis y laHaematoxylum compechianum. El género más vistoso de lasplantas acuáticas fue Utricularia y el más vistoso de lasplantas anfibias fue la Elocharis.
Cincuenta de las especies registradas en el parque sonacuáticas o anfibias (Apéndice 6). Nueve especies poseenflores que son estrictamente acuáticas: Brassenia schreberi,Cabomba palaeformis, Najas wrightiana, Nymphaea ampla,Pistia stratiotes, Utricularia foliosa, U. gibba, U. sp., yVallisneria americana. Estas especies representan a seisfamilias: Araceae, Cabombaceae, Hydrocharitaceae,Lentibulariaceae, Najadaceae y Nymphaeaceae. Dos de éstaseran plantas flotantes: Salvinia auriculata y S. minima. Entodo el estado de Campeche, y en la Península de Yucatán,Lot et al. (1993) mencionó 33 plantas con floresestrictamente acuáticas. Es posible que no hayamosregistrado varias familias de las que existen en el parque,incluyendo Ceratophyllaceae, Lemnaceae, Menyanthaceae ySphenocleaceae.
Tipos de vegetación
Las planicies de la Península de Yucatán, particularmente los“humedales de bosque” tienen ricas ciénagas (Lot y Novelo,1990). Estos humedales en bosque se dan como un mosaicocon ciénagas (humedales herbáceos) tanto en el parque comoen el biotopo. La abundancia de cada uno de estos tipos devegetación varía, en parte, debido a procesos como lavariación de las estaciones en cuanto a la precipitación quemodifica la saturación del sustrato, así como la intervenciónhumana. Las propiedades hidrológicas del área juegan, sinlugar a dudas un rol importante en el mantenimiento delmosaico. (Lugo et al., 1990).
CONSERVATION INTERNATIONAL Programa de Evaluación Rápida���
La maleza de palmas inundadas se desarrolla en formasobresaliente en la parte central y alta del Río Escondido. El“tasistal” describe una de sus asociaciones principales -aquélla en la cual Acoelorraphe wrightii es dominante y esacompañada por hierbas tales como Cladium jamaicense,Osmunda regalis en su variedad spectabilis, o bien árbolesde Pachira aquatica.
El mangle no se desarrolló en el área de estudio.Solamente pocos individuos del Rhizophora mangleocupan las márgenes del Río San Pedro y están rodeadas porun ́ sibal´ alterado. Esta población aislada es la forma máscontinental conocida en la península (Nicholas Brokaw, pers.comm.). Se localiza fuera del parque y consecuentemente norecibe ninguna protección oficial.
Todos los tipos de vegetación están sujetos a serquemados, ya sea directamente a través del uso de fuego parala caza de venados o indirectamente a través de incendios queescapan de los lotes adyacentes, en los que se practica elmétodo corte y quema (la roza). Fue difícil evaluar losefectos del fuego en la ciénaga y su impacto sobre labiodiversidad en este estudio a corto plazo. El SP7 habíasido quemado un año antes del estudio (Tabla 3.1). En elanterior, registramos 17 especies; en este último, registramos19 especies. Ambas compartían la mayoría de sus especies.Sería útil registrar el impacto de estas alteraciones duranteperíodos más largos. Igualmente interesante sería un estudioen el que se documentara la probabilidad de supervivencia deciertas especies de plantas cuando se pierden sus partesaéreas durante los incendios. Observamos que en segmentosparcialmente quemados de ramales de base, los pseudo-bulbos de las orquídeas Eulophia y Habenaria puedensobrevivir.
CiénagaLa ciénaga es sin duda el tipo de vegetación más dominadapor la verdadera vegetación acuática. La ciénaga ocupa laspartes más bajas del parque y probablemente esté asociadacon sedimentos depositados por el río o en las márgeneserosionados de ambientes lénticos. Estas plantas tambiénforman pequeñas comunidades a lo largo de los bancos queestán dominadas por el bosque ribereño. La presencia deverdaderas plantas acuáticas, en parte, está relacionada con laprofundidad y el tipo de sustrato, el nivel de protección deun sitio en cuanto a fuertes corrientes y la frecuencia de lasmolestias. Las especies anfibias dominan las ciénagas.
Las ciénagas en el PNLT se componen de diferentesasociaciones dominadas por Cladium jamaicense (laasociación llamada sibal). C. jamaicense y Phragmitesaustralis (sibal-carrizo) existen abundantemente a lo largo delRío San Pedro hasta la desembocadura del Río Escondido. Laasociación de C. jamaicense y Typha domingensis (sibal-tul)es rara aparentemente y sucede sólo en el Arroyo la Pista(SP3). La asociación de C. jamaicense y Acoelorraphewrightii (sibal-tasiste) domina las márgenes del RíoEscondido.
La ciénaga representa el tipo de vegetación más diversorespecto de la cantidad de especies acuáticas y anfibias, asícomo taxa terrestre como la Asclepiadaceae, Convolvulaceae,Cucurbitaceae y la Passifloraceae. La vegetación terrestre esfavorecida por el sibal ya que se había quemadorecientemente, usualmente durante la estación seca. Losincendios queman de manera heterogénea el sibal, dejando unmosaico de áreas gravemente consumidas, áreas mezcladas yáreas en las cuales solamente las partes superiores de lasplantas se han quemado. La heterogeneidad producida por elfuego también se refleja en el nuevo crecimiento de especiesde madera localizadas en los bancos de la ciénaga.
Otro factor que afecta la ciénaga y su biota es el cambioen los patrones de drenaje debido a la construcción decaminos. Se pueden observar cuerpos de agua a lo largo delas rutas de acceso a las lagunas, llenos con grama y guamiles.
Humedales en bosqueEs difícil delimitar este tipo de ciénaga durante la estaciónseca, ya que solamente se puede observar el límite inferior desu extremo durante este período. En México, este tipo deciénaga se reconoce en diferentes clases, incluyendo bosquesribereños altos y medianos, bosques ribereños pequeños,maleza de palmas en humedales y mangles (Lot y Novelo,1990). Estos cuatro tipos se presentan en el PNLT.
El bosque ribereño alto es dominado por Pachiraaquatica, Inga vera, Lonchocarpus hondurensis yPhitecellobium sp. y éstas pueden ser vistas cerca de laEstación Biológica Guacamayas (EBLG) sobre el Río SanPedro. Estos se encuentran entre los bosques más altos en elárea, pero los árboles raramente pasan de 30 metros, debido
a la ausencia de suelos profundos. El bosque ribereñopequeño, comprendía la mayor parte de las áreas boscosasque examinamos. Representados por diversas asociaciones,dominadas por Haematoxylum campechianum (tintal), quese encuentra en la Laguna Flor de Luna (F1).Adicionalmente, la asociación de Bucida buceras y Pachiraaquatica (pucte-zapote bobo) sucede en partes de los ríosSan Pedro y Sacluc; la asociación de B. buceras y Metopium(pucte-chechen negro) sucede en la Laguna Guayacán (F5); yB. buceras y Diospyros sucede en la parte alta del RíoEscondido, en donde también se encontraron las especiesChrysobalanus icaco y Metopium. La asociación más comúnfue Bucida-Pachira, especialmente a lo largo del Río SanPedro (SP6, SP9, y los rápidos) y el Río Sacluc (Tabla 3.1).En general, el bosque ribereño es menos rico en especies demacrófitas acuáticas que en la ciénaga (Tabla 3.1). Sinembargo, otras especies, algunas de las cuales tienenimportancia desde el punto de vista económico para laspoblaciones locales (por ejemplo Calophyllum brasiliense)—podrían aparecer en este bosque de manera cíclica.

�������������� ������������� Octubro 2000 ���
un bosque secundario depurado, dominado por Bucidabuceras con arbustos de Mimosa pigra. Las plantasflotantes acuáticas se limitaban a Salvinia minima. En el casode los ríos Chocop y Candelaria, cada uno tenía bosquesribereños, caracterizados por asociaciones distintas queaparentemente estaban intactas. El bosque ribereño en elChocop albergaba Bucida buceras y Matayba, mientras queel bosque en Candelaria consistía de la asociación de Bucidabuceras y Diospyros. En estos ríos, las plantas acuáticassumergidas son muy escasas; solamente se encontróCabomba en una curva del Candelaria.
Los rápidos del Río San Pedro están formados pordepósitos de bivalvos y son florísticamente interesantesdebido a la presencia de una población única de Vallisneriaamericana. Sin embargo, las especies presentes en el bosqueribereño, así como la ciénaga que rodea los rápidos seencuentran en otras áreas. Adicionalmente, en el E9 (CanalManfredo) del Río Escondido, también se encontrarondepósitos de bivalvos que fueron comparativamente ricos entaxa. Los depósitos de bivalvos pueden contribuir a ladiversidad de microhábitats para las plantas.
Macrohábitats acuáticos y sus características florales
En base a las características del fondo del río y la forma de lacorriente, los hábitats del río se pueden subdividir en ríospermanentes, ríos estacionales y macrohábitats rápidos(referirse a la Tabla 1.1).
Del río permanente (profundo) se obtuvieron muestrasen seis localidades: cuatro en el Río San Pedro, una en el RíoSacluc y una en el Río Escondido (Tabla 3.1). Estas áreas secaracterizaban por fondo de roca calcárea, aguas profundas yflujo de agua durante todo el año. Este hábitat sostiene unmosaico de tipos de bosques ribereños y ciénagas. La mayorvariación en ambientes acuáticos, tipos de vegetación ycantidad de especies de macrófitas acuáticas se encontró enel Río San Pedro. Nuestros registros sugieren que elmacrohábitat del río es uno de los más diversos, aunque lamayoría de sus especies no son únicas en este macrohábitat.
Del poco profundo macrohábitat del río se obtuvieronmuestras en tres ubicaciones de diferentes áreas focales(Tabla 3.1). De éstas, solamente E10 se encontraba en unárea que había sido modificada extensivamente por laactividad humana. Este punto de muestreo fue rodeado por
Tabla 3.1. Macrohábitats, tipos de vegetación y número de especies de plantas registradas en los 25 puntos de muestreo.
Punto de muestreo Macrohábitat Tipo de vegetación Número de taxaSP3: Arroyo La Pista Tributario Ciénaga 14SP4: El Sibalito Río profundo Ciénaga 12SP6: Caracol Tributario Bosque ribereño 9SP7: San Juan Tributario Ciénaga 17SP8: La Caleta caño Ciénaga 10SP9: Pato 1 Río profundo Bosque ribereño 11SP11: Río Saclúc Río profundo Bosque ribereño 12SP12: Rápidos Río profundo Arrecife, bosque ribereño 6SP13: Est. Guacamayas Río profundo Ciénaga 19E5: Laguna Cocodrilo Laguna oxbow Ciénaga 4E6: Laguna Jabirú Laguna oxbow Ciénaga 5E7: Caleta Escondida Laguna oxbow Ciénaga, bosque ribereño 14E8: Punto Icaco Río profundo Bosque ribereño 9E9: Canal Manfredo bivalvo/rápidos Ciénaga 28E10: Nuevo Amanecer Río poco profundo Bosque ribereño 5F5: Flor de Luna Laguna Ciénaga, bosque ribereño 9F6: Pozo Xan Laguna Ciénaga 6C1: Chocop Río poco profundo Bosque ribereño 4C2: Guayacán Laguna Ciénaga 7C3: La Pista Laguna Ciénaga 3C4: Tintal Laguna Bosque ribereño 5C6: Laguna La Lámpara Laguna Ciénaga, bosque ribereño 8C7: Laguna Poza Azul Laguna Bosque ribereño 7Amelia 2 Laguna Ciénaga 3CA1: Candelaria Río poco profundo Bosque ribereño 6

CONSERVATION INTERNATIONAL Programa de Evaluación Rápida���
��������������� ��������������
• Debería ser una prioridad comprender las característicasfísicas e hidrológicas de las áreas dentro y alrededor delparque para poder entender de mejor manera losprocesos que determinan la heterogeneidad de vegetalesen ciénagas, así como para administrar y evitar lacontaminación en los humedales.
• El impacto del desarrollo de actividades petroleras sedebería evaluar, y los cambios generados por laconstrucción de caminos y sus efectos sobre el drenajede las aguas.
• En el futuro los estudios biológicos deberían evaluar lariqueza y composición en cada humedal del área ydebería relacionar estos patrones con patrones deamplia escala a lo largo de la Península de Yucatán.
• Debe ser una prioridad reconocer y distinguir losprocesos naturales y antropogénicos que afectan losecosistemas acuáticos del parque.
• El fuego constituye una de las perturbaciones másimportantes en el parque y afecta a todos los tipos deambientes acuáticos. Los estudios a mediano y largoplazo se deberían dirigir para determinar los efectos delfuego sobre las poblaciones de plantas en ciénagas asícomo en bosques ribereños.
• La vegetación ribereña que se encuentra a lo largo deríos no profundos como el Chocop y el Candelariadifiere de la que se encuentre a lo largo de ríos conmayor longitud y profundidad, como el San Pedro. Porlo tanto, cada uno de estos tipos de bosque deberían serconservados con un esfuerzo similar. La presencia de laespecie Arthrostylidium a lo largo del Candelaria deberíaser causa de preocupación debido a que la especie seesparce de manera agresiva en áreas sujetas a incendios.
• El Río Sacluc debería incorporarse dentro del PNLT demanera que el bosque de encino ( Quercus sp.)de ese lugar fuera protegido, así como los bosquesribereños que conectan con el San Pedro.
• Las áreas con depósitos de bivalvos en el RíoEscondido poseen especies ricas y vulnerables a ladestrucción debido a la erosión ocasionada por eltránsito de lanchas de motor, la ampliación del canal ylos incendios. Los rápidos del Río San Pedro albergan apoblaciones únicas por lo que esta área se deberíaconservar.
El macrohábitat tributario se encontró en tresubicaciones: dos dentro de la ciénaga y una en un bosqueribereño (Tabla 3.1). Este macrohábitat es relativamente ricoen especies, aunque éstas pueden encontrarse en otraspartes, exceptuando las Najas cf. wrightiana (SP3).
El macrohábitat de caño se caracteriza por aguasestables, turbias. Nuestras observaciones acerca de estehábitat se limitan a ciénagas compuestas de un sibal en el RíoSan Pedro que no fue quemado durante dos años, aunquecondiciones similares suceden en las estaciones tributariasdel Río Sacluc. En este punto de muestreo, descubrimos queel final del sibal incluía especies terrestres del géneroIpomoea y Passiflora y una planta de la familia de lasLonganiaceae.
El macrohábitat de la laguna incluye cuerpos de aguaaislados y se representa en ocho de nuestros puntos demuestreo (Tabla 3.1). En la mayoría de las lagunas, estápresente el bosque ribereño en los alrededores, y lasmacrófitas acuáticas prosperan, dependiendo del tipo desustrato encontrado en una profundidad de un metro y lascaracterísticas del banco. La riqueza de este marcohábitatvaría entre tres y nueve especies, la mayoría de las cualestambién se encuentran en los macrohábitats. La flora en elPozo Xan (F6) contribuyó con especies conocidas solamenteen este macrohábitat, incluyendo Brasenia schreberi y Xyrissp. La Laguna Flor de Luna (F5) aparentemente representauna laguna en el proceso de eutroficación, con dos tipos devegetación en bancos opuestos - uno dominado con ciénagaspor Cladium en uno y Eleocharis en el otro—y un bosqueribereño dominado por Haematoxylum campechianum. Lasuperficie de la laguna se encuentra casi completamentecubierta de Nymphaea ampla. La laguna Guayacán es uncuerpo de agua grande en el cual parte del banco estácompuesto por roca calcificada, cubierta con bosque noinundado. La vegetación de ciénagas en esta laguna eslimitada, pero puede encontrarse en interiores protegidos.Estos interiores aparentan ser corrientes que alimentan lalaguna.
Las muestras de la laguna de recodo muestran unariqueza desde muy baja (3) hasta muy alta (28) en cuanto ariqueza de especies. La variación en riqueza puedeinterpretarse como resultado de la diferencia en edades deestas lagunas, duración del aislamiento del canal principal delrío y características geológicas e hidrológicas. La muestra delpunto E9 (Canal Manfredo) incluía las especies encontradassolamente en este lugar dentro de este estudio, como las dosespecies de Utricularia, Sagittaria lanciforme, Hydrocotylecf. bonariensis y una orquídea entre otras.

�������������� ������������� Octubro 2000 ���
• Existe una potencial amenaza de contaminación porpetróleo en el Río Escondido, ya que la tubería pasacerca de las aguas principales del río. Tomando encuenta el efecto devastador que un derrame de petróleopodría tener a lo largo del humedal, se debería crear unplan para evitar este tipo de accidentes.
���� ��� �� ������
Deevey, E. S., D. S. Rice, P. M. Rice, H. H. Vaughan, M.Brenner y M. Flannery. 1979. Mayan urbanism:impact on a tropical karst environment. Science 206:298-306.
Islebe, G. A., H. Hooghiemstra, M. Brenner, D. A. Hodelly J. Curtis. 1996. A Holocene vegetation history oflowland Guatemala (Lake Petén-Itza). Doctoraldissertation. Amsterdam, the Netherlands.
Lot, A. y A. Novelo. 1990. Forested wetlands of Mexico.Pp. 287-298 in Ecosystems of the World 15: ForestedWetlands (A. E. Lugo, M. Brinson, and S. Brown,eds.). Elsevier, Amsterdam, the Netherlands.
Lot, A., A. Novelo y P. Ramirez-García. 1993. Diversityof Mexican aquatic vascular plant flora. Pp. 577-591in Biological Diversity of Mexico: Origins andDistribution (T. P. Ramamoorthy, R. Bye, A. Lot, andJ. Fa, eds.). Oxford University Press, New York, NY,USA.
Lugo, A. E., M. Brinson y S. Brown. 1990. Synthesis andsearch for paradigms in wetland ecology. Pp. 447-460in Ecosystems of the World 15: Forested Wetlands (A.E. Lugo, M. Brinson, and S. Brown, eds.). Elsevier,Amsterdam, the Netherlands.
Lundell, C. L. 1937. The vegetation of Petén. Publication478. Carnegie Institution of Washington, Washington,DC, USA.
Martínez, M. y A. Novelo. 1993. La vegetación acuáticadel Estado de Tamaulipas, México. Anales Inst. Biol.Univ. Nac. Autón. México, Ser. Bot. 64: 59-86.
Morales Can, J. 1998. Tesis de bachillerato. UniversidadNacional de San Carlos, Guatemala.
de Poll, E. 1983. Plantas acuáticas de la región El Estor,Izabal. Universidad de San Carlos de Guatemala,Facultad de Ciencias Químicas y Farmacia. Escuela deBiología, Guatemala.
Standley, P. 1924-1964. Flora of Guatemala. FieldianaBotany Vol. 24. Field Museum of Natural History,Chicago, IL, USA.
Williams, L. O. 1966-1975. Flora of Guatemala. FieldianaBotany Vol. 24. Field Museum of Natural History,Chicago, IL, USA.
CONSERVATION INTERNATIONAL Programa de Evaluación Rápida���
������
• Se recolectaron peces de agua dulce en 48 localidades decinco puntos focales regionales del Parque NacionalLaguna del Tigre (PNLT) y el biotopo.
• Se capturaron cuarenta y un especies de peces de 55conocidas o que se sospecha existen en la región.Varias de las especies capturadas representan nuevosregistros para la Cuenca del Río San Pedro enGuatemala (incluyendo Batrachoides goldmani, Mugilcurema y Aplodinotus grunniens). Se encontraron dosespecies exóticas (Oreochromis sp.) y el césped(Ctenopharyngodon idella). Se capturaron dos especiesno descritas, un pez gato y otro que pertenecía algénero Atherinella.
• Nuestros resultados muestran que la mayoría de lasespecies conocidas del Río San Pedro hace 60 años aúnse encuentran presentes.
• El punto focal del Río San Pedro es el más diverso, perocon pocas excepciones, la mayoría de las especies seencuentra distribuida homogéneamente entre lasregiones dentro de la cuenca o entre los macrohábitats.Los hábitats de la laguna todos aparentemente teníandocenas de especies, sin importar las alteraciones a lavegetación marginal, el uso humano o la proximidad alos caminos.
��� ��������
Los peces que viven en las aguas dulces de El Petén deGuatemala y México representan una ictiofaunarelativamente bien conocida y bien descrita. En gran parte, y
��������� (
��������������������������� ������������������������ ������������������
Christian Barrientos, Herman A. Kihn y BarryChernoff
empezando con las publicaciones de Alfreid Gúnther (1868)que se basa en las recolecciones de Osberd Salvin en 1859, hahabido una serie de publicaciones que tratan con los peces deesta interesante región. C. Tate Regan (1906-08) fue elprimero en reconocer y establecer provincias biogeográficaspara los peces de México y Centroamérica. Carl L. Hubbsrealizó exploraciones críticas del sur del Petén, el lago PeténItzá y el Río San Pedro en 1935. Sus recolecciones formanuna base importante de comparación para nuestra encuesta.Desde Hubbs, se han descrito muchas especies, y se hanentablado debates sobre la naturaleza de las provinciasbiogeográficas (Miller, 1976).
El Río San Pedro es un tributario principal del RíoUsumacinta. El Río Candelaria es un afluente independientede la Laguna de Términos. Los peces de las tres cuencas seconocen porque se componen de 48 especies en base aespecímenes registrados en el museo. Adicionalmente, lasfuentes conocidas y las recolecciones del Río Pasíon enSayaxché sugieren cinco especies adicionales, a las quenosotros agregamos dos exóticas. Esto eleva la ictiofaunaconocida y potencial a 55 especies. Estas especies seenumeran en el Apéndice 7. Esta ictiofauna se compone deespecies que viven principalmente en aguas dulces, ademásde las que libremente extienden sus rangos desde hábitasmarinos y estuarinos hasta las aguas dulces, tales como laslisas (Mugil spp.).
La mayoría de los componentes de la ictiofaunaencontrados en el Parque Nacional Laguna del Tigre (PNLT)y el biotopo pertenecen a un grupo ampliamente distribuidode peces encontrados entre el Río Coatzacoalcos al norte y elRío Polochic/Río Sarstún en el sur. Regan (1906-08) y Miller(1966, 1976) se han referido a esta distribución general comola Provincia del Río Usumacinta, aunque Bussing (1987)incluyó el Río Motaga en la Provincia del Río Usumacinta,esto no recibió mucha atención. Sin embargo, Chernoff(1986) descubrió que un grupo monofilético de Atherinella
���������������������� ���������������������� Julio 2000 ���
A excepción del Lago Petén Itzá y los lagosrelacionados, hay poco o no hay endemismo de peces dentrode El Petén propiamente. Esto incluye al PNLT y albiotopo. Sin embargo, notamos que existe un gran grado deendemismo al nivel de la Provincia del Usumacinta sensuRegan (1906-08). Por lo tanto, las áreas protegidas dentro dela provincia mayor deben ser establecidas para poderconservar su interesante fauna. Uno de nuestros objetivosfue descubrir si el PNLT y el biotopo podrían servir paraeste propósito. Esto es particularmente importante ya queen los estados mexicanos vecinos de Campeche y Tabascohábitats similares han sido totalmente o altamentedegradados debido al ganado y exploración petrolera.
El propósito de esta encuesta fue triple: 1) documentarla biodiversidad de peces en el PNLT y el biotopo, 2)documentar, a través de protocolos de evaluación rápida, ladiversidad de peces asociada con puntos focales ymacrohábitats, y 3) identificar al mayor grado posible elestado de salud de los hábitats, las regiones críticas paramantenimiento de biodiversidad y las amenazas potencialeso reales así como sus impactos potenciales.
�������
Durante el curso de 20 días, se realizaron 48 recolecciones depeces (Apéndices 8-9). Los peces se capturaron utilizandolos siguientes métodos:• atarrayas (5 m x 2 m x 3.4 mm; 1.3 m x 1 m x 1.75 mm);• redes (2 m, 1.5 m);• redes experimentales de arroyo (48 m);• pesca manual con redes (3 m) y• redes sumergidas.La pesca con redes barrederas fue bastante difícil porque noencontramos ninguna playa o áreas libres para halar las redesbarrederas.
Todos los especímenes de peces recolectados sepreservaron inicialmente en una solución de 10% deformalina, luego se transfirieron a una de 70% de etanol parasu almacenamiento y archivo. Las identificaciones se hicieronen el laboratorio con la ayuda de descripciones originales yestudios de revisión más recientes (Regan, 1905; Rosen y
Bailey, 1959, 1963; Hubbs y Miller, 1960; Miller, 1960;Rivas, 1962; Suttkus, 1963; Deckert y Greenfield, 1987;Greenfield y Thomerson, 1997; y otros). Los especímenesse depositaron en el Field Museum de Chicago y en elMuseo de Historia Natural, Universidad de San Carlos deGuatemala. Para ubicar la diversidad de peces, semuestrearon tantos hábitats como fue posible (referirse a laTabla 1.1). Las áreas muestreadas se trataronjerárquicamente. En el nivel superior de la jerarquía seencuentran las áreas focales descritas en el “Itinerario deexpedición y Diccionario de geográfico.” Dentro de estasáreas focales, todo el equipo de ciencias acuáticas coordinóestudios a una escala más fina (muestra o puntos degeoreferencia). Nuestras 48 muestras, en la mayoríacorrespondían a 40 puntos de georeferencia (Apéndice 1, 8).Pocas muestras se encontraban fuera de estos regímenes demuestras coordinadas. Los Indices de Similitud de Simpson(cantidad de taxa compartida entre dos grupos/número detaxa en el grupo menor) se utilizaron para realizarcomparaciones entre los macrohábitats, áreas focales y tipode equipo. Seleccionamos el Indice de Similitud de Simpsonporque éste enfatiza la presencia de taxa utilizando elnúmero de especies en el grupo menor del denominador(Chernoff et al., 1999). Consideramos la ausencia de taxacomo ambigua debido a que una taxa determinada puede enrealidad estar ausente o pudo haber estado presente pero nohaber sido detectada.
���������������������
Efectividad del muestreo
Aunque se cree que aproximadamente 55 especies de peceshabitan la región estudiada (Apéndice 7), recolectamos 41(Apéndice 8). Algunos de los peces no recolectados no soncomunes en el área. Entre los ejemplos se incluye Ictiobusmeridionalis y Gobiomorus dormitor. Los demás son pecesgrandes que probablemente nadan a través de los ríos largospero no permanecen en un lugar determinado durante muchotiempo. Estos son difíciles de recolectar durante muestreoscortas, pero a veces son atrapados por pescadores locales obien personas que realizan estudios a largo plazo. Entre losejemplos se incluye Anguilla rostrata, Mugil cephalus yCentropomus undecimalis. La curva de acumulación deespecies demuestra que alcanzamos la asíntota después deocho días y creemos que la taxa recolectada es una buenarepresentación de las especies que se encontraban allí en esemomento (Figura 4.1).
incluye la especie encontrada en el Motagua, Petén-Itzá ylos drenajes del Usumacinta al Coatzacoalcos. Otros grupospresuntamente monofiléticos (por ejemlo Phallichthys yXiphophorus) también incluyen al Motagua en lasdistribuciones de la Provincia del Usumacinta. Estasrelaciones de grupo de hermanas, incluyendo el RíoMotugua, crean la hipótesis de la presencia de ancestroscomunes que una vez habitaron las regiones del Motagua ydel Usumacinta, seguidos por algún grado de evolución localdespués de que las dos regiones se aislaron, probablementedurante el Terciario menor (Rosen y Bailey, 1959; Rosen,1979; Weyl, 1980).

CONSERVATION INTERNATIONAL Programa de Evaluación Rápida���
0
5
10
15
20
25
30
35
40
45
1 3 5 7 9 11 13 15 17
Time (Days)
Cu
mu
lati
ve N
um
ber
of
Sp
ecie
s
Puntos focales (ver Itinerario y boletín de laexpedición).
Río San PedroDiversidad de pecesDel Río San Pedro, recolectamos 38 especies de pecesdurante el muestreo RAP (Apéndice 8) de un estimado de 55especies para la región. Catorce de las especies recolectadaseran cíclidos. El segundo grupo más dominante fue el depoecílidos, con 8 especies. Se recolectaron diez especies a lolargo del punto focal y en una variedad de macrohábitats.Estos incluyen Astyanax aeneus, Cichlasoma pasionis,Belonesox belizanus, Cichlasoma synspilum, Cichlasomahelleri, Gambusia sexradiata, Cichlasoma heterospilum,Petenia splendida, Cichlasoma meeki, y Poecilia mexicana.
Batrachoides goldmani, Mugil curema y Aplodinotusgrunniens son los primeros registros oficiales para estasespecies en esta cuenca de Guatemala. En comparación a lasrecolecciones de Hubbs en 1935, la diversidad y los númerosaparentemente no han cambiado significativamente.
Diversos hábitats aquí son de especial atención para elmantenimiento de la diversidad de peces y se discuten acontinuación.
1) Los bosques bajos, similares a varzea, inundadoscerca de Paso Caballos y a lo largo del Río Sacluc son áreascríticas de crianza para peces jóvenes y probablementefuncionan como áreas en las cuales los peces, como el Bryconspp., comen y dispersan semillas. Este tipo de hábitat no esreconocido y no se describe en Mesoamérica.
2) Sibal (dominado por Cladium jamaicense) esprobablemente un microhábitat importante para las cíclidosy el barbo. Probablemente también sirve de criadero parapeces que depositan huevos de acuerdo con los niveles de
fluidez del agua y que se alimentan de semillas. Aún durantela estación seca, el agua es una parte integral del sibal ya queel agua penetra en el sibal. La hojarasca en el fondo del ríopodría proporcionar una importante fuente de alimento paralos peces, ya que la microflora constantemente crece en lashojas. Las hojas también pueden ser un escondite para lospeces pequeños.
3) Los tributarios que entran al Río San Pedro desde laparte norte del río (Paso Caballos, SP2; Arroyo La Pista,SP3) fueron muy claros y poco profundos y de corrienterápida. El arroyo La Pista se encontraba sobre un sustratorocoso, casi formando canales con troncos. Sin embargo, ladiversidad de los peces fue relativamente baja, consolamente 12 especies en total. En el Arroyo La Pista,observamos enormes agregados de Dorosoma petenense, deaproximadamente 60 mm de longitud, que se reunían sobrelas rocas. Estos hábitats de corrientes posiblemente seencuentran amenazados debido a la modificación y lacontaminación del hábitat.
ObservacionesLos peces aguja y Hyphessobrycon fueron atrapados desdeel fondo. Los peces aguja fueron abundantes y podrían serlos piscívoros dominantes. Muchos peces, incluyendo losaguja y los Petenia, estaban llenos de huevos o tenían testasgrandes, lo cual indicaba que se estaban preparando para lareproducción. Se recolectaron los especímenes de Atherinellaalvarezi. Aunque algunos especímenes fueron recolectadospor Hubbs en 1935, las especies no se han recolectado enocasiones más recientes del Río Pasión o cerca de Sayaxché.
AmenazasLas aglomeraciones humanas son muy significativas debido ala quema de sibales, contaminación de fuentes ydeforestación.
FragilidadLa fragilidad es alta para el sibal y varzea debido a que seencuentran fragmentados.
Río EscondidoDiversidad de pecesSe encontraron solamente 27 especies de peces de las 55encontradas en todos los macrohábitas dentro del puntofocal del Río Escondido (Apéndice 8). Las especies del RíoEscondido contienen las 10 especies comunes (Tabla 4.1)más Atractosteus tropicus, Dorosoma petenense,Cichlasoma friedrichsthalii y Cathorops aguadulce, entreotros.
ObservacionesMuchos de los peces se encontraban en condiciónreproductiva.
Figura 4.1. Curva de acumulación de especies para pecesrecolectados durante la expedición RAP 1999 hacia el ParqueNacional Laguna del Tigre, Petén, Guatemala
Acu
mul
ació
n de
núm
ero
de e
spec
ies
Tiempo (Días)
�������������� ������������� Octubro 2000 ���
AmenazasLas amenazas principales incluyen la quema de sibal y ladestrucción del bosque. Fuimos testigos de la quema de sibaly la conversión activa de hábitats de bosques para pasto yusos agrícolas. Estas actividades tienden a incrementar lacontaminación del río, y eliminan importantes áreas decriadero y microhábitats con sombra y más frescos en loscuales los peces puedan vivir.
FragilidadLos hábitats de sibal y de bosques son frágiles porque susbases se están degradando y/o volviendo más pequeñas. Casitodas las márgenes boscosas han sido habitadas por personasya que esta zona ofrece suelo sólido y se encuentra cerca delacceso al agua. La fragilidad del río desde la perspectiva deproporcionar hábitats adecuados para la supervivencia de lospeces no se conoce en este momento.
Flor de LunaDiversidad de pecesDe las 55 especies, se encontraron 22 dentro del punto focalde Flor de Luna (Apéndice 8). La fauna encontrada dentro delas lagunas fue un subgrupo del Río San Pedro, incluyendolas diez especies más comunes.
AmenazasEn las instalaciones de petróleo Xan, existe una amenazapotencial de contaminación a causa de petróleo de un pozoen funciones que se encuentra adyacente a la laguna y laciénaga. Se notó que los peces recolectados por toxicologíatenían una alta incidencia de aletas podridas y que un cíclidotenía una masa fibrosa en su hígado.
Es difícil estimar las amenazas a otras lagunas debido aque encontramos esencialmente las mismas especies ya sea sila laguna tenía márgenes vírgenes, o se encontraba rodeada debosques explorados y campos agrícolas.
FragilidadEs difícil estimar la fragilidad de los hábitats de la lagunadebido a que aparentemente soportan contra los impactoshumanos, modificaciones de bosque y construcciones decaminos. No existen datos para comparar nuestro muestreocon muestras previas a la modificación de muchas de estaslagunas.
Río ChocopDiversidad de pecesSolamente se encontraron 15 especies dentro del punto focal(Apéndice 8). Sin embargo, Xiphophorus hellerii se encontróde manera única en este punto focal.
AmenazasEntre las principales amenazas se incluye la deforestación yla quema. La deforestación y la quema aumentará lacontaminación en estos sistemas de agua relativamenteclaros, lo que en última instancia podría afectar la diversidadde peces. Estas amenazas ya están sucediendo a unavelocidad rápida aunque estas localidades se encuentrendentro del PNLT.
FragilidadLas corrientes de agua principales como las que encontramosen este punto focal tienden a ser más frágiles que lassecciones de corriente hacia abajo. La contaminación debido ala deforestación y conversión de hábitat cambian el carácterde las corrientes de aguas de manera dramática.
Río CandelariaDiversidad de pecesSolamente se obtuvieron muestras de una localidad dentro deeste punto focal, de manera que es difícil hacer estimacionesde la diversidad. Recolectamos 13 especies (Apéndice 8).Solamente en este lugar recolectamos Atherinella c.f.schultzi. Debido a que el Río Candelaria es un drenajeindependiente del Río San Pedro, existe una posibilidad deque existas taxa novedosas.
AmenazasAl igual que en las cercanías del punto focal del Río Chocop,la deforestación y la quema son las amenazas principales.Ambas se observaron durante nuestro estudio. Ladeforestación y la quema aumentarán la contaminación enestos sistemas de agua relativamente claros, que en últimainstancia podría afectar la diversidad de peces. Estasamenazas ya están ocurriendo a una velocidad rápida, aunqueestas localidades se encuentren dentro del PNLT.
FragilidadLas corrientes principales como las que encontramos en estepunto focal tienden a ser más frágiles que las secciones ríoabajo. La alteración por deforestación y conversión dehábitat cambian el carácter de las corrientes principales demanera dramática.
Comparaciones entre macrohábitats, puntos focales yequipo
El río permanente (es decir, el Río San Pedro) fue elmacrohábitat con la mayoría de especies (N=33) (Apéndice9). Las lagunas, tributarios y ríos estacionales tambiéntuvieron números relativamente altos de especies (23, 22 y24 respectivamente). El río permanente es el tipo demacrohábitat acuático más común en el PNLT, aunqueabundan las lagunas en las áreas focales de Flor de Luna yChocop.
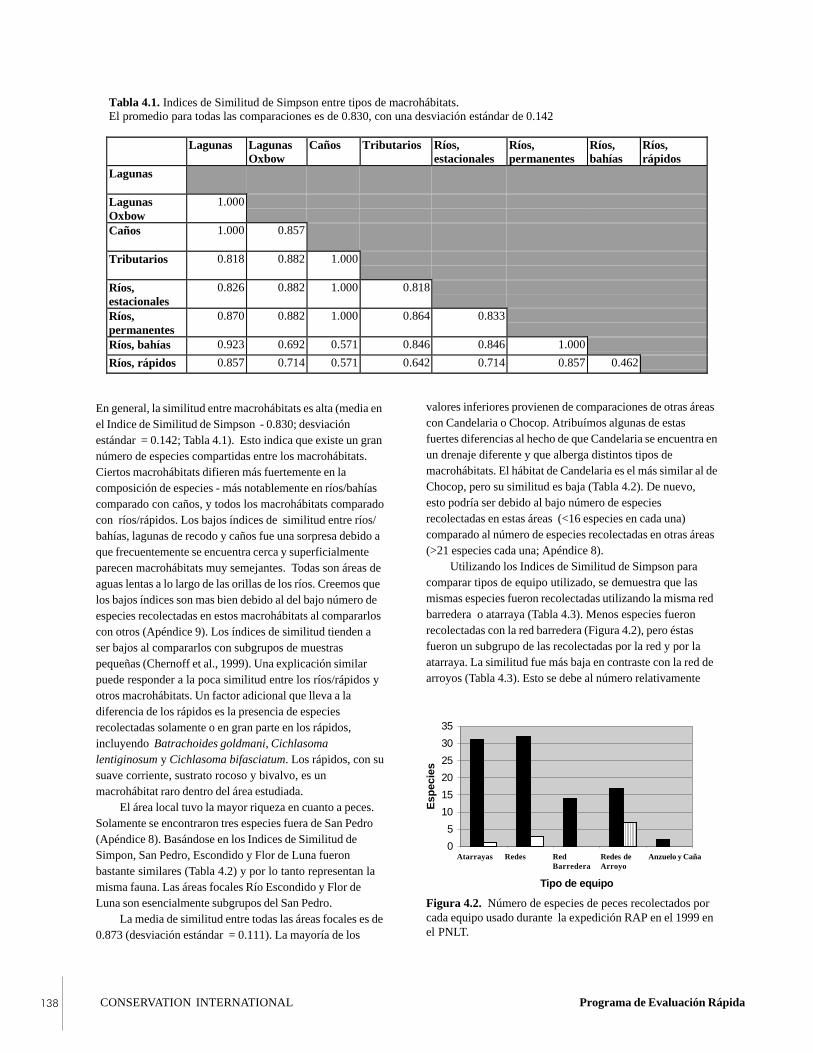
CONSERVATION INTERNATIONAL Programa de Evaluación Rápida���
0
5
10
15
20
25
30
35
Seine Castnet Trawl Gillnet Hook andLine
Tipo de equipo
Esp
ecie
s
En general, la similitud entre macrohábitats es alta (media enel Indice de Similitud de Simpson - 0.830; desviaciónestándar = 0.142; Tabla 4.1). Esto indica que existe un grannúmero de especies compartidas entre los macrohábitats.Ciertos macrohábitats difieren más fuertemente en lacomposición de especies - más notablemente en ríos/bahíascomparado con caños, y todos los macrohábitats comparadocon ríos/rápidos. Los bajos índices de similitud entre ríos/bahías, lagunas de recodo y caños fue una sorpresa debido aque frecuentemente se encuentra cerca y superficialmenteparecen macrohábitats muy semejantes. Todas son áreas deaguas lentas a lo largo de las orillas de los ríos. Creemos quelos bajos índices son mas bien debido al del bajo número deespecies recolectadas en estos macrohábitats al compararloscon otros (Apéndice 9). Los índices de similitud tienden aser bajos al compararlos con subgrupos de muestraspequeñas (Chernoff et al., 1999). Una explicación similarpuede responder a la poca similitud entre los ríos/rápidos yotros macrohábitats. Un factor adicional que lleva a ladiferencia de los rápidos es la presencia de especiesrecolectadas solamente o en gran parte en los rápidos,incluyendo Batrachoides goldmani, Cichlasomalentiginosum y Cichlasoma bifasciatum. Los rápidos, con susuave corriente, sustrato rocoso y bivalvo, es unmacrohábitat raro dentro del área estudiada.
El área local tuvo la mayor riqueza en cuanto a peces.Solamente se encontraron tres especies fuera de San Pedro(Apéndice 8). Basándose en los Indices de Similitud deSimpon, San Pedro, Escondido y Flor de Luna fueronbastante similares (Tabla 4.2) y por lo tanto representan lamisma fauna. Las áreas focales Río Escondido y Flor deLuna son esencialmente subgrupos del San Pedro.
La media de similitud entre todas las áreas focales es de0.873 (desviación estándar = 0.111). La mayoría de los
valores inferiores provienen de comparaciones de otras áreascon Candelaria o Chocop. Atribuímos algunas de estasfuertes diferencias al hecho de que Candelaria se encuentra enun drenaje diferente y que alberga distintos tipos demacrohábitats. El hábitat de Candelaria es el más similar al deChocop, pero su similitud es baja (Tabla 4.2). De nuevo,esto podría ser debido al bajo número de especiesrecolectadas en estas áreas (<16 especies en cada una)comparado al número de especies recolectadas en otras áreas(>21 especies cada una; Apéndice 8).
Utilizando los Indices de Similitud de Simpson paracomparar tipos de equipo utilizado, se demuestra que lasmismas especies fueron recolectadas utilizando la misma redbarredera o atarraya (Tabla 4.3). Menos especies fueronrecolectadas con la red barredera (Figura 4.2), pero éstasfueron un subgrupo de las recolectadas por la red y por laatarraya. La similitud fue más baja en contraste con la red dearroyos (Tabla 4.3). Esto se debe al número relativamente
Tabla 4.1. Indices de Similitud de Simpson entre tipos de macrohábitats.El promedio para todas las comparaciones es de 0.830, con una desviación estándar de 0.142
Lagunas LagunasOxbow
Caños Tributarios Ríos,estacionales
Ríos,permanentes
Ríos,bahías
Ríos,rápidos
Lagunas
LagunasOxbow
1.000
Caños 1.000 0.857
Tributarios 0.818 0.882 1.000
Ríos,estacionales
0.826 0.882 1.000 0.818
Ríos,permanentes
0.870 0.882 1.000 0.864 0.833
Ríos, bahías 0.923 0.692 0.571 0.846 0.846 1.000
Ríos, rápidos 0.857 0.714 0.571 0.642 0.714 0.857 0.462
Figura 4.2. Número de especies de peces recolectados porcada equipo usado durante la expedición RAP en el 1999 enel PNLT.
Atarrayas Redes Red Redes de Anzuelo y CañaBarredera Arroyo
�������������� ������������� Octubro 2000 ���
grande de taxa recolectada exclusivamente con red dearroyos, (por ejemplo Mugil curema, la mayoría de los pezgato, Aplodinotus grunniens; (Figura 4.2). Solamente dosespecies (Brycon guatemalensis y Petenia splendida) fueronatrapadas con anzuelo y caña, siendo un método pocofrecuente, por lo que hay poco que decir sobre este tipo deutensilio. En general, es importante utilizar diversas técnicasde recolección para poder inventariar la totalidad de la faunaen un área determinada.
En resúmen, consideramos que cada una de las regionesfocales contiene subgrupos de la ictiofauna encontradadentro del Río San Pedro. Exceptuando los peces queprefieren hábitats de ríos grandes (- el ictalúrido y los pecesgato, Mugil, Aplodinotus, etc.—)la mayoría de los pecesestán distribuidos en grupos más pequeños de manera
homogénea entre macrohábitats y regiones focales. Lasexcepciones a este patrón incluyen Xiphophorus hellerii,Heterandria bimaculata y Atherinella cf. schultzi,las cuales econtramos en hábitats de aguas principales. Elárea de rápidos/arrecifes también tenía dos especies,Cichlasoma lentiginosum y Batrachoides goldmani, que nose encontraron en ningún otro lugar.
������� ���������������� #�����
La homogeneidad de la distribución de especies entremacrohábitats y entre regiones focales sugiere que fácilmentese puede implementar un plan general para la conservaciónde la biodiversidad de peces en el PNLT. Recomendamos que
Tabla 4.2. Indices de Similitud de Simpson entre áreas focales. El promedio para todas las comparaciones es de 0.873,que es una desviación estándar de 0.111
San Pedro Escondido Flor de Luna Chocop Candelaria
San Pedro
Escondido 0.963
Flor de Luna 1.000 1.000
Chocop 0.867 0.933 0.733
Candelaria 0.846 0.923 0.769 0.692
Tabla 4.3. Indice de similitud de Simpson entre tipos de equipos.El promedio para todas las comparaciones es de 0.694, con una desviación estándar de 0.251.
Atarrayas Redes Redbarredera
Redes dearroyo
Anzuelo yCaña
Atarrayas
Redes 0.935
Redbarredera
1.000 1.000
Redes dearroyo
0.529 0.471 0.500
Anzuelo yCaña
0.500 0.500 0.500 1.000
CONSERVATION INTERNATIONAL Programa de Evaluación Rápida���
se proteja una muestra de cada uno de los tipos demacrohábitats como áreas de conservación, especialmente loshábitats del arrecife y de aguas principales.
Taxones presentados
Se observaron dos especies no nativas: la especieOreochromis, que es un cíclido africano (no se guardaronespecímenes) y la Ctenopharyngodon idella, que es un pezpequeño asiático. Estas especies han sido presentadasalrededor del mundo para controlar la vegetación acuática ysirven como fuente de alimento. Hasta donde sabemos, éstasno han sido presentadas en el norte de Guatemala. Pero hansido presentadas en algunos de los estados vecinos deMéxico. Es probable que estos peces hayan nadado a lo largodel Usumacinta hasta el río San Pedro y luego al PNLT. Estees un ejemplo gráfico de la interconexión entre los sistemasacuáticos a través de las fronteras y resalta la necesidad deestrategias de manejo ecoregionales. Cualquier iniciativa deconservación o la introducción de especies exóticas, debetomar en cuenta la movilidad de la fauna.
Consideraciones biogeográficas
Si incluimos la especie Oreochromis, entonces registramos42 especies durante la encuesta ictiológica en el PNLT. Deéstas, 34 son endémicas a la provincia del Usumacinta. Estostaxa endémicos incluyen nueve cíclidos (Cichlasomabifasciatum, C. helleri, C. heterospilum, C. lentiginosum, C.meeki, C. pasionis, C. pearsei, C. synspilum y Peteniasplendida), de las cuales todas son utilizadas como alimento.Otras seis especies registradas (Astyanax aeneus, Bryconguatemalensis, Rhamdia guatemalensis, Belonesoxbelizanus, Poecilia mexicana y Cichlasoma robertsoni) seencontraron en el Usumacinta, Motagua y posiblemente enotros drenajes. Se integraron dos especies(Ctenopharyngodon idella y Oreochromis). En resumen,mucha de la taxa recolectada se encuentra solamente en eldrenaje del Usumacinta.
Se estima que existen doscientas o más especies en eldrenaje Usumacinta-Grijalva (Miller, 1976). Creemos queexisten 58 especies (56 nativas, 2 introducidas) en el norte delas tierras bajas de Guatemala dentro de la cuenca delUsumacinta. Estas 58 especies representan el 29% del totalde la fauna de peces del Usumacinta. El PNLT ocupa unagran área del norte de las tierras bajas de Guatemala, yrelativamente no se ha modificado. Otras porciones deldrenaje del Usumacinta se encuentran en peligro de serdesarrolladas. La preservación del PNLT ayudaría a protegera un cuarto de la fauna de peces del Usumacinta. Esto essignificativo debido al alto grado de endemismo global dentrodel drenaje del Usumacinta y el daño ambiental aparentedetrás de los límites del parque, incluyendo México.
���������������'�����������������
Las siguientes son conclusiones generales que resultan denuestras interpretaciones de la distribución de peces en loscinco puntos focales.
• Recolectamos 41 especies de peces de agua dulce de unpotencial de 55 especies que se piensa que habitan estaregión. Los peces que no recolectamos incluyenCentropomus undecimalis (reportado por pescadoresde Sayaxché), Rivulus tenuis (reportado en estudiosanteriores ), Tarpon atlanticus y Hyporhampusmexicanus (reportado desde Sayaxché), Ictiobusmeridionalis (conocido en el Río Pasión), y Rhamdialaticauda (conocido en el Río Pasión y en el RíoNegro).
• Identificamos dos especies de peces introducidos, yrecolectados por los pescadores: la tilapia (especieOreochromis, no se guardaron especímenes) y la carpa(Ctenopharyngodon idella). Este es el primer registrooficial de esta especie en el norte de Guatemala.
• La lisa (Mugil curema) es el primer registro de laespecie de la cuenca de San Pedro y Usumacinta enGuatemala.
• El tambor de agua dulce (Aplodinotus grunniens) y elpejesapo (Batrachoides goldmani) son los primerosregistros en la cuenca de San Pedro.
• La fauna de peces está distribuida más o menoshomogéneamente entre los cinco puntos focalesregionales y entre los ocho macrohábitats. No pudimosindentificar algún patrón de especies entre loscomponentes principales o las comunidades de peces.
• Hubo un grupo de 10 especies que se encontró en lamayoría de puntos y macrohábitats. Este grupo incluyeAstyanax aeneus, Belonesox belizanus, Cichlasomahelleri, C. heterospilum, C. meeki, C. pasionis, C.synspilum, Gambusia sexradiata, Petenia splendida yPoecilia mexicana.
• Ciertos grupos pequeños de especies se encontraronsolamente en macrohábitats determinados. Lossiguientes son algunos ejemplos: rápidos/arrecifes—Cichlasoma lentiginosum, Batrachoides goldmani, y engran parte Cichlasoma bifasciatum; aguas principalescon corriente—Xiphophorus hellerii y Heterandriabimaculata; canal principal del Río San Pedro—Bryconguatemalensis, pez gato e ictalurido, Mugil curema,Aplodinotus grunniens, y Eugerres mexicanus.
• Las faunas de las lagunas fueron marcadamentesimilares a pesar de las diferencias en cuanto a laproximidad a asentamientos humanos, caminos u otrosdisturbios principales.
• La heterogeneidad de los macrohábitats es baja. Loshábitats de los ríos y lagunas tenían márgenes bastantepoco profundas.
�������������� ������������� Octubro 2000 ���
����������������������� #�����
Estos resultados sugieren varias recomendaciones específicaspara la conservación de poblaciones de peces y hábitatsdentro del parque. Las recomendaciones no se presentan enorden de prioridad.
• Desarrollar un plan de conservación integrado para lasáreas que contienen un número grande de lagunas, esnecesario un estudio hidrológico para proporcionarinformación crítica sobre la conexión de lagunas,estanques y sibales durante las estaciones deinundación. ¿Cuáles son los roles o fuentes de lasfaunas de peces en éstos hábitats relativamenteaislados? Grupos de lagunas y sibales se debenidentificar como críticos para el mantenimiento de labiodiversidad.
• Los administradores de los parques deben reconocer lanaturaleza crítica del bosque bajo, similar a varzea y loshábitats sibales para la reproducción de peces,criaderos, reproducción de larvas para peces y pecesjóvenes. Estos hábitats deben considerarse frágiles yamenazados debido a la modificación humana,especialmente a través de la quema. Recomendamosque la franja de sibal no modificado que se encuentra alsur del Río San Pedro y la varzea a lo largo del RíoSacluc y debajo del Paso Caballos se debería incluir enel Parque.
• El impacto humano en el Río San Pedro, tanto enMéxico como en Guatemala, se debería estudiar debidoa que ha habido mucho deterioro de hábitats naturales alo largo de las márgenes del río en la frontera sur delPNLT.
• Según los estudios preliminares realizados porhidroecólogos, los arrecifes de moluscos filtran elagua entre la Estación Biológica Las Guacamayas y elpueblo de El Naranjo. Estos tipos de arrecifes seencuentran raramente en aguas dulces y tienen unacomunidad de peces única asociada. Esta región demacrohábitat debe ser protegida para poder asegurar lasalud de la ictiofauna en la parte sureste del parque ytambién para asegurar la buena calidad del agua para laspersonas de El Naranjo.
• La fauna de peces es básicamente la misma que seencontró en muestreos cortos hace 60 años. Noencontramos evidencia de extinciones. Sin embargo,debe notarse que se han introducido dos especiesexóticas.
• Los estudios sobre la dinámica de población dediferentes especies de peces para alimento, se debenimplementar de inmediato, para proteger la ictiofaunade presiones generadas por los humanos debido a lasubsistencia de pesca comercial. La presión provieneprincipalmente de la pesca de red no regulada,la pesca con anzuelo y caña, pesca con atarraya y pescacon red. Los objetivos principales son la Peteniasplendida, y otros cíclidos, Brycon guatemalensis y losbarbos grandes. Notamos que una de las fuentesprincipales de la presión de pesca sucede durante laSemana Santa, cuando los pescadores explotan losrecursos fuertemente a lo largo de la cuenca.
• Se necesitan inmediatamente datos sobre el uso humanode peces dentro del parque y dentro del biotopo, parapredecir las demandas futuras sobre poblaciones nativasde peces de agua dulce conforme la explosióndemógrafica en estas regiones.
• Un plan de conservación requerirá información sobre laecología de la comunidad de peces durante lasestaciones que no sean la estación seca.
• Los hábitats de las tierras bajas de los ríos y las lagunasdentro del PNLT y el biotopo se deben comparar conhábitats similares dentro de la provincia delUsumacinta, tanto en México como en Guatemala, y enotros lugares de la RBM. El PNLT y el biotopo puedenservir como un área de conservación adaptable para estacomunidad de peces ampliamente distribuida.
• La fuerte deforestación y destrucción de sibal debenevitarse, ya que podría afectar adversamente loshábitats acuáticos que se encuentran dentro de lacuenca, debido a una contaminación aumentada en elresto de las vías acuáticas.
���� ��� �� ������
Bussing, W. L. 1987. Peces de las Aguas Continentales deCosta Rica. Editorial de la Universidad de Costa Rica,San Jose, Costa Rica.
Chernoff, B. 1986. Phylogenetic relationships andreclassification of menidiine silverside fishes, withemphasis on the tribe Membradini. Proceedings of theAcademy of Natural Sciences of Philadelphia 138:189-249.

CONSERVATION INTERNATIONAL Programa de Evaluación Rápida���
Chernoff, B., P. W. Willink, J. Sarmiento, A. Machado-Allison, N. Menezes y H. Ortega. 1999. Geographicand macrohabitat partitioning of fishes in Tahuamanu-Manuripi region, upper Río Orthon basin, Bolivia. Pp.51-67 in A Biological Assessment of the AquaticEcosystems of the Upper Río Orthon Basin, Pando,Bolivia (B. Chernoff and P. W. Willink, eds.). Bulletinof Biological Assessment 15. Conservation Interna-tional, Washington, DC, USA.
Collette, B. B. y J. L. Russo. 1981. A revision of the scalytoadfishes, genus Batrachoides, with descriptions oftwo new species from the eastern Pacific. Bulletin ofMarine Science 31: 197-233.
Deckert, G. D. y D. W. Greenfield. 1987. A review of thewestern Atlantic species of the genera Diapterus andEugerres (Pisces: Gerreidae). Copeia 1987: 182-194.
Greenfield, D. W. y J. E. Thomerson. 1997. Fishes of theContinental Waters of Belize. The University Press ofFlorida, Gainesville, FL, USA.
Gúnther, A. 1868. An account of the fishes of the states ofCentral America, based on collections made by Capt.J. M. Dow, F. Goodman, Esq., and O. Salvin, Esq.Transactions of the Zoological Society of London 6:377-494.
Hubbs, C. L. y R. R. Miller. 1960. Potamarius, a newgenus of ariid catfishes from the fresh waters ofMiddle America. Copeia 1960: 101-112.
Miller, R. R. 1960. Systematics and biology of the gizzardshad (Dorosoma cepedianum) and related fishes.Fishery Bulletin 173: 371-392.
Miller, R. R. 1966. Geographical distribution of CentralAmerican fishes. Copeia 1966: 773-802.
���� � � � � � ��������������� ���������������������� Julio 2000
������
• Las muestras de sedimento y de tejido de dos especiesde peces (Thorichthys meeki y Cichlasoma synspilum)se recolectaron de una laguna que se encontrabainmediatamente adyacente a la instalación de petróleoXan 3, así como de nuestros sitios de referencia(Laguna Flor de Luna, Laguna Buena Vista, LagunaGuayacán, Río Escondido y Río San Pedro).Se utilizó el sedimento para determinar los niveles dehidrocarbonos policíclicos aromáticos (PAH, por sussiglas en inglés), que son químicos indicativos decontaminación a causa de petróleo. Los tejidos seutilizaron para evaluar el nivel de daño en el ADN, loque indica exposición a PAH y otros diversoscontaminantes.
• El daño de ADN se analizó utilizando electroforesis degel agarosa (para determinar la interrupción de la cadenade ADN) y el flujo de citometría (para determinar laruptura de cromosomas).
• Las concentraciones de sedimentos de PAH de la lagunaen Xan 3 no fueron significativamente más altas que lossitios de referencia, pero los de la Laguna Buena Vistafueron marcadamente mayores que en cualquier otrositio.
• Para T. meeki, los niveles de la cadena de ADN deruptura fueron mayores en las poblaciones Xan 3 queen los de Flor de Luna y el Río San Pedro. Para C.synspilum, el nivel de ruptura cromosomal fue mayor enel Xan 3 que en el sitio del Río San Pedro. En amboscasos, la cantidad de daño de ADN en Buena Vista fueintermedio entre el Xan 3 y otros sitios de referencia.
��������� &
�������������� ����� ��� !����������������������������������� ������������������������������ �����������������
Christopher W. Theodorakis y John W. Bickham
• Es necesaria la investigación adicional en las conexioneshidrológicas del parque y sus efectos en laredistribución contaminante, así como en los niveles deotros contaminantes.
��� ��������
Una amenaza potencial a la biota del Parque NacionalLaguna del Tigre (PNLT) que no ha sido tratada, es elimpacto de las actividades de extracción de petróleo en loscampos de petróleo Xan. La preocupación mayor es quedichas actividades podrían ocasionar contaminaciónaccidental del ambiente alrededor. La contaminaciónambiental podría tener impactos adversos sobre laspoblaciones y comunidades (Newman y Jagoe, 1996).Primero, podría resultar en una disminución en el éxitoreproductivo o un aumento en la mortalidad de organismosafectados. Esto podría provocar reducciones en la densidadpoblacional de algunas o todas las especies presentes.Algunas especies pueden ser más resistentes a los efectos decontaminación que otras. Esto podría ocasionar cambios enla estructura de la comunidad (composición de especies yabundancia relativa). Los ambientes expuestos al petróleofrecuentemente poseen menos especies que los hábitats nocontaminados ya que relativamente pocas especies puedentolerar la exposición a contaminantes asociados con elpetróleo (Newman y Jagoe, 1996).
Los ecosistemas acuáticos son particularmentesusceptibles a la contaminación por diversas razones.Primero, la contaminación terrestre y la deposiciónatmosférica tienden a eliminar los contaminantes de sistemasterrestres a acuáticos (Pritchard, 1993). En segundo lugar,debido a sus pieles y ampliamente permeables, los peces yotros organismos acuáticos son particularmente susceptiblesa los efectos de contaminación (Pritchard, 1993).

CONSERVATION INTERNATIONAL Programa de Evaluación Rápida���
Muchos hidrocarburos están ya degradados en un ambienteaeróbico, pero el ambiente acuático frecuentemente contienepoco o nada de oxígeno. Por lo tanto, los contaminantespueden persistir en ecosistemas acuáticos por mucho mástiempo que en los sistemas terrestres (Ashok y Saxena,1995). Finalmente, los organismos acuáticos contaminadosimplican un riesgo importante de salud para las personas quelos consumen o el agua en el que habitan.
Aquí evaluamos los efectos de la contaminación dehidrocarburos en el estado fisiológico de los peces comoconsecuencia de las actividades de extracción de petróleoalrededor de los pozos petrolíferos de Xan en el PNLT.Hemos tratado esto al examinar a los peces en las lagunaslocalizadas a diferentes distancias de los pozos petrolíferosde Xan. Nuestra hipótesis es que las concentraciones decontaminantes de hidrocarburo sería más alta cerca de laubicación de petróleo Xan 3, y que este patrón sería paraleloal aumentar el daño fisiológico a los peces. Existen muchasvariables naturales que pueden contribuir a la variación ensistemas biológicos a lo largo del área. Por lo tanto, si seencontraran diferencias entre el Xan 3 y las áreas dereferencia, sería difícil determinar si estas diferencias sedebían a efectos contaminantes o a otras fuentes de variaciónambiental. Los patrones paralelos de daño elevado en a lospeces junto con las elevadas concentraciones dehidrocarburos entre los sitios (es decir, una evaluacióntoxicológica) podrían proporcionar fuerte evidencia de que lacontaminación está afectando las poblaciones de peces.
Para determinar los niveles de contaminantes en elambiente, se midieron los niveles de hidrocarburospolicíclicos aromáticos (PAH, por sus siglas en inglés). Estoscompuestos son componentes característicos de lacontaminación del petróleo que se acumulan en el sedimento(Mille et al., 1998). El análisis incluye la determinación deconcentraciones de PAH tanto en agua como en sedimentos.
La evaluación de los efectos de estos compuestos en lospeces se enfocaron en las consecuencias fisiológicas pordiversas razones. Primero, frecuentemente es difícil asumirlas concentraciones del tejido corporal y los efectos tóxicosde los contaminantes de su concentración ambiental(McCarthy y Shugart, 1990). Esto se debe a que es frecuenteque la disponibilidad de ciertos químicos que son absorbidosen los tejidos de los peces (“biodisponibilidad”), es decir, lacantidad de hidrocarburos, se dan naturalmente en el agua ysedimento. Asimismo, los contaminantes ambientales seencuentran presentes usualmente como mezclas complejas, yla toxicidad de estas mezclas no pueden predecirse conexactitud para las mediciones de concentraciones de químicosindividuales (McCarthy y Shugart, 1990). Por lo tanto, lasmedidas de las respuestas fisiológicas de peces que viven enestos ambientes se necesitan para evaluar rigurosamente losimpactos de contaminación de hidrocarburos.
La respuesta fisiológica determinada que se utilizó paraesta evaluación fue daño en el ADN (ácido
desoxiribonucléico). Se ha descubierto que este tipo de dañoes característico de la exposición a PAH y contaminantes depetróleo(Bickham, 1990; Shugart, 1988). Las dos medidasutilizadas para evaluar el daño de ADN fueron ruptura decadena de ADN y daño cromosomal, medido como envariaciones de célula a célula en el contenido de ADN. ElADN es una molécula doble, y la exposición a los PAHpuede ocasionar rupturas en las cadenas de ADN (Shugart etal., 1992). Esto se debe a que los PAH se ligan químicamenteal ADN, y las encimas de reparación del ADN eliminanporciones de la cadena que contienen esta modificación.Encimas posteriores llenan estas brechas, pero hasta que lohacen, existen rupturas de cadenas temporales (Hoeijmakers,1993). Si las rupturas se encuentran solamente en una cadenade ADN (rupturas de una cadena), el cromosoma permaneceintacto, pero la integridad se pone en riesgo. Si las rupturasde cadenas suceden en dos cadenas adyacentes, entonces sepodría fragmentar la cromosoma. Una manera de medir estafragmentación es determinar la variación de célula a célula enel contenido de ADN (Bickham, 1990). Cuando loscromosomas se fragmentan, la división de una célula podríaocasionar una distribución no igual de cadenas de ADN entrelas células hijas. Esto ocasiona un aumento en la variación decélula a célula en cuanto al contenido de ADN.
El daño en el ADN puede producir la formación detumores en los peces (Bauman, 1998) o una vida más corta(Agarwal y Sohal, 1996). También podría tener un efectodeteriorante en la fertilidad y en la función inmunológica(Theodorakis et al., 1996; O’Connor et al., 1996). Esto sedebe a que las células que se dividen rápidamente son presafácil del daño al ADN, a los órganos, gónadas y embriones endesarrollo, que forman células sanguíneas blancas con altosíndices de división celular. Por lo tanto, el daño al ADNpodría indicar un aumento en la mortalidad en poblaciones deespecies además de la presencia de contaminantes tóxicos.
�������
Recolección de muestras
Los peces y las muestras de sedimentos se recolectaron enuna laguna adyacente a una instalación de bombeo depetróleo, que según nuestra hipótesis, es la fuente decontaminantes en el área de estudio, Xan 3, y en tres lagunasque se ubican a diferentes distancias de Xan 3 (Buena Vista,5.63 km; Flor de Luna, 13.46 km y Guayacán, 39.51 km).Adicionalmente, un muestreo en el Río San Pedro (a 66.89 km de Xan 3) sirvió como sitio de control distante,y probablemente no contaminado. Los peces que serecolectaron utilizando una atarraya, fueron devueltos vivosal compo. Se midió la longitud de cada pez, siendo despuésanestesiados. Se recolectaron muestras de hígado, baso ysangre, se congelaron y se preservaron en nitrógeno líquido.
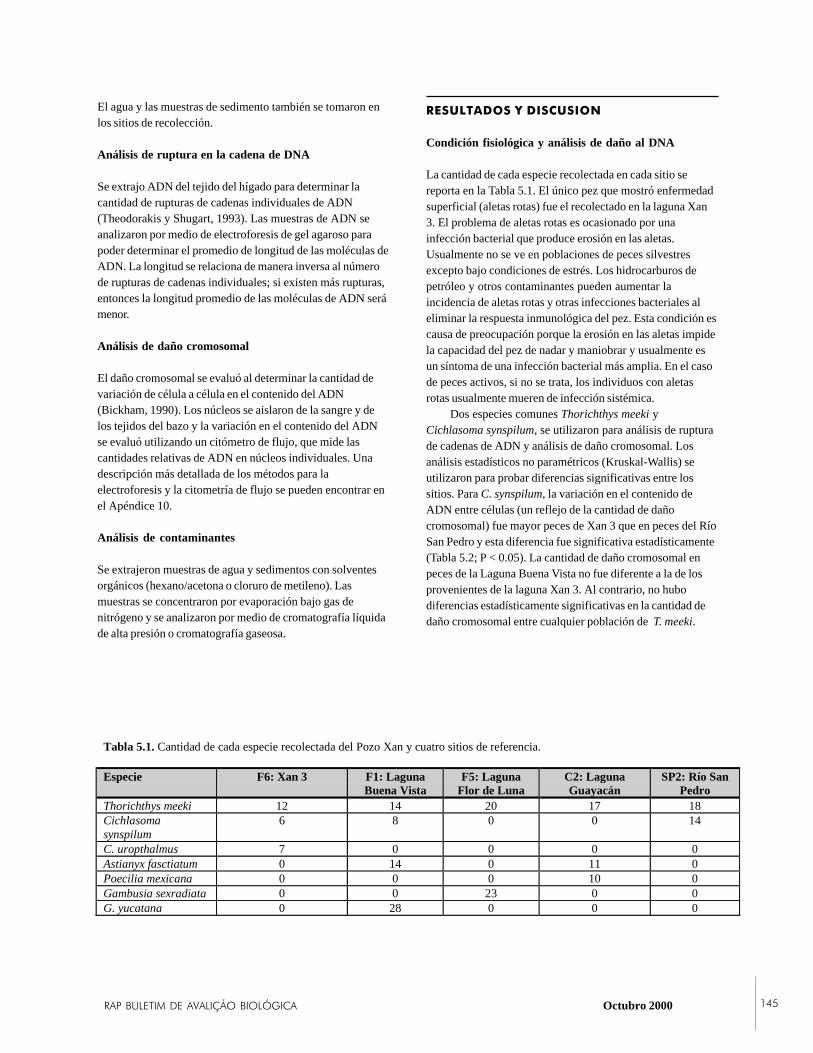
�������������� ������������� Octubro 2000 ���
El agua y las muestras de sedimento también se tomaron enlos sitios de recolección.
Análisis de ruptura en la cadena de DNA
Se extrajo ADN del tejido del hígado para determinar lacantidad de rupturas de cadenas individuales de ADN(Theodorakis y Shugart, 1993). Las muestras de ADN seanalizaron por medio de electroforesis de gel agaroso parapoder determinar el promedio de longitud de las moléculas deADN. La longitud se relaciona de manera inversa al númerode rupturas de cadenas individuales; si existen más rupturas,entonces la longitud promedio de las moléculas de ADN serámenor.
Análisis de daño cromosomal
El daño cromosomal se evaluó al determinar la cantidad devariación de célula a célula en el contenido del ADN(Bickham, 1990). Los núcleos se aislaron de la sangre y delos tejidos del bazo y la variación en el contenido del ADNse evaluó utilizando un citómetro de flujo, que mide lascantidades relativas de ADN en núcleos individuales. Unadescripción más detallada de los métodos para laelectroforesis y la citometría de flujo se pueden encontrar enel Apéndice 10.
Análisis de contaminantes
Se extrajeron muestras de agua y sedimentos con solventesorgánicos (hexano/acetona o cloruro de metileno). Lasmuestras se concentraron por evaporación bajo gas denitrógeno y se analizaron por medio de cromatografía líquidade alta presión o cromatografía gaseosa.
���������������������
Condición fisiológica y análisis de daño al DNA
La cantidad de cada especie recolectada en cada sitio sereporta en la Tabla 5.1. El único pez que mostró enfermedadsuperficial (aletas rotas) fue el recolectado en la laguna Xan3. El problema de aletas rotas es ocasionado por unainfección bacterial que produce erosión en las aletas.Usualmente no se ve en poblaciones de peces silvestresexcepto bajo condiciones de estrés. Los hidrocarburos depetróleo y otros contaminantes pueden aumentar laincidencia de aletas rotas y otras infecciones bacteriales aleliminar la respuesta inmunológica del pez. Esta condición escausa de preocupación porque la erosión en las aletas impidela capacidad del pez de nadar y maniobrar y usualmente esun síntoma de una infección bacterial más amplia. En el casode peces activos, si no se trata, los individuos con aletasrotas usualmente mueren de infección sistémica.
Dos especies comunes Thorichthys meeki yCichlasoma synspilum, se utilizaron para análisis de rupturade cadenas de ADN y análisis de daño cromosomal. Losanálisis estadísticos no paramétricos (Kruskal-Wallis) seutilizaron para probar diferencias significativas entre lossitios. Para C. synspilum, la variación en el contenido deADN entre células (un reflejo de la cantidad de dañocromosomal) fue mayor peces de Xan 3 que en peces del RíoSan Pedro y esta diferencia fue significativa estadísticamente(Tabla 5.2; P < 0.05). La cantidad de daño cromosomal enpeces de la Laguna Buena Vista no fue diferente a la de losprovenientes de la laguna Xan 3. Al contrario, no hubodiferencias estadísticamente significativas en la cantidad dedaño cromosomal entre cualquier población de T. meeki.
Tabla 5.1. Cantidad de cada especie recolectada del Pozo Xan y cuatro sitios de referencia.
Especie F6: Xan 3 F1: LagunaBuena Vista
F5: LagunaFlor de Luna
C2: LagunaGuayacán
SP2: Río SanPedro
Thorichthys meeki 12 14 20 17 18Cichlasomasynspilum
6 8 0 0 14
C. uropthalmus 7 0 0 0 0Astianyx fasctiatum 0 14 0 11 0Poecilia mexicana 0 0 0 10 0Gambusia sexradiata 0 0 23 0 0G. yucatana 0 28 0 0 0
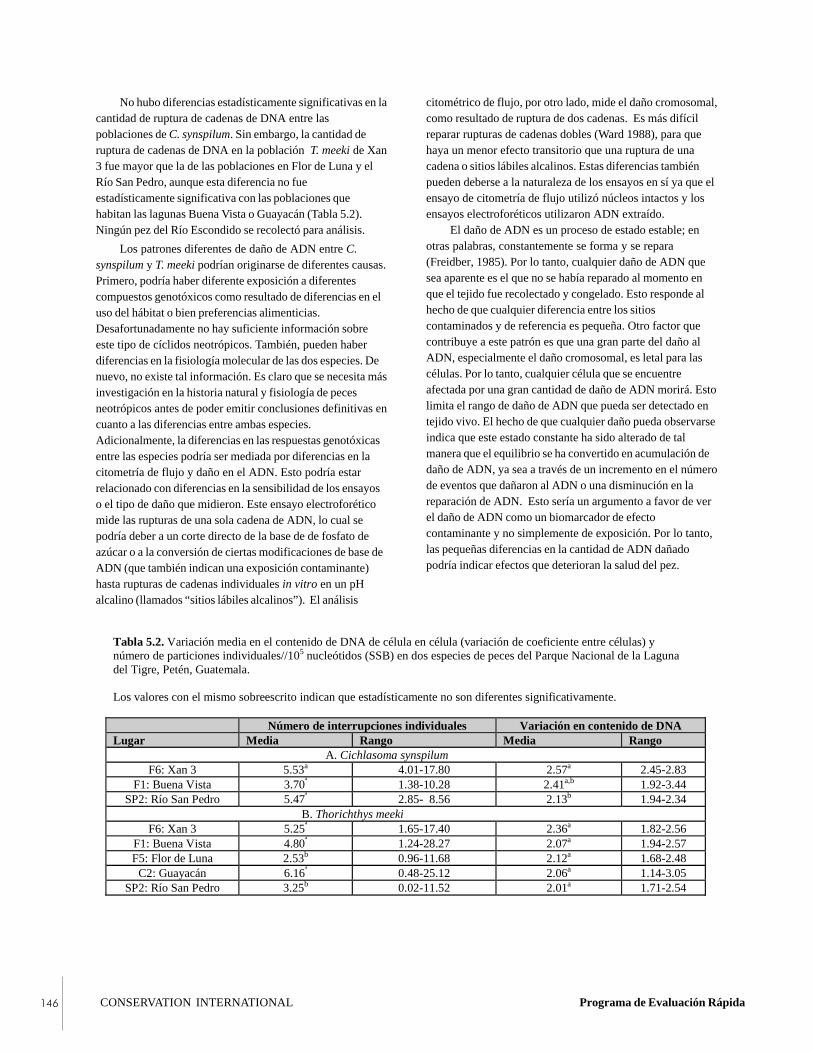
CONSERVATION INTERNATIONAL Programa de Evaluación Rápida���
Los patrones diferentes de daño de ADN entre C.synspilum y T. meeki podrían originarse de diferentes causas.Primero, podría haber diferente exposición a diferentescompuestos genotóxicos como resultado de diferencias en eluso del hábitat o bien preferencias alimenticias.Desafortunadamente no hay suficiente información sobreeste tipo de cíclidos neotrópicos. También, pueden haberdiferencias en la fisiología molecular de las dos especies. Denuevo, no existe tal información. Es claro que se necesita másinvestigación en la historia natural y fisiología de pecesneotrópicos antes de poder emitir conclusiones definitivas encuanto a las diferencias entre ambas especies.Adicionalmente, la diferencias en las respuestas genotóxicasentre las especies podría ser mediada por diferencias en lacitometría de flujo y daño en el ADN. Esto podría estarrelacionado con diferencias en la sensibilidad de los ensayoso el tipo de daño que midieron. Este ensayo electroforéticomide las rupturas de una sola cadena de ADN, lo cual sepodría deber a un corte directo de la base de de fosfato deazúcar o a la conversión de ciertas modificaciones de base deADN (que también indican una exposición contaminante)hasta rupturas de cadenas individuales in vitro en un pHalcalino (llamados “sitios lábiles alcalinos”). El análisis
No hubo diferencias estadísticamente significativas en lacantidad de ruptura de cadenas de DNA entre laspoblaciones de C. synspilum. Sin embargo, la cantidad deruptura de cadenas de DNA en la población T. meeki de Xan3 fue mayor que la de las poblaciones en Flor de Luna y elRío San Pedro, aunque esta diferencia no fueestadísticamente significativa con las poblaciones quehabitan las lagunas Buena Vista o Guayacán (Tabla 5.2).Ningún pez del Río Escondido se recolectó para análisis.
citométrico de flujo, por otro lado, mide el daño cromosomal,como resultado de ruptura de dos cadenas. Es más difícilreparar rupturas de cadenas dobles (Ward 1988), para quehaya un menor efecto transitorio que una ruptura de unacadena o sitios lábiles alcalinos. Estas diferencias tambiénpueden deberse a la naturaleza de los ensayos en sí ya que elensayo de citometría de flujo utilizó núcleos intactos y losensayos electroforéticos utilizaron ADN extraído.
El daño de ADN es un proceso de estado estable; enotras palabras, constantemente se forma y se repara(Freidber, 1985). Por lo tanto, cualquier daño de ADN quesea aparente es el que no se había reparado al momento enque el tejido fue recolectado y congelado. Esto responde alhecho de que cualquier diferencia entre los sitioscontaminados y de referencia es pequeña. Otro factor quecontribuye a este patrón es que una gran parte del daño alADN, especialmente el daño cromosomal, es letal para lascélulas. Por lo tanto, cualquier célula que se encuentreafectada por una gran cantidad de daño de ADN morirá. Estolimita el rango de daño de ADN que pueda ser detectado entejido vivo. El hecho de que cualquier daño pueda observarseindica que este estado constante ha sido alterado de talmanera que el equilibrio se ha convertido en acumulación dedaño de ADN, ya sea a través de un incremento en el númerode eventos que dañaron al ADN o una disminución en lareparación de ADN. Esto sería un argumento a favor de verel daño de ADN como un biomarcador de efectocontaminante y no simplemente de exposición. Por lo tanto,las pequeñas diferencias en la cantidad de ADN dañadopodría indicar efectos que deterioran la salud del pez.
Tabla 5.2. Variación media en el contenido de DNA de célula en célula (variación de coeficiente entre células) ynúmero de particiones individuales//105 nucleótidos (SSB) en dos especies de peces del Parque Nacional de la Lagunadel Tigre, Petén, Guatemala.
Los valores con el mismo sobreescrito indican que estadísticamente no son diferentes significativamente.
Número de interrupciones individuales Variación en contenido de DNALugar Media Rango Media Rango A. Cichlasoma synspilum
F6: Xan 3 5.53a 4.01-17.80 2.57a 2.45-2.83F1: Buena Vista 3.70ª 1.38-10.28 2.41a,b 1.92-3.44
SP2: Río San Pedro 5.47ª 2.85- 8.56 2.13b 1.94-2.34 B. Thorichthys meeki
F6: Xan 3 5.25ª 1.65-17.40 2.36a 1.82-2.56F1: Buena Vista 4.80ª 1.24-28.27 2.07a 1.94-2.57F5: Flor de Luna 2.53b 0.96-11.68 2.12a 1.68-2.48
C2: Guayacán 6.16ª 0.48-25.12 2.06a 1.14-3.05SP2: Río San Pedro 3.25b 0.02-11.52 2.01a 1.71-2.54

�������������� ������������� Octubro 2000 ���
Tabla 5.3. Concentraciones de sedimento de hidrocarburos aromáticos policíclicos.
Concentración surrogada corregida (ng PAH/g sedimento seco)a
CompuestoF6: Xan 3 F1: Buena
VistaF5: Flor de
LunaC2: Guayacán SP2: Río San
PedroNaftaleno 6.1 15.4 2.8 56.0 2.4Naftalenos C1 9.7 25.2 3.9 44.1 3.0Naftalenos C2 13.6 90.1 21.5 44.0 6.7Naftalenos C3 17.1 54.4 11.2 23.4 7.2Naftalenos C4 13.9 85.4 11.6 34.1 8.8Bifenil 2.7 5.3 0.7 11.9 0.8Acenaftileno BMDLb 0.7 BMDLb BMDLb BMDLb
Acentafteleno 2.3 9.7 0.9 6.0 0.8Fluoreno 5.5 29.2 1.8 17.0 1.8Fluorenos C1 11.3 37.6 3.6 9.5 3.2Fluorenos C2 27.5 190.0 17.0 75.7 15.2Fluorenos C3 13.0 53.5 9.3 18.6 13.9Fenantreno 15.4 69.3 12.2 23.7 12.7Antraceno 1.4 5.8 0.5 4.6 0.8Fenantrenos/Antracenos C1 18.3 94.8 29.0 34.8 16.8Fenantrenos/Antracenos C2 15.1 72.7 13.0 17.7 14.4Fenantrenos/Antracenos C3 4.6 29.8 6.9 7.1 4.7Fenantrenos/Antracenos C4 3.0 17.8 5.4 3.8 1.9Dibenzotiofen 1.1 12.8 1.7 5.5 1.3Dibenzotiopenos C1 4.5 31.0 4.6 4.2 4.7Dibenzotiopenos C2 6.9 52.4 8.5 7.5 7.5Dibenzotiopenos C3 4.5 42.5 4.4 3.8 3.5Fluoranteno 1.8 17.6 2.3 10.0 2.4Pireno 1.5 13.5 2.0 8.4 2.4Pirenos/Fluorantenos C1 1.5 4.2 BMDLb 6.0 0.7Benz(a)ntraceno 0.3 1.8 0.2 3.3 0.2Criseno 0.3 2.1 0.3 3.1 0.3Crisenos C1 4.9 16.4 2.6 6.1 1.2Crisenos C2 10.9 37.4 16.8 14.9 1.7Crisenos C3 2.8 49.3 1.1 24.5 2.0Crisenos C4 0.7 11.0 1.3 3.4 2.8Benzo(b)fluoranteno 0.6 1.8 0.7 2.8 0.5Benzo(k)fluoranteno BMDLb 2.1 0.8 2.7 0.3Continuación de tabla 10Benzo(e)pireno 0.4 1.6 0.4 1.3 0.4Benzo(a)pireno 0.3 0.8 0.7 1.5 0.4Perileno BMDLb 4.4 BMDLb 64.2 BMDLb
Indeno(1,2,3-c,d)pireno BMDLb 1.5 0.7 BMDLb BMDLb
Dibenzo(a,h)antraceno BMDLb BMDLb 0.5 BMDLb BMDLb
Benzo(g,h,i)perileno BMDLb 1.1 BMDLb BMDLb BMDLb
Total de PAHs 225 1190 202 612 148Recuperación de % de surrogado relacionado
Surrogado % de recuperaciónNaftaleno d8 88 75 74 72 83Acentafteno d10 95 102 97 78 109Fenantreno d10 108 71 103 96 117Criseno d12 70 65 72 62 77Perileno d12 81 51 92 62 87a Cada muestra de sedimento se relacionó con un sedimento de PAH y las concentraciones se normalizaron por el % derecuperación del surrogadob Inferior al límite mínimo de detección

CONSERVATION INTERNATIONAL Programa de Evaluación Rápida���
Recomendamos que se inicie un programa de monitoreoambiental y que se realice una evaluación de riesgosecológicos y salud humana con detalle para controlar variosproblemas que incluyen lo siguiente:
• una determinación de la fuente de estrés, enfermedad dealetas y genotoxicidad en los peces de las lagunasadyacentes a las instalaciones petroleras de Xan;
• una descripción más detallada de los posiblescontaminantes en las instalaciones petroleras de Xan;
• una determinación del origen de PAH en la LagunaBuena Vista y, más general, estudios de las conexioneshidrológicas que varían de acuerdo con la temporada enlas cercanías de las instalaciones petroleras de Xan, paraque los patrones de redistribución de los contaminantespotenciales se pueda comprender; y
• una evaluación de cualquier efecto de salud posible porla exposición de PAH en la población local que seencuentra en las áreas al rededor de las instalaciones deXan.
���� ��� �� ������
Agarwal, S. y R. S. Sohal. 1994. DNA oxidative damageand life expectancy in houseflies. Proceedings of theNational Academy of Sciences 91: 12,332-12,335.
Ashok, B. T. y S. Saxena. 1995. Biodegradation ofpolycyclic aromatic-hydrocarbons—a review. Journalof Scientific & Industrial Research 54: 443-451.
Bauman, P. C. 1998. Epizootics of cancer in fish associatedwith genotoxins in sediment and water. MutationResearch—Reviews in Mutation Research 411: 227-233.
Análisis de contaminantes
Se determinaron las concentraciones de sedimentos de PAHpara Xan 3, así como para las lagunas Flor de Luna y BuenaVista, y los ríos Escondido y San Pedro. Las muestras desedimento para Guayacán se perdieron debido a la rupturade los contenedores que se encontraban en camino a TexasA&M University. El total de las concentraciones desedimentos de PAH para Flor de Luna, Río Escondido, RíoSan Pedro, Buena Vista y Xan 3, fueron respectivamente202, 148, 612, 1190 y 225 ng PAH/g de sedimento seco(partes por mil de millones). Las concentraciones deisómeros individuales de PAH se enumeran en la Tabla 5.3.
Estos datos muestran que la cantidad de PAH en lamuestra de sedimento de la Xan 3 son menores o iguales quelos de los sitios de referencia. Sin embargo, los datos de losanálisis del daño de ADN y del daño cromosomal indicanque los peces de Xan 3 están siendo expuestos a un agenteque daña el ADN. Esto es según la observación de que lospeces de Xan 3 y ningún pez de cualquier otro sitio - mostrósignos de enfermedad. Esto siguiere que los peces estánsiendo presionados por contaminantes u otros PAH. Existenmuchos otros compuestos además de los PAH que ocasionandaño en el ADN, por ejemplo metales pesados,hidrocarburos clorinados, arsénico, cromo, pesticidas ycompuestos nitroaromáticos. Los procedimientos deevaluación de riesgo detallados podrían implementarse, loque haría posible identificar la fuente de su genotoxicidad.Un hallazgo no esperado fue que la cantidad de PAH en elsedimento fue mucho mayor en la Laguna Buena Vista que encualquier otro sitio. Eso podría explicar las elevadascantidades de ruptura de cadenas de ADN en los peces deeste sitio. También hay evidencia de que los peces enGuayacán están expuestos a agentes de daño.
��������������� ��������������
La hipótesis de que la instalación de petróleo Xan 3 tiene unimpacto en el ambiente que la rodea, no puede ser rechazadaporque hubo evidencia de estrés y daño de ADN en lospeces desde la laguna adyacente. Concluimos que la cantidadde ADN, daña a los peces en Xan 3 y fue mayor que en elRío San Pedro, con resultados intermedios para elapareamiento de peces en las cercanías de Xan 3. El hallazgode concentraciones de PAH más altas en la laguna BuenaVista que en cualquier otra fue inesperado. Este resultadopuede deberse a patrones complicados de intercambio deaguas entre lagunas durante la estación lluviosa y otrasfuentes contaminantes. Las concentraciones de PAHindividuales en el sedimento, sin embargo, fue mucho másbajas que los criterios del US EPA, para la protección deinvertebrados bénticos, que se basa en pruebas de toxicidad a
corto plazo de químicos sencillos (US EPA, 1991a, 1991b,1991c). Sin embargo, los efectos a largo plazo de laexposición a múltiples químicos en la salud ambiental yhumana son desconocidos. El hecho de que la poblaciónhumana local utiliza bastante a Buena Vista para pescar,bañarse, lavar y recreación es de mucha preocupación.Aunque los datos no indican una amenaza extrema alambiente y salud humana, sugieren que se debe iniciar unmanejo mejorado.

�������������� ������������� Octubro 2000 ���
Bickham, J. W. 1990. Flow cytometry as a technique tomonitor the effects of environmental genotoxins onwildlife populations. Pp 97-108 in In Situ Evaluationof Biological Hazard of Environmental Pollutants (S.Sandhu, W. R. Lower, F. J. DeSerres, W. A. Suk, andR. R. Tice, eds.). Environmental Research Series Vol.38. Plenum Press, New York, NY, USA.
Bickham, J. W., J. A. Mazet, J. Blake, M. J. Smolen, Y.Lou y B. E. Ballachey. 1998. Flow cytometricdetermination of genotoxic effects of exposure topetroleum in mink and sea otters. Ecotoxicology 7:191-199.
Freeman, S. E. y B. D. Thompson. 1990. Quantitation ofultraviolet radiation-induced cyclobutyl pyrimidinedimers in DNA by video and photographic densitom-etry. Analytical Biochemistry 186: 222-228.
Freidberg, E. C. 1985. DNA Repair. Plenum Press, NewYork, NY, USA.
Hoeijmakers, J. H. J. 1993. Nucleotide excision repair II,from yeast to mammals. Trends in Genetics 9: 211-217.
McCarthy, J. F. y L. R. Shugart. 1990. Biomarkers ofenvironmental contamination. Pp. 3-16 in Biomarkersof Environmental Contamination (J. F. McCarthy andL. R. Shugart, eds.). Lewis Publishers, Boca Raton,FL, USA.
Mille, G., D. Munoz, F. Jacquot, L. Rivet y J. C. Bertrand.1998. The Amoco Cadiz oil spill: evolution ofpetroleum hydrocarbons in the Iie Grande saltmarshes (Brittany) after a 13-year period. EstuarineCoastal and Shelf Science 47: 547-559.
Newman, M. C. y C. H. Jagoe (eds.). 1996. Ecotoxicology:A Hierarchical Treatment. Lewis Publishers, BocaRaton, FL, USA.
O’Connor, A., C. Nishigori, D. Yarosh, L. Alas, J. Kibitel,L. Burley, P. Cox, C. Bucana, S. Ullrich y M. 1996.DNA double strand breaks in epidermal cells causeimmune suppression in vivo and cytokine productionin vitro. Journal of Immunology 157: 271-278.
Pritchard, J. B. 1993. Aquatic toxicology—past, present,and prospects. Environmental Health Perspectives100: 249-257.
Shugart, L. R. 1988. An alkaline unwinding assay for thedetection of DNA damage in aquatic organisms.
Shugart, L. R., J. Bickham, G. Jackim, G. McMahon, W.Ridley, J. Stein y S. Steinert. 1992. DNA alterations.Pp. 125-154 in Biomarkers: Biochemical, Physiologi-cal, and Histological Markers of Anthropogenic Stress(R. J. Huggett, R. A. Kimerle, P. M. Mehrle Jr., H. L.Bergman, eds.). Lewis Publishers, Boca Raton, FL,USA.
Theodorakis, C. W., B. G. Blaylock y L. R. Shugart. 1996.Genetic ecotoxicology I: DNA integrity and reproduc-tion in mosquitofish exposed in situ to radionuclides.Ecotoxicology 5: 1-14.
Theodorakis, C. W. y L. R. Shugart. 1993. Detection ofgenotoxic insult as DNA strand breaks in fish bloodcells by agarose gel electrophoresis. EnvironmentalToxicology and Chemistry 13: 1023-1031.
Theodorakis, C. W., S. J. D’Surney, J. W. Bickham, T. B.Lyne, B. P. Bradley, W. E. Hawkins, W. L. Farkas, J.F. McCarthy y L. R. Shugart. 1992. Sequentialexpression of biomarkers in bluegill sunfish exposed tocontaminated sediment. Ecotoxicology 1:45-73.
U.S. Environmental Protection Agency. 1991a. Proposedsediment quality criteria for the protection of benthicorganisms: Acenapthene. U.S. EPA, Washington, DC,USA.
U.S. Environmental Protection Agency. 1991b. Proposedsediment quality criteria for the protection of benthicorganisms: Fluoranthene. U.S. EPA, Washington, DC,USA.
U.S. Environmental Protection Agency. 1991c. Proposedsediment quality criteria for the protection of benthicorganisms: Nanthrene. U.S. EPA, Washington, DC,USA.
Vindelov, L. L., I. J. Christianson, N. Keiding, M. Prang-Thomsen y N. I. Nissen. 1983. Long-term storage ofsamples for flow cytometric DNA analysis.Cytometry 3: 317-320.
Vindelov, L. L., and I. J. Christensen. 1990. A review oftechniques and results obtained in one laboratory byan integrated system of methods designed for routineclinical flow cytometric DNA analysis. Cytometry11: 753-770.
Ward, J.F. 1988. DNA damage produced by ionizing-radiation in mammalian-cells-identities, mechanisms offormation, and repairability. Prog. Nucl. Acid. Res.Mol. Biol. 35: 95-125.
CONSERVATION INTERNATIONAL Programa de Evaluación Rápida���
������
• Un total de 173 especies de aves se registraron en elParque Nacional Laguna del Tigre (PNLT),aproximadamente 60.7% del número total de especies(N=285) reportadas del parque. De estas, 157 sereportaron en conteo de puntos; el resto en conteos nosistemáticos.
• Se realizaron once registros nuevos de aves para la listaoficial del parque, para un total de 296 especies de aves.Los registros nuevos incluyen Aramus guarauma,Calidris minutilla, C. melanotus, C. fuscicollis,Cyanocorax yucatanicus, Cardinalis cardinalis, e Himantopus mexicanus. Las extensiones de ladistribución también se registraron para tres de losnuevos registros: Tyrannus savana monachus,Laterallus exilis y Pyrocephalus rubinus.
• En general, los ciconiformes (aves zancudas grandes) sedistribuyeron ampliamente en el parque; eran másabundantes en las ciénagas del Río Escondido y elbosque de dosel abierto del Río Sacluc y Río San Pedro.Los especialistas forestales eran numerosos en colinas ybosques cerrados del este del área de San Pedro; estosincluyen Crax rubra, Agriocharis ocellata, Automolusochrolaemus, dendrocoláptidos y troglodítidos.
• La fuente de variación principal en la composición deespecies en el parque es el contraste entre las partes deloeste, incluyendo el biotopo y los humedales al rededory las áreas boscosas de las partes centrales (Chocop/Candelaria) y orientales (Río San Pedro/Sacluc) delparque. El área oriental fue única y contenía muchasespecies encontradas solamente allí, incluyendo Calidrisminutilla, C. fusciola, C.melanotus, Himantopus
��������� "
�����#��������� ����������#� ���������$%��#�����������!���������������������� ������������������������ �����������������
Edgar Selvin Pérez y Miriam Lorena Castillo Villeda
mexicanus, Laterallus exillis, Phorphyrula martinica,Jacana spinosa (asociadas con playones, aguasestancadas poco profundas), Tyrannus savanamonachus y Pyrocephalus rubinus (asociada consabanas inundadas en La Lámpara).
��� ��������
El Parque Nacional Laguna del Tigre representa un área dehumedales muy importante internacionalmente paraGuatemala. El parque se registró como un sitio Ramsar en1990 y también se incluyó en el registro Montreaux 1993.El listado anterior fue necesario debido a la amenazaocasionada por la explotación de petróleo en el parque(Carbonell et al., 1998). La meta de este estudio fuedocumentar y comparar la diversidad de las aves del humedalen diferentes áreas dentro del PNLT y contribuir aldesarrollo de estudios de monitoreo de aves en esta área dehumedales importante.
Tres tipos de hábitat de aves importantes se puedendistinguir en los humedales del PNLT: 1) bosques ribereños;2) sabanas inundadas, pantanos o humedales; y 3) zonas decontaminación (operaciones petroleras, agricultura,colonizaciones, etc). Estos hábitats y los microhábitats quecontienen, tienden a mantener diferentes tipos de aves,incluyendo especies que utilizan árboles ribereños y dehumedales y arbustos; áreas con vegetación espesa;vegetación emergente alta y robusta; usualmente en áreasabiertas y árboles altos en áreas ribereñas. Así, la estructurade la vegetación se espera que sea un determinante principalde los patrones de composición de especies para aves dehumedales (Zigûenza, 1994).
Un estudio base de aves para un programa de monitoreoen PNLT (Méndez et al., 1998) realizó 41 registros

���������������������� ���������������������� Julio 2000 ���
importantes para un total de 285 especies, incluyendo unnuevo registro para El Petén (Zenaida asiatica) y el índice deextensión del Nyctibius grandis. Nuestro objetivo fuecomplementar este esfuerzo al ampliar el número deasociaciones de vegetación y áreas muestreadas dentro delPNLT. También proporcionamos un foco en las relacionesentre aves y hábitats acuáticos que no se ha vistopreviamente en estudios.
�������
Las aves fueron muestreadas en tres hábitats diferentes. Lasáreas ribereñas sirvieron para tomar muestras a lo largo delos ríos San Pedro, Sacluc, Candelaria, Chocop y partes delRío Escondido. Se consideraron tres tipos de macrohábitatsdentro de las áreas ribereñas. Estudiamos el bosque ribereñoabierto y cerrado, los pantanos en combinación con losbosques ribereños inundaban la sabana compuesta de sibales(sibal), árboles (por ejemplo, Crescentia sp.), tasiste(Acoelorraphe wrightii) y hierbas. Este último macrohábitatera más común en el área de Río Escondido y endeterminadas lagunas como La Lámpara. En segundo lugar,se estudiaron las ciénagas/humedales, ejemplificados por lavegetación del Río Escondido dentro del biotopo y en suconfluencia con el Río San Pedro. Esta categoría de hábitatfue la menos común de los tres tipos de hábitats.Finalmente, se examinaron las áreas de vegetacióndesequilibradas y regeneradas (guamiles) tal como aquellasque se encuentran cerca de los poblados, operacionespetroleras y campos agrícolas abandonados.
El muestreo se enfocó en los cuatro puntos principalesutilizados en este estudio RAP (refiérase a “Itinerario de laExpedición y Diccionario Geográfico”). Para el muestreo dereptiles y anfibios (Castañeda Moya et al. este volumen), eluso de puntos discretos de muestreo se consideróinadecuado debido a que las aves utilizan hábitats sobreescalas relativamente amplias. Así, muestreamos aves en lasorillas de los lugares con agua utilizando conteos de 20puntos por ubicación. Las unidades de muestra individualestratadas incluían el Río San Pedro, Río Sacluc, RíoEscondido, Laguna Flor de Luna, Río Chocop, RíoCandelaria y Laguna La Lámpara (Tabla 6.1, Apéndice 1).En el Río Chocop pudimos muestrar solamente 10 puntos.Para estudios sobre ríos, el conteo de puntos sedistribuyeron a lo largo del río. Para estudios de lagunas, elconteo de puntos fue tomado mientras caminábamos a lolargo de la orilla de los mismos.
Para elegir los métodos más efectivos y convenientespara muestrear especies de aves acuáticas en el parque,comparamos inicialmente tres estrategias de muestreo.Conteos de puntos audiovisuales realizados al establecer 10puntos establecidos en forma ecuánime en una distancia detres kilómetros (es decir, conteo de un punto cada 300
metros) que fueron estudiados en una sóla sesión. Lasespecies observadas y escuchadas se registraron durante 10minutos en cada punto. Las aves también fueronmuestreadas mediante viajes a una velocidad constante (10km/h) en una lancha de motor y grabando cada ave observaday escuchada en un área de tres kilómetros. Finalmente,muestreamos aves durante la noche en áreas de treskilómetros para grabar sitios amplios durante la noche,especialmente para especies comunales. Para cada esquemade muestreo, registramos el tipo de hábitat en el cual seencontró cada especie y su comportamiento en ese hábitat(por ejemplo, alimentación, el momento de pernoctar).
Después de una evaluación inicial de estos métodos,decidimos utilizar solamente conteo de puntos audiovisuales.Este método probó ser el más efectivo para grabar el númeromás grande de especies en diferentes tipos de hábitats asícomo para identificar cada ave activa como pájaroscarpinteros, pericos y crácidos. Nuestro censo fue apoyadopor el uso de un micrófono direccional para registrar lasllamadas que no fueron reconocidas inmediatamente.También se registraron las observaciones no sistemáticaspero no se incluyeron en el análisis de datos.
Tabla 6.1. Distribución de la intensidad del muestreo porpunto focal, Parque Nacional Laguna del Tigre, RBM, Petén.
Áreas focales Extensión delmuestreo
Tipos de hábitatsmuestreados
Río San Pedro De PasoCaballos(SP2) a LaCaleta (SP8).
Bosque conectadocon bosques altos enlas montañas, áreaspantanosas.
Río Sacluc Casi todo el ríoSacluc.
Bosques abiertos ycerrados.
Río Escondido Casi 2/3 del río(cuando se puedenavegar).
Bosques abiertos ycerrados, ciénagascon sibal, caños,áreas quemadas.
Flor de Luna Laguna Flor deLuna
Bosques abiertos,sabana inundada,,“guamiles” yciénagas con sibal.
Río Chocop Partes del ríoChocop yCandelaria.Aparte, Laguna LaLámpara.
Bosques abiertos ycerrados, ciénagas,áreas con problemas(guamiles deoperacionespetroleras, áreasquemadas),vegetación basta conNymphea.

CONSERVATION INTERNATIONAL Programa de Evaluación Rápida���
0
20
40
60
80
100
SAN PEDRO
SACLUC
ESCONDIDO
FLOR D
E LUNA
CHOCOP
CANDELARIA
LAM
PARA
# of spp.
# exclusive spp.
se encontró en los ríos San Pedro, Sacluc y Escondido,mientras que se observaron relativamente menos especies enlos ríos Chocop y Candelaria (Figura 6.1). Esto último puedeser debido al área tan reducida de bosque cerrado. La riquezade especies encontradas en los ríos de San Pedro y Saclucpuede ser debido a condiciones de clima favorables durante elmuestreo y la proximidad de los grandes bosques altos.Muchas especies de aves registradas por los especialistasforestales en estas áreas (c.f. Whitacre, 1996), incluyendopájaros carpinteros, trogones, motmots, pavos deAmericanos, chachalacas, guacos y algunos mosqueritos.Algunas de estas especies se encontraron únicamente enestos lugares, como Xiphorynchus flavigaster, Agriocharisocellata, Crax rubra y Trogon massena.
El área del Río Escondido alberga diversosmacrohábitantes ribereños, incluyendo sibales, bosquesabiertos y cerrados (es decir, Punto Icaco, E8). Las zonasadyacentes en el lado oeste del parque, junto con la LagunaLa Lámpara, representan un hábitat único compuesto deciénagas y sabanas inundadas. Estos hábitats alberganespecies de aves como Rostramus sociabilis, Laterallusexillis, Aramus guarauma y Jabiru mycteria.
El área central del parque, representado aquí por el áreaprincipal de Chocop/Candelaria, presentó especies de avesúnicas como Dendrocygna anabatina (piche piquirrojo), quese observó en una laguna cerca del Pozo Xan 1. Esta zonatiene bosques cerrados y albergan especies principalesboscosas como Micrastur semitorquatus y Xenops minutus,que también se registraron en los ríos Sacluc y San Pedrodurante estudios anteriores (Pérez, 1998).
La jacana (Jacana spinosa) se asocia con vegetaciónartificial y se registró solamente en lagunas que poseen laninfa Nymphaea ampla y en los humedales poco profundosdel Río Escondido, en donde se encontró Porphirulamartinica, Laterallus ruber y L. exillis. Busarellus nigricollisy Rostramus sociabilis se registraron en lagunas aisladas y seasociaron con vegetación emergente en ciénagas con sibales.
Los análisis de similitud revelaron que generalmentehabía un alto grado de similitud en la composición deespecies entre las áreas de muestra (Tabla 6.2). Las áreas deSan Pedro y Sacluc comparten 60 especies debido a suproximidad. La mayoría del avifauna de Río Escondido yLaguna La Lámpara se encontró en San Pedro y la mayoríade estas especies se asociaron con bosques abiertos y dehumedales (consulte Léon y Morales Can, este volumen).Las especies que habitan los prados inundados, sin embargo,no se encontraron en el área de San Pedro; estos incluyenTyrannus savana monachus, Pyrocephalus rubinus yAramus guarauma. De los sitios visitados, solamente LaLámpara mostró prados inundados, compuestosprincipalmente de Cladium jamaicense y otras especies deCyperaceae, pastos, árboles (Crescentia alata) y tasiste(Acoelorraphe wrightii) en determinadas áreas. Este tipo dehábitat también es llamado “campería” por los habitanteslocales. Un número pequeño de familias se ha establecido enlas orillas de esta laguna. Una combinación de estrés debido ala variación del clima (Kushlan et al., 1995) y una alteraciónatropogénica local pueden amenazar la existencia de unhábitat crítico en este lugar.
El tipo de bosque cerrado se comparte entre los ríosChocop, Candelaria y Sacluc; como consecuencia, la avifaunade estos sitios es similar (Tabla 6.2). Las especies de avesacuáticas de este tipo de bosque son tipificadas por lapresencia de guardarríos como Chloroceryle americana y C.aenea, que a menudo pernoctan en áreas cercanas al agua.
���������������������
Registramos un total de 2103 individuos en 173 especies, 42familias y 17 órdenes (Apéndice 11). La mayoría de losindividuos fueron paseriformes. El número de especiescontadas corresponde al 60.7% de la avifauna encontrada enel parque (Méndez et al., 1998).
Los registros de las nuevas especies para el PNLTincluyen Aramus guarauma, Calidris minutilla, C.melanotus, C. fuscicollis, Cyanocorax yucatanicus,Cardinalis cardinalis, e Himantopus mexicanus. Los rangosde distribución se ampliaron para Tyrannus savanamonachus, Laterallus exilis y Pyrocephalus rubinus (en basea los mapas en Howell y Webb 1995). Se observó Jabirumycteria que no se había registrado en esta área por 10 años(Herman A. Kihn, pers. com.).
Comparaciones de avifauna entre áreas focales
En general, las especies de aves fueron distribuidashomogéneamente en todo el parque. La mayor riqueza
Figura 6.1 Patrones de riqueza de especies de aves y elnúmero de especies exclusivas (no se encontró en otramuestra) entre las áreas de muestra en el PNLT.
# de
esp
ecie
s
de spp.
exclusivo de spp.
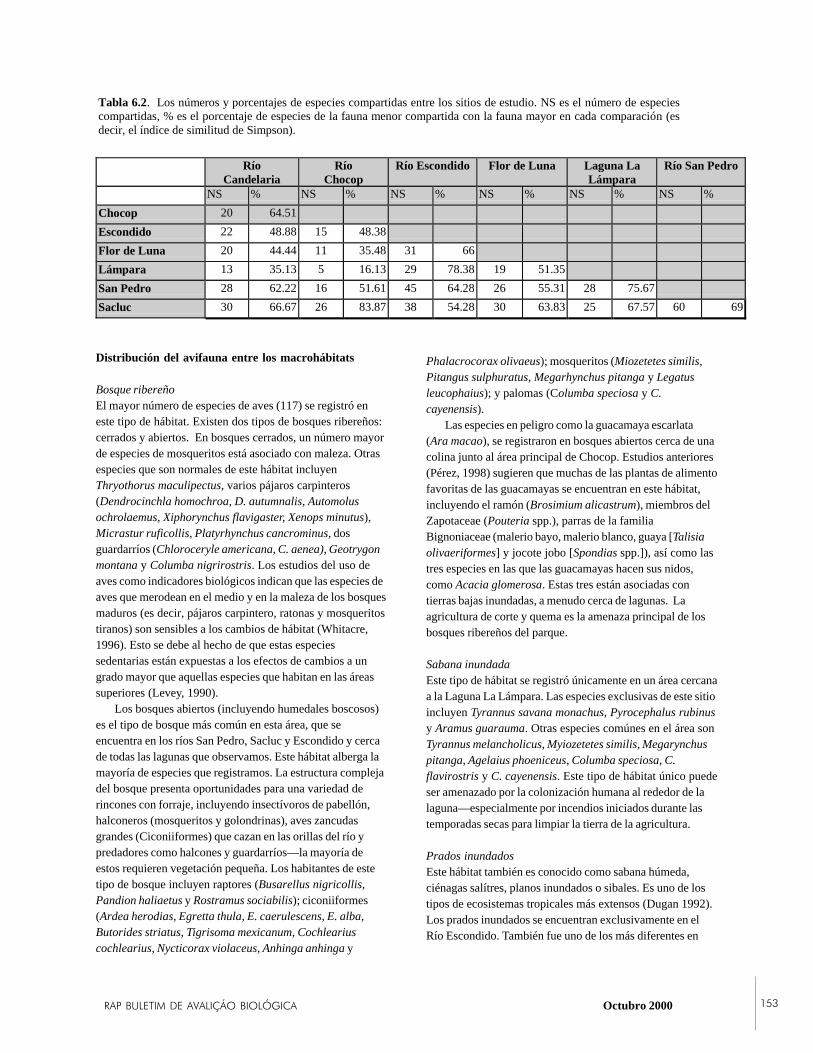
�������������� ������������� Octubro 2000 ���
Distribución del avifauna entre los macrohábitats
Bosque ribereñoEl mayor número de especies de aves (117) se registró eneste tipo de hábitat. Existen dos tipos de bosques ribereños:cerrados y abiertos. En bosques cerrados, un número mayorde especies de mosqueritos está asociado con maleza. Otrasespecies que son normales de este hábitat incluyenThryothorus maculipectus, varios pájaros carpinteros(Dendrocinchla homochroa, D. autumnalis, Automolusochrolaemus, Xiphorynchus flavigaster, Xenops minutus),Micrastur ruficollis, Platyrhynchus cancrominus, dosguardarríos (Chloroceryle americana, C. aenea), Geotrygonmontana y Columba nigrirostris. Los estudios del uso deaves como indicadores biológicos indican que las especies deaves que merodean en el medio y en la maleza de los bosquesmaduros (es decir, pájaros carpintero, ratonas y mosqueritostiranos) son sensibles a los cambios de hábitat (Whitacre,1996). Esto se debe al hecho de que estas especiessedentarias están expuestas a los efectos de cambios a ungrado mayor que aquellas especies que habitan en las áreassuperiores (Levey, 1990).
Los bosques abiertos (incluyendo humedales boscosos)es el tipo de bosque más común en esta área, que seencuentra en los ríos San Pedro, Sacluc y Escondido y cercade todas las lagunas que observamos. Este hábitat alberga lamayoría de especies que registramos. La estructura complejadel bosque presenta oportunidades para una variedad derincones con forraje, incluyendo insectívoros de pabellón,halconeros (mosqueritos y golondrinas), aves zancudasgrandes (Ciconiiformes) que cazan en las orillas del río ypredadores como halcones y guardarríos—la mayoría deestos requieren vegetación pequeña. Los habitantes de estetipo de bosque incluyen raptores (Busarellus nigricollis,Pandion haliaetus y Rostramus sociabilis); ciconiiformes(Ardea herodias, Egretta thula, E. caerulescens, E. alba,Butorides striatus, Tigrisoma mexicanum, Cochleariuscochlearius, Nycticorax violaceus, Anhinga anhinga y
Phalacrocorax olivaeus); mosqueritos (Miozetetes similis,Pitangus sulphuratus, Megarhynchus pitanga y Legatusleucophaius); y palomas (Columba speciosa y C.cayenensis).
Las especies en peligro como la guacamaya escarlata(Ara macao), se registraron en bosques abiertos cerca de unacolina junto al área principal de Chocop. Estudios anteriores(Pérez, 1998) sugieren que muchas de las plantas de alimentofavoritas de las guacamayas se encuentran en este hábitat,incluyendo el ramón (Brosimium alicastrum), miembros delZapotaceae (Pouteria spp.), parras de la familiaBignoniaceae (malerio bayo, malerio blanco, guaya [Talisiaolivaeriformes] y jocote jobo [Spondias spp.]), así como lastres especies en las que las guacamayas hacen sus nidos,como Acacia glomerosa. Estas tres están asociadas contierras bajas inundadas, a menudo cerca de lagunas. Laagricultura de corte y quema es la amenaza principal de losbosques ribereños del parque.
Sabana inundadaEste tipo de hábitat se registró únicamente en un área cercanaa la Laguna La Lámpara. Las especies exclusivas de este sitioincluyen Tyrannus savana monachus, Pyrocephalus rubinusy Aramus guarauma. Otras especies comúnes en el área sonTyrannus melancholicus, Myiozetetes similis, Megarynchuspitanga, Agelaius phoeniceus, Columba speciosa, C.flavirostris y C. cayenensis. Este tipo de hábitat único puedeser amenazado por la colonización humana al rededor de lalaguna—especialmente por incendios iniciados durante lastemporadas secas para limpiar la tierra de la agricultura.
Prados inundadosEste hábitat también es conocido como sabana húmeda,ciénagas salítres, planos inundados o sibales. Es uno de lostipos de ecosistemas tropicales más extensos (Dugan 1992).Los prados inundados se encuentran exclusivamente en elRío Escondido. También fue uno de los más diferentes en
Tabla 6.2. Los números y porcentajes de especies compartidas entre los sitios de estudio. NS es el número de especiescompartidas, % es el porcentaje de especies de la fauna menor compartida con la fauna mayor en cada comparación (esdecir, el índice de similitud de Simpson).
RíoCandelaria
RíoChocop
Río Escondido Flor de Luna Laguna LaLámpara
Río San Pedro
NS % NS % NS % NS % NS % NS %
Chocop 20 64.51
Escondido 22 48.88 15 48.38
Flor de Luna 20 44.44 11 35.48 31 66
Lámpara 13 35.13 5 16.13 29 78.38 19 51.35
San Pedro 28 62.22 16 51.61 45 64.28 26 55.31 28 75.67
Sacluc 30 66.67 26 83.87 38 54.28 30 63.83 25 67.57 60 69
CONSERVATION INTERNATIONAL Programa de Evaluación Rápida���
• Investigar la asociación entre Tyrannus savanamonachus y Pyrocephalus rubinus con hábitats de lasabana inundada de La Lámpara.
• Implementar un programa de monitoreo para documentarlos cambios en la diversidad de las aves durante loscambios en los diferentes tipos de hábitats y usar estosdatos para establecer los límites de tolerancia paraespecies determinadas de aves.
• Proporcionar una perspectiva unificada regional para elmanejo de la avifauna de los humedales del oeste de laRBM.
• Proporcionar una clasificación detallada de los hábitatsde aves para las áreas en toda la RBM.
���� ��� �� ������
Carbonell, M., O. Lara, J. Fernández-Porto, and others.1998. Convention on Wetlands. Proceedings of theOrientation of Management. Ramsar Site: Laguna delTigre, Guatemala. Gland, Switzerland.
Dugan, P. J. (ed.) 1992. Conservation of Wetlands: AnAnalysis of Actual Issues and the Necessary Actions.IUCN, Switzerland.
Howell, S. y S. Webb. 1995. A Guide to Birds of Méxicoand Northern Central America. Oxford UniversityPress, New York, NY, USA.
Kushlan J. A., G. Morales y P. Frohing. 1985. Foragingniche relations of wading birds in tropical westsavannas. Pp. 663-682 in Neotropical Ornithology.Ornithological Monographs 36.
Levey, D. 1990. Habitat-dependent fruiting behaviour of anunderstorey tree, Miconia centrodesma, and tropicaltreefall gaps as keystone habitats for frugivores inCosta Rica. Journal of Tropical Ecology 6: 409-420.
Méndez, C., C. Barrientos, F. Castañeda y R. Rodas. 1998.Programa de Monitoreo, Unidad de Manejo Lagunadel Tigre. Los Estudios Base para su Establecimiento.CI/ProPetén, Conservation International, Guatemala.
Pérez E. S. 1998. Evaluation of available habitat for thescarlet macaw (Ara macao) in Petén, Guatemala. Tésisde Licenciatura. Universidad de San Carlos deGuatemala, Facultad de Ciencias, Químicas yFarmacia, Escuela de Biología.
términos de composición de especies de aves. Existe unagran diversidad de microhábitats en este hábitat debido a suscaracterísticas hidrológicas. Por ejemplo, los bancos arenososson los mejores hábitats para especies como Calidrismelanotus, C. minutilla, C. fuscicollis, Laterallus exilis, L.ruber y Tringa flavipes. Registramos la mayoría de lasespecies con penacho observadas en el estudio de estehábitat, así como Columba spp. y el caracol (Rostramussociabilis), el cual depende principalmente de caracolesacuáticos (Pomacea sp.). También se observó aquí el jabirú(Jabiru mycteria). Este hábitat está amenazado por eldesarrollo debido a la proximidad de los caminos y lasinstalaciones petroleras; en particular, el ancho del canal delrío para navegación se está deteriorando.
��������������� ��������������
Consideramos que la salud en general de la biodiversidad delas aves en los bosques del parque es intermedia. Laabundancia de especies en general que son indicadoras deproblemas no es tan grande en estudios similares de sitios deguamil en la jungla Lacandona cercanas a Chiapas, México(Warkentin et al., 1995). Sin embargo, los cambios y lapérdida forestal continua, es inminente, si la actividadagrícola de los colonos continúa sin resolverse. Con relacióna este problema, el área central del PNLT (es decir, las áreasprincipales de Flor de Luna y Chocop) es más fácil que sevea más afectada por la colonización debido a la presencia decaminos en esta zona y su proximidad a los hábitats dehumedales. Debido a que la fauna de aves es única en estazona, los impactos de la destrucción del hábitat tendránconsecuencias desastrosas para la fauna de aves del parque(Méndez et al., 1998).
Nuestras observaciones sugieren que los hábitats másimportantes para las aves acuáticas en el PNLT, incluyendotanto humedales como bosques altos/ribereños, son raros enlas áreas cubiertas de la Reserva de la Biosfera Maya (RBM;Carbonell et al., 1998). La conservación estricta de dichoshábitats en estas áreas deberían ser una consideraciónimportante en el diseño y manejo de la RBM (Méndez et al.,1998). Hasta este momento, es muy importante queestudios futuros en el parque proporcionen una comprensiónmás detallada de lo que constituye los diferentes hábitats deaves y sus distribuciones (en lugar de confiar en simplesdivisiones zonales). Ofrecemos varias recomendacionesespecíficas para estudios y conservación de aves dentro delPNLT; las recomendaciones no están en orden deimportancia:
• Investigar los efectos sobre la población de aves de laampliación del canal en Río Escondido.

�������������� ������������� Octubro 2000 ���
Zigûenza R. 1994. Evaluación de las fluctuacionespoblacionales de 31 especeis de aves en el área deprotección especial Manchón-huamuchal. Tésis deLicenciatura. Universidad de San Carlos de Guatemala,Facultad de Ciencias, Químicas y Farmacia, Escuela deBiología.
Warkentin I. G., T. Russell y J. Salgado. 1995. Songbird useof gallery woodlands in recently cleared and oldersettled landscapes of the Selva Lacandona, Chiapas,México. Conservation Biology 9: 1095-1106.
Whitacre, D. 1996. Ecological Monitoring Program for theMayan Biosphere Reserve. Draft. The PeregrineFoundation.
CONSERVATION INTERNATIONAL Programa de Evaluación Rápida���
�������
Estudio de la población del Crocodylus moreletii
• Los índices del C. moreletii registrada en el camino de laXan-Flor de Luna y en Laguna la Pista son los másaltos registrados hasta ahora en Guatemala.
• Laguna la Pista, Laguna el Perú y el Río Sacluc sonsitios ideales en los cuales se puede implementar unprograma de manejo para Crocodylus moreletii en elParque Nacional Laguna del Tigre (PNLT) debido a losaltos porcentajes de adultos en estos sitios así como lainfraestructura disponible para los investigadores.
• El hábitat sibal (de Cladium jamaicense) se utilizómás frecuentemente por C. moreletii en el PNLT. Estehábitat ofrece aislamiento adecuado, disponibilidad dealimentos y protección para estas especies.
• Áreas de 500 mts. muestreados en 150 min parece seruna buena estrategia de muestreo para C. moreletti enáreas dentro del PNLT.
Estudio de herpetofauna en la vegetación ribereña
• Existe una disminución de la abundancia de laherpeofauna en los límites de los cuerpos de agua en elinterior del bosque durante la época seca en el PNLT.
• Las especies de reptiles y anfibios registrados en elPNLT tiene distribuciones amplias dentro de laPenínsula de Yucatán y muestran poca especificaciónen el área de Petén. Dermatemys mawii, sin embargo, esun endémico regional y debería dársele énfasos pormedio de los administradores del parque.
���������
����� ���������������� ������������������������ ���������������������������������������!����������������� ���������� ��������������������� �
Francisco Castañeda Moya, Oscar Lara y AlejandroQueral-Regil
���������
La herpetofauna de Guatemala es extremadamente rica.Campbell y Vannini (1989) enumeraron 326 especies paraGuatemala y 160 de estas se encuentran en la región de Petén(Campbell, 1998). Sin embargo, durante los últimos diezaños, han habido varias revisiones taxonómicas y los análisisfilogenéticos que han revelado una herpetofauna más rica quela que se pensaba previamente (Campbell y Mendelson,1998). Actualmente, conocemos de 145 especies de anfibiosy 242 especies de reptiles para un total de 387 especies enGuatemala, aunque cálculos recientes sugieren que puedenhaber más de 400 especies (Campbell y Mendelson, 1998).
A pesar de estos estudios, la herpetofauna de El Petény específicamente en el Parque Nacional Laguna del Tigre,es poco conocida. Recientemente, Méndez et al. (1998)condujo un estudio de las plantas, aves y anfibios y reptilesdel parque. Este estudio proporcionó datos base sobre laherpetofauna, aunque la cobertura geográfica de este estudiofue muy limitado.
Un componente importante de la herpetofauna de ElPetén es el cocodrilo pantanero (Crocodylus moreletii). C.moreletii es una especie endémica de la Península de Yucatány está registrada en el Libro Rojo de UICN (1996) con unadeficiencia de datos y en el Apéndice I de CITES. Estudiosprevios de población del C. moreletii en Guatemala hanmostrado que la persistencia de las especies en el área estáamenazada por la caza ilegal y por la destrucciónincrementada del hábitat debido a la invasión del hombre(Lara, 1990; Castañeda, 1997).
�������
Estudio de la población del Crocodylus moreletii

���������������������� ���������������������� Julio 2000 ���
El muestreo de los cocodrilos se realizó en los siguienteslugares:1) Area principal de San Pedro: Río San Pedro (ca. 38 kmjunto al río, desde la comunidad de Paso Caballos hasta lacomunidad de El Buen Samaritano) y Río Sacluc (ca. 7 kmdesde la confluencia con el Río San Pedro hasta el final delRío Sacluc).2) Area principal de Río Escondido (ca. 29 km cubriendo lamayor parte de la sección navegable del río).3) Área principal de Flor de Luna (ca. 1.3 km de las orillas dela Laguna Flor de Luna y ca. 1 km de las orillas de la LagunaVista Hermosa).4) Area principal del Río Chocop: Laguna Tintal (C4, 1.4 kmde las orillas); La Pista (C3; 2 km de las orillas); LagunaGuayacán (C2; 1.3 km de las orillas); y varias otras aguadas(pequeños estanques) y lagunas a lo largo de la carretera deXan-Flor de Luna (refiérase a “Itinerario de la expedición yDiccionario Geográfico”).5) Además, se tomó una muestra en Laguna El Perú (5 km delas orillas), lo que se encuentra cerca del sitio arqueológico ElPerú (un sendero del sitio empieza cerca de SP10).
Realizamos un censo de población del Crocodylusmoreletii utilizando linternas en las orillas de los ríos ylagunas desde un bote inflable con motor fuera de borda.Contamos cualquier cocodrilo visible. Intentamos capturarcada animal que veíamos, aunque casi siempre estaban fueradel alcance del bote. Ordenamos por categorías tantoanimales como neonatos observados y capturados, juveniles,subadultos o adultos en base al tamaño aproximado delcuerpo (Castañeda, 1998). Calculamos el tamaño de cadaindividuo utilizando la relación entre la distancia de dondenos encontrábamos y la distancia hacia el punto enfocado(Lara, 1990).
Para determinar los tipos de hábitats utilizados,también registramos el hábitat en el cual un animal seobservó por primera vez. Los tipos de hábitatsconsiderados fueron 1) agua: aquellos registros de individuosque no flotaban en la orilla o en la vegetación; 2) bosqueribereño: aquellos registros en vegetación arborescente en lasorillas de los cuerpos de agua; 3) guamil: vegetación decrecimiento secundario sin árboles; 4) sibal: guamiles(Cladium jamaicense) en vegetación de ciénagas; y 5)vegetación emergente.
Estudio de herpetofauna en vegetación ribereña
La herpetofauna que ocupa los bancos de los ríos se examinóen puntos de muestreo terrestres a lo largo del Río San Pedro(SPT1), Río Sacluc (SPT5) y Río Escondido (ET2, ET3;refiérase a “Itinerario de la Expedición y DiccionarioGeográfico”).
Realizamos transectos de 500 mts. de largo y 5 deancho en las orillas de estos ríos. Cada corte se dividió encinco transectos más pequeños de 100 mts. Estandarizamos
los esfuerzos de muestreo al limitar la búsqueda a 30minutos cada 100 metros. Además, se registraron lasobservaciones puntuales en áreas muestreadas de cocodrilos.
���������
Estudio de la población de Crocodylus moreletii
En general, se registraron 130 individuos de C. moreletii en87.14 km de estudios en cuerpos de agua del PNLT. Ladensidad promedio en los puntos de muestreo fue de 4.3cocodrilos/km. Los sistemas acuáticos cerrados tenían unadensidad promedio mayor comparada con sistemas abiertos(ríos; Tabla 7.1). Entre sistemas acuáticos abiertos, el RíoSacluc poseía una densidad mayor que la del Río San Pedro oRío Escondido. Las lagunas del área principal de Flor deLuna y la Laguna la Pista (SP3) tienen las densidadesmayores entre los sistemas acuáticos cerrados. La estructurade la población del C. moreletii en el PNLT se basa en clasesde edades menores (Figura 7.1).
La Laguna el Perú tuvo el porcentaje más alto deadultos, constituyendo un 32.26% de todos los adultos en elestudio, seguido por el Río Sacluc (Tabla 7.2). La Laguna laPista también contenía un mayor número de adultos ymostró el porcentaje más alto de subadultos en el estudio(ca. 46% de todos los subadultos). En el Río Escondido,como en el San Pedro, observamos un porcentaje alto deneonatos así como de jóvenes. Las muestras de muchaslagunas en las áreas principales de Flor de Luna y RíoChocop mostraron números bajos; en estas áreas, la mayoríade los individuos eran jóvenes.
El porcentaje más alto de registros de hábitats de C.moreletii se encontraba en sibal (39%), seguido por el agualejos de la orilla (31%), bosque ribereño (25%), vegetaciónemergente (4%) y guamil (1%; Tabla 7.3).
Figura 7.1. El número de individuos de C. moreletti, porclase de edad, observados durante estudios dentro del LTNP.
31
13
22
40
24
0
5
10
15
20
25
30
35
40
45
1
Age categories
# in
div
idu
als
Adult Subadult Neonate Juvenile Unknown
31
13
22
40
24
0
5
10
15
20
25
30
35
40
45
1
Age categories
# in
div
idu
als
Adult Subadult Neonate Juvenile Unknown
Categorías por edad
Indi
vidu
os
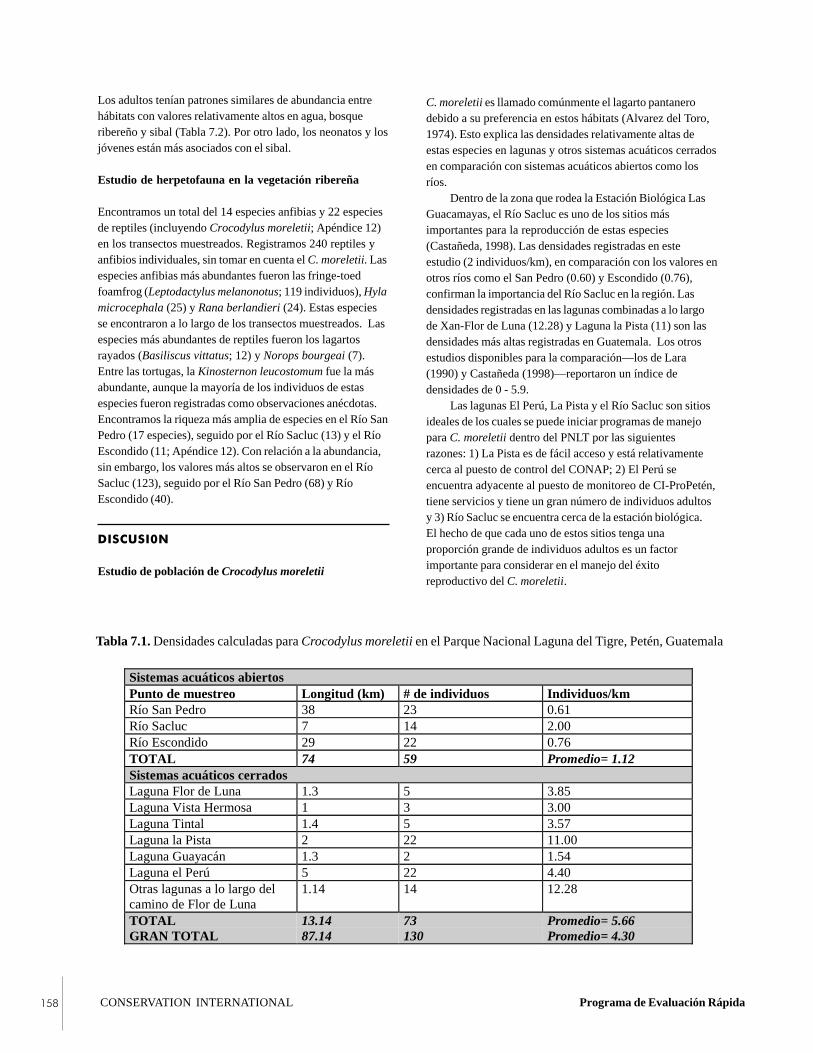
CONSERVATION INTERNATIONAL Programa de Evaluación Rápida���
Tabla 7.1. Densidades calculadas para Crocodylus moreletii en el Parque Nacional Laguna del Tigre, Petén, Guatemala
Los adultos tenían patrones similares de abundancia entrehábitats con valores relativamente altos en agua, bosqueribereño y sibal (Tabla 7.2). Por otro lado, los neonatos y losjóvenes están más asociados con el sibal.
Estudio de herpetofauna en la vegetación ribereña
Encontramos un total del 14 especies anfibias y 22 especiesde reptiles (incluyendo Crocodylus moreletii; Apéndice 12)en los transectos muestreados. Registramos 240 reptiles yanfibios individuales, sin tomar en cuenta el C. moreletii. Lasespecies anfibias más abundantes fueron las fringe-toedfoamfrog (Leptodactylus melanonotus; 119 individuos), Hylamicrocephala (25) y Rana berlandieri (24). Estas especiesse encontraron a lo largo de los transectos muestreados. Lasespecies más abundantes de reptiles fueron los lagartosrayados (Basiliscus vittatus; 12) y Norops bourgeai (7).Entre las tortugas, la Kinosternon leucostomum fue la másabundante, aunque la mayoría de los individuos de estasespecies fueron registradas como observaciones anécdotas.Encontramos la riqueza más amplia de especies en el Río SanPedro (17 especies), seguido por el Río Sacluc (13) y el RíoEscondido (11; Apéndice 12). Con relación a la abundancia,sin embargo, los valores más altos se observaron en el RíoSacluc (123), seguido por el Río San Pedro (68) y RíoEscondido (40).
���������
Estudio de población de Crocodylus moreletii
C. moreletii es llamado comúnmente el lagarto pantanerodebido a su preferencia en estos hábitats (Alvarez del Toro,1974). Esto explica las densidades relativamente altas deestas especies en lagunas y otros sistemas acuáticos cerradosen comparación con sistemas acuáticos abiertos como losríos.
Dentro de la zona que rodea la Estación Biológica LasGuacamayas, el Río Sacluc es uno de los sitios másimportantes para la reproducción de estas especies(Castañeda, 1998). Las densidades registradas en esteestudio (2 individuos/km), en comparación con los valores enotros ríos como el San Pedro (0.60) y Escondido (0.76),confirman la importancia del Río Sacluc en la región. Lasdensidades registradas en las lagunas combinadas a lo largode Xan-Flor de Luna (12.28) y Laguna la Pista (11) son lasdensidades más altas registradas en Guatemala. Los otrosestudios disponibles para la comparación—los de Lara(1990) y Castañeda (1998)—reportaron un índice dedensidades de 0 - 5.9.
Las lagunas El Perú, La Pista y el Río Sacluc son sitiosideales de los cuales se puede iniciar programas de manejopara C. moreletii dentro del PNLT por las siguientesrazones: 1) La Pista es de fácil acceso y está relativamentecerca al puesto de control del CONAP; 2) El Perú seencuentra adyacente al puesto de monitoreo de CI-ProPetén,tiene servicios y tiene un gran número de individuos adultosy 3) Río Sacluc se encuentra cerca de la estación biológica.El hecho de que cada uno de estos sitios tenga unaproporción grande de individuos adultos es un factorimportante para considerar en el manejo del éxitoreproductivo del C. moreletii.
Sistemas acuáticos abiertosPunto de muestreo Longitud (km) # de individuos Individuos/kmRío San Pedro 38 23 0.61Río Sacluc 7 14 2.00Río Escondido 29 22 0.76TOTAL 74 59 Promedio= 1.12Sistemas acuáticos cerradosLaguna Flor de Luna 1.3 5 3.85Laguna Vista Hermosa 1 3 3.00Laguna Tintal 1.4 5 3.57Laguna la Pista 2 22 11.00Laguna Guayacán 1.3 2 1.54Laguna el Perú 5 22 4.40Otras lagunas a lo largo delcamino de Flor de Luna
1.14 14 12.28
TOTAL 13.14 73 Promedio= 5.66GRAN TOTAL 87.14 130 Promedio= 4.30

�������������� ������������� Octubro 2000 ���
Tabla 7.2. Estructura de la población de Crocodylus moreletii por muestra.
Data: Total # de individuos% de muestra% de individuos
Clase deedad →
Lugar deMuestreo ↓
Adulto Neonato Desconocido Jóvenes Subadultos TotalIndividuos/
Muestra
Aguada 1 00.000.00
00.000.00
00.000.00
1100.002.50
00.000.00
1
Aguada 2 00.000.00
00.000.00
00.000.00
1100.002.50
00.000.00
1
El Perú 1045.4532.26
00.000.00
522.7320.83
522.7312.50
29.0915.38
22
Escondido 29.096.45
1045.4545.45
14.554.17
836.3620.00
14.557.69
22
Establo 00.000.00
00.000.00
00.000.00
6100.0015.00
00.000.00
6
Flor de Luna 120.003.23
360.0013.64
00.000.00
00.000.00
120.007.69
5
Garza 1 00.000.00
00.000.00
133.334.17
133.332.50
133.337.69
3
Guayacán 00.000.00
150.004.55
00.000.00
150.002.50
00.000.00
2
La Pista 627.2719.35
418.1818.18
522.7320.83
14.552.50
627.2746.15
22
Román 00.000.00
00.000.00
00.000.00
3100.007.50
00.000.00
3
Sacluc 535.7116.13
00.000.00
750.0029.17
214.295.00
00.000.00
14
San Pedro 419.0512.90
419.0518.18
314.2912.50
838.1020.00
29.5215.38
21
Tintal 240.006.45
00.000.00
120.004.17
240.005.00
00.000.00
5
VistaHermosa
133.333.23
00.000.00
133.334.17
133.332.50
00.000.00
3
TOTAL deIndividuos
31 22 24 40 13 130
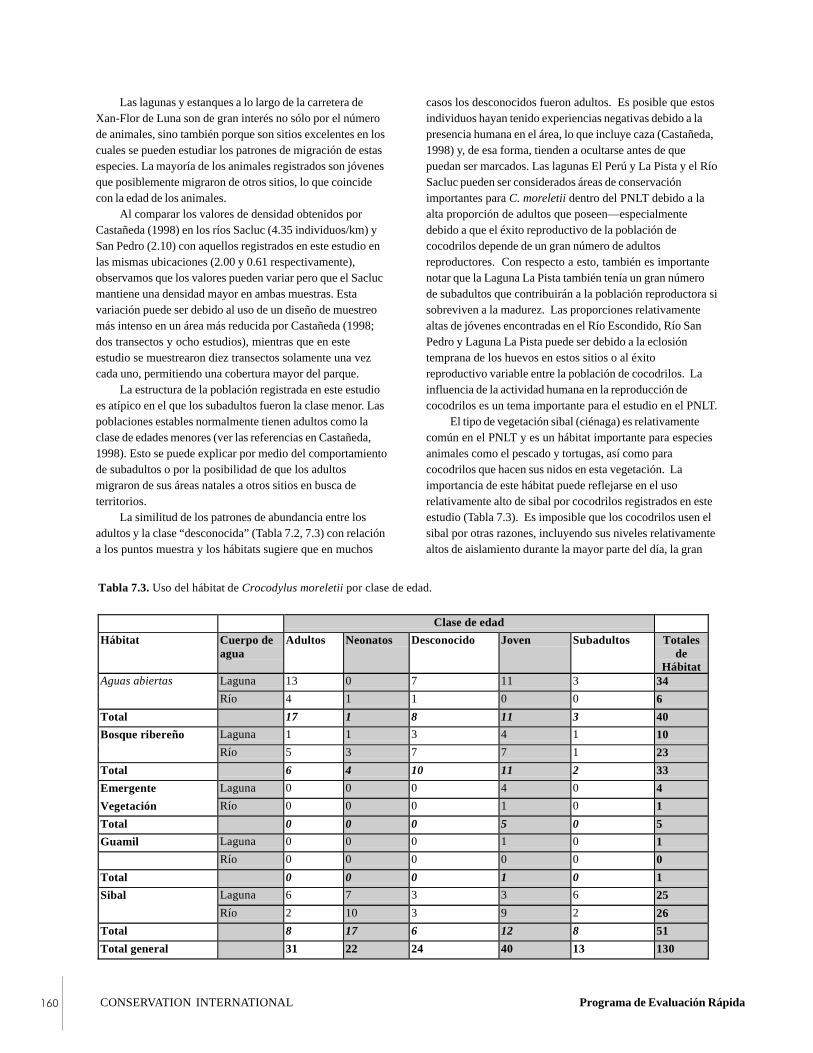
CONSERVATION INTERNATIONAL Programa de Evaluación Rápida���
Las lagunas y estanques a lo largo de la carretera deXan-Flor de Luna son de gran interés no sólo por el númerode animales, sino también porque son sitios excelentes en loscuales se pueden estudiar los patrones de migración de estasespecies. La mayoría de los animales registrados son jóvenesque posiblemente migraron de otros sitios, lo que coincidecon la edad de los animales.
Al comparar los valores de densidad obtenidos porCastañeda (1998) en los ríos Sacluc (4.35 individuos/km) ySan Pedro (2.10) con aquellos registrados en este estudio enlas mismas ubicaciones (2.00 y 0.61 respectivamente),observamos que los valores pueden variar pero que el Saclucmantiene una densidad mayor en ambas muestras. Estavariación puede ser debido al uso de un diseño de muestreomás intenso en un área más reducida por Castañeda (1998;dos transectos y ocho estudios), mientras que en esteestudio se muestrearon diez transectos solamente una vezcada uno, permitiendo una cobertura mayor del parque.
La estructura de la población registrada en este estudioes atípico en el que los subadultos fueron la clase menor. Laspoblaciones estables normalmente tienen adultos como laclase de edades menores (ver las referencias en Castañeda,1998). Esto se puede explicar por medio del comportamientode subadultos o por la posibilidad de que los adultosmigraron de sus áreas natales a otros sitios en busca deterritorios.
La similitud de los patrones de abundancia entre losadultos y la clase “desconocida” (Tabla 7.2, 7.3) con relacióna los puntos muestra y los hábitats sugiere que en muchos
casos los desconocidos fueron adultos. Es posible que estosindividuos hayan tenido experiencias negativas debido a lapresencia humana en el área, lo que incluye caza (Castañeda,1998) y, de esa forma, tienden a ocultarse antes de quepuedan ser marcados. Las lagunas El Perú y La Pista y el RíoSacluc pueden ser considerados áreas de conservaciónimportantes para C. moreletii dentro del PNLT debido a laalta proporción de adultos que poseen—especialmentedebido a que el éxito reproductivo de la población decocodrilos depende de un gran número de adultosreproductores. Con respecto a esto, también es importantenotar que la Laguna La Pista también tenía un gran númerode subadultos que contribuirán a la población reproductora sisobreviven a la madurez. Las proporciones relativamentealtas de jóvenes encontradas en el Río Escondido, Río SanPedro y Laguna La Pista puede ser debido a la eclosióntemprana de los huevos en estos sitios o al éxitoreproductivo variable entre la población de cocodrilos. Lainfluencia de la actividad humana en la reproducción decocodrilos es un tema importante para el estudio en el PNLT.
El tipo de vegetación sibal (ciénaga) es relativamentecomún en el PNLT y es un hábitat importante para especiesanimales como el pescado y tortugas, así como paracocodrilos que hacen sus nidos en esta vegetación. Laimportancia de este hábitat puede reflejarse en el usorelativamente alto de sibal por cocodrilos registrados en esteestudio (Tabla 7.3). Es imposible que los cocodrilos usen elsibal por otras razones, incluyendo sus niveles relativamentealtos de aislamiento durante la mayor parte del día, la gran
Tabla 7.3. Uso del hábitat de Crocodylus moreletii por clase de edad.
Clase de edad
Hábitat Cuerpo deagua
Adultos Neonatos Desconocido Joven Subadultos Totalesde
HábitatAguas abiertas Laguna 13 0 7 11 3 34
Río 4 1 1 0 0 6
Total 17 1 8 11 3 40
Bosque ribereño Laguna 1 1 3 4 1 10
Río 5 3 7 7 1 23
Total 6 4 10 11 2 33
Emergente Laguna 0 0 0 4 0 4
Vegetación Río 0 0 0 1 0 1
Total 0 0 0 5 0 5
Guamil Laguna 0 0 0 1 0 1
Río 0 0 0 0 0 0
Total 0 0 0 1 0 1
Sibal Laguna 6 7 3 3 6 25
Río 2 10 3 9 2 26
Total 8 17 6 12 8 51
Total general 31 22 24 40 13 130

�������������� ������������� Octubro 2000 ���
disponibilidad de alimentos debido al uso de sibal por lospeces, el poco acceso para los humanos y la tranquilidad delambiente.
A pesar de la importancia de los sibales dentro delparque, este hábitat se quema mucho cada año y esteproceso constituye la amenaza principal para laspoblaciones de C. moreletii en la región (Castañeda, 1998).
Los adultos a menudo se asociaron con el agua abierta,posiblemente porque nuestro estudio correspondió a laépoca de apareamiento de los cocodrilos que empieza enmarzo en México (Alvarez del Toro, 1982). En el caso delPNLT, este período puede empezar en marzo o abril(Castañeda, 1998). Los adultos se encontraron a menudo enlagunas, posiblemente debido al poco acceso de los humanoshacia las lagunas en comparación con los ríos.
Estudio de herpetofauna en vegetación ribereña
La abundancia general de especímenes registrados a lo largodel Río Sacluc se debe a la gran abundancia de fringe-toedfoamfrog (Leptodactylus melanonotus), la cual es una especiecomún con una distribución amplia en el PNLT. La mayoríade los animales se detectaron en las orillas de los cuerpos deagua y otros pocos se encontraron en más de cinco metrostierra adentro. Esto se debe a la dependencia de laherpetofauna en áreas cercanas al agua durante la época seca(Méndez et al., 1998).
Es aparente que modificar el diseño del transectoutilizado por Méndez et al. (1998) de 200 m muestreados en120 min a una estrategia de muestreo de 500 m en 150 minfue más eficiente. Sin embargo, se necesitan esfuerzos deestudio más intensos en el PNLT. Los nuevos registros parael área, como la serpiente barriga manchada con rayas(Coniophanes quinquevittatus) que se encontraron en esteestudio, surgen de dichos esfuerzos.
Otros reptiles amenazados de El Petén que seobservaron durante estos estudios incluyen la tortuga de ríode América Central (Dermatemys mawii), cuya (Campbell,1998) y así como boa (Boa constrictor). D. mawii seencuentran enumerados por la UICN como especies enpeligro y ambos reptiles se encuentran enumerados en elApéndice II de CITES. Junto con el cocodrilo pantanero,estas especies deberán ser un foco de futuros estudios yplanes de manejo para especies dentro del parque.
��������������
• Monitorear al Crocodylus moreletii en el PNLT,haciendo énfasis en el Río Sacluc y las lagunas El Perú yLa Pista.
• Iniciar un programa de manejo cautivo para el C.moreletti en el que se recolecten los huevos y se incuben
bajo condiciones controladas. Esto ayudará a reducir elimpacto de pérdidas naturales y el superhábit puede serutilizado como medida alterna para las poblacioneshumanas locales.
• Usar la estrategia de muestreo de transectos de 500 m/150 min, utilizando tanto señales visuales comoauditivas para inventarios y monitoreos de herpetologíaen el PNLT.
• Incluir la tortuga de río de Centro América(Dermatemys mawii) y la boa (Boa constrictor) enprogramas de monitoreo.
���� ��� �� ������
Alvarez del Toro, M. 1974. Estudio Comparativo de losCrocodylia de México. Ed. Inst. Instituto Mexicano deRecursos Naturales Renovables, A.C. Mexico.
Alvarez del Toro, M. 1982. Los Reptiles de Chiapas.Instituto de Historia Natural del Estado,Departamento de Zoología.
Campbell, J. A. 1998. Amphibians and Reptiles of NorthernGuatemala, the Yucatán, and Belize. The Universityof Oklahoma Press, Norman, OK, USA.
Campbell, J. A. y J. R. Mendelson III. 1998.Documentación de los anfibios y reptiles de Guate-mala. Mesoamericana 3:21.
Campbell, J. A. y J. P. Vannini. 1989. Distribution ofamphibians and reptiles in Guatemala and Belize.Proceedings of the Western Foundation of VertebrateZoology 4:1-21.
Castañeda, F. 1997. Estatus y manejo propuesto deCrocodylus moreletii en el Departamento de El Petén,Guatemala. Pp. 52-57 in Memorias de la 4ta. ReuniónRegional del Grupo de Especialistas de Cocodrilos deAmérica Latina y el Caribe. Centro Regional deInnovación Agroindustrial, S.C. Villahermosa,Tabasco.
Castañeda, F. 1998. Situación actual y plan de manejo paraCrocodylus moreletii en el área de influencia de laEstación Biológica Las Guacamayas, Departamentode Petén, Guatemala. Tésis de Licenciatura enBiología, Facultad de Ciencias Químicas y Farmacia,Universidad de San Carlos, Guatemala.
CONSERVATION INTERNATIONAL Programa de Evaluación Rápida���
Lara, O. 1990. Estimación del tamaño y estructura de lapoblación de Crocodylus moreletii en los lagos Petén-Itza, Sal-Petén, Peténchel y Yaxhá, El Petén, Guate-mala. Tésis de Maestría, Universidad Nacional,Heredia, Costa Rica.
Méndez, C., C. Barrientos, F. Castañeda y R. Rodas. 1998.Programa de Monitoreo, Unidad de Manejo Lagunadel Tigre. Los Estudios Base para su Establecimiento.CI-ProPetén, Conservation International, Washington,DC, USA.

���� � � � � � ��������������� ���������������������� Julio 2000
������
• La fauna mamífera ha sobrevivido en cuatro áreasprincipales del Parque Nacional Laguna del Tigre(PNLT). El estudio se enfocó en mamíferos pequeños.
• Los murciélagos fueron capturados con redes y losroedores con trampas. Otros mamíferos fueronregistrados con rastreos y señales.
• Se identificó un total de 40 especies de mamíferos deuna lista potencial de 130 para el parque. No hubodiferencias significativas en la diversidad de losmurciélagos entre las cuatro áreas principales. Lasespecies roedoras mostraron asociaciones de hábitatespecíficas tal y como se han reportado previamente enotros estudios.
• Reportamos un nuevo registro de especies paraGuatemala: el ratón Peromyscus yucatanicus.También se observó otra especie endémica regional, elratón coludo Heteromys guameri. Varios mamíferosraros y/o en peligro de extinción, incluyendo el tapir yel ciervo cola roja se observaron cerca de la EstaciónBiológica Las Guacamayas. Esta área puede ser de granvalor de conservación para los mamíferos.
��� ��������
La deforestación produce pérdida y fragmentación dehábitats de mamíferos y es una de las peores amenazas parala biodiversidad mamífera en todo el mundo. Produce uncambio significativo en la composición y abundancia relativade especies mamíferas, reflejado en la extinción local deespecies raras (Williams y Marsh, 1998) e incrementa la
����������
��������������� ������� ������������������������ ���������������������������������������� ����������
Heliot Zarza y Sergio G. Pérez
abundancia de especies generales u oportunistas (Malcolm,1997). Por ejemplo, los cambios a menudo conllevan lainvasión de especies que generalmente se benefician con lasactividades humanas, como los conejos (Sylvilagus spp.) y elcoyote (Canis latrans; Garrott et al., 1993).
Entre los mamíferos, los murciélagos son componentesimportantes de la biodiversidad en bosques tropicales ypueden representar hasta el 60% de la fauna mamífera local(Eisenberg, 1989). Son diversos tropicalmente, incluyendoespecies que se alimentan de invertebrados y vertebrados,polen, néctar, frutas y sangre (Wilson, 1989). Los bosquesneotropicales tienen la diversidad más grande de murciélagosen el mundo. De los 75 géneros presentes en losneotrópicos, 48 pertenecen a la familia Phyllostomidae(Wilson, 1989). La diversidad de los murciélagosfilostómidos se refleja en el número de especies y sudiversidad de dietas (Gardner, 1977) y estas característicaslos hacen buenos indicadores biológicos (Fenton et al.,1992).
La composición y la abundancia relativa de murciélagosse determina por la complejidad y heterogeneidad del hábitat(LaVal y Fitch, 1977). Si el hábitat mantiene una complejidady heterogeneidad alta, puede proporcionar un gran númerode nichos por unidad de espacio (August, 1983). Así, lospatrones de composición y diversidad de los murciélagostienen gran potencial como detectores de cambios en elhábitat en los bosques tropicales (Amín y Medellín, enimprenta). Un estudio en la Sierra Lacandona, México(Medellín et al., en imprenta), encontró valoressignificativamente altos de diversidad de murciélagos enlugares con poca perturbación y alta abundancia desubfamilias Phyllostominae en hábitats con cambios.Patrones similares se reportaron en el este de Quintana Roo,México (Fenton et al., 1992). Se ha propuesto que laidentidad de las especies más sencillas de murciélagosabundantes también pueden ser un indicador de cambios. Por

CONSERVATION INTERNATIONAL Programa de Evaluación Rápida���
asocian con los árboles altos como los amates (Ficus spp.) yjobos (Spondias spp.). En condiciones con cambiosmoderados, el género Carollia es dominante; en hábitatsaltamente con cambios, el género sencillo más abundante esSturnira (Amín y Medellín,en imprenta).
Los mamíferos pequeños no voladores como losroedores, son grupos funcionalmente importantes en losbosques tropicales y constituyen entre el 15% y 25% de lafauna mamífera en los bosques neotropicales (Voss yEmmons, 1996). Los roedores ejercen una influencia sobrelas plantas al dispersar las semillas, son fuentes de alimentoimportantes para los predadores (Dirzo y Miranda, 1990) yson sensibles al cambio de hábitat. Los mamíferos debosques neotropicales como el tapir, el jaguar y los monos,pueden ser especialmente sensibles al cambio de hábitat y ala actividad humana debido a su rareza, susceptibilidad a lacaza y timidez (Reid, 1997).
�������
Se reunió una lista de especies que podrían encontrarsepotencialmente en el PNLT utilizando mapas de índices ydescripciones de distribución en Hall (1981), Emmons yFeer (1997) y Reid (1997); éstos se compararon con losdatos que obtuvimos.
Muestreo de roedores
Establecimos transectos de 540 metros cerca del punto focalde cada área principal y muestreamos roedores utilizando 90trampas (Victor Rat Trap y Museum Special Mammal Trap)distribuidos en pares en 45 estaciones localizadas cada 12metros a lo largo del área del transecto. Por las tardes, en lastrampas se colocaron carnadas con una mezcla demantequilla de maní, pasas, nuez molida y tocino y serevisaron al día siguiente por la mañana (Jones et al., 1996).Las trampas fueron operados dos o tres noches portransecto. Cada roedor capturado fue identificado ypreparado en el campo como una piel de estudio y secolocaron pruebas en formol líquido. Todas las especies sealmacenaron en Colecciones Zoológicas del Museo deHistoria Natural de la Universidad de San Carlos.
Muestreo de murciélagos
Utilizamos cuatro redes que median 2.6x12 m, colocadas enforma de “T” para optimizar el esfuerzo de captura (Kunz etal., 1996). Las redes fueron colocadas en diferentesubicaciones cada noche, se abrieron al anochecer (ca. 18:30hrs) y se cerraron cuatro horas más tarde (ca. 22:30 hrs).Este es el período durante el cual los murciélagos son másactivos (Fleming et al., 1972; Willig, 1986). Cada murciélagocapturado se identificó con especies utilizando Medellín et
al. (1997) y se liberaron en el mismo lugar. En algunos casos,los murciélagos fueron preparados como muestras de estudioy depositados en las Colecciones Zoológicas del Museo deHistoria Natural de la Universidad de San Carlos.
El esfuerzo de captura y la abundancia relativa secalculó con el método propuesto por Medellín (1993), endonde las capturas por metros totales de red/hora seutilizaron para calcular la abundancia relativa. Para calcularla riqueza de las especies de murciélagos, creamos curvas deacumulación de especies utilizando el software EstimateS 5(Colwell, 1999), utilizando el calculador de riqueza deespecies ACE (Calculador de cobertura en base a abundanciade riqueza de especies) esto se basa en aquellas especies con10 o menos individuos en la muestra. Calculamos ladiversidad de las ubicaciones utilizando el ídice de diversidadShannon-Wiener y estos valores se compararon entre lasáreas principales utilizando ANOVA (Zar, 1984). Tambiénconsideramos la comunidad de murciélagos, de acuerdo con elhábito alimenticio. Cada especie fue clasificada en diferentescategorías de dietas de acuerdo con Medellín (1994).
Otros mamíferos
La mayoría de los mamíferos grandes son difíciles deobservar. Utilizamos, huellas, piel, heces, cadáveres o restosóseos y madrigueras (Aranda, 1981) para proporcionar datossobre la presencia y ausencia de mamíferos grandes.Realizamos estudios visuales diarios durante las pruebaspara observar los mamíferos.
���������������������
Murciélagos
Registramos un 39% de las especies potenciales (en base amapas) de murciélagos (23 especies) para el PNLT(Apéndice 13). Doscientos veintiún individuos ycapturamos 20 especies con un esfuerzo de muestreo de 684metros de red/57 horas (14 noches). El esfuerzo promediopor noche fue de 3.7 horas con 44 metros de red (Tabla 8.2).Capturamos e identificamos tres especies sin redes, que nose consideraron en el análisis.
El índice de captura más grande se observó en el áreafocal del Río San Pedro, lo cual contrasta con los valores másbajos registrados en las áreas focales de Flor de Luna y RíoChocop (Tabla 8.1). Estos valores bajos probablementerepresentan la “fobia lunar”, es decir una influencia negativaen la actividad de los murciélagos debido a que la luna estaballena durante el muestreo en ambas localizaciones (Morrison,1978). La curva de acumulación de especies de murciélagos(Figura 8.1) muestra que durante las primeras ocho noches,se recolectaron 19 especies. Esto representó un 95% deltotal de especies capturadas en el estudio. En las siguientes

�������������� ������������� Octubro 2000 ���
0
5
10
15
20
25
30
0 1 2 3 4 5 6 7 8 9 10 11 12 13 14
Noches
Esp
ecie
s
seis noches, solamente una especie se agregó. El calculadorACE de la riqueza de especies fue de 26.5.
No hubo diferencia significativa en la diversidad de lascomunidades de murciélagos de las cuatro localizaciones (F =1.116, p>0.05, n = 12). La diversidad total fue H’ = 1.471para las cuatro localizaciones combinadas. Entre laslocalizaciones, Río Escondido tenía el valor más alto dediversidad (Tabla 8.2). La paridad más alta se encontró enRío Chocop (E = 0.94), posiblemente debido al bajo númerode especies (S = 8) y a la baja abundancia (dos de tresindividuos/especies).
Las 20 especies de murciélagos capturados pertenecíana cuatro familias. La familia Phyllostomidae fue la másabundante, con 198 individuos de 17 especies y se encontróen todas las localidades. Cuatro especies (tresphyllostomidos y una mormoópido) fueron comunes entodas las localizaciones. La abundancia relativa (Tabla 8.3)muestra que las especies dominantes de la comunidad sonArtibeus intermedius, Carollia brevicauda y A. lituratus.Estas especies comprenden el 54% del total de murciélagos(consulte también el Apéndice 13). Un segundo grupo menosabundante consta de 11 especies, algunas de las cualespueden considerarse comunes (por ejemplo, Sturnira lilium,Dermanura phaeotis) y otras que son menos capturadas(por ejemplo, Uroderma bilobatum). Un tercer grupo deespecies raras consta de seis especies capturadas solamenteuna vez, juntas representan el 2.7% de los murciélagoscapturados (por ejemplo, Chrotopterus auritus, Mimoncrenulatum).
Entre las especies más abundantes (A. intermedius, C.brevicauda y A. lituratus), dos son dominantes en el hábitatsin cambios: A. intermedius y A. lituratus; la otra, C.brevicauda, es dominante en condiciones de cambiosmoderados. La abundancia de cada una de estas especies es <25% del total de todos los murciélagos capturados, lo quesugiere que el hábitat se encuentra sin cambios de acuerdo alos criterios de Amín y Medellín (en imprenta).
Tabla 8.1. Esfuerzo de captura y éxito utilizando redes en el Parque Nacional Laguna del Tigre, Petén, Guatemala.
San Pedro Sacluc Escondido Flor deLuna
Chocop Total Promedio Prom/Noche
Redes-m 144 144 96 132 144 660 132 44.00Noches 3 3 2 3 3 14 2.8 0.93Horas 12 12 8 12 12 56 11.2 3.73# de murciélagos 100 38 38 19 25 220 44 14.67# especies 14 10 12 8 8 20 10.4Redes-m/h 1728 1728 768 1584 1728 7536#muerciélagos/N-m/h 0.05787 0.02199 0.049479 0.01199 0.01446 0.029193#especies/N-m/h 0.00810 0.00578 0.015625 0.00505 0.00463 0.002654
Figura 8.1. La curva de acumulación de especies para losmurciélagos del PNLT. La curva más baja (círculos abiertos)indica la acumulación observada y la curva superior (diamantessólidos) indica la acumulación calculada del calculador decobertura en base a la abundancia (ACE).
Figura 8.2. Porcentaje de especies de murciélagos quepertenecen a diferentes grupos trópicos en el PNLT.
Frugívoros9 spp. (39%)
Sanguívoros1 sp. (4%)
Carnívoros2 spp. (9%)
Insectívoros10 spp. (44%)
Nectarívoros1 sp. (4%)

CONSERVATION INTERNATIONAL Programa de Evaluación Rápida���
Tabla 8.2. Abundancia y dominio relativos de murciélagos en el Parque Nacional Laguna del Tigre, Petén, Guatemala.
Rango Especies No. deindividuos
Ind/N-m/h
1 Artibeus intermedius 48 0.006369
2 Carollia brevicauda 41 0.0054413 Artibeus lituratus 30 0.0039814 Sturnira lilium 20 0.0026545 Dermanura phaeotis 17 0.0022566 Pteronotus parnellii 16 0.0021237 Artibeus jamaicensis 10 0.0013278 Glossophaga commissarisi 8 0.0010629 Dermanura watsoni 7 0.00092910 Rhynchonycteris naso 5 0.00066311 Tonatia evotis 4 0.00053112 Desmodus rotundus 3 0.00039813 Mimon bennettii 3 0.00039814 Uroderma bilobatum 2 0.00026515 Mormoops megalophylla 1 0.00013316 Micronycteris schmidtorum 1 0.00013317 Chrotopterus auritus 1 0.00013318 Centurio senex 1 0.00013319 Mimon crenulatum 1 0.00013320 Tonatia brasiliense 1 0.000133
Los murciélagos capturados en este estudiorepresentaron una variedad de grupos tróficos (Figura 8.2).Los insectívoros comprendieron el 43% de las especies,seguido por frutívoros en un 39%, carnívoros en un 8.7%,nectarívoros en un 4.3% y sanguívoros en un 4.3%. En susestudios de murciélagos de bosques tropicales, Wilson et al.(1997) y Amín (1996) reportaron que los frutívoros eran elgrupo tropical más grande (50%), seguido por insectívoros(23%). Nuestros resultados pueden diferir de los suyosdebido a que nuestros puntos de muestreo se encontrabancerca de cuerpos de agua, en donde los insectívorosgeneralmente son más abundantes (Kunz y Kurta, 1988).
Análisis de la diversidad de murciélagos por sitios(Tabla 8.3)
Area principal de Río San PedroEn esta localidad registramos el número más alto de especies(15 especies) y capturas (138 individuos). Esta localidad sesubdividió en dos puntos para muestreo—el Río San Pedroy el Río Sacluc—debido al contraste de la vegetación entreellos. En el Río San Pedro, el muestreo se realizó en elbosque ribereño (SPT1-3) y el bosque alto (SPT6; refiérase ala Tabla 1.2, Apéndice 2); aquí capturamos 100 individuosde 14 especies en tres noches. Las especies más abundantesfueron Artibeus intermedius, Carollia brevicauda, A.lituratus y Sturnira lilium. En Río Sacluc, las redes secolocaron en encinales (SPT4-5) y se capturaron 38
Río EscondidoAquí muestreamos en bosque alto con algunas áreasnaturales abiertas (ET 1-2). El bosque se quemó haceaproximadamente 20 años. Capturamos 39 individuos y 13especies. Las especies más abundantes fueron Artibeusintermedius y Sturnira lilium. Los valores de riqueza fueronsimilares a los del Río San Pedro, aunque la abundancia fuemenor. El éxito de la captura fue un poco más alta que la delRío Sacluc (Tabla 8.1). Esta localización mostró valores deriqueza más altos (Tabla 8.2). Observamos un grupo demurciélagos con líneas blancas mayores (Saccopteryxbilineata) que utilizaba un tronco hueco de matapalos (Ficussp.) como lugar de descanso.
individuos de 10 especies. Las especies más abundantesfueron A. lituratus, C. brevicauda y A. intermedius. El éxitode la captura fue en parte por el hábitat del bosque alto(Tabla 8.1). No hubo diferencia estadísticamente importanteentre las áreas principales (San Pedro vs. Sacluc: t =1.933, t=1.352, P >0.005), pero los valores de diversidad fueron unpoco mayores en Río San Pedro (Tabla 11). El únicomurciélago cara manchada (Centurio senex) observado fuecapturado en el sitio del Río Sacluc. Un murciélago negro(Molussus ater) se encontró bajo una tienda de campaña enla Estación Biológica Las Guacamayas (SP13) y un grupo demurciélagos proboscis (Rhynchonycteris naso; cinco de seisindividuos) se observó en el tronco de un árbol directamentesobre el agua. En la Laguna El Perú, también observamos unmurciélago pescador más grande (Noctilio leporinus).

�������������� ������������� Octubro 2000 ���
Laguna Flor de LunaBosque bajo que consta de tintales que se muestreó aquí (FT1-3). Capturamos a 19 individuos de ocho especies. Durantela primera noche de muestreo, obtuvimos el número más altode individuos; las especies más abundantes fueronPteronotus parnellii y Sturnira lilium. El éxito de la capturafue la más baja de todas las áreas principales (Tabla 8.1). Eléxito de la riqueza, abundancia y captura disminuyó despuésde la segunda noche de muestreo, probablemente debido a lainfluencia de la luna llena (Morrison, 1978).
Río ChocopBosque alto fue muestreado y las especies de plantasdominantes fueron Mataiba sp., Chrysophila sp. y algunassapoteceas (Manilkara sapota y Pouteria sp.). Capturamos25 individuos y ocho especies. Las especies dominantesfueron Artibeus intermedius y Pteronotus parnellii. Estosresultados muestran una disminución clara en el índice decapturas de individuos mientras continuaba el muestreo. Eléxito de la captura fue bajo, similar a la de Flor de Luna.
Roedores
Este fue el segundo grupo más frecuentemente registrado demamíferos en este estudio (Apéndice 13). Identificamosocho especies de roedores en siete géneros. Dos especies seregistraron por observación directa y no se recolectaron. Losroedores capturados constituyen el 47% de las especies deroedores potenciales para el PNLT (en base a registrosprevios). Las especies capturadas fueron Oryzomys couesi,Sigmodon hispidus, Ototylomys phyllotis, Peromyscusyucatanicus, Heteromys desmarestianus y H. gaumeri). Dosde estos son endémicos a la Península de Yucatán(Peromyscus yucatanicus y H. gaumeri).El Sigmodontinae (Muridae) consta de 21 géneros y 61especies en el sureste de México y Centro América (Reid,1997). Encontramos que la mayoría de las especiescapturadas durante el muestreo pertenecen a esta subfamilia.La familia Heteromyidae está representada por dos géneros
en Centro América y registramos un género (Heteromys) ydos de sus especies (todas las que podían ocurrirpotencialmente) en el PNLT. El otro género (Liomys) estádistribuido principalmente en las costas pacíficas en bosquessecos del norte de México hasta Panamá (Reid, 1997).
En un total de 1149 trampas nocturnas, obtuvimos untotal de 10 individuos y cinco especies (Tabla 8.4). Lariqueza de especies más alta se encontró en el área focal delRío San Pedro/Río Sacluc (3 sp.), en comparación con lasotras ubicaciones, en donde solamente se registró unaespecie. El éxito de las trampas fue constante para lamayoría de las ubicaciones, con la excepción de Río Sacluc(encinal), en donde se observó el valor más bajo.Nuestros datos y otras fuentes sugieren que las diferentesespecies de roedores tienden a asociarse con diferentes tiposde vegetación en la región. Sigmodon hispidus está asociadocon los guamiles (Río Escondido); Heteromysdesmarestianus (Río San Pedro), H. gaumeri (Río Chocop) yOtotylomys phyllotis (Río San Pedro) con bosque alto; yOryzomys couesi (Río Sacluc) y Peromyscus yucatanicus(Flor de Luna) con bosque bajo y tintales ( Medellín yRedford, 1992; Young y Jones, 1983).
Obtuvimos un nuevo registro para Guatemala: el ratónciervo de Yucatán (Peromyscus yucatanicus; Muridae). Esteratón es de tamaño moderado, más largo que el P. leucopus(Young y Jones, 1983). Este es un endémico de la Penínsulade Yucatán, aunque su limite de distribución del sur no se hadeterminado aún (Huckaby, 1980). Las localidades del sur,en donde se ha reportado esta especie en la literatura seencuentra 7.5 km al oeste de Escárcega, Campeche, México(Dowler y Engstrom, 1988). Cuatro especies de P. y. badiusse recolectaron de Calakmul, Campeche y se depositan en lacolección del Instituto de Biología, Universidad Autónomade México (IBUNAM 37362, 37364, 37365, 37366), con115 km ESE de acuerdo con el último registro. Nuestroregistro constituye una extensión de 116 kms al sur deEscárcega y 134 km al suroeste de Calakmul.
Tabla 8.3. Riqueza y diversidad de murciélagos por área principal en el Parque Nacional Lagunadel Tigre, Petén, Guatemala.
H’ = el índice Shannon-Wiener Index
Area principal # Ind. # ESPECIE Diversidad (H’) PareamientoRío San Pedro 100 14 1.6897 0.8270Río Sacluc 38 10 1.3514 0.9050Río Escondido 38 12 1.8475 0.9173Laguna Flor de Luna 19 8 1.1769 0.8993Río Chocop 25 8 1.2899 0.9404Valores generales 220 20 1.4711 0.8978
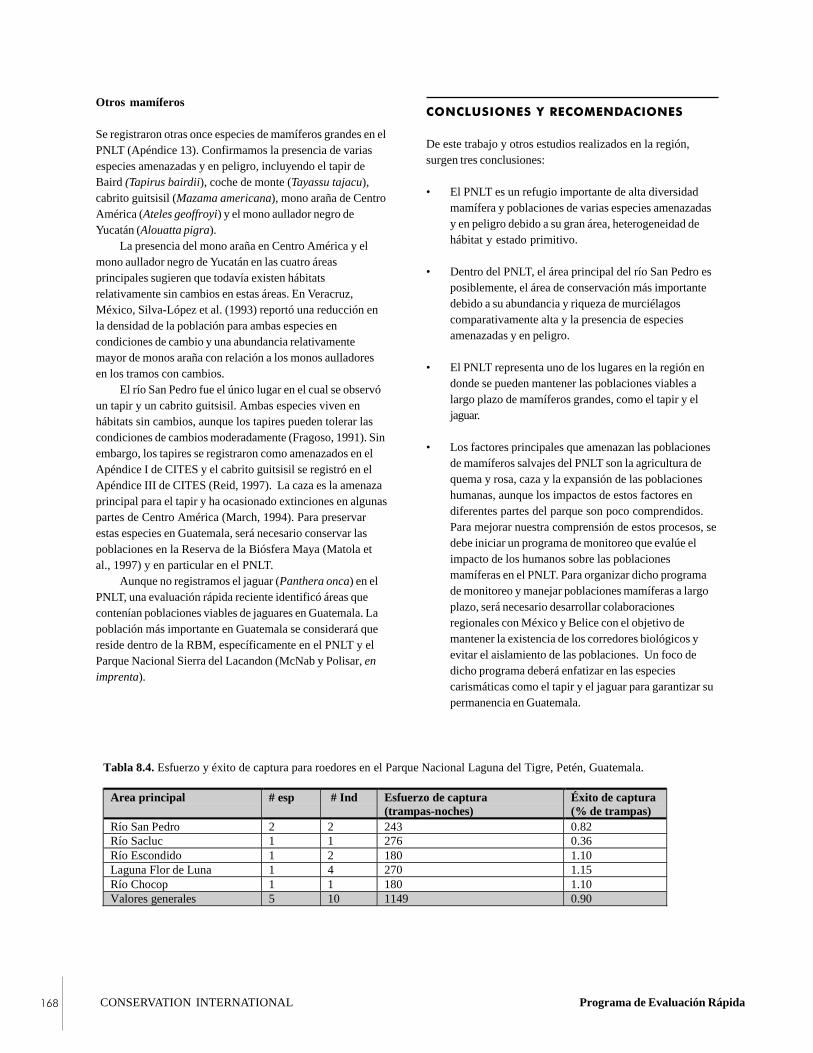
CONSERVATION INTERNATIONAL Programa de Evaluación Rápida���
��������������� ��������������
De este trabajo y otros estudios realizados en la región,surgen tres conclusiones:
• El PNLT es un refugio importante de alta diversidadmamífera y poblaciones de varias especies amenazadasy en peligro debido a su gran área, heterogeneidad dehábitat y estado primitivo.
• Dentro del PNLT, el área principal del río San Pedro esposiblemente, el área de conservación más importantedebido a su abundancia y riqueza de murciélagoscomparativamente alta y la presencia de especiesamenazadas y en peligro.
• El PNLT representa uno de los lugares en la región endonde se pueden mantener las poblaciones viables alargo plazo de mamíferos grandes, como el tapir y eljaguar.
• Los factores principales que amenazan las poblacionesde mamíferos salvajes del PNLT son la agricultura dequema y rosa, caza y la expansión de las poblacioneshumanas, aunque los impactos de estos factores endiferentes partes del parque son poco comprendidos.Para mejorar nuestra comprensión de estos procesos, sedebe iniciar un programa de monitoreo que evalúe elimpacto de los humanos sobre las poblacionesmamíferas en el PNLT. Para organizar dicho programade monitoreo y manejar poblaciones mamíferas a largoplazo, será necesario desarrollar colaboracionesregionales con México y Belice con el objetivo demantener la existencia de los corredores biológicos yevitar el aislamiento de las poblaciones. Un foco dedicho programa deberá enfatizar en las especiescarismáticas como el tapir y el jaguar para garantizar supermanencia en Guatemala.
Otros mamíferos
Se registraron otras once especies de mamíferos grandes en elPNLT (Apéndice 13). Confirmamos la presencia de variasespecies amenazadas y en peligro, incluyendo el tapir deBaird (Tapirus bairdii), coche de monte (Tayassu tajacu),cabrito guitsisil (Mazama americana), mono araña de CentroAmérica (Ateles geoffroyi) y el mono aullador negro deYucatán (Alouatta pigra).
La presencia del mono araña en Centro América y elmono aullador negro de Yucatán en las cuatro áreasprincipales sugieren que todavía existen hábitatsrelativamente sin cambios en estas áreas. En Veracruz,México, Silva-López et al. (1993) reportó una reducción enla densidad de la población para ambas especies encondiciones de cambio y una abundancia relativamentemayor de monos araña con relación a los monos aulladoresen los tramos con cambios.
El río San Pedro fue el único lugar en el cual se observóun tapir y un cabrito guitsisil. Ambas especies viven enhábitats sin cambios, aunque los tapires pueden tolerar lascondiciones de cambios moderadamente (Fragoso, 1991). Sinembargo, los tapires se registraron como amenazados en elApéndice I de CITES y el cabrito guitsisil se registró en elApéndice III de CITES (Reid, 1997). La caza es la amenazaprincipal para el tapir y ha ocasionado extinciones en algunaspartes de Centro América (March, 1994). Para preservarestas especies en Guatemala, será necesario conservar laspoblaciones en la Reserva de la Biósfera Maya (Matola etal., 1997) y en particular en el PNLT.
Aunque no registramos el jaguar (Panthera onca) en elPNLT, una evaluación rápida reciente identificó áreas quecontenían poblaciones viables de jaguares en Guatemala. Lapoblación más importante en Guatemala se considerará quereside dentro de la RBM, específicamente en el PNLT y elParque Nacional Sierra del Lacandon (McNab y Polisar, enimprenta).
Tabla 8.4. Esfuerzo y éxito de captura para roedores en el Parque Nacional Laguna del Tigre, Petén, Guatemala.
Area principal # esp # Ind Esfuerzo de captura(trampas-noches)
Éxito de captura(% de trampas)
Río San Pedro 2 2 243 0.82Río Sacluc 1 1 276 0.36Río Escondido 1 2 180 1.10Laguna Flor de Luna 1 4 270 1.15Río Chocop 1 1 180 1.10Valores generales 5 10 1149 0.90
�������������� ������������� Octubro 2000 ���
���� ��� �� ������
Amín, M. 1996. Ecología de comunidades de murciélagosen bosque tropical y hábitats modificados en la SelvaLacandona, Chiapas. Tesis de Licenciatura.Universidad Nacional Autónoma de México.
Amín, M. y R. A. Medellín. In press. Bats as indicators ofhabitat disturbance. In Single Species Approaches toConservation: What Works, What Doesn’t and WhyIsland Press, Washington, DC, USA.
Aranda, J. M. 1981. Rastros de los mamíferos silvestres deMéxico. Manual de campo. Instituto Nacional deInvestigaciones sobre Recursos Bióticos, México.
August, P. V. 1983. The role of habitat complexity andheterogeneity structuring tropical mammal communi-ties. Ecology 64:1495-1507.
Colwell, R. K. 1999. EstimateS 5. Statistical Estimation ofSpecies Richness and Shared Species from Samples.Web site: viceroy.eeb.uconn.edu/estimates.
Dirzo, R. y A. Miranda. 1990. Contemporary Neotropicaldefaunation and forest structure, function, anddiversity: A sequel to John Terborgh. ConservationBiology 4: 444-447.
Eisenberg, J. F. 1989. Mammals of the Neotropics: TheNorthern Neotropics: Panama, Colombia, Venezuela,Suriname, French Guiana. Vol 1. University ofChicago Press, Chicago, IL, USA.
Emmons, L. H. y F. Feer. 1997. Neotropical RainforestMammals: A Field Guide. Second edition. TheUniversity of Chicago Press, Chicago, IL, USA.
Fenton, M. B., L. Acharya, D. Audet, M. B. C. Hickey, C.Merriman, M. K. Obrist, D. M. Syme y B. Adkins.1992. Phyllostomid bats (Chiroptera: Phyllostomidae)as indicators of habitat disruption in the Neotropics.Biotropica 24: 440-446.
Fleming, T. H., E. T. Hooper y D. E. Wilson. 1972. ThreeCentral American bat communities: structure,reproductive cycles, and movement patterns. Ecology53: 555-569.
Fragoso, J. M. 1991. The effect of selective logging onBaird’s tapir. Pp. 295-304 in Latin America Mammal-ogy: History, Biodiversity, and Conservation (M. A.Mares and D. J. Schmidly, eds.). University ofOklahoma Press, Norman, OK, USA.
Gardner, A. L. 1977. Feeding habits. Pp. 351-364 inBiology of Bats of the New World: FamilyPhyllostomidae Part II (R. J. Baker, J. K. Jones, andD. C. Carter, eds.). Special Publications, Museum,Texas Tech University, Lubbock, TX, USA.
Garrott, R. A., P. J. White y C. A. Vanderbilt White. 1993.Overabundance: an issue for conservation biologists?Conservation Biology 7: 946-949.
Hall, E. R. 1981. The Mammals of North America, Vol. 1.John Wiley and Sons.
Huckaby, D. C. 1980. Species limits in the Peromyscusmexicanus group (Mammalian: Rodentia: Muridea).Contributions Sciences National History Museum,Los Angeles 326: 1-24.
Jones, C., W. J. McShea, M. J. Conroy y T. H. Kunz.1996. Capturing mammals. Pp. 115-155 in Measuringand Monitoring Biological Diversity: StandardMethods for Mammals (D. Wilson, J. R. Cole, J. D.Nichols, R. Rudran, and M. S. Foster, eds.).Smithsonian Institution Press, Washington, DC, USA.
Kunz, T. H. y A. Kurta. 1988. Capture methods andholding devices. Pp. 1-29 in Ecological and BehaviorMethods for Study of Bats (T. H. Kunz, ed.).Smithsonian Institution Press, Washington, DC, USA.
Kunz, T. H., D. W. Thomas, G. C. Richards, C. R.Tidemann, E. D. Pierson y P. A. Racey. 1996.Observational techniques for bats. Pp. 105-114 inMeasuring and Monitoring Biological Diversity:Standard Methods for Mammals (D. Wilson, J. R.Cole, J. D. Nichols, R. Rudran, and M. S. Foster,eds.). Smithsonian Institution Press, Washington, DC,USA.
LaVal, R. K. y H. S. Fitch. 1977. Structure, movement, andreproduction in three Costa Rican bat communities.Occasional Papers, Museum of Natural History,University of Kansas 69:1-28.
CONSERVATION INTERNATIONAL Programa de Evaluación Rápida���
Reid, F. A. 1997. A Field Guide to the Mammals of CentralAmerica and Southeast Mexico. Oxford UniversityPress, New York, NY, USA.
Silva-López, G., J. Benítez-Rodríguez, and J. Jimenéz-Huerta. 1993. Uso del hábitat por monos araña (Atelesgeoffroyi) y aullador (Alouatta palliata) en áreasperturbadas. Pp. 421-435 in Avances en el Estudio delos Mamíferos Méxicanos (R. A. Medellín and G.Ceballos, eds.). Publicaciones Especiales, AsociaciónMexicana de Mastozoología, A.C. 1:1-464.
Voss, R. S., and L. H. Emmons. 1996. Mammaliandiversity in Neotropical lowland rainforest: apreliminary assessment. Bulletin American Museumof Natural History 230:1-115.
Williams, S. E., and H. Marsh. 1998. Changes in smallmammal assemblage structure across a rain forest/openforest ecotone. Journal of Tropical Ecology 14:187-198.
Willig, M. R. 1986. Bat community in South America: atenacious chimera. Revista Chilena de Historia Natural59: 151-168.
Wilson, D. E. 1989. Bats. Pp. 365-382 in Tropical RainForest Ecosystems: Biogeographical and EcologicalStudies (H. Lieth and M. J. A. Werger, eds.). ElsevierScience Publications, Amsterdam, the Netherlands.
Wilson, D. E., R. Baker, S. Solari, and J. J. Rodríguez.1997. Bats: Biodiversity assessment in the LowerUrubamba Region. Pp. 293-301 in BiodiversityAssessment and Monitoring of the Lower UrubambaRegion, Peru: San Martin-3 and Cashiriari-2 WellSites (F. Dallmeier and A. Alonso, eds.). SI/MABSeries # 1. Smithsonian Institution/MAB BiodiversityProgram, Washington, DC, USA.
Wilson, D. E., and D. M. Reeder. 1993. Mammal species ofthe world: a taxonomic and geographic reference. 2nd.ed. Smithsonian Institution Press, Washington, DC,USA.
Young, C. J., and J. K. Jones. 1983. Peromyscusyucatanicus. Mammalian Species 196: 1-3.
Zar, J. H. 1984. Biostatistical Analysis. 2nd. Ed. PrenticeHall. Englewood Cliffs, NJ, USA.
Malcolm, J. R. 1997. Biomass and diversity of smallmammals in Amazonian Forest fragments. Pp. 207-221 in Tropical Forest Remnants: Ecology, Manage-ment, and Conservation of Fragmented Communities(W. F. Laurace and R. O. Bierregaard, eds.). TheUniversity of Chicago Press, Chicago, IL, USA.
March, I. J. 1994. Situación actual del tapir en México.Centro de Investigaciones Ecológicas del Sureste (SerieMonográfica No. 1).
Matola, S., A. D. Cuarón y H. Rubio-Torgler. 1997. Statusand action plan of Baird’s tapir (Tapirus bairdi). InTapir: Status and Conservation Action Plan (D. M.Brooks, R. E. Bodmer, and S. Matola, eds.). TheIUCN/SSC Tapir Specialist Group Report. Web site:http://www.tapirback.com/tapirgal/iucn-ssc/actions97/cover.htm.
McNab, R. B. y J. Polisar. In press. A participatorymethodology for a rapid assessment of jaguar(Panthera onca) distributions in Guatemala. WildlifeConservation Society.
Medellín, R. A. 1993. Estructura y diversidad de unacomunidad de murciélagos en el trópico húmedomexicano. Pp. 333-354 in Avances en el Estudio de losMamíferos Méxicanos (R. A. Medellín and G.Ceballos, eds.). Publicaciones Especiales, AsociaciónMexicana de Mastozoología, A. C. 1:1-464.
Medellín, R. A. 1994. Mammals diversity and conserva-tion in the Selva Lacandona, Chiapas, México.Conservation Biology 8:788-799.
Medellín, R. A., H. Arita, and O. Sánchez. 1997.Identificación de los murciélagos de México. clave decampo. Asociación Mexicana de Mastozoología, A.C.Publicaciones Especiales No 2. México.
Medellín, R. A., M. Equihua, and M. A. Amín. In press.Bat diversity and abundance as indicators of distur-bance in Neotropical rainforest. Conservation Biology.
Medellín, R. A., and K. H. Redford. 1992. The role ofmammals in Neotropical forest-savanna boundaries.Pp. 519-548 in Nature and Dynamics of Forest-Savanna Boundaries (P.A. Furley, J. Procyor, andJ.A. Ratter, eds.). Chapman & Hall.
Morrison, D. W. 1978. Lunar phobia in a tropical fruit bat,Artibeus jamaicensis (Chiroptera: Phyllostomidae).Animal Behaviour 26:852-855.

���� � � � � � ��������������� ���������������������� Julio 2000
������
• Registramos 112 especies y 39 géneros de hormigas enel Parque Nacional Laguna del Tigre (PNLT). Estosvalores son mayores que aquéllos registrados en variosotros estudios en la región.
• El género Pheidole contenía el número más grande deespecies, pero otros géneros arborícolas fuerontambién altamente diversos.
• Se registraron tres especies endémicas de hormigas en laregión del Bosque Maya, incluyendo Sericomyrmexaztecus, Xenomyrmex skwarrae y Odontomachusyucatecus. Un género extremadamente raro,Thaumatomyrmex, se descubrió por primera vez enGuatemala.
• La riqueza de las especies fue más alta en hábitatsrelativamente abiertos y con cambios, contrario anuestras expectativas. Esto se debió a la alta diversidadde microhábitats de estos sitios. Un hábitat modificadofue similar relativamente a un sitio boscoso primitivocercano, lo que coincide con la sugerencia de que larecuperación de la fauna de hormigas neotrópicas de loscambios es rápida.
• Los índices de cambio en la composición de lashormigas entre los sitios es muy alto, lo que impide unaevaluación de asociaciones de especie-hábitat. Lariqueza general de la fauna de hormigas del PNLT esmucho más alto que el registrado.
��������� �
������ ��������������� ���� ��������������� ������������������������ �����������������
Brandon T. Bestelmeyer, Leeanne E. Alonso y Roy R.Snelling
��� ��������
Se cree que los insectos son el grupo más vistoso de losorganismos sobre la tierra (Mayo, 1988). Este grupo alcanzasu mayor diversidad en bosques tropicales (Erwin y Scott,1980), así que el índice incrementado de deforestacióntropical puede resultar en reducciones severas de diversidadde insectos en todo el mundo. Por esta razón, los estudiosque documentan los patrones de diversidad de insectos entrelos bosques tropicales son necesarios para priorizar laconservación de las regiones tropicales y los hábitats dentrode las regiones (Haila y Margules, 1996). Otra consecuenciade la gran diversidad de insectos es que es difícillogísticamente hablando considerar todos los insectossimultáneamente en dichos estudios. Así, los ecologistasconfían en La información proporcionada por uno o másgrupos de insectos para caracterizar los patrones dediversidad de insectos en las regiones.
Las hormigas (Hymenoptera: Formicidae) son un grupoque puede ser útil para representar las respuestas de insectosterrestres. Las hormigas son extremadamente llamativas,abundantes, activas y elementos diversos de los bosquesneotropicales. Debido a que las hormigas son insectossociales, son tomadas en grupos y son muy flexibles en susrespuestas a las diferencias en su entorno en tiempo yespacio (Wilson, 1987). Como consecuencia de estaflexibilidad, las hormigas son exitosas en aún los hábitats másdifíciles. Las hormigas pueden encontrarse anidando en casitodas partes de los ecosistemas terrestres, desde lasprofundidades en columnas de tierra hasta las profundidadesde hojas secas y tierra y en arbustos epifitos y troncos deárboles.
Sin embargo, la composición y riqueza de las especiesde las comunidades de hormigas, revelaron respuestas a la

CONSERVATION INTERNATIONAL Programa de Evaluación Rápida���
variación del hábitat natural y a los cambios de hábitat(Andersen, 1991; Bestelmeyer y Wiens, 1996; Vasconcelos,1999) debido a que las diferentes especies pueden estarasociadas con condiciones determinadas del suelo (Johnson,1992), microclimas (Perfecto y Vandermeer, 1996) y aún lapresencia de especies asociadas con plantas particulares(Alonso, 1998), todos estos pueden verse alterados por lasactividades económicas humanas. En los bosques tropicalesen particular, el dosel es parte importante de lascaracterísticas ambientales que determinan la distribución yabundancia de las especies de hormigas (MacKay, 1991;Perfecto y Snelling, 1995). Las respuestas de las hormigaspara dicha variación puede utilizarse para evaluar tanto elvalor de la conservación de determinadas áreas como losefectos del uso de tierra por el hombre en la biodiversidad.
Todavía no se han reportado estudios de comunidadesde hormigas para los bosques de El Petén en Guatemala ynuestro objetivo principal en esta evaluación rápida fueproporcionar información preliminar de la riqueza ycomposición de la fauna de hormigas en el Parque NacionalLaguna del Tigre (PNLT) en un contexto biogeográfico.También deseamos proporcionar una evaluación preliminarde las relaciones entre la variación de hábitat y la variación enla composición y riqueza de la comunidad de hormigas.Específicamente, nos enfocamos en el contraste entre 1)hábitats de doseles cerrados que caracterizan el bosque alto,2) los hábitats de doseles relativamente abiertos incluyendoencinales y tintales que se producen por medio de procesosnaturales y 3) los guamiles que se producen por medio desucesiones secundarias después de la deforestación. Con lahipótesis de que los hábitats de doseles abiertos tienenmenos riqueza de especies y la composición de la comunidadalterada en comparación con los hábitats de doseles cerradosen el contexto de este bosque tropical, de acuerdo a lo queencontró MacKay (1991) y Vasconcelos (1999). Sinembargo, no muestreamos intensamente en hábitats depastos recientemente cambiados. Dicho esfuerzo debería serredundante ya que varios estudios han demostrado lasconsecuencias de dichos cambios drásticos en la vegetaciónde la diversidad de hormigas (Greenslade y Greenslade,1977; Quiroz-Robledo y Valenzuela-Gonzáles, 1995;Vasconcelos, 1999). Observamos los patrones del dominiode las especies de hormigas en los hábitats de los guamiles,para comparación con otros estudios en la región.Utilizamos esta información para resaltar la importanciaregional del parque e intentar identificar algunos procesosque pueden apoyar o amenazar a las hormigas y otraspoblaciones artrópodas en el parque. Nuestras observacionesintentan sugerir rutas fructíferas para estudios más intensosen el parque así como proporcionar información tentativasobre patrones de riqueza de especies de hormigas en laausencia de dichos estudios.
� ������������������������
Se muestrearon hormigas y variables ambientales en lostransectos en uno o más tipos de hábitats en cada área focal(refiérase a “Itinerario de la expedición y DiccionarioGeográfico”). No se hizo ningún intento de caracterizar lafauna de hormigas en áreas principales debido a que cada áreaprincipal contenía una variedad de distintos tipos de hábitatsque no podían muestrearse adecuadamente en el tiempopensado. Las especies de hormigas corresponden a lavariación del hábitat que ocurre en cada escala, así quenuestro objetivo principal fue examinar las asociaciones dehábitats de hormigas en distintos tipos de hábitats. Lastrampas se utilizaron para reunir muestras estandarizadaspara comparaciones cuantitativas, de acuerdo a losprocedimientos de Bestelmeyer et al. (en imprenta). Secolocó una trampa oculta (75 mm de diámetro) en diezpuntos en un área con intervalos de 10 metros (consulte laTabla 9.4). Las trampas se abrieron durante 48 horas. Serealizaron trampas ocultas en cinco puntos de muestrasterrestres: SPT1 (hábitats de guamil; consulte la Tabla 1.2);SPT4 (hábitat de encinal); SPT6 (hábitat de bosque alto,ramonal); ET1 (recientemente ramonal quemado) y FT1(hábitat de bosque bajo, tintal).
Además, se realizó la extracción de desechos Winkler enSPT1 y SPT6. La extracción de desechos se realizóutilizando el diseño “mini-Winkler”, siguiendo los métodosdescritos por Bestelmeyer et al. (en imprenta). Se muestreótoda la basura de hojas y ramas en un área de 1m2 en 10estaciones por área. Se tomaron muestras de desechos en porlo menos 2 metros de trampas ocultas.
Se utilizó carnada de atún para muestrear las especiesde hormigas excavadoras/omnívoras y para proporcionarinformación sobre el comportamiento merodeador de algunasespecies en ET1, ET2 (solamente hábitat de guamiles), FT1,CT1 (bosque alto) y CT4 (bosque alto). Se colocó unacarnada del tamaño de la mitad de una cucharada de atúnenlatado (ca. 3 g) en 10 puntos (espacios de 10 metros) a lolargo de un área de 90 metros. Esta actividad ocurrió al finalde la tarde o en la noche durante los períodos de actividadespico de las hormigas durante el estudio. El número deindividuos por especies de hormigas se registro cada 45minutos después de colocar la carnada o varias veces en unperíodo de dos horas (10, 30, 60, 90 y 120 minutos despuésde colocarlas), dependiendo de los objetivos de una sesión.
Finalmente, se utilizó el muestreo directo para registrarla presencia de especies de hormigas en cada área focal. Serealizó un muestreo directo en áreas de 90 metros en todoslos puntos muestreados y se realizó un muestreooportunista en toda el área de estudio. El muestreo directoincluyó la búsqueda de nidos en el suelo y basura al escarbarlas hojas en un área de 1m2 y la búsqueda visual de hormigas;rompiendo ramitas y troncos; buscando bajo las piedras; y

�������������� ������������� Octubro 2000 ���
en las hojas, sobre y bajo los árboles y en áreas de hasta 2metros. Estos datos no se utilizaron para comparacióndebido a que los hábitats y transectos eran diferentes en lacomposición de elementos de microhábitat y debido a losdiferentes lapsos de tiempo que estaban disponibles para labúsqueda en diferentes sitios.
Las especies y géneros fueron ordenados por categoríade acuerdo a grupos funcionales en base a observaciones decampo y reportes en la literatura. Grupos funcionales deAndersen (1995) y Bestelmeyer y Wiens (1996). Además,las especies fueron clasificadas de acuerdo con el tipo dedistribución geográfica que exhibieron en base a lainformación de la distribución en Kempf (1972), Brandão(1991), Longino (en línea) y Ward (en línea). Se reconocieronseis tipos de índices aquí: Bosque Maya (bosque en laPenínsula de Yucatán de México, el norte de Guatemala ynoreste de Belice), el norte de Centro América (sur deMéxico–Honduras), Centro América (sur de México–Colombia), en toda Centro América (sur de Estados Unidos–Centro América), Neotrópico (sur de México–norte deArgentina) y toda el área Neotropical (sur de EstadosUnidos–centro de Sur América).
Se utilizó un densiómetro para cuantificar la extensióndel bosque en cada punto a lo largo de los transectos en loscuales se realizó el muestreo.
Se comparó tanto la riqueza como la composición de lasespecies entre los puntos de muestra que representandistintos tipos o variantes de macrohábitats. La riqueza deespecies medida, así como la riqueza real calculada se utilizópara comparar los puntos de muestra, considerando que loshábitats pueden variar en cuanto a lo completo de lasespecies muestreadas. La riqueza se calculó utilizando lastécnicas de extrapoblación de riqueza (Colwell yCoddington, 1994) y utilizando el software EstimateS(versión 5.0.1; Colwell, 1997). Solamente se consideraron loscálculos en base en las incidencias ya que la abundancia dehormigas a menudo se ve atestado debido a su hábito deanidar. En primer y segundo lugar los calculadores deinsectívoros y el calculador de cobertura basado en laincidencia (ICE) se reportan acá.
Los patrones de composición de especies se evaluaronen dos formas. Primero, comparamos cada punto demuestreo en una forma equitativa utilizando índices desimilitud. Se usaron los índices de cálculo de Sorensen, loscuales se basaron en el número esperado de especiescompartidas entre muestras de un calculador de cobertura(EstimateS 5.0.1, Colwell, 1997). Adicionalmente, seproporcionan valores de similitud no modificados en elformato de índices de Morisita-Horn. En segundo lugar,utilizamos técnicas de agrupación por aglomeraciónjerárquica para establecer los patrones de similitud en lacomposición de especies entre grupos de puntos demuestreo considerados como uno solo. Se utilizó elprocedimiento de agrupación central llamado método de
variación mínima de Ward (PC-ORD 4.0; McCune yMefford, 1999) después de las discusiones de Legendre yLegendre (1998).
Finalmente, los patrones de abundancia de hormigas enlas carnadas se compararon entre dos transectos, uno en losguamiles (ET2) y el otro en bosque alto (FT1) paracomparar los patrones de forraje y dominancia de lashormigas entre estos diferentes tipos de hábitats. Laabundancia de hormigas en carnadas individuales setransformó de acuerdo con cinco escalas de abundancia (0-5)de acuerdo con Andersen (1991).
���������
Sobre todos los puntos de muestreo, se registraron 112especies y morfoespecies de 39 géneros de hormigas(Apéndice 14). De estas, 71 especies se reunieron utilizandométodos sistemáticos (extracción de trampas ocultas ybasura) y las restantes 41 especies se reunieron solamentecon la mano o con carnadas de atún. La recolección manualregistró 79 especies. Pheidole fué el género más vistoso (20especies y OTU), seguidos por Pseudomyrmex (9),Camponotus y Cephalotes (7), Pachycondyla y Solenopsis(6), Azteca (5) y Odontomachus (4). Se encontraron sieteespecies en las cuatro áreas focales que se pueden considerarcomunes; éstas incluyen: Camponotus atriceps, C.novogranadensis, C. planatus, Cyphomyrmex minutus,Dolichoderus bispinosus, Solenopsis geminata y Wasmanniaauropunctata.
Se conocen treinta y tres especies o se sospecha queson exclusivamente terrestres y 29 exclusivamente arbóreas.El resto de las especies pueden ocurrir en microhábitats o ensus afinidades de hábitat son desconocidas. Se buscóexhaustivamente una bromeliacea epífita en la cual seregistró, Aechmea tillandsia. Camponotus planatus,Cephalotes minutus, C. scutulatus, Crematogasterbrevispinosus y Pseudomyrmex oculatus. Las hormigas serecolectaron en 20 metros de longitud de un árbol Piscidiapiscipula que cayó durante una tormenta. Camponotusatriceps, Ectatomma tuberculatum, Hypoponera sp. B (nidosen cortezas), Pachycondyla stigma, Pheidole sp. H (nidos enepífitos, Epidendrum sp.), Pheidole punctatissima yTapinoma inrectum se recolectaron de este árbol.
Las especies registradas en la muestra que se restringenal norte de América Central (así se conocen hasta ahora)incluyen Azteca foreli, Belonopelta deletrix, Cephalotesbasalis, C. biguttatus, Hypoponera nitidula, Pseudomyrmexferrugineus, P. pepperi, Rogeria cornuta y Trachymyrmexsaussurei. Odontomachus yucatecus, Sericomyrmex aztecus,Xenomyrmex skwarrae pueden clasificarse como endémicasdel Bosque Maya. O. yucatecus se recolectó en trampasocultas en ramas quemadas y sitios de guamiles, S. aztecusde las trampas ocultas en el guamil y X. skwarrae se
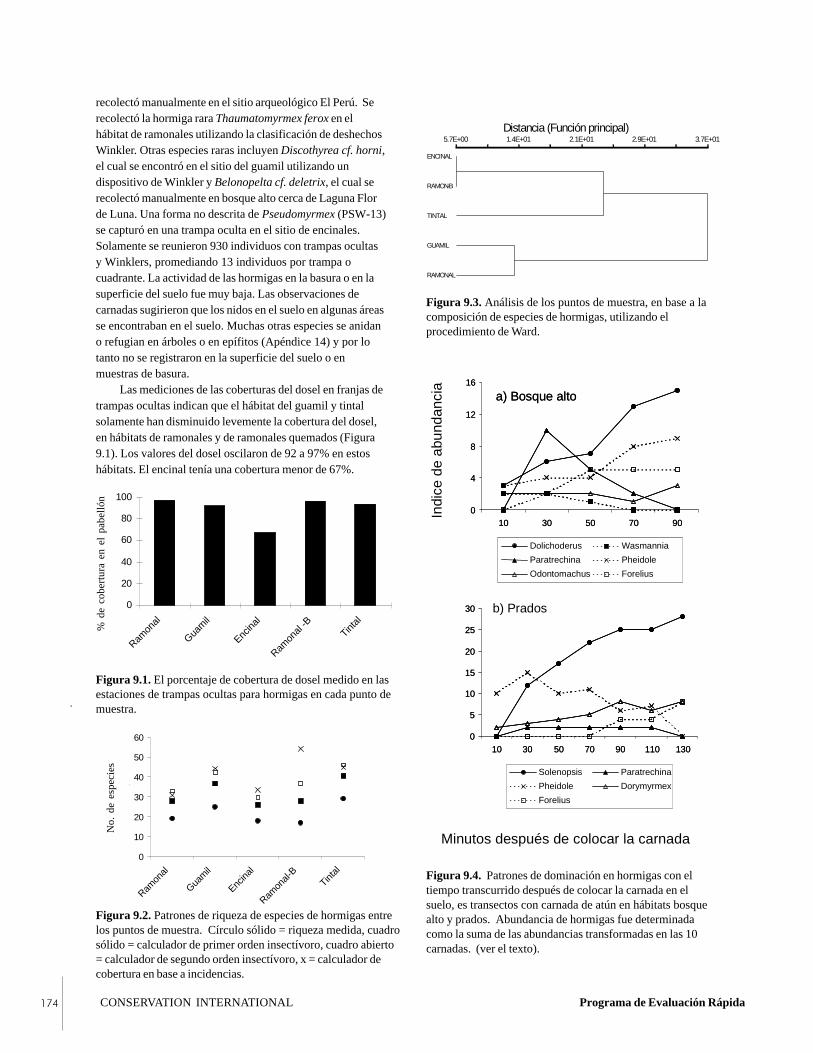
CONSERVATION INTERNATIONAL Programa de Evaluación Rápida���
recolectó manualmente en el sitio arqueológico El Perú. Serecolectó la hormiga rara Thaumatomyrmex ferox en elhábitat de ramonales utilizando la clasificación de deshechosWinkler. Otras especies raras incluyen Discothyrea cf. horni,el cual se encontró en el sitio del guamil utilizando undispositivo de Winkler y Belonopelta cf. deletrix, el cual serecolectó manualmente en bosque alto cerca de Laguna Florde Luna. Una forma no descrita de Pseudomyrmex (PSW-13)se capturó en una trampa oculta en el sitio de encinales.Solamente se reunieron 930 individuos con trampas ocultasy Winklers, promediando 13 individuos por trampa ocuadrante. La actividad de las hormigas en la basura o en lasuperficie del suelo fue muy baja. Las observaciones decarnadas sugirieron que los nidos en el suelo en algunas áreasse encontraban en el suelo. Muchas otras especies se anidano refugian en árboles o en epífitos (Apéndice 14) y por lotanto no se registraron en la superficie del suelo o enmuestras de basura.
Las mediciones de las coberturas del dosel en franjas detrampas ocultas indican que el hábitat del guamil y tintalsolamente han disminuido levemente la cobertura del dosel,en hábitats de ramonales y de ramonales quemados (Figura9.1). Los valores del dosel oscilaron de 92 a 97% en estoshábitats. El encinal tenía una cobertura menor de 67%.
Figura 9.1. El porcentaje de cobertura de dosel medido en lasestaciones de trampas ocultas para hormigas en cada punto demuestra.
Figura 9.2. Patrones de riqueza de especies de hormigas entrelos puntos de muestra. Círculo sólido = riqueza medida, cuadrosólido = calculador de primer orden insectívoro, cuadro abierto= calculador de segundo orden insectívoro, x = calculador decobertura en base a incidencias.
Distance (Objective Function)5.7E+00 1.4E+01 2.1E+01 2.9E+01 3.7E+01
ENCINAL
RAMON-B
TINTAL
GUAMIL
RAMONAL
Distancia (Función principal)5.7E+00 1.4E+01 2.1E+01 2.9E+01 3.7E+01
ENCINAL
RAMON-B
TINTAL
GUAMIL
RAMONAL
Figura 9.3. Análisis de los puntos de muestra, en base a lacomposición de especies de hormigas, utilizando elprocedimiento de Ward.
0
4
8
12
16
10 30 50 70 90
Dolichoderus Wasmannia
Paratrechina Pheidole
Odontomachus Forelius
0
5
10
15
20
25
30
10 30 50 70 90 110 130
Solenopsis Paratrechina
Pheidole Dorymyrmex
Forelius
a) Bosque alto
Minutos después de colocar la carnada
0
4
8
12
16
10 30 50 70 90
Dolichoderus Wasmannia
Paratrechina Pheidole
Odontomachus Forelius
0
5
10
15
20
25
30
10 30 50 70 90 110 130
Solenopsis Paratrechina
Pheidole Dorymyrmex
Forelius
a) Bosque alto
b) Prados
Indi
ce d
e ab
unda
ncia
Figura 9.4. Patrones de dominación en hormigas con eltiempo transcurrido después de colocar la carnada en elsuelo, es transectos con carnada de atún en hábitats bosquealto y prados. Abundancia de hormigas fue determinadacomo la suma de las abundancias transformadas en las 10carnadas. (ver el texto).
.
0
20
40
60
80
100
Ramon
al
Guam
il
Encina
l
Ramon
al -B
Tintal
% c
anop
y co
ver
% d
e co
bert
ura
en e
l pa
bell
ón
0
10
20
30
40
50
60
Ramon
al
Guam
il
Encina
l
Ramon
al-B
Tintal
Num
ber
of S
peci
es
No.
de
espe
cies

�������������� ������������� Octubro 2000 ���
La riqueza medida fue mayor en el hábitat de tintalseguido por el hábitat de guamil (Figura 9.2). Loscalculadores de riqueza de insectívoros también sugieren quela riqueza fue mayor en estos hábitats. El calculador ICEindicó que el hábitat ramonal fue más rico, seguido por elhábitat del guamil y tintal.
La similitud esperada entre los hábitats fuegeneralmente más bajo, oscilando de 0.195 a 0.510 (Tabla9.1). La comparación de hábitat encinal-tintal mostró elmayor valor de similitud, por lo tanto el ramonal y elramonal quemado fueron la pareja de hábitat más diferentes.La pareja de ramonal-guamil y la pareja de encinal-ramonalquemado también tenían valores altos similares. El índiceMorisita-Horn, que incluye una medición de abundancia,produjo un patrón diferente. Utilizando esta métrica, elhábitat del encinal y en ramonal quemado fueron los másparecidos, seguido por la pareja de ramonal y guamil y la deencinal y tintal, por lo tanto las otras parejas mostraron
similitud generalmente baja. El análisis de agrupación revelódos grupos diferentes, uno que contenía el encinal, ramonalquemado y tintal y el otro guamil y ramonal (Figura 9.3). Lasimilitud relativamente alta entre el encinal y el ramonalquemado observados en los índices de Morisita-Horn esaparente en el diagrama de grupos.
Los datos de carnadas del bosque alto y los guamilesrevelaron diferencias grandes en el dominio de especies dehormigas (Figura 9.4). En el área del bosque alto,Dolichoderus bispinosus y Pheidole spp. incrementaron enabundancia en carnadas con tiempo, mientras queParatrechina sp. B alcanzó un pico en 30 minutos despuésde colocarlas y declino posteriormente. En el área de losguamiles, Solenopsis geminata dominó extremadamene y laabundancia de Pheidole sp. Que disminuyó gradualmente conel tiempo. La abundancia de Forelius sp. y Dorymyrmex sp.incrementó con el tiempo mientras incrementaban lastemperaturas de la superficie de la tierra durante la sesión decarnadas.
Tabla 9.1. Patrones de similitud de comunidades de hormigas entre los tipos de hábitats con base en los datos detrampas ocultas. Los valores en las celdas son índices de Sorensen, con base en el número esperado de especiescompartidas entre muestras de un calculador con base en la cobertura. Los valores en paréntesis son índices deMorisita-Horn con base en los datos observados.
Ramonal Guamil Encinal Ramonal-BRamonal --Guamil 0.460 (0.215) --Encinal 0.212 (0.020) 0.285 (0.178) --Ramonal-B 0.195 (0.130) 0.280 (0.116) 0.409 (0.635) --Tintal 0.237 (0.054) 0.320 (0.072) 0.510 (0.201) 0.286 (0.114)
Tabla 9.2. Una comparación de riqueza de especies y riqueza genérica entre las regiones neotrópicas con base en losestudios publicados.
Estos estudios en particular, fueron seleccionados para representar regiones debido a que eran bastante similares alestudio presentado aquí (es decir, una evaluación de heterogeneidad a nivel de paisajes). La escala representa ladistancia máxima entre muestras. Cuando no se reportaron los valores, proporciono un cálculo de escala (seguido porun signo “?”), basados en la información en el texto, cuando era posible. Los valores se encuentran en ordendescendiente de latitud.
Riqueza de especies Riqueza genérica Escala/# habitantes Ubicación103 46* Dentro de10 km?/2 Veracruz, México1
87 32 Dentro 2 km?/3 Chiapas, México2
112 39 ca. 80 km/5 LTNP, Guatemala3
109 31 Dentro 35 km/4 Sarapaqui, Costa Rica4
127 49 ?/elevación BCI, Panamá5
156 49 ?/3 Trombetas, Brasil6
184 45 ?/3 Amazonas, Brasil7
104 30 ca. 10 km/4 Salta, Argentina8
*Los valores de la riqueza genérica se ajustaron si los sinónimos genéricos fueron reconocidos en listas de especies.1Quiróz-Robledo y Valenzuela-Gonzáles 1995 2MacKay et al. 19913 este estudio 4Roth et al. 19945Levings 1983 6Vasconcelos 1999 7Majer y Delabie 1994 8Bestelmeyer y Wiens 1996
CONSERVATION INTERNATIONAL Programa de Evaluación Rápida���
A pesar de estas limitaciones, el número de hormigasregistrado en el PNLT se compara favorablemente con losresultados de otros estudios (Tabla 9.2). Aunque el númerode tipos de hábitats muestreados y las escalas sobre lascuales se tomaron las muestras difieren entre estos estudios,se pueden hacer algunas comparaciones con precaución. Lariqueza de especies y el valor de género en este estudio sonsimilares o mayores a los registrados en estudios realizadosen bosques tropicales de México y Costa Rica, pero sonmenores a aquellos de estudios en bosques panameños y dela amazona brasileña. En general, este patrón sugiere unacurva de riqueza en forma de campana en todos los bosquesneotropicales, con un pico desde el área de Centro Américahasta la amazona brasileña. Se necesitarán estudiosadicionales que empleen técnicas de recolecciónestandarizadas y diseños de muestreo para determinar lavalidez de este patrón. Si se propicia una relación de unaforma específica, podría servir como base desde la cualanticipara y evaluar la biodiversidad de las hormigas enubicaciones tropicales.
Pocas especies parecen ser endémicas a los bosquesmayas, aunque hacen falta datos que se puedan compararcon otros estudios. Comúnmente se encontraron variosgéneros en otros estudios de hormigas en los bosquescentroamericanos pero aquí no se encontraron, incluyendoAdelomyrmex, Leptogenys y Oligomyrmex y a una extensiónmenor Megalomyrmex y Proceratium. Por otro lado, seregistraron varios géneros en este estudio que a menudo nose han registrado en otros estudios regionales, incluyendoBelonopelta, Discothyrea, Thaumatomyrmex y Xenomyrmex.El registro de Thaumatomyrmex ferox es importante. Sehizo referencia a esta hormiga como “hormiga milagrosa” por
Wilson y Hölldobler (1995) por su rareza y belleza. Se sabeque existen menos de 100 especímenes en museos y estorepresenta el primer registro que conocemos de Guatemala.
Contrario a nuestras expectativas, la riqueza de lashormigas no fue mayor en hábitats cerrados, pero fue mayoren hábitats que se encontraban un poco más abiertos y en elcaso del guamil, más distribuidos (Figura 9.2). La riqueza delhábitat relativamente abierto del encinal fue similar a la delhábitat del ramonal de doseles cerrados. Además, lacomposición de la comunidad de las hormigas de los hábitatsabiertos o con cambios no difieren sistemáticamente deaquellos de más doseles cerrados o hábitats “primitivos” (esdecir, ramonal). Por el hecho de estudios previos de losefectos de cambios en el bosque, incluyendo los realizadospor MacKay (1991) y Vasconcelos (1999), este estudiopuede ser considerado hábitat que recientemente sufrió máscambios severos que aquellos ya considerados conanterioridad. MacKay (1991), por ejemplo, observó unareducción del 50% en la riqueza de especies en bosques de laregión de Chiapas que sufren roza y quema y la pérdida seatribuye a la pérdida de especies arbóreas. En contraste, lossitios con cambios en este estudio tienen coberturaabundante de doseles (Figura 9.1). La recuperación debosques maduros y comunidades puede tomar de 13 a 24años después de los cambios (Roth et al., 1994; Vasconcelos,1999) y el hábitat del guamil estudiado aquí se calculó queempezó a sufrir cambios hace más de veinte años atrás(Francisco Bosoc, pers. comm.). Además, nuestro estudiotambién consideró las comunidades de hormigas que seestaban realizando en tipos de bosques abiertos naturalmenteen la región. Las poblaciones de muchas especies dehormigas ahora presentes en los bosques de El Petén puedenser insensibles a las diferencias moderadas en la estructura dela vegetación debido a que estas hormigas han estadoexpuestas a incrementos históricos en las tierras áridas de laregión, así como a los cambios antropogénicos de la misma(Méndez, 1999). Por razones similares, la riqueza másgrande de hormigas observado en los hábitats de guamil ytintal puede deberse al hecho de que las hormigas que habitanestos sitios pueden acoplarse a las condiciones de la épocaseca. La riqueza observada del hábitat ramonal podría sermayor al de los sitios con cambios si se muestreara en unaépoca del año o si se comparara con sitios con cambiosrecientes. Desafortunadamente, el poder estadístico de esteestudio es demasiado bajo para identificar especiesdeterminadas que pueden disminuir cuando el bosque alto seconvierte en guamil. Es posible que las especies crípticas yalgunos depredadores especialistas en hábitats más pequeñosy especies arbóreas (Apéndice 14) sería el más afectado(consulte Bestelmeyer y Wiens, 1996).
La similitud relativamente alta entre los hábitatsramonal y guamil puede estar dominada por su proximidaden lugar de su estructura de hábitat o historial de cambios.
���������
La actividad de las hormigas durante el período de muestreofue bajo, así que es normal que los valores de riqueza deespecies sea menospreciado. Muchas de las especies dehormigas pueden haber estado completamente inactivassobre la tierra debido a las condiciones ásperas eimproductivas que caracterizan la época seca (consultetambién Janzen y Schoener, 1968; Levings, 1983;Bestelmeyer y Wiens, 1996). Durante las temporadas secastropicales, algunas especies de hormigas pueden descenderdel estrato superior a la columna de suelo en donde nopueden muestrearse utilizando sus trampas ocultas oextracción de basura de hojas (Levings y Windsor, 1982;Harada y Bandeira, 1994). De esa forma, el muestreo directoproporcionado por la carnada de atún parece haber sido lacombinación más eficiente de los procedimientos demuestreo bajo las condiciones presentes durante el estudio,especialmente cuando se consideran el tiempo depreparación posterior al procedimiento.
�������������� ������������� Octubro 2000 ���
Dicho efecto fue notado por Feener y Schupp (1998) yBestelmeyer (2000). La similitud de los hábitats de ramonalquemado y de encino no se pueden atribuir a la proximidad yno está claro todavía qué es lo que puede causar este patrón.
El dominio relativo de Solenopsis geminata en el hábitatde guamiles (Figura 9.4) se ha observado en otros estudiosrealizados en Centro América (Perfecto, 1991; Perfecto yVandermeer, 1996). Esta hormiga es favorecida por lascondiciones climáticas cálidas bien aisladas en hábitatsdeforestados. La presencia de Forelius y Dorymyrmex, quees un género dominante en la zona árida, en los guamiles yotros hábitats cambiados fue sorprendente. No pudimosrealizar registros de estos géneros en hábitats similares enestudios realizados más al sur de Centro América. Lapresencia de estos géneros en los bosques de Petén puedenrelacionarse con la aridez relativa de muchos microhábitatsnaturales en la región y a su proximidad a áreas áridas delnorte. Dorymyrmex, Forelius y Solenopsis soncaracterísticos de los desiertos neárticos y su dominiocombinado en los guamiles disminuye el inmenso cambio enlas condiciones ambientales en comparación con el bosque(también consulte Quiróz-Robledo y Valenzuela-Gonzáles,1995).
��������������� ��������������
Es muy útil ver los patrones de la diversidad de hormigascon relación a las clases de microhábitats disponibles paraque los ocupen diferentes especies de hormigas.Generalmente, la riqueza de las hormigas parece estar a sumáximo cuando varios tipos de microhábitats—basura dehojas y ramas, espacios de tierra suelta, ramas y troncoscaídos, epífitos, arbustos y árboles de varias especies, porejemplo—son abundantes en el área. La reducción oeliminación de estos hábitats de hormigas en un área resultaen disminuciones en la riqueza de hormigas y dominioincrementado por especies altamente competitivas dehormigas. Además, los cambios naturales frecuentes oantropogénicos eliminarán las especies de hormigas de lasáreas aún cuando se encuentren disponibles los hábitatsadecuados.
La evidencia presentada aquí y en estudios citadosanteriormente sugieren que la recuperación de microhábitatsadecuados para hormigas de bosques tropicales después delos cambios puede ser rápida. La recuperación tanto delbosque como de sus microhábitats es contingente en el gradodel uso agrícola y erosión del suelo. La erosión del suelopuede ser importante en los bosques de Petén debido a lossuelos delgados sobre las capas de las montañas (Beach,1998). Además, la recolonización de hormigas en losmicrohábitats necesariamente depende de la presencia de laproximidad de las poblaciones de origen. La relación entre ladistribución de la población de origen y los índices de
colonización no se han considerado en detalle, pero esposible que existan cantidades límite de deforestación másallá de las colonizaciones que se limiten por las especies dehormigas (Roth et al., 1994), pueden existir las extincionesen toda la región (Hanski y Gilpin, 1996). Estudios deevaluación rápida y los estudios de corta duración de losefectos de la alteración del hábitat en las comunidades dehormigas no pueden esperar detectar dichos límites o efectosregionales. Lo mejor que podemos hacer en este caso esestar conscientes de la potencia de estos efectos. A pesar delas habilidades de la relativamente buena colonización dehormigas y algunas otras especies de insectos, ladeforestación amenaza la extinción de sus poblaciones. Eneste momento, sin embargo, la diversidad de las hormigasdentro del parque es alta, y debería realizarse cualquieresfuerzo para mantenerla.
El manejo de los bosques dentro del PNLT para laconservación de hormigas debería enfatizar la preservaciónde una variedad de hábitats. Una forma de lograrlo esconservar la extensión de los declives topográficos, quegeneralmente son reconocidos como determinantes ladiversidad de las hormigas en territorios tropicales (porejemplo, Olson, 1994) y de la biodiversidad en el PNLT enparticular (Méndez et al., 1998). Los epífitos y otrosmicrohábitats de doseles disponibles en los árboles altospuede contener muchas especies de hormigas únicas(Longino y Nadkarni, 1990), así los bosques altos deberíanser objeto de estudios adicionales y conservación.
La composición de las comunidades de hormigas esmuy irregular y los índices de cambios son muy altos (Tabla9.1), así que se necesitarán estudios más intensos paraaclarar los efectos del patrón de espacio y los factoresambientales en la diversidad de las hormigas. Las hormigasresponden en formas importantes e informativas a lavariación del terreno y proporcionan un punto importante yútil en más estudios extensivos y monitoreos. Las hormigasresponden a los procesos como la variación topográfica,patrones de inundaciones yde esa forma indicar la irregularidad ambiental y la dinámicaque son importantes para los que manejan las tierras. Elcomprender las relaciones entre los cambios animales,drenajes e incendios, será importante para identificar lasáreas de conservación prioritarias dentro de los hábitatsterrestres del parque. Las recomendaciones específicas sonlas siguientes:
• Los bosques altos altamente complejos en áreas comoEl Perú y Laguna Guayacán que parecen haber sufridorelativamente pequeños cambios previos deberíaprotegerse y examinarse en mayor detalle—especialmente el dosel y las comunidades.
• La conservación de una variedad de tipos de hábitats—en donde los tipos de hábitats se definen de acuerdo a la
CONSERVATION INTERNATIONAL Programa de Evaluación Rápida���
vegetación, topografía y características del suelo—esposible tener una buena estrategia para conservar lashormigas y otros artrópodos terrestres. En el PNLT,las tecnologías de censos remotos puede ayudar en esteproceso.
• La fauna de hormigas de bosques altos y otros sitiosdebería investigarse en alguna época del año, como alprincipio de la época húmeda. Las trampas Malaisedeberían utilizarse para capturar formas sexualesvoladoras durante este período, además de las técnicastradicionales. Esto posiblemente nos llevaría a unregistro más completo de la fauna de las hormigas delparque (e insectos).
• Los esfuerzos adicionales de estudio y monitoreodeberían examinar el papel de la topografía, variacióndel suelo y el historial de incendios en las hormigas yotras comunidades de animales en el parque.
• Se necesitan los estudios repetidos en tipos de hábitatsnaturales como encinales y selva baja para proporcionarevaluaciones más detalladas del complemento de lasfaunas de hormigas entre los tipos de hábitat en elparque.
���� ��� �� ������
Alonso, L. E. 1998. Spatial and temporal variation in theant occupants of a facultative ant-plant. Biotropica30: 210-213.
Andersen, A. N. 1991. Sampling communities of ground-foraging ants: pitfall catches compared with quadratcounts in an Australian tropical savanna. AustralianJournal of Ecology 16: 273-279.
Andersen, A. N. 1995. A classification of Australian antcommunities, based on functional groups whichparallel plant life-forms in relation to stress anddisturbance. Journal of Biogeography 22: 15-29.
Beach, T. 1998. Soil catenas, tropical deforestation, andancient and contemporary soil erosion in the Petén,Guatemala. Physical Geography 19: 378-405.
Belshaw, R. y B. Bolton. 1993. The effect of forestdisturbance on the leaf litter ant fauna of Ghana.Biodiversity and Conservation 2: 656-666.
Bestelmeyer, B. T. 2000. A multiscale perspective on antdiversity in semiarid landscapes. Dissertation.Colorado State University, Fort Collins, CO, USA.
Bestelmeyer, B. T. y J. A. Wiens. 1996. The effects of landuse on the structure of ground-foraging ant communi-ties in the Argentine Chaco. Ecological Applications6:1225-1240.
Bestelmeyer, B.T., D. Agosti, L. Alonso, C. R. Brandão,W. L. Brown Jr., J. H. C. Delabie y R.
Silvestre. In press. Field techniques: an overview, descrip-tion, and evaluation of sampling techniques. InMeasuring and Monitoring Biodiversity: StandardTechniques for Ground-Dwelling Ants (D. Agosti, J.Majer, T. Schultz, and L. Alonso, eds.). SmithsonianInstitution Press, Washington, DC, USA.
Brandão, C. R. F. 1991. Adendos ao catálogo abreviado dasformigas da região neotropical Hymenoptera:Formicidae. Revista Brasileira de Entomología 35:319-412.
Colwell, R. K. 1997. EstimateS 5. Statistical Estimation ofSpecies Richness and Shared Species from Samples.Web site: http://viceroy.eeb.uconn.edu/estimates.
Colwell, R. K. y J. A. Coddington. 1994. Estimatingterrestrial biodiversity through extrapolation.Philosophical Transactions of the Royal Society ofLondon 345:101-118.
Erwin, T. L. y J. C. Scott. 1980. Seasonal and sizepatterns, trophic structure, and richness of Coleopterain the tropical arboreal ecosystem: the fauna of thetree Luehua seemanni Triana and Planch in the CanalZone of Panama. Coleopterists Bulletin 34: 305-322.
Feener, D. H. y E. W. Schupp. 1998. Effects of treefallgaps on the patchiness and species richness ofneotropical ant assemblages. Oecologia 116:191-201.
Greenslade, P. J. M. y P. Greenslade. 1977. Some effects ofvegetation cover and disturbance on a tropical antfauna. Insectes Sociaux 24: 163-182.
Haila, Y. y C. R. Margules. 1996. Survey research inconservation biology. Ecography 19:323-331.
Hanski, I. y M. Gilpin, eds. 1996. MetapopulationDynamics: Ecology, Genetics, and Evolution.Academic Press, New York, NY, USA.
Harada, A. Y. y A. G. Bandeira. 1994. Estratificacão edensidade de invertebrados em solo arenoso sobfloresta primária e plantios arbóreos na Amazoniacentral durante estacão seca. Acta Amazonica 24: 103-118.
�������������� ������������� Octubro 2000 ���
Janzen, D. H. y T. W. Schoener. 1968. Differences in insectabundance and diversity between wetter and driersites during a tropical dry season. Ecology 49:96-110.
Johnson, R. A. 1992. Soil texture as an influence on thedistribution of the desert seed-harvester antsPogonomyrmex rugosus and Messor pergandei.Oecologia 89:118-124.
Kempf, W. W. 1972. Catálogo abreviado das formigas daregião neotropical Hymenoptera: Formicidae. StudiaEntomológica 15:3-344.
Legendre, P. y L. Legendre. 1998. Numerical Ecology, 2nd
English ed. Elsevier, Amsterdam, the Netherlands.
Levings, S. C. 1983. Seasonal, annual, and among-sitevariation in the ground ant community of a deciduoustropical forest: some causes of patchy speciesdistributions. Ecological Monographs 53: 435-455.
Levings, S. C. y D. M. Windsor. 1982. Seasonal and annualvariation in litter arthropod populations. Pp. 355-387in The Ecology of a Tropical Forest: SeasonalRhythms and Long-term Changes (E. G. Leigh Jr., A.S. Rand, and D. M. Windsor, eds). SmithsonianInsitution Press, Washington, DC, USA.
Longino, J. T. Online. www.evergreen.edu/user/serv_res/research/arthropod/ AntsofCostaRica.html).
Longino, J. T. y N. Nadkarni. 1990. A comparison ofground and canopy leaf litter ants (Hymenoptera:Formicidae) in a neotropical montane forest. Psyche97:81-93.
May, R. M. 1988. How many species are there on Earth?Science 241:1141-1148.
MacKay, W. P. 1991. Impact of slashing and burning of atropical rainforest on the native ant fauna(Hymenoptera:Formicidae). Sociobiology 3: 257-268.
McCune, B. y M. J. Mefford. 1999. PC-ORD. Multivari-ate Analysis of Ecological Data, version 4.0. MjMSoftware Design, Gleneden Beach, OR, USA.
Méndez, C. 1999. How old is the Petén tropical forest?Pp. 31-34 in Thirteen Ways of Looking at a TropicalForest: Guatemala’s Maya Biosphere Reserve (J. D.Nations, ed.). Conservation
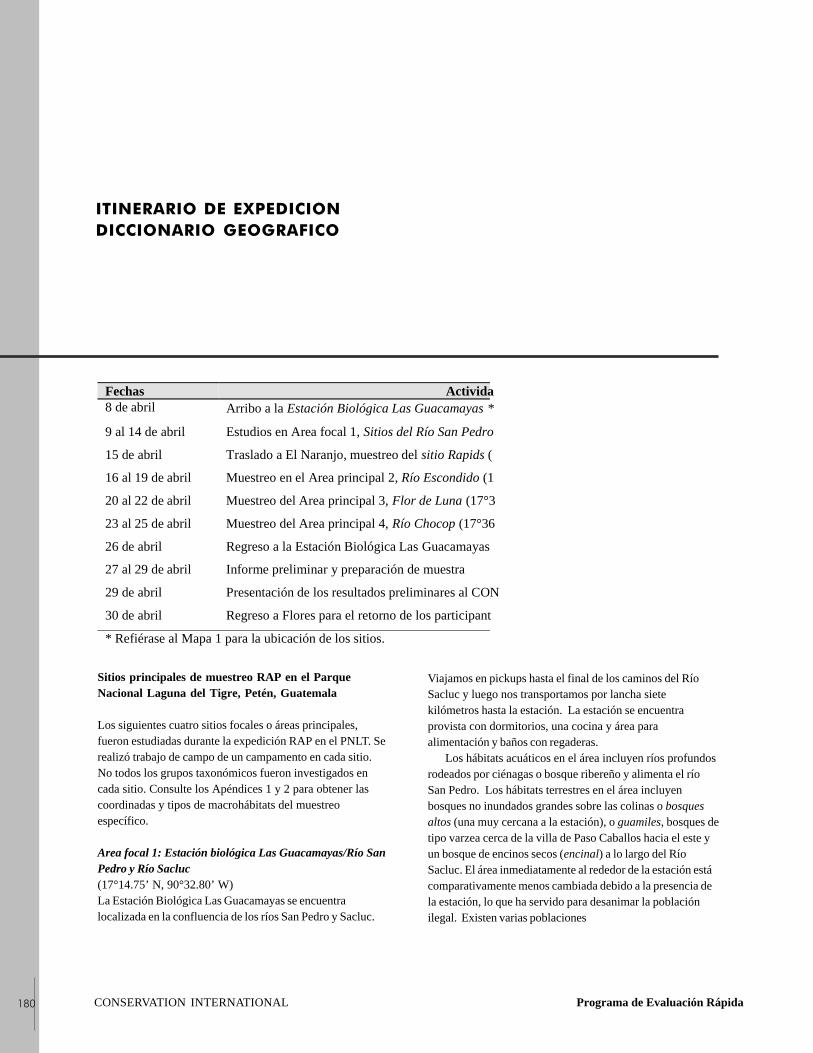
CONSERVATION INTERNATIONAL Programa de Evaluación Rápida180
Fechas Activida8 de abril Arribo a la Estación Biológica Las Guacamayas *
9 al 14 de abril Estudios en Area focal 1, Sitios del Río San Pedro
15 de abril Traslado a El Naranjo, muestreo del sitio Rapids (
16 al 19 de abril Muestreo en el Area principal 2, Río Escondido (1
20 al 22 de abril Muestreo del Area principal 3, Flor de Luna (17°3
23 al 25 de abril Muestreo del Area principal 4, Río Chocop (17°36
26 de abril Regreso a la Estación Biológica Las Guacamayas
27 al 29 de abril Informe preliminar y preparación de muestra
29 de abril Presentación de los resultados preliminares al CON
30 de abril Regreso a Flores para el retorno de los participant
* Refiérase al Mapa 1 para la ubicación de los sitios.
Sitios principales de muestreo RAP en el ParqueNacional Laguna del Tigre, Petén, Guatemala
Los siguientes cuatro sitios focales o áreas principales,fueron estudiadas durante la expedición RAP en el PNLT. Serealizó trabajo de campo de un campamento en cada sitio.No todos los grupos taxonómicos fueron investigados encada sitio. Consulte los Apéndices 1 y 2 para obtener lascoordinadas y tipos de macrohábitats del muestreoespecífico.
Area focal 1: Estación biológica Las Guacamayas/Río SanPedro y Río Sacluc(17°14.75’ N, 90°32.80’ W)La Estación Biológica Las Guacamayas se encuentralocalizada en la confluencia de los ríos San Pedro y Sacluc.
Viajamos en pickups hasta el final de los caminos del RíoSacluc y luego nos transportamos por lancha sietekilómetros hasta la estación. La estación se encuentraprovista con dormitorios, una cocina y área paraalimentación y baños con regaderas. Los hábitats acuáticos en el área incluyen ríos profundosrodeados por ciénagas o bosque ribereño y alimenta el ríoSan Pedro. Los hábitats terrestres en el área incluyenbosques no inundados grandes sobre las colinas o bosquesaltos (una muy cercana a la estación), o guamiles, bosques detipo varzea cerca de la villa de Paso Caballos hacia el este yun bosque de encinos secos (encinal) a lo largo del RíoSacluc. El área inmediatamente al rededor de la estación estácomparativamente menos cambiada debido a la presencia dela estación, lo que ha servido para desanimar la poblaciónilegal. Existen varias poblaciones
ITINERARIO DE EXPEDICIONDICCIONARIO GEOGRAFICO
BOLETIN RAP DE EVALUACION BIOLOGICA DIECISEIS Julio 2000 181
dentro de las fronteras del parque a lo largo del San Pedrohacia el oeste. No observamos población alguna en el Saclucentre el lugar en donde estacionamos la lancha y la estación.
Los RápidosAunque no es parte de nuestro plan de muestreo original,pasamos una serie de rápidos en nuestro camino hacia ElNaranjo. En parte de los rápidos encontramos que el fondoconsistía de un arrecife hecho de conchas (moluscos)mezcladas con individuos vivos. Esta área fue algo único yconstituye un descubrimiento importante.
Area focal 2: Río Escondido(170 18.78’ N; 900 52.15’ W)Acampamos a lo largo del lado oeste del Río Escondido justoal sur del Biotopo de la Laguna del Tigre. El nombre del río,“río escondido”, es adecuado; después del norte del río desdesu confluencia con el San Padro, parece ser un callejón sinsalida en una laguna rodeada por una gran ciénaga. De hecho,el río continua hacia el norte pero como un canal pocoprofundo, estrecho que pasa por los humedales.Eventualmente, el río se hace más profundo y se hace másancho por lo que es más fácil navegarlo. Aprovechamos unpoblado abandonado para refugiarnos y acampar. Loshábitats acuáticos son diversos, incluyendo los estrechosprofundos del río, los canales con pantanos, lagunas e isletas.Los hábitats terrestres que se encuentran aquí, incluyen elbosque alto quemado previamente, guamiles y prados queresultan de la práctica de quema y rosa y un bosque ribereñoalto al limite norte de nuestro muestreo en donde el río sehace más estrecho. Ocho familias viven a lo largo del RíoEscondido hacia el norte de nuestro campamento y algunaspoblaciones probablemente existen dentro de las fronterasdel biotopo.
Area focal 3: Laguna Flor de Luna(17°35.97’ N, 90°53.84’ W)Aquí acampamos al final del camino al lado de la Laguna Florde Luna. Este camino pasa un punto de revisión militar ylos campos petroleros de Xan. Los hábitats acuáticosincluyen solamente las lagunas. Las muestras de tejido depescado y el sedimento examinado en análisis tóxicos de loscampos de Xan. Los hábitats terrestres fueron muestreadosal rededor de Flor de Luna e incluyeron el bosque alto ybosque inundado (bosque bajo) el que se encuentra dominadopor el árbol de tinto (Haematoxylum campechianum) enáreas cercanas a la laguna (tintales). No observamospoblaciones cerca de Flor de Luna pero existen varios cercade las lagunas al sureste.
Area principal 4: Río Chocop(17°36.13’ N, 90°24.53’ W)Este campo se localizó en el puesto de monitoreo delCONAP en donde el río Chocop pasa por el camino. Otropunto de registro militar se encuentra en la ruta hacia laestación; esto es para evitar la colonización ilegal del área.Los hábitats acuáticos encontrados en el área incluyeron dosríos poco profundos y pequeños—el Río Chocop y el RíoCandelaria que se encuentra cerca—así como varias lagunas.Los hábitats terrestres muestreados incluyen el bosque bajo/tintales y bosques altos. Las áreas a lo largo del camino cercade Santa Amelia se encuentran ocupadas por varias familias,se han distribuido y se están regenerando o actualmenteutilizan las cosechas o pastos.
CONSERVATION INTERNATIONAL Programa de Evaluación Rápida182
Aguada: Hundimientos pequeños de piedra caliza queforman estanques que algunas veces contiene agua durantelas épocas secas.
Akalché: Hundimientos más grandes de piedras calizas queforman lagunas y a menudo contienen agua durante todo elaño.
Arroyo: Río pequeño de caudal bajo.
Bosque alto: Bosques de terrenos elevados con árbolesaltos, dosel denso y abundante basura de hojas.
Bosque bajo: Un bosque pequeño (15-20 m) saturado conun dosel relativo al bosque alto y crecimiento abundante ydenso de palmas y hiervas.
Caño: Un cuerpo de agua turbia por medio del cual lasciénagas se conectan a un río.
Comunidad: Un grupo de especies, usualmente delimitadospor afiliaciones taxonómicas que ocupan una localidad.
Complemento: Una medida del grado en el cual difiere lacomposición de especies (es decir, la identidad de especies)entre dos áreas. Un complemento alto indica que pocasespecies son compartidas y que la riqueza de especies de losdos sitios juntos es mucho más alto que cualquiera de los dos
GLOSARIO
Encinales: Bosques dominados por el encino.
Endémico: Nativo de y restringido a una región geográficaen particular.
Fragilidad: Una medida cualitativa del grado al cual lascomunidades o ecosistemas se pueden resistir o recuperardespués de un cambio.
Guamil: Término vernacular local para un área devegetación joven regenerada (normalmente de 1 a 20 años) endonde la vegetación del bosque ha cambiado.
Cárstico: Pertenece a un estrato de piedra caliza irregularque está protegida por el subsuelo y los hundimientos.
Laguna: Español para “lagoon.”
Mioceno: Una época geológica durante el período Terciario,de ca. 26 hasta 5 millones de años antes del presente.
Morfoespecies: Grupos de especies informales, utilizadoscuando los organismos no pueden ser asignados a unaespecie descrita formalmente.
Río: Español para “river.”
Varzea: Bosques inundados bajos.solo.

183 BOLETIN RAP DE EVALUACION BIOLOGICA DIECISEIS Julio 2000
APPENDIX 1 Aquatic sampling points of the RAP expedition to Laguna del Tigre National Park, Petén, Guatemala.APENDICE 1 Puntos acuáticos de muestreo de la expedición RAP en el Parque Nacional Laguna del Tigre, Petén, Guatemala.
APPENDIX 2 Terrestrial sampling points of the RAPexpedition to Laguna del Tigre National Park, Petén, Guatemala.APENDICE 2 Puntos terrestres de muestreo de la expedición RAP en el Parque Nacional Laguna del Tigre, Petén, Guatemala.
Brandon T. Bestelmeyer
APPENDIX 3 Phytoplankton species identified at aquatic each sampling point in Laguna del Tigre National Park, Petén, Guatemala.APENDICE 3 Especies de fitoplancton identificadas en cada punto acuático en el Parque Nacional Laguna del Tigre, Petén,
Guatemala.Karin Herrera
APPENDIX 4 Density (organisms/liter) of phytoplankton identified at each sample point, organized by class.APENDICE 4 Densidad (organismos/litro) del fitoplancton identificada en cada punto de muestreo organizado por clase.
Karin Herrera
APPENDIX 5 Aquatic insects associated with Salvinia auriculata, by sampling point, in Laguna del Tigre National Park,Petén, Guatemala.
APENDICE 5 Insectos acuáticos asociados con Salvinia auriculata, por punto de muestreo en el Parque Nacional Lagunadel Tigre, Petén, Guatemala.Ana Cristina Bailey and Jorge Ordóñez
APPENDIX 6 Plant taxa recorded in and around marshes and riparian forests in Laguna del Tigre National Park, Petén, Guatemala.APENDICE 6 Taxones de plantas registrado en y alrededor de los bosques anegados y ribereños en el Parque Nacional Laguna del
Tigre, Petén, Guatemala.Blanca León and Julio Morales Can
APPENDIX 7 Fish species believed to occur in the Río San Pedro and the upper Río Candelaria basins in Petén, Guatemala.APENDICE 7 Especies de peces que se creen, existen en el Río San Pedro y en la cuenca del Río Candelaria en Petén,
Guatemala.Philip W. Willink, Christian Barrientos, Herman A. Kihn, and Barry Chernoff
APPENDICES/APENDICES
CONSERVATION INTERNATIONAL Programa de Evaluación Rápida184
APPENDIX 8 List of fish species captured during the 1999 RAP expedition to Laguna del Tigre National Park, Petén,Guatemala, and the focal point at which they were collected.
APENDICE 8 Lista de especies de peces capturados durante la expedición RAP de 1999 en el Parque Nacional Laguna delTigre, Petén, Guatemala y el punto focal de muestreo en el cual fueron recolectados.Philip W. Willink, Christian Barrientos, Herman A. Kihn, and Barry Chernoff
APPENDIX 9 List of fish species captured during the 1999 RAP expedition to Laguna del Tigre National Park, Petén,Guatemala, and the macrohabitat in which they were collected.
APENDICE 9 Lista de especies de peces capturados durante la expedición RAP de 1999 en el Parque Nacional Laguna delTigre, Petén, Guatemala y el macrohábitat en donde se recolectaron.Philip W. Willink, Christian Barrientos, Herman A. Kihn, and Barry Chernoff
APPENDIX 10 Detailed methodology for DNA strand breakage and flow cytometry assays.APENDICE 10 Metodología detallada para ensayos de separación de filamentos de ADN y citometría de flujo.
Christopher W. Theodorakis and John W. Bickham
APPENDIX 11 Birds species found in Laguna del Tigre National Park, Petén, Guatemala, during the RAP survey.APENDICE 11 Especies de aves que se encontraron en el Parque Nacional Laguna del Tigre, Petén, Guatemala durante la
expedición de RAP de 1999.Edgar Selvin Pérez and Miriam Lorena Castillo Villeda
APPENDIX 12 Amphibian and reptile species of Laguna del Tigre National Park, Petén, Guatemala.APENDICE 12 Especies de anfibios y reptiles del Parque Nacional Laguna del Tigre, Petén, Guatemala.
Francisco Castañeda Moya, Oscar Lara, and Alejandro Queral-Regil
APPENDIX 13 Mammal species recorded within each focal area in Laguna del Tigre National Park, Petén, Guatemala.APENDICE 13 Especies de mamíferos registradas dentro de cada área focal en el Parque Nacional Laguna del Tigre, Petén,
Guatemala.Heliot Zarza and Sergio G. Pérez
APPENDIX 14 Ant (Hymenoptera: Formicidae) species recorded in Laguna de Tigre National Park, Petén, Guatemala,APENDICE 14 Especies de hormigas (Hymenoptera: Formicidae) registradas en el Parque Nacional Laguna del Tigre, Petén,
Guatemala.Brandon T. Bestelmeyer and Roy R. Snelling

�������������� ������������� Octubro 2000 ���
Aquatic sampling points of the RAP expedition to Laguna del APPENDIX 1Tigre National Park, Petén, Guatemala
Puntos acuáticos de muestreo de la expedición RAP en el Parque APENDICE 1Nacional Laguna del Tigre, Petén, Guatemala
SITE CODES/CODIGO DE LUGARES
SP: Río San PedroE: Río EscondidoF: Laguna Flor de LunaC/CA: Río Chocop
** Macrohabitat Type
R: Rivers; bodies of running waterRR: Rapids, freshwater reefRB: River embayments permanently connected to the riverRP: Permanent stretches of river, deep portions that are never dryRS: Shallow stretches of river that may be dry periodically
RS-m: RS-type river with a muddy bottom substrateRS-r: RS-type river with a rocky botton substrate
T: Tributary rivers or streams that feed into the river channelsC: Locally known as caños; narrow lotic environments with turbid, almost stagnant, watersO: Oxbow lagoons formed by river bends that exist as pockets nearly detached from a river channelL: Lagoons, not associated with rivers
** Tipo de Microhábitat
R: Ríos, cuerpos de agua corriente RR: Cascadas, saltos de agua fresca RB: desembocaduras a ríos permanentemente conectadas RP: tramos permanentes de río, porciones profundas que nunca se secan RS: tramos de ríos llanos que pueden secarse pemanentemente RS-m: tipo de río con subtrata de fondo fangoso RS-r: tipo de río con subtrata rocosaT: Ríos tributarios o riachuelos que alimentan hacia los canales de los ríosC: Localmente conocidos como caños; ambientes lóticos con aguas turbias estancadasO: Lagunas Oxbow formadas por curvaturas que salen como projecciones, casi independiente, de los canales del ríoL: Lagunas no asociadas con ríos

CONSERVATION INTERNATIONAL Programa de Evaluación Rápida���
See Gazetteer for site descriptions.
Coordinates are presented as degrees and minutes. An asterisk indicates an aquatic point located at the focal point thatdefines the center of each focal area. See text in Chapter 1 for a detailed explanation. Note that some of the placenames provided here are informal names used in this expedition only, whereas others are formal place names or localnames used by local inhabitants.
Ver descripciones de los lugares en el Diccionario Geográfico
Las coordenadas están en grados y minutos. Un asterisco indica un punto acuático localizado en el punto focal quedefine el centro de cada área focal. Referirse al texto en el Capítulo 1 para una explicación más detallada. Notar quealgunos de los nombres provistos son nombres informales usados solamente en esta expedición, mientras que otrosson nombres locales y formales usados por los habitantes locales.
Sample PointsPuntos de Muestreo
LatitudeLatitud
LongitudeLongitud
Macrohabitat Type**Tipo de Macrohabitat
Arroyo Yalá 17°15.34’ N 90°14.04’ W RP Paso Caballos 17°15.53’ N 90°14.32’ W T Arroyo La Pista 17°15.56’ N 90°14.51’ W T El Sibalito 17°15.62’ N 90°15.44’ W RP Murciélago 17°14.76’ N 90°17.71’ W RP Caracol 17°14.59’ N 90°18.44’ W T San Juan 17°13.72’ N 90°20.04’ W T La Caleta 17°13.83’ N 90°19.83’ W C Pato 1* 17°14.22’ N 90°19.26’ W RP Pato 2 17°14.30’ N 90°19.16’ W RB Río Sacluc 17°13.88’ N 90°17.87’ W RP Rápidos 17°16.99’ N 90°42.80’ W RR Est. Guacamayas 17°14.75’ N 90°32.80’ W RP Bahía Brandon* 17°19.91’ N 90°51.17’ W RB Bahía Jorge 17°20.23’ N 90°50.89’ W RB Tasistal 17°20.76’ N 90°50.55’ W RP Laguna Cocodrilo 17°24.01’ N 90°48.65’ W O Laguna Jabirú 17°24.25’ N 90°48.42’ W O Caleta Escondida 17°25.48’ N 90°47.33’ W O Punto Icaco 17°26.35’ N 90°47.08’ W RP Canal Manfredo 17°17.74’ N 90°52.85’ W O Nuevo Amanecer 17°26.12’ N 90°47.38’ W RS Pueblo R. Escondido 17°25.94’ N 90°38.65’ W RP Laguna Buena Vista 17°30.78’ N 90°45.09’ W L Laguna Santa Amelia 17°26.74’ N 90°39.98’ W L Garza1 17o 33.12' N 90o 47.69' W L Roman1 17o 33.87' N 90o 51.19' W L Laguna Flor de Luna* 17°35.97’ N 90°53.84’ W L Pozo Xan 3 17°32.45’ N 90°47.57’ W L Vista Hermosa 17o 30.81' N 90o 45.11' W LEstanque sin nombre 17o 32.87' N 90o 47.35' W LRío Chocop* 17°36.13’ N 90°24.53’ W RSLaguna Guayacán 17°36.64’ N 90°25.65’ W LLaguna La Pista 17°39.17’ N 90°32.87’ W LTintal 17o 33.92' N 90o 20.30' W LEstablo 17o 36.71' N 90o 26.13' W LLaguna La Lámpara NA LLaguna Poza Azul NA LCandelaria I 17°40.33’ N 90°31.86’ W RS-mCandelaria II 17°40.31’ N 90°31.99’ W RS-r
APENDICE 1 Puntos acuáticos de muestreo: RAP, PNLT, Guatemala
NA Información no disponible
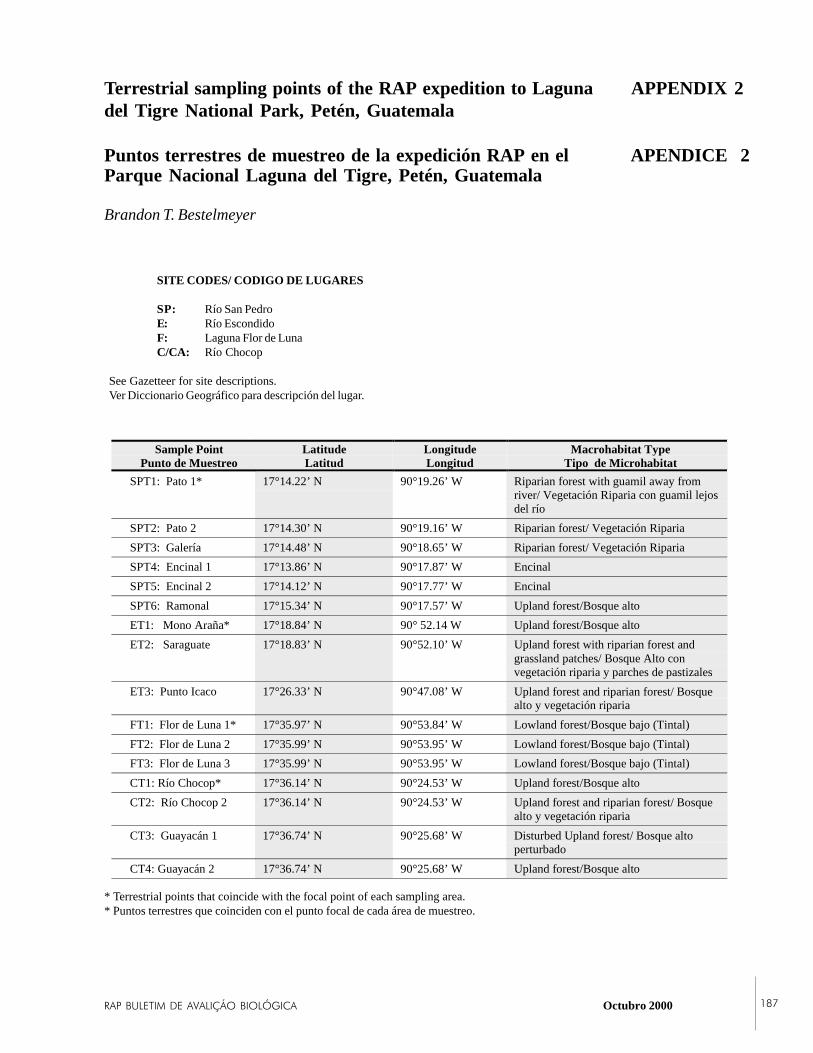
�������������� ������������� Octubro 2000 ���
Sample PointPunto de Muestreo
LatitudeLatitud
LongitudeLongitud
Macrohabitat TypeTipo de Microhabitat
SPT1: Pato 1* 17°14.22’ N 90°19.26’ W Riparian forest with guamil away fromriver/ Vegetación Riparia con guamil lejosdel río
SPT2: Pato 2 17°14.30’ N 90°19.16’ W Riparian forest/ Vegetación Riparia
SPT3: Galería 17°14.48’ N 90°18.65’ W Riparian forest/ Vegetación Riparia
SPT4: Encinal 1 17°13.86’ N 90°17.87’ W Encinal
SPT5: Encinal 2 17°14.12’ N 90°17.77’ W Encinal
SPT6: Ramonal 17°15.34’ N 90°17.57’ W Upland forest/Bosque alto
ET1: Mono Araña* 17°18.84’ N 90° 52.14 W Upland forest/Bosque alto
ET2: Saraguate 17°18.83’ N 90°52.10’ W Upland forest with riparian forest andgrassland patches/ Bosque Alto convegetación riparia y parches de pastizales
ET3: Punto Icaco 17°26.33’ N 90°47.08’ W Upland forest and riparian forest/ Bosquealto y vegetación riparia
FT1: Flor de Luna 1* 17°35.97’ N 90°53.84’ W Lowland forest/Bosque bajo (Tintal)
FT2: Flor de Luna 2 17°35.99’ N 90°53.95’ W Lowland forest/Bosque bajo (Tintal)
FT3: Flor de Luna 3 17°35.99’ N 90°53.95’ W Lowland forest/Bosque bajo (Tintal)
CT1: Río Chocop* 17°36.14’ N 90°24.53’ W Upland forest/Bosque alto
CT2: Río Chocop 2 17°36.14’ N 90°24.53’ W Upland forest and riparian forest/ Bosquealto y vegetación riparia
CT3: Guayacán 1 17°36.74’ N 90°25.68’ W Disturbed Upland forest/ Bosque altoperturbado
CT4: Guayacán 2 17°36.74’ N 90°25.68’ W Upland forest/Bosque alto
Terrestrial sampling points of the RAP expedition to Laguna APPENDIX 2del Tigre National Park, Petén, Guatemala
Puntos terrestres de muestreo de la expedición RAP en el APENDICE 2Parque Nacional Laguna del Tigre, Petén, Guatemala
Brandon T. Bestelmeyer
SITE CODES/ CODIGO DE LUGARES
SP: Río San PedroE: Río EscondidoF: Laguna Flor de LunaC/CA: Río Chocop
See Gazetteer for site descriptions.Ver Diccionario Geográfico para descripción del lugar.
* Terrestrial points that coincide with the focal point of each sampling area.* Puntos terrestres que coinciden con el punto focal de cada área de muestreo.
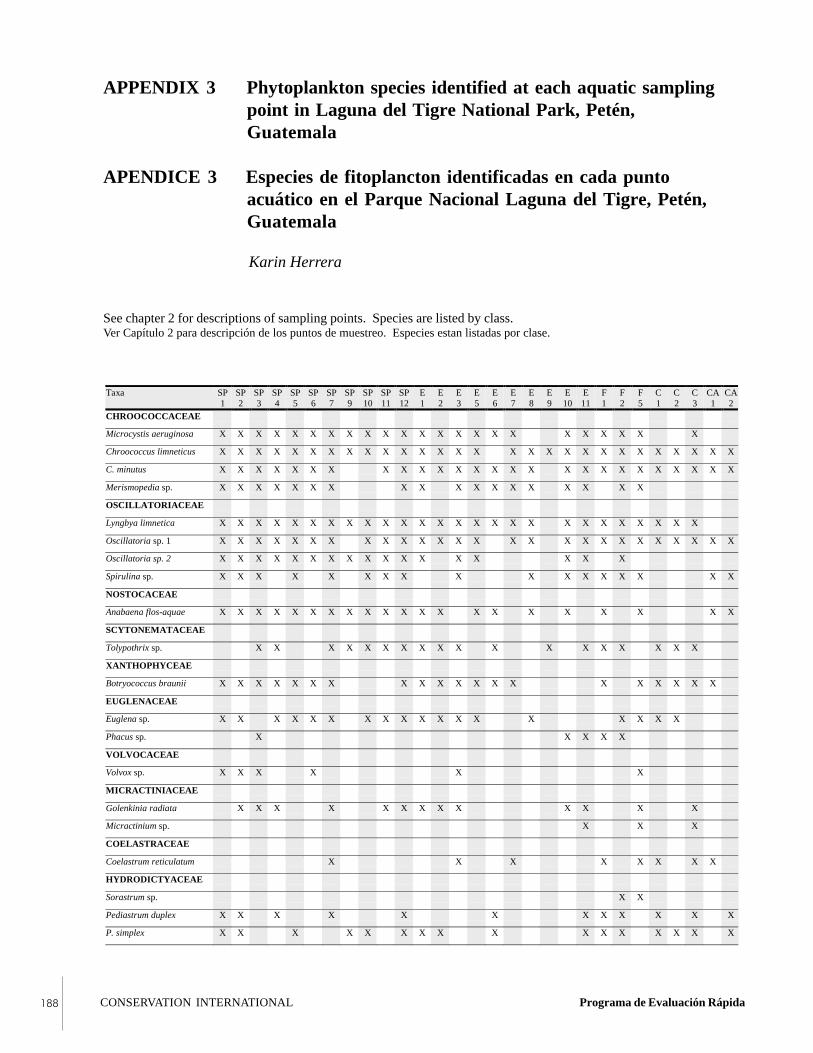
CONSERVATION INTERNATIONAL Programa de Evaluación Rápida���
APPENDIX 3 Phytoplankton species identified at each aquatic samplingpoint in Laguna del Tigre National Park, Petén,Guatemala
APENDICE 3 Especies de fitoplancton identificadas en cada puntoacuático en el Parque Nacional Laguna del Tigre, Petén,Guatemala
Karin Herrera
See chapter 2 for descriptions of sampling points. Species are listed by class.Ver Capítulo 2 para descripción de los puntos de muestreo. Especies estan listadas por clase.
Taxa SP1
SP2
SP3
SP4
SP5
SP6
SP7
SP9
SP10
SP11
SP12
E1
E2
E3
E5
E6
E7
E8
E9
E10
E11
F1
F2
F5
C1
C2
C3
CA1
CA2
CHROOCOCCACEAE
Microcystis aeruginosa X X X X X X X X X X X X X X X X X X X X X X X
Chroococcus limneticus X X X X X X X X X X X X X X X X X X X X X X X X X X X X
C. minutus X X X X X X X X X X X X X X X X X X X X X X X X X X
Merismopedia sp. X X X X X X X X X X X X X X X X X X
OSCILLATORIACEAE
Lyngbya limnetica X X X X X X X X X X X X X X X X X X X X X X X X X X
Oscillatoria sp. 1 X X X X X X X X X X X X X X X X X X X X X X X X X X
Oscillatoria sp. 2 X X X X X X X X X X X X X X X X X
Spirulina sp. X X X X X X X X X X X X X X X X X
NOSTOCACEAE
Anabaena flos-aquae X X X X X X X X X X X X X X X X X X X X X
SCYTONEMATACEAE
Tolypothrix sp. X X X X X X X X X X X X X X X X X X
XANTHOPHYCEAE
Botryococcus braunii X X X X X X X X X X X X X X X X X X X X
EUGLENACEAE
Euglena sp. X X X X X X X X X X X X X X X X X X
Phacus sp. X X X X X
VOLVOCACEAE
Volvox sp. X X X X X X
MICRACTINIACEAE
Golenkinia radiata X X X X X X X X X X X X X
Micractinium sp. X X X
COELASTRACEAE
Coelastrum reticulatum X X X X X X X X
HYDRODICTYACEAE
Sorastrum sp. X X
Pediastrum duplex X X X X X X X X X X X X
P. simplex X X X X X X X X X X X X X X X X
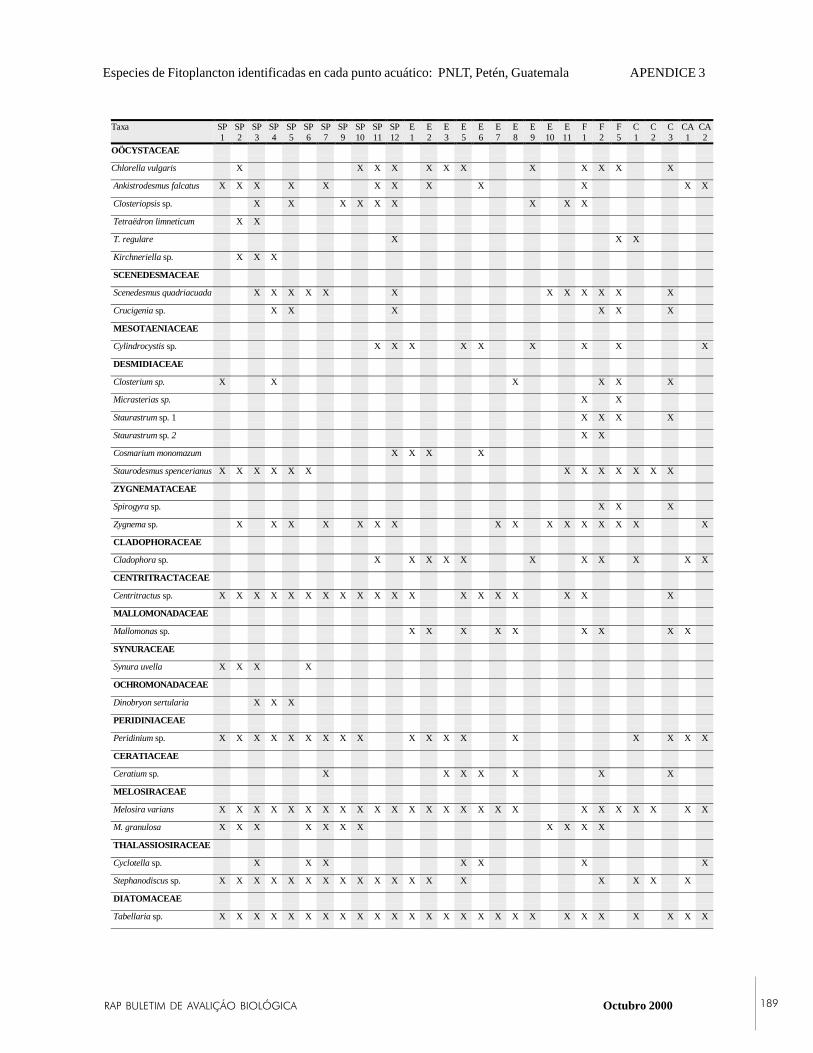
�������������� ������������� Octubro 2000 ���
Taxa SP1
SP2
SP3
SP4
SP5
SP6
SP7
SP9
SP10
SP11
SP12
E1
E2
E3
E5
E6
E7
E8
E9
E10
E11
F1
F2
F5
C1
C2
C3
CA1
CA2
OÖCYSTACEAE
Chlorella vulgaris X X X X X X X X X X X X
Ankistrodesmus falcatus X X X X X X X X X X X X
Closteriopsis sp. X X X X X X X X X
Tetraëdron limneticum X X
T. regulare X X X
Kirchneriella sp. X X X
SCENEDESMACEAE
Scenedesmus quadriacuada X X X X X X X X X X X X
Crucigenia sp. X X X X X X
MESOTAENIACEAE
Cylindrocystis sp. X X X X X X X X X
DESMIDIACEAE
Closterium sp. X X X X X X
Micrasterias sp. X X
Staurastrum sp. 1 X X X X
Staurastrum sp. 2 X X
Cosmarium monomazum X X X X
Staurodesmus spencerianus X X X X X X X X X X X X X
ZYGNEMATACEAE
Spirogyra sp. X X X
Zygnema sp. X X X X X X X X X X X X X X X X
CLADOPHORACEAE
Cladophora sp. X X X X X X X X X X X
CENTRITRACTACEAE
Centritractus sp. X X X X X X X X X X X X X X X X X X X
MALLOMONADACEAE
Mallomonas sp. X X X X X X X X X
SYNURACEAE
Synura uvella X X X X
OCHROMONADACEAE
Dinobryon sertularia X X X
PERIDINIACEAE
Peridinium sp. X X X X X X X X X X X X X X X X X X
CERATIACEAE
Ceratium sp. X X X X X X X
MELOSIRACEAE
Melosira varians X X X X X X X X X X X X X X X X X X X X X X X X X
M. granulosa X X X X X X X X X X X
THALASSIOSIRACEAE
Cyclotella sp. X X X X X X X
Stephanodiscus sp. X X X X X X X X X X X X X X X X X X
DIATOMACEAE
Tabellaria sp. X X X X X X X X X X X X X X X X X X X X X X X X X X
Especies de Fitoplancton identificadas en cada punto acuático: PNLT, Petén, Guatemala APENDICE 3

CONSERVATION INTERNATIONAL Programa de Evaluación Rápida���
Taxa SP1
SP2
SP3
SP4
SP5
SP6
SP7
SP9
SP10
SP11
SP12
E1
E2
E3
E5
E6
E7
E8
E9
E10
E11
F1
F2
F5
C1
C2
C3
CA1
CA2
Meridion circulare X X X X X X X X X X X X
Diatoma vulgare X X X X X X X X X X X X X X X
Fragilaria capucina X X X X X X X X X X X X X X X X X X X X X X X X X X X X X
Synedra ulna X X X X X X X X X X X X X X X X X X X
S. acus X X X X X X X X X X X X X X X X X X X X X X X
ACHNANTHACEAE
Cocconeis sp. X X X X X X X X X X X X X X X
Navicula sp. 1 X X X X X X X X X X X X X X X X X X X X X X X X X
Navicula sp. 2 X X X X X X X X X X X X X X X X X X X X X X
Navicula sp. 3 X X X X X X X X X X X X X X X X X X X X
Pinnularia sp. X X X X X X X X X X X X X X X X X X X X X X X
Stauroneis sp. X X X X X X X X X X X X X X X X
Amphiprora sp. X X X X X X X X
Gyrosigma sp. X X X X X X X X X X X X X X X X X
Achnanthes sp. X X X X X X X X X X X X X X X X
GOMPHONEMACEAE
Gomphoneis sp. X X X X X X X X X X X X X X X X X X X X X
Cymbelaceae
Cymbella sp. X X X X X X X X X X X X X X X X X X X X X X X X X
EPITHEMIACEAE
Denticula sp. X X X X X X X X X X X X X X X X X X X X X X
Epithemia sp. X X X X X X X
NITSCHIACEAE
Nitzschia acircularis X X X X X X X X X X X X
SURIRELLACEAE
Surirella sp. 1 X X X X X
Surirella sp. 2 X X X X X X X X X X X
TOTAL 37 42 41 39 37 35 41 25 34 37 44 38 34 29 38 30 26 23 18 19 36 42 42 30 28 19 36 27 29
** In SP9 and E9 there were very few phytoplankton, so densities were not quantified.
** En SP9 y E9 había poca cantidad de fitoplancton por lo que no se cuantificaron las densidades.
APPENDIX 3 Phytoplankton species identified at each aquatic sampling point in LTNP, Petén, Guatemala
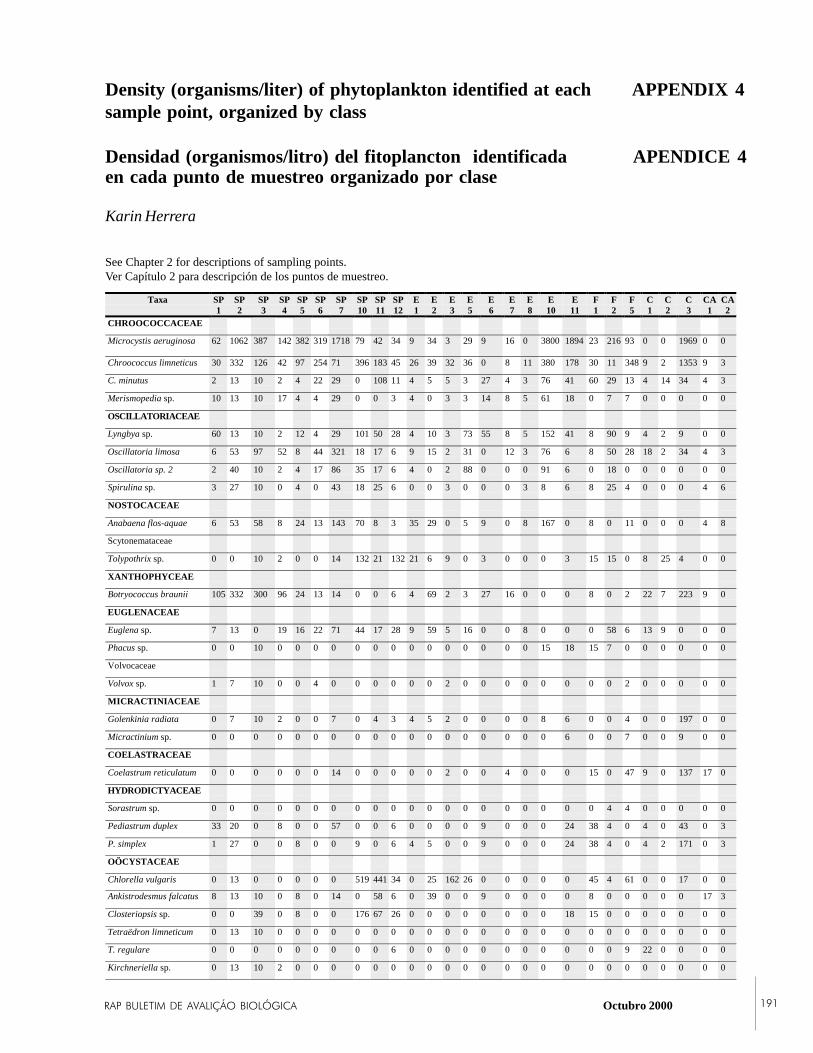
�������������� ������������� Octubro 2000 ���
Density (organisms/liter) of phytoplankton identified at each APPENDIX 4sample point, organized by class
Densidad (organismos/litro) del fitoplancton identificada APENDICE 4en cada punto de muestreo organizado por clase
Karin Herrera
See Chapter 2 for descriptions of sampling points.Ver Capítulo 2 para descripción de los puntos de muestreo.
Taxa SP1
SP2
SP3
SP4
SP5
SP6
SP7
SP10
SP11
SP12
E1
E2
E3
E5
E6
E7
E8
E10
E11
F1
F2
F5
C1
C2
C3
CA1
CA2
CHROOCOCCACEAE
Microcystis aeruginosa 62 1062 387 142 382 319 1718 79 42 34 9 34 3 29 9 16 0 3800 1894 23 216 93 0 0 1969 0 0
Chroococcus limneticus 30 332 126 42 97 254 71 396 183 45 26 39 32 36 0 8 11 380 178 30 11 348 9 2 1353 9 3
C. minutus 2 13 10 2 4 22 29 0 108 11 4 5 5 3 27 4 3 76 41 60 29 13 4 14 34 4 3
Merismopedia sp. 10 13 10 17 4 4 29 0 0 3 4 0 3 3 14 8 5 61 18 0 7 7 0 0 0 0 0
OSCILLATORIACEAE
Lyngbya sp. 60 13 10 2 12 4 29 101 50 28 4 10 3 73 55 8 5 152 41 8 90 9 4 2 9 0 0
Oscillatoria limosa 6 53 97 52 8 44 321 18 17 6 9 15 2 31 0 12 3 76 6 8 50 28 18 2 34 4 3
Oscillatoria sp. 2 2 40 10 2 4 17 86 35 17 6 4 0 2 88 0 0 0 91 6 0 18 0 0 0 0 0 0
Spirulina sp. 3 27 10 0 4 0 43 18 25 6 0 0 3 0 0 0 3 8 6 8 25 4 0 0 0 4 6
NOSTOCACEAE
Anabaena flos-aquae 6 53 58 8 24 13 143 70 8 3 35 29 0 5 9 0 8 167 0 8 0 11 0 0 0 4 8
Scytonemataceae
Tolypothrix sp. 0 0 10 2 0 0 14 132 21 132 21 6 9 0 3 0 0 0 3 15 15 0 8 25 4 0 0
XANTHOPHYCEAE
Botryococcus braunii 105 332 300 96 24 13 14 0 0 6 4 69 2 3 27 16 0 0 0 8 0 2 22 7 223 9 0
EUGLENACEAE
Euglena sp. 7 13 0 19 16 22 71 44 17 28 9 59 5 16 0 0 8 0 0 0 58 6 13 9 0 0 0
Phacus sp. 0 0 10 0 0 0 0 0 0 0 0 0 0 0 0 0 0 15 18 15 7 0 0 0 0 0 0
Volvocaceae
Volvox sp. 1 7 10 0 0 4 0 0 0 0 0 0 2 0 0 0 0 0 0 0 0 2 0 0 0 0 0
MICRACTINIACEAE
Golenkinia radiata 0 7 10 2 0 0 7 0 4 3 4 5 2 0 0 0 0 8 6 0 0 4 0 0 197 0 0
Micractinium sp. 0 0 0 0 0 0 0 0 0 0 0 0 0 0 0 0 0 0 6 0 0 7 0 0 9 0 0
COELASTRACEAE
Coelastrum reticulatum 0 0 0 0 0 0 14 0 0 0 0 0 2 0 0 4 0 0 0 15 0 47 9 0 137 17 0
HYDRODICTYACEAE
Sorastrum sp. 0 0 0 0 0 0 0 0 0 0 0 0 0 0 0 0 0 0 0 0 4 4 0 0 0 0 0
Pediastrum duplex 33 20 0 8 0 0 57 0 0 6 0 0 0 0 9 0 0 0 24 38 4 0 4 0 43 0 3
P. simplex 1 27 0 0 8 0 0 9 0 6 4 5 0 0 9 0 0 0 24 38 4 0 4 2 171 0 3
OÖCYSTACEAE
Chlorella vulgaris 0 13 0 0 0 0 0 519 441 34 0 25 162 26 0 0 0 0 0 45 4 61 0 0 17 0 0
Ankistrodesmus falcatus 8 13 10 0 8 0 14 0 58 6 0 39 0 0 9 0 0 0 0 8 0 0 0 0 0 17 3
Closteriopsis sp. 0 0 39 0 8 0 0 176 67 26 0 0 0 0 0 0 0 0 18 15 0 0 0 0 0 0 0
Tetraëdron limneticum 0 13 10 0 0 0 0 0 0 0 0 0 0 0 0 0 0 0 0 0 0 0 0 0 0 0 0
T. regulare 0 0 0 0 0 0 0 0 0 6 0 0 0 0 0 0 0 0 0 0 0 9 22 0 0 0 0
Kirchneriella sp. 0 13 10 2 0 0 0 0 0 0 0 0 0 0 0 0 0 0 0 0 0 0 0 0 0 0 0
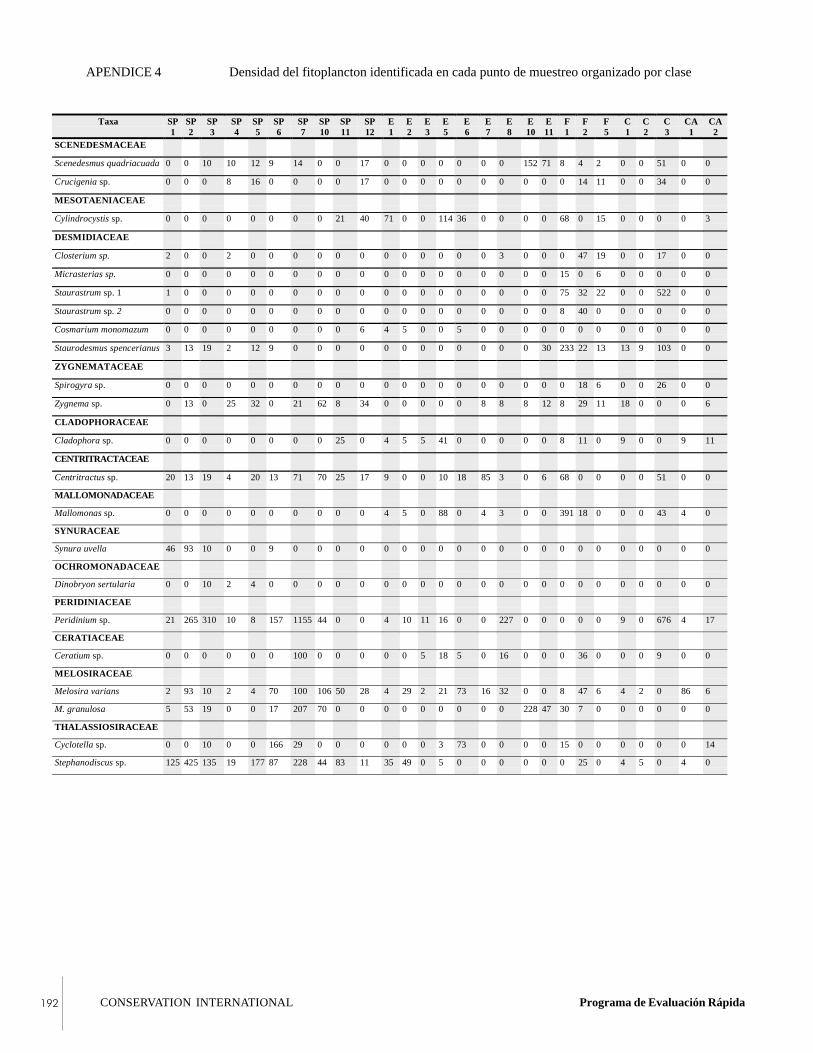
CONSERVATION INTERNATIONAL Programa de Evaluación Rápida���
Taxa SP1
SP2
SP3
SP4
SP5
SP6
SP7
SP10
SP11
SP12
E1
E2
E3
E5
E6
E7
E8
E10
E11
F1
F2
F5
C1
C2
C3
CA1
CA2
SCENEDESMACEAE
Scenedesmus quadriacuada 0 0 10 10 12 9 14 0 0 17 0 0 0 0 0 0 0 152 71 8 4 2 0 0 51 0 0
Crucigenia sp. 0 0 0 8 16 0 0 0 0 17 0 0 0 0 0 0 0 0 0 0 14 11 0 0 34 0 0
MESOTAENIACEAE
Cylindrocystis sp. 0 0 0 0 0 0 0 0 21 40 71 0 0 114 36 0 0 0 0 68 0 15 0 0 0 0 3
DESMIDIACEAE
Closterium sp. 2 0 0 2 0 0 0 0 0 0 0 0 0 0 0 0 3 0 0 0 47 19 0 0 17 0 0
Micrasterias sp. 0 0 0 0 0 0 0 0 0 0 0 0 0 0 0 0 0 0 0 15 0 6 0 0 0 0 0
Staurastrum sp. 1 1 0 0 0 0 0 0 0 0 0 0 0 0 0 0 0 0 0 0 75 32 22 0 0 522 0 0
Staurastrum sp. 2 0 0 0 0 0 0 0 0 0 0 0 0 0 0 0 0 0 0 0 8 40 0 0 0 0 0 0
Cosmarium monomazum 0 0 0 0 0 0 0 0 0 6 4 5 0 0 5 0 0 0 0 0 0 0 0 0 0 0 0
Staurodesmus spencerianus 3 13 19 2 12 9 0 0 0 0 0 0 0 0 0 0 0 0 30 233 22 13 13 9 103 0 0
ZYGNEMATACEAE
Spirogyra sp. 0 0 0 0 0 0 0 0 0 0 0 0 0 0 0 0 0 0 0 0 18 6 0 0 26 0 0
Zygnema sp. 0 13 0 25 32 0 21 62 8 34 0 0 0 0 0 8 8 8 12 8 29 11 18 0 0 0 6
CLADOPHORACEAE
Cladophora sp. 0 0 0 0 0 0 0 0 25 0 4 5 5 41 0 0 0 0 0 8 11 0 9 0 0 9 11
CENTRITRACTACEAE
Centritractus sp. 20 13 19 4 20 13 71 70 25 17 9 0 0 10 18 85 3 0 6 68 0 0 0 0 51 0 0
MALLOMONADACEAE
Mallomonas sp. 0 0 0 0 0 0 0 0 0 0 4 5 0 88 0 4 3 0 0 391 18 0 0 0 43 4 0
SYNURACEAE
Synura uvella 46 93 10 0 0 9 0 0 0 0 0 0 0 0 0 0 0 0 0 0 0 0 0 0 0 0 0
OCHROMONADACEAE
Dinobryon sertularia 0 0 10 2 4 0 0 0 0 0 0 0 0 0 0 0 0 0 0 0 0 0 0 0 0 0 0
PERIDINIACEAE
Peridinium sp. 21 265 310 10 8 157 1155 44 0 0 4 10 11 16 0 0 227 0 0 0 0 0 9 0 676 4 17
CERATIACEAE
Ceratium sp. 0 0 0 0 0 0 100 0 0 0 0 0 5 18 5 0 16 0 0 0 36 0 0 0 9 0 0
MELOSIRACEAE
Melosira varians 2 93 10 2 4 70 100 106 50 28 4 29 2 21 73 16 32 0 0 8 47 6 4 2 0 86 6
M. granulosa 5 53 19 0 0 17 207 70 0 0 0 0 0 0 0 0 0 228 47 30 7 0 0 0 0 0 0
THALASSIOSIRACEAE
Cyclotella sp. 0 0 10 0 0 166 29 0 0 0 0 0 0 3 73 0 0 0 0 15 0 0 0 0 0 0 14
Stephanodiscus sp. 125 425 135 19 177 87 228 44 83 11 35 49 0 5 0 0 0 0 0 0 25 0 4 5 0 4 0
APENDICE 4 Densidad del fitoplancton identificada en cada punto de muestreo organizado por clase

�������������� ������������� Octubro 2000 ���
Taxa SP1
SP2
SP3
SP4
SP5
SP6
SP7
SP10
SP11
SP12
E1
E2
E3
E5
E6
E7
E8
E10
E11
F1
F2
F5
C1
C2
C3
CA1
CA2
DIATOMACEAE
Tabellaria sp. 114 159 77 21 36 52 285 374 141 113 410 368 66 332 555 282 37 0 118 75 108 0 9 0 51 17 6
Meridion circulare 1 7 29 0 4 0 100 9 0 0 0 0 0 21 0 0 0 0 24 0 0 0 31 0 17 0 51
Diatoma vulgare 0 0 0 0 0 0 0 0 0 6 9 5 12 5 18 0 8 0 18 23 29 7 0 11 17 0 14
Fragilaria capucina 10 53 39 8 8 96 86 35 33 40 57 83 116 73 727 137 98 106 24 53 54 6 18 9 103 34 101
Synedra ulna 31 398 126 153 80 385 214 132 42 113 44 147 15 13 82 32 0 0 0 30 87 0 0 0 240 0 0
S. acus 62 465 193 209 121 1141 2138 616 632 340 379 196 291 36 82 121 0 76 24 30 87 0 0 0 86 0 0
ACHNANTHACEAE
Cocconeis sp. 4 7 19 8 12 4 14 4 8 9 26 0 0 31 0 0 0 0 0 15 0 0 0 0 0 21 8
Navicula sp. 1 21 27 48 0 0 13 114 264 116 159 132 69 97 104 327 20 11 76 178 8 58 9 0 11 17 21 70
Navicula sp. 2 27 13 19 8 40 0 0 167 166 45 9 0 0 47 118 121 26 38 41 53 32 0 9 25 26 0 3
Navicula sp. 3 0 13 0 8 0 35 185 123 100 0 35 15 8 73 91 0 8 0 30 8 206 0 9 0 0 56 22
Pinnularia sp. 2 7 39 6 0 0 71 0 4 6 154 74 40 78 391 16 8 0 47 38 206 4 22 25 43 17 11
Stauroneis sp. 2 13 10 2 0 0 14 9 58 6 18 39 0 0 9 0 0 0 6 0 0 0 0 0 0 17 3
Amphiprora sp. 6 13 0 0 8 4 86 0 0 0 0 0 5 145 236 0 0 0 0 0 0 0 0 0 0 0 0
Gyrosigma sp. 9 13 10 2 4 4 14 0 8 0 18 5 0 3 9 16 0 0 142 0 0 0 31 5 0 17 0
Achnanthes sp. 0 46 0 0 12 0 29 70 8 34 9 34 0 5 45 32 0 0 6 0 0 2 0 0 0 9 17
GOMPHONEMACEAE
Gomphoneis sp. 16 53 0 4 24 4 57 26 17 23 463 132 22 0 95 0 8 0 30 0 263 4 9 9 26 0 17
CYMBELACEAE
Cymbella sp. 19 27 0 19 16 13 86 44 890 289 260 132 0 316 0 48 8 0 6 15 72 11 623 11 17 17 17
EPITHEMIACEAE
Denticula sp. 0 0 10 10 0 4 0 18 33 62 4 20 0 52 45 16 0 0 47 38 206 4 22 25 43 17 11
Epithemia sp. 0 0 0 0 0 0 0 18 33 28 9 0 0 0 0 0 0 0 0 0 0 0 0 0 0 9 6
NITSCHIACEAE
Nitzschia acircularis 0 0 0 4 4 4 0 0 4 6 0 20 0 0 0 0 0 0 6 0 0 0 9 0 17 4 3
SURIRELLACEAE
Surirella sp. 1 0 0 0 0 8 4 0 0 0 6 0 0 0 5 0 36 0 0 0 0 0 0 0 0 0 0 0
Surirella sp. 2 0 0 29 2 0 4 43 9 0 0 13 0 2 0 0 0 0 15 12 0 0 0 0 0 0 9 0
Density (organisms/liter) of phytoplankton identified at each sample point, organized by class APPENDIX 4
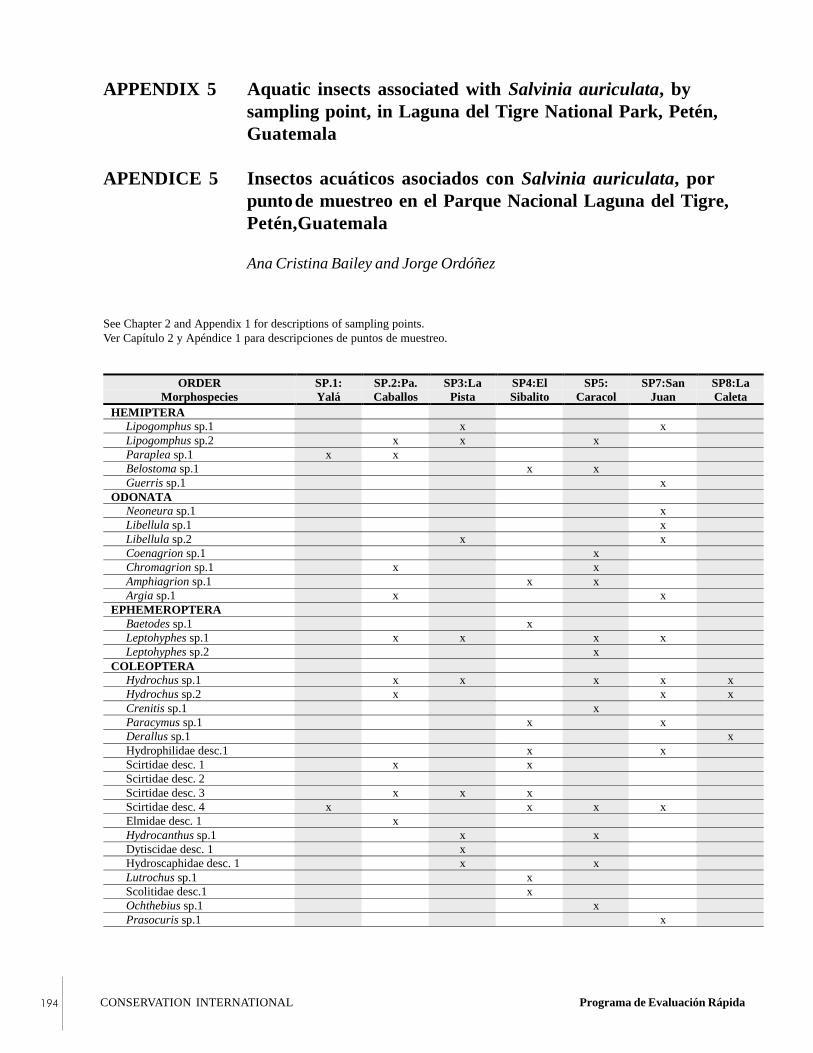
CONSERVATION INTERNATIONAL Programa de Evaluación Rápida���
ORDERMorphospecies
SP.1:Yalá
SP.2:Pa.Caballos
SP3:LaPista
SP4:ElSibalito
SP5:Caracol
SP7:SanJuan
SP8:LaCaleta
HEMIPTERA Lipogomphus sp.1 x x Lipogomphus sp.2 x x x Paraplea sp.1 x x Belostoma sp.1 x x Guerris sp.1 xODONATA Neoneura sp.1 x Libellula sp.1 x Libellula sp.2 x x Coenagrion sp.1 x Chromagrion sp.1 x x Amphiagrion sp.1 x x Argia sp.1 x xEPHEMEROPTERA Baetodes sp.1 x Leptohyphes sp.1 x x x x Leptohyphes sp.2 xCOLEOPTERA Hydrochus sp.1 x x x x x Hydrochus sp.2 x x x Crenitis sp.1 x Paracymus sp.1 x x Derallus sp.1 x Hydrophilidae desc.1 x x Scirtidae desc. 1 x x Scirtidae desc. 2 Scirtidae desc. 3 x x x Scirtidae desc. 4 x x x x Elmidae desc. 1 x Hydrocanthus sp.1 x x Dytiscidae desc. 1 x Hydroscaphidae desc. 1 x x Lutrochus sp.1 x Scolitidae desc.1 x Ochthebius sp.1 x Prasocuris sp.1 x
APPENDIX 5 Aquatic insects associated with Salvinia auriculata, bysampling point, in Laguna del Tigre National Park, Petén,Guatemala
APENDICE 5 Insectos acuáticos asociados con Salvinia auriculata, porpuntode muestreo en el Parque Nacional Laguna del Tigre,Petén,Guatemala
Ana Cristina Bailey and Jorge Ordóñez
See Chapter 2 and Appendix 1 for descriptions of sampling points.Ver Capítulo 2 y Apéndice 1 para descripciones de puntos de muestreo.

�������������� ������������� Octubro 2000 ���
ORDERMorphospecies
SP.1:Yalá
SP.2:Pa.Caballos
SP3:LaPista
SP4:ElSibalito
SP5:Caracol
SP7:SanJuan
SP8:LaCaleta
DIPTERA Prionocera sp.1 x Probezzia sp.1 x x Ceratopogonidae desc. 1 x x x x Chironomidae desc.1 x x x x Chironomidae desc. 2 x x x x x Chironomidae des. 3 x Chaoboridae desc. 1 x x Odontomyia sp.1 x Stratiomys sp.1 x x Stratiomys sp.2 x x
Insectos acuáticos asociados con Salvinia ariculata, por punto de muestreo: PNLT, Petén, Guatemala APENDICE 5
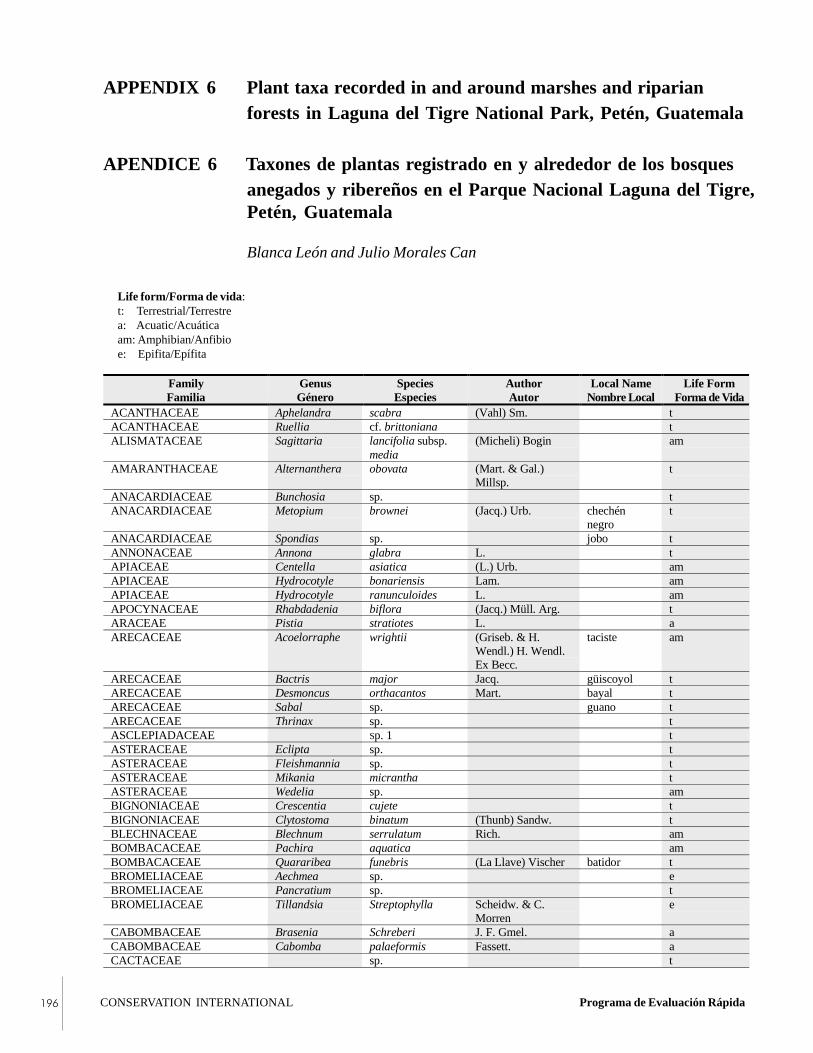
CONSERVATION INTERNATIONAL Programa de Evaluación Rápida���
FamilyFamilia
GenusGénero
SpeciesEspecies
AuthorAutor
Local NameNombre Local
Life FormForma de Vida
ACANTHACEAE Aphelandra scabra (Vahl) Sm. tACANTHACEAE Ruellia cf. brittoniana tALISMATACEAE Sagittaria lancifolia subsp.
media(Micheli) Bogin am
AMARANTHACEAE Alternanthera obovata (Mart. & Gal.)Millsp.
t
ANACARDIACEAE Bunchosia sp. tANACARDIACEAE Metopium brownei (Jacq.) Urb. chechén
negrot
ANACARDIACEAE Spondias sp. jobo tANNONACEAE Annona glabra L. tAPIACEAE Centella asiatica (L.) Urb. amAPIACEAE Hydrocotyle bonariensis Lam. amAPIACEAE Hydrocotyle ranunculoides L. amAPOCYNACEAE Rhabdadenia biflora (Jacq.) Müll. Arg. tARACEAE Pistia stratiotes L. aARECACEAE Acoelorraphe wrightii (Griseb. & H.
Wendl.) H. Wendl.Ex Becc.
taciste am
ARECACEAE Bactris major Jacq. güiscoyol tARECACEAE Desmoncus orthacantos Mart. bayal tARECACEAE Sabal sp. guano tARECACEAE Thrinax sp. tASCLEPIADACEAE Sp. 1 tASTERACEAE Eclipta sp. tASTERACEAE Fleishmannia sp. tASTERACEAE Mikania micrantha tASTERACEAE Wedelia sp. amBIGNONIACEAE Crescentia cujete tBIGNONIACEAE Clytostoma binatum (Thunb) Sandw. tBLECHNACEAE Blechnum serrulatum Rich. amBOMBACACEAE Pachira aquatica amBOMBACACEAE Quararibea funebris (La Llave) Vischer batidor tBROMELIACEAE Aechmea sp. eBROMELIACEAE Pancratium sp. tBROMELIACEAE Tillandsia Streptophylla Scheidw. & C.
Morrene
CABOMBACEAE Brasenia Schreberi J. F. Gmel. aCABOMBACEAE Cabomba palaeformis Fassett. aCACTACEAE sp. t
APPENDIX 6 Plant taxa recorded in and around marshes and riparianforests in Laguna del Tigre National Park, Petén, Guatemala
APENDICE 6 Taxones de plantas registrado en y alrededor de los bosquesanegados y ribereños en el Parque Nacional Laguna del Tigre,Petén, Guatemala
Blanca León and Julio Morales Can
Life form/Forma de vida:t: Terrestrial/Terrestrea: Acuatic/Acuáticaam: Amphibian/Anfibioe: Epifita/Epífita

�������������� ������������� Octubro 2000 ���
FamilyFamilia
GenusGénero
SpeciesEspecies
AuthorAutor
Local NameNombre Local
Life FormForma de Vida
CAPPARIDACEAE Capparis flexuosa L. tCELASTRACEAE recoma tCHRYSOBALANACEAE Chrysobalanus icaco L. icaco tCHRYSOBALANACEAE Hirtella americana L. aceituno peludo tCLUSIACEAE Calophyllum cf. brasiliense
Camb. var. rekoi(Standl.) Standl. t
COMBRETACEAE Bucida buceras L. amCOMMELINACEAE Commelina sp. tCONVOLVULACEAE Ipomoea indica (Burm. f) Merr. quiebracajete tCONVOLVULACEAE Ipomoea sagittata Lam. tCUCURBITACEAE sp. tCUSCUTACEAE Cuscuta sp. tCYPERACEAE Cladium jamaicense Crantz amCYPERACEAE Cyperus lundelli O'Neill amCYPERACEAE Cyperus unioloides (R. Br.) Urb. amCYPERACEAE Eleocharis geniculata (L.) Roem. &
Schult.am
CYPERACEAE Eleocharis interstincta amCYPERACEAE Eleocharis rostellata Torr amCYPERACEAE Fuirena simplex Vahl amCYPERACEAE Rynchospora cephalotes (L.) Vahl amCYPERACEAE Rynchospora holoschoenoides (Rich.) Herter amCYPERACEAE Scleria sp. amDIOSPYRACEAE Diospyros digyna matasano tEUPHORBIACEAE Caperonia castaneifolia (L.) A. St.-Hil. amFABACEAE Acacia sp. subin tFABACEAE Dalbergia sp. xactix tFABACEAE Haemotxylum campechianum L. amFABACEAE Inga sp. tFABACEAE Lysiloma bahamensis salam tFABACEAE Lonchocarpus hondurensis Benth. yaxman tFABACEAE Lonchocarpus sp. palo de San Juan tFABACEAE Mimosa pigra amFABACEAE Piscidia piscipula (L.) Sarg. tFABACEAE Phitecellobium sp. palo Peru tFLACOURTIACEAE Xylosma flexuosum (Kunth) Hemsl. abalche de
montet
GENTIANACEAE Eustoma exaltatum (L.) Salisb. tHYDROCHARITACEAE Vallisneria americana Michx. aLAMIACEAE Teucrium vesicarium Mill. tLAURACEAE Nectandra membranacea cocche tLENTIBULARIACEAE Utricularia foliosa L. aLENTIBULARIACEAE Utricularia gibba L. aLENTIBULARIACEAE Utricularia sp. aLOGANIACEAE Mitreola petiolata (J. F. Gmel.) Torr.
& A. Grayam
MALPIGHIACEAE Heteropterys lindeniana A. Juss. guayabillo depantano
t
MALVACEAE Hibiscus sp. amMYRICACEAE Myrica sp. tMYRTACEAE Calyptranthes chytraculia (L.) Sw. chilimis hoja
anchat
NAJADACEAE Najas wrightiana A. Braun aNYMPHAEACEAE Nymphaea ampla a
Taxones de plantas en y alrededor de los bosques anegados y ribereños: PNLT, Petén, Guatemala APENDICE 6

CONSERVATION INTERNATIONAL Programa de Evaluación Rápida���
FamilyFamilia
GenusGénero
SpeciesEspecies
AuthorAutor
Local NameNombre Local
Life FormForma de Vida
OCHNACEAE Ouratea lucens (Kunth) Engl. tONAGRACEAE Ludwigia cf. nervosa amONAGRACEAE Ludwigia sp. amORCHIDACEAE Eulophia alta (L.) Fawc. &
Rendleam
ORCHIDACEAE Habenaria bractescens Lindl. amORCHIDACEAE Habenaria repens Nutt. amORCHIDACEAE Spiranthes sp. am
APPENDIX 6 Plant taxa recorded in and around marshes and riparian forests in LTNP, Petén, Guatemala

�������������� ������������� Octubro 2000 ���
+ = collected/colectada - = not collected during RAP survey/no se colectaron durante el estudio del RAP Taxa
Common Name Nombre Común
Taxa collected during RAP Taxa colectada durante el RAP
SEMIONOTIFORMES
Lepisosteidae
Atractosteus tropicus Gill 1863 Peje lagarto +
ELOPIFORMES
Megalopidae
Megalops atlanticus Valenciennes 1847 Sábalo -
ANGUILLIFORMES
Anguillidae
Anguilla rostrata Lesueur 1817 Anguila -
CLUPEIFORMES
Clupeidae
Dorosoma anale Meek 1904 Sardina de leche +
Dorosoma petenense Günther 1867 Sardina de leche +
CYPRINIFORMES
Catostomidae
Ictiobus meridionalis Günther 1868 Chopa -
Cyprinidae
Ctenopharyngodon idella Valenciennes 1844 Carpa +
CHARACIFORMES
Characidae
Astyanax aeneus Günther 1860 Sardina +
Brycon guatemalensis Regan 1908 Machaca +
Hyphessobrycon compressus Meek 1904 Sardinita +
SILURIFORMES
Ariidae
Ariidae sp. Curruco +
Cathorops aguadulce Meek 1904 Cabeza de fierro +
Potamarius nelsoni Evermann & Goldsborough 1902 Curruco +
Ictaluridae
Ictalurus furcatus Valenciennes 1840 Jolote +
Pimelodidae
Fish species believed to occur in the Río San Pedro and the APPENDIX 7upper Río Candelaria basins in Petén, Guatemala
Especies de peces que se cree, existen en el Río San APENDICE 7Pedro y en la cuenca del Río Candelaria en Petén, Guatemala
Philip W. Willink, Christian Barrientos, Hernan A. Kihn, and Barry Chernoff

CONSERVATION INTERNATIONAL Programa de Evaluación Rápida���
Taxa Common NameNombre Común
Taxa collected during RAPTaxa colectada durante el RAP
Rhamdia guatemalensis Günther 1864 Filin +
Rhamdia laticauda Kner 1858 Filin -
BATRACHOIDIFORMESBatrachoididae
Batrachoides goldmani Evermann & Goldsborough 1902 Pez sapo +
ATHERINIFORMESAtherinidae
Atherinella alvarezi Diaz-Pardo 1972 Robalito +
Atherinella cf. schultzi Alvarez & Carranza 1952 Robalito +
CYPRINODONTIFORMESAplocheilidae
Rivulus tenuis Meek 1904 "none available" -
PoeciliidaeBelonesox belizanus Kner 1860 Picudito +
Carlhubbsia kidderi Hubbs 1936 Pulta +
Gambusia sexradiata Hubbs 1936 Pulta +
Gambusia yucatana Regan 1914 Pulta -
Heterandria bimaculata Heckel 1848 Pupo +
Phallichthys fairweatheri Rosen & Bailey 1959 Pulta +
Poecilia mexicana Steindachner 1863 Pupo +
Poecilia petenensis Günther 1866 Pupo +
Xiphophorus hellerii Heckel 1848 Pulta +
Xiphophorus maculatus Günther 1866 Pulta -
BELONIFORMESBelonidae
Strongylura hubbsi Collette 1974 Agujeta +
HemiramphidaeHyporhamphus mexicanus Alvarez 1959 Agujeta -
MUGILIFORMESMugilidae
Mugil cephalus Linnaeus 1758 Liza -
Mugil curema Valenciennes 1836 Liza +
SYNBRANCHIFORMESSynbranchidae
Ophisternon aenigmaticum Rosen & Greenwood 1976 Anguila -
PERCIFORMESCentropomidae
Centropomus undecimalis Bloch 1792 Robalo -
CichlidaeCichlasoma bifasciatum Steindachner 1864 Mojarra +
Cichlasoma friedrichsthalii Heckel 1840 Guapote +
Cichlasoma helleri Steindachner 1864 Shibal +
Cichlasoma heterospilum Hubbs 1936 Mojarra negra +
Cichlasoma intermedium Günther 1862 Mojarra -
Cichlasoma lentiginosum Steindachner 1864 Corrientera +
Cichlasoma meeki Brind 1918 Shibal +
Cichlasoma octofasciatum Regan 1903 Negrita +
APENDICE 7 Especies de peces que se cree que existen en el Petén, Guatemala
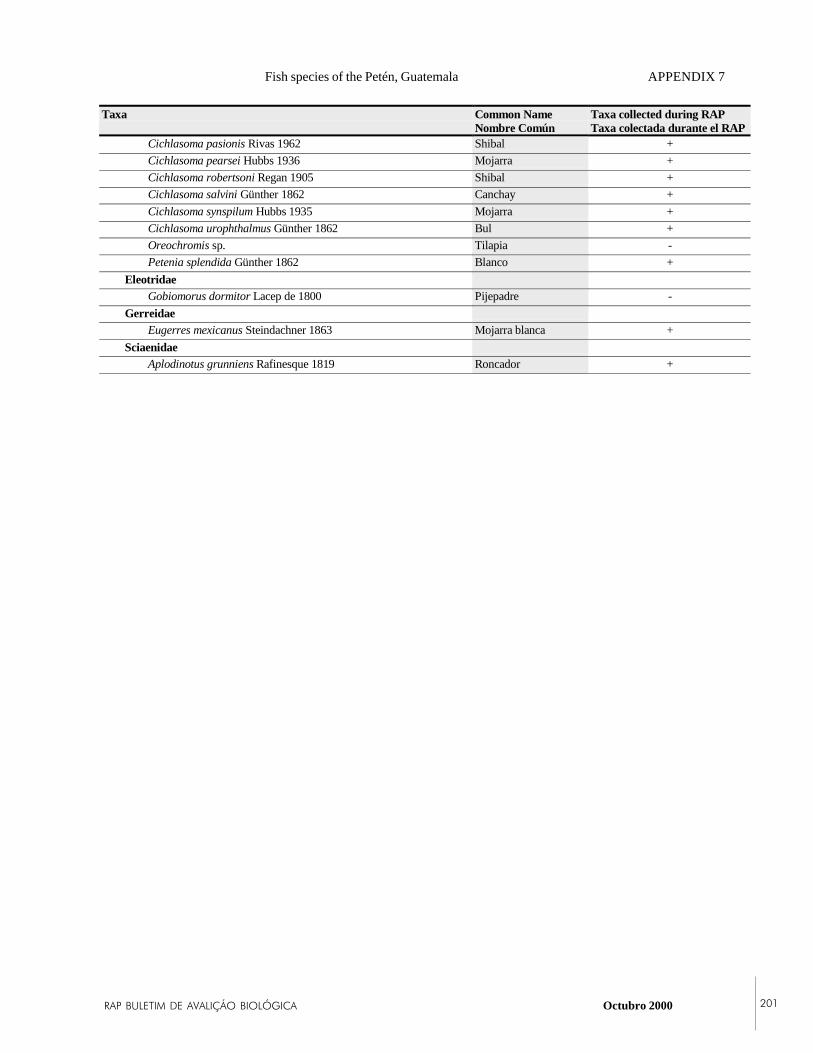
�������������� ������������� Octubro 2000 ���
Taxa Common NameNombre Común
Taxa collected during RAPTaxa colectada durante el RAP
Cichlasoma pasionis Rivas 1962 Shibal +
Cichlasoma pearsei Hubbs 1936 Mojarra +
Cichlasoma robertsoni Regan 1905 Shibal +
Cichlasoma salvini Günther 1862 Canchay +
Cichlasoma synspilum Hubbs 1935 Mojarra +
Cichlasoma urophthalmus Günther 1862 Bul +
Oreochromis sp. Tilapia -
Petenia splendida Günther 1862 Blanco +
EleotridaeGobiomorus dormitor Lacep de 1800 Pijepadre -
GerreidaeEugerres mexicanus Steindachner 1863 Mojarra blanca +
SciaenidaeAplodinotus grunniens Rafinesque 1819 Roncador +
Fish species of the Petén, Guatemala APPENDIX 7
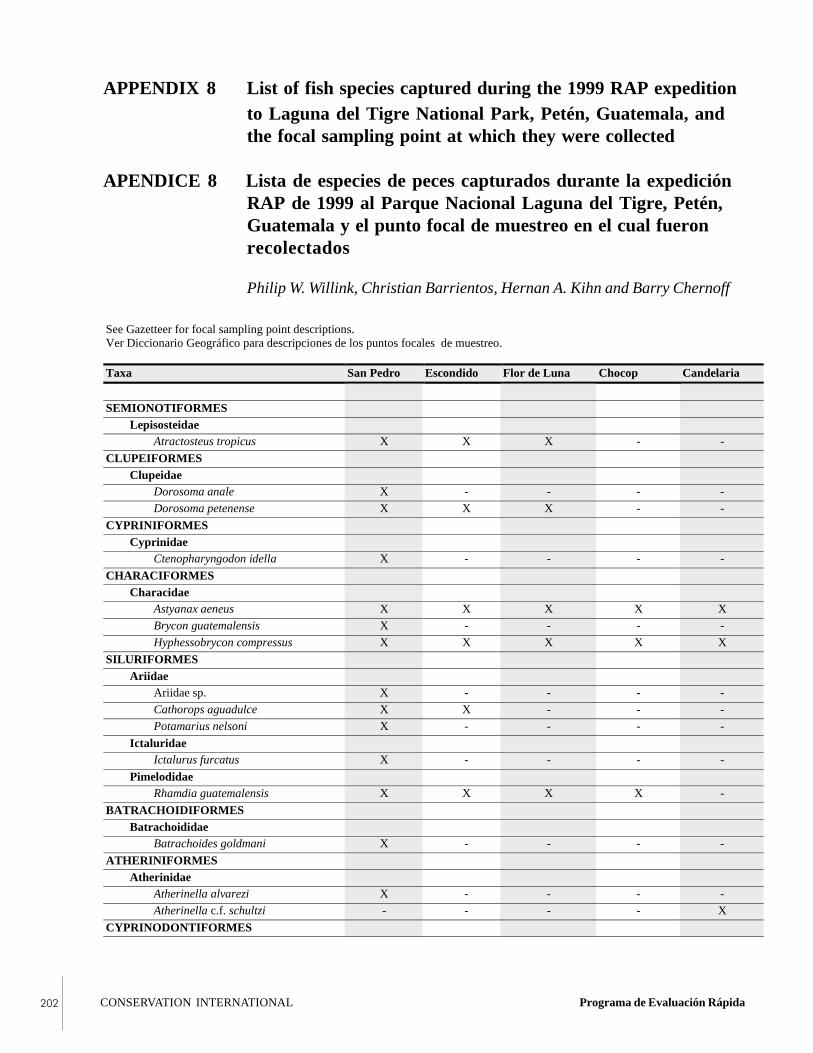
CONSERVATION INTERNATIONAL Programa de Evaluación Rápida���
See Gazetteer for focal sampling point descriptions.Ver Diccionario Geográfico para descripciones de los puntos focales de muestreo.
Taxa San Pedro Escondido Flor de Luna Chocop Candelaria
SEMIONOTIFORMESLepisosteidae
Atractosteus tropicus X X X - -
CLUPEIFORMESClupeidae
Dorosoma anale X - - - -
Dorosoma petenense X X X - -
CYPRINIFORMESCyprinidae
Ctenopharyngodon idella X - - - -
CHARACIFORMESCharacidae
Astyanax aeneus X X X X X
Brycon guatemalensis X - - - -
Hyphessobrycon compressus X X X X X
SILURIFORMESAriidae
Ariidae sp. X - - - -
Cathorops aguadulce X X - - -
Potamarius nelsoni X - - - -
IctaluridaeIctalurus furcatus X - - - -
PimelodidaeRhamdia guatemalensis X X X X -
BATRACHOIDIFORMESBatrachoididae
Batrachoides goldmani X - - - -
ATHERINIFORMESAtherinidae
Atherinella alvarezi X - - - -
Atherinella c.f. schultzi - - - - X
CYPRINODONTIFORMES
APPENDIX 8 List of fish species captured during the 1999 RAP expeditionto Laguna del Tigre National Park, Petén, Guatemala, andthe focal sampling point at which they were collected
APENDICE 8 Lista de especies de peces capturados durante la expediciónRAP de 1999 al Parque Nacional Laguna del Tigre, Petén,Guatemala y el punto focal de muestreo en el cual fueronrecolectados
Philip W. Willink, Christian Barrientos, Hernan A. Kihn and Barry Chernoff

�������������� ������������� Octubro 2000 ���
Taxa San Pedro Escondido Flor de Luna Chocop Candelaria
Poeciliidae
Belonesox belizanus X X X X X
Carlhubbsia kidderi X X X - -
Gambusia sexradiata X X X - -
Heterandria bimaculata - X - X X
Phallichthys fairweatheri X X X - -
Poecilia mexicana X X X X X
Poecilia petenensis X X X - -
Xiphophorus hellerii - - - X -
BELONIFORMES
Belonidae
Strongylura hubbsi X X - - -
MUGILIFORMES
Mugilidae
Mugil curema X - - - -
PERCIFORMES
Cichlidae
Cichlasoma bifasciatum X X - - X
Cichlasoma friedrichsthalii X X - X X Cichlasoma helleri X X - X X
Cichlasoma heterospilum X X X X -
Cichlasoma lentiginosum X - - - -
Cichlasoma meeki X X X X X
Cichlasoma octofasciatum X X - X -
Cichlasoma pasionis X X X X -
Cichlasoma pearsei X X X - -
Cichlasoma robertsoni X X X X -
Cichlasoma salvini X X X - X
Cichlasoma synspilum X X X - X
Cichlasoma urophthalmus X X X - -
Petenia splendida X X X X X
Gerreidae
Eugerres mexicanus X - - - -
Sciaenidae
Aplodinotus grunniens X - - - -
TOTAL 38 27 20 15 13
Especies de peces capturados: RAP 1999, PNLT, Petén, Guatemala APENDICE 8
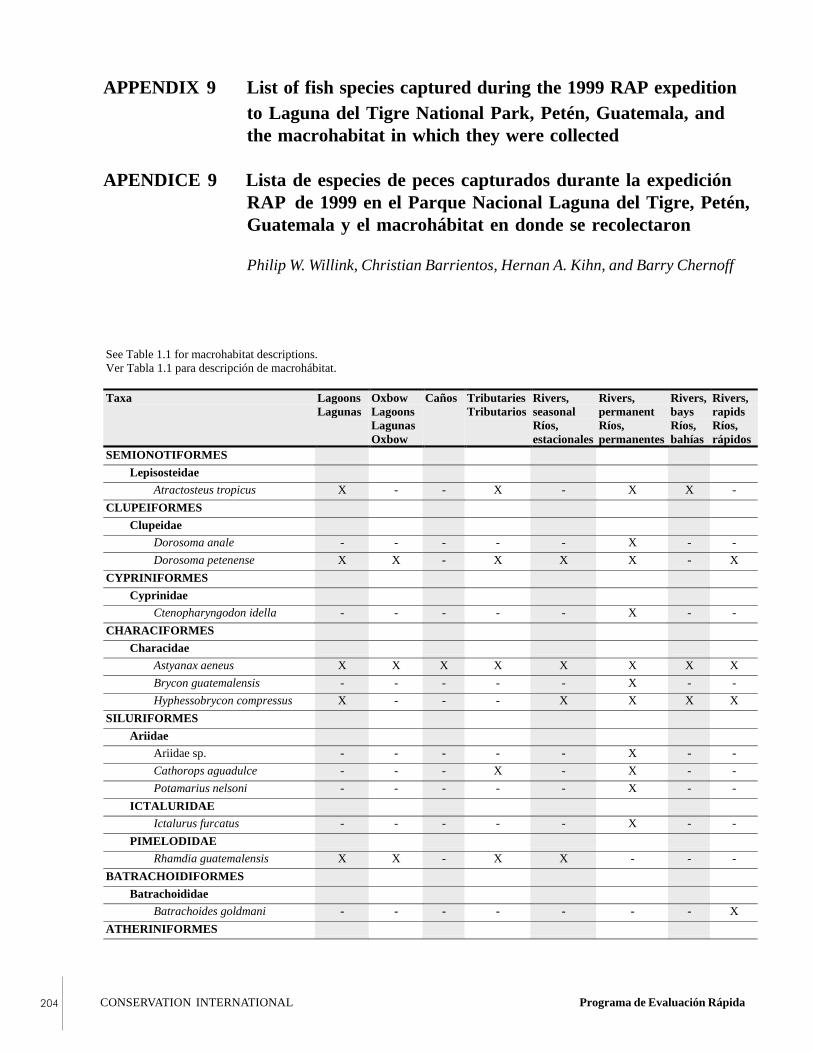
CONSERVATION INTERNATIONAL Programa de Evaluación Rápida���
See Table 1.1 for macrohabitat descriptions.Ver Tabla 1.1 para descripción de macrohábitat.
Taxa LagoonsLagunas
OxbowLagoonsLagunasOxbow
Caños TributariesTributarios
Rivers,seasonalRíos,estacionales
Rivers,permanentRíos,permanentes
Rivers,baysRíos,bahías
Rivers,rapidsRíos,rápidos
SEMIONOTIFORMES
LepisosteidaeAtractosteus tropicus X - - X - X X -
CLUPEIFORMES
ClupeidaeDorosoma anale - - - - - X - -
Dorosoma petenense X X - X X X - X
CYPRINIFORMES
CyprinidaeCtenopharyngodon idella - - - - - X - -
CHARACIFORMES
CharacidaeAstyanax aeneus X X X X X X X X
Brycon guatemalensis - - - - - X - -
Hyphessobrycon compressus X - - - X X X X
SILURIFORMES
AriidaeAriidae sp. - - - - - X - -
Cathorops aguadulce - - - X - X - -
Potamarius nelsoni - - - - - X - -
ICTALURIDAEIctalurus furcatus - - - - - X - -
PIMELODIDAERhamdia guatemalensis X X - X X - - -
BATRACHOIDIFORMES
BatrachoididaeBatrachoides goldmani - - - - - - - X
ATHERINIFORMES
APPENDIX 9 List of fish species captured during the 1999 RAP expeditionto Laguna del Tigre National Park, Petén, Guatemala, andthe macrohabitat in which they were collected
APENDICE 9 Lista de especies de peces capturados durante la expediciónRAP de 1999 en el Parque Nacional Laguna del Tigre, Petén,Guatemala y el macrohábitat en donde se recolectaron
Philip W. Willink, Christian Barrientos, Hernan A. Kihn, and Barry Chernoff
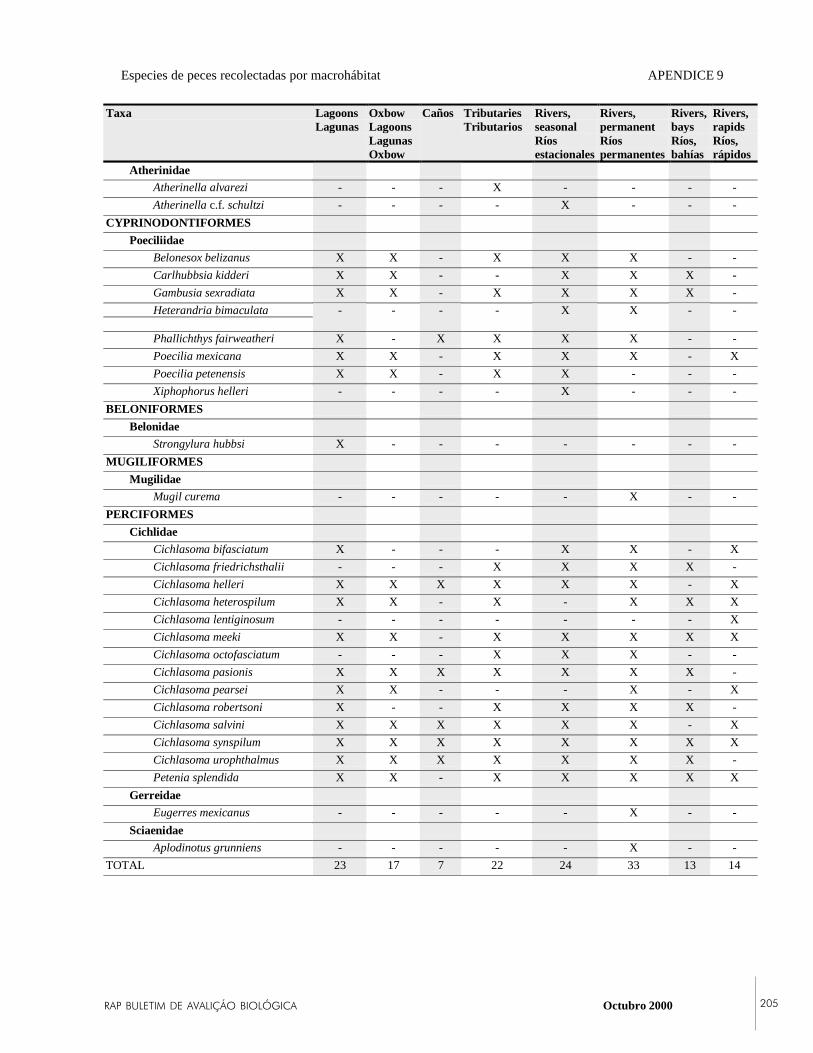
�������������� ������������� Octubro 2000 ���
Taxa LagoonsLagunas
OxbowLagoonsLagunasOxbow
Caños TributariesTributarios
Rivers,seasonalRíosestacionales
Rivers,permanentRíospermanentes
Rivers,baysRíos,bahías
Rivers,rapidsRíos,rápidos
AtherinidaeAtherinella alvarezi - - - X - - - -
Atherinella c.f. schultzi - - - - X - - -
CYPRINODONTIFORMES
PoeciliidaeBelonesox belizanus X X - X X X - -
Carlhubbsia kidderi X X - - X X X -
Gambusia sexradiata X X - X X X X -
Heterandria bimaculata - - - - X X - -
Phallichthys fairweatheri X - X X X X - -
Poecilia mexicana X X - X X X - X
Poecilia petenensis X X - X X - - -
Xiphophorus helleri - - - - X - - -
BELONIFORMES
BelonidaeStrongylura hubbsi X - - - - - - -
MUGILIFORMES
MugilidaeMugil curema - - - - - X - -
PERCIFORMES
CichlidaeCichlasoma bifasciatum X - - - X X - X
Cichlasoma friedrichsthalii - - - X X X X -
Cichlasoma helleri X X X X X X - X
Cichlasoma heterospilum X X - X - X X X
Cichlasoma lentiginosum - - - - - - - X
Cichlasoma meeki X X - X X X X X
Cichlasoma octofasciatum - - - X X X - -
Cichlasoma pasionis X X X X X X X -
Cichlasoma pearsei X X - - - X - X
Cichlasoma robertsoni X - - X X X X -
Cichlasoma salvini X X X X X X - X
Cichlasoma synspilum X X X X X X X X
Cichlasoma urophthalmus X X X X X X X -
Petenia splendida X X - X X X X X
GerreidaeEugerres mexicanus - - - - - X - -
SciaenidaeAplodinotus grunniens - - - - - X - -
TOTAL 23 17 7 22 24 33 13 14
Especies de peces recolectadas por macrohábitat APENDICE 9

CONSERVATION INTERNATIONAL Programa de Evaluación Rápida���
For flow cytometric analysis, nuclei were isolated from blood cells and stained with propidium iodide according to a modificationof the methods of Vindelov et al. (1983) and Vindelov and Christianson (1990; see Chapter 5 for references). An increase in theamount of chromosomal damage is reflected by an increase in cell-to-cell variation in DNA content (Bickham, 1990). Thisvariation (measured as half-peak coefficient of variation [CV]) was measured using an Epics Profile II Flow Cytometer (CoulterCorp., Hialeah, CA), which measures the cell-to-cell half-peak coefficient of variation (gated CV) in DNA content for cells in theG
1/G
0 phase of the cell cycle. Alignment, focus, and instrumental gain were set prior to analysis using 0.097 mm fluorescent
microspheres (Coulter Corp.) and all samples were run in one day. Differences between sites were tested using the Kruskal-Wallistest.
For DNA extractions, 20 ml whole blood was suspended in 500 ml TEN (50 mM Tris, 10 mM EDTA, 100mM NaCl, pH8.0). DNA was then extracted and purified according to Theodorakis et al. (1996), and dissolved in TE (10 mM Tris, 1 mMEDTA, pH 8.0). DNA was quantified spectrophotometrically at 260 nm (1 AU = 50 mg DNA/ml).
The DNA was subjected to electrophoresis with alkaline or neutral running buffer (Theodorakis et al., 1996). Alkalineelectrophoresis was performed with 30 mM NaOH, 2 mM EDTA (pH 12.5) as the running buffer. A total of 0.5 mg of DNA wasloaded into each well of a 0.8% agarose gel and subjected to electrophoresis at 5 V/cm for 5 hr. The buffer was constantlyrecirculated and cooled in an icebath. For neutral gel electrophoresis, TBE (45 mM Tris, 45 mM borate, 0.5 mM EDTA, pH 8.0)was used as the running buffer. A total of 0.05 mg DNA was loaded into a 0.3% agarose gel and subjected to electrophoresis at0.75 V/cm for 18 hr. Because such a low percentage gel is very fragile, the gels were cast on a basement of 3% agarose. Afterelectrophoresis, gels were stained in ethidium bromide and photographed under UV light. The average molecular length (Ln) of theDNA in each sample was calculated as in Theodorakis et al. (1993).
The Ln calculated under alkaline conditions is affected by both single- and double-strand breaks, while the Ln of neutral gels isaffected by double strand breaks only. Because DNA is a long and fragile molecule, double-strand breaks can be caused not onlyby genotoxicant exposure, but also by physical shearing which may take place during extraction, purification and analysis. Inorder to take this into account, the number of single-strand breaks (per 105 bases) was determined by subtracting the double-strand Ln from the single-strand Ln according to the following formula, as modified from Freeman et al. (1990):
1 1 #SSB = ( - ) X 100 Ln (single) Ln(double)
APPENDIX 10 Detailed methodology for DNA strand breakage and flowcytometry assays
APENDICE 10 Metodología detallada para ensayos de separación defilamentos de ADN y citometría de flujo.
Chris W. Theodorakis and John W. Bickham
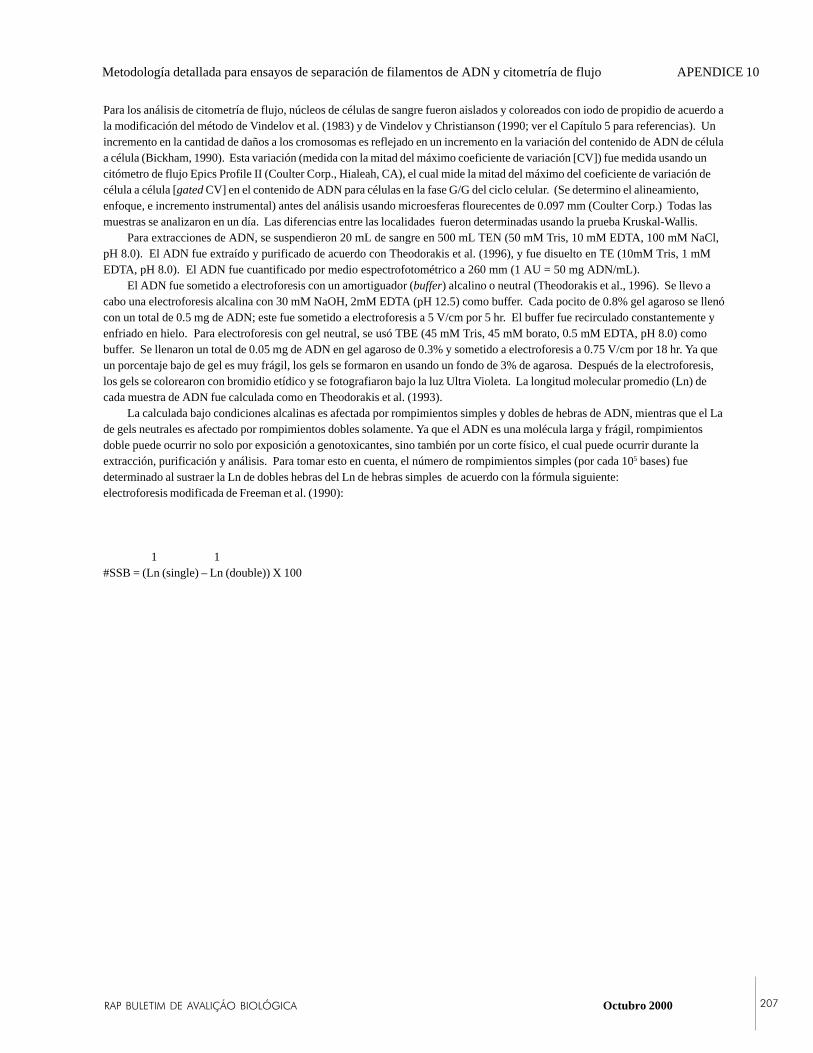
�������������� ������������� Octubro 2000 ���
Para los análisis de citometría de flujo, núcleos de células de sangre fueron aislados y coloreados con iodo de propidio de acuerdo ala modificación del método de Vindelov et al. (1983) y de Vindelov y Christianson (1990; ver el Capítulo 5 para referencias). Unincremento en la cantidad de daños a los cromosomas es reflejado en un incremento en la variación del contenido de ADN de célulaa célula (Bickham, 1990). Esta variación (medida con la mitad del máximo coeficiente de variación [CV]) fue medida usando uncitómetro de flujo Epics Profile II (Coulter Corp., Hialeah, CA), el cual mide la mitad del máximo del coeficiente de variación decélula a célula [gated CV] en el contenido de ADN para células en la fase G/G del ciclo celular. (Se determino el alineamiento,enfoque, e incremento instrumental) antes del análisis usando microesferas flourecentes de 0.097 mm (Coulter Corp.) Todas lasmuestras se analizaron en un día. Las diferencias entre las localidades fueron determinadas usando la prueba Kruskal-Wallis.
Para extracciones de ADN, se suspendieron 20 mL de sangre en 500 mL TEN (50 mM Tris, 10 mM EDTA, 100 mM NaCl,pH 8.0). El ADN fue extraído y purificado de acuerdo con Theodorakis et al. (1996), y fue disuelto en TE (10mM Tris, 1 mMEDTA, pH 8.0). El ADN fue cuantificado por medio espectrofotométrico a 260 mm (1 AU = 50 mg ADN/mL).
El ADN fue sometido a electroforesis con un amortiguador (buffer) alcalino o neutral (Theodorakis et al., 1996). Se llevo acabo una electroforesis alcalina con 30 mM NaOH, 2mM EDTA (pH 12.5) como buffer. Cada pocito de 0.8% gel agaroso se llenócon un total de 0.5 mg de ADN; este fue sometido a electroforesis a 5 V/cm por 5 hr. El buffer fue recirculado constantemente yenfriado en hielo. Para electroforesis con gel neutral, se usó TBE (45 mM Tris, 45 mM borato, 0.5 mM EDTA, pH 8.0) comobuffer. Se llenaron un total de 0.05 mg de ADN en gel agaroso de 0.3% y sometido a electroforesis a 0.75 V/cm por 18 hr. Ya queun porcentaje bajo de gel es muy frágil, los gels se formaron en usando un fondo de 3% de agarosa. Después de la electroforesis,los gels se colorearon con bromidio etídico y se fotografiaron bajo la luz Ultra Violeta. La longitud molecular promedio (Ln) decada muestra de ADN fue calculada como en Theodorakis et al. (1993).
La calculada bajo condiciones alcalinas es afectada por rompimientos simples y dobles de hebras de ADN, mientras que el Lade gels neutrales es afectado por rompimientos dobles solamente. Ya que el ADN es una molécula larga y frágil, rompimientosdoble puede ocurrir no solo por exposición a genotoxicantes, sino también por un corte físico, el cual puede ocurrir durante laextracción, purificación y análisis. Para tomar esto en cuenta, el número de rompimientos simples (por cada 105 bases) fuedeterminado al sustraer la Ln de dobles hebras del Ln de hebras simples de acuerdo con la fórmula siguiente:electroforesis modificada de Freeman et al. (1990):
1 1#SSB = (Ln (single) – Ln (double)) X 100
Metodología detallada para ensayos de separación de filamentos de ADN y citometría de flujo APENDICE 10

CONSERVATION INTERNATIONAL Programa de Evaluación Rápida���
APPENDIX 11 Birds species found in Laguna del Tigre National Park,Petén, Guatemala during the RAP survey
APENDICE 11 Especies de aves que se encontraron en el ParqueNacional Laguna del Tigre, Petén, Guatemala durante laexpedición RAP de 1999
Edgar Selvin Pérez and Miriam Lorena Castillo Villeda
Scientific NameNombre Científico
Common English NameNombre común en inglés
Common Spanish NameNombre común en español
TINAMIDAECrypturellus boucardi Slaty-breasted TinamouCrypturellus cinamomeus Thicket Tinamou MancololaCrypturellus soui Little Tinamou Mancolola EnanaTinamus major Great Tinamou Mancolola GrandePODICIPEDIDAETachybatus dominicus Least Grebe Zambullidor EnanoPELECANIDAEPelecanus occidentalis Brown Pelican Pelícano PardoPHALACROCORACIDAEPhalacrocorax brasilianus Olivaceous Cormorant Malache, Pato CocheANHINGIDAEAnhinga anhinga Anhinga Pato Aguja, Anhinga.ARDEIDAEAgamia agami Agami Heron Garcita Vientre CastañoArdea herodias Great Blue Heron Garzón AzuladoBotaurus pinnatus Pinnated Bittern Garza TigreBubulcus ibis Cattle Egret Garcita GarrapateraButorides striatus Striated Heron Garcita VerdeCasmerodius albus Great Egret Garza RealCochlearius cochlearius Boat-billed Heron Garza Pico Zapato, CucharónEgretta caerulea Little Blue Heron Garza GrisEgretta thula Snowy Egret Garcita BlancaEgretta tricolor Tricolored Heron Garcita TricolorNycticorax violaceus Yellow-crowned Night-Heron Garza Nocturna Corona AmarillaTigrisoma mexicanum Bare-throated Tiger-Heron Garza TigreCICONIDAEJabiru mycteria Jabiru Ciguieña JabirúMycteria americana Wood Stork Garzón PulidoANATIDAEAnas discors Blue-winged Teal Cerceta ala AzulCairina moschata Muscovy Duck Pato RealDendrocygna autumnalis Black-bellied Whistling-Duck PijijeCATHARTIDAECathartes aura Turkey Vulture Viuda, MayónCoragyps atratus Black Vulture Zopilote Negro, ZopeSarcoramphus papa King Vulture Rey ZopeACCIPITRIDAEAccipiter bicolor Bicolored Hawk Gavilán BicolorAccipiter cooperii Cooper's Hawk GavilánBusarellus nigricollis Black-collared Hawk Gavilán PescadorButeo brachyurus Short-tailed Hawk GavilánButeo magnirostris Roadside Hawk Gavilán de los CaminosButeo nitidus Grey Hawk Gavilán GrisButeo platypterus Broad-winged Hawk Gavilán Aludo

�������������� ������������� Octubro 2000 ���
Scientific NameNombre Científico
Common English NameNombre común en inglés
Common Spanish NameNombre común en español
Buteogallus urubitinga Great Black Hawk Aguililla NegraElanoides forficatus Swallow-tailed Kite Gavilán TijeretaGeranospiza caerulescens Crane Hawk Gavilán RaneroIctinia mississippiensi Mississippi Kite Gavilán GrisilloIctinia plumbea Plumbeous Kite Gavilán PlomizoLeptodon cayenensis Grey-headed KiteLeucopternis albicollis White Hawk Gavilán BlancoMorphnus guianensis Crested Eagle Aguila Monera*Pandion haliaetus Osprey Aguila PescadoraParabuteo unicinctus Harris' Hawk Gavilán MixtoRostrhamus sociabilis Snail Kite Gavilán CaracoleroSpizaetus ornatus Ornate Hawk-Eagle Aguilucho de Penacho*Spizatur melanoleucus Black-and-White Hawk-Eagle Aguilucho Blanco y NegroFALCONIDAEFalco deiroleucus Orange-breasted Falcon Halcón Pecho NaranjaFalco rufigularis Bat Falcon Halcón MurcielagueroHerpetotheres cachinans Laughing Falcon Halcón GuacoMicraster ruficollis Barred Forest-Falcon Halcón de Monte RayadoM. semitorquatus Collared Forest-Falcon Halcón de CollarCRACIDAECrax rubra Great Curassow Pajuil, Faisán.Ortalis vetula Plain Chachalaca Chachalaca, ChachaPenelope purpurascens Crested Guan CojolitaPHASIANIDAEAgriocharis ocellata Ocellated Turkey Pavo ocelado, Pavo PeteneroDactylortyx thoraxicus* Singing Quail Bolonchaco*Odontophorus guttatus* Spotted Wood-Quail Bolonchaco, Cobanitos*RALLIDAEAramides cajanea Grey-necked Wood-Rail GallinolaGallinula chloropus Common Moorhen Gallinola Frente ColoradaLaterallus ruber Ruddy Crake Gallineta ColoradaPorphyrula martinica Purple Gallinule Gallinola MoradaHELIORNITHIDAEHeliornis fulica Sungrebe Pájaro CantilARAMIDAEAramus guarauna Limpkin Totolaca,CaraúCHARADRIDAECharadrius collaris Collared Plover Chorlito de CollarCharadrius vociferus Killdeer CollarejoJACANIDAEJacana spinosa Northern Jacana Gallito de PantanoRECURVIROSTRIDAEHimantopus mexicanus Black-necked Stilt Candelero AmericanoSCOLOPACIDAEActitis macularia Spotted Sandpiper AlzaculitoCalidris melanotus Pectoral Sandpiper PlayeritoCalidris minimus Least Sandpiper PlayeritoCalidris fuscicola White-rumped Sandpiper PlayeritoTringa flavipe Lesser Yellowlegs idemCOLUMBIDAEClaravis pretiosa Blue Ground-Dove Tortolita CelesteColumba flavirostris Red-billed Pigeon Paloma piquirojoColumba nigrirostris Short-billed Pigeon Paloma pico cortoColumba speciosa Scaled Pigeon Paloma EscamosaColumbina minuta Plain-breasted Ground-Dove Tortolita caféColumbina talpacoti Ruddy Ground-Dove TortolitaGeotrygon montana Ruddy Quail-Dove Paloma de Montaña, Paloma Perdiz
Especies de aves encontradas en el PNLT, Petén, Guatemala APENDICE 11
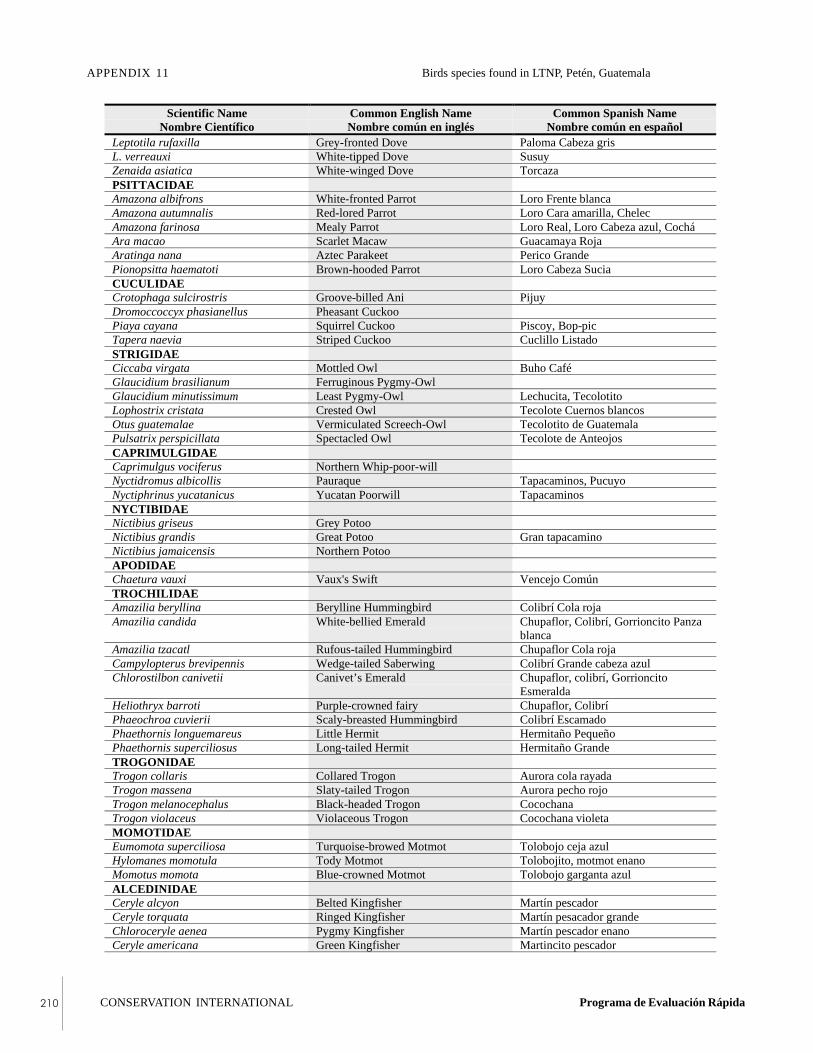
CONSERVATION INTERNATIONAL Programa de Evaluación Rápida���
Scientific NameNombre Científico
Common English NameNombre común en inglés
Common Spanish NameNombre común en español
Leptotila rufaxilla Grey-fronted Dove Paloma Cabeza grisL. verreauxi White-tipped Dove SusuyZenaida asiatica White-winged Dove TorcazaPSITTACIDAEAmazona albifrons White-fronted Parrot Loro Frente blancaAmazona autumnalis Red-lored Parrot Loro Cara amarilla, ChelecAmazona farinosa Mealy Parrot Loro Real, Loro Cabeza azul, CocháAra macao Scarlet Macaw Guacamaya RojaAratinga nana Aztec Parakeet Perico GrandePionopsitta haematoti Brown-hooded Parrot Loro Cabeza SuciaCUCULIDAECrotophaga sulcirostris Groove-billed Ani PijuyDromoccoccyx phasianellus Pheasant CuckooPiaya cayana Squirrel Cuckoo Piscoy, Bop-picTapera naevia Striped Cuckoo Cuclillo ListadoSTRIGIDAECiccaba virgata Mottled Owl Buho CaféGlaucidium brasilianum Ferruginous Pygmy-OwlGlaucidium minutissimum Least Pygmy-Owl Lechucita, TecolotitoLophostrix cristata Crested Owl Tecolote Cuernos blancosOtus guatemalae Vermiculated Screech-Owl Tecolotito de GuatemalaPulsatrix perspicillata Spectacled Owl Tecolote de AnteojosCAPRIMULGIDAECaprimulgus vociferus Northern Whip-poor-willNyctidromus albicollis Pauraque Tapacaminos, PucuyoNyctiphrinus yucatanicus Yucatan Poorwill TapacaminosNYCTIBIDAENictibius griseus Grey PotooNictibius grandis Great Potoo Gran tapacaminoNictibius jamaicensis Northern PotooAPODIDAEChaetura vauxi Vaux's Swift Vencejo ComúnTROCHILIDAEAmazilia beryllina Berylline Hummingbird Colibrí Cola rojaAmazilia candida White-bellied Emerald Chupaflor, Colibrí, Gorrioncito Panza
blancaAmazilia tzacatl Rufous-tailed Hummingbird Chupaflor Cola rojaCampylopterus brevipennis Wedge-tailed Saberwing Colibrí Grande cabeza azulChlorostilbon canivetii Canivet’s Emerald Chupaflor, colibrí, Gorrioncito
EsmeraldaHeliothryx barroti Purple-crowned fairy Chupaflor, ColibríPhaeochroa cuvierii Scaly-breasted Hummingbird Colibrí EscamadoPhaethornis longuemareus Little Hermit Hermitaño PequeñoPhaethornis superciliosus Long-tailed Hermit Hermitaño GrandeTROGONIDAETrogon collaris Collared Trogon Aurora cola rayadaTrogon massena Slaty-tailed Trogon Aurora pecho rojoTrogon melanocephalus Black-headed Trogon CocochanaTrogon violaceus Violaceous Trogon Cocochana violetaMOMOTIDAEEumomota superciliosa Turquoise-browed Motmot Tolobojo ceja azulHylomanes momotula Tody Motmot Tolobojito, motmot enanoMomotus momota Blue-crowned Motmot Tolobojo garganta azulALCEDINIDAECeryle alcyon Belted Kingfisher Martín pescadorCeryle torquata Ringed Kingfisher Martín pesacador grandeChloroceryle aenea Pygmy Kingfisher Martín pescador enanoCeryle americana Green Kingfisher Martincito pescador
APPENDIX 11 Birds species found in LTNP, Petén, Guatemala

�������������� ������������� Octubro 2000 ���
Scientific NameNombre Científico
Common English NameNombre común en inglés
Common Spanish NameNombre común en español
BUCCONIDAEBucco macrorhynchos White-necked Puffbird Pájaro bobito collarejoMalacoptila panamensis White-whiskered Puffbird Pájaro Bobito Barbon, Viejito BarbudoGALBULIDAEGalbula ruficauda Rufus-tailed Jacamar Jacamar, GuardabarrancosRAMPHASTIDAEPteroglossus torquatus Collared Aracari Pichit. Tucancito Negro.Ramphastos sulfuratus Keel-billed Toucan Tucán Real, Tucán Pico VerdePICIDAECampephilus guatemalensis Pale-billed Woodpecker Carpintero Real, Cheje GrandeCeleus castaneus Chestnut-colored Woodpecker Cheje CaféDryocopus lineatus Lineated Woodpecker Carpintero GrandeMelanerpes aurifrons Golden-fronted Woodpecker Cheje ComúnMelanerpes pucherani Black-cheecked Woodpecker Cheje de MonteMelanerpes pygmaeus Carpintero atacabadoMelanerpes uropygialisVeniliornis fumigatus Smoky-brown Woodpecker Carpintero AtacabadoAutomolus ochrolaemus Buff-throated Foliage-Gleaner Furnárido PardoSclerurus guatemalensis Scaly-throated Leaftosser ExcarvadorSynallaxis erythrothorax Rufous-breasted Spinetail Guito Pechirojo.Xenops minutus Plain Xenops PicoleznaDendrocinchla homochroa Ruddy Woodcreeper Trepador Anaranjado, ChicleroD. anabatina Tawny-winged Woodcreeper Trepador Café, chicleroDendrocolaptes certhia Barred Woodcreeeper Trepador Grande Rayado, Chiclero
GrandeGlyphorynchus spirurus Wedge-billed Woodcreeper TrepadorcitoLepidocolaptes souleyetii Streak-headed Woodcreeper TrepadorSittasomus griseicapillus Olivaceous Woodcreeper Trepadorcito Aceituno, Chiclerito GrisXiphocolaptes turdinus TrepadorcitoXiphocolaptes promerhophirinchus Strong-billed WoodcreeperXiphorhyinchus flavigaster Ivory-billed Woodcreeper Trepador Grande Pico Blanco,
Chiclero PicudoTaraba major Great Antshrike Batara MayorCercomacra tyranina Dusky Antbird HormigueroDysithamnus mentalis Plain Antvireo HormigueroFormicarius analis Black-faced Antthrush Hormiguero GallitoMicrorhopias quixensis Dot-winged Antwren Hormiguero ala PunteadaThamnophilus doliatus Barred Antshrike Pavito (macho), Batara RayadoAttila spadiceus Bright-rumped Attila BigotónCamptostoma imberbe Northern Beardless TyrannuletEmpidonax difficilis Pacific Slope Flycatcher MosqueritoEmpidonax flaviventris Yellow-bellied Flycatcher MosqueritoEmpidonax minimus Least Flycatcher MosqueritoEmpidonax trailli Willow Flycatcher MosqueritoEmpidonax virescens Acadian Flycatcher MosqueritoLeptogon amauricephalus Sepia-capped Flycatcher Mosquerito Espalda AmarillaMegarynchus pitanga Boat-billed Flycatcher TaquillaMyarchus sp Myiarchus species MosqueroM. tyrannulus Brown-crested Flycatcher BigotónM. yucatanensis Yucatan Flycatcher MosqueroMyobius sulphureipygius Sulphur-rumped Flycatcher Mosquerito Culo AmarilloMyodinastes luteiventris Sulphur-bellied Flycatcher MosqueritoMyopagis viridicata Greenish Elaenia Elaenia verdeMyozetetes similis Social Flycatcher Mosquero Corona blancaOncostoma cienreigulare Northern Bentbill Mosquerito Oliva, Pico ganchudoOnychorhynchus coronatus Royal Flycatcher Mosquero RealOrnithion semifalvum Yellow-bellied Tyrannulet MosqueritoPitangus sulphuratus Great Kiskadee Chepillo, Taquilla
Especies de aves encontradas en el PNLT, Petén, Guatemala APENDICE 11
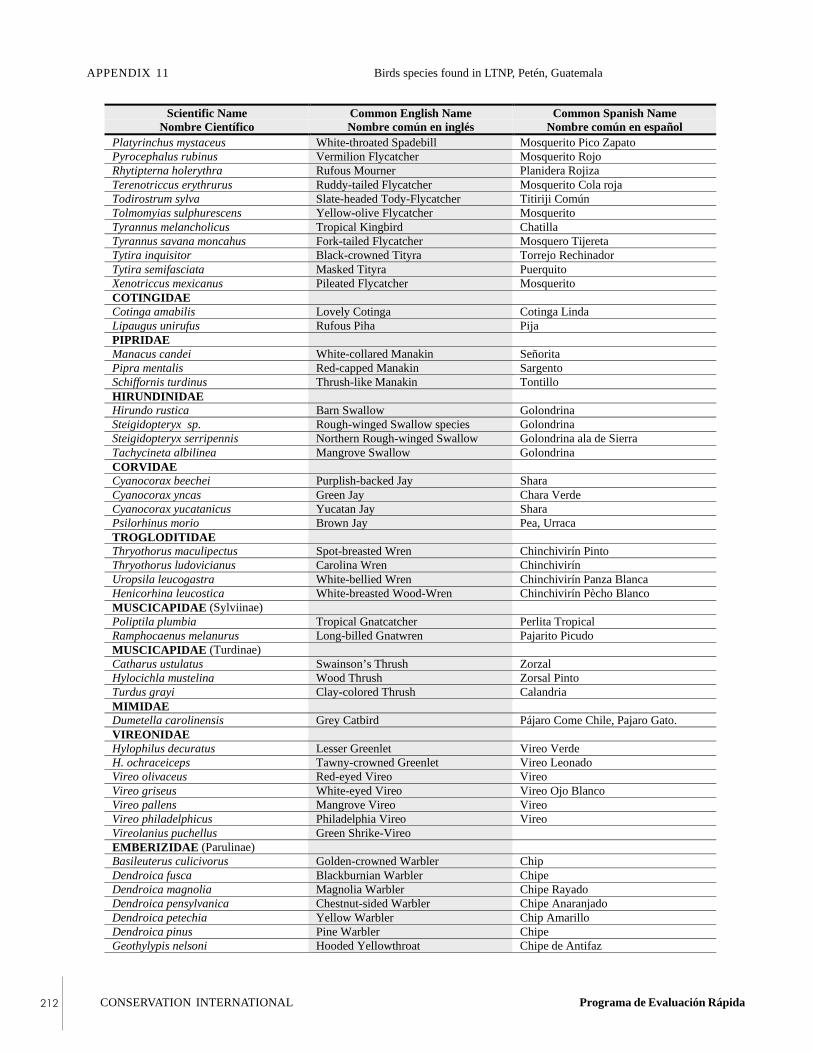
CONSERVATION INTERNATIONAL Programa de Evaluación Rápida���
Scientific NameNombre Científico
Common English NameNombre común en inglés
Common Spanish NameNombre común en español
Platyrinchus mystaceus White-throated Spadebill Mosquerito Pico ZapatoPyrocephalus rubinus Vermilion Flycatcher Mosquerito RojoRhytipterna holerythra Rufous Mourner Planidera RojizaTerenotriccus erythrurus Ruddy-tailed Flycatcher Mosquerito Cola rojaTodirostrum sylva Slate-headed Tody-Flycatcher Titiriji ComúnTolmomyias sulphurescens Yellow-olive Flycatcher MosqueritoTyrannus melancholicus Tropical Kingbird ChatillaTyrannus savana moncahus Fork-tailed Flycatcher Mosquero TijeretaTytira inquisitor Black-crowned Tityra Torrejo RechinadorTytira semifasciata Masked Tityra PuerquitoXenotriccus mexicanus Pileated Flycatcher MosqueritoCOTINGIDAECotinga amabilis Lovely Cotinga Cotinga LindaLipaugus unirufus Rufous Piha PijaPIPRIDAEManacus candei White-collared Manakin SeñoritaPipra mentalis Red-capped Manakin SargentoSchiffornis turdinus Thrush-like Manakin TontilloHIRUNDINIDAEHirundo rustica Barn Swallow GolondrinaSteigidopteryx sp. Rough-winged Swallow species GolondrinaSteigidopteryx serripennis Northern Rough-winged Swallow Golondrina ala de SierraTachycineta albilinea Mangrove Swallow GolondrinaCORVIDAECyanocorax beechei Purplish-backed Jay SharaCyanocorax yncas Green Jay Chara VerdeCyanocorax yucatanicus Yucatan Jay SharaPsilorhinus morio Brown Jay Pea, UrracaTROGLODITIDAEThryothorus maculipectus Spot-breasted Wren Chinchivirín PintoThryothorus ludovicianus Carolina Wren ChinchivirínUropsila leucogastra White-bellied Wren Chinchivirín Panza BlancaHenicorhina leucostica White-breasted Wood-Wren Chinchivirín Pècho BlancoMUSCICAPIDAE (Sylviinae)Poliptila plumbia Tropical Gnatcatcher Perlita TropicalRamphocaenus melanurus Long-billed Gnatwren Pajarito PicudoMUSCICAPIDAE (Turdinae)Catharus ustulatus Swainson’s Thrush ZorzalHylocichla mustelina Wood Thrush Zorsal PintoTurdus grayi Clay-colored Thrush CalandriaMIMIDAEDumetella carolinensis Grey Catbird Pájaro Come Chile, Pajaro Gato.VIREONIDAEHylophilus decuratus Lesser Greenlet Vireo VerdeH. ochraceiceps Tawny-crowned Greenlet Vireo LeonadoVireo olivaceus Red-eyed Vireo VireoVireo griseus White-eyed Vireo Vireo Ojo BlancoVireo pallens Mangrove Vireo VireoVireo philadelphicus Philadelphia Vireo VireoVireolanius puchellus Green Shrike-VireoEMBERIZIDAE (Parulinae)Basileuterus culicivorus Golden-crowned Warbler ChipDendroica fusca Blackburnian Warbler ChipeDendroica magnolia Magnolia Warbler Chipe RayadoDendroica pensylvanica Chestnut-sided Warbler Chipe AnaranjadoDendroica petechia Yellow Warbler Chip AmarilloDendroica pinus Pine Warbler ChipeGeothylypis nelsoni Hooded Yellowthroat Chipe de Antifaz
APPENDIX 11 Birds species found in LTNP, Petén, Guatemala

�������������� ������������� Octubro 2000 ���
Scientific NameNombre Científico
Common English NameNombre común en inglés
Common Spanish NameNombre común en español
Geothylypis poliocephala Grey-crowned Yellowthroat idemGeothylypis trichas Common Yellowthroat Chip AntifacitoGranatellus sallaei Grey-throated Chat GranatelloHelmitheros swaisonii Swainson’s Warbler ChipeH. vermivorus Worm-eating Warbler Chipe come GusanosIctera virens Yellow-breasted Chat BuscabrenaMniotilita varia Black-and-White Warbler Chiclerito RayadoOporornis formosus Kentucky Warbler Chipe PatuditoOporornis philadelphia Mourning WarblerOporornis tolmei MacGillivray’s Warbler ChipeParula americana Northern Parula ChipProtonotaria citrea Prothonotary Warbler Chip AnaranjadoSeiurus aurocapillus Ovenbird PizpitaS. novebaracensis Northern Waterthrush ChipSetophaga ruticilla American Redstart Rey ChipeVermivora chrysoptera Golden-winged Warbler ChipVermivora peregrina Tennessee Warbler ChipeWilsonia citrina Hooded Warbler ChipeWilsonia pusilla Wilson’s Warbler Chipe Gorra Negra(Coerebinae)Coereba faveola* Bananaquit Siquita*(Thraupinae)Cyanerpes cyaneus Red-legged Honeycreeper Mielero Patas RojasE. affinis Scrub Euphonia CalandritaEucometis penicillata Grey-headed Tanager Hormiguero Cabeza GrisEuphonia gouldi Olive-backed Euphonia Calandrita VerdeEuphonia hirundinaceae Yellow-throated Euphonia CalandritaHabia fuscicauda Red-throated Ant-Tanager Hormiguero RojoHabia rubica Red-crowned Ant-Tanager Hormiguero RojoPheucticus ludovicianus* Western Tanager TangaraPiranga rubra Summer Tanager Quitrique ColoradoRhampocelus passerinii* Scarlet-rumped Tanager Terciopelo*Tangara larvata Golden-hooded Tanager Quitrique CaretoThraupis abbas Yellow-winged Tanager CarboneroT. episcopus Blue-grey Tanager Pito(Cardinalinae)Cardinalis cardinalis Northern Cardinal CardenalCaryothraustes poliogaster Black-faced Grosbeak Piquigrueso EnmascaradoCyanocompsa cyanoides Blue-black Grosbeak Pico grueso AzulCyanocompsa parellina Blue Bunting Ruiz AzulGuiraca caerulea Blue Grosbeak Pico Grueso AzulPasserina ciris Painted Bunting Colorín Siete ColoresPasserina cyanea Indigo Bunting Colorín AzulSaltator atriceps Black-headed Saltator Chinchigorrión Cabeza NegraSaltator coerulescens Greyish Saltator ChinchigorriónSaltator maximus Buff-throated Saltator Chinchigorrión(Emberizinae)Arremonops aurantirostris Orange-billed Sparrow Pico de OroArremonops chloronotus Green-backed Sparrow TaleroArremonops rufivigatus Olive Sparrow Gorrion AceitunadoSporophila minuta Ruddy-breasted Seedeater JaulinS. torqueola White-collared Seedeater Jaulín de CollarVolantina jacarina Blue-black Grassquit Jaulín Azulado(Icterinae)Agelaius phoeniceus Red-winged Blackbird Tordo SargentoAmblycercus holosericeus Yellow-billed Cacique Zanate Pico AmarilloDives dives Melodious Blackbird Zanate CantorIcterus chrysater Yellow-backed Oriole Chorcha
Especies de aves encontradas en el PNLT, Petén, Guatemala APENDICE 11

CONSERVATION INTERNATIONAL Programa de Evaluación Rápida���
Scientific NameNombre Científico
Common English NameNombre común en inglés
Common Spanish NameNombre común en español
Icterus cucullatus Hooded Oriole ChorchaIcterus dominicensis Black-cowled Oriole Chorcha, Bolsero Capa NegraIcterus galbula Baltimore Oriole ChorchaIcterus gradacauda Audubon’s Oriole ChorchaIcterus mesomelas Yellow-tailed Oriole ChorchaIcterus spurius Orchard Oriole ChorchaMolothrus aeneus Bronzed Cowbird Tordo Ojo RojoOryziborus funereus Thick-billed SeedfinchPsarocolius montezuma Montezuma’s Oropendola OropéndolaQuiscalus mexicanus Great-tailed Grackle Clarinero
APPENDIX 11 Birds species found in LTNP, Guatemala

�������������� ������������� Octubro 2000 ���
Amphibian and reptile species of Laguna del Tigre National APPENDIX 12Park, Petén, Guatemala
Especies de anfibios y reptiles del Parque Nacional Laguna APENDICE 12del Tigre, Petén, Guatemala
Francisco Castañeda Moya, Oscar Lara, and Alejandro Queral-Regil
See Appendices 1 and 2 for descriptions of sampling points.Ver Apéndices 1 y 2 para descripciones del lugar de muestreo.
FAMILY/FAMILIASpecies/Especies
SPT1:Pato 1
SPT5:Río
Sacluc
ET2:Saraguate
ET3:Icaco
Laguna Florde Luna*
RíoChocop*
Lagoonsalong Xan
roadBUFONIDAEBufo marinus X+
Bufo valliceps X* X X X*MICROHYLIDAEGastrophryne elegans X X X*HYLIDAEAgalichnys callidryas X* XHyla ebracatta X*Hyla microcephala X X X X* X*Hyla picta X X X X X* X*Phrynohyas venulosa X X X*Scinax staufferi X X X X*Smilisca baudinii X X X*LEPTODACTYLIDAELeptodactylus melanonotus X X X X X* X*Leptodactylus labialis X X*RANIDAERana berlandieri X X X X X* X*Rana vaillanti X X X X*GEKKONIDAEColeonyx elegans X+
Sphaerodactylus glaucus X+ X+
TEIIDAEAmeiva undulata XCORYTOPHANIDAEBasiliscus vittatus X X XSCINCIDAEMabuya brachiopoda XPOLYCHROTIDAENorops bourgeaei X X XNorops uniformis XNorops sp3 XBOIDAEBoa constrictor X+
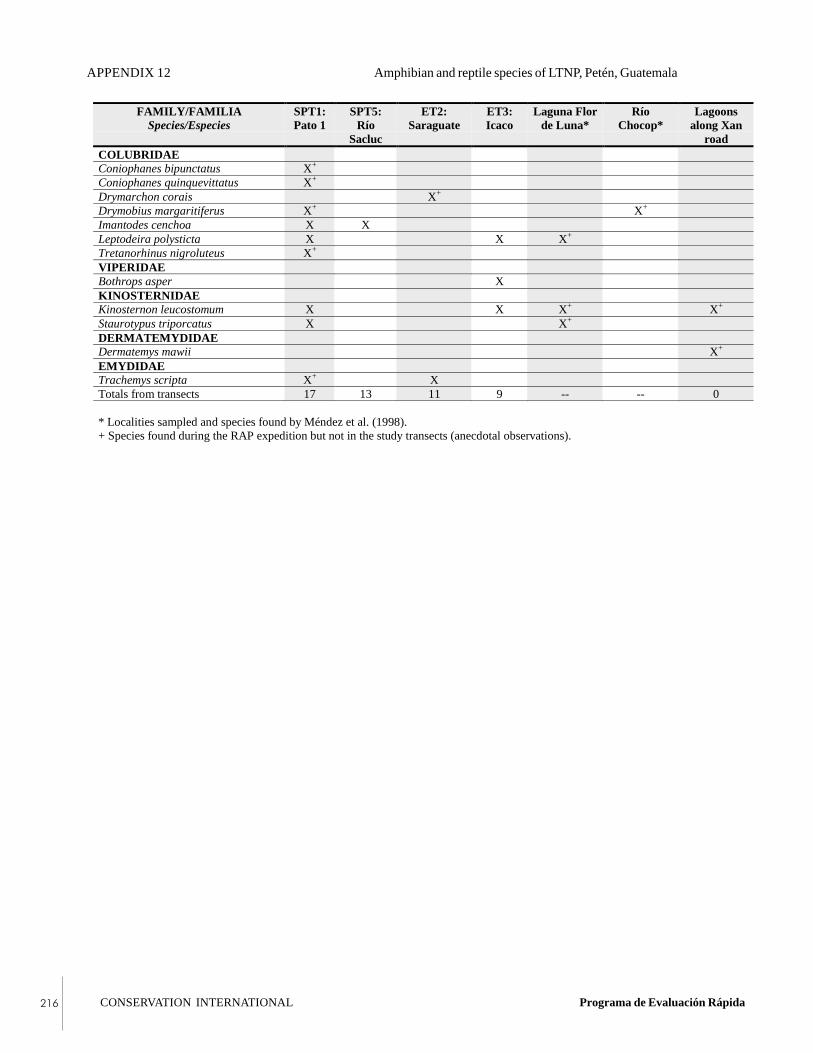
CONSERVATION INTERNATIONAL Programa de Evaluación Rápida���
FAMILY/FAMILIASpecies/Especies
SPT1:Pato 1
SPT5:Río
Sacluc
ET2:Saraguate
ET3:Icaco
Laguna Florde Luna*
RíoChocop*
Lagoonsalong Xan
roadCOLUBRIDAEConiophanes bipunctatus X+
Coniophanes quinquevittatus X+
Drymarchon corais X+
Drymobius margaritiferus X+ X+
Imantodes cenchoa X XLeptodeira polysticta X X X+
Tretanorhinus nigroluteus X+
VIPERIDAEBothrops asper XKINOSTERNIDAEKinosternon leucostomum X X X+ X+
Staurotypus triporcatus X X+
DERMATEMYDIDAEDermatemys mawii X+
EMYDIDAETrachemys scripta X+ XTotals from transects 17 13 11 9 -- -- 0
* Localities sampled and species found by Méndez et al. (1998).+ Species found during the RAP expedition but not in the study transects (anecdotal observations).
APPENDIX 12 Amphibian and reptile species of LTNP, Petén, Guatemala
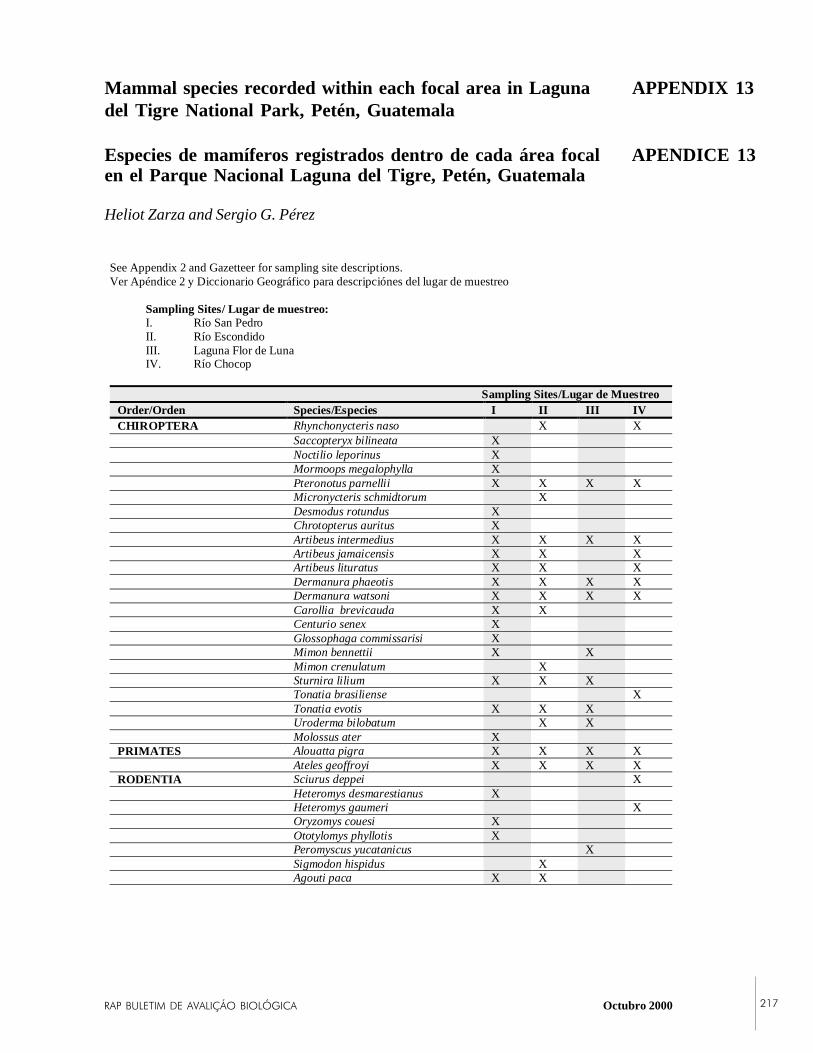
�������������� ������������� Octubro 2000 ���
See Appendix 2 and Gazetteer for sampling site descriptions.Ver Apéndice 2 y Diccionario Geográfico para descripciónes del lugar de muestreo
Sampling Sites/ Lugar de muestreo:I. Río San PedroII. Río Escondido III. Laguna Flor de Luna IV. Río Chocop
Sampling Sites/Lugar de MuestreoOrder/Orden Species/Especies I II III IVCHIROPTERA Rhynchonycteris naso X X
Saccopteryx bilineata XNoctilio leporinus XMormoops megalophylla XPteronotus parnellii X X X XMicronycteris schmidtorum XDesmodus rotundus XChrotopterus auritus XArtibeus intermedius X X X XArtibeus jamaicensis X X XArtibeus lituratus X X XDermanura phaeotis X X X XDermanura watsoni X X X XCarollia brevicauda X XCenturio senex XGlossophaga commissarisi XMimon bennettii X XMimon crenulatum XSturnira lilium X X XTonatia brasiliense XTonatia evotis X X XUroderma bilobatum X XMolossus ater X
PRIMATES Alouatta pigra X X X XAteles geoffroyi X X X X
RODENTIA Sciurus deppei XHeteromys desmarestianus XHeteromys gaumeri XOryzomys couesi XOtotylomys phyllotis XPeromyscus yucatanicus XSigmodon hispidus XAgouti paca X X
Mammal species recorded within each focal area in Laguna APPENDIX 13del Tigre National Park, Petén, Guatemala
Especies de mamíferos registrados dentro de cada área focal APENDICE 13en el Parque Nacional Laguna del Tigre, Petén, Guatemala
Heliot Zarza and Sergio G. Pérez

CONSERVATION INTERNATIONAL Programa de Evaluación Rápida���
Sampling Sites/Lugar de MuestreoOrder/Orden Species/Especies I II III IVCARNIVORA Potos flavus X X
Nasua narica X XProcyon lotor X
PERISSODACTYLA Tapirus bairdii XARTIODACTYLA Tayassu tajacu X X
Mazama americana XOdocoileus virginianus X X
APPENDIX 13 Mammal species recorded within each focal area in LTNP, Petén, Guatemala

�������������� ������������� Octubro 2000 ���
Ant (Hymenoptera: Formicidae) species recorded in Laguna APPENDIX 14de Tigre National Park, Petén, Guatemala
Especies de hormigas (Hymenoptera:Formicidae) registradas APENDICE 14en el Parque Nacional Laguna del Tigre, Petén, Guatemala
Brandon T. Bestelmeyer and Roy R. Snelling
Biogeographic range type:C= Central AmericaCn= northern Central AmericaCw= Central America and into United StatesM= Maya forestN= NeotropicalNw= Neotropical and into United States
SUBFAMILYSUB FAMILIA
GenusGénero
RangeTypeTipo de Rango
Functional Group/ HabitatGrupo Funcional/Hábitat
PONERINAE Belonopelta cf. deletrix Mann Cn Cr/TDiscothyrea cf. horni Menozzi ? Cr/Tor AEctatomma ruidum Roger N Op/TEctatomma tuberculatum (Olivier) N Op/T, AGnamptogenys tornata (Roger) C Cr/THypoponera nitidula (Emery) Cn Cr/T, AHypoponera sp. A -- Cr/T, AHypoponera sp. B -- Cr/T, AOdontomachus bauri Emery N Sp/TOdontomachus brunneus Patton ? Sp/TOdontomachus minutus Emery N Sp/TOdontomachus yucatecus Brown M Sp/TPachycondyla apicalis (Latrielle) N Sp/T, APachycondyla harpax (Fabricius) Nw Sp/T, APachycondyla lineaticeps (Mayr) C Sp/T, APachycondyla stigma (Fabricius) N Sp/T, APachycondyla unidentata (Mayr) N Sp/T, APachycondyla villosa (Fabricius) Nw Sp/T, AThaumatomyrmex ferox Mann C Cr/T
Functional group:At= Attini, Cr= cryptic speciesDd= dominant dolichoderinesGm= generalized myrmicinesLg= legionary speciesOp= opportunistsSc= subordinate camponotiniSp= specialist predators
Habitat:A= ArborealT= Terrestrial
Tipos de áreas biográficas:C= América CentralCn= América Central septentrionalCw= América Central hacia Estados UnidosM= Bosque MayaN= NeotrópicoNw= Neotrópico hacia Estados Unidos
Grupo funcional:At= Attini, Cr= especies crípticasDd= Dolicoderinos dominantesGm= Myrmisinos generalizadosLg= Especies legionariasOp= OportunistasSc= Camponotini subordinadosSp= Depredadores especializados
Hábitat:A= ArbóreoT= Terrestre

CONSERVATION INTERNATIONAL Programa de Evaluación Rápida���
SUBFAMILYSUB FAMILIA
GenusGénero
RangeTypeTipo de Rango
Functional Group/ HabitatGrupo Funcional/Hábitat
PSEUDOMYRMECINAE Pseudomyrmex boopis (Roger) N Sp?/APseudomyrmex elongatus (Mayr) N Sp?/APseudomyrmex ejectus (F. Smith) ? Sp?/APseudomyrmex ferrugineus (F. Smith) Cn Sp?/APseudomyrmex gracilis N Sp?/APseudomyrmex oculatus (F. Smith) ? Sp?/APseudomyrmex pepperi (Forel) Cn Sp?/APseudomyrmex PSW-13 ? Sp?/APseudomyrmex simplex (F. Smith) Nw Sp?/A
ECITONINAE Eciton burchelli (Westwood) N Lg/TEciton hamatum (Fabricius) N Lg/TLabidus c.f. coecus (Latrielle) N Lg/TLabidus praedator (F. Smith) N Lg/T
MYRMICINAE Acromyrmex octospinosus (Reich) N At/TApterostigma pilosum complex -- At/TAtta cephalotes (Linné) N At/TCephalotes basalis (F. Smith) Cn ?/ACephalotes biguttatus (Emery) Cn ?/ACephalotes cristatus (Emery) N ?/ACephalotes kukulcan (Snelling) ? ?/ACephalotes minutus (Fabricius) N ?/ACephalotes scutulatus (F. Smith) C ?/ACephalotes umbraculatus (Fabricius) N ?/ACrematogaster brevispinosus complex -- Gm/ACrematogaster sp. B -- Gm/ACrematogaster sp. C -- Gm/ACyphomyrmex minutus Mayr Nw At/ACyphomyrmex sp. A (new sp.?) -- At/?Hylomyrma dentiloba (Sanstchi) C ?Leptothorax sp. -- Cr/AMonomorium ebeninum Forel C Gm/TMonomorium floricola (Jerdon) N Gm/TNeostruma sp. -- Cr/TOctostruma balzani (Emery) N Cr/TPheidole fimbrata Roger N Gm, Cr/T, APheidole punctatissima Mayr C Gm, Cr/T, APheidole sp. A -- Gm, Cr/T, APheidole sp. B -- Gm, Cr/T, APheidole sp. C -- Gm, Cr/T, APheidole sp. D -- Gm, Cr/T, APheidole sp. E -- Gm, Cr/T, APheidole sp. F -- Gm, Cr/T, APheidole sp. H -- Gm, Cr/T, APheidole sp. I -- Gm, Cr/T, APheidole sp. J -- Gm, Cr/T, APheidole sp. K -- Gm, Cr/T, APheidole sp. L -- Gm, Cr/T, APheidole sp. M -- Gm, Cr/T, APheidole sp. N -- Gm, Cr/T, APheidole sp. O -- Gm, Cr/T, APheidole sp. P -- Gm, Cr/T, APheidole sp. Q -- Gm, Cr/T, APheidole sp. R -- Gm, Cr/T, APheidole sp. S -- Gm, Cr/T, ARogeria belti Mann C Cr/T
APPENDIX 14 Ant (Hymenoptera: Formicidae) species recorded in LTNP, Petén, Guatemala

�������������� ������������� Octubro 2000 ���
SUBFAMILYSUB FAMILIA
GenusGénero
RangeTypeTipo de Rango
Functional Group/ HabitatGrupo Funcional/ Hábitat
Rogeria cornuta Kugler Cn Cr/TSericomyrmex aztecus (Forel) M? At/TSmithistruma margaritae (Forel) Nw Cr/TSolenopsis geminata (Fabricius) Nw Gm/TSolenopsis succinea Emery C? Gm, Cr/T, ASolenopsis sp. A -- Gm, Cr/T, ASolenopsis sp. B -- Gm, Cr/T, ASolenopsis sp. C -- Gm, Cr/T, ASolenopsis sp. D -- Gm, Cr/T, AStrumigenys elongata Roger N Cr/TTrachymyrmex saussurei (Forel) Cn At/TTrachymyrmex sp. A -- At/TTrachymyrmex sp. B -- At/TWasmannia auropunctata (Roger) Nw Cr/T,AXenomyrmex skwarrae Wheeler M ?
DOLICHODERINAE Azteca forelii Emery Cn Dd/AAzteca instabilis complex -- Dd/AAzteca sp. A -- Dd/AAzteca sp. B -- Dd/AAzteca sp. C -- Dd/ADolichoderus bispinosus (Olivier) N Dd/ADolichoderus diversus Emery C? Dd/ADorymyrmex sp. -- Op/TForelius sp. -- Hc/TTapinoma inrectum Forel C Op?/TTapinoma ramulorum Emery C? Op?/T
FORMICINAE Brachymyrmex sp. -- ?Camponotus atriceps (F. Smith) N ?/TCamponotus auricomus Roger C Sc/T,ACamponotus novogranadensis Mayr N Sc/T,ACamponotus planatus Roger Cw Sc/T,ACamponotus rectangularis Emery N Sc/T,ACamponotus sericeiventris (Guerin) N Sc/T,ACamponotus sp. A -- Sc/T,AParatrechina terricola (Buckley)? Nw Op/TParatrechina sp. A -- Op/TParatrechina sp. B -- Op/T
Especies de hormigas (Hymenoptera:Formicidae) registradas en el PNLT, Petén, Guatemala APPENDIX 14