rangeland precipitation monitoring workshop report 15 june ... · michael a. crimmins, mitchel p....
TRANSCRIPT
1
Rangeland Precipitation Monitoring Workshop Report
15 June 2017; Miami, AZ
Organizers
Michael A. Crimmins, Mitchel P. McClaran, Julie Brugger
Supported by Western Extension Risk Management Education Grant: Reducing livestock
productions and legal risks from increased climate variability by co-developing tools for
ranch-scale drought detection
Prepared 15 August 2017
Executive Summary
This report documents the objectives, activities, and outcomes of the Rangeland
Precipitation Monitoring Workshop, the culminating workshop of the project, Reducing livestock
productions and legal risks from increased climate variability by co-developing tools for ranch-
scale drought detection, funded by the Western Extension Risk Management Education
Program. This workshop build on the activities and outcomes of two previous workshops where
ranchers with grazing permits and US Forest Service range managers (the Working Group) co-
developed a design for a rugged rain gauge to be deployed in remote areas that makes collecting
precipitation information easier, faster, and more accurate, and a reporting and data-sharing web-
based application (myRAINgeLog.arizona.edu) to compare recorded precipitation values to
current estimates based on PRISM climate data and the estimated historic records using the
Standardized Precipitation Index (SPI). The objective of this workshop was to introduce these
ranch-scale drought detection tools to a wider audience. To that end, the Research Team
advertised the Workshop on the Gila County Cattle Growers website, the Arizona Section of the
Society for Range Management listserv, and extended individual invitations.
There were 36 participants in the Workshop in addition to the Team members. They
included Working Group members, additional ranchers with grazing permits on the TNF,
ranchers from other areas of Arizona, FS personnel new to the TNF, and Bureau of Land
Management and Natural Resources Conservation Service personnel. The Workshop provided
participants with: 1) a description of the co-development process; 2) background about the
standardized precipitation index (SPI); 3) the rationale for the design of the rain gauge and a
description of the construction process: and 4) a demonstration of the myRAINgeLog app. They
were also provided with: a rain gauge to take home and test, copies of the Do-it-yourself
construction guide: Rugged accumulation precipitation gauge for remote monitoring and the
Range Gauges for Range Management: Precipitation Monitoring Best Practices Guide, and the
URL for myRAINgeLog.
Attendance and evaluations indicate that the Workshop met its intended objectives. All
participants found the Workshop valuable and a large majority had a favorable opinion of the
ranch-scale drought detection tools and said they were likely to use them. They also
overwhelmingly agreed that the Workshop helped them to think differently about how to manage
their risk from drought.

2
I. Introduction
Increased climate variability will increase drought severity and frequency on western US
rangelands. Drought creates both production and legal risks because ranches typically rely on
federal lands for 50-90% of their forage, and policies for these 200M acres of federal rangeland
dictate responses regarding herd reduction, reduced access to forage, and a lengthy approval
process to change infrastructure and management. In Arizona, the patchy spatial distribution of
drought means that some ranches experience drought while others do not (McClaran and Wei
2014). Because the spatial resolution of drought information is too coarse to represent this
difference among ranches, the objective of the Ranch-Scale Drought Detection Project was to co-
develop, with ranchers and federal land managers, tools to more precisely detect drought at the
ranch scale and training material that encourages and supports ranchers and federal land
managers to collect data at new sites throughout the region to increase the level of precipitation
monitoring. The goal of the project is to help ranchers and federal land managers reduce the
production and legal risk of drought and increase resilience to drought. We consider the tools
and training material elements of a ranch-scale drought early warning system.
The tools co-developed include a design for a rugged
rain gauge to be deployed in remote areas that makes
collecting precipitation information easier, faster, and
more accurate, and a reporting and data-sharing web-
based application (myRAINgeLog.arizona.edu) to
compare recorded precipitation values to current
estimates based on PRISM climate data and the
estimated historic records using the Standardized
Precipitation Index (SPI). Outputs also include a Rain
Gauge Construction Guide (Appendix A) and a
Precipitation Monitoring Best Practices Guide (Appendix B)
The Ranch-Scale Drought Detection Project builds on our ongoing (2014-2017) National
Oceanic and Atmospheric Administration (NOAA) Sectoral Applications Research Program
(SARP) funded project, “Using a co-development process to improve, integrate and encourage
use of drought information and adaptive management of livestock grazing on National Forests”
(the Co-development Project). In that project, ranchers and FS co-developed solutions to
increase preparedness for drought. We use the SPI to represent the severity of drought because
the drought policy of FS Region 3 (Arizona and New Mexico) uses SPI as a trigger: “In the
Southwestern Region, anytime the SPI reaches a value of minus 1.00 or less for the preceding 12
month period, grazing allotments should be evaluated for existing drought conditions” (R3
Manual Supplement to 2209.13.19.1). Participants in that project gained a greater understanding
of the spatial variation of SPI among ranches, the value of detecting drought with SPI at the
ranch scale with the installation of rain gauges, and the need for long-term measurements at each
gauge to calculate the SPI for current conditions. This quote from an evaluation form following
our second workshop (August 2015) illustrates their interest in ranch-scale precipitation
monitoring: “Set up ranchers with rain gauges in many pastures and set them up to obtain SPI
measures and extrapolations on their allotments.”

3
II. Outline of the project
The project was organized as three workshops in which the University of Arizona project team
(the Team) and ranchers with grazing permits and U.S. Forest Service (FS) range managers on
the Tonto National Forest (TNF) in Arizona participated. Figure 1 shows the organization with
initial projected workshop dates. Workshop agendas can be found in Appendix C. The first two
workshops were discussion oriented, in which participants, known as the Precipitation
Monitoring Working Group, discussed ideas for the design of rain gauges, precipitation
monitoring best practices, and a recording and reporting application for precipitation data, tested
them out in practice, and iteratively improved the designs. The Team then incorporated these
ideas into building an actual gauge and application and a best practices guide which would be
presented to a larger audience in Workshop III.
Figure 1: Organization of the Ranch-Scale Drought Detection Project
a. Pre-workshop consultation
The workshops were preceded by consultation with an Advisory Group of three ranchers who
were already participating in the Co-development Project. Consultation began in April 2016 and
resulted in: 1) an initial design for a rain gauge; 2) a request for guidance on flexible
precipitation monitoring approaches for gauges that may be read infrequently, the cost-benefit of
different approaches, and how to select the best approach for an operation based on decision
making needs; 3) a request for online tools designed to support a spectrum of different
precipitation monitoring approaches, and; 4) suggestions for whom to invite to the first
workshop. These suggestions were incorporated into a prototype rain gauge and a prototype
“Precipitation Logbook Generator” application to be distributed at Workshop I.
4
b. Workshop I
The first workshop was held June 30, 2016 in Payson, AZ. A total of 19 participants in addition
to the Team included ranchers and FS personnel who were participating in the Drought Project,
FS personnel new to the TNF, a Gila County Extension Agent, and Arizona Game and Fish
Department personnel.
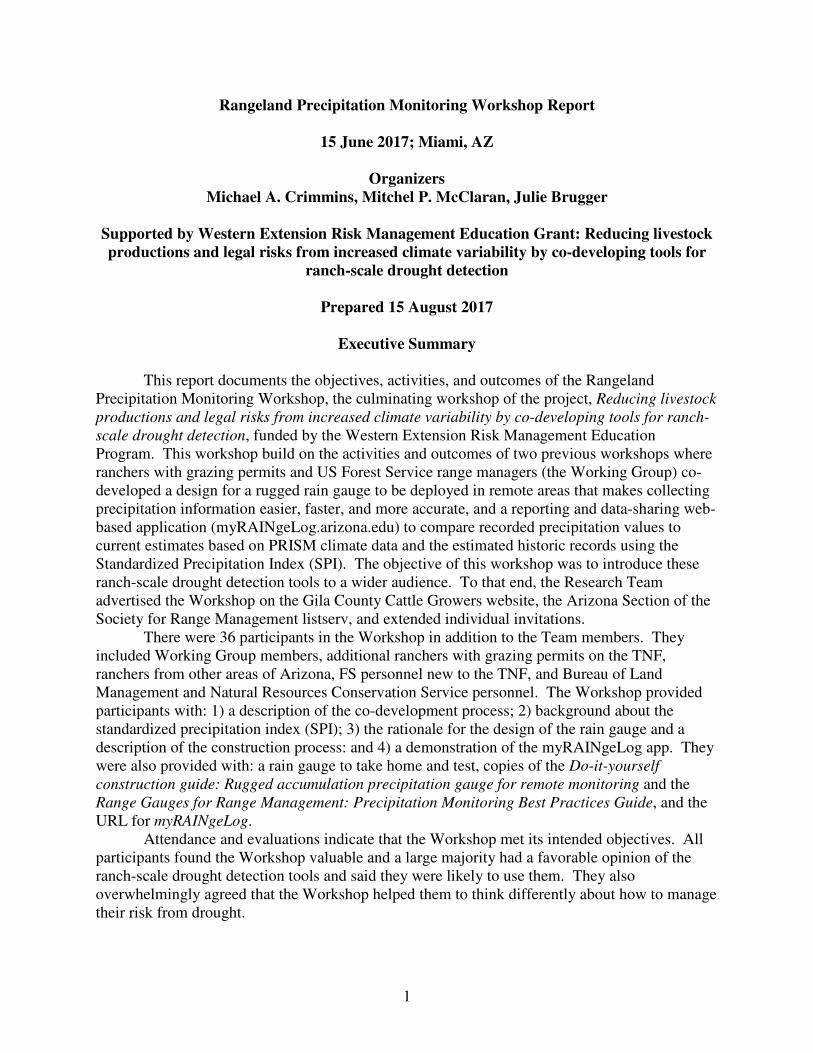
Mike Crimmins opened the workshop by describing the purpose and organization of the project
and the Working Group’s role as co-developers. Next he discussed the calculation and use of
drought indices and the advantages and disadvantages of different types of rain gauges. To seed
the discussion of best practices for precipitation monitoring, he asked participants to describe
what they are currently doing. He then displayed Figure 2, which asks them to consider where
the optimum cost-benefit, or “sweet spot,” is between density of gauges and frequency of
monitoring for their operation based on their decision making needs.
Figure 2: Schema for considering how many gauges to have and how often to read them.
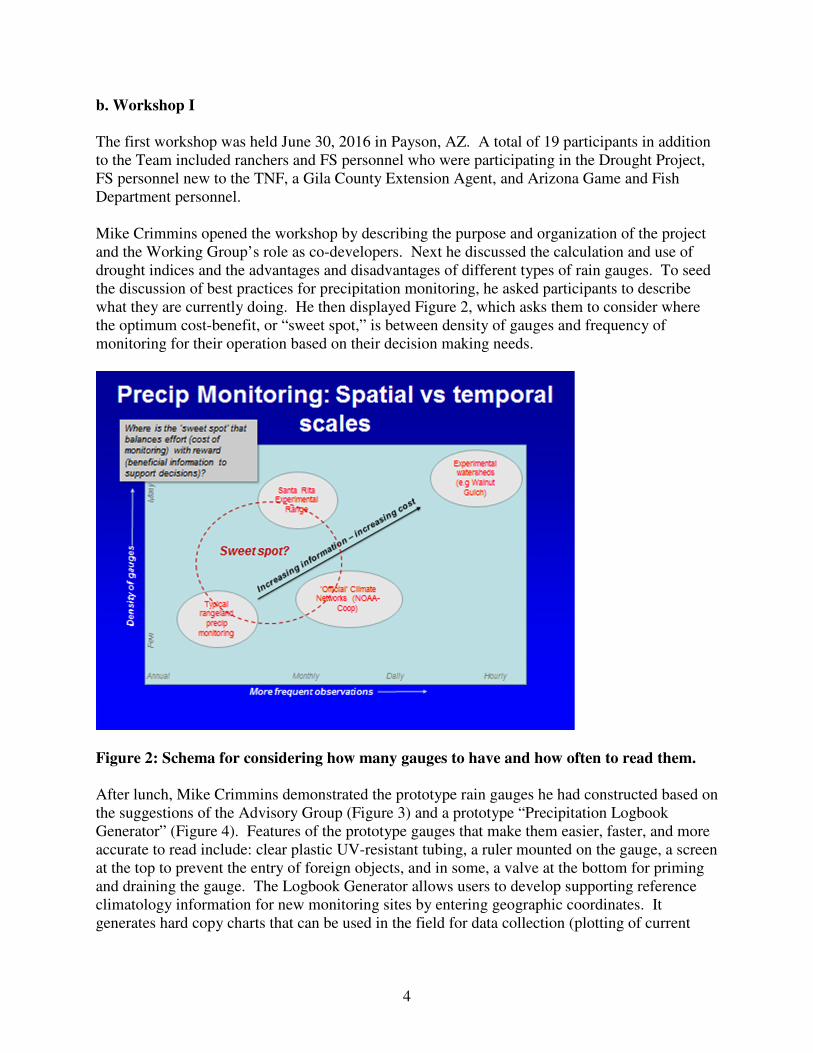
After lunch, Mike Crimmins demonstrated the prototype rain gauges he had constructed based on
the suggestions of the Advisory Group (Figure 3) and a prototype “Precipitation Logbook
Generator” (Figure 4). Features of the prototype gauges that make them easier, faster, and more
accurate to read include: clear plastic UV-resistant tubing, a ruler mounted on the gauge, a screen
at the top to prevent the entry of foreign objects, and in some, a valve at the bottom for priming
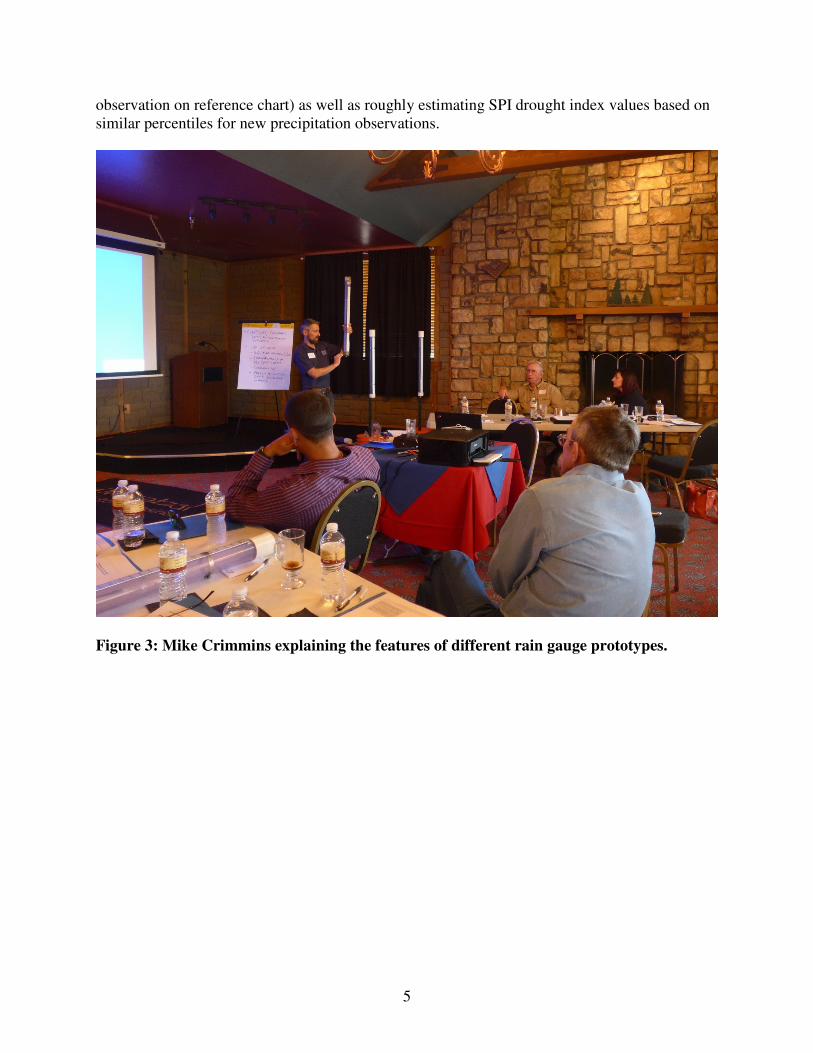
and draining the gauge. The Logbook Generator allows users to develop supporting reference
climatology information for new monitoring sites by entering geographic coordinates. It
generates hard copy charts that can be used in the field for data collection (plotting of current
5
observation on reference chart) as well as roughly estimating SPI drought index values based on
similar percentiles for new precipitation observations.
Figure 3: Mike Crimmins explaining the features of different rain gauge prototypes.
6
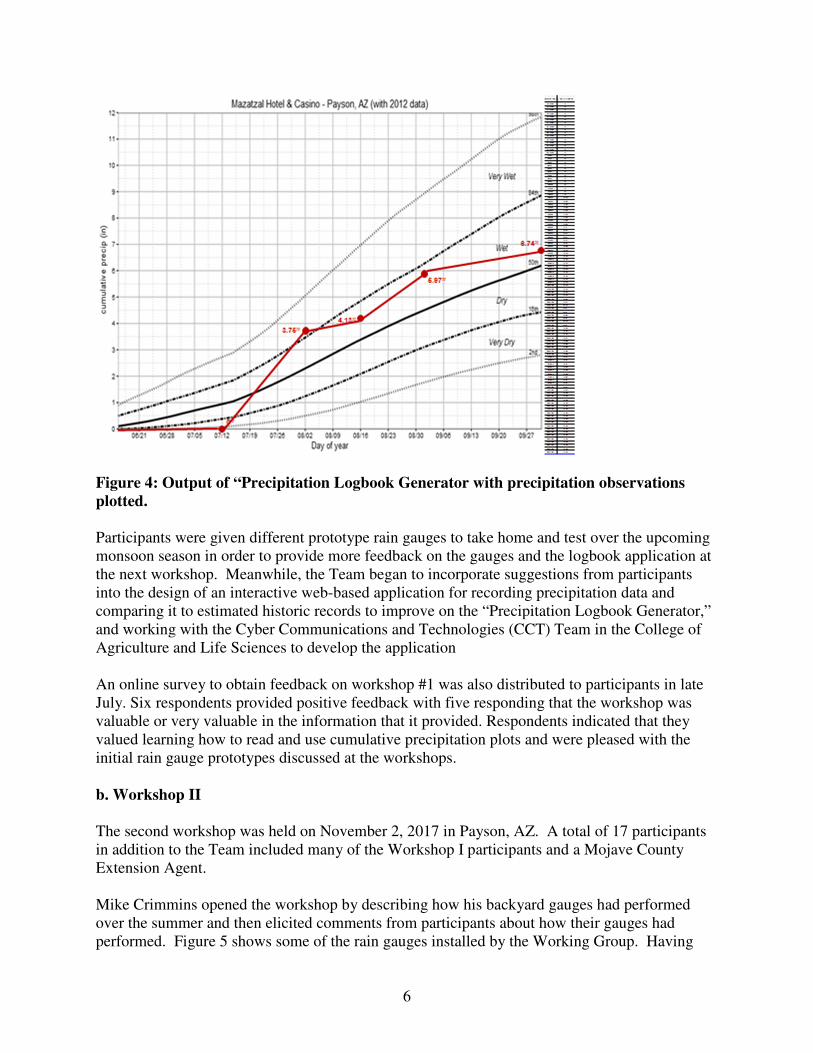
Figure 4: Output of “Precipitation Logbook Generator with precipitation observations
plotted.
Participants were given different prototype rain gauges to take home and test over the upcoming
monsoon season in order to provide more feedback on the gauges and the logbook application at
the next workshop. Meanwhile, the Team began to incorporate suggestions from participants
into the design of an interactive web-based application for recording precipitation data and
comparing it to estimated historic records to improve on the “Precipitation Logbook Generator,”
and working with the Cyber Communications and Technologies (CCT) Team in the College of
Agriculture and Life Sciences to develop the application
An online survey to obtain feedback on workshop #1 was also distributed to participants in late
July. Six respondents provided positive feedback with five responding that the workshop was
valuable or very valuable in the information that it provided. Respondents indicated that they
valued learning how to read and use cumulative precipitation plots and were pleased with the
initial rain gauge prototypes discussed at the workshops.
b. Workshop II
The second workshop was held on November 2, 2017 in Payson, AZ. A total of 17 participants
in addition to the Team included many of the Workshop I participants and a Mojave County
Extension Agent.
Mike Crimmins opened the workshop by describing how his backyard gauges had performed
over the summer and then elicited comments from participants about how their gauges had
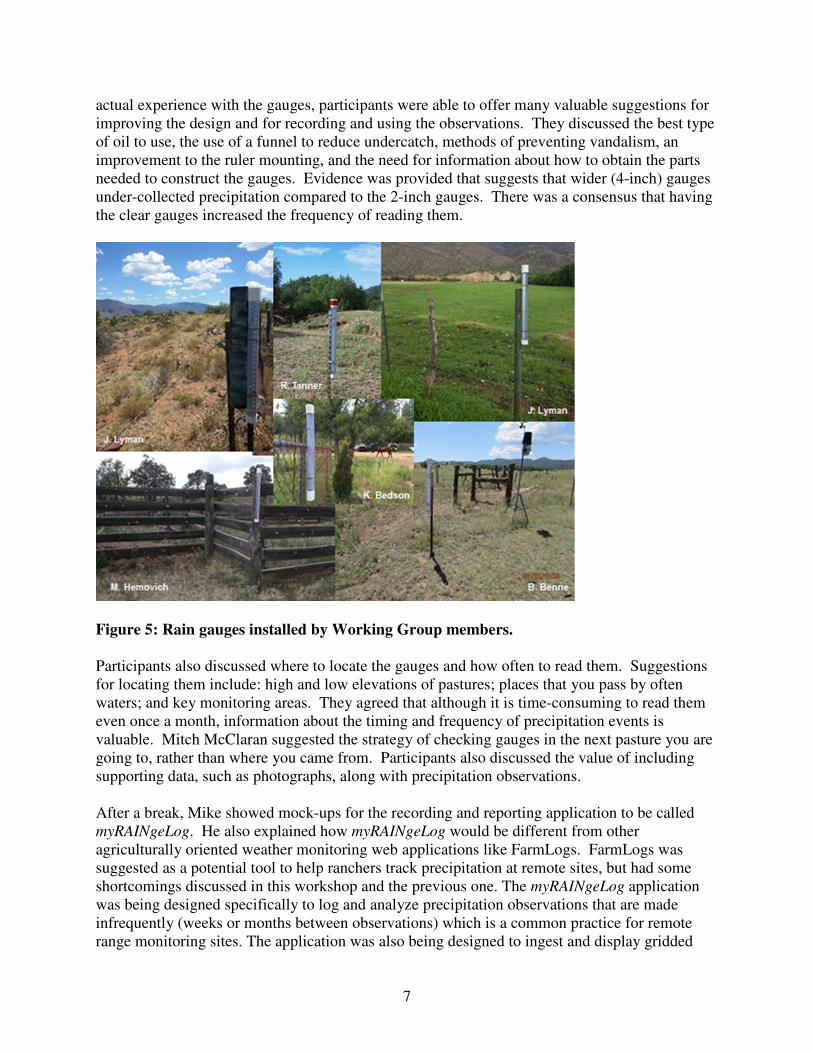
performed. Figure 5 shows some of the rain gauges installed by the Working Group. Having
7
actual experience with the gauges, participants were able to offer many valuable suggestions for
improving the design and for recording and using the observations. They discussed the best type
of oil to use, the use of a funnel to reduce undercatch, methods of preventing vandalism, an
improvement to the ruler mounting, and the need for information about how to obtain the parts
needed to construct the gauges. Evidence was provided that suggests that wider (4-inch) gauges
under-collected precipitation compared to the 2-inch gauges. There was a consensus that having
the clear gauges increased the frequency of reading them.
Figure 5: Rain gauges installed by Working Group members.
Participants also discussed where to locate the gauges and how often to read them. Suggestions
for locating them include: high and low elevations of pastures; places that you pass by often
waters; and key monitoring areas. They agreed that although it is time-consuming to read them
even once a month, information about the timing and frequency of precipitation events is
valuable. Mitch McClaran suggested the strategy of checking gauges in the next pasture you are
going to, rather than where you came from. Participants also discussed the value of including
supporting data, such as photographs, along with precipitation observations.
After a break, Mike showed mock-ups for the recording and reporting application to be called
myRAINgeLog. He also explained how myRAINgeLog would be different from other
agriculturally oriented weather monitoring web applications like FarmLogs. FarmLogs was
suggested as a potential tool to help ranchers track precipitation at remote sites, but had some
shortcomings discussed in this workshop and the previous one. The myRAINgeLog application
was being designed specifically to log and analyze precipitation observations that are made
infrequently (weeks or months between observations) which is a common practice for remote
range monitoring sites. The application was also being designed to ingest and display gridded

8
precipitation estimates, much like FarmLogs, but is using a different product (PRISM)
specifically designed to capture topo-climatic variability that is endemic to the western U.S. .
The PRISM dataset used in myRAINgeLog is better at taking elevation into account when
interpolating data from surrounding official observation sites.
Participants were very enthusiastic about the app and suggestions for improvements flowed
freely. One of the ranchers stated: “I see this app, you could just keep adding things to it, and
really do something that you could use to manage a western ranch.” Some of participants’
suggestions included:
1. Ability to use some features of a mobile app without cell service, such as entering data.
2. Multiple accounts/user and/or users/account.
3. Using GPS to locate gauges and notify of proximity.
4. Using a map layer to display location of gauges.
5. Alerts when rain has been recorded near gauge location.
The discussion of desired features for myRAINgeLog continued after lunch and was followed by
a discussion of best practices. There was a consensus that precipitation monitoring data is not
for making hard and fast management decisions, but just one tool in the toolbox of things that
can provide some situational awareness of what’s going on. As one rancher put it: “And so as
we move forward I think we need to make it very clear that this is simply one tool, or this is
simply one metric that get can used to try to paint the picture.” Mike Crimmins summarized the
discussion this way: “It’s not about trigger points and decisions, numbers don’t equal direct
actions, but that this is a tool and this is about decision support, is maybe the way to think about
it, that it’s another piece of information to bring to it.” OR As The workshop concluded with a
discussion of how to encourage the adoption of best practices among a broader group of ranchers
and land managers and how to organize the final workshop, whom to invite and how to get the
word out, and how it should be organized.
Workshop evaluations (n=14) indicated that all respondents found the two Workshops valuable,
all but one found it extremely valuable. For many the most valuable aspect was the shared
learning and relationship building between ranchers and FS, described as “Gets everybody on
same page,” and “Helped bridge gaps between FS and permittees. Put us all on the same team.”
All but one respondent agreed that the Workshops increased their understanding of the
calculation and use of drought indices, best practices for installing ranch-scale precipitation
monitoring, how precipitation data can be used for livestock management decision making, and
that the information from the Workshops helped them manage their risk from drought. All but
two agreed that the Workshop increased their understanding of how to analyze and interpret
precipitation data. All but one agreed that the information and tools generated in the Workshops
would be valuable to other ranchers and land managers.
The Team incorporated suggestions for improving the rain gauge design into building new
gauges, a Construction Guide for the gauges, and a Best Practices Guide for the final workshop.
They continued to work with the CCT team to incorporate desired features in myRAINgeLog
with the goal of having a beta ready for the Workshop III. In order to share information learned
and tools developed with a broader group of ranchers and land managers in Workshop III, the
9
Team advertised the Workshop on the Gila County Cattle Growers website, the Arizona Section
of the Society for Range Management listserv, and extended individual invitations.
III. Workshop III Summary
Workshop III took place on June 15, 2017 in Miami, AZ. There were 36 participants in addition
to the Team members. They included Working Group members, additional ranchers with
grazing permits on the TNF, ranchers from other areas of Arizona, FS personnel new to the TNF,
and Bureau of Land Management and Natural Resources Conservation Service personnel.
a. Introduction
Mitch McClaran opened the Workshop by explaining the project to the new audience and
introducing them to SPI basics that are crucial for understanding how to use the precipitation
monitoring tools that would be introduced. He first reminded them how SPI is used in FS
Region 3 as a drought indicator. SPI has the advantage of providing a “standardized” indicator
that is adjusted to the magnitude of precipitation expected in an area (Quiring 2008). Therefore,
an SPI value representing high (relatively wet) elevations expresses the same drought severity in
low (relatively dry) elevations. In addition, SPI values represent the likelihood of occurrence and
therefore provide a measure of threat frequency (Table 1). For example, an SPI value of -1 or
less occurs about 16% of the time in a long term record (~1 in 6 years or 16 times in 100 years),
and a value of -2 or less occurs about 2.3% of the time (~1 in 43 years or 2.3 times in 100 years).
Finally, SPI values can be estimated for any specific location, and therefore the measurements
collected from a specific rain gauge or from a large region will represent that location.
Table 1. Probability of Occurrence for Standardized
Precipitation Index (SPI) Values
SPI Value Probability Category
> 2.0 2.3% Extremely Wet
1.5 to 1.9 4.4% Very Wet
1.0 to 1.4 9.2% Moderately Wet
-0.9 to 0.9 68.2% Near Normal
-1.0 to -1.4 9.2% Moderately Dry
-1.5 to -1.9 4.4% Very Dry
< -2.0 2.3% Extremely Dry
The 114-year record for low, middle and high elevation locations (Figure 6) in Tonto National
Forest illustrates how SPI provides a “standardized” indictor that is not affected by the
magnitude of precipitation expected in an area (Quiring 2008). In this example, the SPI values
(12 months from Jan-Dec) for the three elevations behave very similarly through last 100 years.
In keeping with the probabilities of occurrence (Table 1), SPI -2 values occurred 4 times in the
114-year record (3.5%), and values less than SPI -1 occurred 19 times (16.6%).

10
It is also possible to distinguish winter (October through May) and summer (June through
September) drought conditions rather than combine them in to a 12-month period. Figure 7
shows the relationship between SPI values and departures from average precipitation for summer
and winter seasons on Tonto National Forest for the previous 100 years. The comparison clearly
shows that summer (June through September) precipitation is much less variable across the 100
years than winter (October through May). Summer values ranged from ~3 to 12 inches, while
winter ranged from ~4 to 30 inches. That difference in variability directly translated into smaller
percentage of average winter precipitation (58% of average = 42% decrease from average) at SPI
-1 than the percentage of average summer (72% of average = 22% decrease from average). The
same was true for SPI -2, with only 34% of average for winter and 52% of average for summer.
Figure 6: Standardized precipitation index (12 month Jan-Dec) for three elevations in Tonto
National Forest from 1900 through 2014. Low elevation is < 4500 ft, mid elevation is 4500-5500 ft
and high elevation is > 5500 ft.

11
Average
Average
Summer
-1 SPI 72% of average
5.1 of 7.0”
-2 SPI 52% of average
3.5 of 7.0”
Winter
-1 SPI 58% of average
7.7 of 13.2”
-2 SPI 34% of average
4.5 of 13.2”
Figure 7. Distribution of summer and winter precipitation values for Tonto National Forest, 1915-
2014. Average (red) summer (7 inches, June-September) and winter (13.2 inches, October-May),
and corresponding SPI -1 (blue) and SPI -2 (green) values of precipitation, and the respective
percent of average for the two SPI values.
12
b. Best Practices
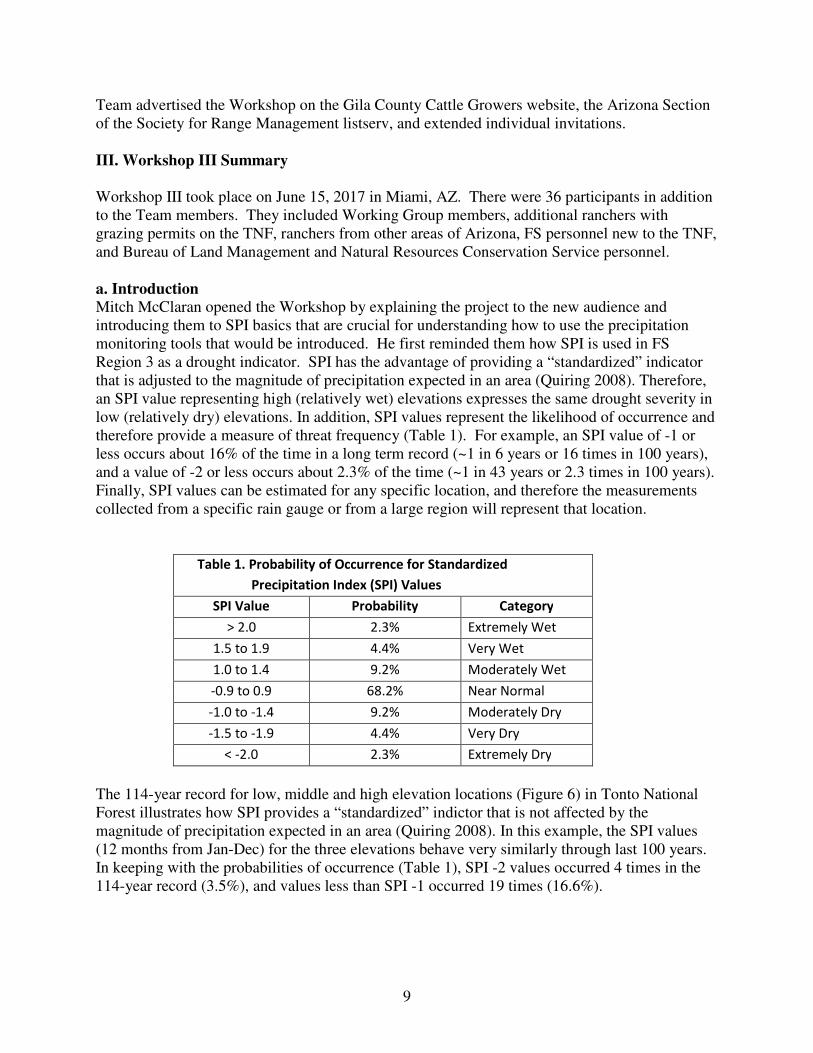
Mike Crimmins then described the problem the tools are addressing: lack of local-scale
precipitation data. Most official climate monitoring networks have high densities of
observations in and around urban area with many fewer observations in rural and remote
wilderness areas where public land grazing occurs. This means that regional drought monitoring
tools have greater uncertainty in these areas where range management decisions are being made.
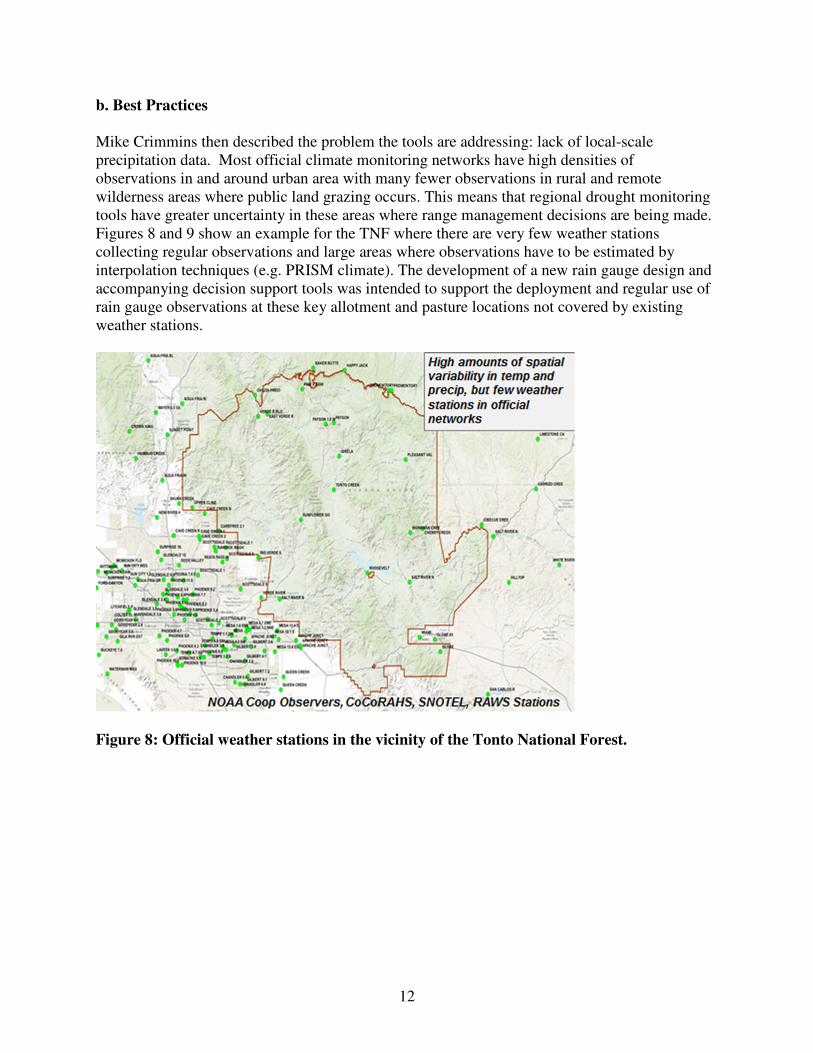
Figures 8 and 9 show an example for the TNF where there are very few weather stations
collecting regular observations and large areas where observations have to be estimated by
interpolation techniques (e.g. PRISM climate). The development of a new rain gauge design and
accompanying decision support tools was intended to support the deployment and regular use of
rain gauge observations at these key allotment and pasture locations not covered by existing
weather stations.
Figure 8: Official weather stations in the vicinity of the Tonto National Forest.
13
Figure 9: Gridded climate data for the vicinity of the Tonto National Forest.
The rugged PVC rain gauge
designed to capture cumulative
precipitation over long periods
is ideal for range management
applications and has long been
used by ranchers and land
managers to gather precipitation
data at key monitoring sites.
Crimmins reviewed the
rationale for the new rain gauge
design and how to construct
one. The innovation of using
clear PVC and adding an
emptying valve makes the
reading and maintenance of a
remote rain gauge even easier,
encouraging more frequent
readings over time. Details can
be found in the Do-it-yourself
construction guide: Rugged
accumulation precipitation
gauge for remote monitoring
(Appendix A).
14
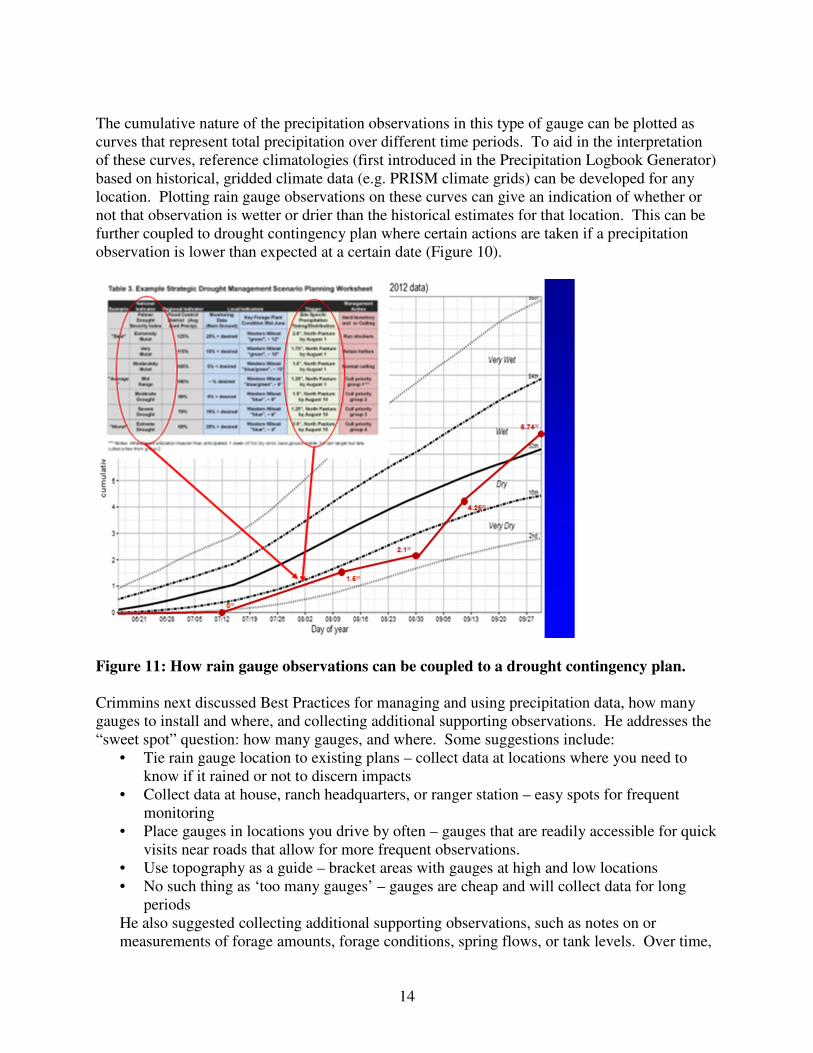
The cumulative nature of the precipitation observations in this type of gauge can be plotted as
curves that represent total precipitation over different time periods. To aid in the interpretation
of these curves, reference climatologies (first introduced in the Precipitation Logbook Generator)
based on historical, gridded climate data (e.g. PRISM climate grids) can be developed for any
location. Plotting rain gauge observations on these curves can give an indication of whether or
not that observation is wetter or drier than the historical estimates for that location. This can be
further coupled to drought contingency plan where certain actions are taken if a precipitation
observation is lower than expected at a certain date (Figure 10).
Figure 11: How rain gauge observations can be coupled to a drought contingency plan.
Crimmins next discussed Best Practices for managing and using precipitation data, how many
gauges to install and where, and collecting additional supporting observations. He addresses the
“sweet spot” question: how many gauges, and where. Some suggestions include:
• Tie rain gauge location to existing plans – collect data at locations where you need to
know if it rained or not to discern impacts
• Collect data at house, ranch headquarters, or ranger station – easy spots for frequent
monitoring
• Place gauges in locations you drive by often – gauges that are readily accessible for quick
visits near roads that allow for more frequent observations.
• Use topography as a guide – bracket areas with gauges at high and low locations
• No such thing as ‘too many gauges’ – gauges are cheap and will collect data for long
periods
He also suggested collecting additional supporting observations, such as notes on or
measurements of forage amounts, forage conditions, spring flows, or tank levels. Over time,
15
these will help you interpret your precipitation observations. More information can be found
in Range Gauges for Range Management: Precipitation Monitoring Best Practices Guide
(Appendix B).
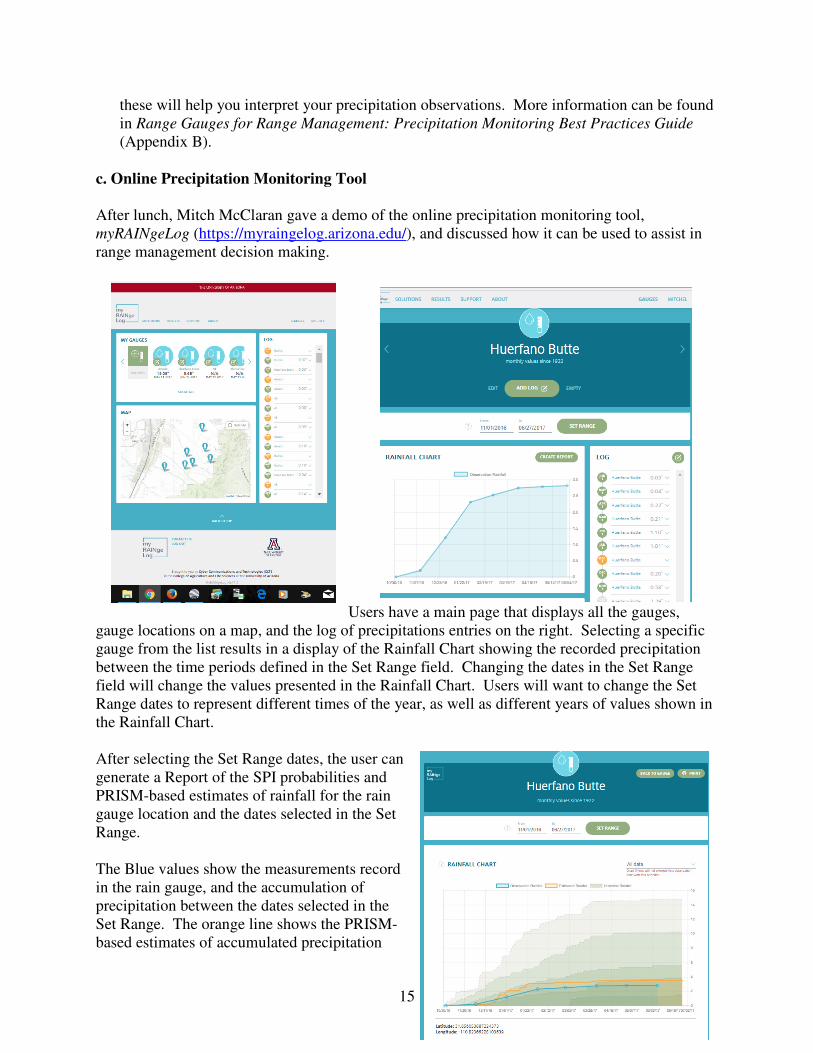
c. Online Precipitation Monitoring Tool
After lunch, Mitch McClaran gave a demo of the online precipitation monitoring tool,
myRAINgeLog (https://myraingelog.arizona.edu/), and discussed how it can be used to assist in
range management decision making.
Users have a main page that displays all the gauges,
gauge locations on a map, and the log of precipitations entries on the right. Selecting a specific
gauge from the list results in a display of the Rainfall Chart showing the recorded precipitation
between the time periods defined in the Set Range field. Changing the dates in the Set Range
field will change the values presented in the Rainfall Chart. Users will want to change the Set
Range dates to represent different times of the year, as well as different years of values shown in
the Rainfall Chart.
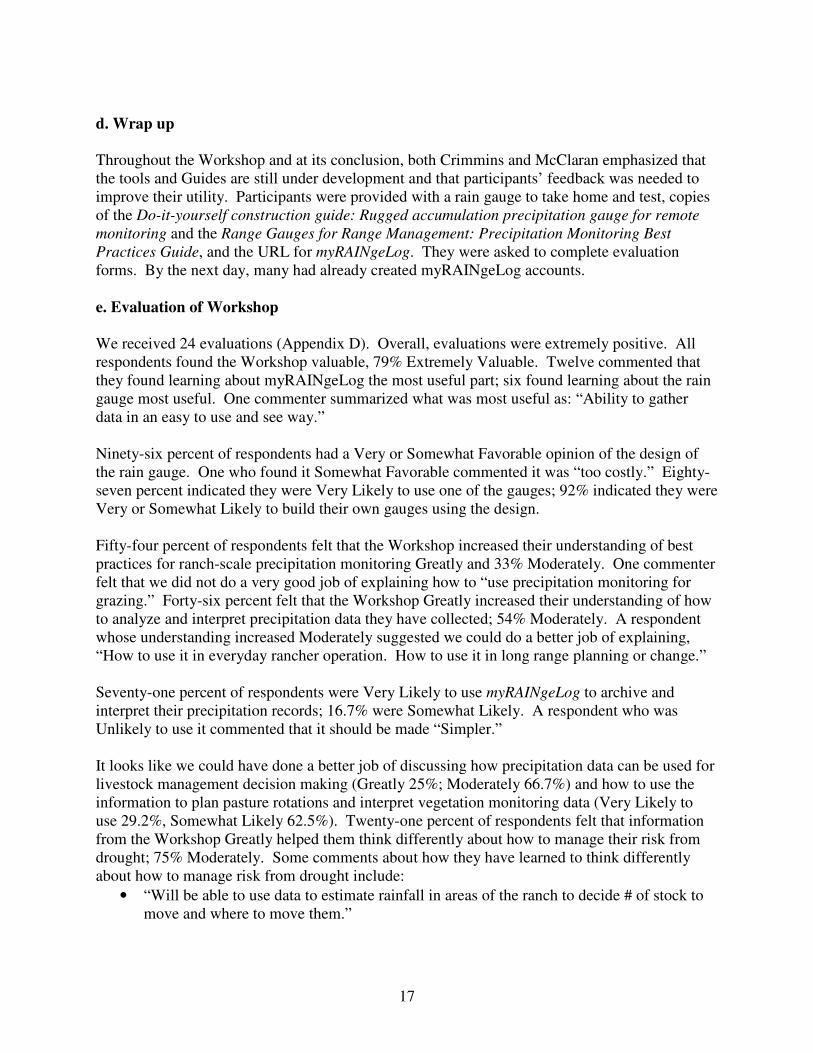
After selecting the Set Range dates, the user can
generate a Report of the SPI probabilities and
PRISM-based estimates of rainfall for the rain
gauge location and the dates selected in the Set
Range.
The Blue values show the measurements record
in the rain gauge, and the accumulation of
precipitation between the dates selected in the
Set Range. The orange line shows the PRISM-
based estimates of accumulated precipitation
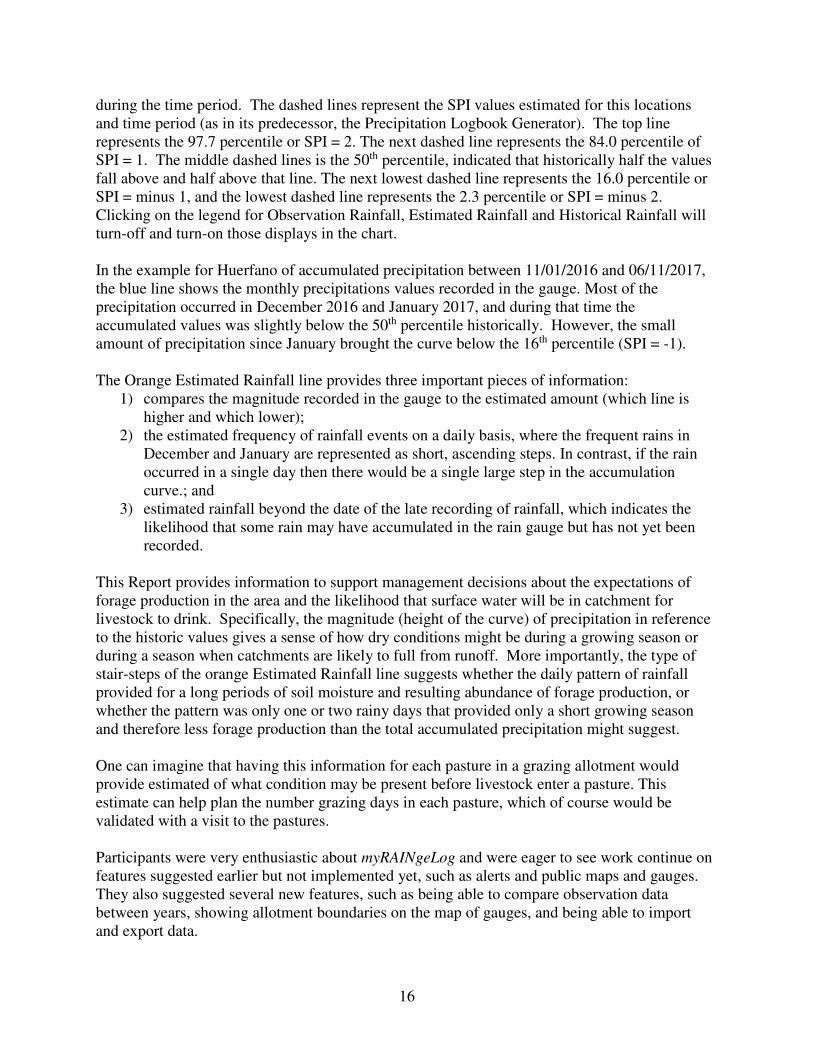
16
during the time period. The dashed lines represent the SPI values estimated for this locations
and time period (as in its predecessor, the Precipitation Logbook Generator). The top line
represents the 97.7 percentile or SPI = 2. The next dashed line represents the 84.0 percentile of
SPI = 1. The middle dashed lines is the 50th percentile, indicated that historically half the values
fall above and half above that line. The next lowest dashed line represents the 16.0 percentile or
SPI = minus 1, and the lowest dashed line represents the 2.3 percentile or SPI = minus 2.
Clicking on the legend for Observation Rainfall, Estimated Rainfall and Historical Rainfall will
turn-off and turn-on those displays in the chart.
In the example for Huerfano of accumulated precipitation between 11/01/2016 and 06/11/2017,
the blue line shows the monthly precipitations values recorded in the gauge. Most of the
precipitation occurred in December 2016 and January 2017, and during that time the
accumulated values was slightly below the 50th percentile historically. However, the small
amount of precipitation since January brought the curve below the 16th percentile (SPI = -1).
The Orange Estimated Rainfall line provides three important pieces of information:
1) compares the magnitude recorded in the gauge to the estimated amount (which line is
higher and which lower);
2) the estimated frequency of rainfall events on a daily basis, where the frequent rains in
December and January are represented as short, ascending steps. In contrast, if the rain
occurred in a single day then there would be a single large step in the accumulation
curve.; and
3) estimated rainfall beyond the date of the late recording of rainfall, which indicates the
likelihood that some rain may have accumulated in the rain gauge but has not yet been
recorded.
This Report provides information to support management decisions about the expectations of
forage production in the area and the likelihood that surface water will be in catchment for
livestock to drink. Specifically, the magnitude (height of the curve) of precipitation in reference
to the historic values gives a sense of how dry conditions might be during a growing season or
during a season when catchments are likely to full from runoff. More importantly, the type of
stair-steps of the orange Estimated Rainfall line suggests whether the daily pattern of rainfall
provided for a long periods of soil moisture and resulting abundance of forage production, or
whether the pattern was only one or two rainy days that provided only a short growing season
and therefore less forage production than the total accumulated precipitation might suggest.
One can imagine that having this information for each pasture in a grazing allotment would
provide estimated of what condition may be present before livestock enter a pasture. This
estimate can help plan the number grazing days in each pasture, which of course would be
validated with a visit to the pastures.
Participants were very enthusiastic about myRAINgeLog and were eager to see work continue on
features suggested earlier but not implemented yet, such as alerts and public maps and gauges.
They also suggested several new features, such as being able to compare observation data
between years, showing allotment boundaries on the map of gauges, and being able to import
and export data.
17
d. Wrap up
Throughout the Workshop and at its conclusion, both Crimmins and McClaran emphasized that
the tools and Guides are still under development and that participants’ feedback was needed to
improve their utility. Participants were provided with a rain gauge to take home and test, copies
of the Do-it-yourself construction guide: Rugged accumulation precipitation gauge for remote
monitoring and the Range Gauges for Range Management: Precipitation Monitoring Best
Practices Guide, and the URL for myRAINgeLog. They were asked to complete evaluation
forms. By the next day, many had already created myRAINgeLog accounts.
e. Evaluation of Workshop
We received 24 evaluations (Appendix D). Overall, evaluations were extremely positive. All
respondents found the Workshop valuable, 79% Extremely Valuable. Twelve commented that
they found learning about myRAINgeLog the most useful part; six found learning about the rain
gauge most useful. One commenter summarized what was most useful as: “Ability to gather
data in an easy to use and see way.”
Ninety-six percent of respondents had a Very or Somewhat Favorable opinion of the design of
the rain gauge. One who found it Somewhat Favorable commented it was “too costly.” Eighty-
seven percent indicated they were Very Likely to use one of the gauges; 92% indicated they were
Very or Somewhat Likely to build their own gauges using the design.
Fifty-four percent of respondents felt that the Workshop increased their understanding of best
practices for ranch-scale precipitation monitoring Greatly and 33% Moderately. One commenter
felt that we did not do a very good job of explaining how to “use precipitation monitoring for
grazing.” Forty-six percent felt that the Workshop Greatly increased their understanding of how
to analyze and interpret precipitation data they have collected; 54% Moderately. A respondent
whose understanding increased Moderately suggested we could do a better job of explaining,
“How to use it in everyday rancher operation. How to use it in long range planning or change.”
Seventy-one percent of respondents were Very Likely to use myRAINgeLog to archive and
interpret their precipitation records; 16.7% were Somewhat Likely. A respondent who was
Unlikely to use it commented that it should be made “Simpler.”
It looks like we could have done a better job of discussing how precipitation data can be used for
livestock management decision making (Greatly 25%; Moderately 66.7%) and how to use the
information to plan pasture rotations and interpret vegetation monitoring data (Very Likely to
use 29.2%, Somewhat Likely 62.5%). Twenty-one percent of respondents felt that information
from the Workshop Greatly helped them think differently about how to manage their risk from
drought; 75% Moderately. Some comments about how they have learned to think differently
about how to manage risk from drought include:
• “Will be able to use data to estimate rainfall in areas of the ranch to decide # of stock to
move and where to move them.”

18
• “Totals don’t show the entire picture where this data can show SPI and where we really
are in a given time for rainfall.”
• “Being able to generate and use reports for planning purposes to stay ahead of poor
conditions.”
• “When planning for the year, could work with data to inform potential water hauling,
etc.”
Finally, 66.7% felt that the information and tools they learned about in the Workshop would be
Greatly useful to other ranchers and land managers; 29.2% Moderately.
IV. Next Steps
Based on discussion at the Workshop and ongoing feedback from users, we are working to fine
tune myRAINgeLog and develop new features, as well as looking for funding to support these
efforts. Planned features include:
• public maps: publicly-viewable map of gauges and their observations
• public gauges: sharing the ability to log observations with other myRAINgeLog users
• historical data chart builder: displaying overlapping years or “seasons” of observations on
the same chart
• cumulative precipitation outcome likelihoods: allows users to anticipate potential climate
outcomes.
On 14 August 2017 we submitted a proposal to the NOAA SARP FY2018 Funding Opportunity
addressing the Coping with Drought Initiative in support of the National Integrated Drought
Information System to continue this work.
V. References Cited
McClaran, M.P. and H.Wei. 2014. Recent drought phase in a 73-year record at two spatial
scales: Implications for livestock production on rangelands in the Southwestern United
States. Agricultural and Forest Meteorology 197:40-51.
Quiring, Steven M. “Monitoring Drought: An Evaluation of Meteorological Drought Indices.”
Geography Compass 3, no. 1 (January 2009): 64–88.

19
Appendix A: Rain Gauge Construction Guide

1 DRAFT – v1.3June2017
Do-it-yourself construction guide: Rugged accumulation precipitation
gauge for remote monitoring
Introduction Precipitation is the key
variable in assessing
drought status and tracking
changes in drought
conditions. Precipitation is
also highly variable in space
and time and having your
own rain gauge ensures
you have data specifically
for your location. Backyard
rain gauges are inexpensive
and easy to use, but what if
your monitoring location is
at a remote, unattended
site? A simple and
inexpensive accumulation
gauge can help in this
situation. These gauges are
typically open containers
like PVC pipes, capped on
one end, containing a small
amount of oil to stop
evaporation. As
precipitation falls into the
gauge it collects below the
thin film of oil and
continues to accumulate
until the gauge is emptied.
This allows a gauge to be
deployed at a remote site
and read many months or even years later.
Accumulation gauges are easy to construct on your own with materials and tools easily available at any
local hardware store. These directions provide guidance on constructing a gauge with some added
features that are particularly useful for remote monitoring (Figure 1). One particular feature of this
gauge is the use of a clear PVC which allows the design to mimic the ease of use of typical plastic
Figure 1. Clear PVC accumulation gauge
2 DRAFT – v1.3June2017
backyard gauges, but has the ruggedness to be deployed in remote locations and harsh environments.
This pipe is not as readily available at hardware stores, but available through online retailers.
Before you begin The first decision to make before constructing a gauge or several gauges is deciding how tall it should
be. This largely depends on two factors 1) How often you intend to visit the gauge and empty it, and 2)
how much precipitation typically falls over this period be it a season or a year. An online tool called the
Precipitation Logbook Generator (https://goo.gl/JswZJJ) can help you decide on the height of a gauge
based on the historical climate at that location. Go to ‘Choose Location’ and click on the map where you
intend to install your gauge and then click ‘Download data’. Wait for the data to download and then
proceed to the ‘Generate Logbook’ page. To assess the typical annual amount of precipitation at your
location set Start Month to 1, Start Day to 1 and Chart length to 365 and click Generate Chart. The black
line represents the median accumulation of daily precipitation observed at this location (based on 1981-
2015 PRISM climate data). The chart below lists the values used in the creation of the chart. The last
value in the Normal (50th %) column is the median total precipitation for this location. That means that
half of the years in the historical record were wetter and half were drier than this value. If you want your
gauge to hold a year’s worth of precipitation then choosing a depth greater than the 50th line, but less
than the 98th will ensure you have a good chance of not having your gauge overfill. This chart can also be
used directly as a logbook to track precipitation with your new gauge. Click on the ‘Download’ button
and print out a logbook customized for your site.
Parts needed This gauge design includes the use of standard schedule 40 PVC parts, clear PVC pipe, and the
installation of drainage valve to support ease of use and maintenance in the field. A simpler design
would be to use standard schedule 40 white PVC and no valve. This would require the use of a dipstick
to measure precipitation levels and also would require removing the gauge to empty it. The rest of this
guide has guidance on building and using a clear PVC gauge with valve. The screened cap will work on
any PVC gauge. Also, this design uses 2” PVC pipe and fittings which keep the cost relatively low (larger
pipe and fittings are more expensive). Look for furniture grade or UV resistant clear PVC tubes (see
Appendix A for a list of online retailers). These will last longer in direct sunlight without becoming brittle
and cracking. Narrower pipe sizes can be used (e.g. 1” PVC pipe), but may be more prone to error
caused by wind (see http://www.bom.gov.au/climate/cdo/about/rain-measure.shtml for more
information on tradeoffs with gauge sizes).

3 DRAFT – v1.3June2017
Part Picture Notes
2” clear schedule 40 PVC pipe (often available in 5 and 10 ft sections)
Available online through various retailers. Look for UV resistant or furniture grade for outdoor use. (See Appendix A for a list of online retailers) Cost: ~ $7-8/foot
2” schedule 40 PVC slip cap (1 per gauge)
Available at any hardware or plumbing supply store. Cost: ~ $1
2” schedule 40 PVC coupling (1 per gauge)
Available at any hardware or plumbing supply store. Cost: ~ $1
1 ¾ to 2 ¾ “ adjustable hose clamps (2 per gauge)
or Larger adjustable clamps that will fit directly around the pipe and post where you are installing the gauge
Available at any hardware or plumbing supply store. Cost: ~ $1-2

4 DRAFT – v1.3June2017
Section of metal window screen (at least 4x4” square, 1 piece per gauge)
Available at any hardware or plumbing supply store. Cost: ~ $10/roll
PVC primer and cement (only a small quantity needed for each gauge)
Available at any hardware or plumbing supply store. Cost: ~ $7
Short piece (at least 2” long) of 2” schedule 40 PVC pipe (1 short 2” section per gauge)
Available at any hardware or plumbing supply store. Cost: ~ $1/foot
¼” Needle drain cock (1 per gauge)
Available at any hardware or plumbing supply store. Cost: ~ $3

5 DRAFT – v1.3June2017
A gauge 2’ high will cost roughly $30 in materials. Some of these materials can be found at reduced cost
online and when purchased in bulk. Several of the parts on the list including the window screen, pipe
tap, sealing tape, and PVC cement can be used to construct many gauges. Most of these parts are also
readily available at hardware stores.
¼” by 18NPT pipe tap
Available at any hardware or plumbing supply store. Size and threading match valve. Cost: ~ $10
Aluminum yardstick ruler (or adhesive ruler, 1 per gauge)
Rulers available at any hardware or plumbing supply store. Adhesive rulers with different scales (metric, 0.1”…) are also available through different online retailers [for example see https://stop-painting.com/) Cost: ~ $5
Thread sealing tape (only short length needed per gauge)
Available at any hardware or plumbing supply store. Cost: ~ $4
Light, household multi-purpose oil (like 3-1 Oil) or mineral oil. (1 container can be used for multiple gauges). Automatic transmission fluid (ATF) can also be used as an evaporation barrier.
Available at any hardware or plumbing supply store. Cost: ~ $5
6 DRAFT – v1.3June2017
Tools needed Hack saw that can cut PVC and metal ruler
Utility knife (to trim window screen)
Drill and 7/16” drill bit (to drill out drain hole - size depends on tap size; use drill press if
available)
Socket wrench to drive pipe tap
Rubber mallet or hammer (to construct screened cap)
Marker (for marking measurements)
Adjustable Wrench (to tighten drain valve and hose clamps)
WD40 or silicone spray (to construct screened cap)
File or sand paper (to clean off burrs on cut PVC)
Rag for cleaning off tools and parts
Gather parts and tools and find a safe and well ventilated workspace. It will take about one hour to
assemble one gauge.
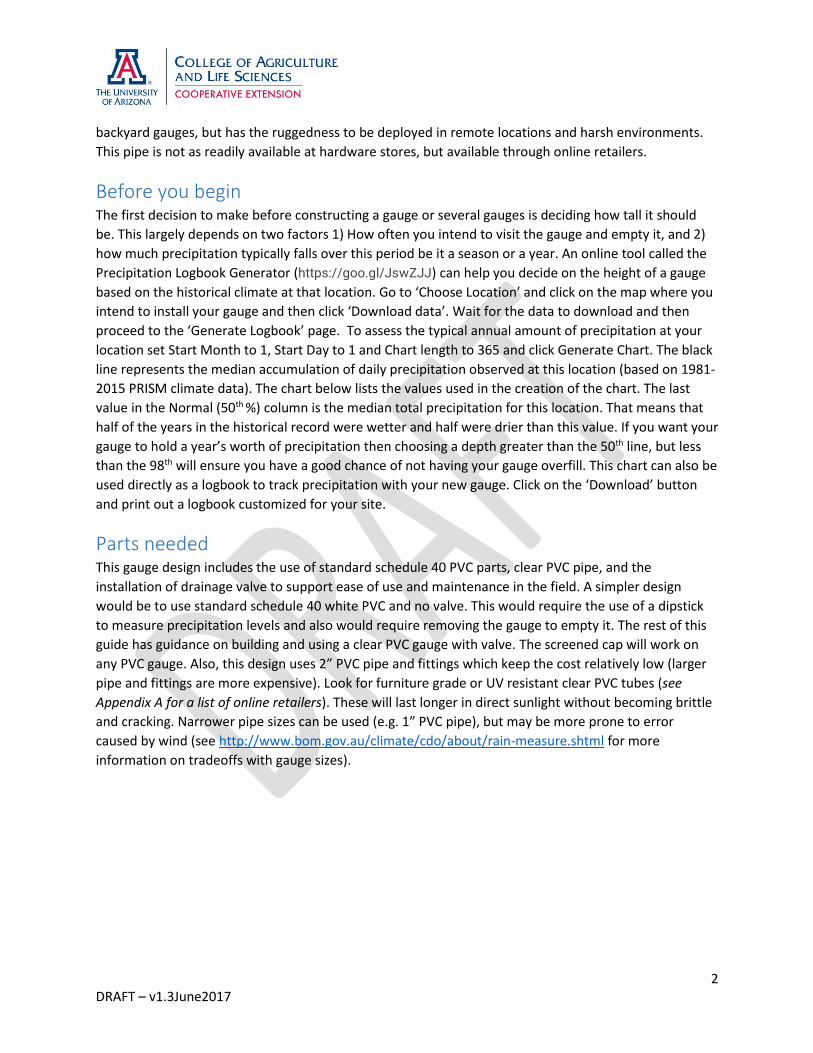
Instructions 1. Cut PVC pipe to desired length
a. Measure desired length and mark
PVC with marker. Use pipe clamp
make a mark around diameter of
pipe. This will help you make a
square cut.
b. Secure the pipe to a bench using
clamps or bench vise and cut
through the pipe following the
mark you made around the pipe.
Tip: Use two pipe clamps on either
side of the cut line to guide saw to
ensure straight cut
c. Use a file or some sand paper to remove the burrs around the cut.
Step 1a – Mark and cut pipe to length

7 DRAFT – v1.3June2017
2. Prepare end cap for drain valve
a. Secure end cap to work bench using clamp or bench
vise or secure to drill press. Drill hole through center
of end cap and clean off burrs with file or sand paper.
b. Keep end cap secured and
place tap into drilled out hole. Start
turning tap by hand and then use
socket wrench to continue turning
tap through hole. Turn all the way
until threads on tap are not visible.
Back out pipe tap and clean away
burrs by hand, making sure not to
damage newly created threads in to
PVC cap.
3. Glue end cap to PVC pipe
a. Clean inside of end cap and
end of PVC tube with a dry, clean rag making sure no burrs or debris are
present where glue will be applied.
b. Dry fit the end cap to the PVC pipe to ensure snug fit. Note how
far end cap covers PVC
tube
c. Apply PVC primer to inside of end cap
(keep away from threads in drain hole)
and to outside end of PVC pipe where
end cap will cover. Then apply PVC
cement to all areas covered in primer.
Slide end cap onto PVC pipe and turn
(quarter turn) to create seal. Allow seal
to cure for 15 minutes.
4. Install drain valve
a. With the valve
pointing down, wrap thread sealing tape counter clockwise 5-7
times around the threads. Keep tape away from bottom valve seat
to prevent interfering with seal. This thick layer of sealing tape will
serve as a gasket when threaded into the gauge.
b. Hand tighten the valve into the drain hole in the end cap. Use a
wrench to tighten further until the valve is fully seated against the
end cap. Be careful not to overtighten with the wrench
(overtightening will damage the plastic threads in the end cap).
Step 2a – Drill out drain
hole
Step 2b – create
threads with tap
Step 3c – Glue end cap to PVC pipe
Step 4a – wrap valve with
thread sealing tape
8 DRAFT – v1.3June2017
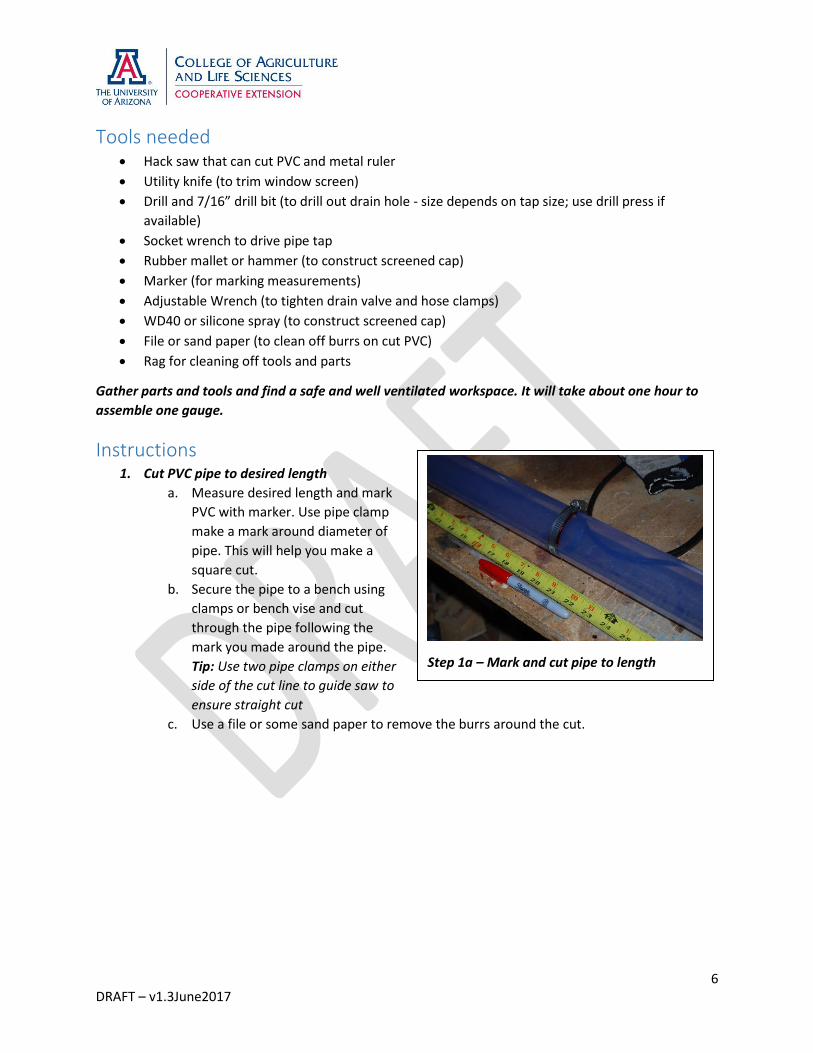
c. Close valve, hold gauge upright and fill with some water. Check
to see if valve leaks around collar. Carefully tighten until leaking stops.
If leaking does not stop, remove valve and repeat steps with new
thread sealing tape. More tape may be necessary to create tight seal
around valve. Tip: Using thread sealing tape allows you to remove and
replace the valve if necessary. The valve could also be more
permanently installed and sealed using a silicone glue.
5. Build screened cap
a. Take white PVC pipe and measure 1 5/8th “ length. Use pipe
clamps to make a straight line mark around the diameter of the tube.
Cut off piece and remove burrs with file or sand paper.
b. Cut 4” by 4” square out of steel or aluminum window screen.
c. Take PVC coupler and apply a light coating of lubricant like WD-
40 or silicone spray using a rag to the
inside of the coupler.
d. Place square of window screen on
2” coupler, centering over opening.
e. Place short 1.5” PVC section on top of screen and lightly
tap into place with hammer or rubber mallet. This step is
a bit tricky and may require a couple of attempts to seat
the pipe into the coupler. Go slowly to prevent tearing the
screen as the pipe piece is pounded into place.
f. Once the PVC pipe is fully seated, trim excess screen using
utility knife.
g. PVC piece is slightly
longer than coupler and is
intended to stick up slightly
above opening to prevent
rain drops from splashing
into gauge.
6. Secure ruler to gauge
a. Cut ruler to length of exposed PVC on gauge above
glued end cap and just below where screened end cap will
slide on. Use hacksaw for steel ruler cut to appropriate
length
b. Hold cut ruler to side of gauge and slide two pipe
clamps over pipe and ruler. Tighten to secure ruler.
c. Pipe clamps also serve as means to wire gauge to fence posts in field installations.
7. Test gauge for leaks
a. Wrap some baling wire around the pipe clamp to make hook for hanging the gauge.
b. Hang the gauge on a wall in your workshop or on a fence outside, fill the gauge up at
least half way with water and leave to sit for at least an hour. Mark the level of the
water with a piece of tape for reference.
Step 5e – tap PVC section
into coupler
Step 5f – trim excess screen using
utility knife
Step 4b – thread valve
into drain hole and
tighten
9 DRAFT – v1.3June2017
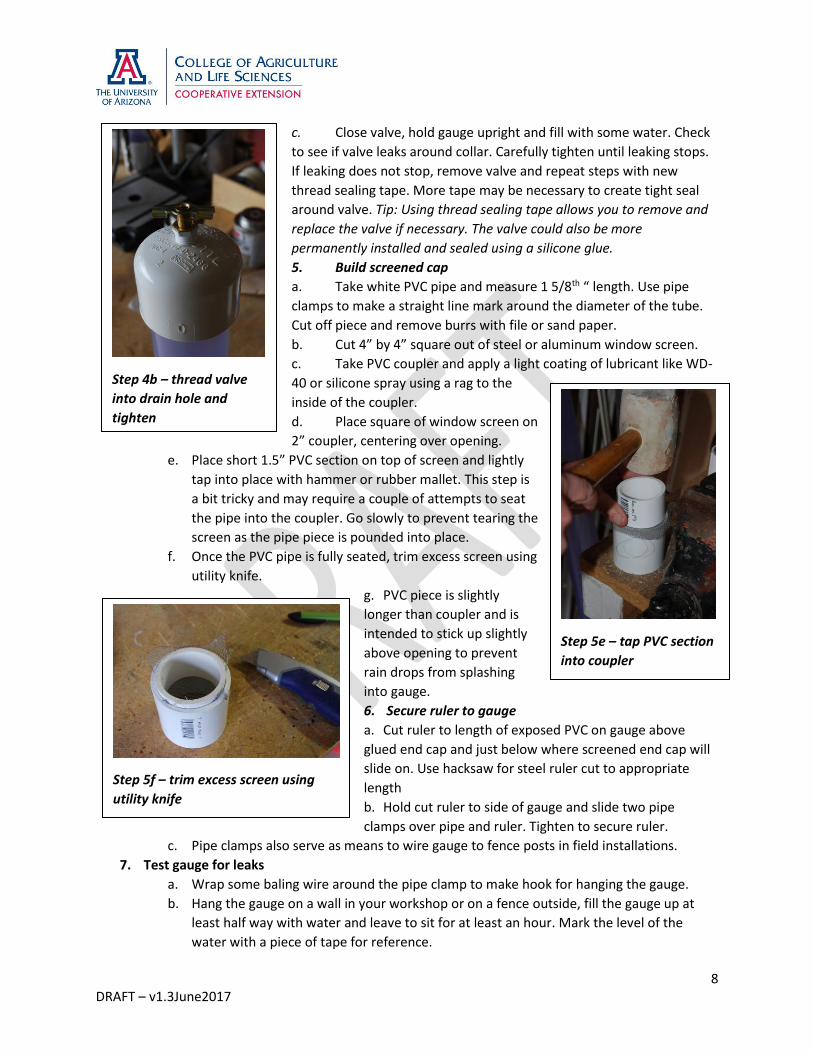
c. After sitting for some time, check to see if the water level has dropped below the level
of the tape. Check the gauge for leaks around the glued seam between slip cap and pipe
and also around the valve. If a leak forms around the glued cap, it is best to saw this
section off and start over by gluing a new cap on. If the valve is leaking, remove it and
clean off the existing thread sealing tape. Re-wrap the valve with a thicker layer and
reinstall. Check for leaks again.
Installing gauge 1. Survey intended gauge location and try to find a spot that is relatively open and away from trees
and other overhanging obstructions (like telephone poles and/or wires) that could impact
precipitation accumulations.
2. Affix gauge to fence post or other post by wrapping baling wire first around pipe clamps and
then around post (an oversized clamp around the post and the gauge can also be used to affix
the gauge). Make sure the top of the gauge is higher than the post itself. Installing on the north
side of the post will also offer some protection from direct sunlight. It is important to strongly
affix the gauge to the post if livestock or large wildlife may be present. They may rub against the
gauge and knock it off if not strongly attached.
3. Prime the gauge with some water to bring the level above the bottom of the ruler. Add between
1/8 and ¼” of light machine oil to gauge making sure it covers water surface and creates a
barrier to evaporation. Too thick a layer may hamper rain drops moving through this oil barrier
impacting the accumulation amounts and accuracy of the gauge. Use the valve to empty water
until the bottom of the oil layer reaches zero on the ruler.
4. This is an important time for a final check for leaks around the valve collar, the valve itself and
the glued cap. Carefully tighten valve if necessary.
Other installation
considerations Although rain gauges are
typically in open areas that
are visible from long
distances, this also creates
the potential for vandalism
in highly trafficked areas.
Steps to reduce the
potential of vandalism
include camouflage by
painting white caps darker
colors and even the pipe
itself if a narrow site window is preserved (add a strip of masking tape from top to bottom of gauge
before painting), or cloaking them with burlap or other camouflaging material. Also consider placing a
label on the gauge explaining what it is for and your contact information. Research in Germany found
that a personal, friendly and descriptive label reduced the rate of vandalism and theft of unattended
Add water Add Oil Drain to zero level
Installing gauge step 3 – Priming gauge
10 DRAFT – v1.3June2017
monitoring equipment (Clarin, B.-M., E. Bitzilekis, B. M. Siemers, and H. R. Goerlitz, 2014: Personal
messages reduce vandalism and theft of unattended scientific equipment. Methods Ecol Evol, 5, 125–
131, doi:10.1111/2041-210X.12132.).
Anti-freeze is often added to accumulation gauges like these
to protect against cracking and splitting. This is only a risk in
very cold locations where water in the gauge may freeze
solid. In most instances, newer PVC pipe is strong enough to
withstand the expansion of water when it freezes, forcing
the ice to expand up the inside of the pipe. Older gauges that
have been exposed to the sun for many years may weaken
and be more prone to splitting and cracking when freezing. If
you forgo using antifreeze you can still take a measurement
from a frozen gauge. Water expands about 9% in volume when freezing, so multiplying the reading of a
frozen gauge by 0.91 will provide a rough estimate of the equivalent liquid level. If the gauge is full of
snow, then it is necessary to wait until all of the frozen precipitation melts to get an accurate
precipitation reading.
If you use antifreeze to protect your gauge try and use a non-toxic formulation. Antifreeze formulations
containing ethylene glycol are toxic and can be harmful to animals and wildlife if the gauge leaks or is
tipped over and emptied on the ground. Antifreeze containing propylene glycol which is non-toxic and
biodegradable can be found auto parts and hardware stores. A concentrated form (look for 100% and
not pre-mixed 50/50 formulations) of this type of antifreeze can be used to charge the gauge and will
help prevent freezing. Consider resetting and charging the gauge in the fall with antifreeze before the
winter season. The antifreeze will dilute as precipitation accumulates in the gauge, but should still be
concentrated enough to protect from freezing. The amount of antifreeze ultimately needed will be a
function of how much precipitation is expected during the winter season and how cold the
temperatures may ultimately reach.
Using the gauge No rain gauge is perfect and this gauge design is no exception. All rain gauges are prone to error which is
typically expressed in lower than actually occurring total precipitation amounts. Some sources of error
included (Brock and Richardson, 2001: Meteorological Measurement Systems. Oxford University Press,
New York, 290 p.):
Wind: Wind can cause ‘undercatch’ where drops are blown across the opening of the gauge
erratically during precipitation events.
Splash out: Large drops can strike the top of the cap and splash out rather than in. The slightly
raised PVC collar on the screened cap is designed to minimize this impact.
Wetting and Evaporation: Drops from light precipitation events can be caught up in the screen
in the cap and along the sides of the gauge. If these drops don’t accumulate below the oil layer,
they will most likely evaporate in between rain events and won’t contribute to the total. Adding
a simple plastic funnel to the top of the gauge below the cap can help guide drops away from
Rain gauge for range monitoring
please do not disturb – Please
contact me if you have any questions
and would like to know more:
Name/phone number
Example rain gauge label
11 DRAFT – v1.3June2017
the sides, improving the collection of the rain water. See Appendix B for instructions on how to
build a funnel for a 2 inch PVC gauge.
Snow: Snow and its liquid water contribution to running precipitation totals is notoriously
difficult to measure. Removing the screened cap in the winter will allow some but most likely
not all snow to accumulate in the gauge. This snow will eventually melt and accumulate below
the oil layer, but will most likely be only fraction of the total snow that fell over the
measurement period. (Note: A frozen gauge will read higher than the liquid amount, wait until
the gauge is completely thawed to get an accurate reading)
Even with these potential sources of error the precipitation data afforded by these gauges provide a
better representation of the local site than estimates based on gauges located some distance away.
Logging observations Reading this clear PVC accumulation gauge is simple, just note the level of the water at the bottom of
the oil layer when visiting the gauge. Note this observation in a field book with date and any other
observations of field conditions that may be useful in interpreting this precipitation amount at a later
time. The observation that you log will grow over time until the gauge is reset by emptying it to a zero
level. Subtract subsequent observations from each other to get the total precipitation that occurred
between the observation dates. More frequent observations will give you more insight into the timing
and frequency of precipitation events. Set up a schedule to visit gauges and log observations that
matches key decision points in your management schedule (e.g. grazing rotations, water availability in
tanks…).
Several tools exist to help manage accumulation gauge type data.
The Precipitation Logbook Generator (https://goo.gl/JswZJJ) allows you to create a printable
logbook with reference climate information for any gauge location in the continental U.S.
The myRAINge web application (https://myraingelog.arizona.edu) allows you to manage data for
multiple gauges in the field with reference climate information, precipitation alerts, and summary
tools.
Maintenance The materials used in these gauges are very durable and should last many years, but they may require
some maintenance from time to time. In particular, having spare parts to repair damage that may occur
from vandalism or wear and tear is a good idea when visiting a gauge. Some spare parts to have on
hand include:
Thread sealing tape and spare valve in case the existing one is leaking; silicone grease in case
valve is sticky
Spare screened cap (built earlier) if the existing one is missing or damaged
Replacement ruler in case existing one is damaged
Baling wire to reattach gauge if it is has fallen off post
Water (and/or antifreeze) and oil to reset a gauge
12 DRAFT – v1.3June2017
The clear PVC tube may need to be cleaned out after several years if it is difficult to read. A long handled
brush and some soapy water will clean out the inside of the tube. Bring additional baling wire as well to
reattach the gauge if removed.
Authors: Michael Crimmins, Mitchel McClaran, Julie Brugger, Ashley Hall, Douglas Tolleson
Contributors: Rangeland Precipitation Monitoring Working Group consisting of members of the Gila
County Cattle Growers Association, ranchers with permits on the Tonto National Forest and staff with
the U.S. Forest Service-Tonto National Forest.
Acknowledgements: Special thanks to D. Crimmins for help in constructing rain gauges, T. Crimmins for
photographing steps in construction process and B. Benne, R. Tanner, and M. Hemovich for providing
initial project ideas and guidance and K. Wolff-Krauter for providing feedback and testing of initial gauge
design. Funding provided by Western Extension Risk Management Education program.
Questions or comments? Contact: Mike Crimmins Associate Professor & Extension Specialist - Climate Science Department of Soil, Water, & Environmental Science The University of Arizona [email protected] ph (520)626-4244 fax (520)621-1647
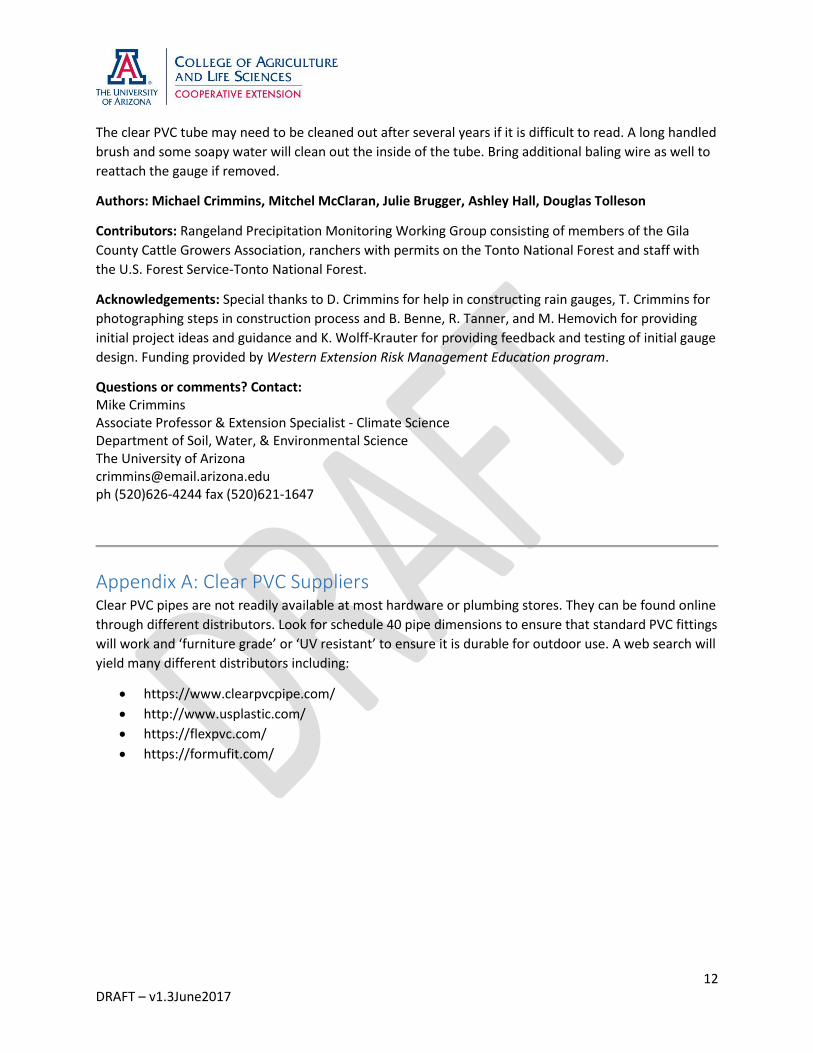
Appendix A: Clear PVC Suppliers Clear PVC pipes are not readily available at most hardware or plumbing stores. They can be found online
through different distributors. Look for schedule 40 pipe dimensions to ensure that standard PVC fittings
will work and ‘furniture grade’ or ‘UV resistant’ to ensure it is durable for outdoor use. A web search will
yield many different distributors including:
https://www.clearpvcpipe.com/
http://www.usplastic.com/
https://flexpvc.com/
https://formufit.com/
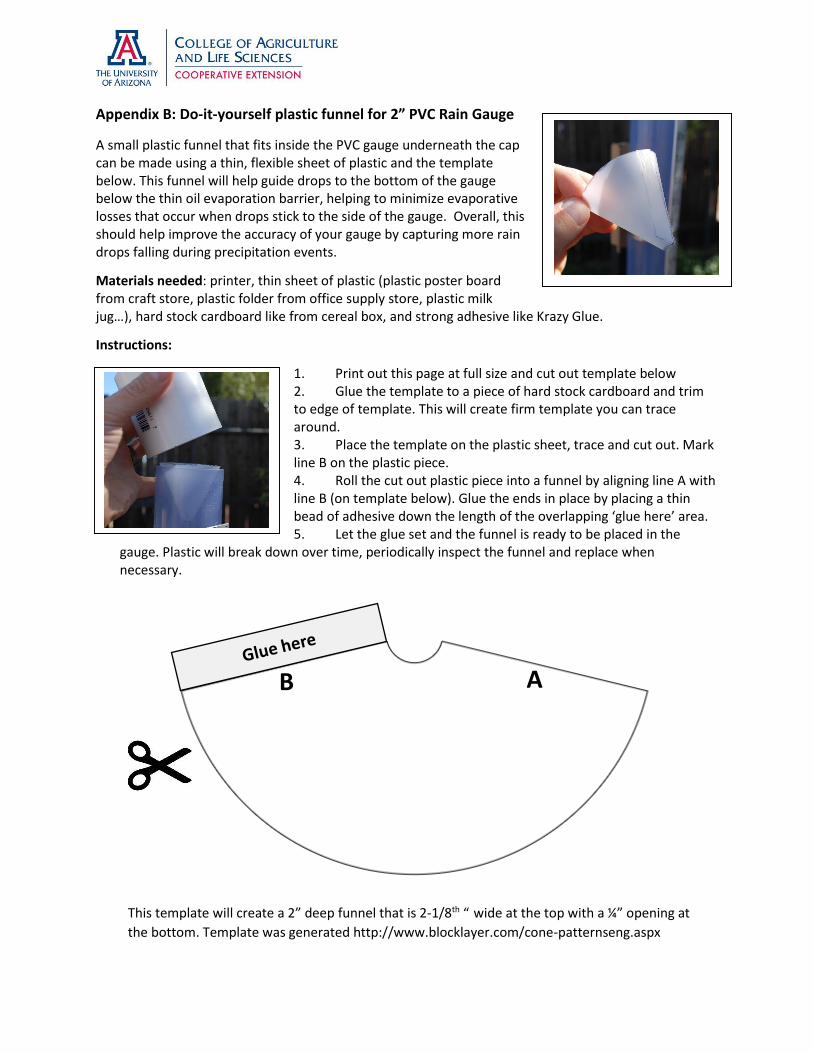
Appendix B: Do-it-yourself plastic funnel for 2” PVC Rain Gauge
A small plastic funnel that fits inside the PVC gauge underneath the cap can be made using a thin, flexible sheet of plastic and the template below. This funnel will help guide drops to the bottom of the gauge below the thin oil evaporation barrier, helping to minimize evaporative losses that occur when drops stick to the side of the gauge. Overall, this should help improve the accuracy of your gauge by capturing more rain drops falling during precipitation events.
Materials needed: printer, thin sheet of plastic (plastic poster board from craft store, plastic folder from office supply store, plastic milk jug…), hard stock cardboard like from cereal box, and strong adhesive like Krazy Glue.
Instructions:
1. Print out this page at full size and cut out template below 2. Glue the template to a piece of hard stock cardboard and trim to edge of template. This will create firm template you can trace around. 3. Place the template on the plastic sheet, trace and cut out. Mark line B on the plastic piece. 4. Roll the cut out plastic piece into a funnel by aligning line A with line B (on template below). Glue the ends in place by placing a thin bead of adhesive down the length of the overlapping ‘glue here’ area. 5. Let the glue set and the funnel is ready to be placed in the
gauge. Plastic will break down over time, periodically inspect the funnel and replace when necessary.
This template will create a 2” deep funnel that is 2-1/8th “ wide at the top with a ¼” opening at
the bottom. Template was generated http://www.blocklayer.com/cone-patternseng.aspx
AB

20
Appendix B: Precipitation Monitoring Best Practices Guide

1 DRAFT – v1.1-May2017
Rain Gauges for Range Management: Precipitation Monitoring Best
Practices Guide
Introduction Precipitation in the form of rain and snow is critical to many aspects of working lands from controlling
the growth of vegetation used in grazing by livestock and wildlife to recharging local water resources
found in springs, tanks and riparian areas. Land management decisions often require some knowledge of
how much precipitation fell within a management unit to assess how past actions have performed and
what to do next. For example, do forage conditions reflect a lack of precipitation or grazing
management? Did the next pasture or allotment in my rotation get any rainfall over the past season?
Given that precipitation monitoring is important, where and how do we usually get this information?
Typically, we consult websites and maps that track precipitation observations from airports and
backyard observers. These ‘official’ sites managed by volunteer and federal agency programs do a good
job of maintaining a steady stream of high quality data, but often are located near cities away from rural
and backcountry areas where the bulk of land management activities occur. Estimates provided by
‘interpolating’ between these official gauges can provide just that, estimates. Knowing how much and
when precipitation fell in your pasture, allotment or land management unit is a key variable for sound
decision making and requires collecting precipitation data directly at that site.
This guide will also highlight some new tools that help put your precipitation observations into a longer-
term climatological context. Knowing how much it rained is one thing, but knowing that observation is
below average for that location and time period is additional insight critical to interpreting and using
that piece of information to support a management decision.
Overall, this “best practices” guide will cover some of the basic approaches to collecting and using
precipitation observations at remote sites in support of rangeland management including:
Tying observations to a drought plan
Where to place gauges and how often to record observations
Managing and using precipitation observations
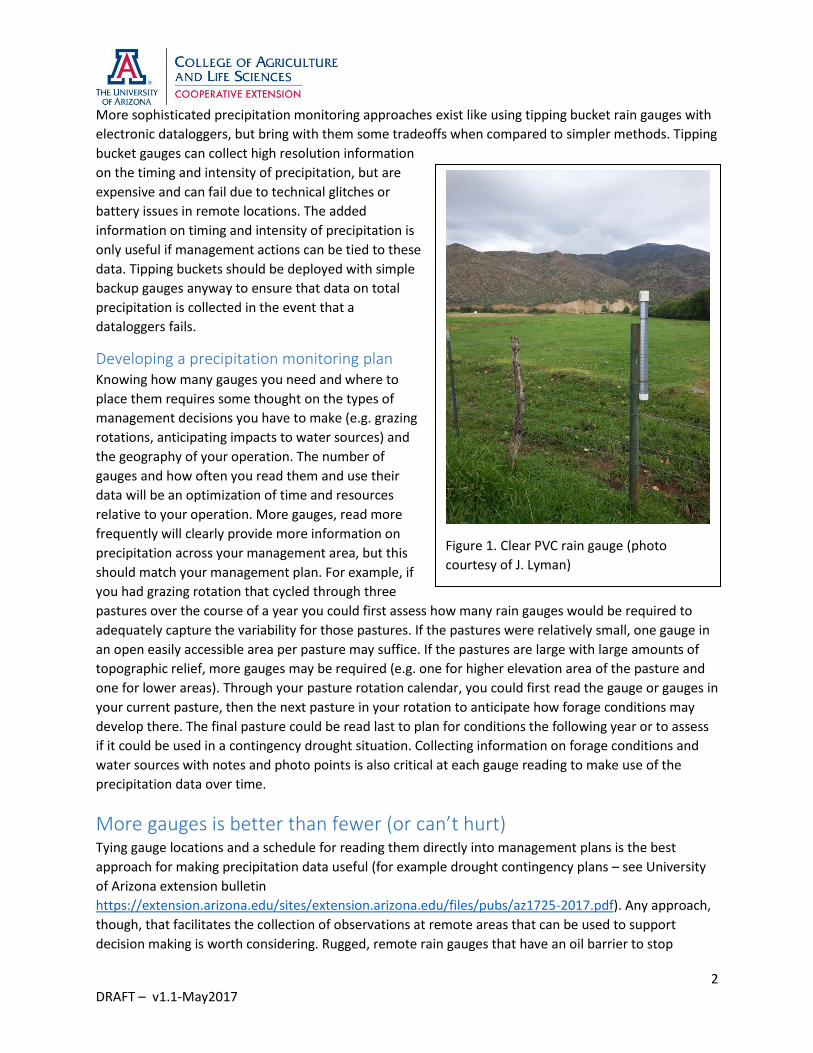
Rain gauges Precipitation monitoring is one of the most straightforward aspects of weather and climate monitoring
and does not require overly sophisticated or expensive equipment. Simple rain gauges consisting of a
collection container suffice under most situations. Gauges made out of PVC tubes capped at one end
and mounted to fence posts in key areas have been utilized by ranchers and land managers for many
years. These gauges typically have a small amount of oil in the gauge to stop evaporation and are read
several times throughout the year in concert with key land management decision points on the
calendar. Some innovations on this PVC design have been developed including the use of clear PVC that
allows for direct reading of the precipitation amounts in the gauge and a drainage valve that simplifies
resetting the gauge each season [example in figure 1; see companion bulletin titled How to construct a
rugged accumulation precipitation gauge for remote monitoring].
2 DRAFT – v1.1-May2017
More sophisticated precipitation monitoring approaches exist like using tipping bucket rain gauges with
electronic dataloggers, but bring with them some tradeoffs when compared to simpler methods. Tipping
bucket gauges can collect high resolution information
on the timing and intensity of precipitation, but are
expensive and can fail due to technical glitches or
battery issues in remote locations. The added
information on timing and intensity of precipitation is
only useful if management actions can be tied to these
data. Tipping buckets should be deployed with simple
backup gauges anyway to ensure that data on total
precipitation is collected in the event that a
dataloggers fails.
Developing a precipitation monitoring plan Knowing how many gauges you need and where to
place them requires some thought on the types of
management decisions you have to make (e.g. grazing
rotations, anticipating impacts to water sources) and
the geography of your operation. The number of
gauges and how often you read them and use their
data will be an optimization of time and resources
relative to your operation. More gauges, read more
frequently will clearly provide more information on
precipitation across your management area, but this
should match your management plan. For example, if
you had grazing rotation that cycled through three
pastures over the course of a year you could first assess how many rain gauges would be required to
adequately capture the variability for those pastures. If the pastures were relatively small, one gauge in
an open easily accessible area per pasture may suffice. If the pastures are large with large amounts of
topographic relief, more gauges may be required (e.g. one for higher elevation area of the pasture and
one for lower areas). Through your pasture rotation calendar, you could first read the gauge or gauges in
your current pasture, then the next pasture in your rotation to anticipate how forage conditions may
develop there. The final pasture could be read last to plan for conditions the following year or to assess
if it could be used in a contingency drought situation. Collecting information on forage conditions and
water sources with notes and photo points is also critical at each gauge reading to make use of the
precipitation data over time.
More gauges is better than fewer (or can’t hurt) Tying gauge locations and a schedule for reading them directly into management plans is the best
approach for making precipitation data useful (for example drought contingency plans – see University
of Arizona extension bulletin
https://extension.arizona.edu/sites/extension.arizona.edu/files/pubs/az1725-2017.pdf). Any approach,
though, that facilitates the collection of observations at remote areas that can be used to support
decision making is worth considering. Rugged, remote rain gauges that have an oil barrier to stop
Figure 1. Clear PVC rain gauge (photo
courtesy of J. Lyman)
3 DRAFT – v1.1-May2017
evaporation are relatively inexpensive, require little maintenance and can be read infrequently making
them ideal for deployment at numerous locations. Some strategies to consider include:
Collect data at house, ranch headquarters, or ranger station – frequent observations at these
locations can provide good reference points from which to compare readings made at remote
gauges.
Place gauges in locations you drive by often – gauges that are readily accessible for quick visits
near roads that allow for more frequent observations. Mounting gauges on fence posts near
gates may even allow for ‘drive thru’ readings. These may be close enough to other key
monitoring areas to provide useful information in interpreting local conditions.
Use topography as a guide – higher elevation areas typically get more precipitation than lower
elevation areas, so capturing observations at the highest and lowest points of your management
area can often give you an indication of the range of precipitation that occurred over the area. A
couple of gauges in middle elevation areas can also serve as a check on this logic.
No such thing as ‘too many gauges’ – since PVC gauges are inexpensive to build and require little
maintenance there is no harm in placing gauges in locations where you don’t immediately need
the information, but may need it at some point in the future. If a gauge is sufficiently tall given
the precipitation that typically occurs at that location, it can continue to collect cumulative
precipitation for seasons to years. This type of monitoring could be useful at especially remote
sites that are visited every couple of years to assess longer term changes.
Managing and using precipitation data A key part of your precipitation monitoring plan is developing a way to log and interpret your
observations. Ideally, the precipitation values you observe at each gauge will help guide a specific
decision or management action. This requires tying different precipitation levels to specific time periods
and decisions. For example, a ranching drought contingency plan can be set up to trigger different
management actions when a location reaches different levels of drought intensity at different times of
the year (see University of Arizona Extension Bulletin
https://extension.arizona.edu/sites/extension.arizona.edu/files/pubs/az1725-2017.pdf). This requires
being able to put your precipitation observations into some kind of long-term, climatological context. If
you have a long-term set of observations (at least 10 years, but longer is better) at your rain gauge you
can get a sense of whether or not the values are unusually wet or dry for the time of year at that
location. Two new tools exist specifically for helping with tracking accumulated precipitation at new and
existing gauges and providing climatological context for the observations:
The Precipitation Logbook Generator (https://goo.gl/JswZJJ) allows you to create a printable
logbook with reference climate information for any gauge location in the continental U.S. (See
appendix A with guidance on how to use the Logbook generator)
The myRAINge Log web application (https://myraingelog.arizona.edu) allows you to manage
data for multiple gauges in the field with reference climate information, precipitation alerts, and
summary tools.
4 DRAFT – v1.1-May2017
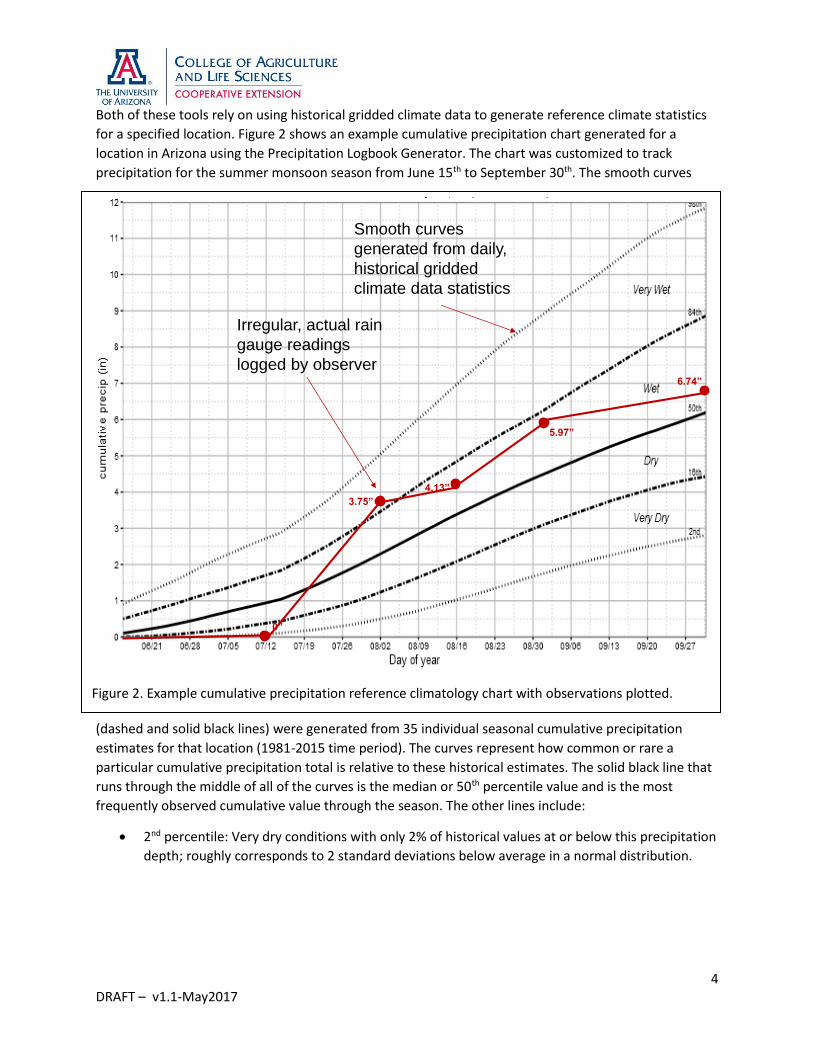
Both of these tools rely on using historical gridded climate data to generate reference climate statistics
for a specified location. Figure 2 shows an example cumulative precipitation chart generated for a
location in Arizona using the Precipitation Logbook Generator. The chart was customized to track
precipitation for the summer monsoon season from June 15th to September 30th. The smooth curves
(dashed and solid black lines) were generated from 35 individual seasonal cumulative precipitation
estimates for that location (1981-2015 time period). The curves represent how common or rare a
particular cumulative precipitation total is relative to these historical estimates. The solid black line that
runs through the middle of all of the curves is the median or 50th percentile value and is the most
frequently observed cumulative value through the season. The other lines include:
2nd percentile: Very dry conditions with only 2% of historical values at or below this precipitation
depth; roughly corresponds to 2 standard deviations below average in a normal distribution.
Figure 2. Example cumulative precipitation reference climatology chart with observations plotted.
6.74”
4.13”
0”
3.75”
5.97”
Smooth curves
generated from daily,
historical gridded
climate data statistics
Irregular, actual rain
gauge readings
logged by observer

5 DRAFT – v1.1-May2017
16th percentile: Dry conditions with 16% of
historical values at or below this precipitation
depth; roughly corresponds to 1 standard
deviation below average in a normal distribution.
84th percentile: Wet conditions with 84% of
historical values below this precipitation depth;
roughly corresponds to 1 standard deviation
above average in a normal distribution.
98th percentile: Very wet conditions with 98% of
historical values below this precipitation depth
(inversely, only 2% of observations greater than
this value); roughly corresponds to 2 standard
deviations above average in a normal distribution.
The red line on the chart in Figure 2 provides an example
of how actual observations could be entered and
interpreted. In this example, the gauge is a typical PVC
type gauge at a remote site with an oil evaporation barrier allowing precipitation to accumulate over
time. The gauge is empty at the beginning of the monsoon season on June 15th. The first observation is
made on July 12th and the gauge is still empty. The black line (median/50th percentile) indicates that this
location typically receives 1” of cumulative precipitation between June 15th and the first observation
date of July 12th. The zero inch observation falls on the 2nd percentile indicating that the site is very dry
and rarely so for that date. It is early in the season, but this very dry observation could trigger a
management action depending on the site and the objective.
The next observation is made on August 2nd and the gauge total has risen to 3.75”. On the chart, this
cumulative total is now above the 84th percentile or into the ‘very wet’ part of the historical distribution.
This quick turnaround from dry to wet is not uncommon in Arizona during the summer monsoon season
where a handful (or even one) thunderstorm can drop several inches of rain. Another observation was
made on August 16th with a value of 4.13”. This value was now slightly below the 84th percentile, but still
above the median cumulative value for this time of year. The final two observations of 5.97” on August
31st and 6.74” on September 30th both fell between the 50th and 84th percentiles, indicating that
cumulative precipitation kept pace ahead of the long-term median values and were wetter than
historical values through the end of the season. The relatively frequent observations, every couple of
weeks, help detect some subtle shifts in the timing of precipitation throughout the season. Reading the
gauge once in the season at the end of the September would have missed the potential impact of the
early season dry spell on subsequent range conditions and water resources.
Cumulative precipitation is a bit
different than the way we typically
see precipitation represented in
discrete daily, monthly or seasonal
totals on maps and charts. This is the
running total from some start date,
consistent with the way precipitation
accumulates in a PVC gauge over
time. You can check the depth of
water in the PVC gauge at various
times over a season and this value
will represent the cumulative
precipitation total until you empty
the gauge.
6 DRAFT – v1.1-May2017
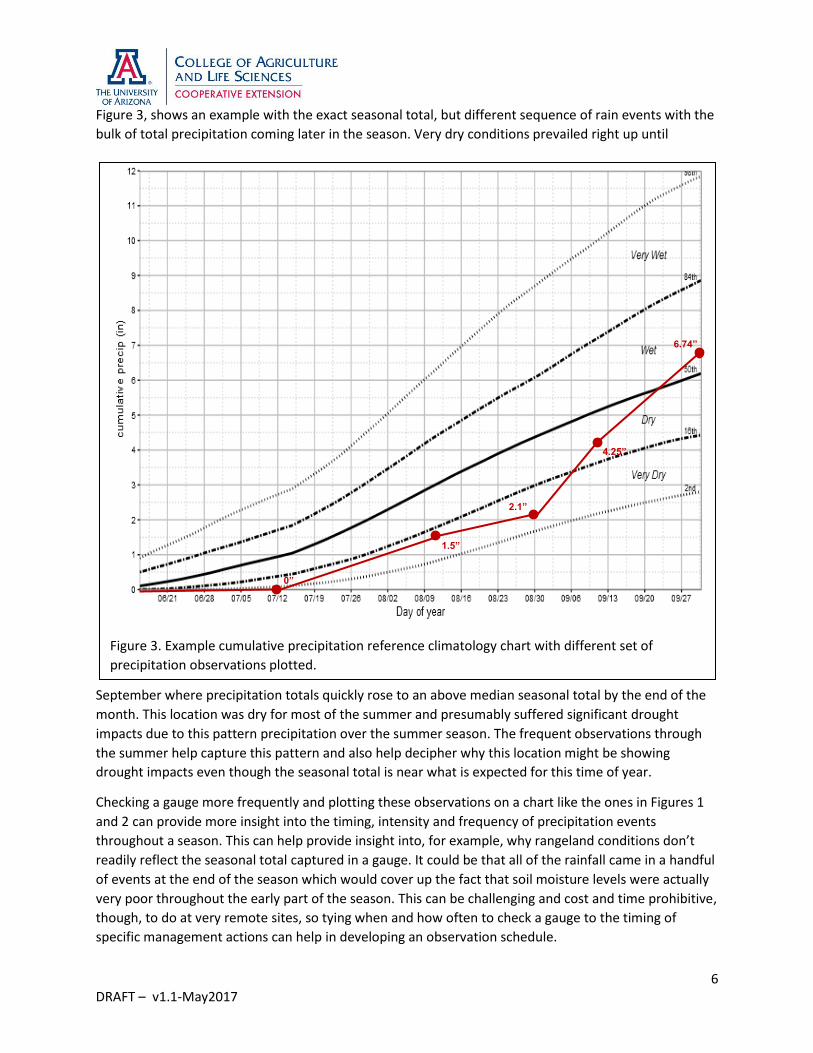
Figure 3, shows an example with the exact seasonal total, but different sequence of rain events with the
bulk of total precipitation coming later in the season. Very dry conditions prevailed right up until
September where precipitation totals quickly rose to an above median seasonal total by the end of the
month. This location was dry for most of the summer and presumably suffered significant drought
impacts due to this pattern precipitation over the summer season. The frequent observations through
the summer help capture this pattern and also help decipher why this location might be showing
drought impacts even though the seasonal total is near what is expected for this time of year.
Checking a gauge more frequently and plotting these observations on a chart like the ones in Figures 1
and 2 can provide more insight into the timing, intensity and frequency of precipitation events
throughout a season. This can help provide insight into, for example, why rangeland conditions don’t
readily reflect the seasonal total captured in a gauge. It could be that all of the rainfall came in a handful
of events at the end of the season which would cover up the fact that soil moisture levels were actually
very poor throughout the early part of the season. This can be challenging and cost and time prohibitive,
though, to do at very remote sites, so tying when and how often to check a gauge to the timing of
specific management actions can help in developing an observation schedule.
Figure 3. Example cumulative precipitation reference climatology chart with different set of
precipitation observations plotted.
6.74”
0”
4.25”
1.5”
2.1”

7 DRAFT – v1.1-May2017
Putting it all together: Connecting decisions with precipitation observations Having a seasonal precipitation reference climatology chart like the ones in figures 2 and 3 could help
support developing a decision calendar which would help you decide when to check precipitation
observations at different management areas and what to do if the observation represents drier or
wetter conditions than would be expected for that date and location. Take figure 4 as an example which
represents the summer monsoon season (June through September) precipitation at a location in
Arizona. This season provides critical precipitation to support summer forage production and subtle
shifts in timing, intensity and rain event frequency can impact that production in subtle ways. The figure
shows a precipitation monitoring plan with three observation points through the summer to:
1) anticipate the timing of forage “green up” in the current or next pasture in a rotation
2) assess ‘near peak’ forage production to assess whether or not adjustments to the rotation
schedule are necessary
3) final check of conditions at the end of the season to assess total precipitation amounts and the
carry over in production that will be available for subsequent seasons.
Figure 4: Example of likely decision points regarding livestock management over the course of a
summer monsoon season.
8 DRAFT – v1.1-May2017
In this example, based on prior experience and ability to check gauges throughout the season three
dates were settled on for this plan. The first check at July 20th indicated that no precipitation had fallen
yet at this location which is unusual given the precipitation climatology curves on the chart. Zero
precipitation at this date is near record dry for this location falling below the 2nd percentile curve. This
may indicate that a substantial delay in green up will occur and may require delaying moving the herd
into this pasture if forage “green up” was expected before entry.
The second observation point in this plan occurred on August 23rd, near the middle of the summer
monsoon growing season with the expectation that ‘near peak’ forage conditions would be occurring
depending on rainfall up to this point. The observed precipitation was 3 inches at this point and just
below the median expected cumulative precipitation for this date or slightly drier than expected. Forage
conditions may be lagging behind expectations as well given this amount of precipitation. This mid-
season observation can serve to assess how long you can stay in this pasture and whether or not any
course corrections need to be made to the grazing schedule going forward.
The final observation made at the end of the season on September 30th, served as a wrap up assessment
of total precipitation and conditions at the site. The observation of 6.74” was just above the long-term
median value and would suggest site conditions would be near average as well.
The observations made at the beginning of the season with the late start, slightly dry conditions at the
midpoint and the final near median observation probably tell a richer story together than the just the
final observation alone. Overall production at the site may be less than expected given the late start and
mediocre precipitation in the middle of the season, even though the final total is near median. The final
observation also gives you a chance to assess how much carryover forage will be available in subsequent
seasons allowing for moving directly into the next seasons plan. This type of monitoring plan can be
made for any season or for the whole 12 months seasonal cycle if that makes more sense for your
operation.
Collecting additional, supporting observations Precipitation observations, even with climatological context, only provide part of the story when
determining a management decision. When visiting a gauge, consider collecting additional observations
of range and forage conditions, spring or water tank levels if nearby and any other observations that will
help you interpret your precipitation values. These observations can be entered on your Precipitation
Logbook sheet or in your myRAINge account or just jotted down in a field book. Also note if you took
any management actions at that time based on your observations. Over time, these observations will
grow into a valuable site specific dataset that will help tune up your management toolbox associated
with different precipitation observations.
Another valuable way of collecting these types of observations is by taking photos of the site when
visiting your gauge. Taking four photos in each cardinal direction (N-S-E-W) with the gauge in the
foreground provides a comprehensive view of the local site conditions. Here are several links to
additional resources on rangeland photopoint monitoring:
Using Repeat Color Photography as a Tool to Monitor Rangelands (L. Howery and P. Sundt,
1998) https://extension.arizona.edu/sites/extension.arizona.edu/files/pubs/az1024-2016_0.pdf
9 DRAFT – v1.1-May2017
Fast and easy rangeland monitoring using repeat photography (F. Mashiri, 2015)
http://ucanr.edu/blogs/blogcore/postdetail.cfm?postnum=16616
Photo Monitoring for Ranchers Technical Guide (A. Gearhart and K. Launchbaugh, 2015)
https://catalog.extension.oregonstate.edu/pnw671
Authors: Michael Crimmins, Mitchel McClaran, Julie Brugger, Ashley Hall, Doug Tolleson, Andrew
Brischke
Contributors: Rangeland Precipitation Monitoring Working Group consisting of members of the Gila
County Cattle Growers Association, ranchers with permits on the Tonto National Forest and staff with
the U.S. Forest Service-Tonto National Forest.
Acknowledgements: Special thanks to B. Benne, R. Tanner, and M. Hemovich for providing initial project
ideas and guidance. Funding provided by Western Extension Risk Management Education program.
Questions or comments? Contact: Mike Crimmins Associate Professor & Extension Specialist - Climate Science Department of Soil, Water, & Environmental Science The University of Arizona [email protected] ph (520)626-4244 fax (520)621-1647
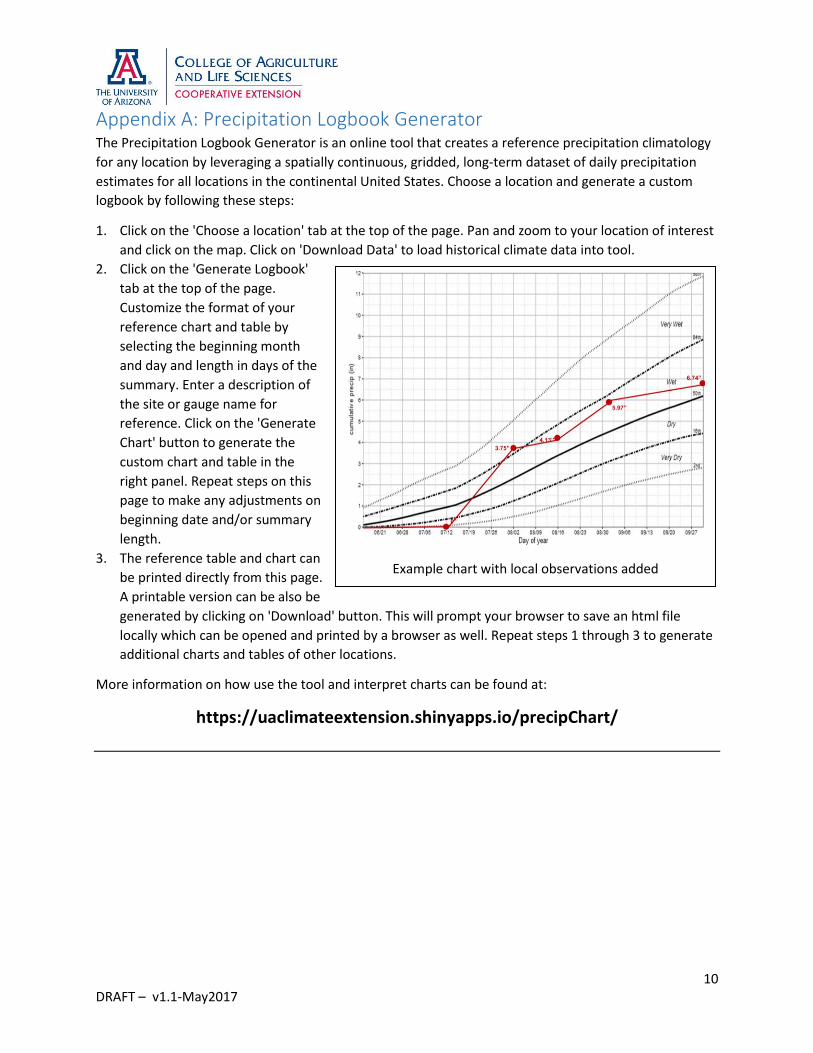
10 DRAFT – v1.1-May2017
Appendix A: Precipitation Logbook Generator The Precipitation Logbook Generator is an online tool that creates a reference precipitation climatology
for any location by leveraging a spatially continuous, gridded, long-term dataset of daily precipitation
estimates for all locations in the continental United States. Choose a location and generate a custom
logbook by following these steps:
1. Click on the 'Choose a location' tab at the top of the page. Pan and zoom to your location of interest
and click on the map. Click on 'Download Data' to load historical climate data into tool.
2. Click on the 'Generate Logbook'
tab at the top of the page.
Customize the format of your
reference chart and table by
selecting the beginning month
and day and length in days of the
summary. Enter a description of
the site or gauge name for
reference. Click on the 'Generate
Chart' button to generate the
custom chart and table in the
right panel. Repeat steps on this
page to make any adjustments on
beginning date and/or summary
length.
3. The reference table and chart can
be printed directly from this page.
A printable version can be also be
generated by clicking on 'Download' button. This will prompt your browser to save an html file
locally which can be opened and printed by a browser as well. Repeat steps 1 through 3 to generate
additional charts and tables of other locations.
More information on how use the tool and interpret charts can be found at:
https://uaclimateextension.shinyapps.io/precipChart/
Example chart with local observations added
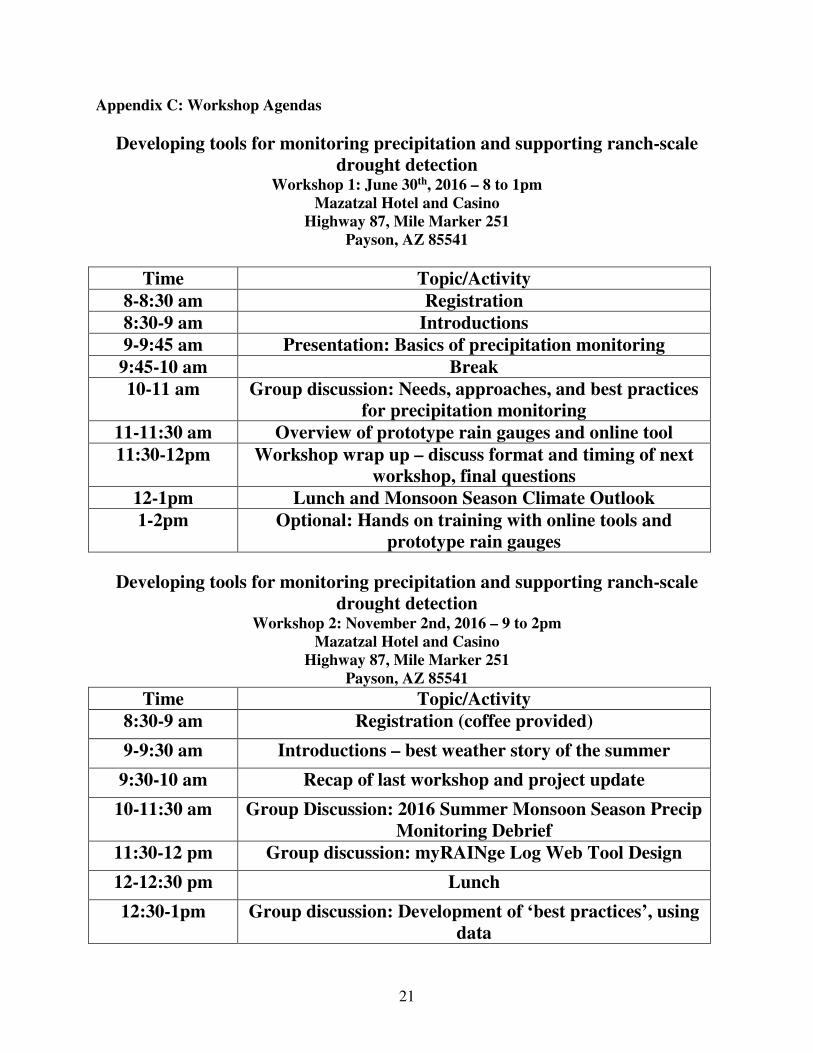
21
Appendix C: Workshop Agendas
Developing tools for monitoring precipitation and supporting ranch-scale
drought detection Workshop 1: June 30th, 2016 – 8 to 1pm
Mazatzal Hotel and Casino
Highway 87, Mile Marker 251
Payson, AZ 85541
Time Topic/Activity
8-8:30 am Registration
8:30-9 am Introductions
9-9:45 am Presentation: Basics of precipitation monitoring
9:45-10 am Break
10-11 am Group discussion: Needs, approaches, and best practices
for precipitation monitoring
11-11:30 am Overview of prototype rain gauges and online tool
11:30-12pm Workshop wrap up – discuss format and timing of next
workshop, final questions
12-1pm Lunch and Monsoon Season Climate Outlook
1-2pm Optional: Hands on training with online tools and
prototype rain gauges
Developing tools for monitoring precipitation and supporting ranch-scale
drought detection Workshop 2: November 2nd, 2016 – 9 to 2pm
Mazatzal Hotel and Casino
Highway 87, Mile Marker 251
Payson, AZ 85541
Time Topic/Activity
8:30-9 am Registration (coffee provided)
9-9:30 am Introductions – best weather story of the summer
9:30-10 am Recap of last workshop and project update
10-11:30 am Group Discussion: 2016 Summer Monsoon Season Precip
Monitoring Debrief
11:30-12 pm Group discussion: myRAINge Log Web Tool Design
12-12:30 pm Lunch
12:30-1pm Group discussion: Development of ‘best practices’, using
data

22
1-1:30pm Project deliverables and structure for workshop #3
1:30-2pm Wrap up and Evaluation
Rangeland Precipitation Monitoring Workshop June 15, 2017 – 9:00am - 2:30pm
(Check-in begins at 8:30am) Bullion Plaza Cultural Center
150 N Plaza Circle Miami, Arizona 85539-1629
Time Topic/Activity
8:30-9 am Registration
9-10 am Workshop and project Overview
10-10:15am Break
10:15-11 am Rangeland Precipitation Monitoring Best Practices and
Applications
11:00-12:00 pm Do-it-yourself Rain Gauge Construction Guide
12:00-1:00 pm Lunch
1-2 pm Introduction to myRAINge Log – online precipitation
data management tool
2-2:30 pm Next steps, wrap up and evaluation
2:30-3:30 pm Post workshop hands on session with gauges and tools

23
Appendix D: Rangeland Precipitation Monitoring Workshop Report Evaluations
Rangeland Precipitation Monitoring Workshop Evaluations Summary
15 June, 2017, Miami, AZ N = 24
1. Overall, how valuable was this Workshop?
2. What is your opinion of the design of the rain gauge?
3. How likely are you to use one of the rain gauges introduced in the Workshop?
4. How likely are you to build you own rain gauges that use this design?
5. How much did the Workshop increase your understanding of best practices for ranch-scale
precipitation monitoring?
6. How much did the Workshop increase your understanding of how to analyze and interpret
precipitation data you have collected?
Greatly
19 (79.2%)
Moderately
5 (20.8%) Minimally Not at all Undecided
Very
favorable
19 (79.2%)
Somewhat
favorable
4 (16.7%)
Unfavorable Very
unfavorable
Undecided
1 (4.2%)
Very likely
21 (87.5%)
Somewhat
likely
2 (8.3%)
Unlikely
1 (4.2%) Very unlikely Undecided
Very likely
10 (41.7%)
Somewhat
likely
12 (50.0%)
Unlikely
1 (4.2%) Very unlikely Undecided
Greatly
13 (54.2%)
Moderately
8 (33.3%)
Minimally
3 (12.5%) Not at all Undecided
Greatly
11 (45.8%)
Moderately
13 (54.2%) Minimally Not at all Undecided
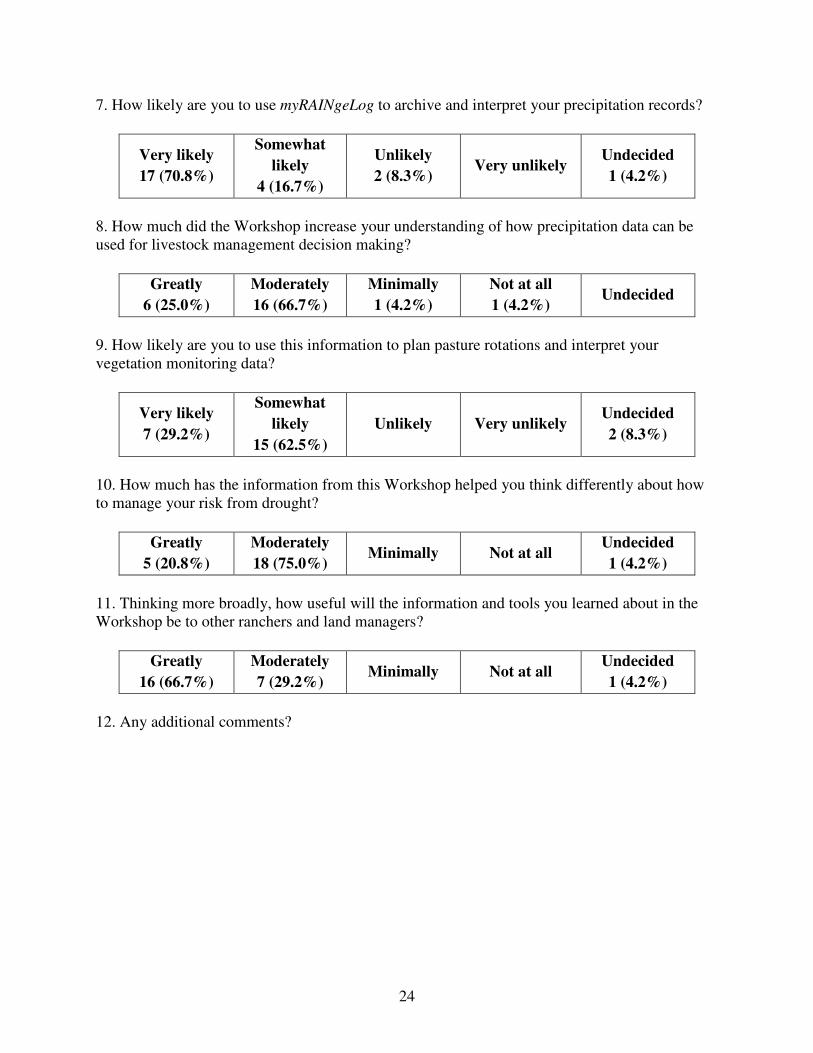
24
7. How likely are you to use myRAINgeLog to archive and interpret your precipitation records?
8. How much did the Workshop increase your understanding of how precipitation data can be
used for livestock management decision making?
9. How likely are you to use this information to plan pasture rotations and interpret your
vegetation monitoring data?
10. How much has the information from this Workshop helped you think differently about how
to manage your risk from drought?
11. Thinking more broadly, how useful will the information and tools you learned about in the
Workshop be to other ranchers and land managers?
12. Any additional comments?
Very likely
17 (70.8%)
Somewhat
likely
4 (16.7%)
Unlikely
2 (8.3%) Very unlikely
Undecided
1 (4.2%)
Greatly
6 (25.0%)
Moderately
16 (66.7%)
Minimally
1 (4.2%)
Not at all
1 (4.2%) Undecided
Very likely
7 (29.2%)
Somewhat
likely
15 (62.5%)
Unlikely Very unlikely Undecided
2 (8.3%)
Greatly
5 (20.8%)
Moderately
18 (75.0%) Minimally Not at all
Undecided
1 (4.2%)
Greatly
16 (66.7%)
Moderately
7 (29.2%) Minimally Not at all
Undecided
1 (4.2%)