range-wide population estimation and monitoring for lesser … · 2013-12-24 · range-wide...
TRANSCRIPT
1
Range-wide Population Estimation and Monitoring for
Lesser Prairie-chickens:
Sampling Design and Pilot Implementation
Photo by Joel Thompson, WEST, Inc.
2003 Central Avenue, Cheyenne, WY 82001 Phone: 307-634-1756; Fax: 307-637-6981

2
Range-wide Population Estimation and Monitoring for Lesser Prairie-chickens: Sampling Design and Pilot Implementation
Lyman McDonald Jim Griswold Troy Rintz
Western EcoSystems Technology, Inc. 2003 Central Avenue
Cheyenne, Wyoming 82070
Prepared for
Western Association of Fish and Wildlife Agencies c/o Bill Van Pelt
WAFWA Grassland Coordinator Arizona Game and Fish Department
5000 W. Carefree Highway Phoenix, Arizona 85086
December 7, 2011
ABSTRACT: Lesser prairie-chickens (LEPC) breed in relatively open areas (e.g., low visual obstruction and low horizontal cover) of grasslands where males congregate to perform a courtship dance. This area is known as a lek. After mating, most females will nest within 3.2 km (2 miles) of the lek site. Due to this high lek affinity, managers monitor the abundance of this life cycle component for population trends. A range-wide sampling framework and survey method is being developed to estimate total abundance of active leks for the population of LEPC. In addition, standard operating procedures are being developed for aerial surveys and ground truthing surveys. The methods are being developed with the assistance of core members of the Lesser Prairie-Chicken Interstate Working Group (LPCIWG). It is anticipated that the plan will be implemented in a pilot study in the spring of 2012. This study plan and results of the pilot study will provide managers within the Great Plains Landscape Conservation Cooperative (GPLCC) a more consistent approach for trend analyses of abundance of LEPC leks across the species’ range.
INTRODUCTION: Within the five states of its historic range (Texas, Oklahoma, Kansas, New Mexico, and Colorado), the LEPC remains present on sand sagebrush (Artemesia filifolia) and mixed-grass prairies of western Kansas and eastern Colorado, through portions of northwest Oklahoma, the northeast Texas panhandle, and into the shinnery oak (Quercus havardii) and sand sagebrush habitat of eastern New Mexico and western Texas. All states within the occupied range monitor LEPC breeding populations annually, however, monitoring efforts have differed markedly among agencies and inferences have been made about populations using a variety of methods.

3
This variation in survey effort complicates attempts to understand LEPC population trends and makes comparisons among areas and agencies difficult. This survey design utilizes and builds upon the knowledge, information, and expertise of the five state wildlife agencies to develop and test a consistent LEPC range-wide sampling framework to estimate abundance of active leks and trends in lek abundance over time. The design will provide managers within the GPLCC a consistent approach for estimating LEPC lek population sizes and trends across the five-state species range.
OBJECTIVES:
There are three objectives of this study design and pilot data collection. They are: 1) To develop a range-wide aerial survey methodology that will be implementable by all 5 states; 2) To test the survey methodology for applicability and costs; and 3) To develop cost estimates for implementing a range-wide survey effort. The study design is developed with the assumption that it will be applicable for the study of trend in lek abundance over a 5 to 25 year period of time. STUDY AREA AND SAMPLING FRAME: The study area for a range wide survey of LEPC active leks includes the lesser prairie-chicken range in 2011 (Southern Great Plains Crucial Habitat Assessment Tool, see the map available at http://www.kars.ku.edu/geodata/maps/sgpchat/). The 2011 LEPC range was expanded in Kansas to include habitat with relatively high probability of lek occurrence based on a habitat suitability model developed for the Western Governors’ Association (Online Lesser Prairie-Chicken Habitat Mapping Tool, http://www.oklahomafarmreport.com/wire/news/2011/11/02055_LesserPrairieChicken11012011_132701.php). In addition the small, convoluted areas in the 2011 LEPC range were expanded by a 7.5 km buffer to better accommodate 15 x 15 km survey blocks. The expanded 2011 LEPC range is outlined in red in Figure 1. The outer boundary for potential survey in 2013 or later is currently defined as a 30-mile buffer (48.27 km buffer) around the expanded 2011 LEPC range (Figure 1). The current sampling frame is defined by all 15 x 15 km grid cells using the USA Contiguous Albers Equal Area Conic USGS projection which overlap the outer boundary of the expanded 2011 LEPC range by 10% or more. Strata 1 is defined by all 15 x 15 km cells which overlap the expanded 2011 LEPC range by 50% or more (total = 536 cells). A sample of grid cells from Strata 1 will be surveyed, flying two 15 km x 400 m transects in each, during the pilot work, spring 2012. Further stratification based on habitat type is not recommended at this time, because changes in habitat are expected over the proposed 25 year lifetime of the study design. Strata 2 is defined as the remaining 921 cells in the sampling frame after excluding cells in Strata 1. The pilot study design does not include survey of cells in Strata 2 in spring, 2012. Also, note that the outer boundary of Strata 2 may be changed in future surveys depending on results of the pilot study, funds available, predictions of suitable LEPC habitat based on the Western Governors’ Association tool, or other new information.

4
Figure 1. The study area is currently defined by a 30-mile buffer (48.27-km buffer) around the expanded 2011 LEPC range. Grid cells (15 x15 km) are defined to be in Strata 1 if they overlap the expanded 2011 LEPC range by 50% or more (total = 536 cells). Strata 2 consists of the remaining cells which overlap the 48.27-km buffer by 10% or more (total = 921 cells).

5
METHODS:
Sampling Procedure: Grid cells in Strata 1 were ranked by an equal probability sampling procedure known as Generalized Random Tessellation Stratified (GRTS) sampling (Stevens and Olsen, 2004). GRTS samples maintain the spatial dispersion of a sample for areal resources such that any contiguous subset, if taken in order, is a representative sample of the target population. Cells can be dynamically removed from the ranked list and the next cells on the list added to the sample as we discover non-target or inaccessible cells, e.g., military lands, if any exist. A potential sample of Strata1cells for survey in the 2012 spring pilot study is illustrated in Figure 2 which shows the first 217 grid cells on the GRTS list. The entire GRTS ordered list of 536 cells is in Appendix D, where UTM coordinates of the center point of the grid cells are given. Survey Platform: When flushed by a helicopter, lesser prairie-chickens in Texas returned to the lek and resumed pre-disturbance behavior within an average of approximately 7 minutes, suggesting that aerial surveys can be conducted using a helicopter without disruption to the lesser prairie-chicken lek dynamic (McRoberts et al. 2011a). The survey platform used in the McRoberts et al (2011a) study and recommended for the spring 2012 pilot study is the Raven II (R-44) (Robinson Helicopter Company, Torrance, CA) helicopter accommodating two observers in the rear seats, and a third observer in the front seat.

6
Figure 2. A potential sample of cells for survey in the 2012 spring pilot study is illustrated by the first 217 grid cells on the GRTS list (Appendix D).

7
Standard Operating Procedure. The Standard Operating Procedure (SOP) for conducting the aerial surveys is provided in Appendix A. A summary is given here.
1. Aerial surveys will be conducted in a R-44 helicopter or equivalent with 3 observers.
2. The study area will be stratified into two strata (Figure 1).
a. Survey effort in the 2012 pilot study will be restricted to Strata 1. b. No survey units will be identified in Nebraska.
3. Grid cells to be surveyed are ranked in a list using the Generalized Random Tessellation Stratified (GRTS) sampling procedure (Appendix D).
a. Any consecutive subset of grid cells from the list forms an equal probability sample of cells.
4. Two 15 km x 400 m transects will be flown north to south or south to north in each selected unit.
5. The starting point of the first transect will be randomly located in the interval [200 m,
7300 m] on the base of the cell and the second transect will be located 7500 m to the
right.
6. Transects will be flown at 60 km per hour and 25 m elevation above ground. 7. Surveys will be conducted between March 15 and May 15. 8. Surveys will not be flown during any type of precipitation events, when the wind is
blowing greater than 25mph, or if the forward visibility is less than 2mi. 9. Surveys will be conducted from sunrise until 2.5 hours after sunrise during the peak
period of lek attendance. 10. The front seat observer will focus on detection of leks on and close to the transect line
and also make observations of leks detected in the field of view of the right-hand rear seat observer.
11. A double sampling method will be implemented on one side of the helicopter. a. Leks detected by the front seat observer will be classified as: 1) leks in the strip
close to the transect line and not visible to the rear seat observers and 2) leks in the field of view of the right-hand rear seat observer. By using a mark-recapture analysis on leks in the field of view of the right-hand rear seat observer we can estimate the probability of detection on the inside edge of that field of view.
b. The front seat observer and rear seat observer will maintain a cardboard barrier between the observers to help maintain independence of observations.
c. Observers will record approximate perpendicular distance from the center of a “potential lek” to the transect line, count any observed LEPC seen, and remain quiet until confident that the other observer has either seen or missed the lek.
d. Leks will be announced and the helicopter will return to the lek so that the GPS coordinates of the approximate center can be recorded for more accurate computation of the perpendicular distance from the transect.
12. The rear seat observer behind the pilot will maintain approximately the same view of a strip on her/his side as used by the other rear seat observer.
a. The pilot’s primary function is to fly the helicopter, but should the pilot detect a lek missed by the rear seat observer on his/her side, the detection will be announced, the pilot will return to the lek and the coordinates recorded.
b. Leks detected by the pilot but not by the rear seat observer will be recorded but cannot be used in estimation of lek density.

8
13. In addition to the number of LEPC counted, other covariates recorded will include: size of lek, whether they are man-made or natural (McRoberts et al., 2011b), and habitat type.
14. Ground truthing surveys will be conducted following SOPs developed by the LPCIWG (Appendix B).
15. Leks with five or more birds observed from the helicopter do not require confirmation from the ground.
16. Previously unknown leks of 1 to 4 birds should be visited at least once to confirm their status.
17. Leks detected in areas of overlap of LEPC and Greater Prairie Chicken (GRPC) should be visited to confirm if the lek is exclusively LEPC, exclusively GRPC, or a mixture of both species.
18. Individual States may be able to contribute effort for ground truthing potential leks. The aerial survey crew will assist with ground truthing as time allows.
19. Locations of all potential leks detected during deadhead flights and turns will be recorded along with the number of LEPC counted.
COSTS:
Anticipated survey effort, assumptions for ‘off survey and deadhead’ flying time and survey budget in the spring 2012 pilot study is illustrated in Table 1 under the assumption that $230,000 is available to conduct the survey. R-44 helicopter rental rate was assumed to be $525/hour. Labor and travel expenses were estimated at $2400/day for four observers and pilot. Assuming these rates, two transects can be flown in approximately 217 blocks in approximately 54 days. The target number of blocks to be surveyed in the pilot study will be adjusted based on actual costs encountered.
Table 1. Anticipated survey effort and survey budget in the spring 2012 pilot study under the assumption that the R-44 rental cost is $525/hour.
Survey Item Per Unit Total
Transect Survey Hours 2.0 hr/dy 108.5
Deadhead Hours Within Survey Window
0.5 hr/dy 27.125
Deadhead Hours Outside Survey Window
1.0 hr/dy 54.25
Flight Hours 3.5 hr/dy 189.875
Flight Days 3.5 hr/dy 54.25
Sample Blocks 4 blks/dy 217
Budget Item Per Unit Total
Total Budget - $230,000
Labor and Travel Expenses $2,400/dy $130,200
R-44 Rental $525/hr $99,684
Total - $229,884

9
ESTIMATED PRECISION IN THE PILOT SURVEY:
Simulations of expected precision in the 2012 pilot survey were conducted under the following assumptions:
1. Maximum expected lek density in Strata 1 is approximately 0.062 leks/km2 (6.25 mi2/lek). This assumption is supported by an observed density of 0.062 leks/km2 (6.25 mi2/lek) in ground surveys conducted in Kansas, 2011.
2. Minimum expected lek density in Strata 1 is approximately 0.031 leks/km2 (12.5 mi2/lek). This assumption may be too low based on observed densities reported in unpublished thesis research conducted in the Panhandle of Texas (Jennifer Timmer, personal communication).
Simulating leks available for detection
3. Random locations, representing the locations of leks, were generated across 536 15 x 15 km grid cells at the two assumed densities. The 536 grid cells represented available sample blocks. Two hundred seventeen GRTS sample blocks were then drawn from the available 536 cells, and the number of GRTS sample blocks containing one or more leks was determined. The number of leks available for detection by the survey crew in the two 400-m transects was simulated by a binomial response where the probability of inclusion was the surveyed proportion of each block.
This step likely introduces the largest source of variation in the simulation, however variation due to the probability of detection is simulated using binomial processes in steps 5 below.
4. Clustered locations, representing the locations of leks, were generated using a moderately clustered spatial point process over 536 available blocks. The number of leks available for potential detection by the survey crew was simulated using the above method for random locations.
Estimating the number of detected leks and estimating lek density
5. Simulations were conducted using p = 0.66 for the average probability of detection of a lek in the transects. The estimate p = 0.66 was selected as a compromise between values in the neighborhood of 0.89 reported in McRoberts et al. (2011b) and the value of 0.43 reported in more recent aerial surveys using a two seat helicopter in the Panhandle of Texas (personal communication, Jennifer Timmer). It was found by reviewing data from McRoberts et al. (2011b) that variability in probability of detection could be approximated by a binomial distribution. One thousand random values of probability of detection were generated from a binomial distribution having mean 0.66. These 1,000 simulated detectabilities were multiplied by the 1,000 simulated values of leks available for detection to obtain a simulation set of detected leks which included variability in detection.

10
Density ( D̂ ) was then estimated by summing the numbers of detected leks over all transects simulated, correcting for probability of detection, and dividing the estimated total detected by the total area surveyed.
Estimating precision of estimated lek density
6. The above procedure was repeated 1,000 times. Each simulation provided a new estimate of lek density so that 1,000 estimates were generated. Lek density and precision of estimated lek density was then computed. An estimate of the standard error (se) of estimated lek density was computed as the standard deviation of the 1,000 simulated density estimates. Ninety percent confidence intervals (CI) for estimated lek density were obtained as the 5th and 95th quantiles of the 1,000 density estimates. The coefficient of variation (cv) of lek density was determined by taking the ratio of the standard error and the mean of the simulated lek densities.
Results
Based on random dispersion of leks, a sample of 217 blocks, and average detection probability of p = 0.66, an optimistic prediction for coefficient of variation of estimated density would be in the neighborhood of 15% (Table 2). A coefficient of variation for estimated density of leks in the neighborhood of 25% for clustered leks is probably a more realistic target for results in the 2012 spring pilot study (Table 3). Table 2. Estimated density of leks (leks/km2) using detection probability p = 0.66 with
completely random spatial distribution. ( )ˆ /D Number of Detections Area Surveyed p= × ).
The estimate is based on a simulated population of leks with density at 0.031 leks/km2 (first row in table) and 0.062 leks/km2 (second row in table). Leks were generated randomly over 536 available blocks. Estimates include binomial variability in estimated detection probability.
90% CI 95% CI
D̂ ( )ˆˆse D ( )ˆˆcv D Low High Low High
0.031 0.004 0.145 0.024 0.039 0.022 0.040
0.062 0.006 0.103 0.052 0.073 0.050 0.074
Table 3. Estimated density of leks (leks/km2) using detection probability p = 0.66 with a
clustered spatial distribution for leks. ( ( )ˆ /D Number of Detections Area Surveyed p= × ). The
estimate is based on a simulated population of leks with density at 0.031leks/km2. Leks were generated using a moderately clustered spatial point process over 536 available blocks. Estimates include binomial variability in estimated detection probability.
90% CI 95% CI
D̂ ( )ˆˆse D ( )ˆˆcv D Low High Low High
0.031 0.008 0.25 0.019 0.044 0.016 0.048

11
DISCUSSION:
The recommended study design and methods for the 2012 pilot study were selected from numerous alternatives in the literature and others discussed in conference calls with the LPCIWG. The GRTS sampling procedure has many advantages: equal probability of selection, good spatial representation, and the ability to replace non-accessible units with the next cell on the list (Appendix D). One of the primary advantages is that the sample size within sub-strata (e.g., States or habitat type) can be changed by selection (or dropping) of the ranked cells that meet the criterion of interest. For example, the 2011 pilot study will have a certain sample size from the State of New Mexico. If additional precision is needed for, say, a one-time study of abundance in New Mexico, the next cells on the GRTS list from New Mexico could be selected while maintaining equal probability of selection within the State and good spatial representation. When complete, the 2012 pilot study will provide further information and results for refinement of the study design recommended for 2013 and beyond. In particular, we will have current information on costs and distribution and degree of clustering of LEPC leks in the study area. The number of blocks flown in the spring 2012 pilot study will be determined by actual costs encountered for helicopter rental, labor and travel expenses. Estimated density of leks will have a certain precision depending on the realized sample size. Regardless of the precision realized in the 2012 pilot study, the observed data will be re-sampled with replacement in computer intensive exercises to simulate relationships between sample size and precision in future studies. Precision of a one-time estimate of abundance (status of the universe of active leks) is important, however, the sample size and precision necessary for detection of important trends and abrupt changes in the abundance of LEPC leks is of equal or greater interest. We will also simulate the sample size necessary to detect important trends and abrupt changes in the abundance of active leks. For example, we will estimate the sample size necessary to detect a decrease (increase) in lek abundance of, for example, 20% over 10 years, or other time periods. It is anticipated that the sample size necessary to detect a statistically significant decline, for example, 20%, over several years will be smaller than the sample size necessary to detect a statistically significant change of 20% between any two years if the same sample of blocks are surveyed in any future surveys. An attempt will be made to use two helicopters and survey crews and conduct the 2012 pilot study during the peak periods of lek attendance in the five states. We will monitor lek detection rates over the part of the March 15 to May 15 season in which flights are made. Also, detection rates will be monitored over the daily survey period from sunrise to 2.5 after sunrise. Modifications in the survey season, in the daily survey period, or to other components of the Standard Operating Procedure (Appendix A) may be recommended based on experience gained in and results of the 2012 pilot study. Of particular interest for any surveys in 2013 and beyond is the amount of surveying that should be done in Strata 2 (Figure 2) and, in fact, the size and shape of Strata 2. Recommendations on this and other issues will be given in the Final Report due August 31, 2012.
12
ACKNOWLEDGEMENT
The recommended study design and methods were developed with the assistance of the following members of the Lesser Prairie-Chicken Interstate Working Group: Bill Van Pelt, WAFWA Grassland Coordinator, Arizona Game and Fish Department; Jim Pitman, Kansas Department of Wildlife, Parks and Tourism; Sean Kyle, Texas Parks and Wildlife Department; David Klute, Colorado Division of Parks and Wildlife; Grant Beauprez, New Mexico Dept. of Game and Fish; and Doug Schoeling, Oklahoma Dept. of Wildlife Conservation. Without their knowledge of the potential range, life history and demographics of the LEPC and input during numerous conference calls and a face-to-face meeting, development of this study plan would not have been possible. Valuable assistance was also received from Michael Houts, GIS/Remote Sensing Specialist, Kansas Biological Survey. We acknowledge input of these individuals, but must assume responsibility for the final recommendations and any errors remaining in the report. This work was accomplished by the financial support of the Great Plains Landscape Conservation Cooperative through a grant to the Western Association of Fish and Wildlife Agencies.
REFERENCES:
McRoberts, J.T., M.J. Butler, W.B. Ballard, M.C. Wallace, H.A. Whitlaw, and D.A. Haukos. 2011a. Response of lesser prairie-chickens on leks to aerial Surveys. Wildlife Society
Bulletin 35: 27-31. McRoberts, J.T., M.J. Butler, W.B. Ballard, H.A. Whitlaw, D.A. Haukos, and M.C. Wallace.
2011b. Detectability of Lesser Prairie-Chicken Leks: A Comparison of Surveys From Aircraft. The Journal of Wildlife Management 75:771–778.
Stevens, D. L., Jr., and Olsen, A. R. (2004), Spatially Balanced Sampling of Natural Resources.
Journal of the American Statistical Association, 99, 262-278.

13
APPENDIX A
LESSER PRAIRIE-CHICKEN LEK SURVEY
STANDARD OPERATING PROCEDURES
Photo by Joel Thompson, West, Inc.
2003 Central Avenue, Cheyenne, WY 82001 Phone: 307-634-1756; Fax: 307-637-6981

14
Introduction
This appendix contains guidance on methods for aerial block/line transect surveys for detection of active lesser prairie-chicken (Tympanuchus pallidicinctus) (LEPC) leks.
Equipment Checklist
The following equipment should be taken aboard the aircraft each day of the survey: 1. Laptop computer with fully charged battery, power cord and inverter, 2. GPS unit with 2 sets (4 AA) of spare batteries, and USB cable, 3. Pencils and clipboard with 10 data sheets, 4. Maps of region showing topography, locations of airports, and survey transects, 5. Printed list of transect waypoints, 6. MapSource Topo CD, 7. Helmets and flight suits, 8. Cardboard divider, 9. Cell phone with the following numbers programmed:
a. Troy: 307-421-8437, b. WEST main office: 1-888-634-1756.
Flight Protocol
Flight Safety – The safety of the crew members should be the first consideration before flights start each day. Please see Safety Equipment and other sections below.
Safety Equipment – Helmets must be worn during take-off, landing, and while flying on transect and at low altitudes. Nomex flight suits should be worn by observers at all times in the aircraft.
Flight Crews – One crew of 3 observers and one pilot are required to complete the surveys. The crew will complete approximately 190 hours of transect flight and ferry time between transects (Table 1). There is a 62-day window for completing surveys (March 15 – May 15). This includes days not spent flying due to weather, travel, and ground days for the pilot, as required by the FAA. Crew leaders will strive to complete an average of 4 blocks (8- 15 kilometer [km] transects) per day. To reach this goal, the crew should strive for completing 5 blocks on days when weather and logistics permit. Observers/Aircraft – There will be three observers in the Raven II (R-44) (Robinson Helicopter Company, Torrance, CA) helicopter – 2 main observers in the rear seats, and a third observer acting as a ‘double-observer’, navigator, and data recorder in the front seat. Along with actively searching for lesser prairie-chicken leks, the observer in the front seat of the aircraft will help the pilot with navigation and recording positions of observed leks using the GPS. Analysis of observation data from both front and back seat observers on the right side of the aircraft uses mark-recapture methodology for estimation of probability of detection functions and correction of lesser prairie-chicken lek densities. Observers will rotate positions in the aircraft daily to ensure that differences in observer abilities are distributed across all positions in the aircraft.

15
Timing of Surveys – Surveys will begin March 15th and end no later than May 15th. Depending on weather conditions, surveys will be conducted from sunrise to 2.5 hours after sunrise. Weather Restrictions – The relative safety of each flight will be determined in the field and will depend upon weather conditions and local flight restrictions. Crew leaders and the pilot will determine if standard survey protocol can be followed in a safe manner. Surveys will not be flown if any precipitation event is taking place, when wind speeds are >40 kilometer per hour (kph) (25 miles per hour [mph]), or visibility is less than 3.2 km (2 miles [mi]). If the pilot or crew leader determines that surveys cannot be conducted safely, surveys will be halted until conditions improve.
Transect Flights – Safety should be the primary concern during the survey. Surveys will be conducted at an approximate air speed of 60 kilometer per hour (kph) (37 mile per hour [mph]), and the helicopter will be maintained at an altitude of 25 m (82 feet [ft]) above the ground level (AGL). Surveys will not be completed over housing, livestock, or large water bodies. During the survey, all crew members and pilot should carefully monitor the air speed and AGL to ensure the survey protocol is being followed consistently. Off-Transect Flight – The pilot will determine the most appropriate airspeed and altitude for flying between transects and airports. Transect Lines within Survey Blocks -- Two transects will be flown in each survey block in north to south or south to north direction insuring no potential overlap with surveyed ‘transect strips’ in other blocks (Figure 1). The first transect will be randomly located in the interval [200 m, 7300 m] on the base of the block and the second transect will be located 7500 m to the right. For example, if the starting point for the first transect is 355 m from the left hand edge, the ending point for the second transect will be at 355 m + 7500 m = 7855 m. Waypoints for the beginning and end of all transects in the planned survey blocks and in alternates will be determined prior to the start of the survey. A list of alternate survey blocks and transects will be created. This list should be used to make up for survey blocks whose transects cannot be flown. If a survey block is dropped because it is not accessible, then the preferred option is the next survey block on the GRTS list. However, if the next survey block on the GRTS list would substantially increase costs and time to complete the survey then the closest alternate survey block can be flown. A map of alternate survey blocks will be created.

16
Figure 1. 15 km by 15 km sample block showing random position of 400 m wide transects.
0 5 10 15
05
10
15
Easting (km)
Northing (km)
Lek/LEPC Observations
Lesser Prairie-Chicken Lek Observations -- Observers will concentrate on detecting displaying and flying LEPCs within 200 m of the helicopter. Observers should give more effort to detecting LEPC closer to the helicopter compared to longer distances. After a complete scan of the ground and the air in the first 100 m, the next ~200 m should then be scanned until one is certain all LEPC available to be seen are detected. Further distance zones are then searched in exactly the same manner.

17
Lesser Prairie-Chicken Lek and/or Bird Observations – A LEPC lek detection consists of an individual prairie chicken or group of prairie chickens sighted while flying on a designated transect. Lek/LEPC sighted while flying off transect, either to and from transect way-points and airports, will be recorded in the “off transect” section on the field data form. The pilot will fly to the lek so that the sighting can be verified and the observed location recorded. If a lek/LEPC is sighted while flying off transect in an attempt to verify a lek detection, the crew needs to determine if the new LEPC observation is independent of the original sighting. For example, one lek/LEPC is sighted while on transect and the aircraft is pulled off-line for closer inspection of and to obtain GPS coordinates of the Lek. Another lek is seen in the area and it is determined the new lek is related to the original (e.g., is a satellite lek), then the total abundance of LEPC would be recorded. However, if the new lek observed while off-line is believed to be an independent lek separated by at least 100 m from the original then the new lek will be recorded in the comments section of the field data form. New, independent lek/LEPC sighted off-transect cannot be included in the statistical analysis due to the extra search effort associated with the sighting, which can bias final estimates of LEPC lek density.
Reporting by Back-Left Observer – When a lek/LEPC is sighted on the left side of the aircraft by the back-left observer, the observer will immediately notify the rest of the flight crew. The observer will state lek/LEPC have been sighted on the left of the transect line, the visually estimated distance from the transect line, and the characteristics of the lek/LEPC location so that the pilot can navigate the aircraft closer to the lek. The rear seat observer with the field data form will begin recording the observation at this time. When the helicopter is directly above the location where the lek/LEPC was originally sighted, the front-right observer with the GPS will record the location in the GPS and announce the waypoint ID number. The waypoint ID on the field data form should match the waypoint recorded in computer. The observers need to communicate with each other to verify the GRTS grid cell being flown, the waypoint ID, and lek type.
Reporting by the Front-Right and Back-Right Observers – The front seat observer will focus on detections around the transect line (i.e., guard the line) and immediately announce detection that are not in the field of view of the rear seat observers. The front seat observer will also make observations of leks detected in the field of view of the right-hand rear seat observer (but without 100% detection). A double sampling method will be implemented on this side of the helicopter. Leks detected by the front seat observer will be classified as: 1) leks in the strip close to the transect line and not visible to the rear seat observers and 2) leks in the field of view of the right-hand rear seat observer. By using a mark-recapture analysis on leks in the field of view of the right-hand rear seat observer we can get an estimate of the probability of detection on the inside edge of that field of view.
Using this approach, the front and back seat observers on the right side of the helicopter will not immediately announce lek/LEPC sightings in the field of view of the rear seat observer. Instead, they wait an appropriate length of time (~5 seconds) to ensure the observed lek/LEPC are behind the helicopter and out of view of the other right seat observer. Once the observed lek/LEPC are out of view of the other observer, and no other lek/LEPC are in sight on the right side, then the observer(s) will announce the sighting, and the pilot will pull off-line so that the sighting can be verified and the observed location recorded. It is important that the observers, once off-line, pay

18
most attention to the location of the lek/LEPC in question so that the pilot can locate the lek. A determination will be made based on which observers (front, back, or both) on the right side observed the lek/LEPC while on transect. Once an observer on the right side of the aircraft has announced that lek/LEPC have been sighted, the field data form recorder will begin filling out the data sheet, making sure to indicate on the form which observer(s) on the right side of the aircraft detected the LEPC. This crucial piece of information is not meant to indicate which of the observers first called out the sighting, but whether only one or both of the observers on the right side actually detected the lek/LEPC while on transect.
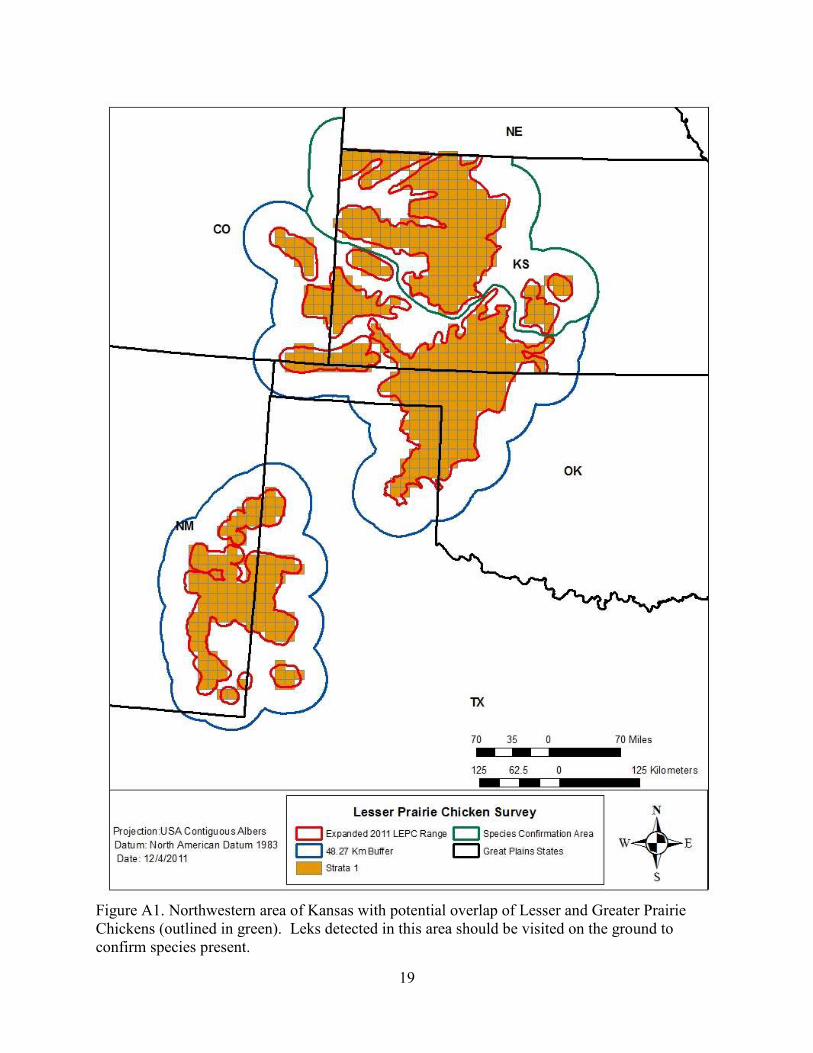
Daily rotation of the observers in the aircraft will allow for more flexibility in the methodology used to estimate detection functions for LEPC. The front right seat observer will always be responsible for the GPS unit and recording waypoints into the computer. The field data form responsibilities should be alternated daily between the two rear seat observers to ensure the effect of that responsibility is pooled across both sides of the aircraft. It is essential that the observers on the right side of the aircraft operate independently – i.e., one observer cannot be “clued in” when lek/LEPC are sighted due to movements of the other observer. Use of the cardboard divider will reduce visibility between the two observers on the right side of the aircraft and facilitate independence. Pilot Responsibilities – The pilot is responsible for safely flying survey transects while maintaining the desired AGL and airspeed. The observers are responsible for sighting LEPC and recording all sightings in the computer and on the field data form. If the pilot sights a LEPC, he or she should wait an appropriate length of time to allow the LEPC to pass out of view of the other observers (front and back seats). If the other observers in the helicopter do not announce that a sighting has been made, the pilot can then alert the observers that a LEPC lek was missed. This information, along with the habitat type and activity of the birds will be recorded in the “comments” section of the field data form. Once the observed lek/LEPC are out of view of the other observers, and no other lek/LEPC are in sight, then the pilot will announce the sighting, and the pilot will pull off-line so that the sighting can be verified and the observed location recorded. Lek/LEPC sighted by the pilot will not be used in estimation of total lek abundance. LEPC Observed Flying – Communication between observers will be the same for flying and displaying LEPC. If LEPC are observed flying and the location of the lek is not immediately obvious, the observers should estimate the perpendicular distance from the flying LEPC to the transect line. It is important to verify the sighting first, and then try to record location where the LEPC was first seen. Use of landmarks directly below the LEPC will help reduce measurement error. For all LEPC (lekking and flying), a visual estimation of the perpendicular distance of the LEPC from the transect line will be recorded and compared to the GPS measurement to help calibrate visual estimates by observers. If possible, the crew should determine the most likely location of a lek used by the flying birds. The location of the potential lek should be recorded and ground truthed using the Lek Confirmation Protocol, Appendix B. Mixed Species Areas - Both Lesser and Greater prairie-chicken can and do occur in portions of Kansas (Figure A1). If a lek is observed within this area, ground truthing will need to be conducted to determine actual species occupancy. See Lek Confirmation Protocol, Appendix B.
19
Figure A1. Northwestern area of Kansas with potential overlap of Lesser and Greater Prairie Chickens (outlined in green). Leks detected in this area should be visited on the ground to confirm species present.

20
Lesser Prairie-Chicken Groups that are less than 5 - If a group of LEPC are observed with size between 1 to 4 birds, a ground confirmation should be undertaken to determine if an active lek is actually present. See Lek Confirmation Protocol, Appendix B.
Recording Other Pertinent Data – Location of the helicopter, date, and time are automatically recorded in the computer by the GPS unit at fixed intervals (~ every 5 seconds). This permits plotting of the actual flight path versus the intended transect lines, and calculation of airspeeds. The crew leader should record the time of each take-off and landing. To record a waypoint (transect start and end points, LEPC locations, and habitat changes), click ‘control’ ‘w’ on the keyboard or use the mouse to select ‘tools’ and ‘waypoint’. The front-right observer will also record transect start and end points, and changes in habitat types below the transect line. This will provide a habitat profile for each transect line and allow estimation of the total amount of each habitat type in the study area. For a transect start point, name the waypoint ‘start,1,sgr,time’ for starting point of transect 1 which is over Short-grass Grassland habitat ‘start,2,cr,time’ for starting point of transect 2 which is over Crop Lands habitat. For a transect stop point, name the waypoint ‘stop,1,sp,time’ for the stopping point on transect 1 which is over Sand-sage Prairie habitat. Habitat Codes are: CR:Crop Land, SGR:Short-grass Grassland, TGR Tall-grass Grassland (with little or no shrubs, including CRP grassland), SP:Sand-sage Prairie, SH:Shinnery Oak (including other shrub dominated land), and OT:Other. For LEPC locations, name the waypoints ‘lpc1’, ‘lpc2’, etc. Waypoints given to the field data form recorder for insertion into the ‘Waypoint ID’ field on the data form will be ‘lpc1’, ‘lpc2’, etc. Good communication between the front right observer with the computer and GPS unit and the field data form recorder will ensure that LEPC records can be tied to recorded locations in the computer. Waypoints for habitat changes not at transect start or end points will be named ‘sgr,1,time’, for the first habitat change to Short-grass Grassland on transect 1. For example, if Transect 2 starts over Grassland, then crosses into Crop Land habitat, where the 3rd lek/LEPC is observed by this crew, and back over Grassland habitat, the following waypoints should be entered into the computer at the appropriate locations: ‘start,2,sgr,time’, ‘2,cr,time’, ‘lpc3’, ‘2,sgr,time’, and ‘stop,2,sgr,time’. Survey Block, Observer, and Weather Documentation – At the beginning and end of each survey flight when the aircraft is on the ground or in transit to the survey area, the field data form recorder is responsible for entering information for the individual survey block to be flown. Documentation includes, but is not limited to, the crew names and their positions within the helicopter, weather conditions, survey block to be flown, and the direction the flight line is to be flown (north-to-south or south-to-north). Weather information should include cloud cover percentage (0 to 100% CC), air temperature and wind speed.

21
Data Entry and Back-Up – At the end of each survey day, the crew leader will be responsible for entering data from the field data forms into the ACCESS database designed specifically for this study. This will help ensure that any discrepancies/errors in the field data forms are corrected while the survey under question is fresh in the minds of the crew. It will also serve as a backup in case field data forms are lost or damaged during the study. To save waypoint locations and information at the end of each survey day, open nRoute, select the ‘Waypoints’ tab, then ‘File’ and ‘Export’. Save the ‘gdb’ file and include the date in the file name.
Restricted Airspace and Other Restrictions on Flying -- At the end of each survey day, the crew needs to plan which transects and blocks will be flown the following day. This should be done with the help of the pilot, who can determine which airport(s) will be used for fueling, and refer to his/her flight maps and GPS to determine if the designated survey blocks/transects cross restricted or dangerous airspace.
Every effort has been made to identify restricted airspace prior to sending crews out into the field. If GRTS/transects are recognized as running through restricted airspace, over new housing/office building development, or close to a grass fire and access cannot be obtained or it is deemed unsafe, then the transects in the next survey block on the GRTS sample list should be flown if logistically feasible. The only circumstances under which transects in a survey block can be dropped or not fully completed are: grass fire; restricted airspace; crossing over large housing or industrial developments; or sudden dangerous weather or limited visibility. If transects in a survey block are dropped or not flown from start to end, the explanation of the deviation from the planned survey must be recorded on a field data form.
If a transect runs through a farmyard, town, small housing development, cattle feed lot, or there are other segments of a transect that should not be flown at low elevation in a helicopter, then those segments should be assumed to not contain lek/LEPC. The pilot should increase elevation and, if possible, avoid harassment of people or livestock. Start and end points of the surveyed segments of the transect must be recorded. Similarly, if development, forest fire, or restricted airspace only affects a portion of a transect, fly the length of transect not affected.
Example Comments on Field Data Form – The ‘Transect Comments’ section is located at the bottom of the field data form.
Transect # 13 was flown by the crew on 1 April 2012, starting at 7:30 am. This transect was flown in a north to south direction during good conditions – 10% cloud cover and no wind. Ryan and Rhett were on the right side of the aircraft, and Tory was the back-left observer.
Waypoint ID 28: This waypoint marks the location of a lek in which 2 LEPC were observed by Tory in the back-left position in the aircraft. Tory visually estimated the perpendicular distance from the transect line to the center of the lek to be 120 m. These birds flushed upon approach of the helicopter.

22
Waypoint ID 29: This waypoint marks the location directly under where lek/LEPC were first observed over SGR:Short-grass habitat, independently by both Rhett and Ryan. The lek/LEPC were about 200 m away from the transect line. Waypoint ID 31: This waypoint marks the location where approximately 5 adult male LEPC were observed on a lek in short grass open habitat by Tory. Visual estimation of the perpendicular distance from the transect line was 80 m. These LEPC did not flush when approached by the helicopter. Available Airports – Locations of airports which may be used during the 2011 Spring Pilot Study are illustrated in Figure A2.
Figure A2. Locations of airports which may be used for conduct of the Spring 2012 Pilot Study.

23
Appendix B
LEPC Aerial Survey
Lek Confirmation Protocol
• Lek detections with five or more birds observed from the helicopter do not require confirmation from the ground (Jennifer Timmer, personal communication).
• Previously unknown lek detections of 1 - 4 birds should be visited at least once to confirm their status between March 15 and May 15. Surveys should be conducted between thirty minutes before sunrise and two hours after sunrise. Do not conduct surveys when winds exceed 12 mph (Beaufort scale 4) or if raining. Light drizzle is acceptable.
• Surveyors should attempt to gain access to private land from the land owner or lease
holder. Trespassing must be avoided at all costs. If surveyors are unsure of the
ownership of a piece of property or if a road is not a public right of way, always assume
that you do not have access.
• Where access is granted or where leks are visible from a public road, use binoculars or a
spotting scope to count individual birds on the lek. Counts should be conducted from a
vehicle or a ground blind from roughly 75-200 m away to avoid flushing birds. If the
terrain and vegetation does not allow for observation from a distance, a flush count is
acceptable.
• In the event that access is not permitted, leks may be confirmed based on a detection
from public roads with visual observation or an auditory detections with a minimum of
two compass bearings to define the location of the lek. When recording compass
bearings, try to ensure that bearings are 70-110 degrees apart to minimize triangulation
error.
• Where access is granted but no birds are detected, search the area within 100m of the
coordinates of the detection for feathers, scat, tracks, flattened grass, etc. that would
indicate the presence of a lek. The surveyor can make a judgment about lek status based
on the amount of sign found at the site, but revisit these detections wherever practical.
• Verbal confirmation of the regular presence of displaying birds at detection site is
acceptable in lieu of a survey as long as the location is confirmed with the landowner
from aerial imagery.
• Surveyors should attempt to visit lek detections in and adjoining cropland as soon as
possible because lek attendance at these sites may be impacted by tilling and planting. If
the area around the detection has been tilled or planted and no birds are detected, search a
minimum of 100 m around the detection for sign as described above.
• The specie(s) of prairie chicken occupying each lek must also be identified if the site falls
within the estimated occupied range of the greater prairie-chicken. Observers should

24
listen to the displaying chickens from <800 meters for a minimum of 5 minutes and
record which specie(s) are heard booming.
o All observers working in the area where both species of prairie chicken are known
to co-exist must watch a short video provided by KDWPT prior to going into the
field. The video illustrates the difference in physical appearance and vocalization
between greater prairie-chickens, lesser prairie-chickens, and hybrids. Observers
must be able to identify the two different species and the hybrid by only
vocalizations.
25
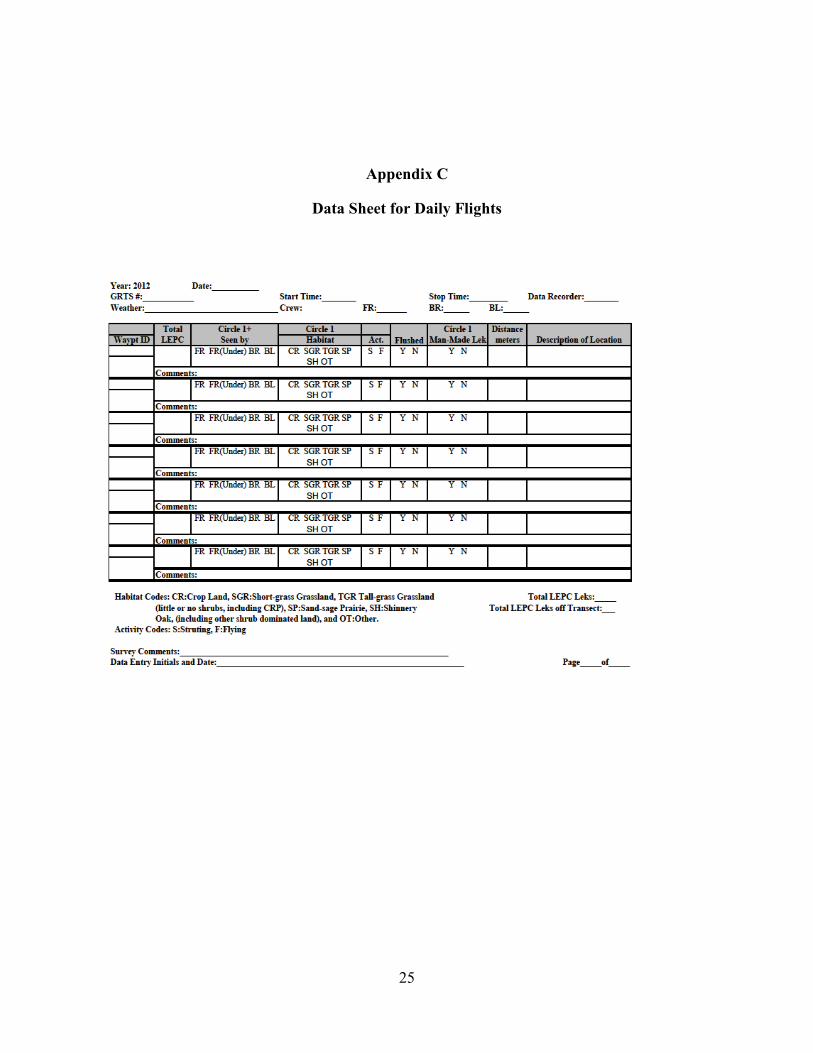
Appendix C
Data Sheet for Daily Flights
26
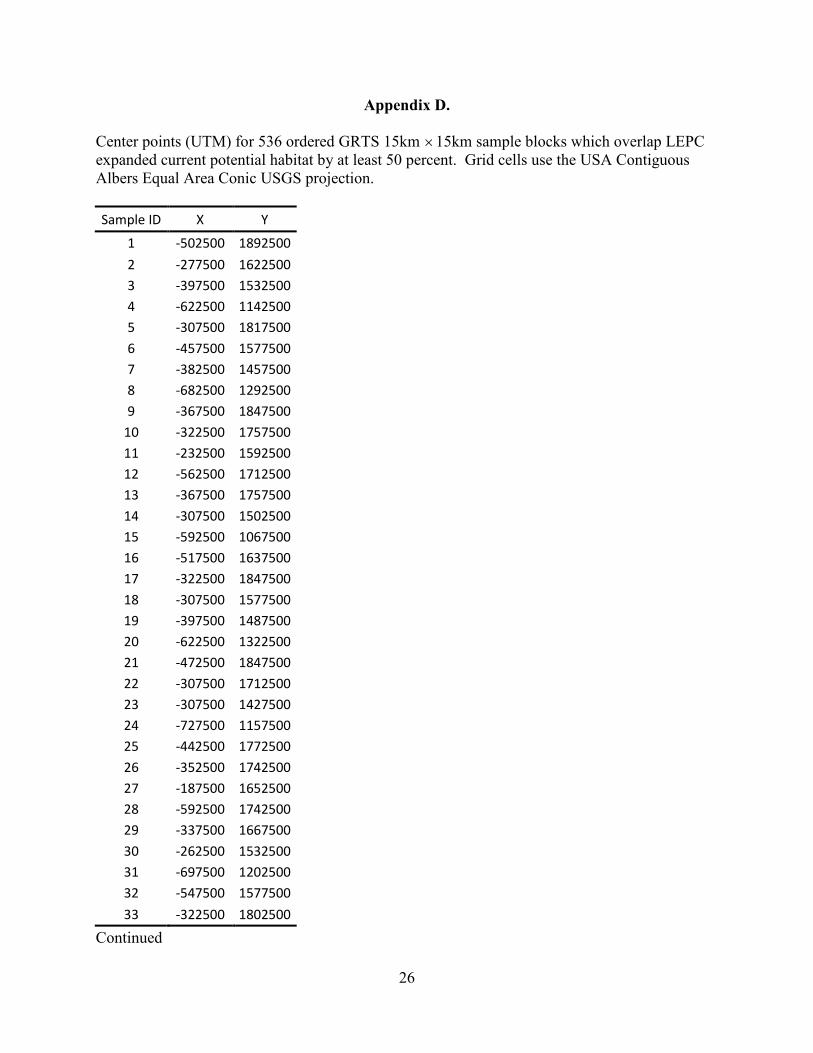
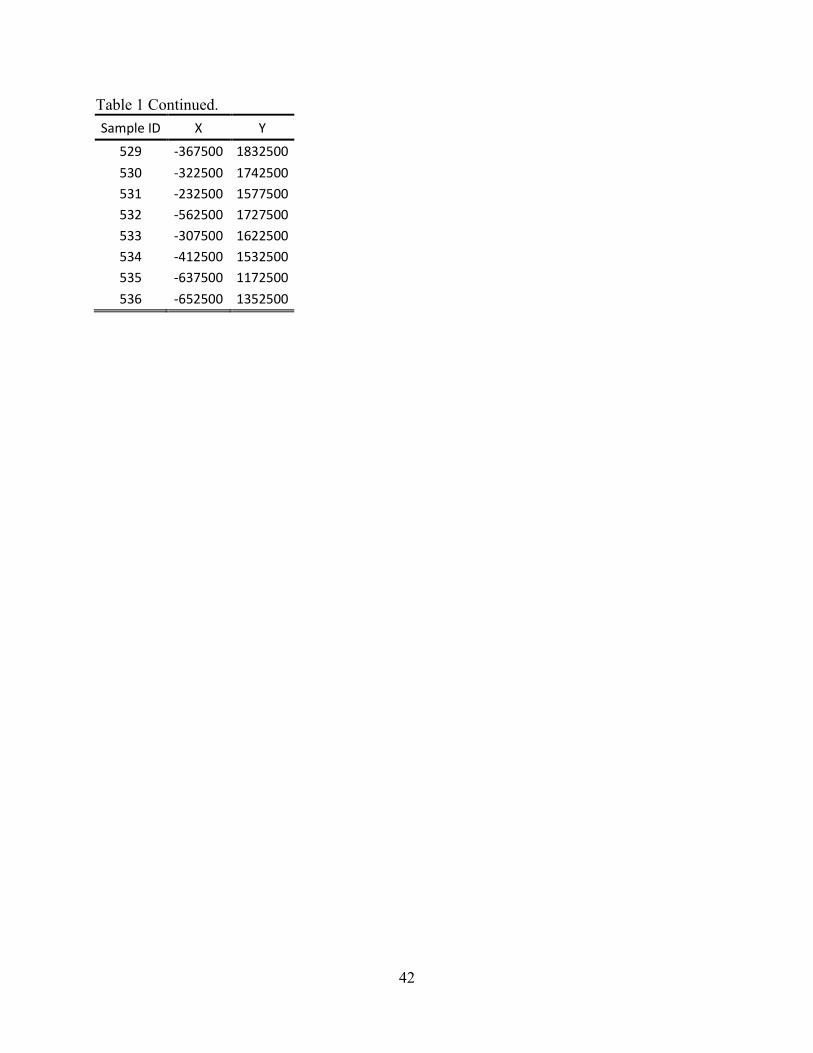
Appendix D.
Center points (UTM) for 536 ordered GRTS 15km ×15km sample blocks which overlap LEPC expanded current potential habitat by at least 50 percent. Grid cells use the USA Contiguous Albers Equal Area Conic USGS projection.
Sample ID X Y
1 -502500 1892500
2 -277500 1622500
3 -397500 1532500
4 -622500 1142500
5 -307500 1817500
6 -457500 1577500
7 -382500 1457500
8 -682500 1292500
9 -367500 1847500
10 -322500 1757500
11 -232500 1592500
12 -562500 1712500
13 -367500 1757500
14 -307500 1502500
15 -592500 1067500
16 -517500 1637500
17 -322500 1847500
18 -307500 1577500
19 -397500 1487500
20 -622500 1322500
21 -472500 1847500
22 -307500 1712500
23 -307500 1427500
24 -727500 1157500
25 -442500 1772500
26 -352500 1742500
27 -187500 1652500
28 -592500 1742500
29 -337500 1667500
30 -262500 1532500
31 -697500 1202500
32 -547500 1577500
33 -322500 1802500
Continued

27
Table 1 Continued.
Sample ID X Y
34 -367500 1592500
35 -442500 1532500
36 -622500 1247500
37 -442500 1877500
38 -352500 1697500
39 -337500 1457500
40 -742500 1217500
41 -367500 1697500
42 -337500 1487500
43 -727500 1082500
44 -487500 1727500
45 -262500 1652500
46 -292500 1517500
47 -697500 1217500
48 -502500 1577500
49 -322500 1862500
50 -472500 1667500
51 -397500 1382500
52 -697500 1232500
53 -397500 1892500
54 -307500 1757500
55 -202500 1652500
56 -727500 1277500
57 -442500 1712500
58 -352500 1517500
59 -607500 1097500
60 -487500 1667500
61 -337500 1577500
62 -382500 1532500
63 -622500 1202500
64 -487500 1562500
65 -502500 1877500
66 -262500 1622500
Continued

28
Table 1 Continued.
Sample ID X Y
67 -382500 1502500
68 -607500 1172500
69 -307500 1802500
70 -457500 1607500
71 -367500 1457500
72 -697500 1307500
73 -412500 1847500
74 -352500 1787500
75 -247500 1577500
76 -517500 1787500
77 -382500 1772500
78 -262500 1502500
79 -592500 1247500
80 -517500 1682500
81 -337500 1847500
82 -292500 1577500
83 -412500 1472500
84 -607500 1247500
85 -457500 1862500
86 -352500 1727500
87 -337500 1412500
88 -712500 1172500
89 -457500 1772500
90 -337500 1472500
91 -172500 1697500
92 -577500 1757500
93 -322500 1667500
94 -277500 1532500
95 -697500 1187500
96 -577500 1577500
97 -352500 1802500
98 -382500 1577500
99 -427500 1382500
Continued

29
Table 1 Continued.
Sample ID X Y
100 -667500 1262500
101 -367500 1862500
102 -277500 1742500
103 -322500 1442500
104 -727500 1202500
105 -367500 1712500
106 -337500 1502500
107 -712500 1067500
108 -547500 1682500
109 -262500 1637500
110 -307500 1532500
111 -667500 1172500
112 -607500 1772500
113 -307500 1877500
114 -442500 1652500
115 -382500 1412500
116 -652500 1247500
117 -412500 1877500
118 -292500 1742500
119 -202500 1637500
120 -742500 1232500
121 -397500 1772500
122 -337500 1517500
123 -697500 1082500
124 -487500 1682500
125 -322500 1577500
126 -367500 1517500
127 -637500 1202500
128 -532500 1562500
129 -487500 1877500
130 -262500 1577500
131 -367500 1487500
132 -607500 1337500
Continued

30
Table 1 Continued.
Sample ID X Y
133 -307500 1832500
134 -292500 1727500
135 -397500 1427500
136 -667500 1292500
137 -397500 1802500
138 -322500 1787500
139 -187500 1607500
140 -487500 1772500
141 -397500 1757500
142 -277500 1547500
143 -592500 1157500
144 -532500 1682500
145 -352500 1832500
146 -367500 1667500
147 -382500 1472500
148 -637500 1262500
149 -427500 1892500
150 -337500 1712500
151 -352500 1457500
152 -742500 1142500
153 -457500 1787500
154 -352500 1472500
155 -247500 1562500
156 -562500 1757500
157 -352500 1652500
158 -307500 1562500
159 -667500 1202500
160 -517500 1577500
161 -337500 1892500
162 -412500 1577500
163 -367500 1397500
164 -682500 1262500
165 -382500 1877500

31
Table 1 Continued.
Sample ID X Y
166 -277500 1772500
167 -202500 1667500
168 -727500 1187500
169 -397500 1697500
170 -322500 1562500
171 -712500 1097500
172 -562500 1682500
173 -337500 1622500
174 -412500 1562500
175 -652500 1172500
176 -577500 1562500
177 -277500 1817500
178 -442500 1592500
179 -382500 1427500
180 -652500 1322500
181 -382500 1802500
182 -307500 1787500
183 -217500 1577500
184 -727500 1232500
185 -412500 1787500
186 -337500 1532500
187 -682500 1052500
188 -487500 1652500
189 -352500 1577500
190 -367500 1547500
191 -622500 1217500
192 -607500 1352500
193 -502500 1802500
194 -277500 1577500
195 -397500 1502500
196 -637500 1322500
197 -472500 1802500
198 -277500 1727500
Continued

32
Table 1 Continued.
Sample ID X Y
199 -307500 1457500
200 -727500 1127500
201 -472500 1742500
202 -337500 1772500
203 -157500 1682500
204 -502500 1772500
205 -337500 1652500
206 -262500 1562500
207 -592500 1142500
208 -562500 1592500
209 -337500 1802500
210 -367500 1682500
211 -472500 1562500
212 -637500 1232500
213 -472500 1892500
214 -322500 1727500
215 -352500 1412500
216 -727500 1217500
217 -442500 1757500
218 -352500 1502500
219 -202500 1562500
220 -517500 1697500
221 -292500 1637500
222 -307500 1547500
223 -667500 1217500
224 -502500 1592500
225 -337500 1877500
226 -457500 1652500
227 -397500 1397500
228 -682500 1232500
229 -382500 1892500
230 -262500 1787500
231 -202500 1682500
Continued

33
Table 1 Continued.
Sample ID X Y
232 -742500 1277500
233 -472500 1727500
234 -352500 1547500
235 -607500 1067500
236 -547500 1652500
237 -337500 1607500
238 -397500 1547500
239 -697500 1172500
240 -562500 1562500
241 -277500 1802500
242 -472500 1592500
243 -397500 1457500
244 -667500 1322500
245 -367500 1817500
246 -292500 1787500
247 -202500 1577500
248 -712500 1232500
249 -382500 1757500
250 -292500 1502500
251 -592500 1082500
252 -532500 1652500
253 -307500 1607500
254 -367500 1562500
255 -637500 1157500
256 -637500 1352500
257 -292500 1802500
258 -442500 1607500
259 -367500 1442500
260 -682500 1307500
261 -367500 1772500
262 -307500 1472500
263 -577500 1247500
264 -532500 1637500
Continued

34
Table 1 Continued.
Sample ID X Y
265 -472500 1862500
266 -292500 1712500
267 -322500 1427500
268 -727500 1172500
269 -322500 1682500
270 -262500 1517500
271 -682500 1202500
272 -592500 1577500
273 -352500 1817500
274 -382500 1592500
275 -427500 1532500
276 -622500 1232500
277 -382500 1697500
278 -322500 1487500
279 -712500 1082500
280 -502500 1697500
281 -397500 1862500
282 -292500 1757500
283 -217500 1637500
284 -727500 1262500
285 -337500 1592500
286 -382500 1517500
287 -622500 1187500
288 -502500 1562500
289 -292500 1832500
290 -457500 1622500
291 -397500 1412500
292 -667500 1307500
293 -397500 1742500
294 -277500 1502500
295 -592500 1262500
296 -517500 1667500
297 -472500 1877500
Continued

35
Table 1 Continued.
Sample ID X Y
298 -337500 1697500
299 -337500 1427500
300 -742500 1157500
301 -352500 1667500
302 -277500 1517500
303 -652500 1187500
304 -577500 1592500
305 -352500 1892500
306 -367500 1577500
307 -427500 1367500
308 -652500 1262500
309 -367500 1727500
310 -337500 1562500
311 -727500 1112500
312 -562500 1667500
313 -382500 1817500
314 -307500 1772500
315 -217500 1652500
316 -742500 1247500
317 -352500 1592500
318 -382500 1562500
319 -637500 1217500
320 -517500 1562500
321 -307500 1847500
322 -307500 1727500
323 -412500 1412500
324 -682500 1322500
325 -412500 1757500
326 -262500 1547500
327 -592500 1172500
328 -532500 1667500
329 -322500 1817500
330 -382500 1682500
Continued

36
Table 1 Continued.
Sample ID X Y
331 -427500 1547500
332 -622500 1262500
333 -472500 1787500
334 -352500 1487500
335 -247500 1547500
336 -562500 1742500
337 -352500 1877500
338 -397500 1577500
339 -382500 1397500
340 -682500 1277500
341 -472500 1712500
342 -337500 1547500
343 -727500 1097500
344 -547500 1667500
345 -367500 1802500
346 -292500 1772500
347 -202500 1592500
348 -712500 1247500
349 -292500 1622500
350 -382500 1547500
351 -622500 1172500
352 -622500 1352500
353 -457500 1802500
354 -307500 1697500
355 -307500 1442500
356 -727500 1142500
357 -337500 1682500
358 -277500 1562500
359 -682500 1187500
360 -562500 1577500
361 -337500 1817500
362 -397500 1682500
363 -427500 1517500
Continued

37
Table 1 Continued.
Sample ID X Y
364 -637500 1247500
365 -427500 1757500
366 -322500 1502500
367 -727500 1067500
368 -517500 1712500
369 -412500 1892500
370 -307500 1742500
371 -217500 1682500
372 -712500 1262500
373 -322500 1592500
374 -367500 1532500
375 -637500 1187500
376 -547500 1562500
377 -382500 1847500
378 -337500 1757500
379 -217500 1592500
380 -727500 1247500
381 -292500 1607500
382 -397500 1517500
383 -622500 1157500
384 -622500 1367500
385 -487500 1892500
386 -277500 1607500
387 -412500 1517500
388 -607500 1142500
389 -397500 1847500
390 -337500 1742500
391 -247500 1592500
392 -577500 1727500
393 -337500 1832500
394 -292500 1592500
395 -397500 1472500
396 -607500 1232500
Continued

38
Table 1 Continued.
Sample ID X Y
397 -442500 1787500
398 -352500 1757500
399 -157500 1697500
400 -592500 1757500
401 -427500 1877500
402 -352500 1712500
403 -337500 1442500
404 -712500 1202500
405 -277500 1637500
406 -292500 1532500
407 -682500 1217500
408 -517500 1622500
409 -322500 1877500
410 -427500 1667500
411 -412500 1397500
412 -697500 1247500
413 -412500 1772500
414 -352500 1532500
415 -667500 1067500
416 -502500 1667500
417 -502500 1862500
418 -262500 1607500
419 -382500 1487500
420 -607500 1157500
421 -397500 1817500
422 -352500 1772500
423 -187500 1622500
424 -502500 1787500
425 -352500 1847500
426 -307500 1592500
427 -367500 1472500
428 -607500 1262500
429 -442500 1892500
Continued

39
Table 1 Continued.
Sample ID X Y
430 -322500 1697500
431 -352500 1442500
432 -742500 1172500
433 -472500 1772500
434 -322500 1472500
435 -187500 1697500
436 -577500 1742500
437 -352500 1682500
438 -292500 1547500
439 -652500 1202500
440 -532500 1577500
441 -382500 1862500
442 -277500 1757500
443 -352500 1397500
444 -712500 1187500
445 -307500 1682500
446 -412500 1547500
447 -652500 1157500
448 -607500 1757500
449 -262500 1802500
450 -427500 1592500
451 -367500 1427500
452 -652500 1232500
453 -397500 1787500
454 -322500 1517500
455 -697500 1097500
456 -502500 1652500
457 -487500 1802500
458 -262500 1592500
459 -367500 1502500
460 -637500 1337500
461 -457500 1757500
462 -337500 1787500
Continued

40
Table 1 Continued.
Sample ID X Y
463 -172500 1682500
464 -487500 1787500
465 -457500 1892500
466 -322500 1712500
467 -352500 1427500
468 -742500 1127500
469 -292500 1652500
470 -292500 1562500
471 -667500 1187500
472 -487500 1592500
473 -367500 1877500
474 -277500 1787500
475 -217500 1667500
476 -742500 1262500
477 -322500 1607500
478 -397500 1562500
479 -682500 1172500
480 -592500 1562500
481 -262500 1817500
482 -427500 1577500
483 -367500 1412500
484 -652500 1337500
485 -367500 1742500
486 -322500 1532500
487 -697500 1052500
488 -502500 1637500
489 -322500 1832500
490 -277500 1592500
491 -412500 1502500
492 -622500 1337500
493 -427500 1772500
494 -322500 1772500
495 -187500 1637500
Continued

41
Table 1 Continued.
Sample ID X Y
496 -487500 1742500
497 -442500 1862500
498 -337500 1727500
499 -322500 1457500
500 -712500 1217500
501 -307500 1637500
502 -307500 1517500
503 -652500 1217500
504 -487500 1577500
505 -337500 1862500
506 -457500 1667500
507 -412500 1382500
508 -682500 1247500
509 -457500 1727500
510 -352500 1562500
511 -607500 1082500
512 -502500 1682500
513 -292500 1817500
514 -472500 1577500
515 -382500 1442500
516 -667500 1337500
517 -382500 1742500
518 -307500 1487500
519 -577500 1082500
520 -517500 1652500
521 -352500 1862500
522 -472500 1652500
523 -412500 1367500
524 -697500 1262500
525 -457500 1712500
526 -322500 1547500
527 -712500 1112500
528 -562500 1652500
Continued
42
Table 1 Continued.
Sample ID X Y
529 -367500 1832500
530 -322500 1742500
531 -232500 1577500
532 -562500 1727500
533 -307500 1622500
534 -412500 1532500
535 -637500 1172500
536 -652500 1352500