randon s.a. implementos e participaÇÕes automotive … challenge 2013... · autometal sa 5.9x 11x...
TRANSCRIPT
Universidade Federal de Santa Catarina Marco Arruda, Gustavo Busnardo, Richard Schnorrenberger, Evelin Silva, Thais Pabis São Paulo, November 2013
RANDON S.A. IMPLEMENTOS E PARTICIPAÇÕES Automotive Industry
Introduction Investment Case Risks Conclusion
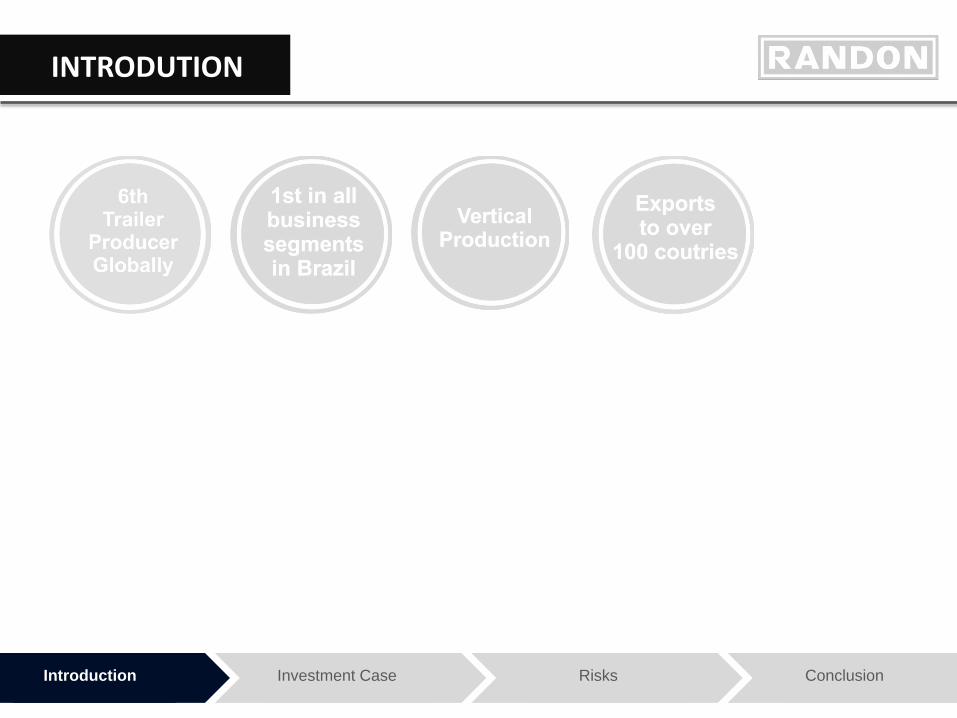
INTRODUTION
Introduction Investment Case Risks Conclusion
INTRODUTION
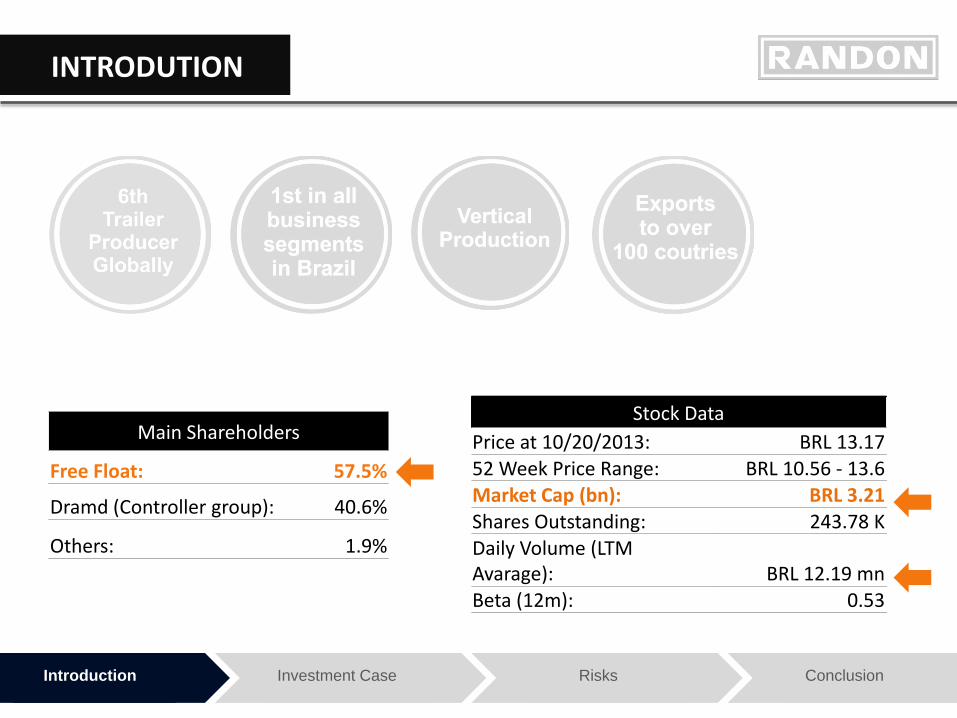
Main Shareholders
Free Float: 57.5%
Dramd (Controller group): 40.6%
Others: 1.9%
Stock Data Price at 10/20/2013: BRL 13.17 52 Week Price Range: BRL 10.56 - 13.6 Market Cap (bn): BRL 3.21 Shares Outstanding: 243.78 K Daily Volume (LTM Avarage): BRL 12.19 mn Beta (12m): 0.53
Main Shareholders
Free Float: 57.5%
Dramd (Controller group): 40.6%
Others: 1.9%
Stock Data Price at 10/20/2013: BRL 13.17 52 Week Price Range: BRL 10.56 - 13.6 Market Cap (bn): BRL 3.21 Shares Outstanding: 243.78 K Daily Volume (LTM Avarage): BRL 12.19 mn Beta (12m): 0.53
Stock Data Price at 10/20/2013: BRL 13.17 52 Week Price Range: BRL 10.56 - 13.6 Market Cap (bn): BRL 3.21 Shares Outstanding: 243.78 K Daily Volume (LTM Avarage): BRL 12.19 mn Beta (12m): 0.53
Introduction Investment Case Risks Conclusion
INTRODUTION
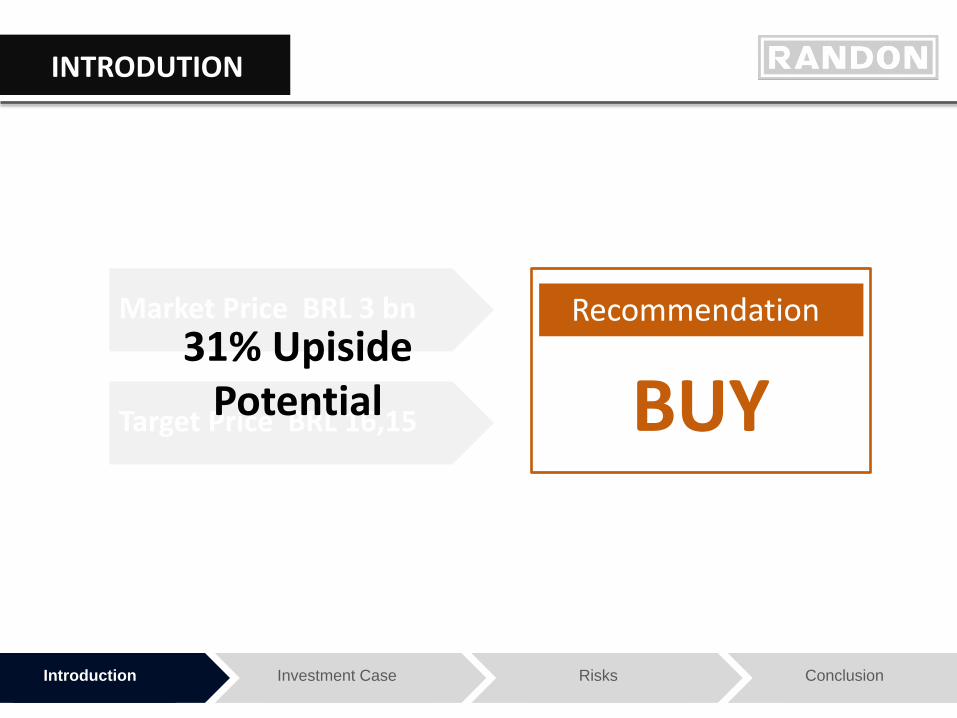
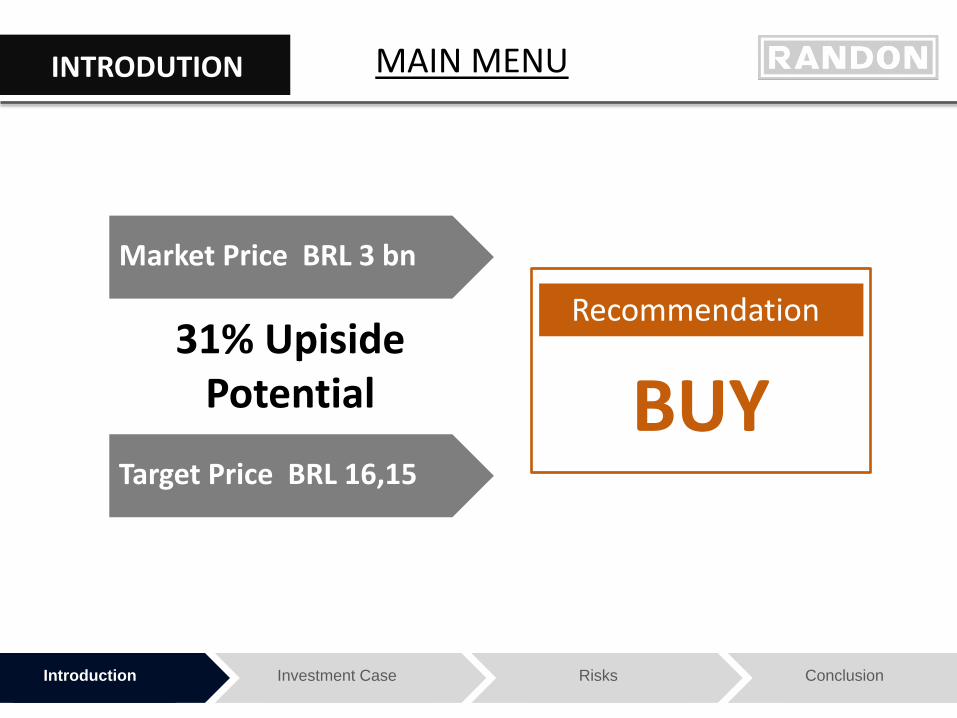
Market Price BRL 3 bn
Target Price BRL 16,15 BUY Recommendation
31% Upiside Potential

Net revenue per segment
Introduction Investment Case Risks Conclusion
BUSINESS DESCTIPTION
Vehicles and
trailers 51%
Auto parts 47%
Financial services
2%
Truck trailers
83%
Special vehicles
10%
Rail Wagons 7%
Suspension Systems
36%
Friction materials
34%
Air Brakes 21%
Castings 9%
Introduction Investment Case Risks Conclusion
WHY BUY?
Good opportunities in the coming years for the sector
Confirmative Valuation
Randon is the most prepared company to leverage market opportunities
Introduction Investment Case Risks Conclusion
INDUSTRY OVERVIEW
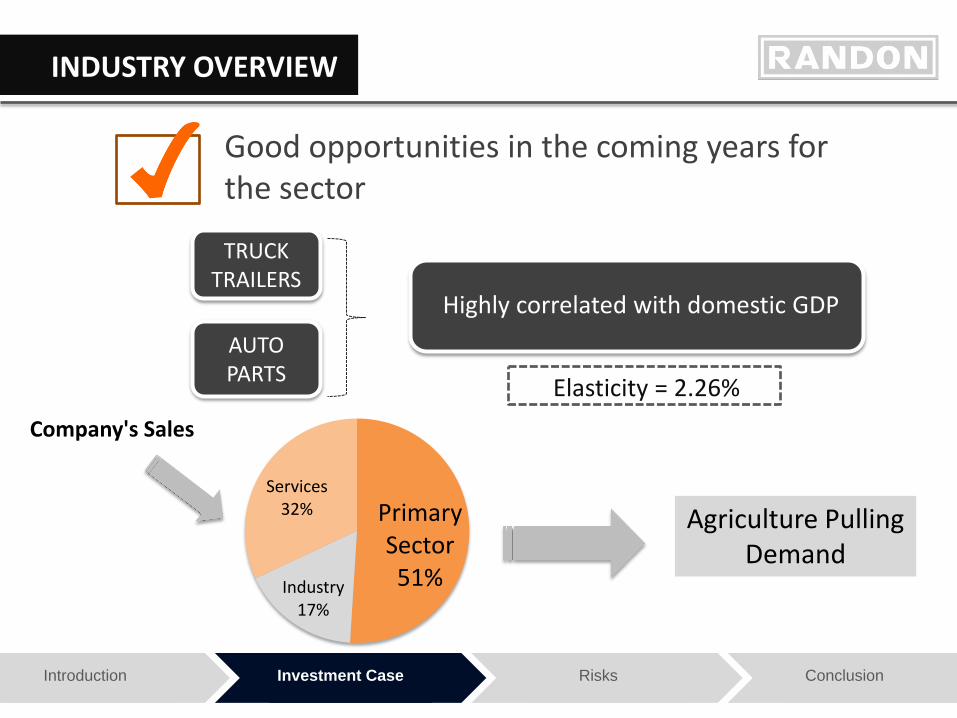
TRUCK TRAILERS
AUTO PARTS
Highly correlated with domestic GDP
Elasticity = 2.26%
Primary Sector 51% Industry
17%
Services 32%
Company's Sales
Agriculture Pulling Demand
Good opportunities in the coming years for the sector

Introduction Investment Case Risks Conclusion
INDUSTRY OVERVIEW
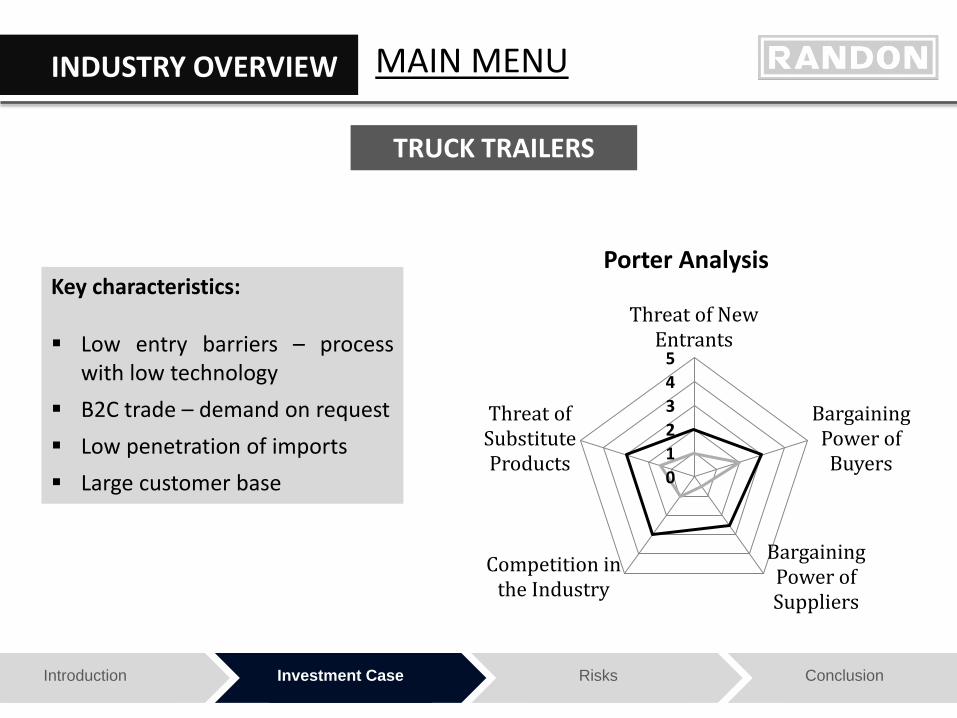
Porter Analysis Key characteristics:
Low entry barriers – process
with low technology
B2C trade – demand on request
Low penetration of imports
Large customer base 0 1 2 3 4 5
Threat of New Entrants
Bargaining Power of Buyers
Bargaining Power of Suppliers
Competition in the Industry
Threat of Substitute Products
TRUCK TRAILERS

Introduction Investment Case Risks Conclusion
INDUSTRY OVERVIEW
Porter Analysis Key characteristics: High entry barriers – requires
high technology processes
B2B trade – concentrated customer base
Joint engineering strategy - integration between subsidiaries
Drivers: domestic and international automotive production and aftermarket needs.
0 1 2 3 4 5
Threat of New Entrants
Bargaining Power of Buyers
Bargaining Power of Suppliers
Competition in the Industry
Threat of Substitute Products
AUTO PARTS
Introduction Investment Case Risks Conclusion
INDUSTRY OVERVIEW
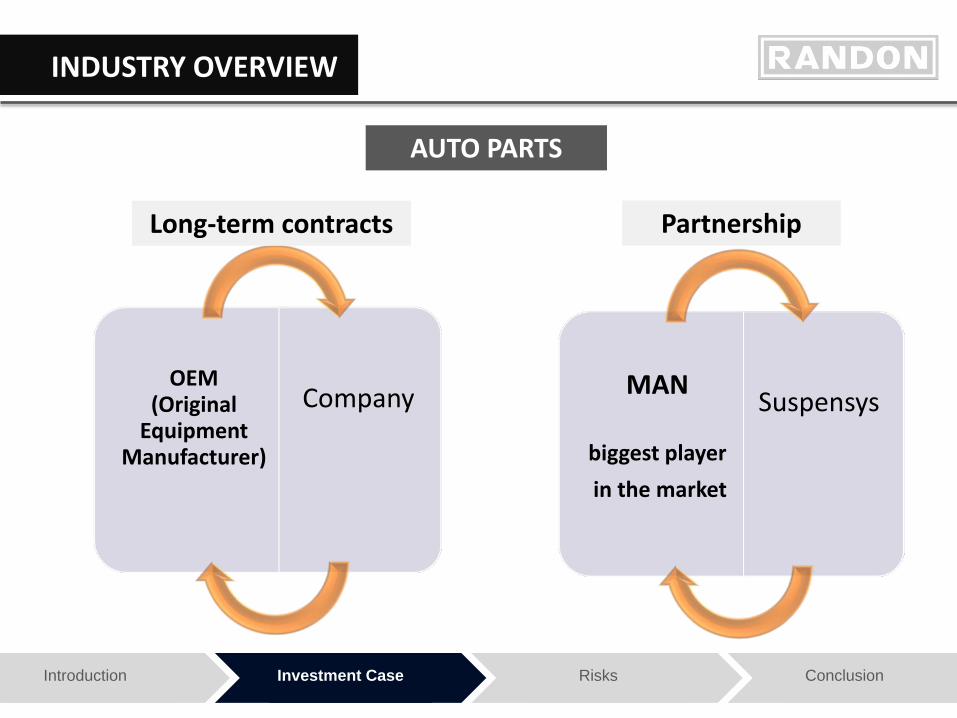
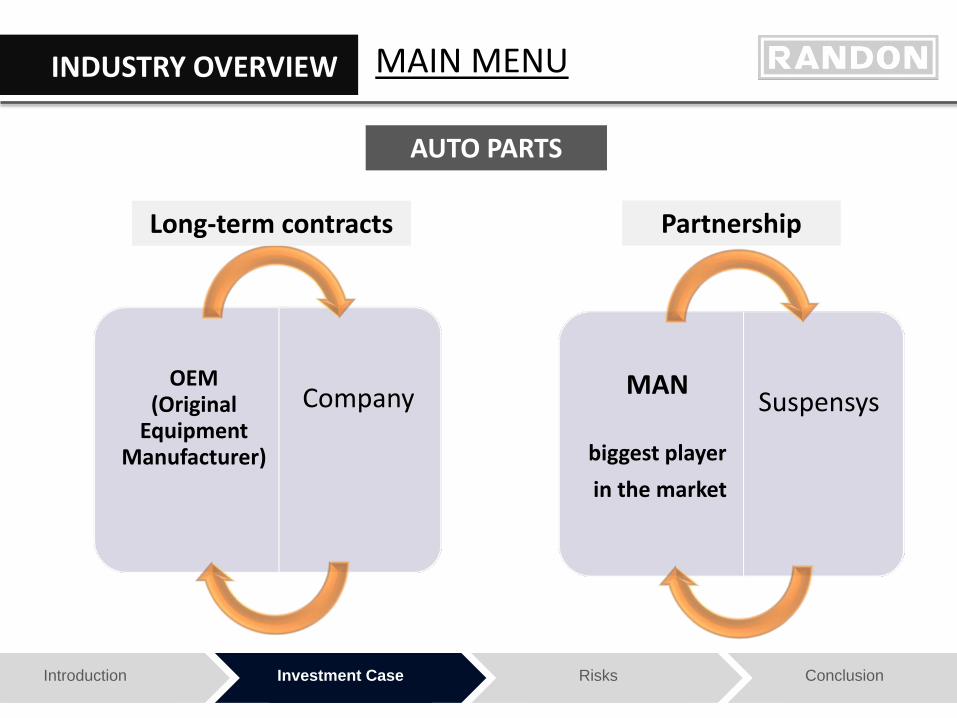
AUTO PARTS
OEM
(Original Equipment
Manufacturer)
Company
Long-term contracts
MAN
biggest player in the market
Suspensys
Partnership

Introduction Investment Case Risks Conclusion
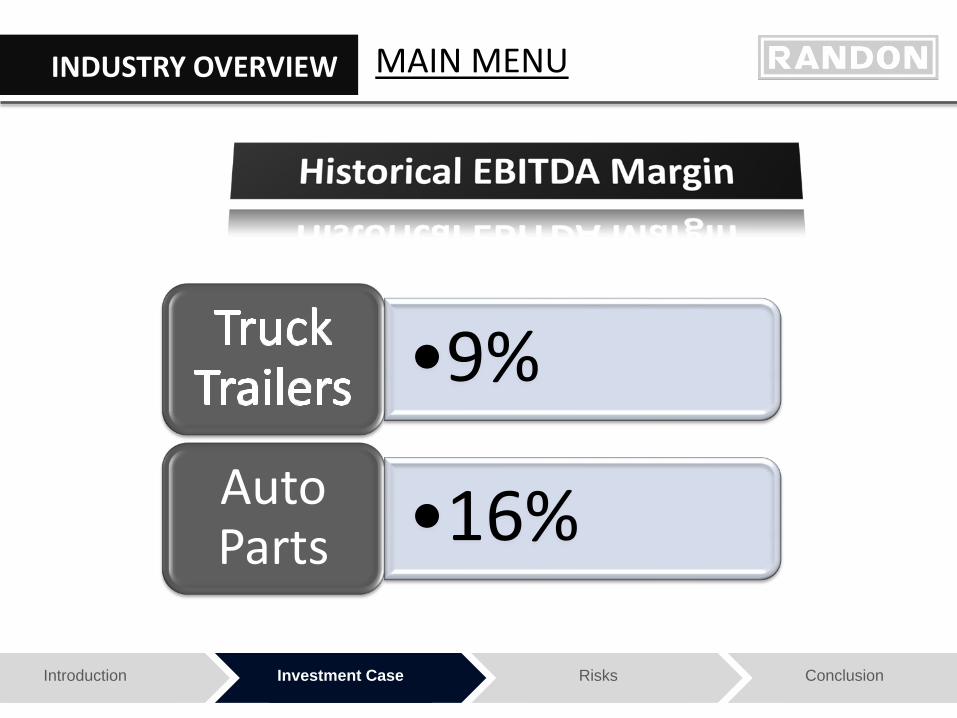
INDUSTRY OVERVIEW
•9%
•16% Auto Parts
Introduction Investment Case Risks Conclusion
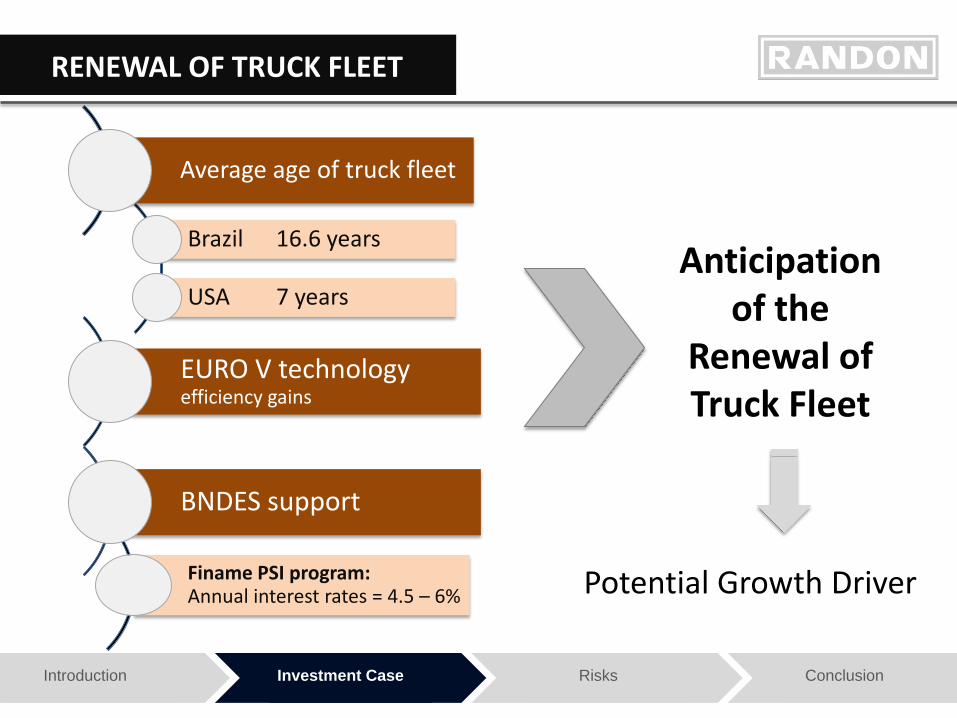
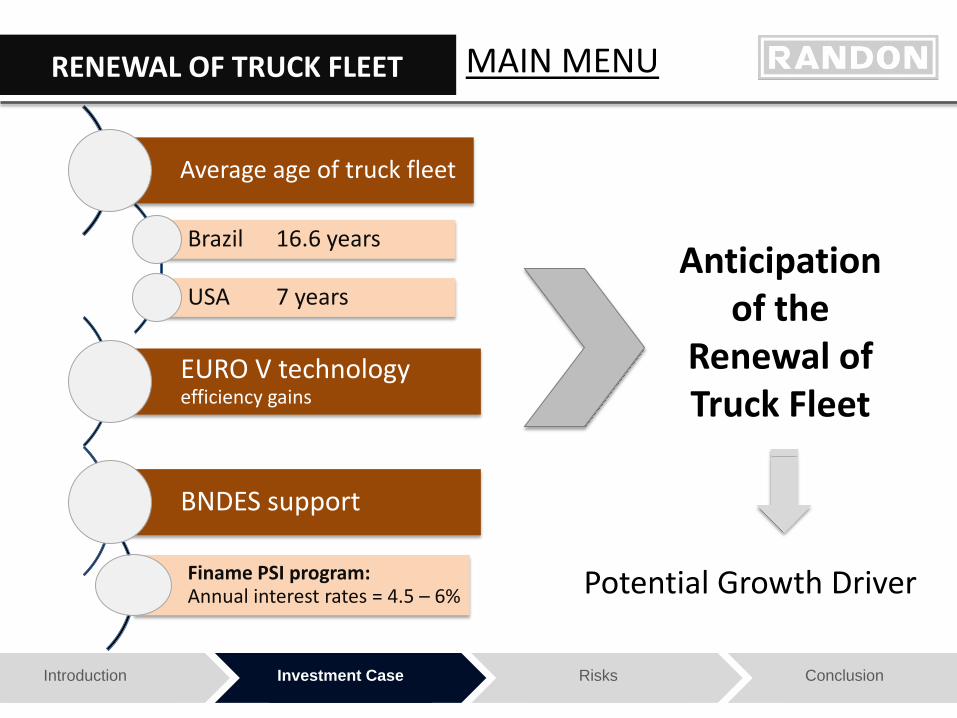
RENEWAL OF TRUCK FLEET
Brazil 16.6 years
USA 7 years
EURO V technology efficiency gains
Average age of truck fleet
Finame PSI program: Annual interest rates = 4.5 – 6%
Anticipation of the
Renewal of Truck Fleet
Potential Growth Driver
BNDES support
Introduction Investment Case Risks Conclusion
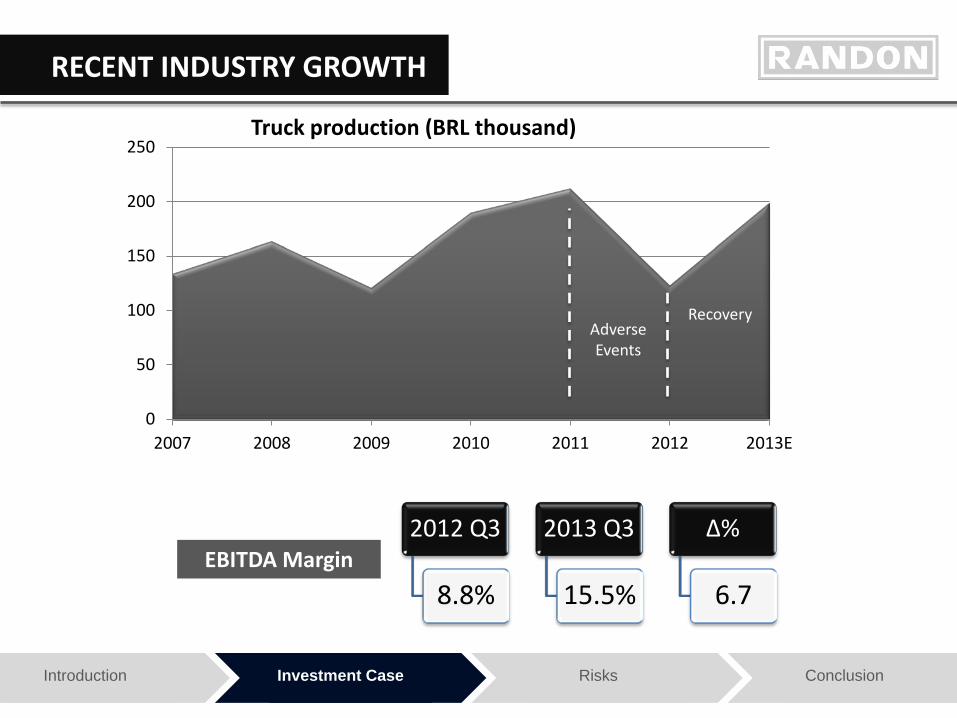
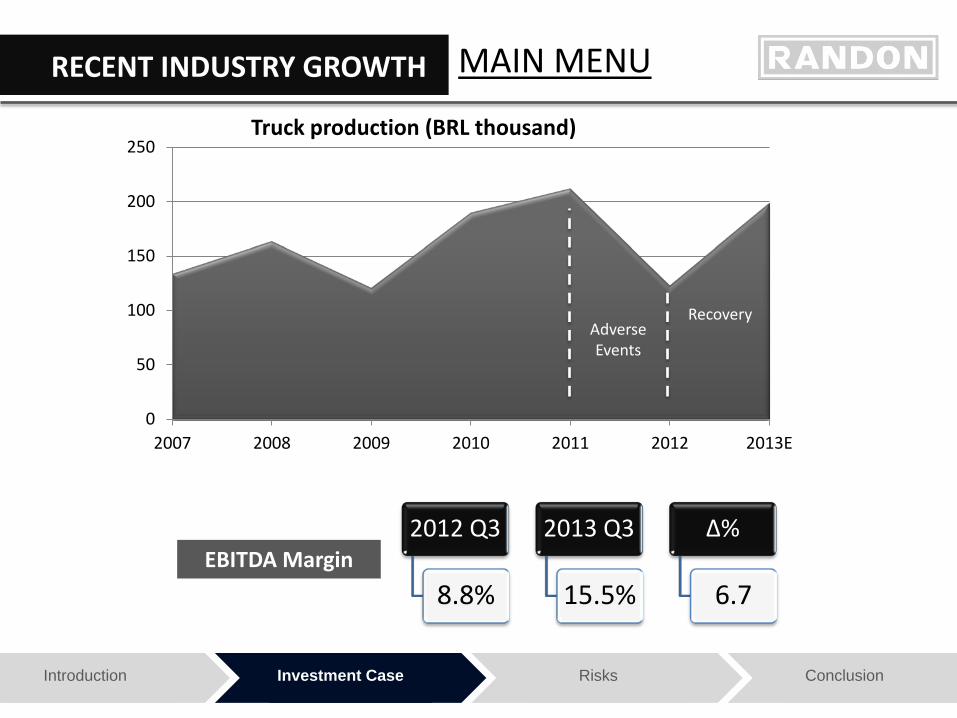
RECENT INDUSTRY GROWTH
2012 Q3
8.8%
2013 Q3
15.5%
Δ%
6.7 EBITDA Margin
0
50
100
150
200
250
2007 2008 2009 2010 2011 2012 2013E
Truck production (BRL thousand)
Adverse Events
Recovery

Introduction Investment Case Risks Conclusion
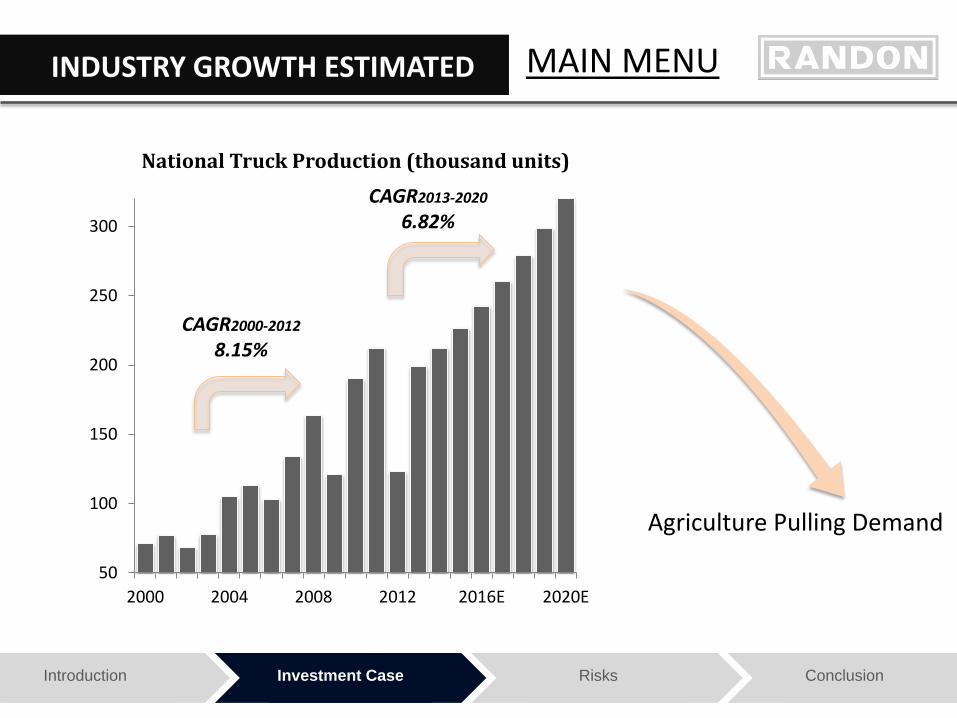
INDUSTRY GROWTH ESTIMATED
50
100
150
200
250
300
2000 2004 2008 2012 2016E 2020E
National Truck Production (thousand units)
CAGR2000-2012
8.15%
CAGR2013-2020
6.82%
Agriculture Pulling Demand

Randon is the most prepared company to leverage market opportunities
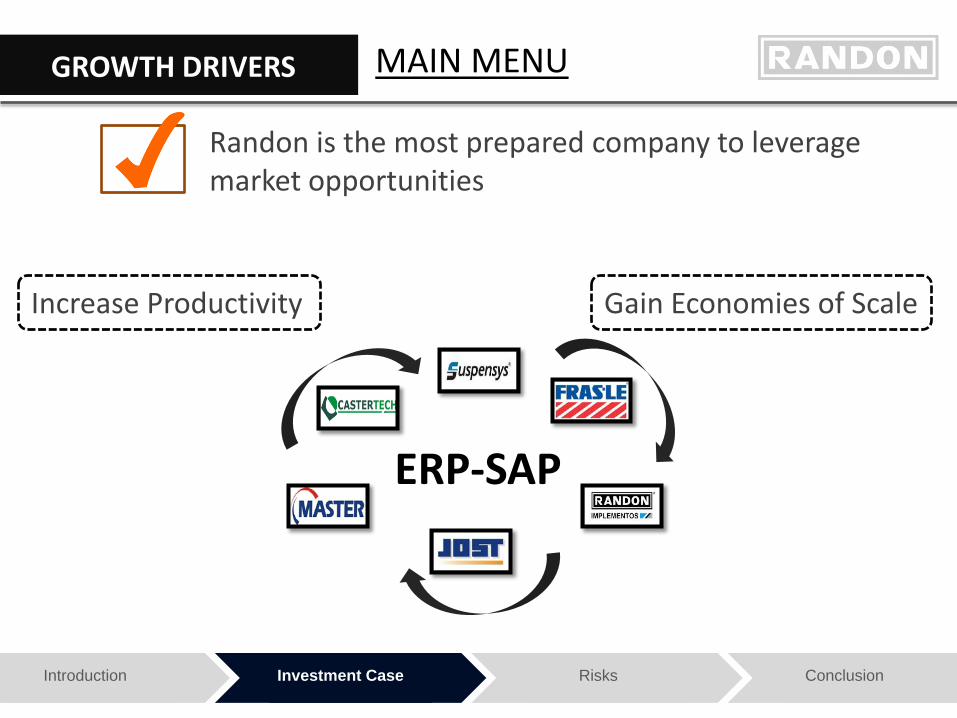
ERP-SAP
GROWTH DRIVERS
Increase Productivity Gain Economies of Scale
Introduction Investment Case Risks Conclusion

Introduction Investment Case Risks Conclusion
GROWTH DRIVERS
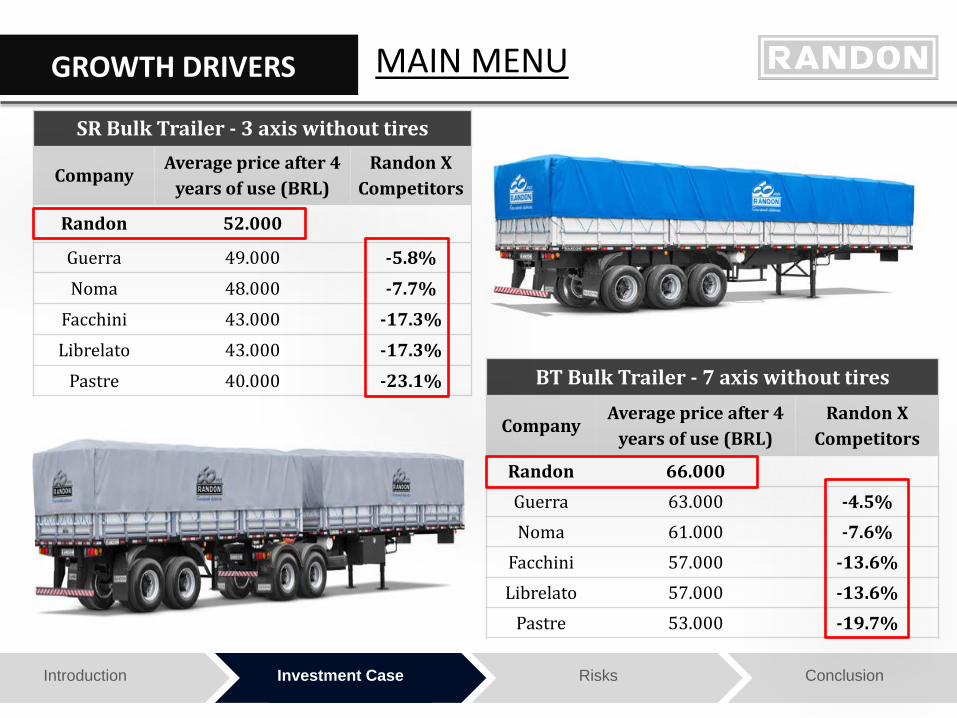
SR Bulk Trailer - 3 axis without tires
Company Average price after 4
years of use (BRL) Randon X
Competitors
Randon 52.000
Guerra 49.000 -5.8%
Noma 48.000 -7.7%
Facchini 43.000 -17.3%
Librelato 43.000 -17.3%
Pastre 40.000 -23.1% BT Bulk Trailer - 7 axis without tires
Company Average price after 4
years of use (BRL) Randon X
Competitors
Randon 66.000 Guerra 63.000 -4.5%
Noma 61.000 -7.6%
Facchini 57.000 -13.6%
Librelato 57.000 -13.6%
Pastre 53.000 -19.7%
Durability
Quality

Introduction Investment Case Risks Conclusion
GROWTH DRIVERS
Investments in R&D
E-coat painting system
Proving ground
Introduction Investment Case Risks Conclusion
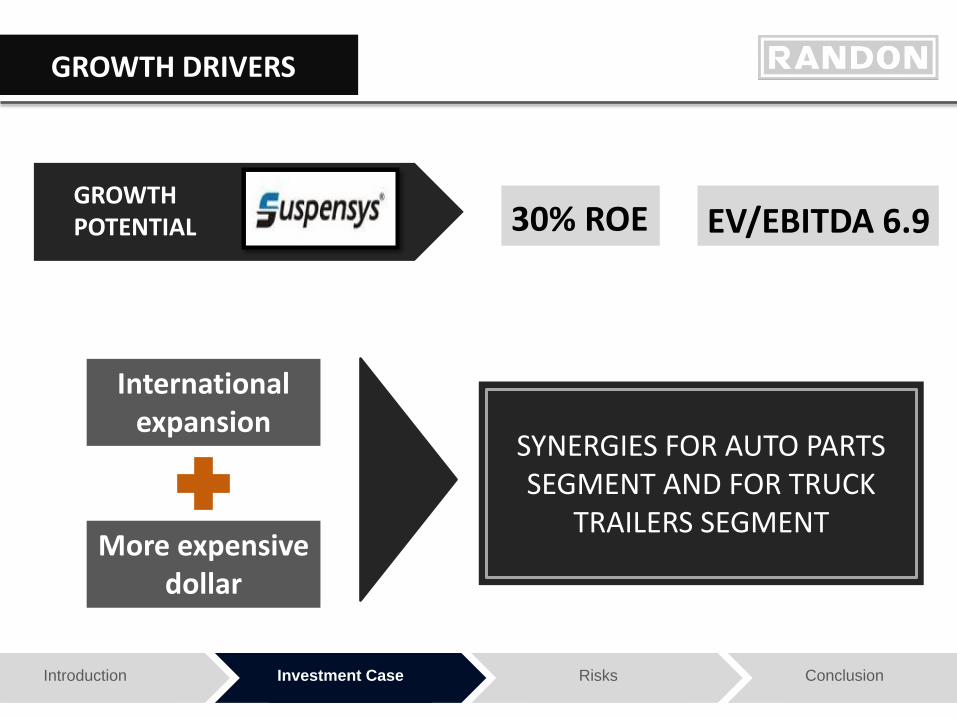
GROWTH DRIVERS
GROWTH POTENTIAL 30% ROE EV/EBITDA 6.9
More expensive dollar
International expansion
SYNERGIES FOR AUTO PARTS SEGMENT AND FOR TRUCK
TRAILERS SEGMENT
Introduction Investment Case Risks Conclusion
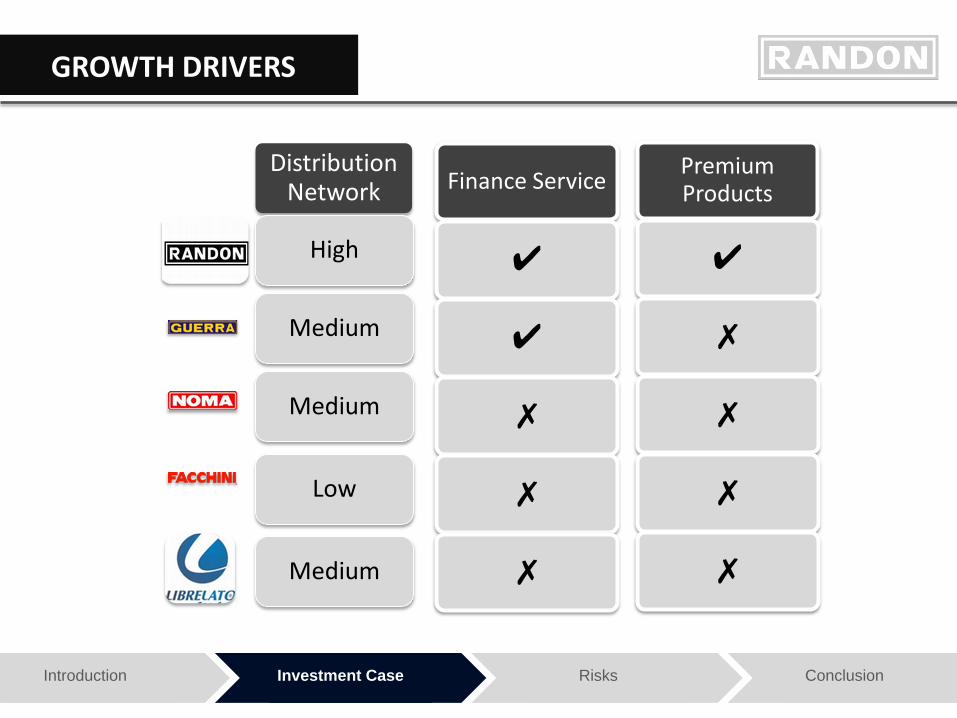
GROWTH DRIVERS
Distribution Network
High
Medium
Medium
Low
Medium
Finance Service
✔
✔
✗
✗
✗
Premium Products
✔
✗
✗
✗
✗
Introduction Investment Case Risks Conclusion
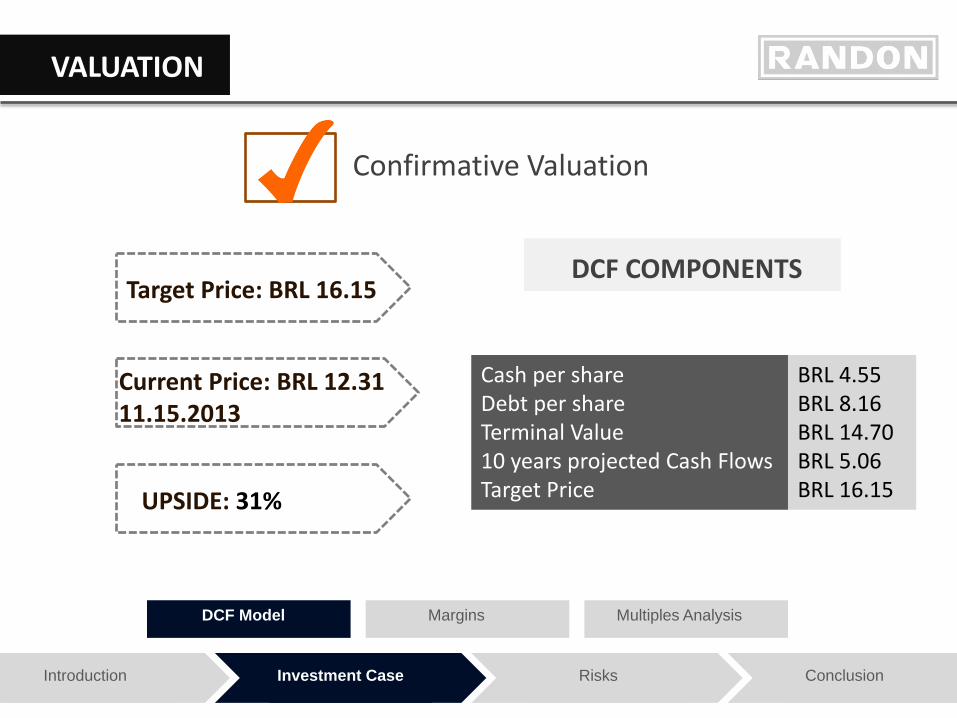
VALUATION
UPSIDE: 31%
Target Price: BRL 16.15
Current Price: BRL 12.31 11.15.2013
DCF COMPONENTS
DCF Model Multiples Analysis Margins
Cash per share Debt per share Terminal Value 10 years projected Cash Flows Target Price
BRL 4.55 BRL 8.16 BRL 14.70 BRL 5.06 BRL 16.15
Confirmative Valuation

Introduction Investment Case Risks Conclusion
VALUATION
DCF Model Multiples Analysis Margins
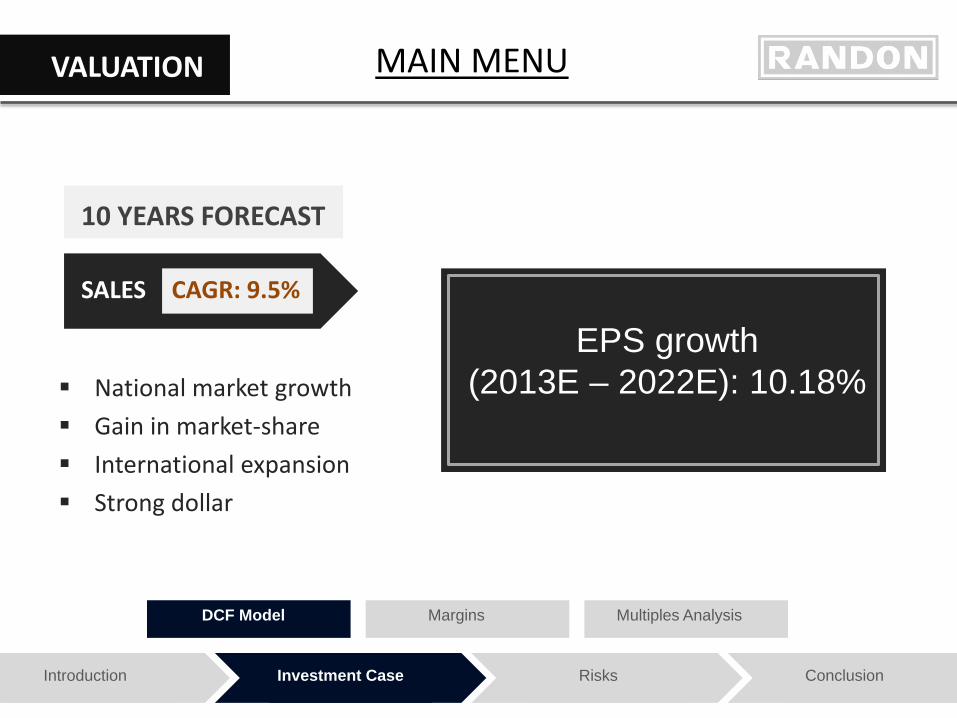
National market growth Gain in market-share International expansion Strong dollar
10 YEARS FORECAST
SALES CAGR: 9.5%
EPS growth (2013E – 2022E): 10.18%
Introduction Investment Case Risks Conclusion
VALUATION
DCF Model Multiples Analysis Margins
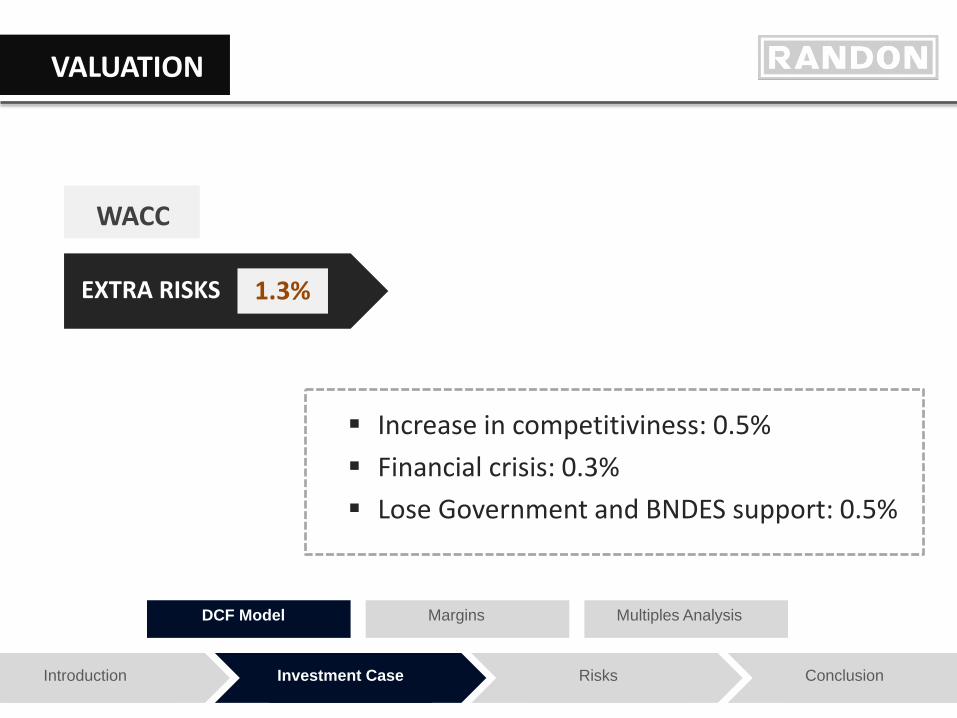
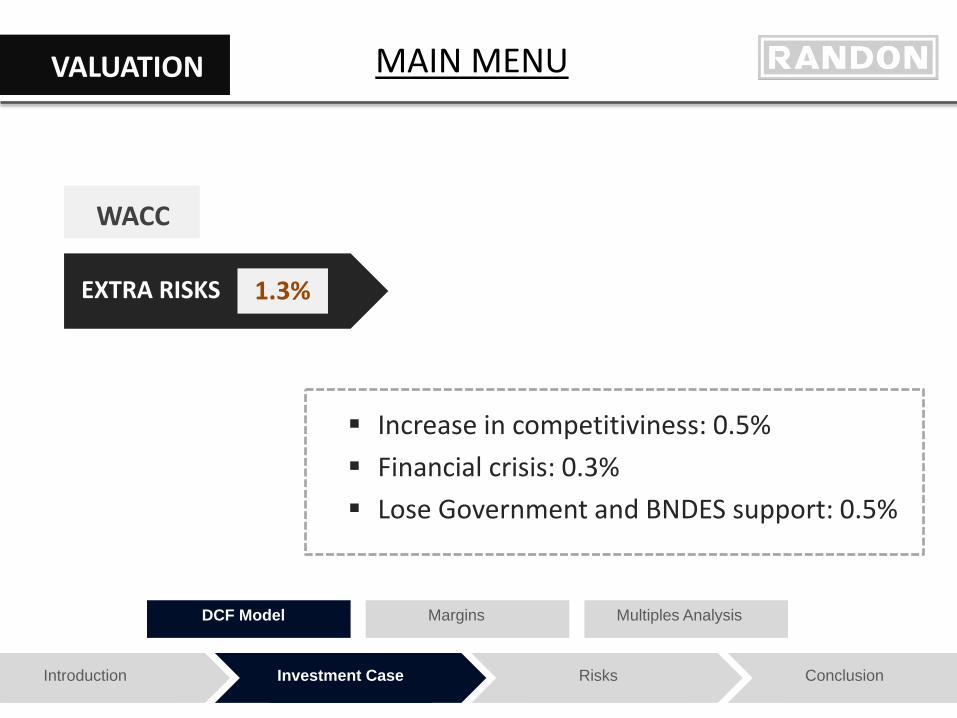
WACC
Increase in competitiviness: 0.5% Financial crisis: 0.3% Lose Government and BNDES support: 0.5%
EXTRA RISKS 1.3%
Introduction Investment Case Risks Conclusion
VALUATION
DCF Model Multiples Analysis Margins
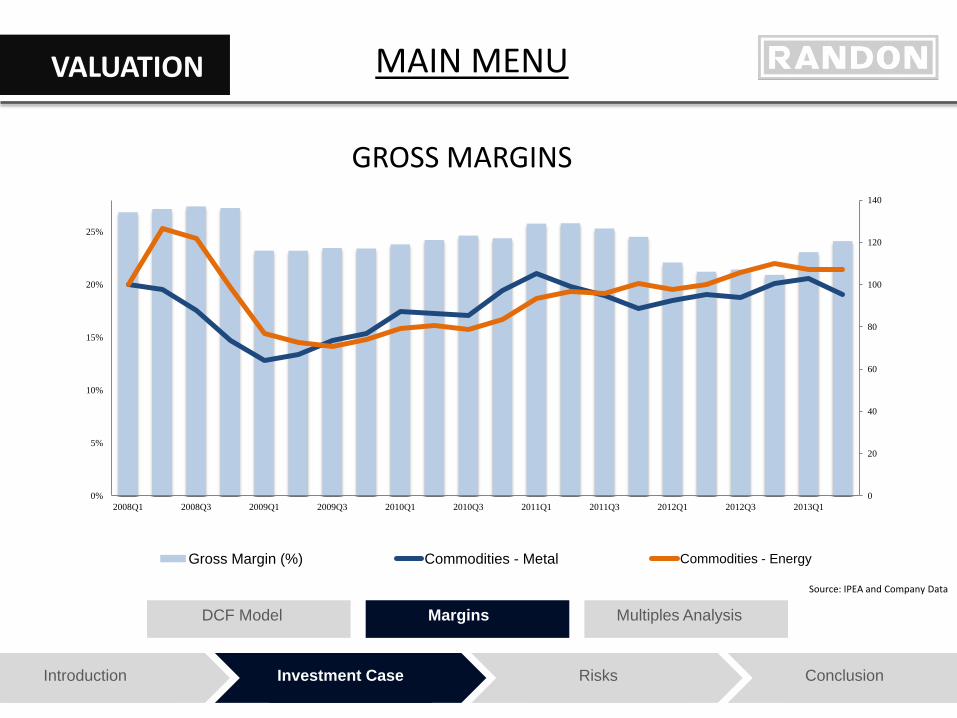
0
20
40
60
80
100
120
140
0%
5%
10%
15%
20%
25%
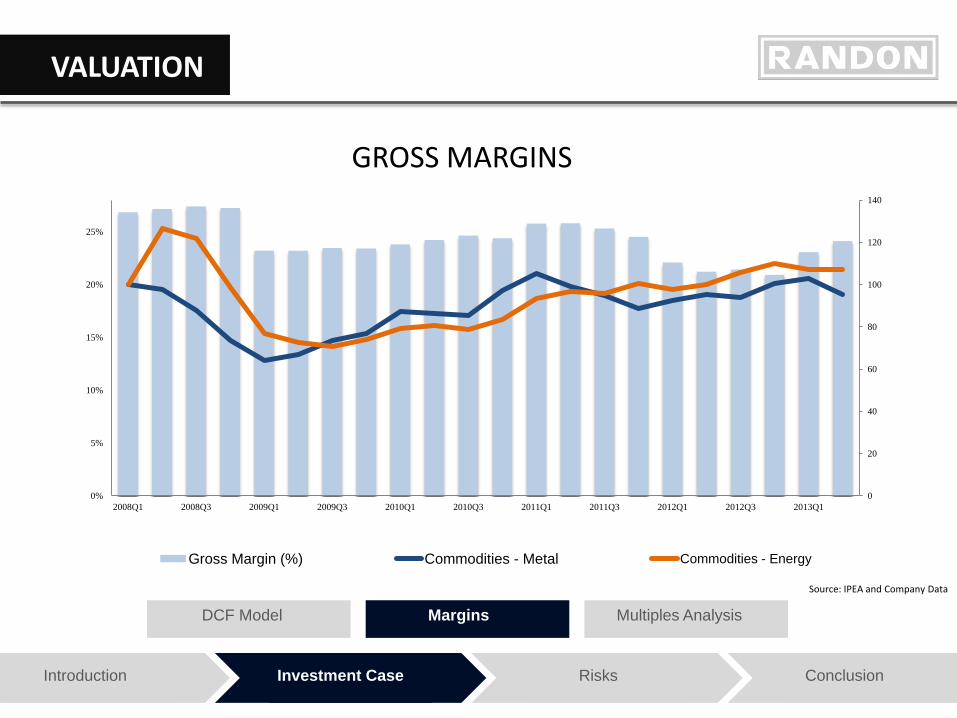
2008Q1 2008Q3 2009Q1 2009Q3 2010Q1 2010Q3 2011Q1 2011Q3 2012Q1 2012Q3 2013Q1
Gross Margin (%) Commodities - Metal Commodities - Energy
Source: IPEA and Company Data
GROSS MARGINS
Introduction Investment Case Risks Conclusion
VALUATION
DCF Model Multiples Analysis Margins
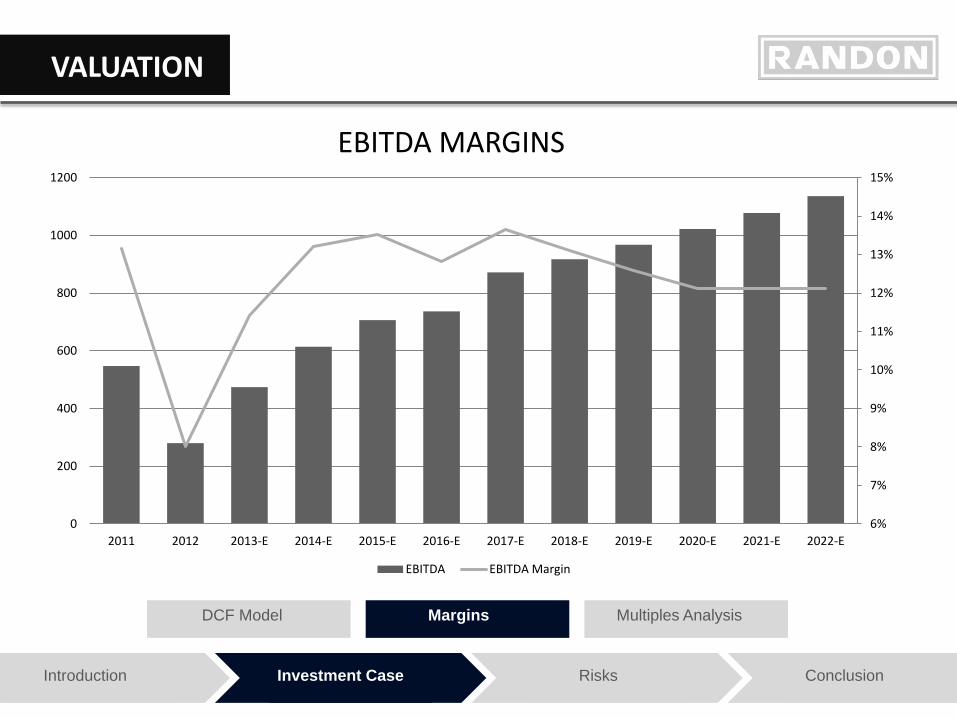
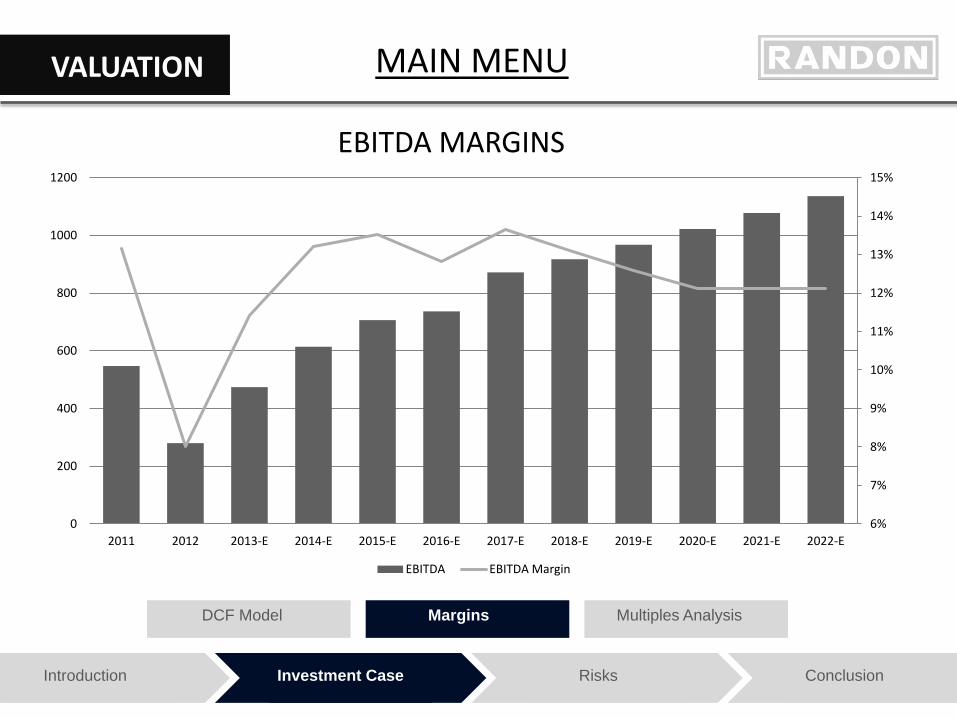
6%
7%
8%
9%
10%
11%
12%
13%
14%
15%
0
200
400
600
800
1000
1200
2011 2012 2013-E 2014-E 2015-E 2016-E 2017-E 2018-E 2019-E 2020-E 2021-E 2022-E
EBITDA EBITDA Margin
EBITDA MARGINS
Introduction Investment Case Risks Conclusion
VALUATION
DCF Model Multiples Analysis Margins
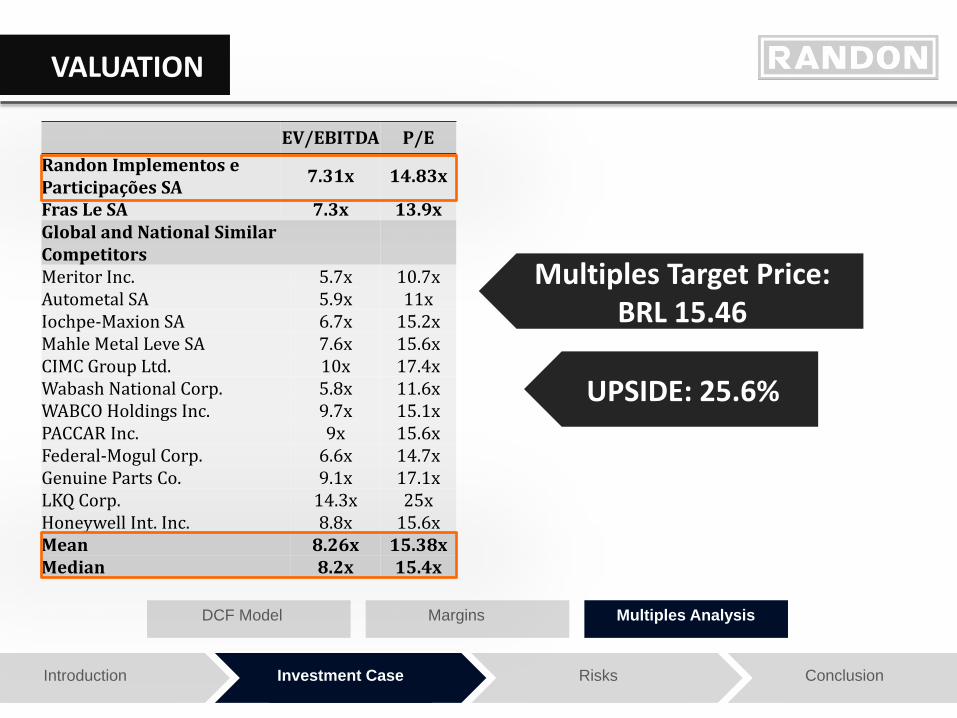
Multiples Target Price: BRL 15.46
UPSIDE: 25.6%
EV/EBITDA P/E Randon Implementos e Participações SA 7.31x 14.83x
Fras Le SA 7.3x 13.9x Global and National Similar Competitors Meritor Inc. 5.7x 10.7x Autometal SA 5.9x 11x Iochpe-Maxion SA 6.7x 15.2x Mahle Metal Leve SA 7.6x 15.6x CIMC Group Ltd. 10x 17.4x Wabash National Corp. 5.8x 11.6x WABCO Holdings Inc. 9.7x 15.1x PACCAR Inc. 9x 15.6x Federal-Mogul Corp. 6.6x 14.7x Genuine Parts Co. 9.1x 17.1x LKQ Corp. 14.3x 25x Honeywell Int. Inc. 8.8x 15.6x Mean 8.26x 15.38x Median 8.2x 15.4x
Introduction Investment Case Risks Conclusion
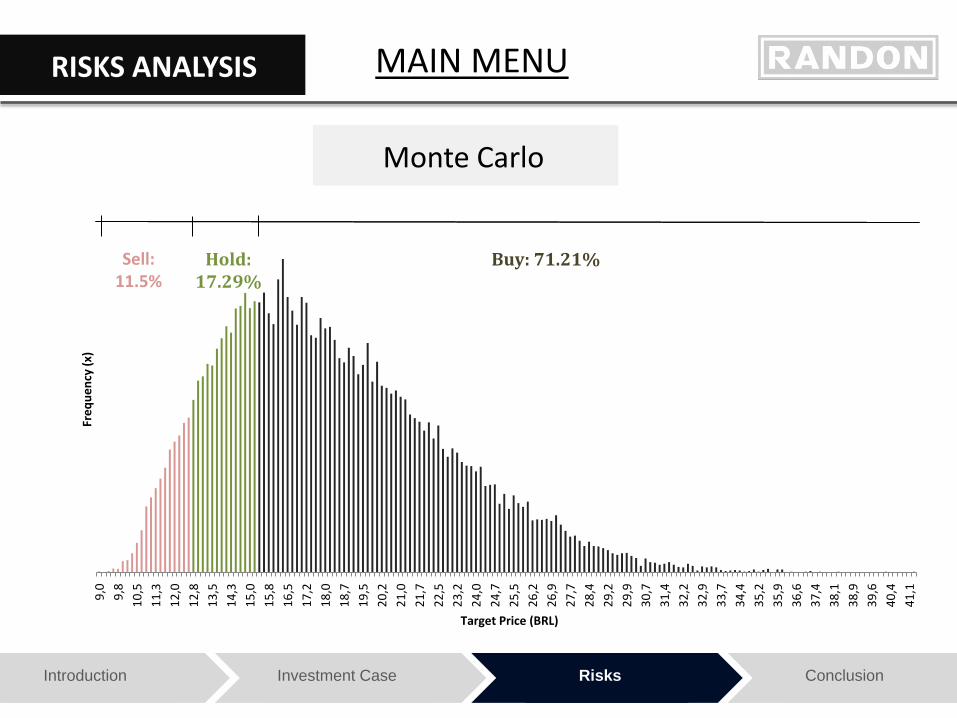
RISKS ANALYSIS 9
,0
9,8
1
0,5
1
1,3
1
2,0
1
2,8
1
3,5
1
4,3
1
5,0
1
5,8
1
6,5
1
7,2
1
8,0
1
8,7
1
9,5
2
0,2
2
1,0
2
1,7
2
2,5
2
3,2
2
4,0
2
4,7
2
5,5
2
6,2
2
6,9
2
7,7
2
8,4
2
9,2
2
9,9
3
0,7
3
1,4
3
2,2
3
2,9
3
3,7
3
4,4
3
5,2
3
5,9
3
6,6
3
7,4
3
8,1
3
8,9
3
9,6
4
0,4
4
1,1
Freq
uenc
y (x
)
Target Price (BRL)
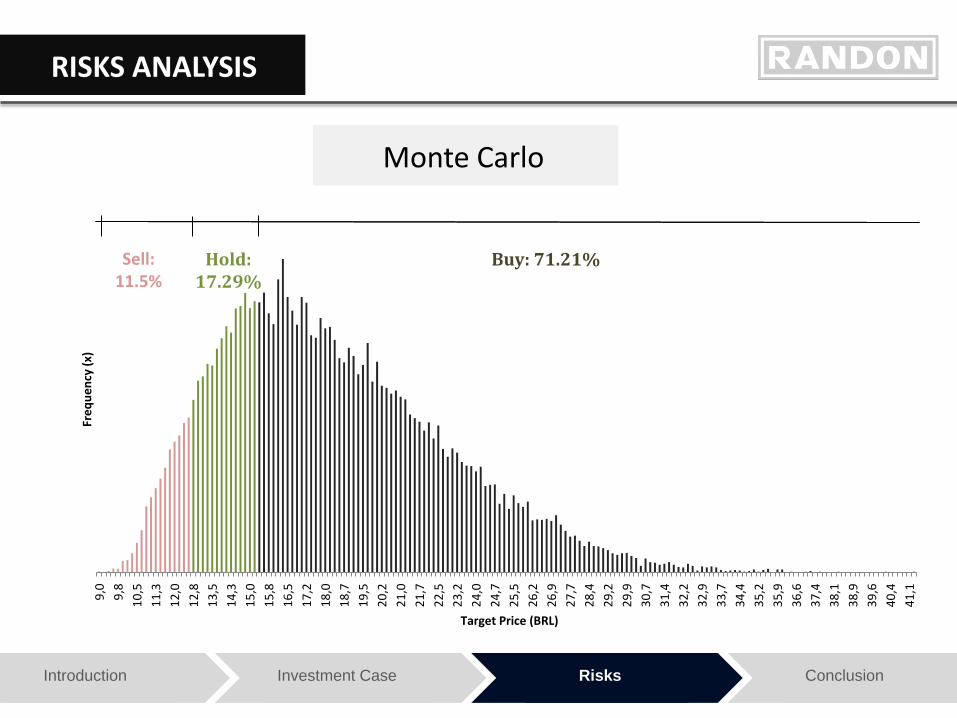
Buy: 71.21% Hold: 17.29%
Sell: 11.5%
Monte Carlo
Introduction Investment Case Risks Conclusion
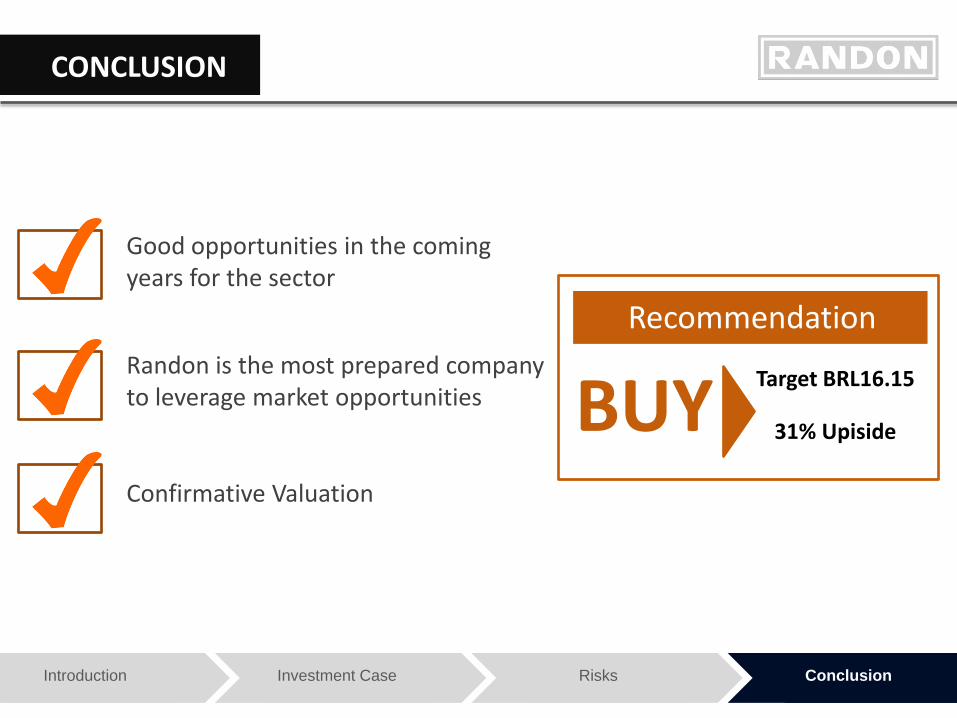
CONCLUSION
Good opportunities in the coming years for the sector
Confirmative Valuation
Randon is the most prepared company to leverage market opportunities BUY
Recommendation
31% Upiside
Target BRL16.15

Q&A THANK YOU Q&A
Q&A
Company Data
Income Statement 1
FCFF
WACC 1
Key Financial Ratios 1
Key Financial Ratios 2
Multiples 2
Balance sheet 1 Balance sheet 2
Multiples 1
Income Statement 2
WACC 2
DuPont Elasticity Randon’s Suppliers
Corporate Governance Graphic
Other information
SWOT
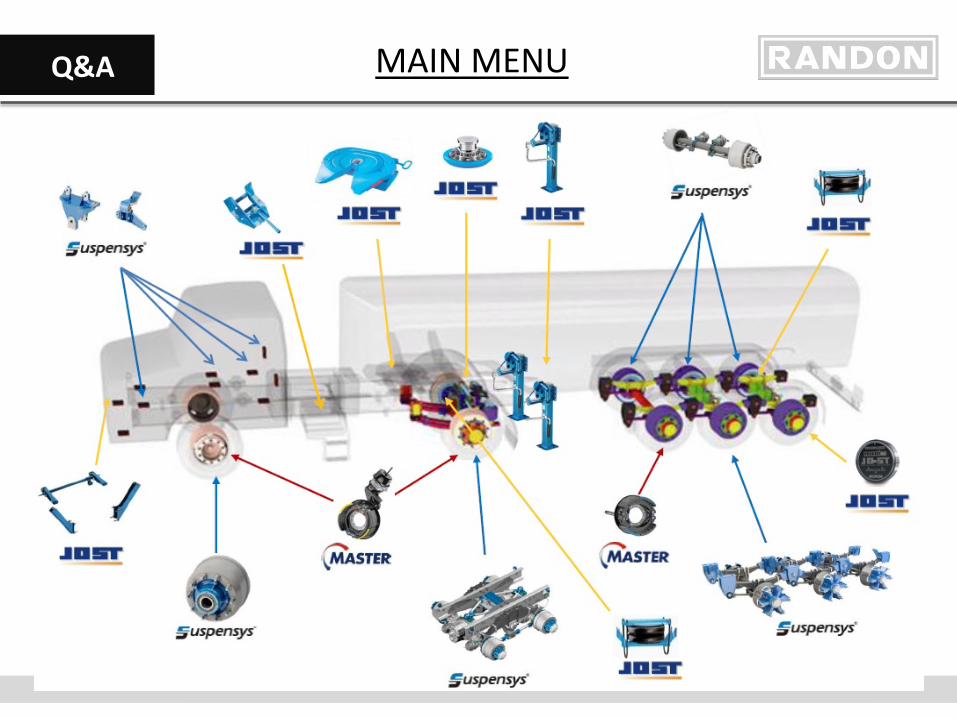
Truck components
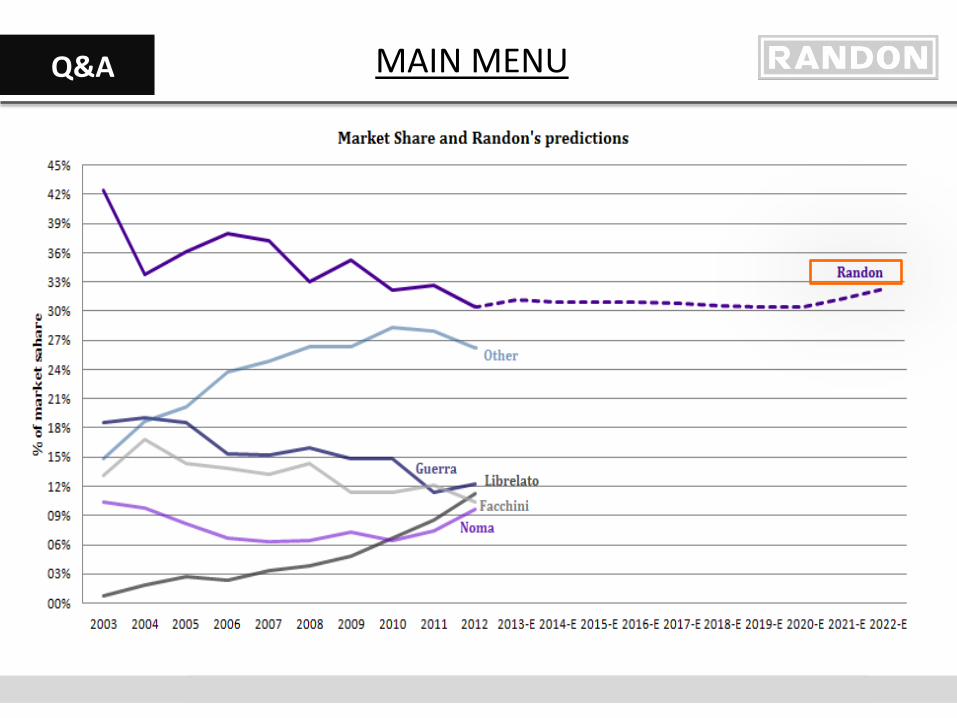
Market share
Rail Lines
Road Network
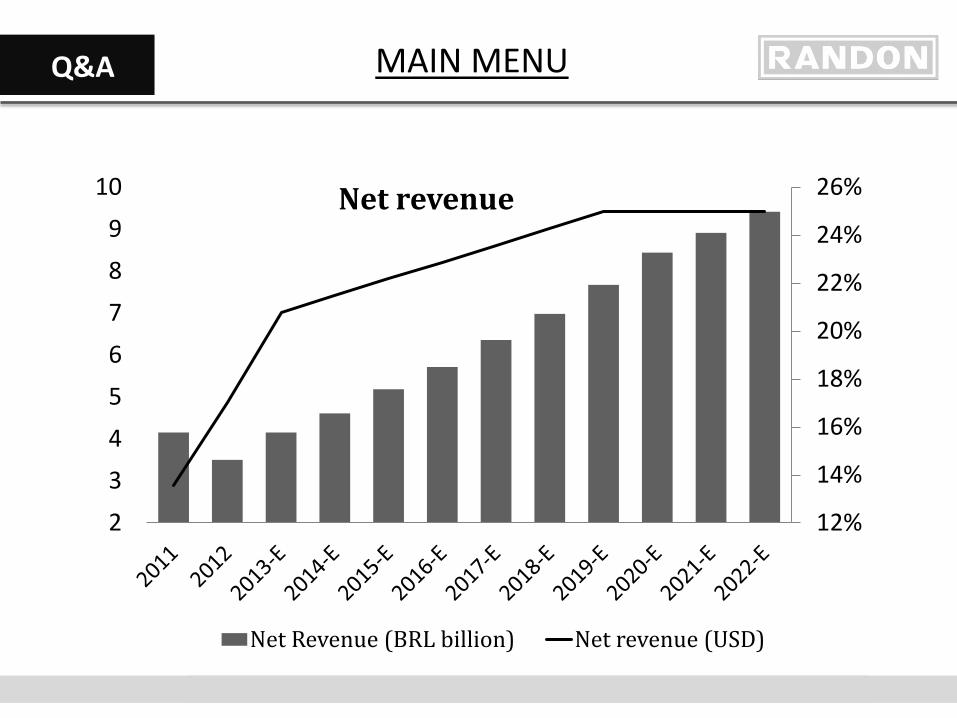
Net Revenue
Companies factories Corporate structure
Synerges
EURO
Global trailers producers
Distribution centers Auto parts market share World truck production
Bullish case Bearish case Domestic sale / exports
BNDES Company’s strategy
Suspensys Jost Master
Fras-le Raw materials Main events
Agribusiness Distribution synergies
Sensibility Analysis Risk Matrix
Q&A
Introduction
Recommendation
Net revenue Investment Case Truck trailers Porter Auto parts Porter Auto parts contracts Historical EBITDA margins
Renew of truck fleet
Recent Industry growth
Bulk trailers
Industry growth estimated
ERP-SAP
R&D
Suspensys growth
Competitors DCF Components
DCF Model 1
DCF Model 2
Gross Margins EBITDA margins Multiples target price
Monte Carlo 1
Monte Carlo 2
Q&A
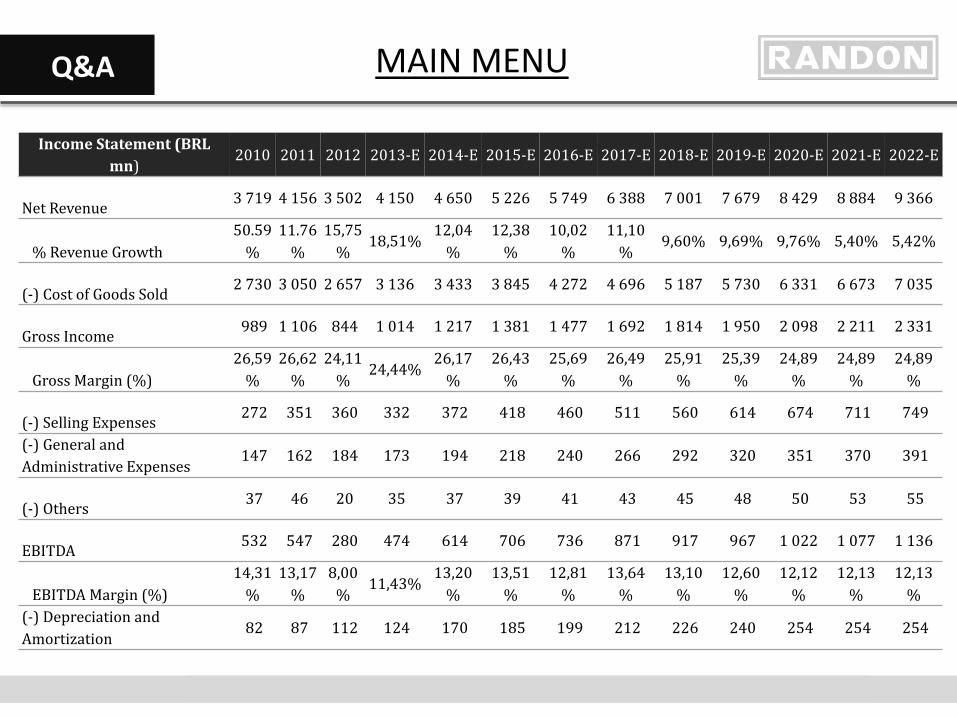
Income Statement (BRL mn)
2010 2011 2012 2013-E 2014-E 2015-E 2016-E 2017-E 2018-E 2019-E 2020-E 2021-E 2022-E
Net Revenue 3 719 4 156 3 502 4 150 4 650 5 226 5 749 6 388 7 001 7 679 8 429 8 884 9 366
% Revenue Growth 50.59
% 11.76
% 15,75
% 18,51%
12,04%
12,38%
10,02%
11,10%
9,60% 9,69% 9,76% 5,40% 5,42%
(-) Cost of Goods Sold 2 730 3 050 2 657 3 136 3 433 3 845 4 272 4 696 5 187 5 730 6 331 6 673 7 035
Gross Income 989 1 106 844 1 014 1 217 1 381 1 477 1 692 1 814 1 950 2 098 2 211 2 331
Gross Margin (%) 26,59
% 26,62
% 24,11
% 24,44%
26,17%
26,43%
25,69%
26,49%
25,91%
25,39%
24,89%
24,89%
24,89%
(-) Selling Expenses 272 351 360 332 372 418 460 511 560 614 674 711 749
(-) General and Administrative Expenses
147 162 184 173 194 218 240 266 292 320 351 370 391
(-) Others 37 46 20 35 37 39 41 43 45 48 50 53 55
EBITDA 532 547 280 474 614 706 736 871 917 967 1 022 1 077 1 136
EBITDA Margin (%) 14,31
% 13,17
% 8,00
% 11,43%
13,20%
13,51%
12,81%
13,64%
13,10%
12,60%
12,12%
12,13%
12,13%
(-) Depreciation and Amortization
82 87 112 124 170 185 199 212 226 240 254 254 254
MAIN MENU
Q&A
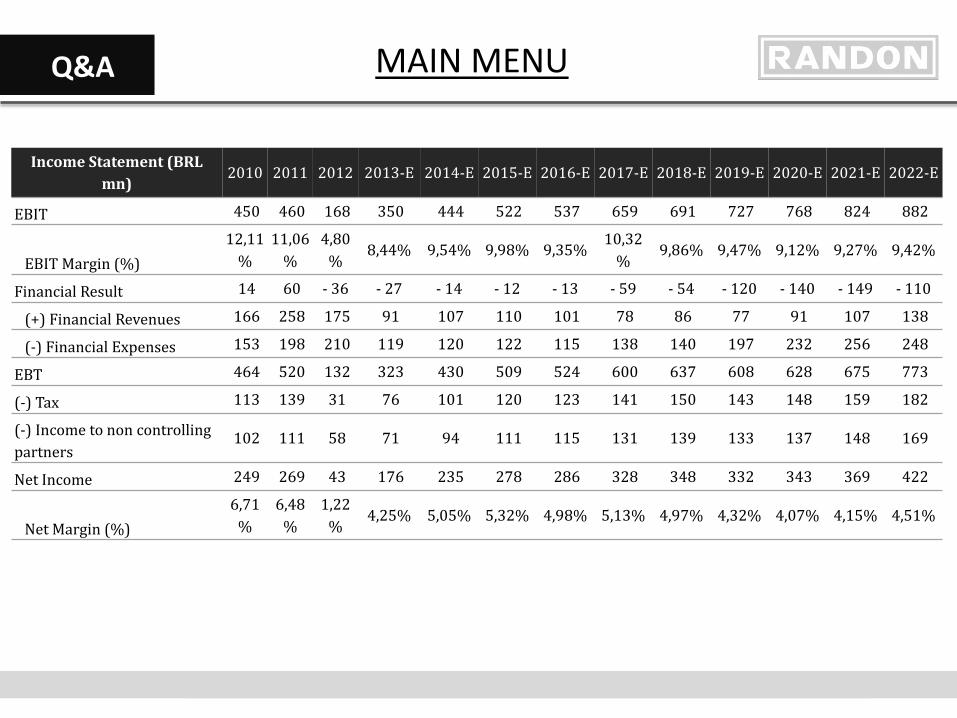
Income Statement (BRL mn)
2010 2011 2012 2013-E 2014-E 2015-E 2016-E 2017-E 2018-E 2019-E 2020-E 2021-E 2022-E
EBIT 450 460 168 350 444 522 537 659 691 727 768 824 882
EBIT Margin (%) 12,11
% 11,06
% 4,80
% 8,44% 9,54% 9,98% 9,35%
10,32%
9,86% 9,47% 9,12% 9,27% 9,42%
Financial Result 14 60 - 36 - 27 - 14 - 12 - 13 - 59 - 54 - 120 - 140 - 149 - 110
(+) Financial Revenues 166 258 175 91 107 110 101 78 86 77 91 107 138
(-) Financial Expenses 153 198 210 119 120 122 115 138 140 197 232 256 248
EBT 464 520 132 323 430 509 524 600 637 608 628 675 773
(-) Tax 113 139 31 76 101 120 123 141 150 143 148 159 182
(-) Income to non controlling partners
102 111 58 71 94 111 115 131 139 133 137 148 169
Net Income 249 269 43 176 235 278 286 328 348 332 343 369 422
Net Margin (%) 6,71
% 6,48
% 1,22
% 4,25% 5,05% 5,32% 4,98% 5,13% 4,97% 4,32% 4,07% 4,15% 4,51%
MAIN MENU
Q&A
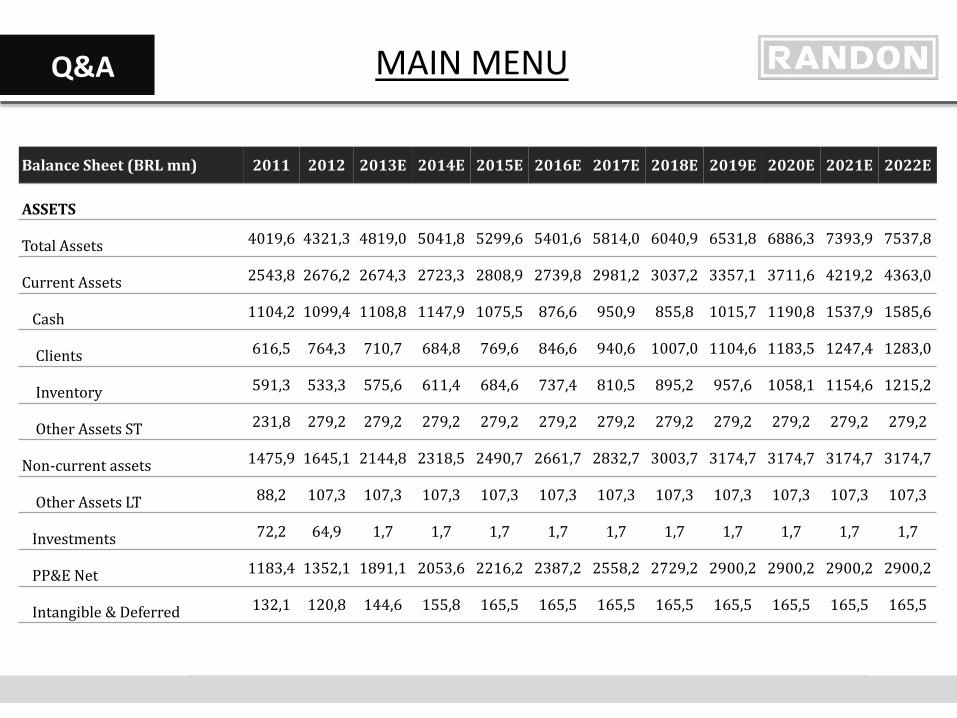
Balance Sheet (BRL mn) 2011 2012 2013E 2014E 2015E 2016E 2017E 2018E 2019E 2020E 2021E 2022E
ASSETS
Total Assets 4019,6 4321,3 4819,0 5041,8 5299,6 5401,6 5814,0 6040,9 6531,8 6886,3 7393,9 7537,8
Current Assets 2543,8 2676,2 2674,3 2723,3 2808,9 2739,8 2981,2 3037,2 3357,1 3711,6 4219,2 4363,0
Cash 1104,2 1099,4 1108,8 1147,9 1075,5 876,6 950,9 855,8 1015,7 1190,8 1537,9 1585,6
Clients 616,5 764,3 710,7 684,8 769,6 846,6 940,6 1007,0 1104,6 1183,5 1247,4 1283,0
Inventory 591,3 533,3 575,6 611,4 684,6 737,4 810,5 895,2 957,6 1058,1 1154,6 1215,2
Other Assets ST 231,8 279,2 279,2 279,2 279,2 279,2 279,2 279,2 279,2 279,2 279,2 279,2
Non-current assets 1475,9 1645,1 2144,8 2318,5 2490,7 2661,7 2832,7 3003,7 3174,7 3174,7 3174,7 3174,7
Other Assets LT 88,2 107,3 107,3 107,3 107,3 107,3 107,3 107,3 107,3 107,3 107,3 107,3
Investments 72,2 64,9 1,7 1,7 1,7 1,7 1,7 1,7 1,7 1,7 1,7 1,7
PP&E Net 1183,4 1352,1 1891,1 2053,6 2216,2 2387,2 2558,2 2729,2 2900,2 2900,2 2900,2 2900,2
Intangible & Deferred 132,1 120,8 144,6 155,8 165,5 165,5 165,5 165,5 165,5 165,5 165,5 165,5
MAIN MENU
Q&A
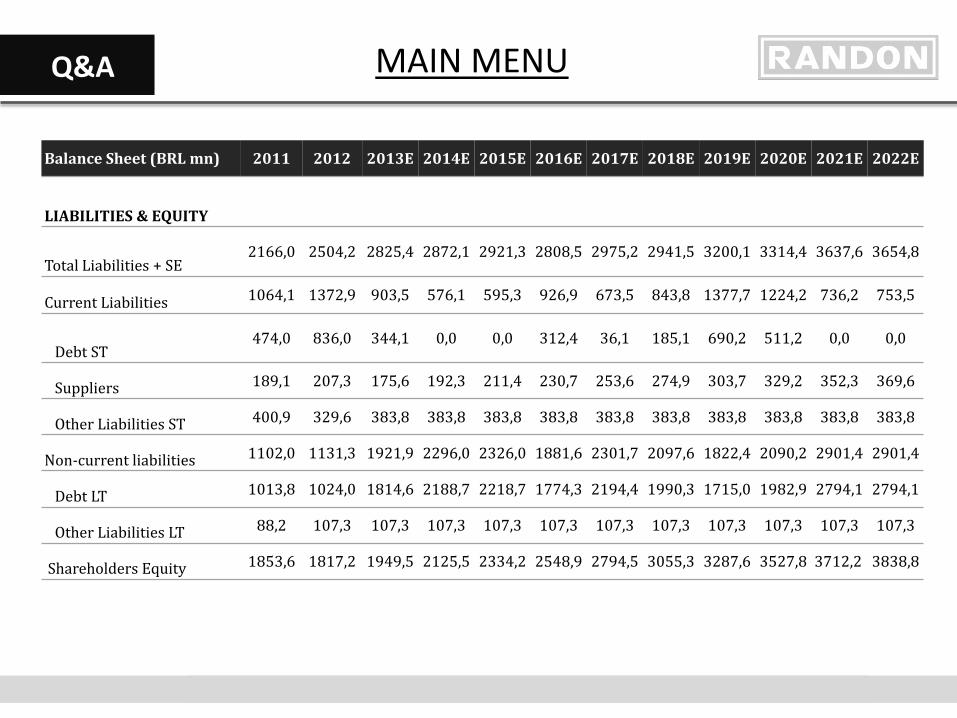
Balance Sheet (BRL mn) 2011 2012 2013E 2014E 2015E 2016E 2017E 2018E 2019E 2020E 2021E 2022E
LIABILITIES & EQUITY
Total Liabilities + SE 2166,0 2504,2 2825,4 2872,1 2921,3 2808,5 2975,2 2941,5 3200,1 3314,4 3637,6 3654,8
Current Liabilities 1064,1 1372,9 903,5 576,1 595,3 926,9 673,5 843,8 1377,7 1224,2 736,2 753,5
Debt ST 474,0 836,0 344,1 0,0 0,0 312,4 36,1 185,1 690,2 511,2 0,0 0,0
Suppliers 189,1 207,3 175,6 192,3 211,4 230,7 253,6 274,9 303,7 329,2 352,3 369,6
Other Liabilities ST 400,9 329,6 383,8 383,8 383,8 383,8 383,8 383,8 383,8 383,8 383,8 383,8
Non-current liabilities 1102,0 1131,3 1921,9 2296,0 2326,0 1881,6 2301,7 2097,6 1822,4 2090,2 2901,4 2901,4
Debt LT 1013,8 1024,0 1814,6 2188,7 2218,7 1774,3 2194,4 1990,3 1715,0 1982,9 2794,1 2794,1
Other Liabilities LT 88,2 107,3 107,3 107,3 107,3 107,3 107,3 107,3 107,3 107,3 107,3 107,3
Shareholders Equity 1853,6 1817,2 1949,5 2125,5 2334,2 2548,9 2794,5 3055,3 3287,6 3527,8 3712,2 3838,8
MAIN MENU
Q&A
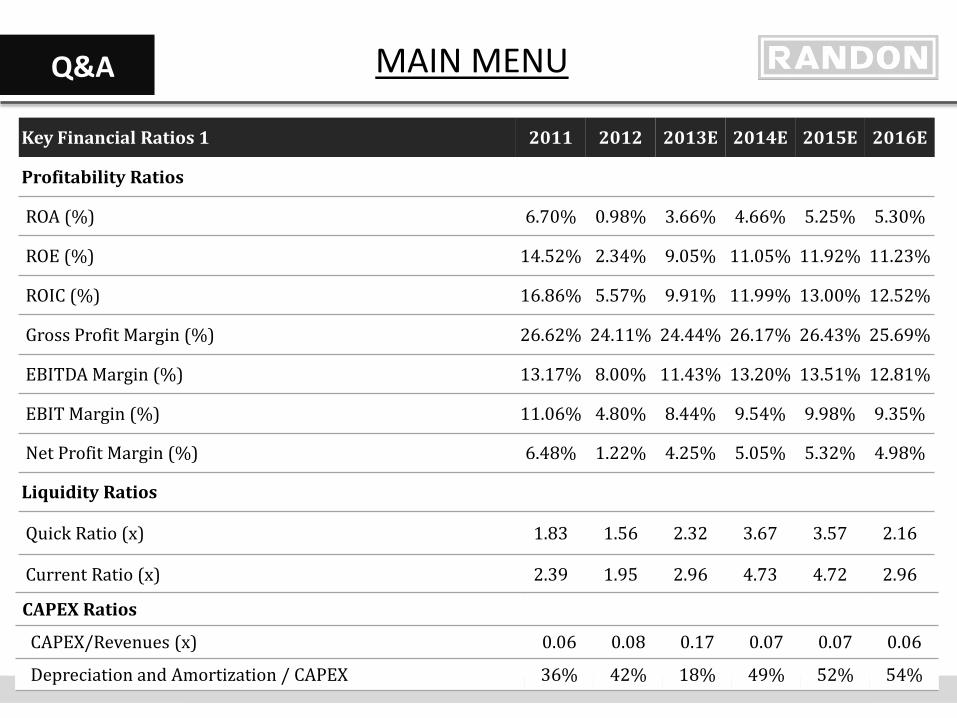
Key Financial Ratios 1 2011 2012 2013E 2014E 2015E 2016E
Profitability Ratios
ROA (%) 6.70% 0.98% 3.66% 4.66% 5.25% 5.30%
ROE (%) 14.52% 2.34% 9.05% 11.05% 11.92% 11.23%
ROIC (%) 16.86% 5.57% 9.91% 11.99% 13.00% 12.52%
Gross Profit Margin (%) 26.62% 24.11% 24.44% 26.17% 26.43% 25.69%
EBITDA Margin (%) 13.17% 8.00% 11.43% 13.20% 13.51% 12.81%
EBIT Margin (%) 11.06% 4.80% 8.44% 9.54% 9.98% 9.35%
Net Profit Margin (%) 6.48% 1.22% 4.25% 5.05% 5.32% 4.98%
Liquidity Ratios
Quick Ratio (x) 1.83 1.56 2.32 3.67 3.57 2.16
Current Ratio (x) 2.39 1.95 2.96 4.73 4.72 2.96
CAPEX Ratios
CAPEX/Revenues (x) 0.06 0.08 0.17 0.07 0.07 0.06
Depreciation and Amortization / CAPEX 36% 42% 18% 49% 52% 54%
MAIN MENU
Q&A
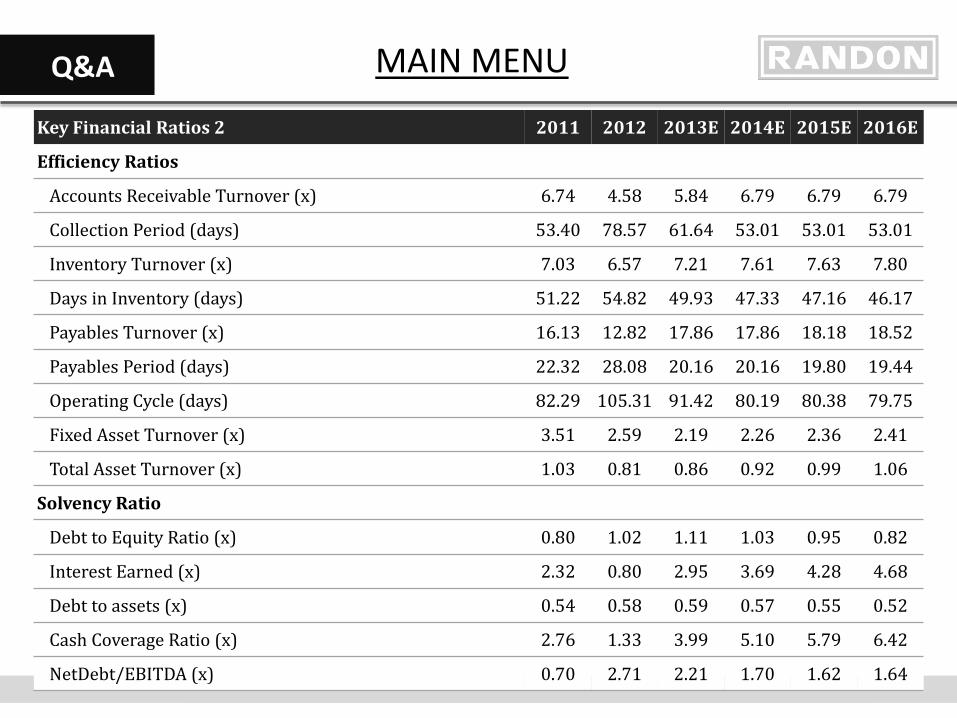
Key Financial Ratios 2 2011 2012 2013E 2014E 2015E 2016E
Efficiency Ratios
Accounts Receivable Turnover (x) 6.74 4.58 5.84 6.79 6.79 6.79
Collection Period (days) 53.40 78.57 61.64 53.01 53.01 53.01
Inventory Turnover (x) 7.03 6.57 7.21 7.61 7.63 7.80
Days in Inventory (days) 51.22 54.82 49.93 47.33 47.16 46.17
Payables Turnover (x) 16.13 12.82 17.86 17.86 18.18 18.52
Payables Period (days) 22.32 28.08 20.16 20.16 19.80 19.44
Operating Cycle (days) 82.29 105.31 91.42 80.19 80.38 79.75
Fixed Asset Turnover (x) 3.51 2.59 2.19 2.26 2.36 2.41
Total Asset Turnover (x) 1.03 0.81 0.86 0.92 0.99 1.06
Solvency Ratio
Debt to Equity Ratio (x) 0.80 1.02 1.11 1.03 0.95 0.82
Interest Earned (x) 2.32 0.80 2.95 3.69 4.28 4.68
Debt to assets (x) 0.54 0.58 0.59 0.57 0.55 0.52
Cash Coverage Ratio (x) 2.76 1.33 3.99 5.10 5.79 6.42
NetDebt/EBITDA (x) 0.70 2.71 2.21 1.70 1.62 1.64
MAIN MENU
Q&A
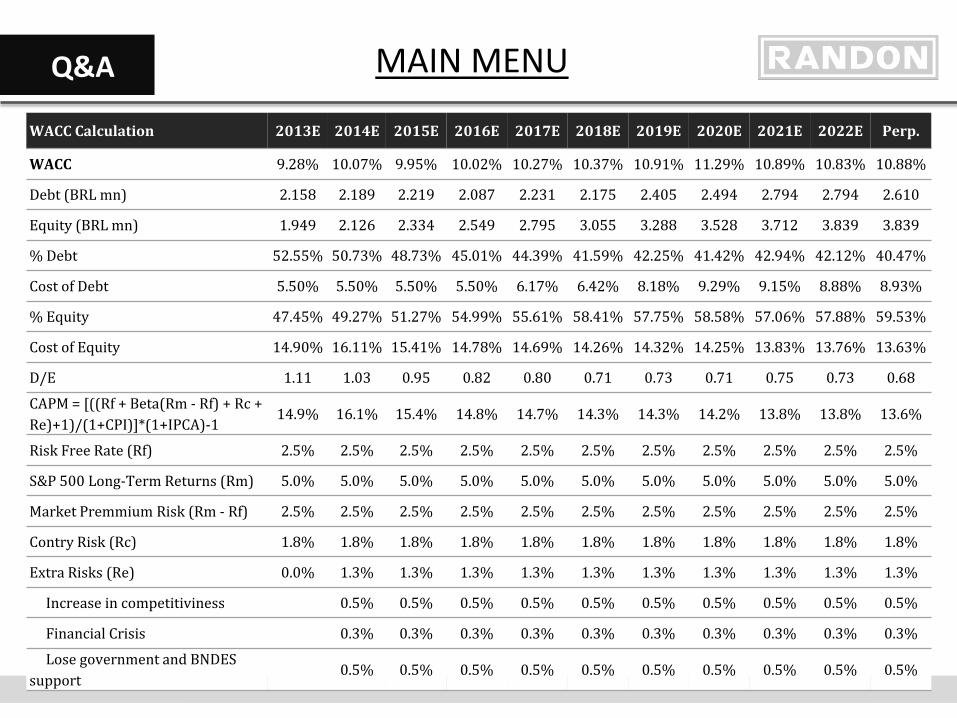
WACC Calculation 2013E 2014E 2015E 2016E 2017E 2018E 2019E 2020E 2021E 2022E Perp.
WACC 9.28% 10.07% 9.95% 10.02% 10.27% 10.37% 10.91% 11.29% 10.89% 10.83% 10.88%
Debt (BRL mn) 2.158 2.189 2.219 2.087 2.231 2.175 2.405 2.494 2.794 2.794 2.610
Equity (BRL mn) 1.949 2.126 2.334 2.549 2.795 3.055 3.288 3.528 3.712 3.839 3.839
% Debt 52.55% 50.73% 48.73% 45.01% 44.39% 41.59% 42.25% 41.42% 42.94% 42.12% 40.47%
Cost of Debt 5.50% 5.50% 5.50% 5.50% 6.17% 6.42% 8.18% 9.29% 9.15% 8.88% 8.93%
% Equity 47.45% 49.27% 51.27% 54.99% 55.61% 58.41% 57.75% 58.58% 57.06% 57.88% 59.53%
Cost of Equity 14.90% 16.11% 15.41% 14.78% 14.69% 14.26% 14.32% 14.25% 13.83% 13.76% 13.63%
D/E 1.11 1.03 0.95 0.82 0.80 0.71 0.73 0.71 0.75 0.73 0.68
CAPM = [((Rf + Beta(Rm - Rf) + Rc + Re)+1)/(1+CPI)]*(1+IPCA)-1
14.9% 16.1% 15.4% 14.8% 14.7% 14.3% 14.3% 14.2% 13.8% 13.8% 13.6%
Risk Free Rate (Rf) 2.5% 2.5% 2.5% 2.5% 2.5% 2.5% 2.5% 2.5% 2.5% 2.5% 2.5%
S&P 500 Long-Term Returns (Rm) 5.0% 5.0% 5.0% 5.0% 5.0% 5.0% 5.0% 5.0% 5.0% 5.0% 5.0%
Market Premmium Risk (Rm - Rf) 2.5% 2.5% 2.5% 2.5% 2.5% 2.5% 2.5% 2.5% 2.5% 2.5% 2.5%
Contry Risk (Rc) 1.8% 1.8% 1.8% 1.8% 1.8% 1.8% 1.8% 1.8% 1.8% 1.8% 1.8%
Extra Risks (Re) 0.0% 1.3% 1.3% 1.3% 1.3% 1.3% 1.3% 1.3% 1.3% 1.3% 1.3%
Increase in competitiviness 0.5% 0.5% 0.5% 0.5% 0.5% 0.5% 0.5% 0.5% 0.5% 0.5%
Financial Crisis 0.3% 0.3% 0.3% 0.3% 0.3% 0.3% 0.3% 0.3% 0.3% 0.3%
Lose government and BNDES support
0.5% 0.5% 0.5% 0.5% 0.5% 0.5% 0.5% 0.5% 0.5% 0.5%
MAIN MENU
Q&A
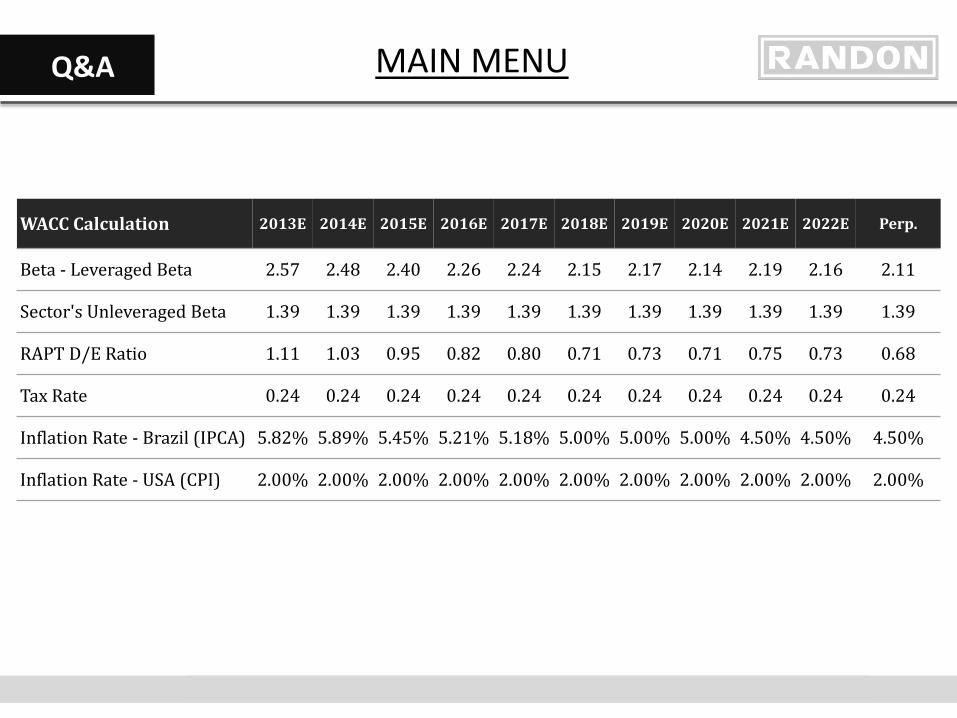
WACC Calculation 2013E 2014E 2015E 2016E 2017E 2018E 2019E 2020E 2021E 2022E Perp.
Beta - Leveraged Beta 2.57 2.48 2.40 2.26 2.24 2.15 2.17 2.14 2.19 2.16 2.11
Sector's Unleveraged Beta 1.39 1.39 1.39 1.39 1.39 1.39 1.39 1.39 1.39 1.39 1.39
RAPT D/E Ratio 1.11 1.03 0.95 0.82 0.80 0.71 0.73 0.71 0.75 0.73 0.68
Tax Rate 0.24 0.24 0.24 0.24 0.24 0.24 0.24 0.24 0.24 0.24 0.24
Inflation Rate - Brazil (IPCA) 5.82% 5.89% 5.45% 5.21% 5.18% 5.00% 5.00% 5.00% 4.50% 4.50% 4.50%
Inflation Rate - USA (CPI) 2.00% 2.00% 2.00% 2.00% 2.00% 2.00% 2.00% 2.00% 2.00% 2.00% 2.00%
MAIN MENU
Q&A
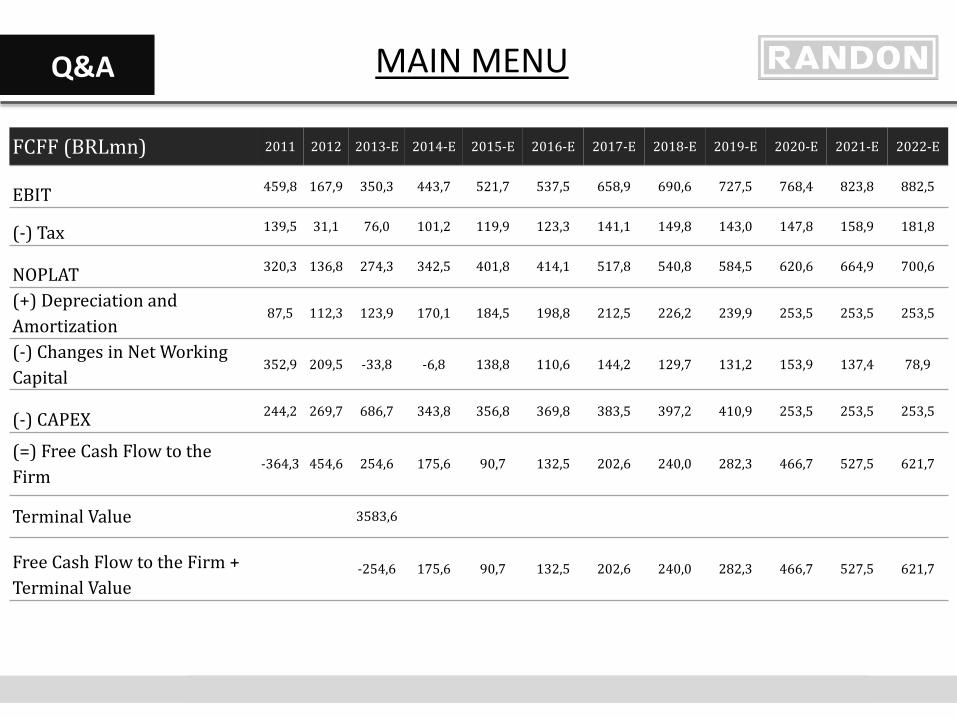
FCFF (BRLmn) 2011 2012 2013-E 2014-E 2015-E 2016-E 2017-E 2018-E 2019-E 2020-E 2021-E 2022-E
EBIT 459,8 167,9 350,3 443,7 521,7 537,5 658,9 690,6 727,5 768,4 823,8 882,5
(-) Tax 139,5 31,1 76,0 101,2 119,9 123,3 141,1 149,8 143,0 147,8 158,9 181,8
NOPLAT 320,3 136,8 274,3 342,5 401,8 414,1 517,8 540,8 584,5 620,6 664,9 700,6
(+) Depreciation and Amortization
87,5 112,3 123,9 170,1 184,5 198,8 212,5 226,2 239,9 253,5 253,5 253,5
(-) Changes in Net Working Capital
352,9 209,5 -33,8 -6,8 138,8 110,6 144,2 129,7 131,2 153,9 137,4 78,9
(-) CAPEX 244,2 269,7 686,7 343,8 356,8 369,8 383,5 397,2 410,9 253,5 253,5 253,5
(=) Free Cash Flow to the Firm
-364,3 454,6 254,6 175,6 90,7 132,5 202,6 240,0 282,3 466,7 527,5 621,7
Terminal Value 3583,6
Free Cash Flow to the Firm + Terminal Value
-254,6 175,6 90,7 132,5 202,6 240,0 282,3 466,7 527,5 621,7
MAIN MENU
Q&A
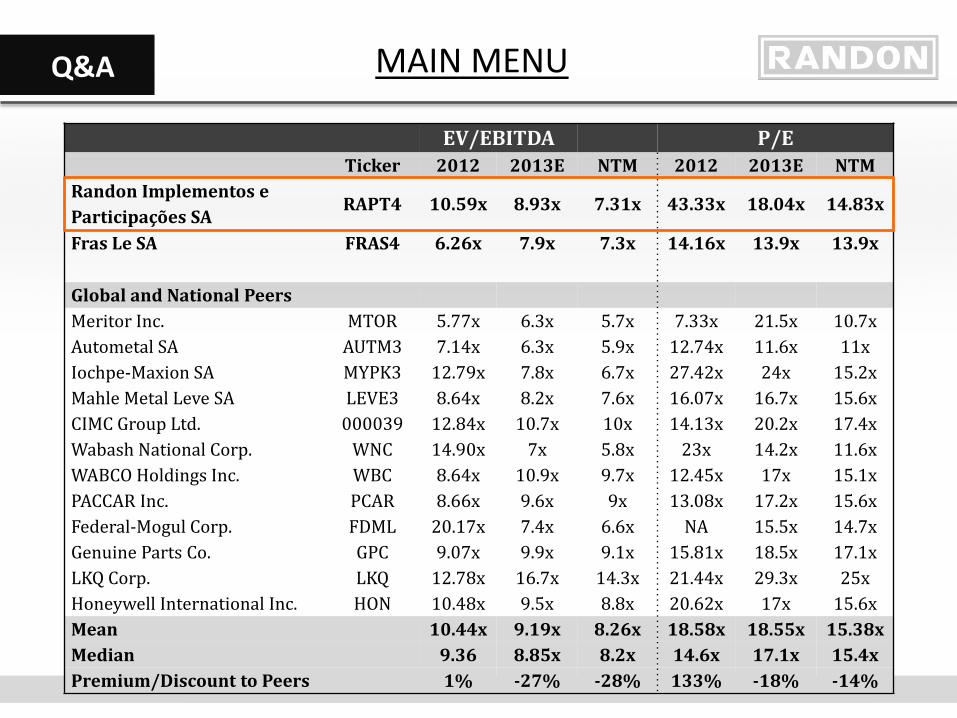
EV/EBITDA P/E Ticker 2012 2013E NTM 2012 2013E NTM
Randon Implementos e Participações SA
RAPT4 10.59x 8.93x 7.31x 43.33x 18.04x 14.83x
Fras Le SA FRAS4 6.26x 7.9x 7.3x 14.16x 13.9x 13.9x
Global and National Peers Meritor Inc. MTOR 5.77x 6.3x 5.7x 7.33x 21.5x 10.7x Autometal SA AUTM3 7.14x 6.3x 5.9x 12.74x 11.6x 11x Iochpe-Maxion SA MYPK3 12.79x 7.8x 6.7x 27.42x 24x 15.2x Mahle Metal Leve SA LEVE3 8.64x 8.2x 7.6x 16.07x 16.7x 15.6x CIMC Group Ltd. 000039 12.84x 10.7x 10x 14.13x 20.2x 17.4x Wabash National Corp. WNC 14.90x 7x 5.8x 23x 14.2x 11.6x WABCO Holdings Inc. WBC 8.64x 10.9x 9.7x 12.45x 17x 15.1x PACCAR Inc. PCAR 8.66x 9.6x 9x 13.08x 17.2x 15.6x Federal-Mogul Corp. FDML 20.17x 7.4x 6.6x NA 15.5x 14.7x Genuine Parts Co. GPC 9.07x 9.9x 9.1x 15.81x 18.5x 17.1x LKQ Corp. LKQ 12.78x 16.7x 14.3x 21.44x 29.3x 25x Honeywell International Inc. HON 10.48x 9.5x 8.8x 20.62x 17x 15.6x Mean 10.44x 9.19x 8.26x 18.58x 18.55x 15.38x Median 9.36 8.85x 8.2x 14.6x 17.1x 15.4x Premium/Discount to Peers 1% -27% -28% 133% -18% -14%
MAIN MENU
Q&A
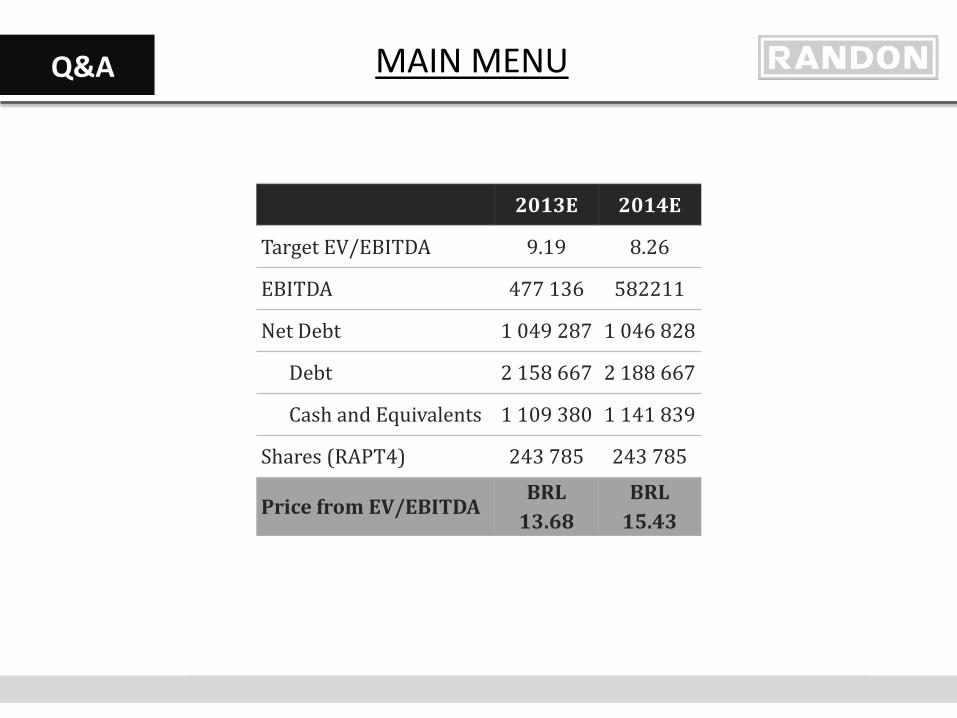
2013E 2014E
Target EV/EBITDA 9.19 8.26
EBITDA 477 136 582211
Net Debt 1 049 287 1 046 828
Debt 2 158 667 2 188 667
Cash and Equivalents 1 109 380 1 141 839
Shares (RAPT4) 243 785 243 785
Price from EV/EBITDA BRL
13.68 BRL
15.43
MAIN MENU
Q&A
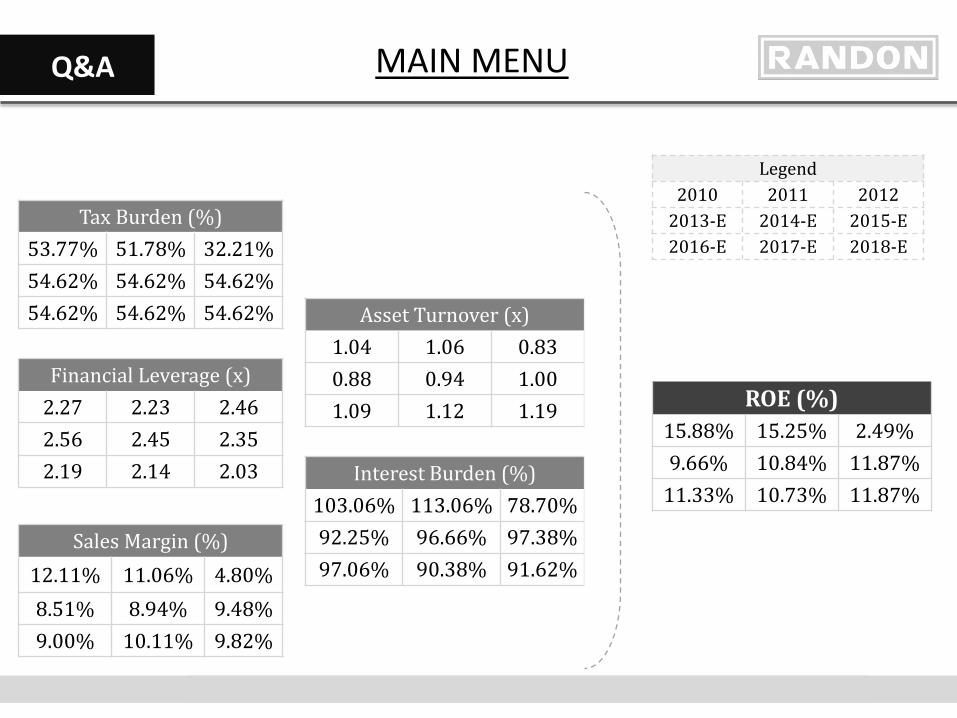
ROE (%) 15.88% 15.25% 2.49% 9.66% 10.84% 11.87%
11.33% 10.73% 11.87%
Tax Burden (%) 53.77% 51.78% 32.21% 54.62% 54.62% 54.62% 54.62% 54.62% 54.62%
Sales Margin (%)
12.11% 11.06% 4.80%
8.51% 8.94% 9.48% 9.00% 10.11% 9.82%
Asset Turnover (x) 1.04 1.06 0.83 0.88 0.94 1.00 1.09 1.12 1.19
Financial Leverage (x) 2.27 2.23 2.46 2.56 2.45 2.35 2.19 2.14 2.03 Interest Burden (%)
103.06% 113.06% 78.70% 92.25% 96.66% 97.38% 97.06% 90.38% 91.62%
Legend 2010 2011 2012
2013-E 2014-E 2015-E 2016-E 2017-E 2018-E
MAIN MENU
Q&A
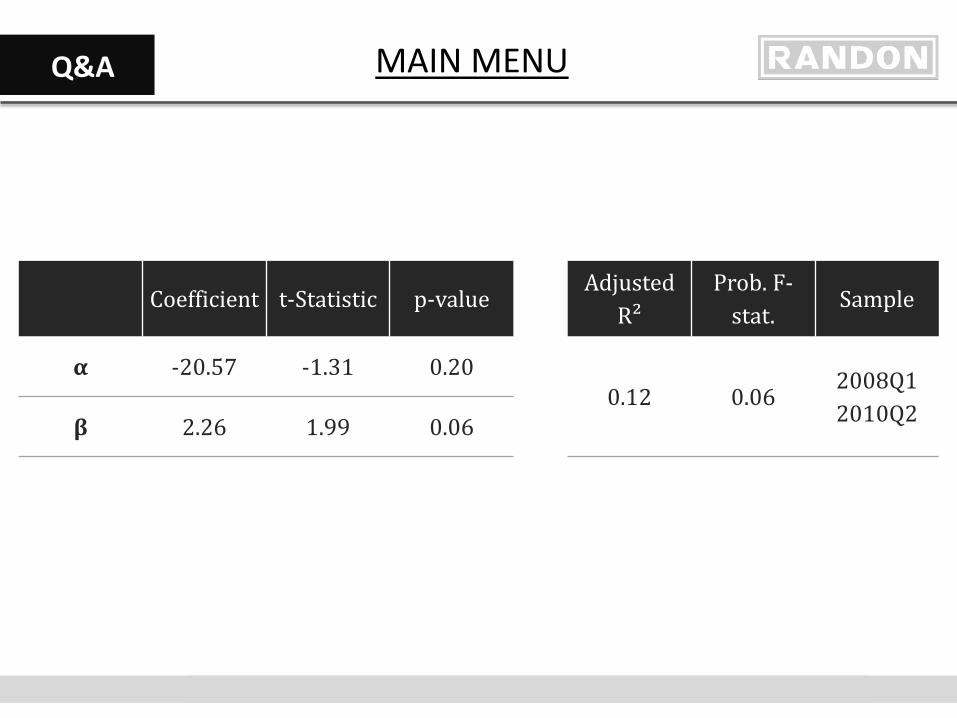
Coefficient t-Statistic p-value Adjusted
R² Prob. F-
stat. Sample
α -20.57 -1.31 0.20 0.12 0.06
2008Q1 2010Q2 β 2.26 1.99 0.06
MAIN MENU
Q&A
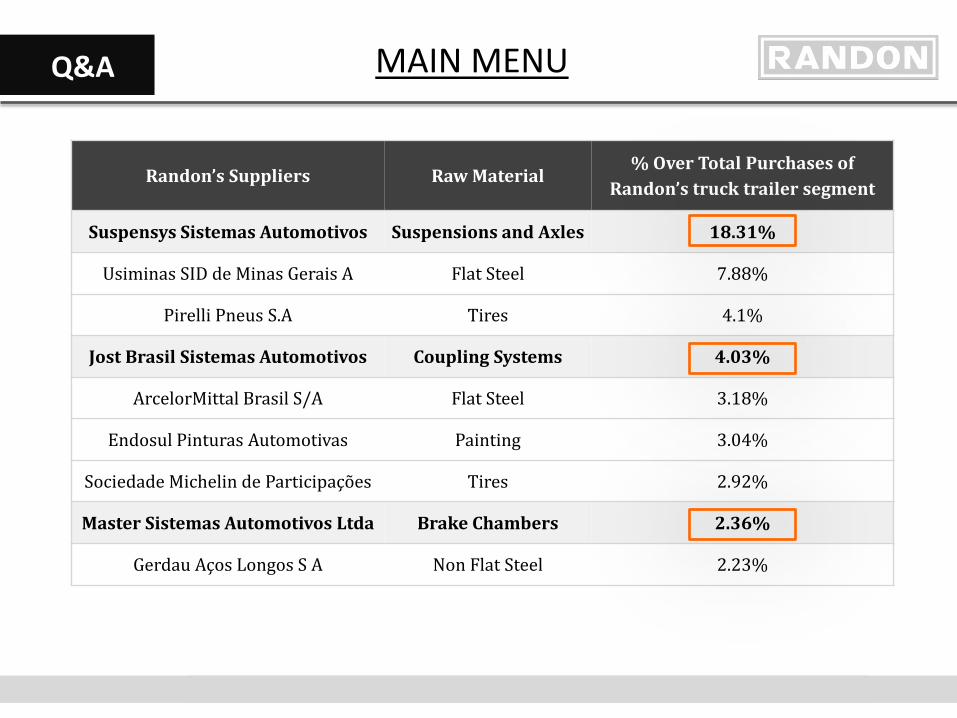
Randon’s Suppliers Raw Material % Over Total Purchases of
Randon’s truck trailer segment
Suspensys Sistemas Automotivos Suspensions and Axles 18.31%
Usiminas SID de Minas Gerais A Flat Steel 7.88%
Pirelli Pneus S.A Tires 4.1%
Jost Brasil Sistemas Automotivos Coupling Systems 4.03%
ArcelorMittal Brasil S/A Flat Steel 3.18%
Endosul Pinturas Automotivas Painting 3.04%
Sociedade Michelin de Participações Tires 2.92%
Master Sistemas Automotivos Ltda Brake Chambers 2.36%
Gerdau Aços Longos S A Non Flat Steel 2.23%
MAIN MENU
Q&A
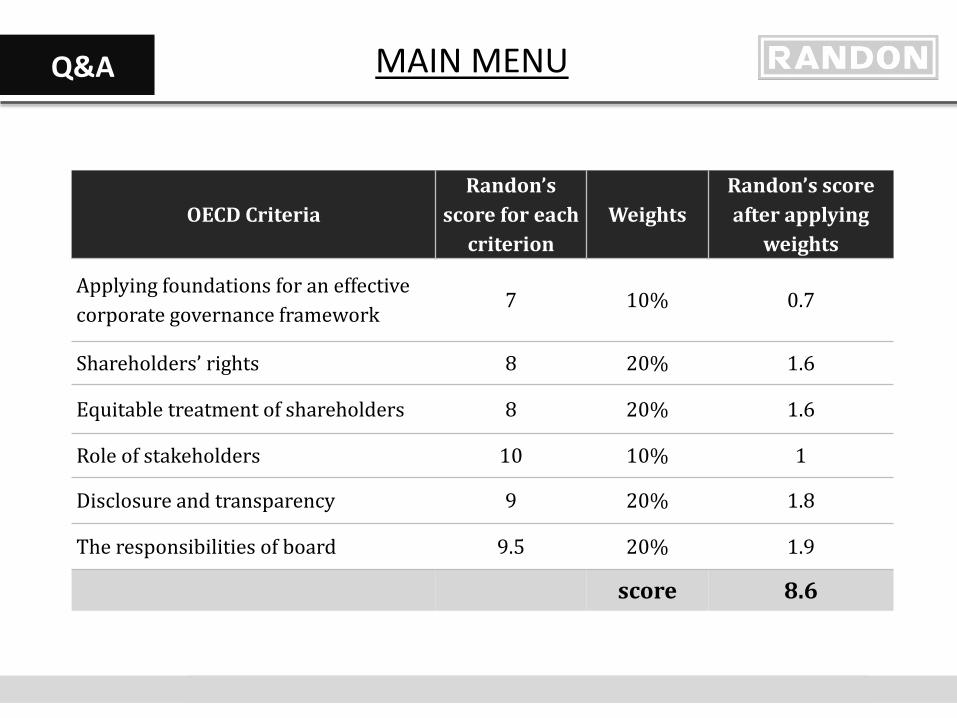
OECD Criteria Randon’s
score for each criterion
Weights Randon’s score after applying
weights
Applying foundations for an effective corporate governance framework
7 10% 0.7
Shareholders’ rights 8 20% 1.6
Equitable treatment of shareholders 8 20% 1.6
Role of stakeholders 10 10% 1
Disclosure and transparency 9 20% 1.8
The responsibilities of board 9.5 20% 1.9
score 8.6
MAIN MENU
Q&A
MAIN MENU
Q&A
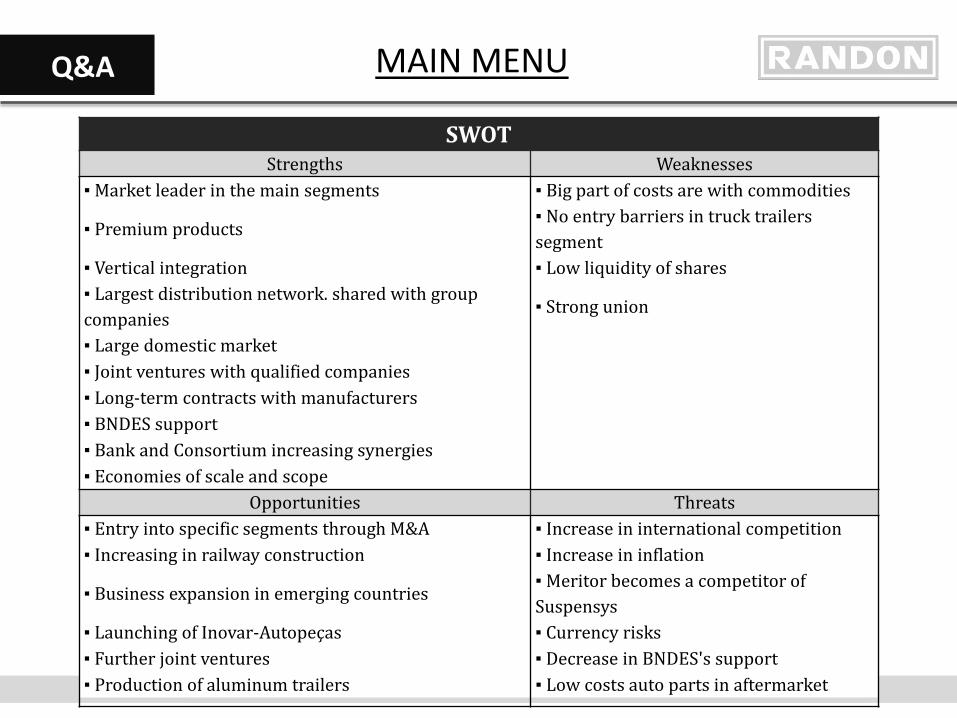
SWOT Strengths Weaknesses
▪ Market leader in the main segments ▪ Big part of costs are with commodities
▪ Premium products ▪ No entry barriers in truck trailers segment
▪ Vertical integration ▪ Low liquidity of shares ▪ Largest distribution network. shared with group companies
▪ Strong union
▪ Large domestic market ▪ Joint ventures with qualified companies ▪ Long-term contracts with manufacturers ▪ BNDES support ▪ Bank and Consortium increasing synergies ▪ Economies of scale and scope
Opportunities Threats ▪ Entry into specific segments through M&A ▪ Increase in international competition ▪ Increasing in railway construction ▪ Increase in inflation
▪ Business expansion in emerging countries ▪ Meritor becomes a competitor of Suspensys
▪ Launching of Inovar-Autopeças ▪ Currency risks ▪ Further joint ventures ▪ Decrease in BNDES's support ▪ Production of aluminum trailers ▪ Low costs auto parts in aftermarket
MAIN MENU
Q&A
MAIN MENU

Q&A
MAIN MENU

Q&A
MAIN MENU
Q&A
0
50
100
150
200
250
0
500
1000
1500
2000
2500
3000
China United States
Russian Federation
Brazil Canada South Africa
Germany Mexico
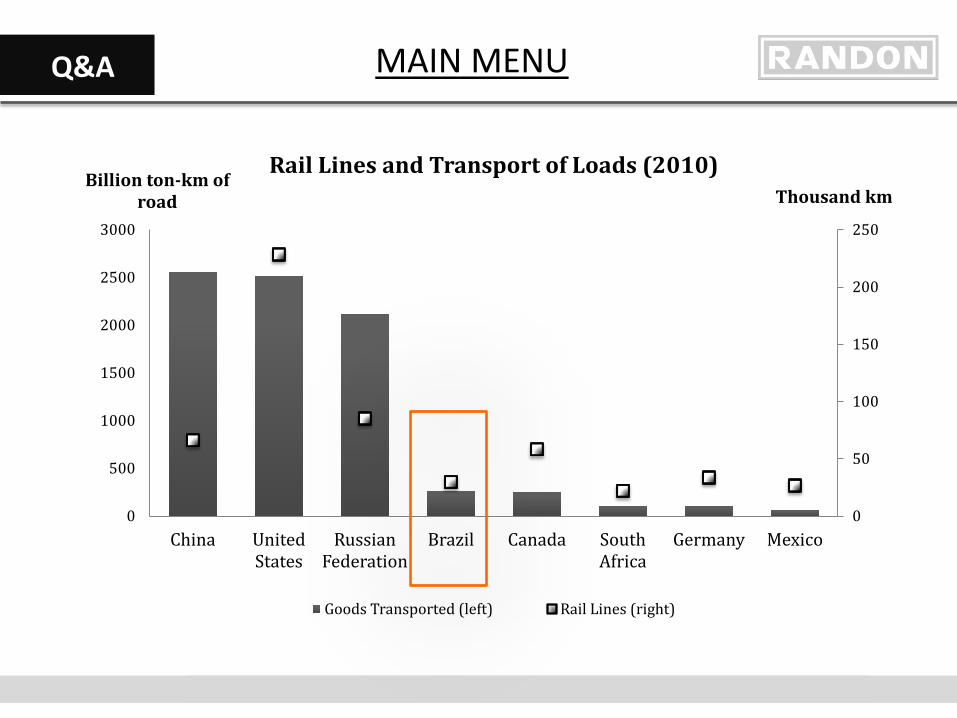
Thousand km Billion ton-km of
road
Rail Lines and Transport of Loads (2010)
Goods Transported (left) Rail Lines (right)
MAIN MENU
Q&A
0
1
2
3
4
5
6
7
0
500
1000
1500
2000
2500
3000
3500
4000
4500
5000
China United States
Brazil Germany Mexico Russian Federation
Turkey Canada
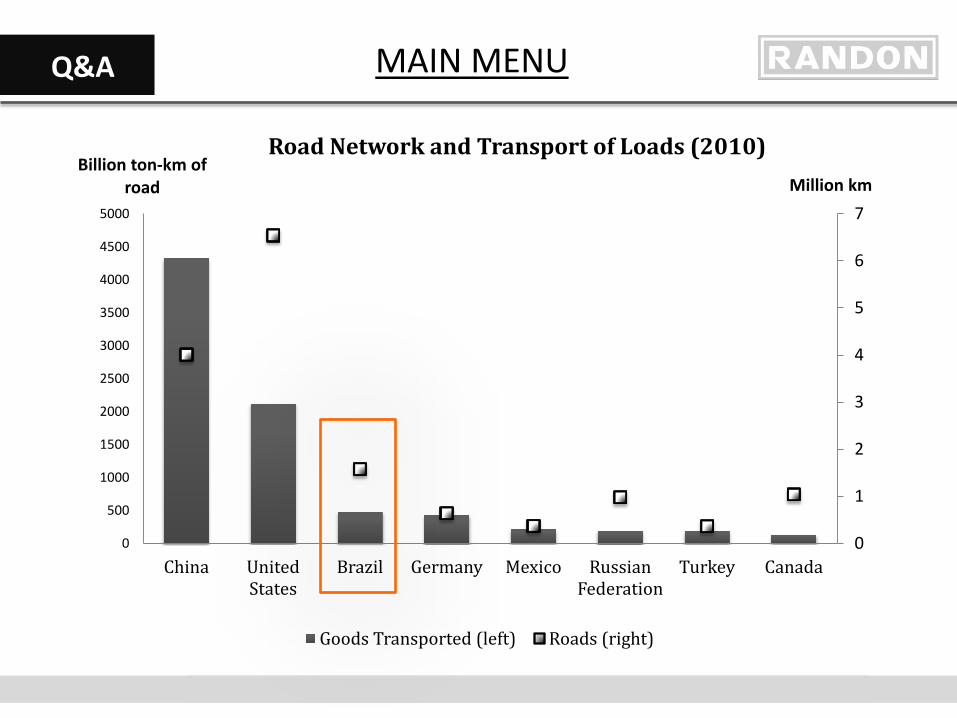
Million km Billion ton-km of
road
Road Network and Transport of Loads (2010)
Goods Transported (left) Roads (right)
MAIN MENU
Q&A
MAIN MENU
Q&A
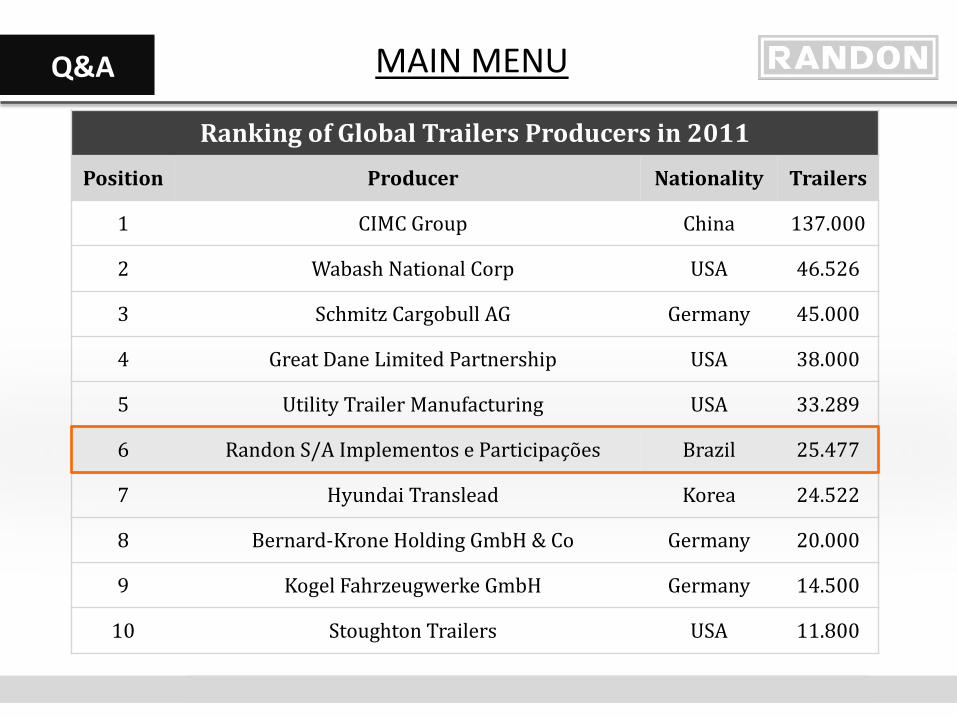
Ranking of Global Trailers Producers in 2011
Position Producer Nationality Trailers
1 CIMC Group China 137.000
2 Wabash National Corp USA 46.526
3 Schmitz Cargobull AG Germany 45.000
4 Great Dane Limited Partnership USA 38.000
5 Utility Trailer Manufacturing USA 33.289
6 Randon S/A Implementos e Participações Brazil 25.477
7 Hyundai Translead Korea 24.522
8 Bernard-Krone Holding GmbH & Co Germany 20.000
9 Kogel Fahrzeugwerke GmbH Germany 14.500
10 Stoughton Trailers USA 11.800
MAIN MENU
Q&A
MAIN MENU

Q&A
MAIN MENU
Q&A
12%
14%
16%
18%
20%
22%
24%
26%
2 3 4 5 6 7 8 9
10 Net revenue
Net Revenue (BRL billion) Net revenue (USD)
MAIN MENU

Q&A
Distributions centers of trailers segment
MAIN MENU
Q&A
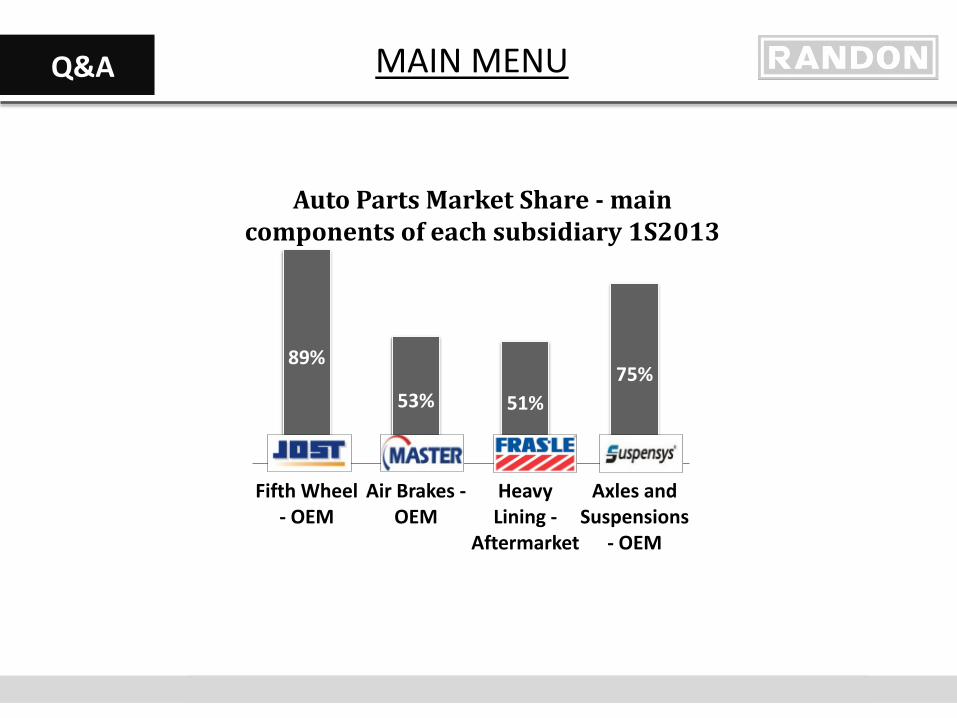
89%
53% 51% 75%
Fifth Wheel - OEM
Air Brakes - OEM
Heavy Lining -
Aftermarket
Axles and Suspensions
- OEM
Auto Parts Market Share - main components of each subsidiary 1S2013
MAIN MENU

Q&A
MAIN MENU
Q&A
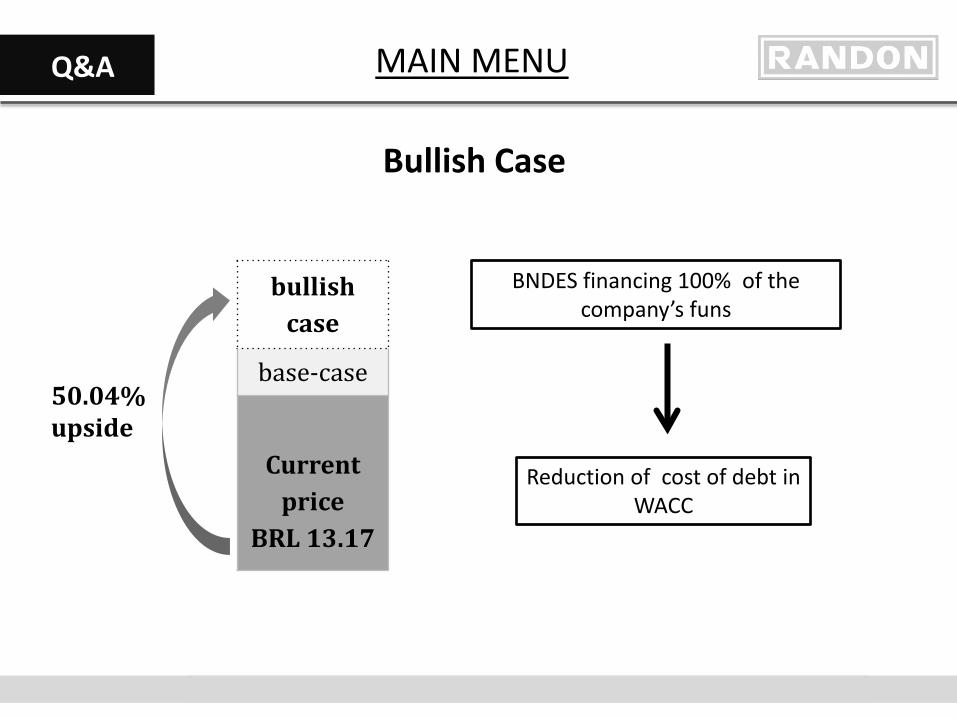
bullish case
base-case
Current
price BRL 13.17
50.04% upside
Bullish Case
MAIN MENU
BNDES financing 100% of the company’s funs
Reduction of cost of debt in WACC
Q&A
MAIN MENU
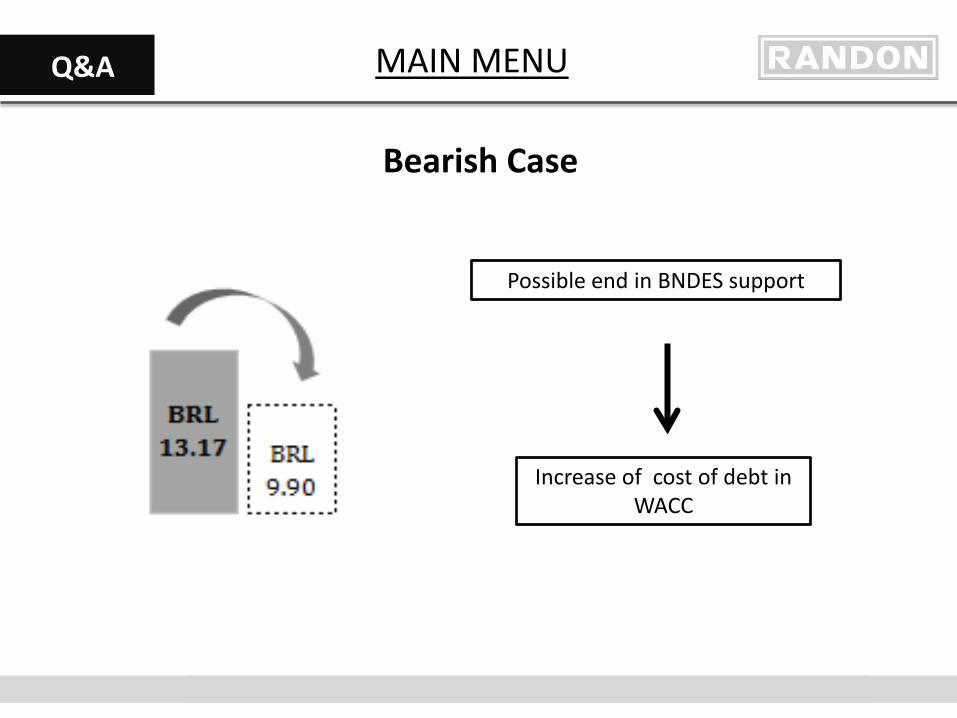
Possible end in BNDES support
Increase of cost of debt in WACC
Bearish Case
Q&A
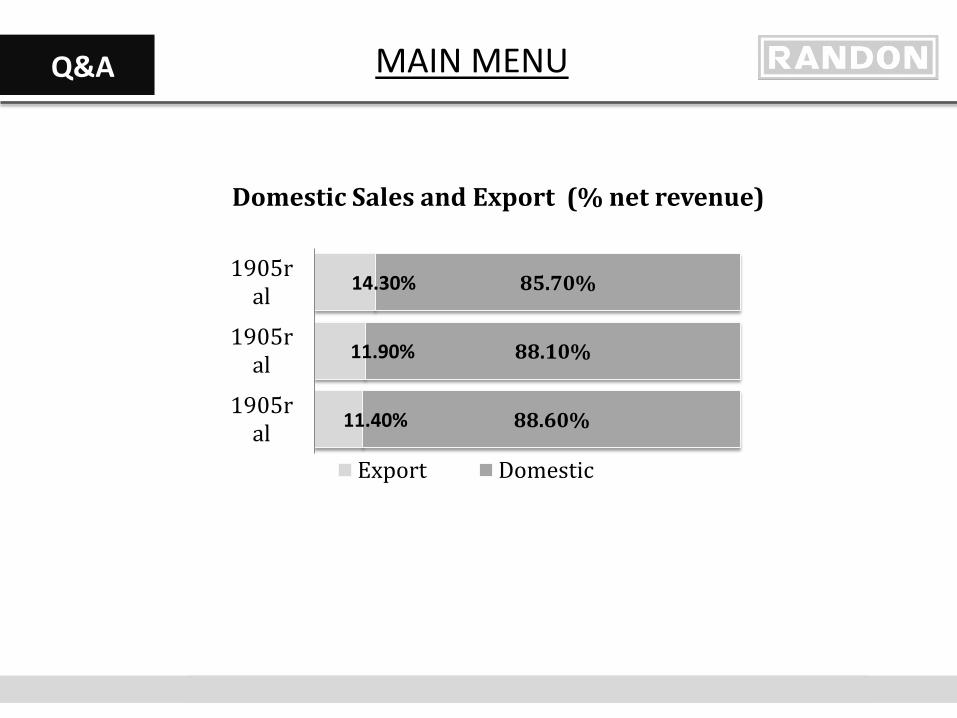
Domestic Sales and Export (% net revenue)
11.40%
11.90%
14.30%
88.60%
88.10%
85.70%
1905ral
1905ral
1905ral
Export Domestic
MAIN MENU
Q&A
MAIN MENU
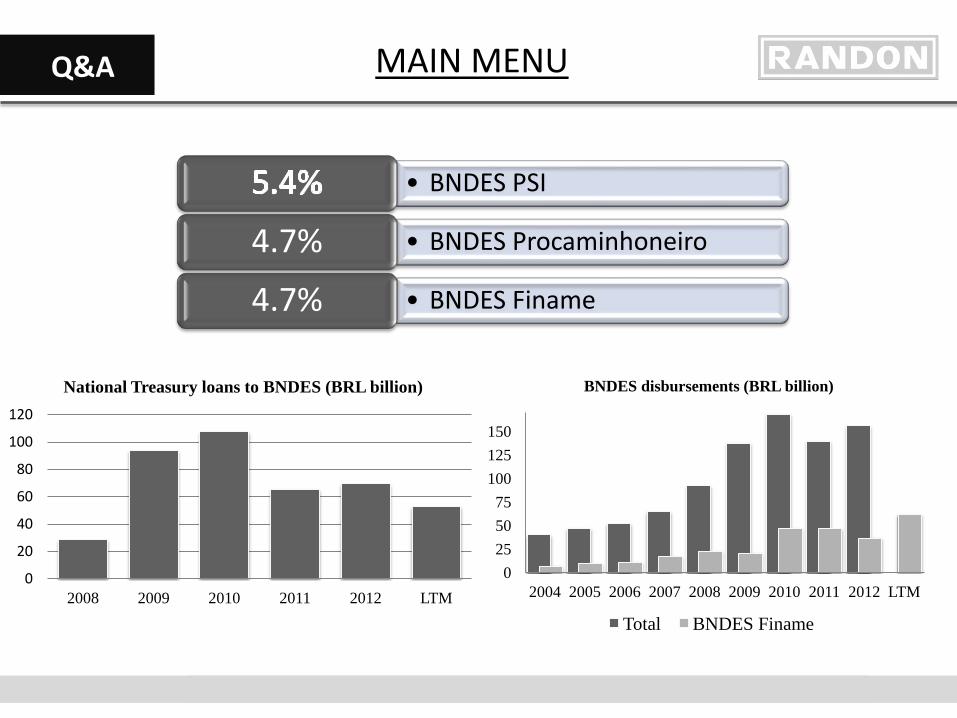
• BNDES PSI
• BNDES Procaminhoneiro 4.7% • BNDES Finame 4.7%
0 25 50 75
100 125 150
2004 2005 2006 2007 2008 2009 2010 2011 2012 LTM
BNDES disbursements (BRL billion)
Total BNDES Finame
0
20
40
60
80
100
120
2008 2009 2010 2011 2012 LTM
National Treasury loans to BNDES (BRL billion)

Q&A
MAIN MENU
Company’s Strategy
• Strategic partnerships; • Maintain the leadership in domestic market; • Advance in international markets; • Decentralization of the productive structure; • Diversification of the product portfolio and
promotion of vertical integration.
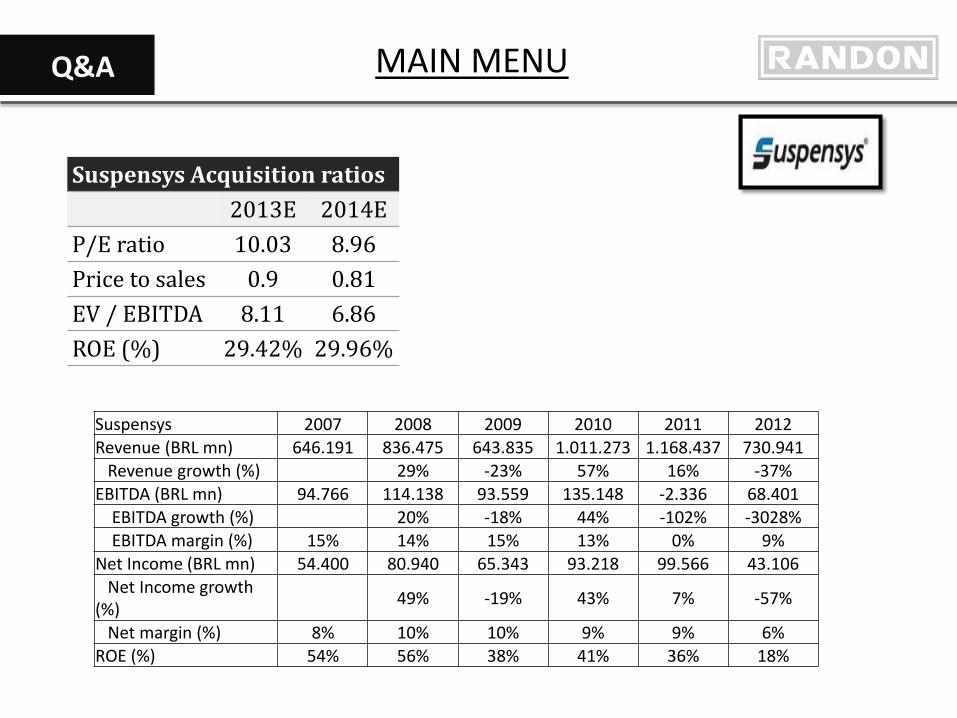
Suspensys Acquisition ratios 2013E 2014E P/E ratio 10.03 8.96 Price to sales 0.9 0.81 EV / EBITDA 8.11 6.86 ROE (%) 29.42% 29.96%
Suspensys 2007 2008 2009 2010 2011 2012 Revenue (BRL mn) 646.191 836.475 643.835 1.011.273 1.168.437 730.941 Revenue growth (%) 29% -23% 57% 16% -37% EBITDA (BRL mn) 94.766 114.138 93.559 135.148 -2.336 68.401 EBITDA growth (%) 20% -18% 44% -102% -3028% EBITDA margin (%) 15% 14% 15% 13% 0% 9% Net Income (BRL mn) 54.400 80.940 65.343 93.218 99.566 43.106 Net Income growth (%) 49% -19% 43% 7% -57%
Net margin (%) 8% 10% 10% 9% 9% 6% ROE (%) 54% 56% 38% 41% 36% 18%
Q&A
MAIN MENU
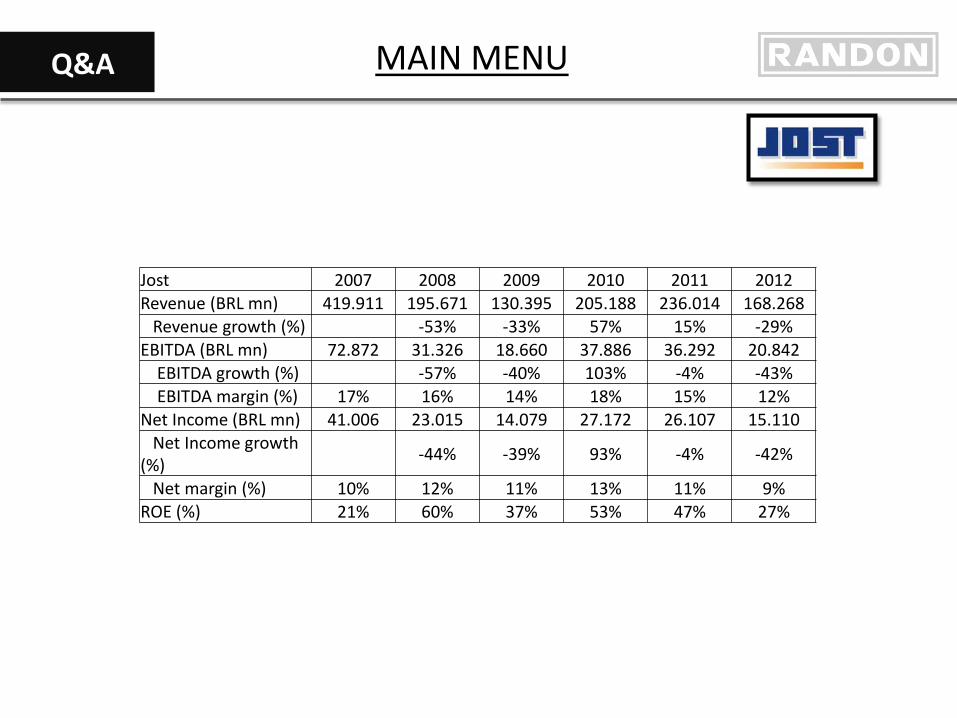
Jost 2007 2008 2009 2010 2011 2012 Revenue (BRL mn) 419.911 195.671 130.395 205.188 236.014 168.268 Revenue growth (%) -53% -33% 57% 15% -29% EBITDA (BRL mn) 72.872 31.326 18.660 37.886 36.292 20.842 EBITDA growth (%) -57% -40% 103% -4% -43% EBITDA margin (%) 17% 16% 14% 18% 15% 12% Net Income (BRL mn) 41.006 23.015 14.079 27.172 26.107 15.110 Net Income growth (%) -44% -39% 93% -4% -42%
Net margin (%) 10% 12% 11% 13% 11% 9% ROE (%) 21% 60% 37% 53% 47% 27%
Q&A
MAIN MENU
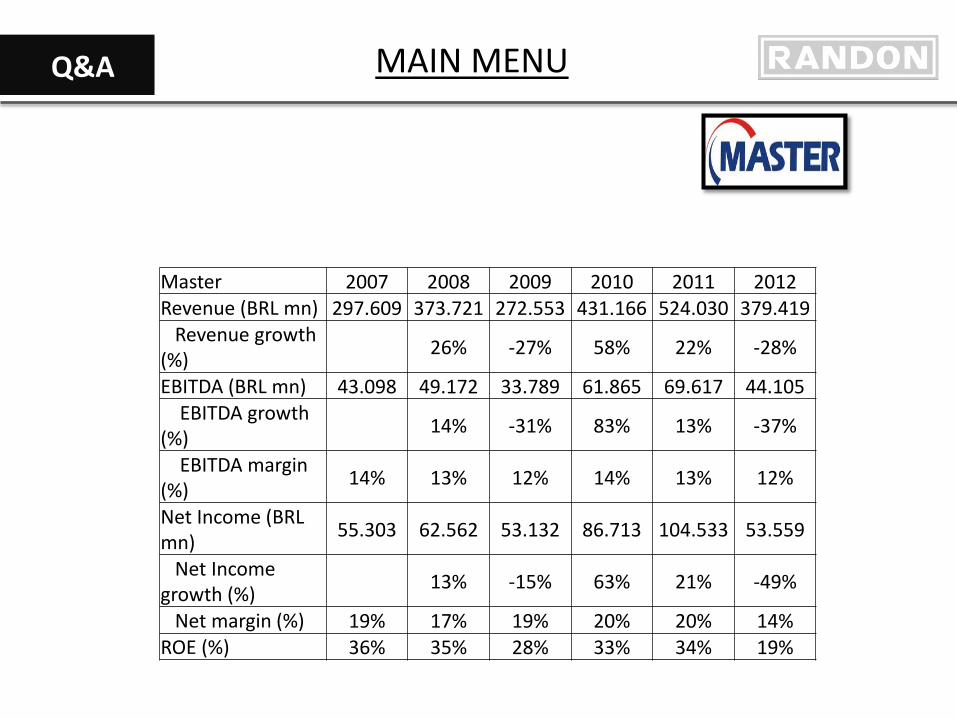
Master 2007 2008 2009 2010 2011 2012 Revenue (BRL mn) 297.609 373.721 272.553 431.166 524.030 379.419 Revenue growth (%) 26% -27% 58% 22% -28%
EBITDA (BRL mn) 43.098 49.172 33.789 61.865 69.617 44.105 EBITDA growth (%) 14% -31% 83% 13% -37%
EBITDA margin (%) 14% 13% 12% 14% 13% 12%
Net Income (BRL mn) 55.303 62.562 53.132 86.713 104.533 53.559
Net Income growth (%) 13% -15% 63% 21% -49%
Net margin (%) 19% 17% 19% 20% 20% 14% ROE (%) 36% 35% 28% 33% 34% 19%
Q&A
MAIN MENU
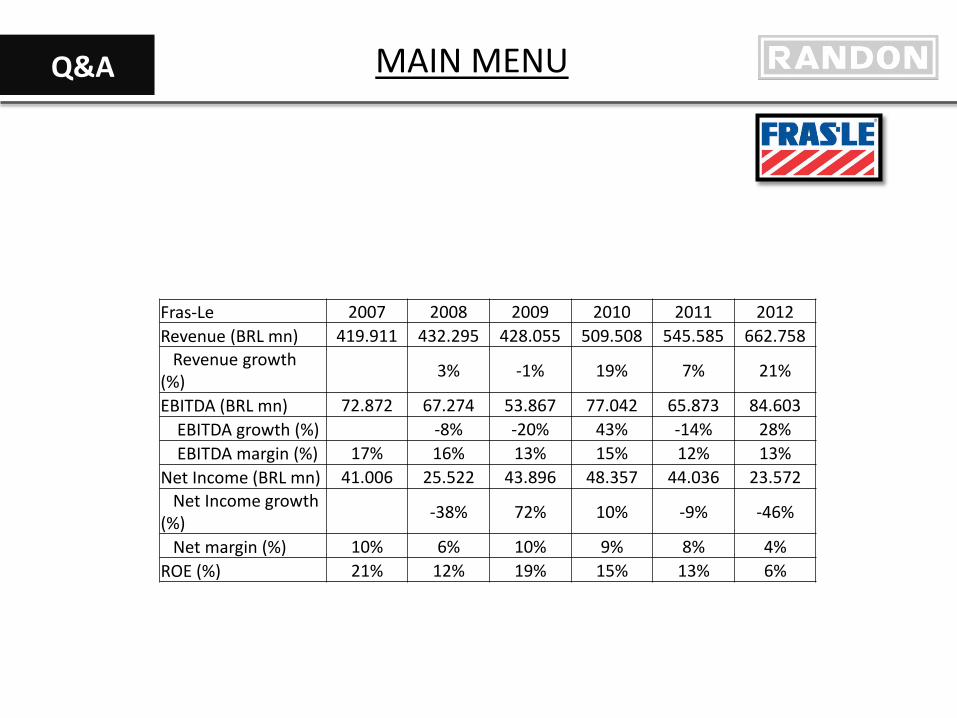
Fras-Le 2007 2008 2009 2010 2011 2012 Revenue (BRL mn) 419.911 432.295 428.055 509.508 545.585 662.758 Revenue growth (%) 3% -1% 19% 7% 21%
EBITDA (BRL mn) 72.872 67.274 53.867 77.042 65.873 84.603 EBITDA growth (%) -8% -20% 43% -14% 28% EBITDA margin (%) 17% 16% 13% 15% 12% 13% Net Income (BRL mn) 41.006 25.522 43.896 48.357 44.036 23.572 Net Income growth (%) -38% 72% 10% -9% -46%
Net margin (%) 10% 6% 10% 9% 8% 4% ROE (%) 21% 12% 19% 15% 13% 6%
Q&A
MAIN MENU
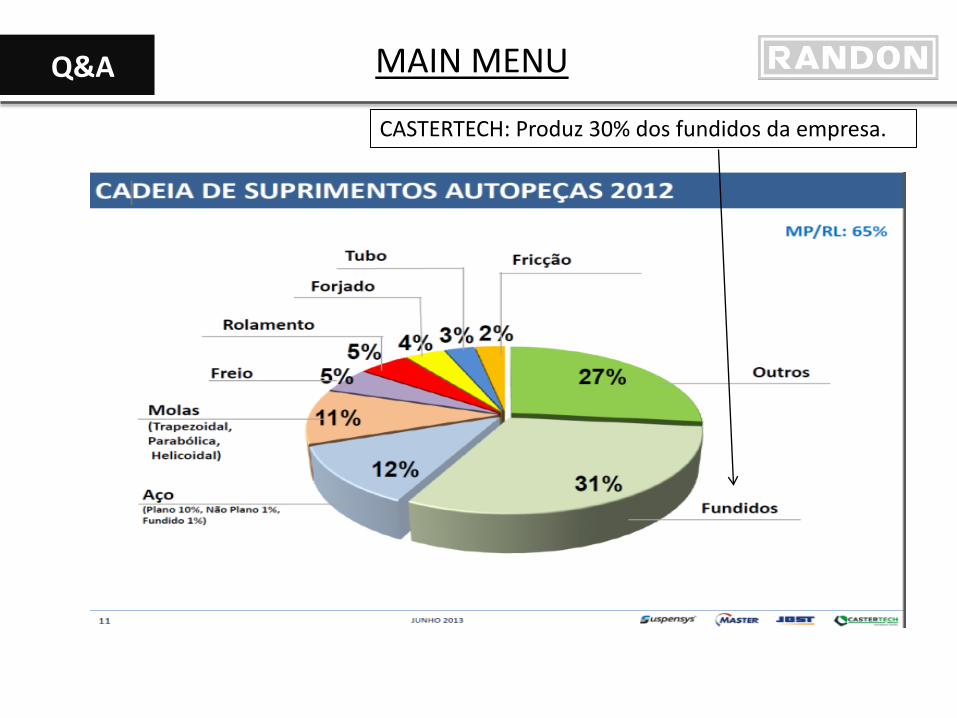
CASTERTECH: Produz 30% dos fundidos da empresa.
Q&A
MAIN MENU

Principais eventos históricos
Q&A
MAIN MENU
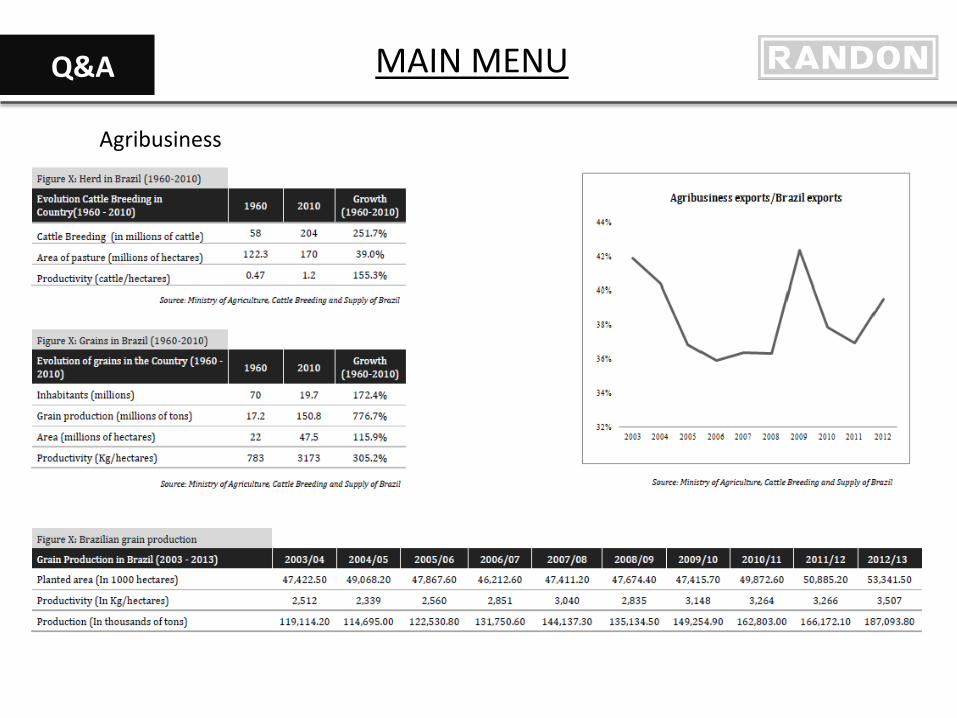
Agribusiness
Q&A
MAIN MENU
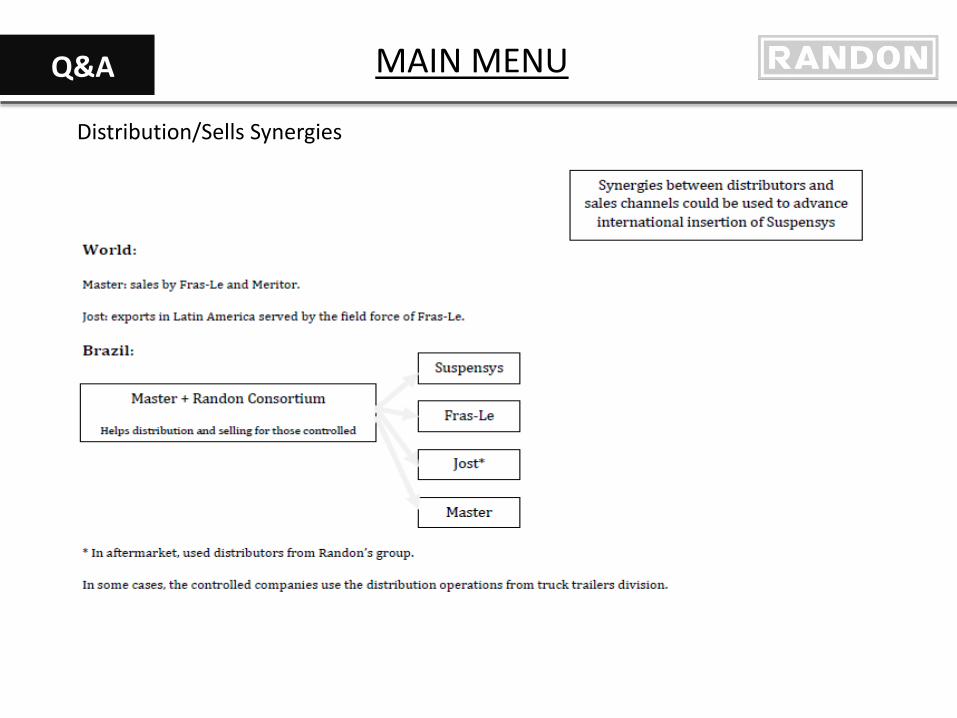
Distribution/Sells Synergies
Q&A
MAIN MENU
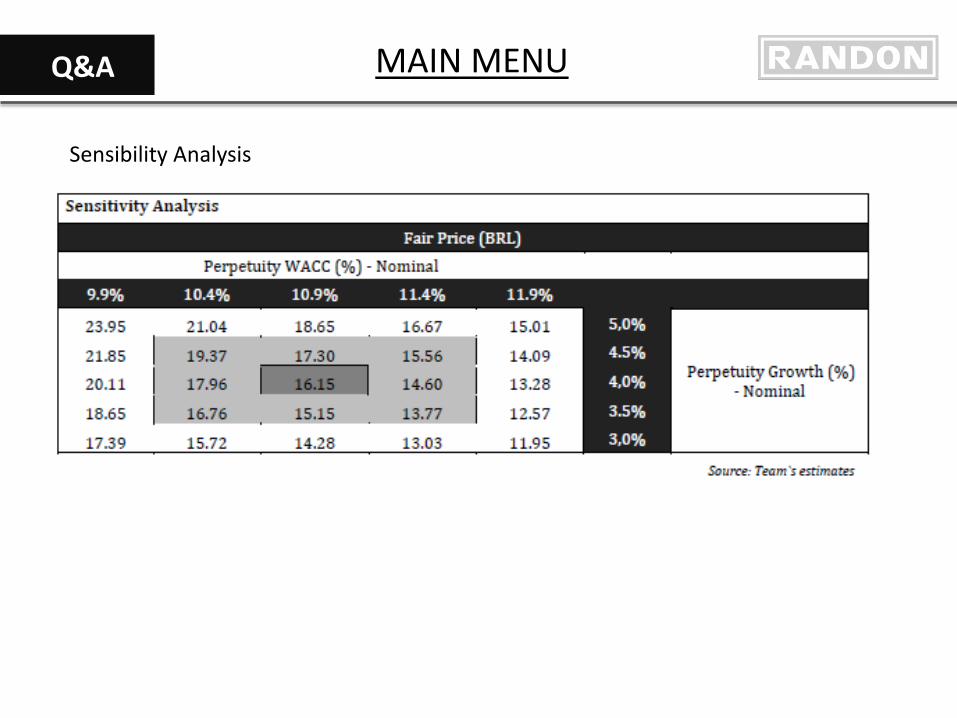
Sensibility Analysis
Q&A
MAIN MENU

Risk Matrix
Q&A
MAIN MENU

Introduction Investment Case Risks Conclusion
INTRODUTION
Main Shareholders
Free Float: 57.5%
Dramd (Controller group): 40.6%
Others: 1.9%
Stock Data Price at 10/20/2013: BRL 13.17 52 Week Price Range: BRL 10.56 - 13.6 Market Cap (bn): BRL 3.21 Shares Outstanding: 243.78 K Daily Volume (LTM Avarage): BRL 12.19 mn Beta (12m): 0.53
Main Shareholders
Free Float: 57.5%
Dramd (Controller group): 40.6%
Others: 1.9%
Stock Data Price at 10/20/2013: BRL 13.17 52 Week Price Range: BRL 10.56 - 13.6 Market Cap (bn): BRL 3.21 Shares Outstanding: 243.78 K Daily Volume (LTM Avarage): BRL 12.19 mn Beta (12m): 0.53
Stock Data Price at 10/20/2013: BRL 13.17 52 Week Price Range: BRL 10.56 - 13.6 Market Cap (bn): BRL 3.21 Shares Outstanding: 243.78 K Daily Volume (LTM Avarage): BRL 12.19 mn Beta (12m): 0.53
MAIN MENU
Introduction Investment Case Risks Conclusion
INTRODUTION
Market Price BRL 3 bn
Target Price BRL 16,15
BUY Recommendation
31% Upiside Potential
MAIN MENU

Net revenue per segment
Introduction Investment Case Risks Conclusion
BUSINESS DESCTIPTION
Vehicles and
trailers 51%
Auto parts 47%
Financial services
2%
Truck trailers
83%
Special vehicles
10%
Rail Wagons 7%
Suspension Systems
36%
Friction materials
34%
Air Brakes 21%
Castings 9% Data from 1S 2013
MAIN MENU

Introduction Investment Case Risks Conclusion
WHY BUY?
Good opportunities in the coming years for the sector
Confirmative Valuation
Randon is the most prepared company to leverage market opportunities
MAIN MENU
Introduction Investment Case Risks Conclusion
INDUSTRY OVERVIEW
Porter Analysis Key characteristics:
Low entry barriers – process
with low technology
B2C trade – demand on request
Low penetration of imports
Large customer base 0 1 2 3 4 5
Threat of New Entrants
Bargaining Power of Buyers
Bargaining Power of Suppliers
Competition in the Industry
Threat of Substitute Products
TRUCK TRAILERS
MAIN MENU

Introduction Investment Case Risks Conclusion
INDUSTRY OVERVIEW
Porter Analysis Key characteristics: High entry barriers – requires
high technology processes
B2B trade – concentrated customer base
Joint engineering strategy - integration between subsidiaries
Drivers: domestic and international automotive production and aftermarket needs.
0 1 2 3 4 5
Threat of New Entrants
Bargaining Power of Buyers
Bargaining Power of Suppliers
Competition in the Industry
Threat of Substitute Products
AUTO PARTS
MAIN MENU
Introduction Investment Case Risks Conclusion
INDUSTRY OVERVIEW
AUTO PARTS
OEM
(Original Equipment
Manufacturer)
Company
Long-term contracts
MAN
biggest player in the market
Suspensys
Partnership
MAIN MENU
Introduction Investment Case Risks Conclusion
INDUSTRY OVERVIEW
•9%
•16% Auto Parts
MAIN MENU
Introduction Investment Case Risks Conclusion
RENEWAL OF TRUCK FLEET
Brazil 16.6 years
USA 7 years
EURO V technology efficiency gains
Average age of truck fleet
Finame PSI program: Annual interest rates = 4.5 – 6%
Anticipation of the
Renewal of Truck Fleet
Potential Growth Driver
BNDES support
MAIN MENU
Introduction Investment Case Risks Conclusion
RECENT INDUSTRY GROWTH
2012 Q3
8.8%
2013 Q3
15.5%
Δ%
6.7 EBITDA Margin
0
50
100
150
200
250
2007 2008 2009 2010 2011 2012 2013E
Truck production (BRL thousand)
Adverse Events
Recovery
MAIN MENU
Introduction Investment Case Risks Conclusion
INDUSTRY GROWTH ESTIMATED
50
100
150
200
250
300
2000 2004 2008 2012 2016E 2020E
National Truck Production (thousand units)
CAGR2000-2012
8.15%
CAGR2013-2020
6.82%
Agriculture Pulling Demand
MAIN MENU
Randon is the most prepared company to leverage market opportunities
ERP-SAP
GROWTH DRIVERS
Increase Productivity Gain Economies of Scale
Introduction Investment Case Risks Conclusion
MAIN MENU
Introduction Investment Case Risks Conclusion
GROWTH DRIVERS
SR Bulk Trailer - 3 axis without tires
Company Average price after 4
years of use (BRL) Randon X
Competitors
Randon 52.000
Guerra 49.000 -5.8%
Noma 48.000 -7.7%
Facchini 43.000 -17.3%
Librelato 43.000 -17.3%
Pastre 40.000 -23.1% BT Bulk Trailer - 7 axis without tires
Company Average price after 4
years of use (BRL) Randon X
Competitors
Randon 66.000 Guerra 63.000 -4.5%
Noma 61.000 -7.6%
Facchini 57.000 -13.6%
Librelato 57.000 -13.6%
Pastre 53.000 -19.7%
MAIN MENU

Introduction Investment Case Risks Conclusion
GROWTH DRIVERS
Investments in R&D
E-coat painting system
Proving ground
MAIN MENU

Introduction Investment Case Risks Conclusion
GROWTH DRIVERS
GROWTH POTENTIAL 30% ROE EV/EBITDA 6.9
More expensive dollar
International expansion
SYNERGIES FOR AUTO PARTS SEGMENT AND FOR TRUCK
TRAILERS SEGMENT
MAIN MENU

Introduction Investment Case Risks Conclusion
GROWTH DRIVERS
Distribution Network
High
Medium
Medium
Low
Medium
Finance Service
✔
✔
✗
✗
✗
Premium Products
✔
✗
✗
✗
✗
MAIN MENU

Introduction Investment Case Risks Conclusion
VALUATION
UPSIDE: 31%
Target Price: BRL 16.15
Current Price: BRL 12.31 11.15.2013
DCF COMPONENTS
DCF Model Multiples Analysis Margins
Cash per share Debt per share Terminal Value 10 years projected Cash Flows Target Price
BRL 4.55 BRL 8.16 BRL 14.70 BRL 5.06 BRL 16.15
Confirmative Valuation
MAIN MENU
Introduction Investment Case Risks Conclusion
VALUATION
DCF Model Multiples Analysis Margins
National market growth Gain in market-share International expansion Strong dollar
10 YEARS FORECAST
SALES CAGR: 9.5%
EPS growth (2013E – 2022E): 10.18%
MAIN MENU
Introduction Investment Case Risks Conclusion
VALUATION
DCF Model Multiples Analysis Margins
WACC
Increase in competitiviness: 0.5% Financial crisis: 0.3% Lose Government and BNDES support: 0.5%
EXTRA RISKS 1.3%
MAIN MENU
Introduction Investment Case Risks Conclusion
VALUATION
DCF Model Multiples Analysis Margins
0
20
40
60
80
100
120
140
0%
5%
10%
15%
20%
25%
2008Q1 2008Q3 2009Q1 2009Q3 2010Q1 2010Q3 2011Q1 2011Q3 2012Q1 2012Q3 2013Q1
Gross Margin (%) Commodities - Metal Commodities - Energy
Source: IPEA and Company Data
GROSS MARGINS
MAIN MENU
Introduction Investment Case Risks Conclusion
VALUATION
DCF Model Multiples Analysis Margins
6%
7%
8%
9%
10%
11%
12%
13%
14%
15%
0
200
400
600
800
1000
1200
2011 2012 2013-E 2014-E 2015-E 2016-E 2017-E 2018-E 2019-E 2020-E 2021-E 2022-E
EBITDA EBITDA Margin
EBITDA MARGINS
MAIN MENU

Introduction Investment Case Risks Conclusion
VALUATION
DCF Model Multiples Analysis Margins
Multiples Target Price: BRL 15.46
UPSIDE: 25.6%
EV/EBITDA P/E Randon Implementos e Participações SA 7.31x 14.83x
Fras Le SA 7.3x 13.9x Global and National Similar Competitors Meritor Inc. 5.7x 10.7x Autometal SA 5.9x 11x Iochpe-Maxion SA 6.7x 15.2x Mahle Metal Leve SA 7.6x 15.6x CIMC Group Ltd. 10x 17.4x Wabash National Corp. 5.8x 11.6x WABCO Holdings Inc. 9.7x 15.1x PACCAR Inc. 9x 15.6x Federal-Mogul Corp. 6.6x 14.7x Genuine Parts Co. 9.1x 17.1x LKQ Corp. 14.3x 25x Honeywell Int. Inc. 8.8x 15.6x Mean 8.26x 15.38x Median 8.2x 15.4x
MAIN MENU
Introduction Investment Case Risks Conclusion
RISKS ANALYSIS 9
,0
9,8
1
0,5
1
1,3
1
2,0
1
2,8
1
3,5
1
4,3
1
5,0
1
5,8
1
6,5
1
7,2
1
8,0
1
8,7
1
9,5
2
0,2
2
1,0
2
1,7
2
2,5
2
3,2
2
4,0
2
4,7
2
5,5
2
6,2
2
6,9
2
7,7
2
8,4
2
9,2
2
9,9
3
0,7
3
1,4
3
2,2
3
2,9
3
3,7
3
4,4
3
5,2
3
5,9
3
6,6
3
7,4
3
8,1
3
8,9
3
9,6
4
0,4
4
1,1
Freq
uenc
y (x
)
Target Price (BRL)
Buy: 71.21% Hold: 17.29%
Sell: 11.5%
Monte Carlo
MAIN MENU
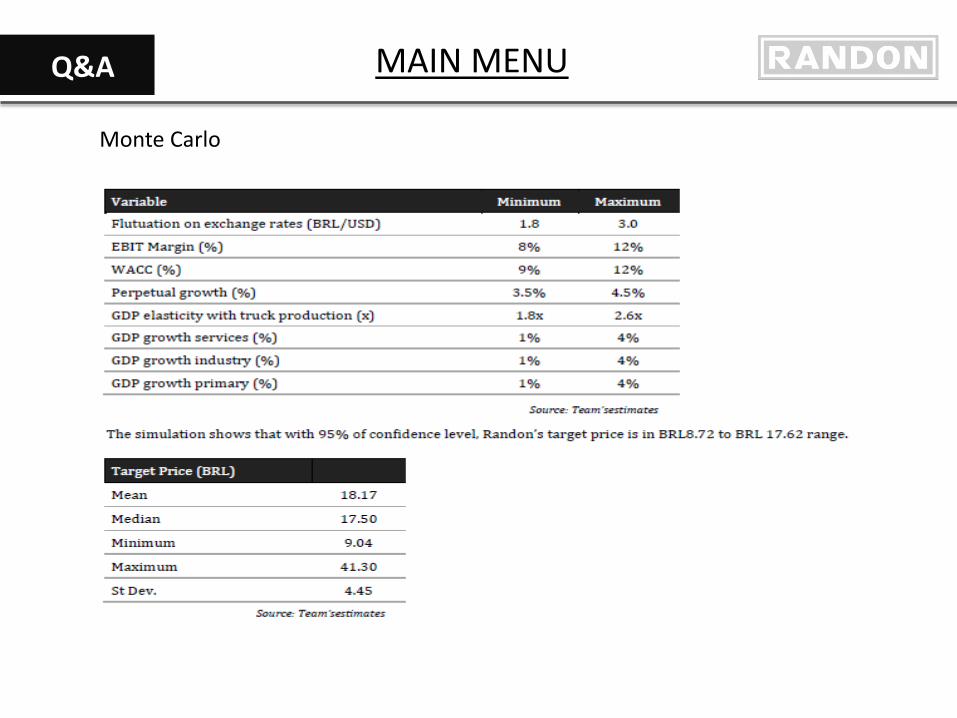
Monte Carlo
Q&A
MAIN MENU