random vibration response-only damage detection for a set...
TRANSCRIPT

Random vibration response-only damage detection for aset of composite beams
K.J. Vamvoudakis-Stefanou1, J.S. Sakellariou1, S.D. Fassois1
1 Stochastic Mechanical Systems & Automation (SMSA) Laboratory,Department of Mechanical and Aeronautical Engineering,University of Patras, GR 265 04, Greece.e-mail: [email protected]
AbstractThe problem of random vibration response-only damage detection for a set of composite beams, each rep-resenting the boom of an unmanned aerial vehicle connecting the tail to the fuselage, is considered. Twentysix (26) like specimens, exhibiting material and manufacturing variability, are used. Two non-parametricand one parametric statistical time series type damage detection methods using response-only signals areemployed. The first is based on the Power Spectral Density (PSD) of a single response, the second on theTransmittance Function (TF) between two responses, and the third on changes in the parameter vector ofan AutoRegressive (AR) model representing a single response signal. All methods are trained in a baselinephase using vibration acceleration response signals acquired from a single healthy beam. Their effective-ness is evaluated in the inspection phase, using signals obtained from the remaining twenty five (25) beams,three (3) of which have suffered impact damage. The results illustrate the problem of degraded detectionperformance caused by material and manufacturing variability among the beams. The parametric, AR based,method is however shown to exhibit effectiveness and robustness.
1 Introduction
Vibration based Structural Health Monitoring (SHM) has received significant attention [1–4], as vibration isnaturally arising and the technology for measurement and processing of vibration signals is mature.
Several methods have been thus introduced and used in various studies concerning composite parts andaircraft structures in the past several years [5, 6]. Vibration based methods may be generally classified aseither utilizing detailed analytical/physical models, such as Finite Element Models (FEMs) [7], or as utilizingdata-based models, such as statistical time series models [1–4]. Furthermore, vibration based SHM methodsmay be distinguished as excitation-response or response-only type. The latter type is of high importance incases where the excitation is ambient and unavailable, as for instance in bridges, aircraft, surface and seavehicles, and so on.
Response-only vibration based SHM methods employing non-parametric response representations, such asthe Power Spectral Density (PSD) [8–10] and the Transmissibility Function (TF) [11], as well as modal in-formation extracted from physical models and wavelet analysis [12,13], have been used. Furthermore partialparametric representations of the structural dynamics, such as AutoRegressive Moving Average (ARMA)type models, have been also used for damage detection and localization through monitoring of model resid-uals [14, 15] and/or specific model parameters [16, 17].
Response-only methods have been also used specifically for SHM in composite structures, as for instancein [18] where the detection of a saw-cut in a composite beam under varying temperatures is achieved basedon a statistical time series method; in [19] where the cross correlation between the vibration accelerations at
3839

two different points on a composite beam is used for the detection of delamination; in [20,21] where the useof a FEM assisted by a surrogate Artificial Neural Network (ANN) is used for the detection of delaminationin composite beams. Wavelet based response-only techniques have been also used for damage detection incomposite structures [6,22]. Additional methods applied to composite structures, which utilize the excitationsignal as well, are reported in [5, 6].
On the other hand, methods for the in-flight (on-line) response-only SHM for composite aircraft structuresare very limited. A feasibility study for wavelet based SHM through measured, under normal operation,vibration signals in an F-15B/836 aircraft is presented in [23]. In a similar sense the monitoring of waveletcoefficients before and after damage is also used in [24] for SHM in a multilayered composite plate anda simplified aircraft composite skin panel. In [25] the delamination in a composite pendulum yoke is de-tected based on the comparison between the responses spectra that correspond to the healthy and unknown,potentially damaged, state of the structure.
Lamb wave and impedance based techniques have been also used for SHM in large, such as solid plates,composite structures [6, 26] with the use of high frequency measurements. Additionally, techniques basedon the reflection drifts of Fiber Bragg Grating (FBG) sensor wavelength are available. These sensors maybe embedded into composite structures and potentially may monitor in-flight dynamic strain, impact dam-age, in-flight wing loads, temperature, flap deformations and cracks (see for instance [27,28] and referencestherein). FBG based techniques may offer a number of advantages over traditional instrumentation for someapplications, but important problems related to composite manufacturing, such as the effects of high temper-ature on the embedded fibers, their mechanical resistance after loading and impacts, and so on are issues tobe resolved [27].
Furthermore the presence of various types of uncertainties, such as changing environmental and operationalconditions, composite material and manufacturing variability, are factors that render SHM challenging. Databased methods, which use training exclusively based on measurements under different health conditions –without resorting on physics – may account for several types of uncertainties and offer an effective solutionto the damage detection problem, although they may have difficulty in providing information on the natureof the damage [29].
This study aims at damage detection in a set of composite beams based on random vibration response-onlystatistical time series methods. The latter belong to the broader family of data based methods and offer severalimportant advantages [3, 4]: They do not need cumbersome physics-based or finite element models in theinspection phase where the structure is in an unknown state and potential damage needs to be detected. Alimited number of response signals is often sufficient for effective damage detection. They inherently accountfor various types (measurement, modelling and so on) of uncertainties and they always operate in a statisticaldecision framework with user specified characteristics. They may be relatively easily implemented in lowcost SHM units for automated damage detection without interrupting the normal operation of the inspectedstructure.
In this paper two non-parametric methods are employed: One is based on the Power Spectral Density (PSD)of a single vibration signal and the other on the transmittance function which relates two measured responses.A parametric method based on the AutoRegressive (AR) modeling of a single vibration signal is also used.A set of 26 composite beams, nominally identical but in reality subject to material and manufacturing vari-ability, are employed. Each beam represents the topology of a commercial Unmanned Aerial Vehicle (UAV)boom with an added mass at the free end simulating the aircraft tail. Three of the beams are damaged viaimpact, using a pendulum type impact hammer. The methods are trained in the baseline phase using a sin-gle beam, while the rest of the beams (healthy or damaged) are used in the inspection phase for methodevaluation.
The rest of the paper is organized as follows: The set of composite beams, the damage scenarios, andexperimental details are presented in section 2. The damage detection methods and their application arepresented in sections 3 and 4, respectively. The conclusions drawn are finally summarized in section 5.
3840 PROCEEDINGS OF ISMA2014 INCLUDING USD2014
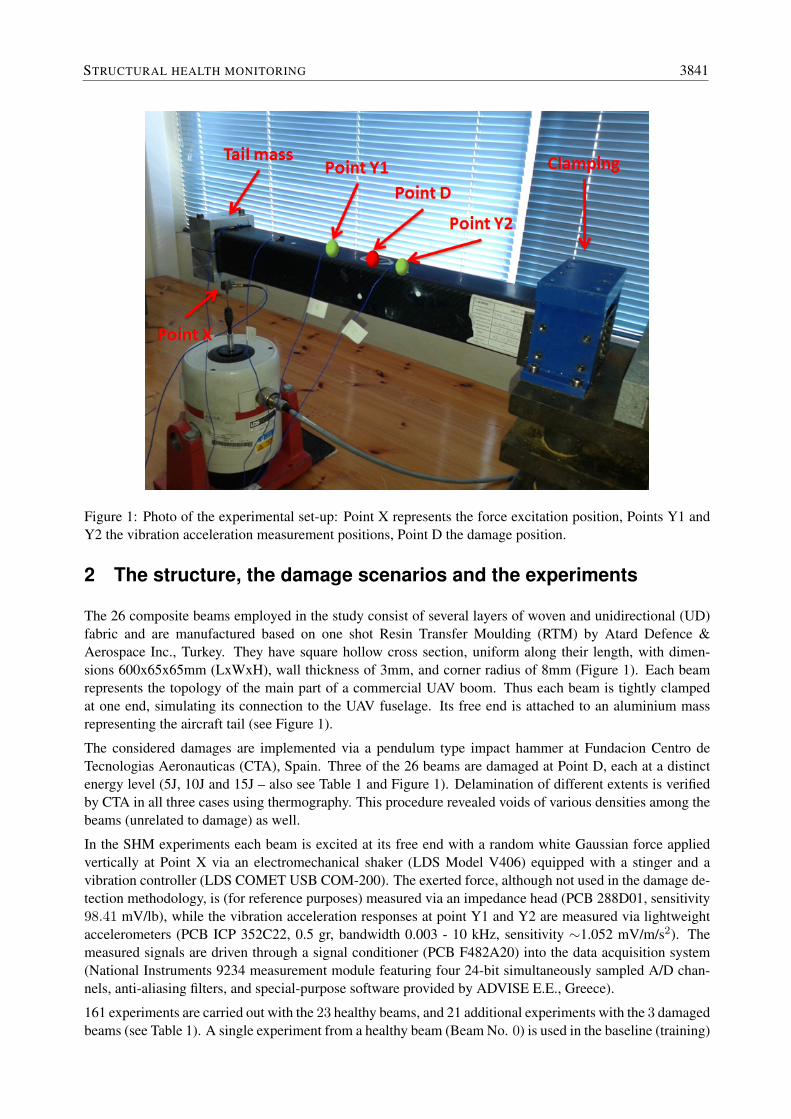
Figure 1: Photo of the experimental set-up: Point X represents the force excitation position, Points Y1 andY2 the vibration acceleration measurement positions, Point D the damage position.
2 The structure, the damage scenarios and the experiments
The 26 composite beams employed in the study consist of several layers of woven and unidirectional (UD)fabric and are manufactured based on one shot Resin Transfer Moulding (RTM) by Atard Defence &Aerospace Inc., Turkey. They have square hollow cross section, uniform along their length, with dimen-sions 600x65x65mm (LxWxH), wall thickness of 3mm, and corner radius of 8mm (Figure 1). Each beamrepresents the topology of the main part of a commercial UAV boom. Thus each beam is tightly clampedat one end, simulating its connection to the UAV fuselage. Its free end is attached to an aluminium massrepresenting the aircraft tail (see Figure 1).
The considered damages are implemented via a pendulum type impact hammer at Fundacion Centro deTecnologias Aeronauticas (CTA), Spain. Three of the 26 beams are damaged at Point D, each at a distinctenergy level (5J, 10J and 15J – also see Table 1 and Figure 1). Delamination of different extents is verifiedby CTA in all three cases using thermography. This procedure revealed voids of various densities among thebeams (unrelated to damage) as well.
In the SHM experiments each beam is excited at its free end with a random white Gaussian force appliedvertically at Point X via an electromechanical shaker (LDS Model V406) equipped with a stinger and avibration controller (LDS COMET USB COM-200). The exerted force, although not used in the damage de-tection methodology, is (for reference purposes) measured via an impedance head (PCB 288D01, sensitivity98.41 mV/lb), while the vibration acceleration responses at point Y1 and Y2 are measured via lightweightaccelerometers (PCB ICP 352C22, 0.5 gr, bandwidth 0.003 - 10 kHz, sensitivity ∼1.052 mV/m/s2). Themeasured signals are driven through a signal conditioner (PCB F482A20) into the data acquisition system(National Instruments 9234 measurement module featuring four 24-bit simultaneously sampled A/D chan-nels, anti-aliasing filters, and special-purpose software provided by ADVISE E.E., Greece).
161 experiments are carried out with the 23 healthy beams, and 21 additional experiments with the 3 damagedbeams (see Table 1). A single experiment from a healthy beam (Beam No. 0) is used in the baseline (training)
STRUCTURAL HEALTH MONITORING 3841

Structural State Description Number of beams Number of experimentsper beam
Healthy — 23 (1 baseline) 7Damage A (beam No. 23) Impact (5 J) 1 7Damage B (beam No. 24) Impact (10 J) 1 7Damage C (beam No. 25) Impact (15 J) 1 7
Sampling frequency: fs = 4654.5 Hz; Signal bandwidth: [3− 2327.25] HzSignal normalized via sample mean removal and division by its sample standard deviation.Signal length used in non-parametric methods: N = 112 000 samples (24.06 s)Signal length used in parametric methods: N = 10 000 samples (2.15 s)
Table 1: The damage scenarios and experimental details.
phase of each method, while the rest of the beams are solely used in the inspection phase for evaluating theperformance of each method. Each signal is normalized via sample mean subtraction and division by itssample standard deviation. The experimental details are summarized in Table 1, while the Welch based FRFmagnitude estimates for the healthy and damaged beams, where the effects of the damages and the materialand manufacturing variability are evident, are depicted in Figure 2.
3 Response-only statistical time series damage detection methods
Damage detection is achieved by following the general principles of statistical time series methods forSHM [3, 4]. With each method two phases are distinguished: (a) The baseline (training) phase where non-parametric and/or parametric modelling of the healthy (partial) structural dynamics is carried out based onthe vibration signal(s), and (b) the inspection phase, which is performed periodically or continuously duringthe structure’s service cycle for damage detection based on fresh signal(s) obtained in the current (unknown)structural state.
3.1 The non-parametric Power Spectral Density (PSD) based method
Damage detection is achieved by testing for changes in the Power Spectral Density (PSD) S(ω) of a mea-sured vibration response signal. The method’s characteristic quantity thus is Q = S(ω), with ω designatingfrequency. In the baseline phase the PSD of the healthy structural responses So(ω) is estimated. The inspec-tion phase is based on the comparison of the current structural response’s PSD Su(ω) to that of the healthystructure’s So(ω). The following hypothesis testing problem is then set up for damage detection:
Ho : Su(ω) = So(ω) (null hypothesis – healthy structure)H1 : Su(ω) 6= So(ω) (alternative hypothesis – damaged structure).
(1)
As the true PSDs, Su(ω), So(ω), are unknown, their estimates Su(ω), So(ω) obtained via the Welch method[3, 4] (with K non-overlapping segments) are used. Then, the following test statistic follows (for eachfrequency ω) F distribution with (2K, 2K) degrees of freedom [3, 4]:
F =So(ω)/So(ω)
Su(ω)/Su(ω)∼ F (2K, 2K) (2)
Under the null (Ho) hypothesis, the true PSDs coincide (Su(ω) = So(ω)) and F = So(ω)/Su(ω) shouldthen be in the range [fα/2, f1−α/2] with probability 1 − α. Thus decision making is as follows at a selectedα risk level (type I error probability of α):
fα2(2K, 2K) ≤ F ≤ f1−α
2(2K, 2K) (∀ ω) =⇒ Ho is accepted (healthy structure)
Else =⇒ H1 is accepted (damaged structure)(3)
3842 PROCEEDINGS OF ISMA2014 INCLUDING USD2014

Figure 2: FRF magnitude estimates for healthy and damaged beams: (a) Five healthy composite beams(single experiment per beam); (b) 23 healthy and 3 damaged beams (7 experiments per beam). (Welch basedestimates; Hamming window; 2048 samples long segment; 0% overlap; Matlab function tfestimate.m)
with fα/2, f1−α/2 designating the F distribution’s α/2 and 1 − α/2 critical points. The method may beapplied in the complete operational frequency bandwidth or in a part of it, as in the present study (see section4).
3.2 The non-parametric Transmittance Function (TF) based method
Damage detection is achieved by testing for changes in the magnitude of the transmittance function. This isdefined by the following relationship [11, 30]:
Tlm(jω) =Sml(jω)
Sll(ω)(4)
where the subscripts l,m designate the corresponding measurement points on the structure, Sml is the crossspectral density (CSD) between signals obtained at points l and m, and Sll the PSD based on measurementsat point l. The method’s characteristic quantity is the magnitude of the Transmittance Function (TF), Q =|T (jω)|. The main idea is the comparison between the magnitude of the transmittance function |Tu(jω)|that corresponds to a current, (unknown), state of the structure, with its counterpart |To(jω)| correspondingto the healthy structure. This is achieved through the following hypothesis testing problem:
Ho : |Tu(jω)| = |To(jω)| (null hypothesis – healthy structure)H1 : |Tu(jω)| 6= |To(jω)| (alternative hypothesis – damaged structure)
(5)
As the true To(jω), Tu(jω), are unknown, their Welch–based estimates To(jω), Tu(jω) are employed andthe following quantity is constructed:
D =|To(jω)||Tu(jω)|
(6)
STRUCTURAL HEALTH MONITORING 3843

Based on user defined thresholds l1 (lower threshold) and l2 (upper threshold), the following decision makingprocedure is followed:
l1 ≤ D ≤ l2 (∀ ω) =⇒ Ho is accepted (healthy structure)Else =⇒ H1 is accepted (damaged structure)
(7)
The method may be applied in the complete operational frequency bandwidth or in part of it (also see section4).
3.3 The AR parameter based method
Baseline phase. A single vibration response signal (displacement, velocity, acceleration) from the healthystructure is used for the identification of a parametric time series model, such as an AutoRegressive (AR)model of the form [31], [32, pp. 79-83]:
y[t] +n∑i=1
ai · y[t− i] = e[t], e[t] ∼ NID(0, σ2e) (8)
with t = 1, . . . , N designating the normalized discrete time, y[t] the response signal, n model order, ai thei-th AR parameter, and e[t] the model residual (one-step ahead prediction error) that is a white Gaussianzero-mean with variance σ2
e sequence. The estimation of an AR(n) model involves parameter and structureestimation. The estimation of the parameter vector θ = [a1 a2 . . . an]
T is obtained based on a Least Squares(LS) estimator [32, pp. 203-207]. Model structure estimation, referring to the determination of the ARorder, is achieved by fitting increasingly higher order models to the signal until no further improvement isobserved. Improvement may be judged via the combination of typical model order selection criteria, suchas the Bayesian Information Criterion (BIC) and the RSS/SSS (Residual Sum of Squares / Signal Sum ofSquares) criterion [32, pp. 498-514].
Inspection phase. Damage detection is achieved based on a characteristic quantity Q = f(θ) that is functionof the parameter vector θ of the AR model. In this study the characteristic quantity is then selected to be thecomplete parameter vector (Q = θ).
For sufficiently long signals the LS estimator θ is Gaussian distributed with mean equal to its true value θand a certain covariance Pθ [32, p. 303], hence θ ∼ N (θ,Pθ).
Damage detection is based on testing for statistically significant changes in the parameter vector θ betweenthe healthy, θo, and current (unknown) state of the structure, θu, through the hypothesis testing problem[3, 4]:
Ho : δθ = θo − θu = 0 (null hypothesis – healthy structure)H1 : δθ = θo − θu 6= 0 (alternative hypothesis – damaged structure).
(9)
The difference between the two parameter vector estimators follows Gaussian distribution [3, 4], that is:
δθ = θo − θu ∼ N (δθ, δP ) (10)
with δθ = θo − θu and δP = P o + P u, where P o,P u designate the corresponding covariance matrices.Under the null (Ho) hypothesis δθ = θo − θu ∼ N (0, 2P o), and the test statistic:
χ2θ = δθ
T· δP−1 · δθ (11)
(with δP = 2P o) follows χ2 distribution with d (parameter vector dimensionality) degrees of freedom [3,4].
As the covariance matrix P o corresponding to the healthy structure is unavailable, its estimated version P o
is used. Then, the following test is constructed at the α (type I) risk level:
χ2θ ≤ χ
21−α(d) =⇒ Ho is accepted (healthy structure)
Else =⇒ H1 is accepted (damaged structure),(12)
with χ21−α(d) designating the χ2 distribution’s 1− α critical point.
3844 PROCEEDINGS OF ISMA2014 INCLUDING USD2014

Non-parametric methodsMethod Measur. Point Estim. Window type / Overlap δf∗ (Hz) / Operational
method length (samples) (%) No. K BWD (Hz)PSD based Y2 Welch Hamming / 2048 0 2.3/54 934− 1172
Tran. based Y1,Y2 Welch Hamming / 2048 0 2.3/54 1820− 1860
Matlab functions: pwelch.m (PSD), tfestimate.m (Transmittance function)
Parametric methodMeasur. Point Selected Model No of estim. params. SPP∗∗ BIC∗∗∗ RSS/SSS∗∗∗ (%)
Y2 AR(59) 59 ∼ 169.5 4.27 26.6
Estimation method: Ordinary Least Squares (OLS) with QR implementation (Matlab function: arx.m)Condition number of inverted matrix∗∗∗ : 24.33∗frequency resolution ∗∗Samples Per estimated Parameter ∗∗∗baseline phase
Table 2: Non–parametric and parametric estimation details.
4 Application to damage detection for the set of composite beams
4.1 Baseline (learning) phase
4.1.1 Non–parametric methods (PSD magnitude and transmittance magnitude based meth-ods)
The non-parametric identification through the PSD and the transmittance functions is based onN = 112 000sample long (≈ 24 s) vibration response signals acquired from points Y1 and Y2 (also see Figure 1 and Table1). For the PSD based method only measurements from point Y1 are utilized, while both points Y1 and Y2(Y2, Y1) are used for the transmittance function. It is noted that measurements from a single experimentwith the healthy beam No. 0 (also see section 2 and Table 1) are used in this phase for the estimation ofSo(ω) and To(jω). The estimated PSD and transmittance functions for the healthy and damaged beams aredepicted in Figure 3. It is evident that the effects of material / manufacturing variability and the considereddamage scenarios on the structural dynamics cannot be clearly separated from each other, thus leading to achallenging damage detection problem. All estimation details are shown in Table 2.
4.1.2 Parametric method (AR parameter based method)
The identification of an adequate AR model is based on a N = 10000 sample long (2.15s) data recordfrom a healthy beam (also see Table 1). Parameter estimation is based on Ordinary Least Squares withQR implementation [32, pp. 318-320]. The successive fitting of AR(n) models for n = 4, . . . , 200 leadsto decreasing BIC, which reaches a minimum for model order n = 59. Figure 4 depicts the BIC and theRSS/SSS criteria for AR models of increasing order n. A summary of the estimation details is provided inTable 2.
4.2 Inspection phase: Damage detection results
4.2.1 PSD based method
Preliminary damage detection results through the PSD based method are shown in Figure 5. As it is shownthe test statistic F that corresponds to the healthy beams exceeds the critical points at several frequencyranges. This means that the method detects significant differences among the healthy beams’ dynamics,leading to false alarms. Relating to previous observations and remarks, this is attributed to material andmanufacturing variability among the beams. It is also evident that even under damage the method’s test
STRUCTURAL HEALTH MONITORING 3845

Figure 3: PSD (a) and TF magnitude (b) estimates corresponding to 23 healthy beams and 3 damaged beams(single experiment per beam). (Welch based estimators; Hamming window; 2048 sample long segment; 0%overlap; Matlab function pwelch)
statistic is very close to the values that correspond to the healthy beams. To overcome these problems, thefrequency range of [934 − 1172] Hz is selected for most effective detection, within which no false alarmsare observed and the damage scenarios A and C are effectively detected in all considered experiments (seeFigure 6). A summary of the final damage detection results is provided in Table 3.
4.2.2 Transmittance Function based method
Damage detection results via the transmittance function based method are presented in Figure 7. The methodcorrectly detects the healthy beams as such, and those under damage A, but fails to detect the damage B anddamage C cases. Zooming at a particular frequency range (presently 1820–1860 Hz; see Figure 8) confirmsthis observation. Thus the method fails to provide effective damage detection in the presence of material andmanufacturing variability – complete results in Table 3.
Method Correct False Missed damageDetection Alarm Damage A Damage B Damage C
Rate Rate Rate Rate RatePSD based 168/175 0/154 0/7 7/7 0/7Transm. based 161/175 0/154 0/7 7/7 7/7AR Model Param. 175/175 0/154 0/7 0/7 0/7PSD based method: α = 10−9
Transmittance function based method: user defined thresholds (l1, l2) = (0.001, 5.072)AR Model Parameter based method: adjusted threshold l = 486.5
Table 3: Damage detection results (inspection phase).
3846 PROCEEDINGS OF ISMA2014 INCLUDING USD2014

Figure 4: AR parameter based method (baseline phase): model order selection through the BIC and RSS/SSScriteria (baseline phase).
Figure 5: PSD based method (inspection phase – preliminary results in full bandwidth): Indicative dam-age detection results based on 7 experiments per healthy beam and a single experiment per damaged beam(risk level α = 10−9; damage is detected if the test statistic exceeds the critical points depicted as dashedhorizontal lines).
STRUCTURAL HEALTH MONITORING 3847

Figure 6: PSD based method (inspection phase – final results in reduced bandwidth): Indicative damagedetection results in the 934-1172 Hz range. (a) 7 experiments per healthy beam; (b) 7 experiments perdamaged beam (risk level α = 10−9; damage is detected if the test statistic exceeds the critical pointsdepicted as dashed horizontal lines).
Figure 7: Transmittance based method (inspection phase – preliminary results in full bandwidth): Indicativedamage detection results based on 7 experiments per healthy beam and a single experiment per damagedbeam (damage is detected if D exceeds the user defined thresholds depicted as dashed horizontal lines).
3848 PROCEEDINGS OF ISMA2014 INCLUDING USD2014

Figure 8: Transmittance based method (inspection phase – results in reduced bandwidth): Indicative damagedetection results in the 1820-1860 Hz range. (a) 7 experiments per healthy beam; (b) 7 experiments perdamaged beam (damage is detected if D exceeds the user defined thresholds depicted as dashed horizontallines).
4.2.3 AR parameter based method
An AR(59) model is estimated in each case – see Tables 1 and 2. The corresponding AR model basedPSD estimates are depicted in Figure 9 from which it is shown that both damage effects and material andmanufacturing variability are reflected in the estimates. Based on each of these models and the model ofthe baseline phase that corresponds to the healthy structure, the hypothesis testing procedure of subsection3.3 is carried out. In order to overcome the material and manufacturing variability, the critical point ofthe method is adjusted at a higher value than that suggested by theory. Summary damage detection resultsare presented in Figure 10 and in Table 3. The figure depicts the minimum and maximum values of thetest statistic (Equation (11)) as obtained from all experiments that correspond to each beam considered inunknown structural state. The deviations among the results corresponding to the healthy beams are due tothe variabilities already discussed. Yet the method is effective in detecting the presence or not of damage(Figure 10).
5 Conclusions
The problem of random vibration response-only damage detection for a set of composite beams, each repre-senting the boom of an unmanned aerial vehicle connecting the tail to the fuselage, was considered. Twentysix (26) like specimens, exhibiting material and manufacturing variability, were used. The employed meth-ods are based on random vibration responses and monitor changes in the partial structural dynamics throughappropriate hypothesis testing procedures that are established on the measured signals’ PSD, TransmittanceFunction (TF), as well as on the parameter vector of an autoregressive (AR) model.
The methods were trained based on a single experiment from a single healthy beam, while the rest of the
STRUCTURAL HEALTH MONITORING 3849
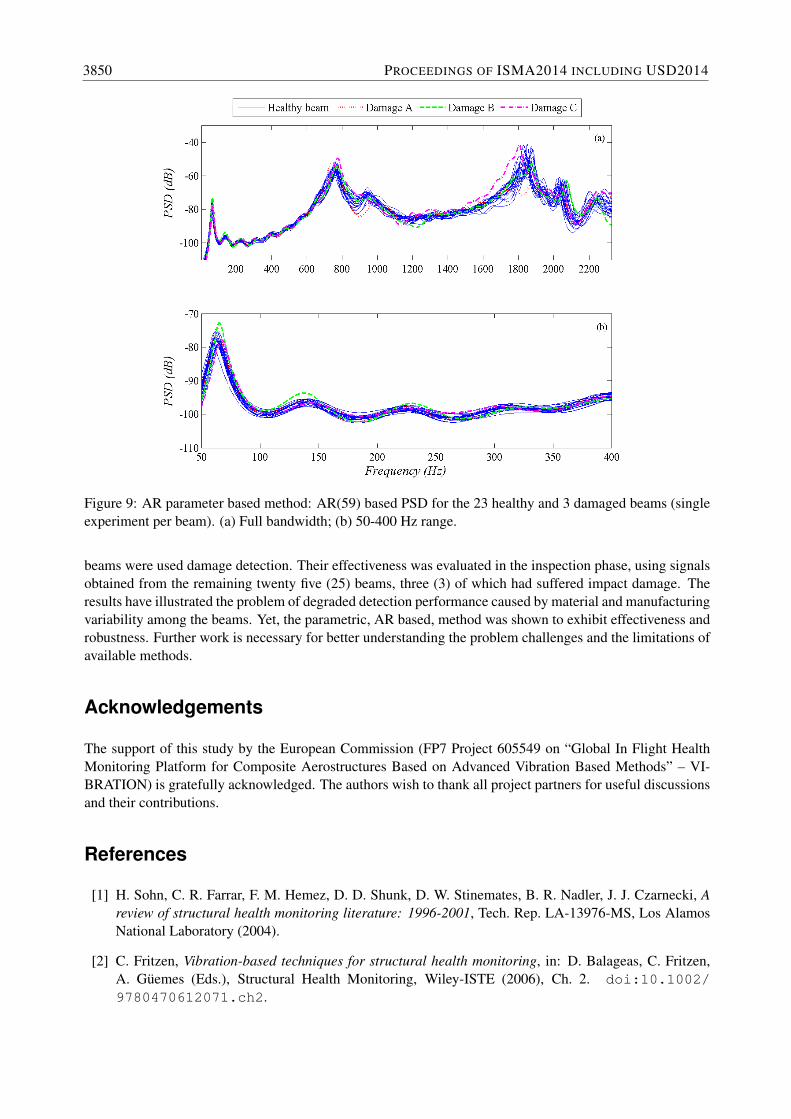
Figure 9: AR parameter based method: AR(59) based PSD for the 23 healthy and 3 damaged beams (singleexperiment per beam). (a) Full bandwidth; (b) 50-400 Hz range.
beams were used damage detection. Their effectiveness was evaluated in the inspection phase, using signalsobtained from the remaining twenty five (25) beams, three (3) of which had suffered impact damage. Theresults have illustrated the problem of degraded detection performance caused by material and manufacturingvariability among the beams. Yet, the parametric, AR based, method was shown to exhibit effectiveness androbustness. Further work is necessary for better understanding the problem challenges and the limitations ofavailable methods.
Acknowledgements
The support of this study by the European Commission (FP7 Project 605549 on “Global In Flight HealthMonitoring Platform for Composite Aerostructures Based on Advanced Vibration Based Methods” – VI-BRATION) is gratefully acknowledged. The authors wish to thank all project partners for useful discussionsand their contributions.
References
[1] H. Sohn, C. R. Farrar, F. M. Hemez, D. D. Shunk, D. W. Stinemates, B. R. Nadler, J. J. Czarnecki, Areview of structural health monitoring literature: 1996-2001, Tech. Rep. LA-13976-MS, Los AlamosNational Laboratory (2004).
[2] C. Fritzen, Vibration-based techniques for structural health monitoring, in: D. Balageas, C. Fritzen,A. Guemes (Eds.), Structural Health Monitoring, Wiley-ISTE (2006), Ch. 2. doi:10.1002/9780470612071.ch2.
3850 PROCEEDINGS OF ISMA2014 INCLUDING USD2014
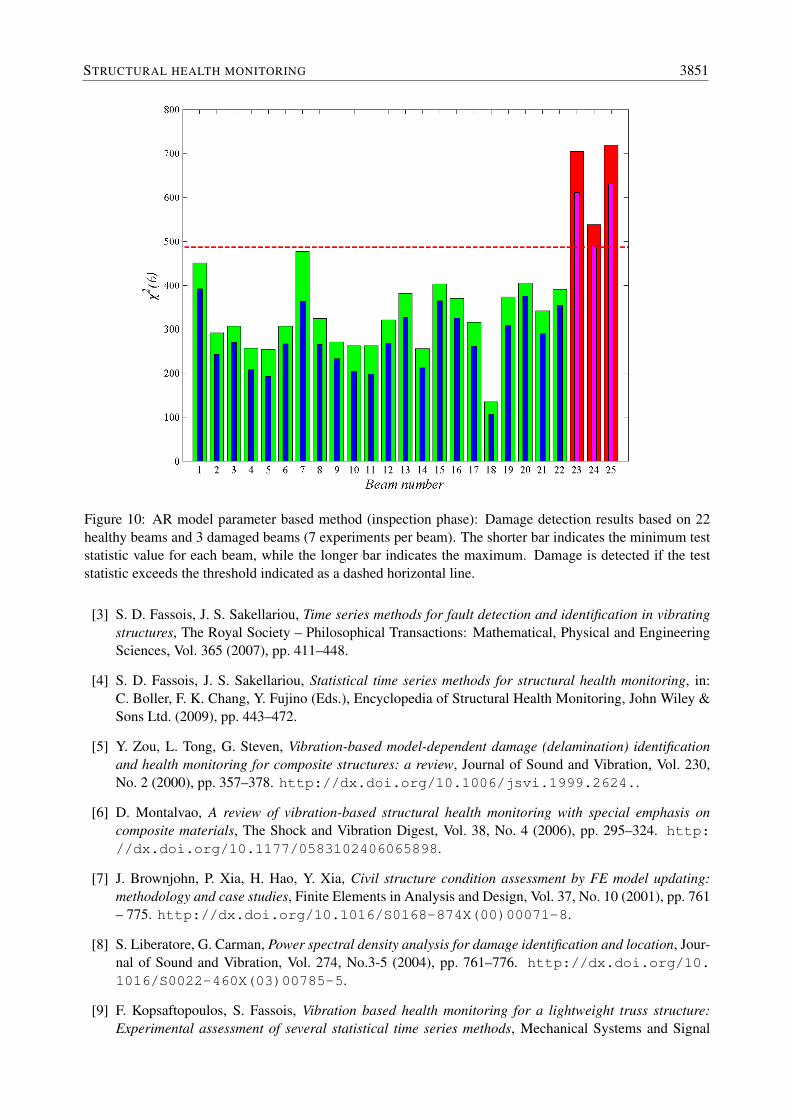
Figure 10: AR model parameter based method (inspection phase): Damage detection results based on 22healthy beams and 3 damaged beams (7 experiments per beam). The shorter bar indicates the minimum teststatistic value for each beam, while the longer bar indicates the maximum. Damage is detected if the teststatistic exceeds the threshold indicated as a dashed horizontal line.
[3] S. D. Fassois, J. S. Sakellariou, Time series methods for fault detection and identification in vibratingstructures, The Royal Society – Philosophical Transactions: Mathematical, Physical and EngineeringSciences, Vol. 365 (2007), pp. 411–448.
[4] S. D. Fassois, J. S. Sakellariou, Statistical time series methods for structural health monitoring, in:C. Boller, F. K. Chang, Y. Fujino (Eds.), Encyclopedia of Structural Health Monitoring, John Wiley &Sons Ltd. (2009), pp. 443–472.
[5] Y. Zou, L. Tong, G. Steven, Vibration-based model-dependent damage (delamination) identificationand health monitoring for composite structures: a review, Journal of Sound and Vibration, Vol. 230,No. 2 (2000), pp. 357–378. http://dx.doi.org/10.1006/jsvi.1999.2624..
[6] D. Montalvao, A review of vibration-based structural health monitoring with special emphasis oncomposite materials, The Shock and Vibration Digest, Vol. 38, No. 4 (2006), pp. 295–324. http://dx.doi.org/10.1177/0583102406065898.
[7] J. Brownjohn, P. Xia, H. Hao, Y. Xia, Civil structure condition assessment by FE model updating:methodology and case studies, Finite Elements in Analysis and Design, Vol. 37, No. 10 (2001), pp. 761– 775. http://dx.doi.org/10.1016/S0168-874X(00)00071-8.
[8] S. Liberatore, G. Carman, Power spectral density analysis for damage identification and location, Jour-nal of Sound and Vibration, Vol. 274, No.3-5 (2004), pp. 761–776. http://dx.doi.org/10.1016/S0022-460X(03)00785-5.
[9] F. Kopsaftopoulos, S. Fassois, Vibration based health monitoring for a lightweight truss structure:Experimental assessment of several statistical time series methods, Mechanical Systems and Signal
STRUCTURAL HEALTH MONITORING 3851
Processing, Vol. 24, No. 7 (2010), pp. 1977–1997. http://dx.doi:10.1016/j.ymssp.2010.05.013.
[10] F. Kopsaftopoulos, S. Fassois, Scalar and vector time series methods for vibration based damage diag-nosis in a scale aircraft skeleton structure, Journal of Theoretical and Applied Mechanics, Vol. 49, No.3 (2011), pp. 1–22.
[11] S. Chesne, A. Deraemaeker, Damage localization using transmissibility functions: A critical review,Mechanical Systems and Signal Processing, Vol. 38, No. 2 (2013), pp. 569–584. http://dx.doi.org/10.1016/j.ymssp.2013.01.020.
[12] P. Cruz, R. Salgado, Performance of vibration–based damage detection methods in bridges, Vol. 24(2008), pp. 62–79. http://dx.doi.org/10.1111/j.1467-8667.2008.00546.
[13] Y. Yang, S. Nagarajaiah, Blind identification of damage in time-varying system using independent com-ponent analysis with wavelet transform, Mechanical Systems and Signal Processing, Vol. 47 (2014),pp. 3–20. http://dx.doi.org/10.1016/j.ymssp.2012.08.029.
[14] S. Mattson, S. Pandit, Statistical moments of autoregressive model residuals for damage localization,Mechanical Systems and Signal Processing, Vol. 20 (2006), pp. 627–645. http://dx.doi.org/10.1016/j.ymssp.2004.08.005.
[15] P. Carden, J. Brownjohn, ARMA modelled time-series classification for structural health monitoring ofcivil infrastructure, Mechanical Systems and Signal Processing, Vol. 22, No. 2 (2008), pp. 295–314.http://dx.doi.org/10.1016/j.ymssp.2007.07.003.
[16] K. Nair, A. Kiremidjian, K. Law, Time series–based damage detection and localization algorithm withapplication to the ASCE benchmark structure, Journal of Sound and Vibration, Vol. 291 (2006), pp.349–368. http://dx.doi.org/10.1016/j.jsv.2005.06.016 .
[17] A. A. Mosavi, D. Dickey, R. Seracino, S. Rizkalla, Identifying damage locations under ambient vi-brations utilizing vector autoregressive models and Mahalanobis distances, Mechanical Systems andSignal Processing, Vol. 26 (2012), pp. 254–267. http://dx.doi.org/10.1016/j.ymssp.2011.06.009.
[18] A. Lekkas, J. Hios, S. Fassois, Output–only damage detection in a composite beam under varyingtemperatures via vector stochastic models, Proceedings of the 5th European Workshop on StructuralHealth Monitoring (EWSHM 2010), Sorrento, Italy (2010).
[19] I. Trendafilova, R. Palazzetti, A. Zuchelli, Delamination assessment in structures made of compositesbased on signal cross - correlation, Proceedings of the International Conference on Noise and VibrationEngineering (ISMA 2012), Leuven, Belgium (2012), pp. 765–776.
[20] O. Ihesiulor, K. Shankar, Z. Zhang, T. Ray, Validation of algorithms for delamination detection incomposite structures using experimental data, Journal of Composite Materials, Vol. 48, No. 8 (2013),pp. 969–983. http://dx.doi.org/10.1177/0021998313480414.
[21] Z. Zhang, K. Shankar, T. Ray, E. Morozov, M. Tahtali, Vibration-based inverse algorithms for detectionof delamination in composites, Composite Structures, Vol. 102 (2013), pp. 226–236.
[22] A. Katunin, Damage identification in composite plates using two-dimensional B-spline wavelets, Me-chanical Systems and Signal Processing, Vol. 25, No. 8 (2011), pp. 3153–3167. http://dx.doi.org/10.1016/j.ymssp.2011.05.015.
[23] C. Smith, C. M. Akujuobi, P. Hamory, K. Kloesel, An approach to vibration analysis using wavelets inan application of aircraft health monitoring, Mechanical Systems and Signal Processing, Vol. 21, No.3 (2007), pp. 1255–1272. http://dx.doi.org/10.1016/j.ymssp.2006.06.008.
3852 PROCEEDINGS OF ISMA2014 INCLUDING USD2014

[24] M. A. Torres-Arredondo, D. A. Tibaduiza, L. E. Mujica, J. Rodellar, C. P. Fritzen, Data-drivenmultivariate algorithms for damage detection and identification: Evaluation and comparison, Struc-tural Health Monitoring, Vol. 13, No. 1 (2014), pp. 19–32. http://dx.doi.org/10.1177/1475921713498530.
[25] J. Edmonds, G. Hickman, Damage detection and identification in composite aircraft components, IEEEAerospace Conference. Proceedings (Cat. No.00TH8484), Vol. 6, IEEE (2000), pp. 263–269. http://dx.doi.org/10.1109/AERO.2000.877902.
[26] K. Diamanti, C. Soutis, Structural health monitoring techniques for aircraft composite structures,Progress in Aerospace Sciences, Vol. 46 (2010), pp. 342–352. http://dx.doi.org/10.1016/j.paerosci.2010.05.001.
[27] Y. Qiu, Q.-B. Wang, H.-T. Zhao, J.-A. Chen, Y.-Y. Wang, Review on Composite Structural HealthMonitoring Based on Fiber Bragg Grating Sensing Principle, J. Shanghai Jiaotong Univ. (Sci.), Vol.18 (2013), pp. 129–139. http://dx.doi.org/10.1007/s12204-013-1375-4.
[28] M. Mieloszyk, L. Skarbek, M. Krawczuk, W. Ostachowicz, A. Zak, Application of fibre Bragg gratingsensors for structural health monitoring of an adaptive wing, Smart Materials and Structures, Vol. 20,No. 12 (2011), pp. 125014.
[29] I. Lopez, N. Sarigul-Klijn, A review of uncertainty in flight vehicle structural damage monitoring,diagnosis and control: challenges and opportunities, Progress in Aerospace Sciences, Vol. 46, No. 7(2010), pp. 247–273. http://dx.doi.org/10.1016/j.paerosci.2010.03.003.
[30] V. Caccese, R. Mewer, S. Vel, Detection of bolt load loss in hybrid composite/metal bolted connections,Engineering Structures, Vol. 26, No. 7 (2004), pp. 895 – 906. http://dx.doi.org/10.1016/j.engstruct.2004.02.008.
[31] S. D. Fassois, Parametric identification of vibrating structures, in: S. G. Braun, D. J. Ewins, S. S. Rao(Eds.), Encyclopedia of Vibration, Academic Press (2001), pp. 673–685. http://dx.doi.org/10.1006/rwvb.2001.0121.
[32] L. Ljung, System Identification: Theory for the User, 2nd Edition, Prentice–Hall (1999).
STRUCTURAL HEALTH MONITORING 3853

3854 PROCEEDINGS OF ISMA2014 INCLUDING USD2014