randall & quilter investment holdings plc - rqih. · pdf filerandall & quilter...
TRANSCRIPT
Randall & Quilter Investment Holdings Ltd.
(“R&Q” or the “Group”)
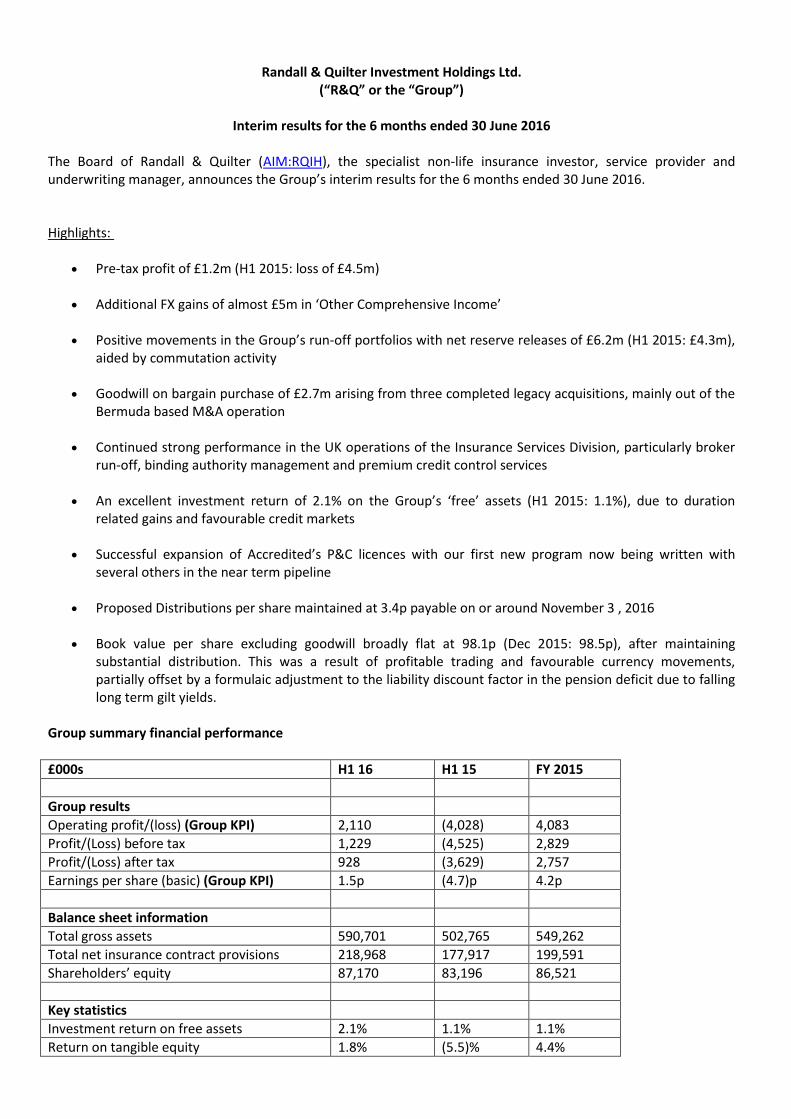
Interim results for the 6 months ended 30 June 2016 The Board of Randall & Quilter (AIM:RQIH), the specialist non-life insurance investor, service provider and underwriting manager, announces the Group’s interim results for the 6 months ended 30 June 2016. Highlights:
Pre-tax profit of £1.2m (H1 2015: loss of £4.5m)
Additional FX gains of almost £5m in ‘Other Comprehensive Income’
Positive movements in the Group’s run-off portfolios with net reserve releases of £6.2m (H1 2015: £4.3m), aided by commutation activity
Goodwill on bargain purchase of £2.7m arising from three completed legacy acquisitions, mainly out of the Bermuda based M&A operation
Continued strong performance in the UK operations of the Insurance Services Division, particularly broker run-off, binding authority management and premium credit control services
An excellent investment return of 2.1% on the Group’s ‘free’ assets (H1 2015: 1.1%), due to duration
related gains and favourable credit markets
Successful expansion of Accredited’s P&C licences with our first new program now being written with several others in the near term pipeline
Proposed Distributions per share maintained at 3.4p payable on or around November 3 , 2016
Book value per share excluding goodwill broadly flat at 98.1p (Dec 2015: 98.5p), after maintaining substantial distribution. This was a result of profitable trading and favourable currency movements, partially offset by a formulaic adjustment to the liability discount factor in the pension deficit due to falling long term gilt yields.
Group summary financial performance
£000s H1 16 H1 15 FY 2015
Group results
Operating profit/(loss) (Group KPI) 2,110 (4,028) 4,083
Profit/(Loss) before tax 1,229 (4,525) 2,829
Profit/(Loss) after tax 928 (3,629) 2,757
Earnings per share (basic) (Group KPI) 1.5p (4.7)p 4.2p
Balance sheet information
Total gross assets 590,701 502,765 549,262
Total net insurance contract provisions 218,968 177,917 199,591
Shareholders’ equity 87,170 83,196 86,521
Key statistics
Investment return on free assets 2.1% 1.1% 1.1%
Return on tangible equity 1.8% (5.5)% 4.4%
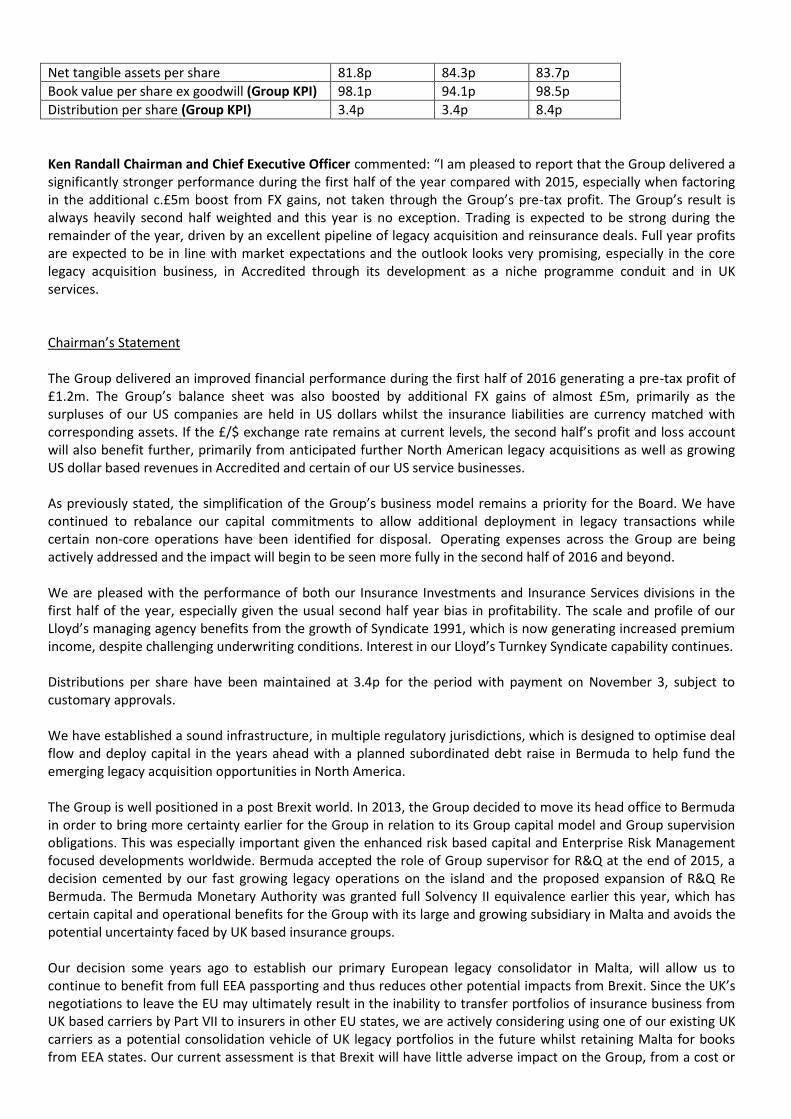
Net tangible assets per share 81.8p 84.3p 83.7p
Book value per share ex goodwill (Group KPI) 98.1p 94.1p 98.5p
Distribution per share (Group KPI) 3.4p 3.4p 8.4p
Ken Randall Chairman and Chief Executive Officer commented: “I am pleased to report that the Group delivered a significantly stronger performance during the first half of the year compared with 2015, especially when factoring in the additional c.£5m boost from FX gains, not taken through the Group’s pre-tax profit. The Group’s result is always heavily second half weighted and this year is no exception. Trading is expected to be strong during the remainder of the year, driven by an excellent pipeline of legacy acquisition and reinsurance deals. Full year profits are expected to be in line with market expectations and the outlook looks very promising, especially in the core legacy acquisition business, in Accredited through its development as a niche programme conduit and in UK services. Chairman’s Statement The Group delivered an improved financial performance during the first half of 2016 generating a pre-tax profit of £1.2m. The Group’s balance sheet was also boosted by additional FX gains of almost £5m, primarily as the surpluses of our US companies are held in US dollars whilst the insurance liabilities are currency matched with corresponding assets. If the £/$ exchange rate remains at current levels, the second half’s profit and loss account will also benefit further, primarily from anticipated further North American legacy acquisitions as well as growing US dollar based revenues in Accredited and certain of our US service businesses. As previously stated, the simplification of the Group’s business model remains a priority for the Board. We have continued to rebalance our capital commitments to allow additional deployment in legacy transactions while certain non-core operations have been identified for disposal. Operating expenses across the Group are being actively addressed and the impact will begin to be seen more fully in the second half of 2016 and beyond. We are pleased with the performance of both our Insurance Investments and Insurance Services divisions in the first half of the year, especially given the usual second half year bias in profitability. The scale and profile of our Lloyd’s managing agency benefits from the growth of Syndicate 1991, which is now generating increased premium income, despite challenging underwriting conditions. Interest in our Lloyd’s Turnkey Syndicate capability continues. Distributions per share have been maintained at 3.4p for the period with payment on November 3, subject to customary approvals. We have established a sound infrastructure, in multiple regulatory jurisdictions, which is designed to optimise deal flow and deploy capital in the years ahead with a planned subordinated debt raise in Bermuda to help fund the emerging legacy acquisition opportunities in North America. The Group is well positioned in a post Brexit world. In 2013, the Group decided to move its head office to Bermuda in order to bring more certainty earlier for the Group in relation to its Group capital model and Group supervision obligations. This was especially important given the enhanced risk based capital and Enterprise Risk Management focused developments worldwide. Bermuda accepted the role of Group supervisor for R&Q at the end of 2015, a decision cemented by our fast growing legacy operations on the island and the proposed expansion of R&Q Re Bermuda. The Bermuda Monetary Authority was granted full Solvency II equivalence earlier this year, which has certain capital and operational benefits for the Group with its large and growing subsidiary in Malta and avoids the potential uncertainty faced by UK based insurance groups. Our decision some years ago to establish our primary European legacy consolidator in Malta, will allow us to continue to benefit from full EEA passporting and thus reduces other potential impacts from Brexit. Since the UK’s negotiations to leave the EU may ultimately result in the inability to transfer portfolios of insurance business from UK based carriers by Part VII to insurers in other EU states, we are actively considering using one of our existing UK carriers as a potential consolidation vehicle of UK legacy portfolios in the future whilst retaining Malta for books from EEA states. Our current assessment is that Brexit will have little adverse impact on the Group, from a cost or

operational standpoint. The improved financial performance in the first half of 2016 is primarily the result of a stronger contribution from our run-off insurers, more legacy acquisition activity, improved performance in our UK services decision and higher investment income. As reported in the 2015 final results, the Group has commuted the adverse development reinsurance purchased from the ACE Group at the time of acquiring R&Q Re (US) from Ace in 2006 and replaced it with a much simpler contract with an expanded limit of $46m. Importantly, the commutation has facilitated improved operational and investment flexibility which has allowed the Group to improve both the liquidity and statutory surplus of this run-off subsidiary. The Board is proposing to maintain interim distributions for the period at 3.4p per share. Whilst the first six months of 2016 saw favourable investment markets, which have in fact continued to prevail during July and August, yields have again fallen as the global economy appears to be rebounding less quickly than hoped for, compounded by fears over the impact of Brexit. The ever increasing supply of new capital to the insurance industry and the expansion of alternative risk transfer vehicles continues to challenge the pace of delivery of attractive income growth and profits in our live operations. Despite this, our Lloyd's Managing Agency and particularly our live syndicate are now building scale, the former to benefit from continued interest in our Turnkey Syndicate management offering. As previously indicated, the Group continues to focus on simplifying its business model, cutting operating expenses and building its book and franchise value. The value generation is primarily being driven by the Group's increasing activity and reach in the legacy acquisition market, where our success in the UK and Europe has now been successfully replicated in Bermuda and the US. We have also consolidated our market leading position in servicing for premium credit control, binding authority management and legacy broking in the UK. The strong core business is enhanced by promising opportunities for revenue and profit growth currently in development. These include capitalising on Accredited's expanded US domestic insurance licenses, recently evidenced through the signing of its first non-bail programme since Accredited was acquired by the Group in late 2014. The US healthcare initiative also continues to develop with revenues expected to build scale during the second half year. Strategy and business model The overall mission and purpose of the Group is to offer investors a stable cash profit stream from the Insurance Services Division, increasing profits, book value growth and capital extractions from the owned run-offs in the Insurance Investments Division and growth prospects through a fee focused Underwriting Management business.
Our main strategic objectives are to:
acquire, transfer or reinsure run-off insurance companies or portfolios to build book value and produce attractive cash returns;
provide specialist insurance services to the live, run-off and captive markets;
increase the focus of our Lloyd’s managing agency business on sustainable fee income whilst reducing our capital commitment; and
develop Accredited, our A- rated US admitted carrier, with diversified sources of revenue, including fee-based income.
The Group has developed a strong reputation and relationships in the global insurance market and benefits from a skilled and entrepreneurial workforce. We use these attributes to source and manage attractive run-off opportunities and to offer expertise in niche insurance services and underwriting management. The aim is to generate strong cash flows to support our business model, grow book value and increase cash distributions to shareholders. Divisional overview
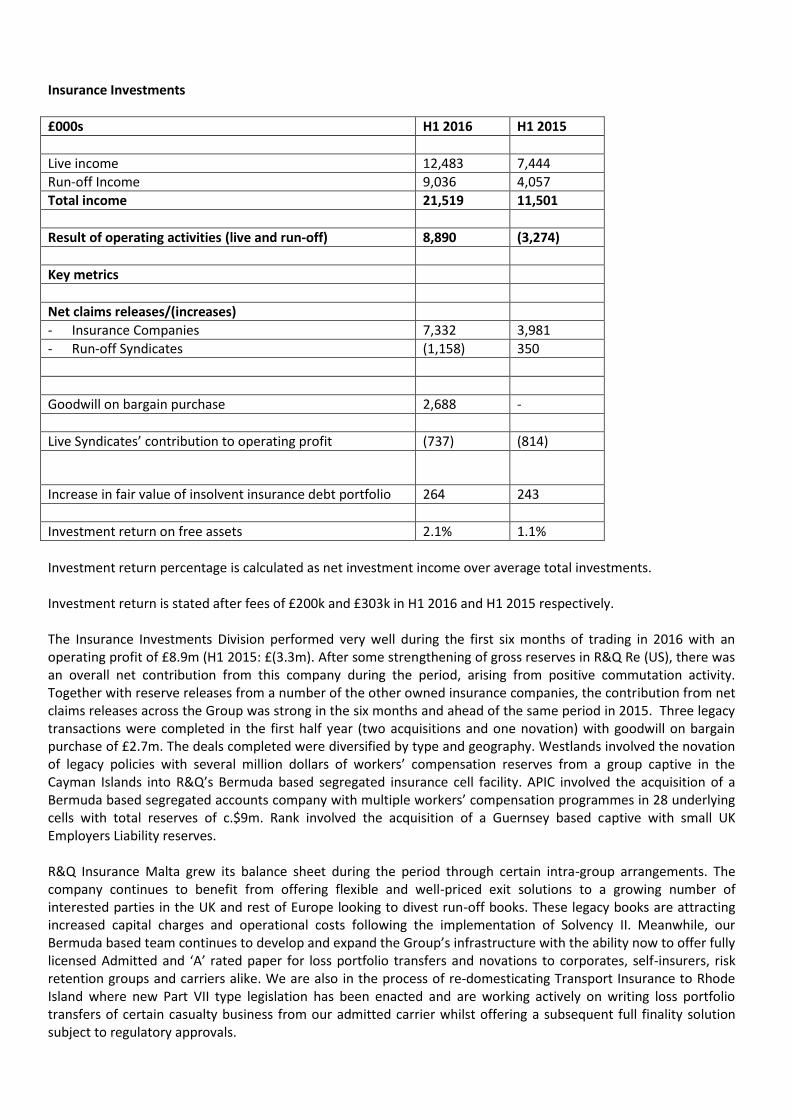
Insurance Investments
£000s H1 2016 H1 2015
Live income 12,483 7,444
Run-off Income 9,036 4,057
Total income 21,519 11,501
Result of operating activities (live and run-off) 8,890 (3,274)
Key metrics
Net claims releases/(increases)
- Insurance Companies 7,332 3,981
- Run-off Syndicates (1,158) 350
Goodwill on bargain purchase 2,688 -
Live Syndicates’ contribution to operating profit (737) (814)
Increase in fair value of insolvent insurance debt portfolio 264 243
Investment return on free assets 2.1% 1.1%
Investment return percentage is calculated as net investment income over average total investments. Investment return is stated after fees of £200k and £303k in H1 2016 and H1 2015 respectively. The Insurance Investments Division performed very well during the first six months of trading in 2016 with an operating profit of £8.9m (H1 2015: £(3.3m). After some strengthening of gross reserves in R&Q Re (US), there was an overall net contribution from this company during the period, arising from positive commutation activity. Together with reserve releases from a number of the other owned insurance companies, the contribution from net claims releases across the Group was strong in the six months and ahead of the same period in 2015. Three legacy transactions were completed in the first half year (two acquisitions and one novation) with goodwill on bargain purchase of £2.7m. The deals completed were diversified by type and geography. Westlands involved the novation of legacy policies with several million dollars of workers’ compensation reserves from a group captive in the Cayman Islands into R&Q’s Bermuda based segregated insurance cell facility. APIC involved the acquisition of a Bermuda based segregated accounts company with multiple workers’ compensation programmes in 28 underlying cells with total reserves of c.$9m. Rank involved the acquisition of a Guernsey based captive with small UK Employers Liability reserves. R&Q Insurance Malta grew its balance sheet during the period through certain intra-group arrangements. The company continues to benefit from offering flexible and well-priced exit solutions to a growing number of interested parties in the UK and rest of Europe looking to divest run-off books. These legacy books are attracting increased capital charges and operational costs following the implementation of Solvency II. Meanwhile, our Bermuda based team continues to develop and expand the Group’s infrastructure with the ability now to offer fully licensed Admitted and ‘A’ rated paper for loss portfolio transfers and novations to corporates, self-insurers, risk retention groups and carriers alike. We are also in the process of re-domesticating Transport Insurance to Rhode Island where new Part VII type legislation has been enacted and are working actively on writing loss portfolio transfers of certain casualty business from our admitted carrier whilst offering a subsequent full finality solution subject to regulatory approvals.

As a result of the Group’s recent track record of completing deals on both sides of the Atlantic and a significant marketing campaign, especially in the US, I am pleased to report that additional transactions are expected to complete in the next month and during the remainder of 2016, underpinning the overall expected increase in profits for the year. These transactions range from UK insurance company acquisitions to US novations, loss portfolio transfers and the purchase of onshore and offshore US and UK captives with a notable trend towards larger transaction sizes and reserve balances. Reserve releases from the run-off insurance companies were higher than the prior year, led by the pro-active claims management strategy in R&Q Re (US), which was previously impeded by the ACE surplus maintenance agreement which was commuted at the end of last year. La Licorne, R&Q Alpha (previously IC Insurance) and our Guernsey captive consolidator, Capstan were all additional contributors to the positive reserve development in the period through a combination of favourable settlements and interim reserve reassessments. The Division delivered an excellent investment return of 2.1% in markets which, during Q3 have remained favourable with falling yields and tightening credit spreads. Once again, our diversification and pro-active management delivered returns which compared favourably with our peers.
Asset Class Share of Portfolio
ABS 12%
CLO 13%
Bonds/Treasuries 28%
Equity 6%
Funds 19%
Cash/Cash Equivalents 22%
Total 100%
Credit Rating Share of Portfolio
Cash 24%
AAA 16%
AA 8%
A 28%
BBB 12%
BB 4%
B 2%
Unrated 6%
Total 100%
The Group’s asset allocations and credit ratings changed a little during the period, primarily through the expansion of eligible investments in R&Q Re (US) following the commutation of the ACE reinsurance and the deployment of cash balances. This has increased yield by allowing a small allocation to BBB credit, which has outperformed during the period. The duration of the portfolios also edged upwards, which again has been a beneficial positioning but it remains short overall at under two years. The credit funds owned by most of the non-US subsidiaries performed very well with their tactical positioning in credit and hedging through a small allocation to longer duration bonds. Our small and reduced equity portfolio was a slight drag on performance but they have rebounded during July and August. We continue with low interest rate duration and a structured credit focus, which performed especially well in July and August. The average yield to worst has reduced by about 30bp to c. 2.5% gross of fees since year end as a result of the same factors which brought about capital gains in the period, i.e. rate falls and credit spread contraction. On the positive side, the level of invested funds has increased substantially since the period end, primarily through the commutation activity in R&Q Re (US) and acquisition activity. To date, the third quarter of 2016 has seen continued positive investment performance with returns year to date already exceeding the annual
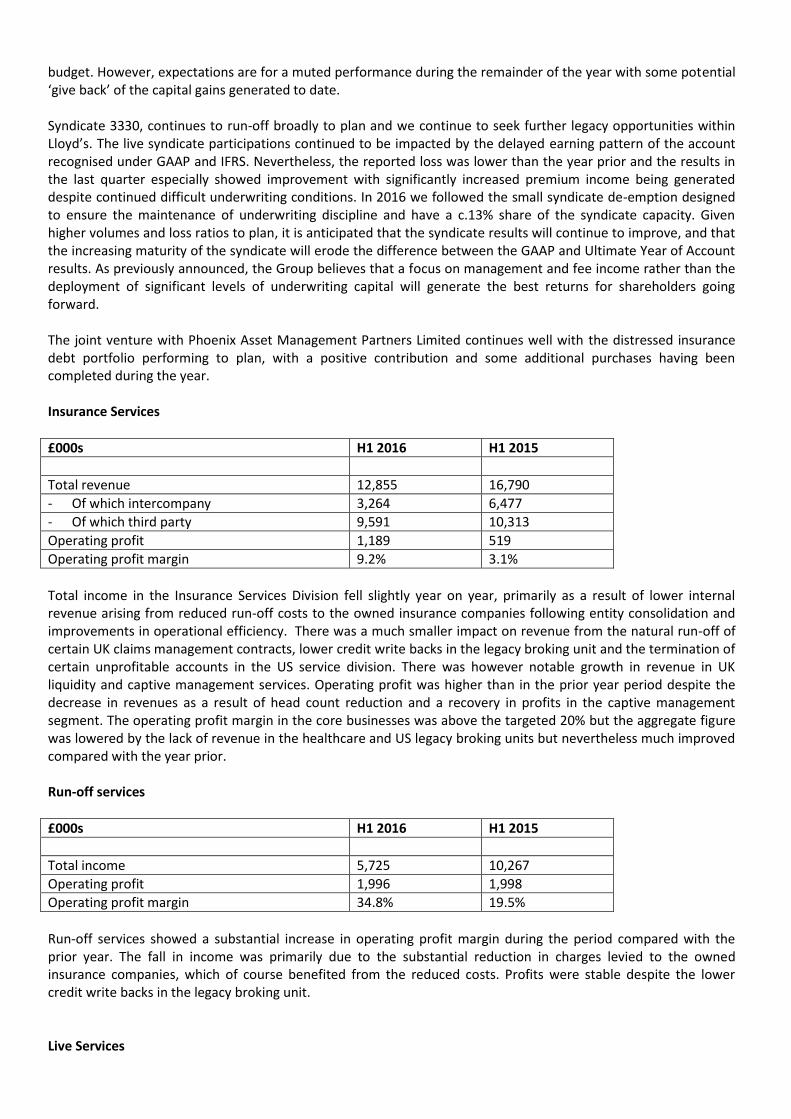
budget. However, expectations are for a muted performance during the remainder of the year with some potential ‘give back’ of the capital gains generated to date. Syndicate 3330, continues to run-off broadly to plan and we continue to seek further legacy opportunities within Lloyd’s. The live syndicate participations continued to be impacted by the delayed earning pattern of the account recognised under GAAP and IFRS. Nevertheless, the reported loss was lower than the year prior and the results in the last quarter especially showed improvement with significantly increased premium income being generated despite continued difficult underwriting conditions. In 2016 we followed the small syndicate de-emption designed to ensure the maintenance of underwriting discipline and have a c.13% share of the syndicate capacity. Given higher volumes and loss ratios to plan, it is anticipated that the syndicate results will continue to improve, and that the increasing maturity of the syndicate will erode the difference between the GAAP and Ultimate Year of Account results. As previously announced, the Group believes that a focus on management and fee income rather than the deployment of significant levels of underwriting capital will generate the best returns for shareholders going forward. The joint venture with Phoenix Asset Management Partners Limited continues well with the distressed insurance debt portfolio performing to plan, with a positive contribution and some additional purchases having been completed during the year. Insurance Services
£000s H1 2016 H1 2015
Total revenue 12,855 16,790
- Of which intercompany 3,264 6,477
- Of which third party 9,591 10,313
Operating profit 1,189 519
Operating profit margin 9.2% 3.1%
Total income in the Insurance Services Division fell slightly year on year, primarily as a result of lower internal revenue arising from reduced run-off costs to the owned insurance companies following entity consolidation and improvements in operational efficiency. There was a much smaller impact on revenue from the natural run-off of certain UK claims management contracts, lower credit write backs in the legacy broking unit and the termination of certain unprofitable accounts in the US service division. There was however notable growth in revenue in UK liquidity and captive management services. Operating profit was higher than in the prior year period despite the decrease in revenues as a result of head count reduction and a recovery in profits in the captive management segment. The operating profit margin in the core businesses was above the targeted 20% but the aggregate figure was lowered by the lack of revenue in the healthcare and US legacy broking units but nevertheless much improved compared with the year prior. Run-off services
£000s H1 2016 H1 2015
Total income 5,725 10,267
Operating profit 1,996 1,998
Operating profit margin 34.8% 19.5%
Run-off services showed a substantial increase in operating profit margin during the period compared with the prior year. The fall in income was primarily due to the substantial reduction in charges levied to the owned insurance companies, which of course benefited from the reduced costs. Profits were stable despite the lower credit write backs in the legacy broking unit. Live Services

£000s H1 2016 H1 2015
Total income 7,130 6,523
- Of which non-US 4,590 4,240
- Of which US 2,540 2,283
Operating loss (807) (1,480)
- Of which non-US 369 (257)
- Of which US (1,176) (1,223)
Operating profit margin (11.3)% (22.7)%
The H1 2016 income and operating result in live services were improved against the prior year, primarily as a result of an improvement in the captive management unit. Non-US business saw an increase in revenue in premium credit control and binder management in the UK with a recent large contract won post period. The US business continued to be impacted from negligible revenue during its investment phase but the outlook in the healthcare segment is encouraging. Underwriting Management
£000s H1 2016 H1 2015
Total revenue 10,412 12,141
Operating loss (1,676) (507)
Operating profit margin (16.1)% (4.2)%
Key metrics
Management fee revenue 4,841 6,446
MGA commission revenue 713 1,232
Profit commissions 16 274
Accredited
- (Loss)/profit before tax (599) 474
- Return on net tangible equity (3.9)% 7.3%
The Underwriting Management result was weak during the period. Total revenue fell mostly due to a change in the internal re-charging structure with only small underlying decreases in management fee revenue, primarily due to the reduced sized run-off syndicate. MGA commission fell purely due to the sale of R&Q Marine Services Limited and Synergy, as CRS continued to grow. Profit commissions were reduced and very small in the six months. New business income was below expectation due to a delay on a pipeline turnkey contract. CRS, our group owned MGA which specialises in underwriting SME commercial insurance on behalf of a panel of Lloyd’s and other highly rated insurers, continues to gain scale. Personnel reductions effected late in the period will benefit the second half result. Turning to Accredited, we are delighted to bring on a new Chief Underwriting Officer to add broad underwriting experience to the team, to help market the Accredited platform and ensure we write profitable and growing programmes, predominantly on behalf of highly rated authorised reinsurers. The results in Accredited during the period were impacted from a further increase in provisions for agents that wrote a few large bonds which were forfeited as mentioned in the Group’s 2015 results. The contracts with these agents have been terminated and control systems further improved with write-downs of the associated bad debt now fully accounted for. Whilst the bail book will continue, in the face of challenging political conditions and market pressures, it is likely that premium income will see some reduction in order to maintain quality. Notwithstanding these short-term headwinds, we are very upbeat about the prospects for Accredited, where our focus is on generating fee income from new sources of USA domestic business which will be reinsured to Lloyd’s and other highly rated reinsurers and developing legacy opportunities. The early part of 2016 was spent applying for new licences to expand Accredited’s underwriting reach nationwide, a process which is now largely complete. This should provide valuable new business flows and a

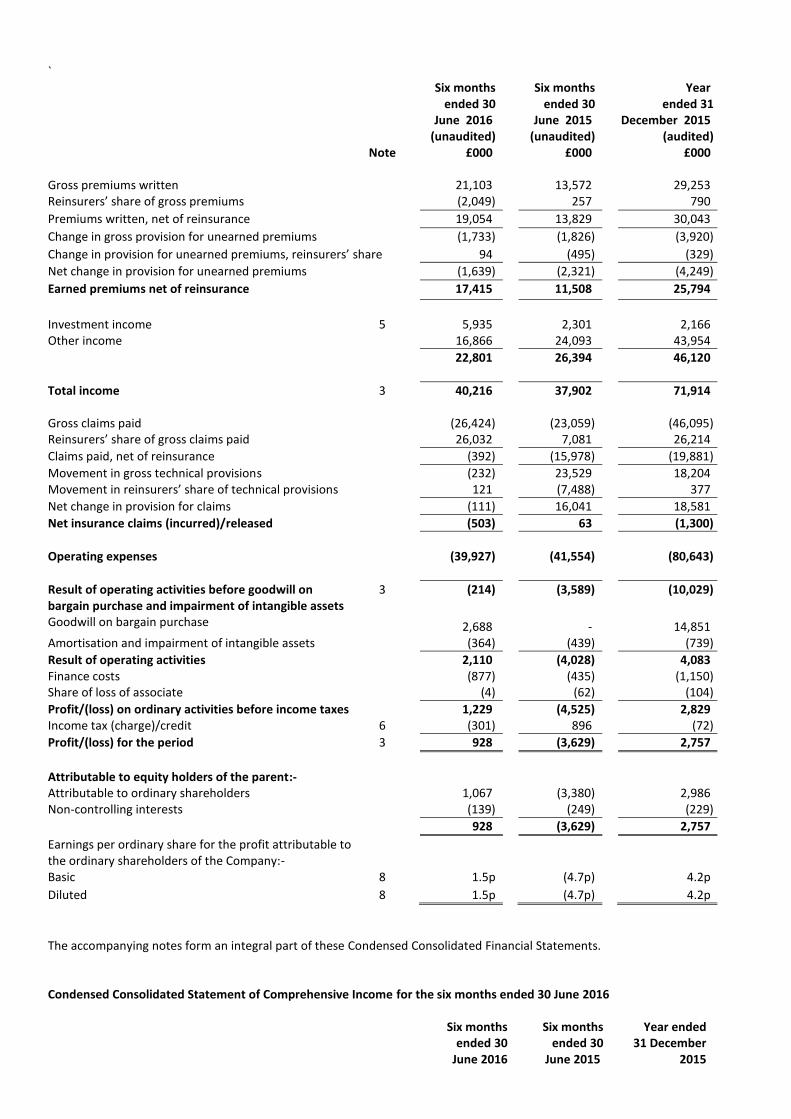
strongly increasing commission income stream for the company and the wider Group. We are pleased to announce that we have started writing our first new programme and have a pipeline of other programs we believe we will sign up during this year. We have also recently been granted the Workers’ Compensation line and now have the ability to use Accredited to write loss portfolio transfers and effect novations for legacy business, increasing its range of activity to leverage the Group’s core expertise in run-off. This should bring further income streams to Accredited and lead to a profitable outturn for the full year. Governance We set high standards of corporate governance, with a structure designed to establish, implement and maintain the effective controls essential to the Group’s long-term success. The role of the Board is to set the Group’s strategic objectives, and to oversee and review management performance, ensuring the required resources are available for meeting those objectives. The Board met regularly through the year to debate and conduct these matters. Our people During the past year, our staff has continued to make valuable contributions to the success of the Group and I emphasise my gratitude for this. We continue to identify and recruit high-quality individuals to develop existing and new business areas, and we demonstrate strength and depth in the management team across the three divisions. We would especially like to welcome Todd Campbell as Chief Underwriting Officer at Accredited. Outlook Trading in the remainder of 2016 is anticipated to be strong given the usual second half operating profit bias with expectations that the full year results will be in line with market expectations. It is expected that book value will increase modestly during the year even after the continued cash distributions to shareholders, which will be maintained at current levels, absent unforeseen circumstances. The Group is confident in further increasing the contribution from its legacy acquisition activity, not just in the UK and Europe but also in Bermuda and the US, where we have been replicating our investment in infrastructure and expertise with good results. The recent commutation with ACE has provided the Group with more liquidity and flexibility to pro-actively manage the run-off of R&Q Re (US). Simplification of our business model continues to be a top priority and the Group has continued to rebalance its live underwriting commitment, to allow the deployment of additional capital in legacy transactions, where returns are expected to be more attractive and increasingly focus on fee based services. A number of opportunities to expand our legacy broking and binder management services in the UK offer promising avenues of profitable growth and we have made recent wins here. The development of revenue during the second half and beyond in the US healthcare initiative should increase the operating margin of the Insurance Services Division as a whole. The Underwriting Management Division has been impacted in 2016 by a delay in a sizeable management contract but strong interest in turnkey management continues and the expansion of Accredited with its increasing pipeline of programme opportunities bodes well for future growth and profits. The reduction in management operating costs across the Group, especially relating to support functions, will begin to emerge during the latter part of the year and particularly in 2017. We look forward to 2016 and beyond with confidence, having delivered a significant improvement in the financial performance of the Group during the first half of 2016 against the same period in 2015. We anticipate a strong second half year result and continue to focus on those core areas of the Group with the greatest growth potential. {signed} Chairman. Condensed Consolidated Income Statement for the six months ended 30 June 2016
`
Six months ended 30
June 2016
Six months ended 30
June 2015
Year
ended 31 December 2015
(unaudited) (unaudited) (audited) Note £000 £000 £000 Gross premiums written 21,103 13,572 29,253 Reinsurers’ share of gross premiums (2,049) 257 790
Premiums written, net of reinsurance 19,054 13,829 30,043
Change in gross provision for unearned premiums (1,733) (1,826) (3,920)
Change in provision for unearned premiums, reinsurers’ share 94 (495) (329)
Net change in provision for unearned premiums (1,639) (2,321) (4,249)
Earned premiums net of reinsurance 17,415 11,508 25,794
Investment income 5 5,935 2,301 2,166 Other income 16,866 24,093 43,954
22,801 26,394 46,120
Total income 3 40,216 37,902 71,914 Gross claims paid (26,424) (23,059) (46,095) Reinsurers’ share of gross claims paid 26,032 7,081 26,214
Claims paid, net of reinsurance (392) (15,978) (19,881)
Movement in gross technical provisions (232) 23,529 18,204 Movement in reinsurers’ share of technical provisions 121 (7,488) 377
Net change in provision for claims (111) 16,041 18,581
Net insurance claims (incurred)/released (503) 63 (1,300)
Operating expenses (39,927) (41,554) (80,643)
Result of operating activities before goodwill on bargain purchase and impairment of intangible assets
3 (214) (3,589) (10,029)
Goodwill on bargain purchase 2,688 - 14,851 Amortisation and impairment of intangible assets (364) (439) (739)
Result of operating activities 2,110 (4,028) 4,083 Finance costs (877) (435) (1,150) Share of loss of associate (4) (62) (104)
Profit/(loss) on ordinary activities before income taxes 1,229 (4,525) 2,829 Income tax (charge)/credit 6 (301) 896 (72)
Profit/(loss) for the period 3 928 (3,629) 2,757
Attributable to equity holders of the parent:- Attributable to ordinary shareholders 1,067 (3,380) 2,986 Non-controlling interests (139) (249) (229)
928 (3,629) 2,757
Earnings per ordinary share for the profit attributable to the ordinary shareholders of the Company:-
Basic 8 1.5p (4.7p) 4.2p
Diluted 8 1.5p (4.7p) 4.2p
The accompanying notes form an integral part of these Condensed Consolidated Financial Statements. Condensed Consolidated Statement of Comprehensive Income for the six months ended 30 June 2016
Six months ended 30
June 2016
Six months ended 30
June 2015
Year ended 31 December
2015
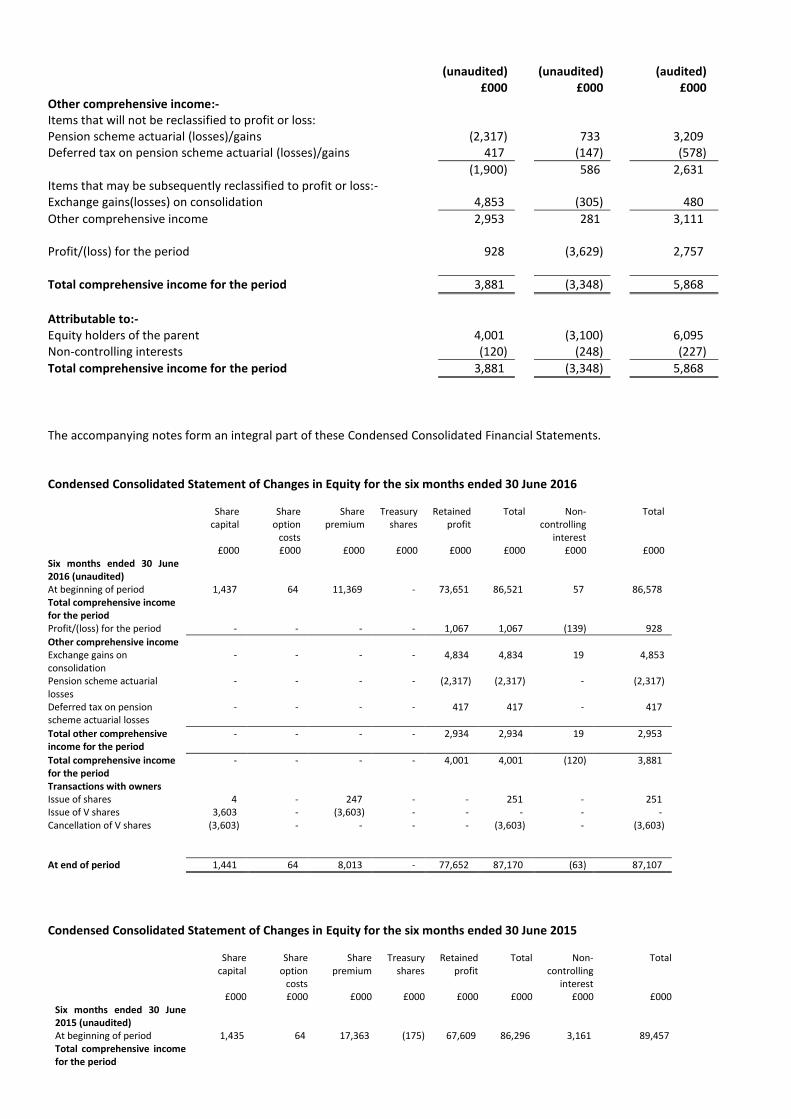
(unaudited) (unaudited) (audited) £000 £000 £000 Other comprehensive income:- Items that will not be reclassified to profit or loss: Pension scheme actuarial (losses)/gains (2,317) 733 3,209 Deferred tax on pension scheme actuarial (losses)/gains 417 (147) (578)
(1,900) 586 2,631 Items that may be subsequently reclassified to profit or loss:- Exchange gains(losses) on consolidation 4,853 (305) 480
Other comprehensive income 2,953 281 3,111 Profit/(loss) for the period 928 (3,629) 2,757
Total comprehensive income for the period 3,881 (3,348) 5,868
Attributable to:- Equity holders of the parent 4,001 (3,100) 6,095 Non-controlling interests (120) (248) (227)
Total comprehensive income for the period 3,881 (3,348) 5,868
The accompanying notes form an integral part of these Condensed Consolidated Financial Statements. Condensed Consolidated Statement of Changes in Equity for the six months ended 30 June 2016
Share
capital Share
option costs
Share premium
Treasury shares
Retained profit
Total Non-controlling
interest
Total
£000 £000 £000 £000 £000 £000 £000 £000 Six months ended 30 June 2016 (unaudited)
At beginning of period 1,437 64 11,369 - 73,651 86,521 57 86,578 Total comprehensive income for the period
Profit/(loss) for the period - - - - 1,067 1,067 (139) 928
Other comprehensive income Exchange gains on consolidation
- - - - 4,834 4,834 19 4,853
Pension scheme actuarial losses
- - - - (2,317) (2,317) - (2,317)
Deferred tax on pension scheme actuarial losses
- - - - 417 417 - 417
Total other comprehensive income for the period
- - - - 2,934 2,934 19 2,953
Total comprehensive income for the period
- - - - 4,001 4,001 (120) 3,881
Transactions with owners Issue of shares 4 - 247 - - 251 - 251 Issue of V shares 3,603 - (3,603) - - - - - Cancellation of V shares (3,603) - - - - (3,603) - (3,603)
At end of period 1,441 64 8,013 - 77,652 87,170 (63) 87,107
Condensed Consolidated Statement of Changes in Equity for the six months ended 30 June 2015
Share
capital Share
option costs
Share premium
Treasury shares
Retained profit
Total Non-controlling
interest
Total
£000 £000 £000 £000 £000 £000 £000 £000 Six months ended 30 June 2015 (unaudited)
At beginning of period 1,435 64 17,363 (175) 67,609 86,296 3,161 89,457 Total comprehensive income for the period
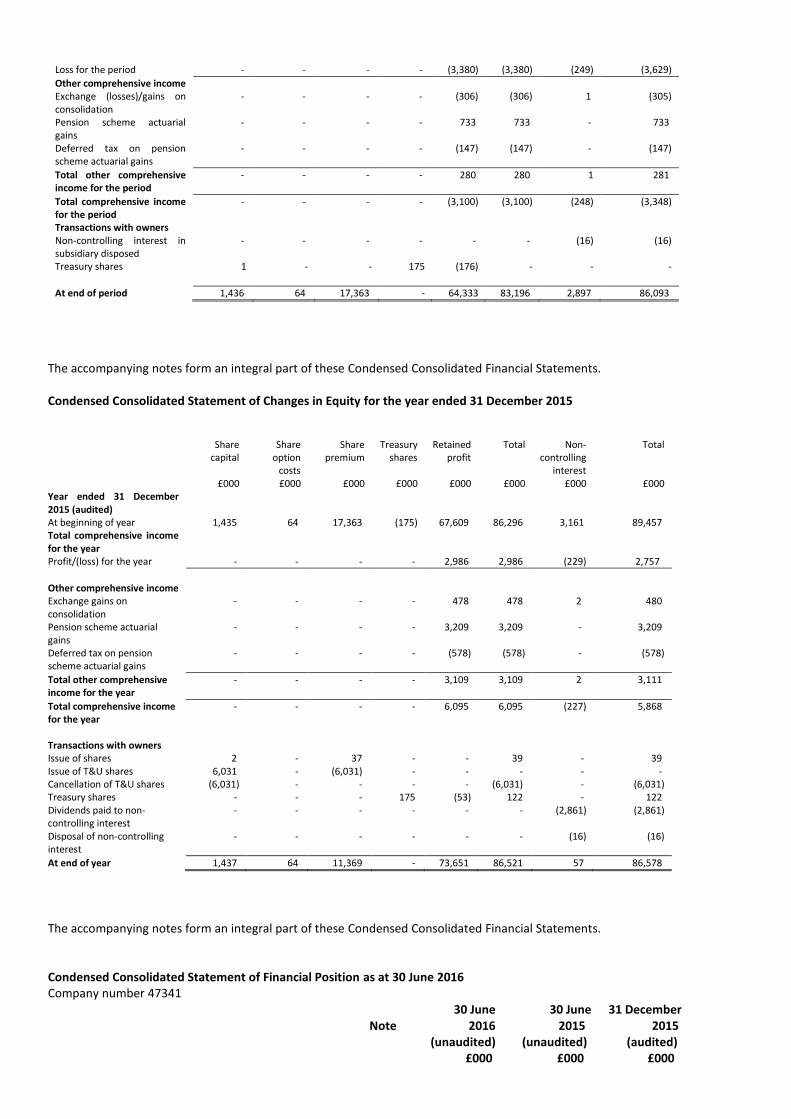
Loss for the period - - - - (3,380) (3,380) (249) (3,629)
Other comprehensive income Exchange (losses)/gains on consolidation
- - - - (306) (306) 1 (305)
Pension scheme actuarial gains
- - - - 733 733 - 733
Deferred tax on pension scheme actuarial gains
- - - - (147) (147) - (147)
Total other comprehensive income for the period
- - - - 280 280 1 281
Total comprehensive income for the period
- - - - (3,100) (3,100) (248) (3,348)
Transactions with owners Non-controlling interest in subsidiary disposed
- - - - - - (16) (16)
Treasury shares 1 - - 175 (176) - - -
At end of period 1,436 64 17,363 - 64,333 83,196 2,897 86,093
The accompanying notes form an integral part of these Condensed Consolidated Financial Statements. Condensed Consolidated Statement of Changes in Equity for the year ended 31 December 2015
Share
capital Share
option costs
Share premium
Treasury shares
Retained profit
Total Non-controlling
interest
Total
£000 £000 £000 £000 £000 £000 £000 £000 Year ended 31 December 2015 (audited)
At beginning of year 1,435 64 17,363 (175) 67,609 86,296 3,161 89,457 Total comprehensive income for the year
Profit/(loss) for the year - - - - 2,986 2,986 (229) 2,757
Other comprehensive income
Exchange gains on consolidation
- - - - 478 478 2 480
Pension scheme actuarial gains
- - - - 3,209 3,209 - 3,209
Deferred tax on pension scheme actuarial gains
- - - - (578) (578) - (578)
Total other comprehensive income for the year
- - - - 3,109 3,109 2 3,111
Total comprehensive income for the year
- - - - 6,095 6,095 (227) 5,868
Transactions with owners
Issue of shares 2 - 37 - - 39 - 39 Issue of T&U shares 6,031 - (6,031) - - - - - Cancellation of T&U shares (6,031) - - - - (6,031) - (6,031) Treasury shares - - - 175 (53) 122 - 122 Dividends paid to non-controlling interest
- - - - - - (2,861) (2,861)
Disposal of non-controlling interest
- - - - - - (16) (16)
At end of year 1,437 64 11,369 - 73,651 86,521 57 86,578
The accompanying notes form an integral part of these Condensed Consolidated Financial Statements. Condensed Consolidated Statement of Financial Position as at 30 June 2016 Company number 47341
Note
30 June 2016
30 June 2015
31 December 2015
(unaudited) (unaudited) (audited) £000 £000 £000

Assets Intangible assets 28,220 22,673 26,397 Investment in associates 9 56 13 Property, plant and equipment 1,093 1,101 940 Investment properties 2,339 756 770 Financial instruments 188,470 113,951 144,337 Reinsurers’ share of insurance liabilities 7 195,598 160,176 177,211 Current tax assets 5,112 4,731 4,569 Deferred tax assets 5,882 8,883 5,840 Insurance and other receivables 111,767 112,923 119,860 Cash and cash equivalents 52,211 77,515 69,325
Total assets 590,701 502,765 549,262
Liabilities Insurance contract provisions 7 414,566 338,093 376,802 Financial liabilities 37,936 25,271 38,921 Deferred tax liabilities 2,517 2,952 2,827 Insurance and other payables 9 33,564 36,955 30,794 Current tax liabilities 7,171 5,712 7,943 Pension scheme obligations 7,840 7,689 5,397
Total liabilities 503,594 416,672 462,684
Equity Share capital 1,441 1,436 1,437 Other reserves 8,077 17,427 11,433 Retained earnings 77,652 64,333 73,651
Attributable to equity holders of the parent 87,170 83,196 86,521 Non-controlling interests in subsidiary undertakings (63) 2,897 57
Total equity 87,107 86,093 86,578
Total liabilities and equity 590,701 502,765 549,262
The Condensed Consolidated Financial Statements were approved by the Board of Directors on 2 September 2016 and were signed on its behalf by: K E Randall T A Booth The accompanying notes form an integral part of these Condensed Consolidated Financial Statements. Condensed Consolidated Cash Flow Statement for the six months ended 30 June 2016
Six months ended 30
June 2016
Six months ended 30
June 2015
Year ended
31 December 2015
(unaudited) (unaudited) (audited)
£000 £000 £000 Cash flows from operating activities
Profit/(loss) before income taxes 1,229 (4,525) 2,829 Finance costs 877 435 1,150
Depreciation 325 409 719 Share based payments 251 - 159
Share of losses of associates 4 62 104
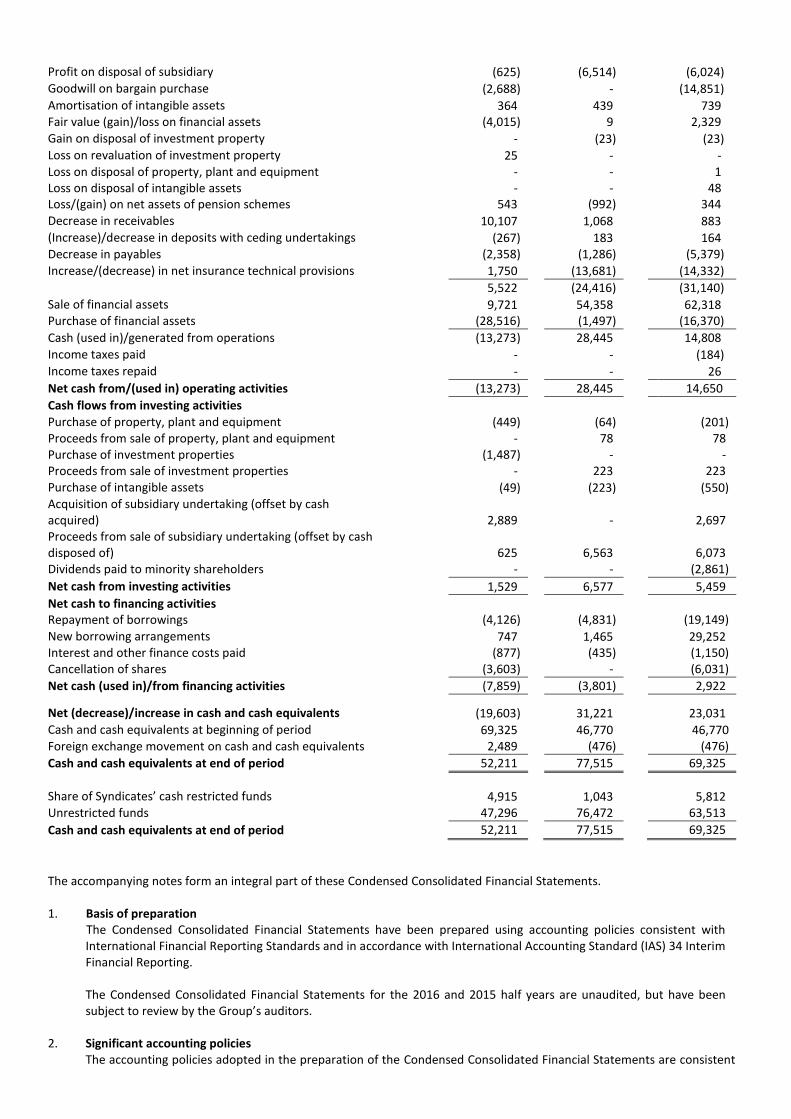
Profit on disposal of subsidiary (625) (6,514) (6,024) Goodwill on bargain purchase (2,688) - (14,851)
Amortisation of intangible assets 364 439 739 Fair value (gain)/loss on financial assets (4,015) 9 2,329
Gain on disposal of investment property - (23) (23) Loss on revaluation of investment property 25 - - Loss on disposal of property, plant and equipment - - 1 Loss on disposal of intangible assets - - 48 Loss/(gain) on net assets of pension schemes 543 (992) 344
Decrease in receivables 10,107 1,068 883 (Increase)/decrease in deposits with ceding undertakings (267) 183 164 Decrease in payables (2,358) (1,286) (5,379)
Increase/(decrease) in net insurance technical provisions 1,750 (13,681) (14,332)
5,522 (24,416) (31,140)
Sale of financial assets 9,721 54,358 62,318 Purchase of financial assets (28,516) (1,497) (16,370)
Cash (used in)/generated from operations (13,273) 28,445 14,808
Income taxes paid - - (184) Income taxes repaid - - 26
Net cash from/(used in) operating activities (13,273) 28,445 14,650
Cash flows from investing activities
Purchase of property, plant and equipment (449) (64) (201) Proceeds from sale of property, plant and equipment - 78 78 Purchase of investment properties (1,487) - - Proceeds from sale of investment properties - 223 223 Purchase of intangible assets (49) (223) (550) Acquisition of subsidiary undertaking (offset by cash acquired) 2,889 - 2,697 Proceeds from sale of subsidiary undertaking (offset by cash disposed of) 625 6,563 6,073 Dividends paid to minority shareholders - - (2,861)
Net cash from investing activities 1,529 6,577 5,459
Net cash to financing activities
Repayment of borrowings (4,126) (4,831) (19,149)
New borrowing arrangements 747 1,465 29,252 Interest and other finance costs paid (877) (435) (1,150) Cancellation of shares (3,603) - (6,031)
Net cash (used in)/from financing activities (7,859) (3,801) 2,922
Net (decrease)/increase in cash and cash equivalents (19,603) 31,221 23,031 Cash and cash equivalents at beginning of period 69,325 46,770 46,770 Foreign exchange movement on cash and cash equivalents 2,489 (476) (476)
Cash and cash equivalents at end of period 52,211 77,515 69,325
Share of Syndicates’ cash restricted funds 4,915 1,043 5,812 Unrestricted funds 47,296 76,472 63,513
Cash and cash equivalents at end of period 52,211 77,515 69,325
The accompanying notes form an integral part of these Condensed Consolidated Financial Statements. 1. Basis of preparation
The Condensed Consolidated Financial Statements have been prepared using accounting policies consistent with International Financial Reporting Standards and in accordance with International Accounting Standard (IAS) 34 Interim Financial Reporting. The Condensed Consolidated Financial Statements for the 2016 and 2015 half years are unaudited, but have been subject to review by the Group’s auditors.
2. Significant accounting policies The accounting policies adopted in the preparation of the Condensed Consolidated Financial Statements are consistent
with those followed in the preparation of the Group’s Consolidated Financial Statements for the year ended 31 December 2015 other than as detailed below. There have been no amendments to accounting policies. New standards effective from 1 January 2016:-
•IFRS 11: Amendment: Accounting for acquisitions on interests in joint operations (EU effective date: 1 January 2016); • IAS 16 and 38: Amendment: Clarification of acceptable methods of depreciation and amortisation (EU effective date: 1 January 2016); and • Annual improvement to IFRSs – 2012-2014 cycle (EU effective date: 1 January 2016). These amendments will not result in any material impact on the interim financial statements of the group and there have been no amendments to the group’s accounting policies as a result of the new standards listed above.
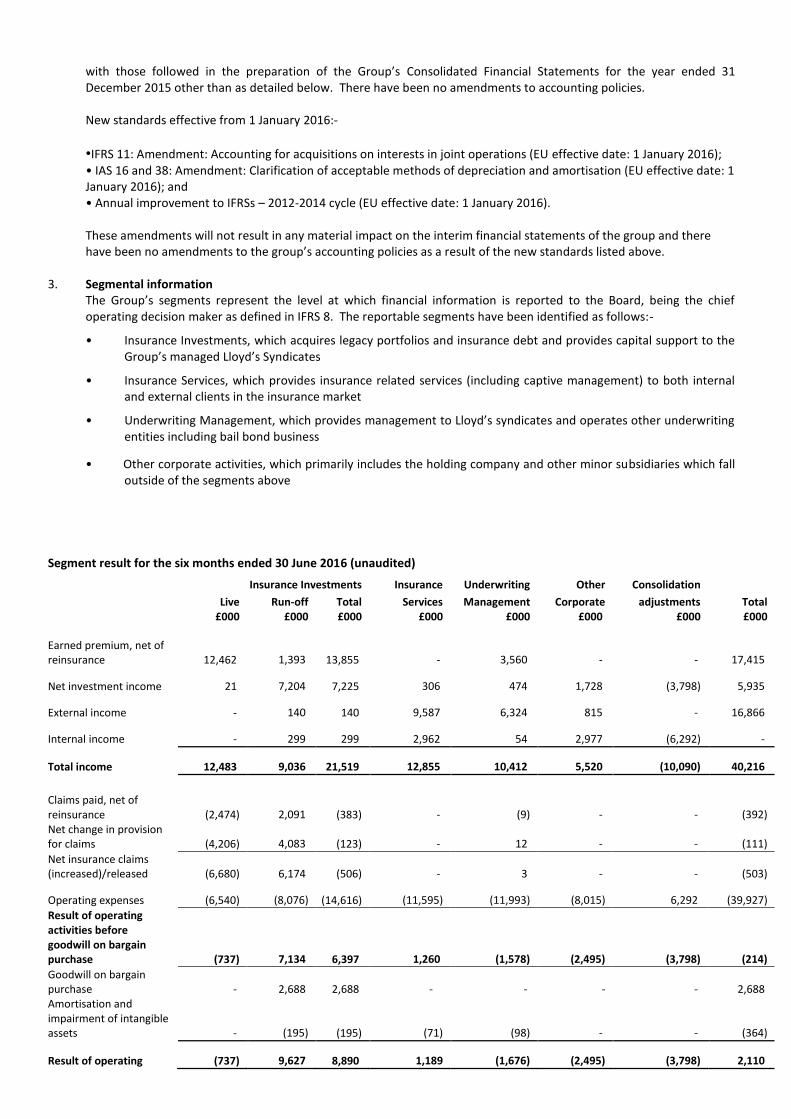
3. Segmental information The Group’s segments represent the level at which financial information is reported to the Board, being the chief operating decision maker as defined in IFRS 8. The reportable segments have been identified as follows:-
• Insurance Investments, which acquires legacy portfolios and insurance debt and provides capital support to the Group’s managed Lloyd’s Syndicates
• Insurance Services, which provides insurance related services (including captive management) to both internal and external clients in the insurance market
• Underwriting Management, which provides management to Lloyd’s syndicates and operates other underwriting entities including bail bond business
• Other corporate activities, which primarily includes the holding company and other minor subsidiaries which fall outside of the segments above
Segment result for the six months ended 30 June 2016 (unaudited)
Insurance Investments Insurance Underwriting Other Consolidation
Live Run-off Total Services Management Corporate adjustments Total
£000 £000 £000 £000 £000 £000 £000 £000
Earned premium, net of reinsurance 12,462 1,393 13,855 - 3,560 - - 17,415
Net investment income 21 7,204 7,225 306 474 1,728 (3,798) 5,935
External income - 140 140 9,587 6,324 815 - 16,866
Internal income - 299 299 2,962 54 2,977 (6,292) -
Total income 12,483 9,036 21,519 12,855 10,412 5,520 (10,090) 40,216
Claims paid, net of reinsurance (2,474) 2,091 (383) - (9) - - (392) Net change in provision for claims (4,206) 4,083 (123) - 12 - - (111)
Net insurance claims (increased)/released (6,680) 6,174 (506) - 3 - - (503)
Operating expenses (6,540) (8,076) (14,616) (11,595) (11,993) (8,015) 6,292 (39,927)
Result of operating activities before goodwill on bargain purchase (737) 7,134 6,397 1,260 (1,578) (2,495) (3,798) (214)
Goodwill on bargain purchase - 2,688 2,688 - - - - 2,688 Amortisation and impairment of intangible assets - (195) (195) (71) (98) - - (364)
Result of operating (737) 9,627 8,890 1,189 (1,676) (2,495) (3,798) 2,110

activities
Finance costs - (1,140) (1,140) (443) (118) (2,974) 3,798 (877)
Share of loss of associate - - - - (4) - - (4)
(Loss)/profit on ordinary activities before income taxes (737) 8,487 7,750 746 (1,798) (5,469) - 1,229
Income tax credit/(charge) - (1,044) (1,044) 206 278 259 - (301)
(Loss)/profit for the year (737) 7,443 6,706 952 (1,520) (5,210) - 928
Non-controlling interests - (253) (253) 392 - - - 139
Attributable to shareholders of parent (737) 7,190 6,453 1,344 (1,520) (5,210) - 1,067
Segment assets 27,663 599,473 627,136 92,077 46,249 166,569 (341,330) 590,701
Segment liabilities 33,309 464,527 497,836 85,179 27,353 234,556 (341,330) 503,594
Segment result for the six months ended 30 June 2015 (unaudited)
Insurance Investments Insurance Underwriting Other Consolidation
Live Run-off Total Services Management Corporate adjustments Total
£000 £000 £000 £000 £000 £000 £000 £000
Earned premium, net of reinsurance 7,444 341 7,785 - 3,723 - - 11,508
Net investment income - 3,509 3,509 716 228 2,574 (4,726) 2,301
External income - 26 26 10,313 7,218 6,536 - 24,093
Internal income - 181 181 5,761 972 599 (7,513) -
Total income 7,444 4,057 11,501 16,790 12,141 9,709 (12,239) 37,902
Claims paid, net of reinsurance (2,114) (13,857) (15,971) - (7) - - (15,978) Net change in provision for claims (2,035) 18,160 16,125 - (84) - - 16,041
Net insurance claims (increased)/released (4,149) 4,303 154 - (91) - - 63
Operating expenses (4,109) (10,675) (14,784) (16,208) (12,455) (5,620) 7,513 (41,554)
Result of operating activities before goodwill on bargain purchase (814) (2,315) (3,129) 582 (405) 4,089 (4,726) (3,589)
Goodwill on bargain purchase - - - - - - - - Amortisation and impairment of intangible assets - (145) (145) (63) (102) (129) - (439)
Result of operating activities (814) (2,460) (3,274) 519 (507) 3,960 (4,726) (4,028)
Finance costs - (694) (694) (843) (267) (3,357) 4,726 (435)
Share of loss of associate - - - - (62) - - (62)
(Loss)/profit on ordinary activities before income taxes (814) (3,154) (3,968) (324) (836) 603 - (4,525)
Income tax credit/(charge) - 811 811 192 (175) 68 - 896
(Loss)/profit for the year (814) (2,343) (3,157) (132) (1,011) 671 - (3,629)
Non-controlling interests - - - 48 201 - - 249
Attributable to shareholders of parent (814) (2,343) (3,157) (84) (810) 671 - (3,380)
Segment assets 13,309 521,993 535,302 89,093 43,265 167,716 (332,611) 502,765
Segment liabilities 18,648 397,741 416,389 86,733 26,223 219,938 (332,611) 416,672
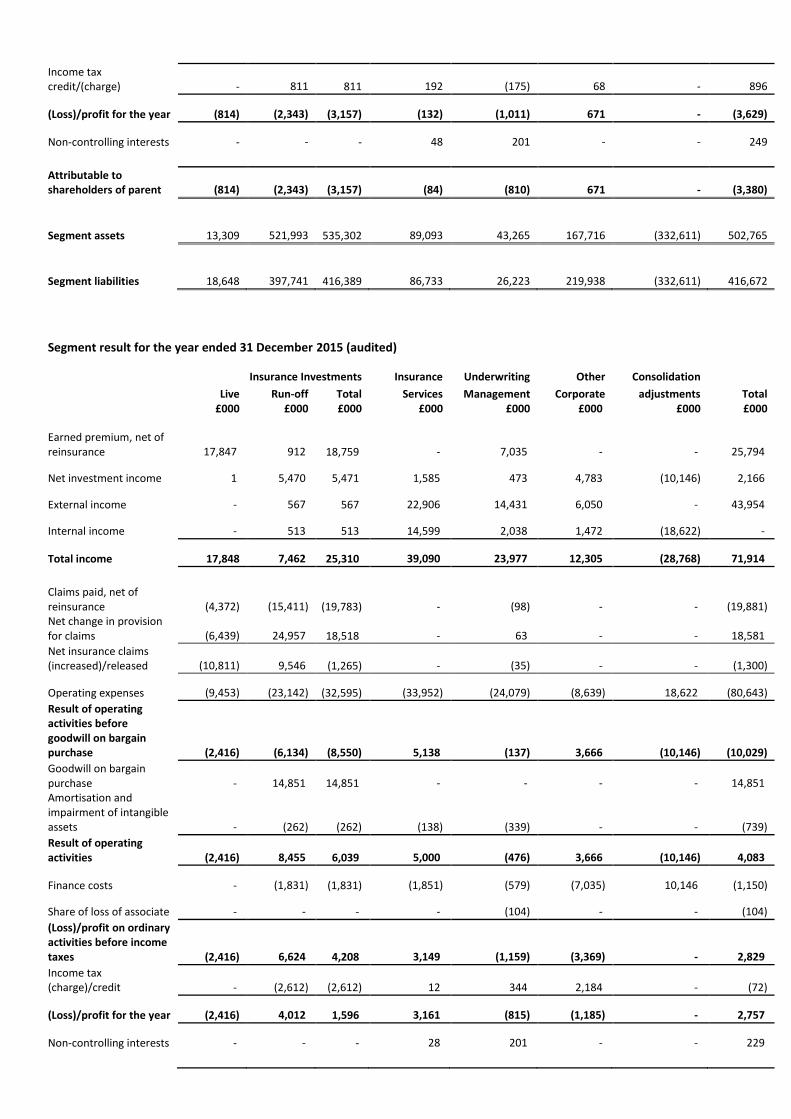
Segment result for the year ended 31 December 2015 (audited)
Insurance Investments Insurance Underwriting Other Consolidation
Live Run-off Total Services Management Corporate adjustments Total
£000 £000 £000 £000 £000 £000 £000 £000
Earned premium, net of reinsurance 17,847 912 18,759 - 7,035 - - 25,794
Net investment income 1 5,470 5,471 1,585 473 4,783 (10,146) 2,166
External income - 567 567 22,906 14,431 6,050 - 43,954
Internal income - 513 513 14,599 2,038 1,472 (18,622) -
Total income 17,848 7,462 25,310 39,090 23,977 12,305 (28,768) 71,914
Claims paid, net of reinsurance (4,372) (15,411) (19,783) - (98) - - (19,881) Net change in provision for claims (6,439) 24,957 18,518 - 63 - - 18,581
Net insurance claims (increased)/released (10,811) 9,546 (1,265) - (35) - - (1,300)
Operating expenses (9,453) (23,142) (32,595) (33,952) (24,079) (8,639) 18,622 (80,643)
Result of operating activities before goodwill on bargain purchase (2,416) (6,134) (8,550) 5,138 (137) 3,666 (10,146) (10,029)
Goodwill on bargain purchase - 14,851 14,851 - - - - 14,851 Amortisation and impairment of intangible assets - (262) (262) (138) (339) - - (739)
Result of operating activities (2,416) 8,455 6,039 5,000 (476) 3,666 (10,146) 4,083
Finance costs - (1,831) (1,831) (1,851) (579) (7,035) 10,146 (1,150)
Share of loss of associate - - - - (104) - - (104)
(Loss)/profit on ordinary activities before income taxes (2,416) 6,624 4,208 3,149 (1,159) (3,369) - 2,829
Income tax (charge)/credit - (2,612) (2,612) 12 344 2,184 - (72)
(Loss)/profit for the year (2,416) 4,012 1,596 3,161 (815) (1,185) - 2,757
Non-controlling interests - - - 28 201 - - 229
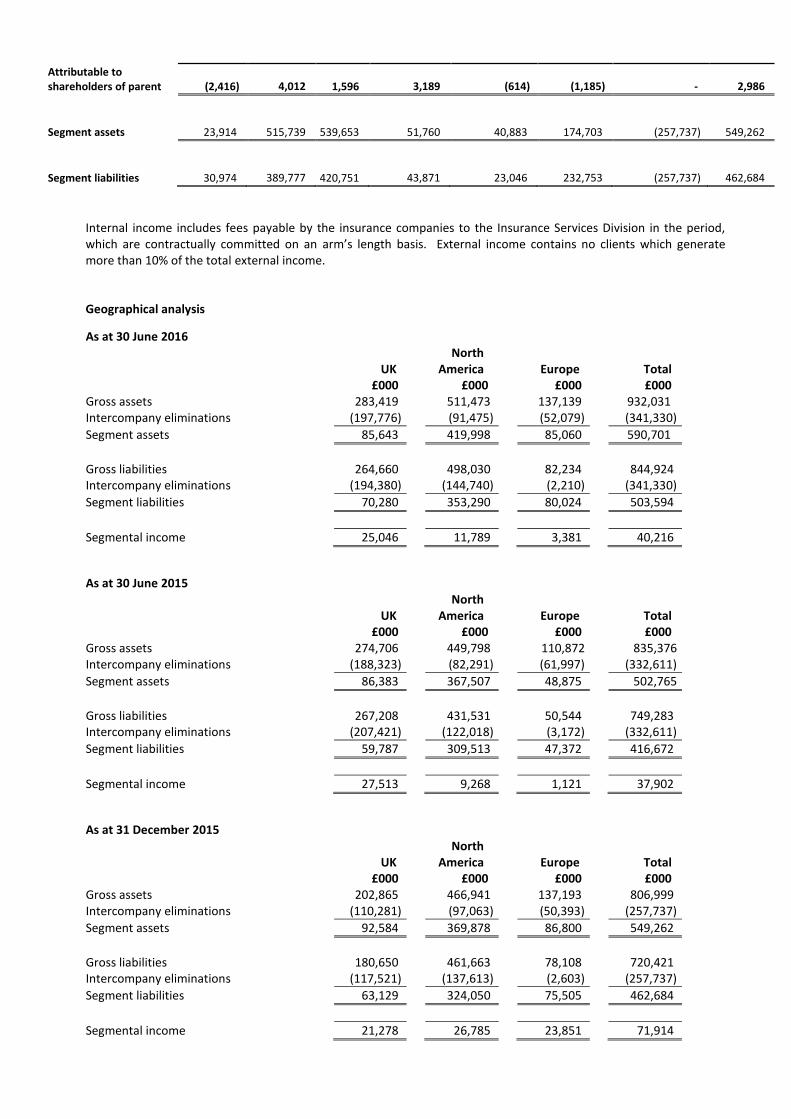
Attributable to shareholders of parent (2,416) 4,012 1,596 3,189 (614) (1,185) - 2,986
Segment assets 23,914 515,739 539,653 51,760 40,883 174,703 (257,737) 549,262
Segment liabilities 30,974 389,777 420,751 43,871 23,046 232,753 (257,737) 462,684
Internal income includes fees payable by the insurance companies to the Insurance Services Division in the period, which are contractually committed on an arm’s length basis. External income contains no clients which generate more than 10% of the total external income.
Geographical analysis
As at 30 June 2016
UK North
America Europe Total £000 £000 £000 £000 Gross assets 283,419 511,473 137,139 932,031 Intercompany eliminations (197,776) (91,475) (52,079) (341,330)
Segment assets 85,643 419,998 85,060 590,701
Gross liabilities 264,660 498,030 82,234 844,924 Intercompany eliminations (194,380) (144,740) (2,210) (341,330)
Segment liabilities 70,280 353,290 80,024 503,594
Segmental income 25,046 11,789 3,381 40,216
As at 30 June 2015
UK North
America Europe Total £000 £000 £000 £000 Gross assets 274,706 449,798 110,872 835,376 Intercompany eliminations (188,323) (82,291) (61,997) (332,611)
Segment assets 86,383 367,507 48,875 502,765
Gross liabilities 267,208 431,531 50,544 749,283 Intercompany eliminations (207,421) (122,018) (3,172) (332,611)
Segment liabilities 59,787 309,513 47,372 416,672
Segmental income 27,513 9,268 1,121 37,902
As at 31 December 2015
UK North
America Europe Total £000 £000 £000 £000 Gross assets 202,865 466,941 137,193 806,999 Intercompany eliminations (110,281) (97,063) (50,393) (257,737)
Segment assets 92,584 369,878 86,800 549,262
Gross liabilities 180,650 461,663 78,108 720,421 Intercompany eliminations (117,521) (137,613) (2,603) (257,737)
Segment liabilities 63,129 324,050 75,505 462,684
Segmental income 21,278 26,785 23,851 71,914
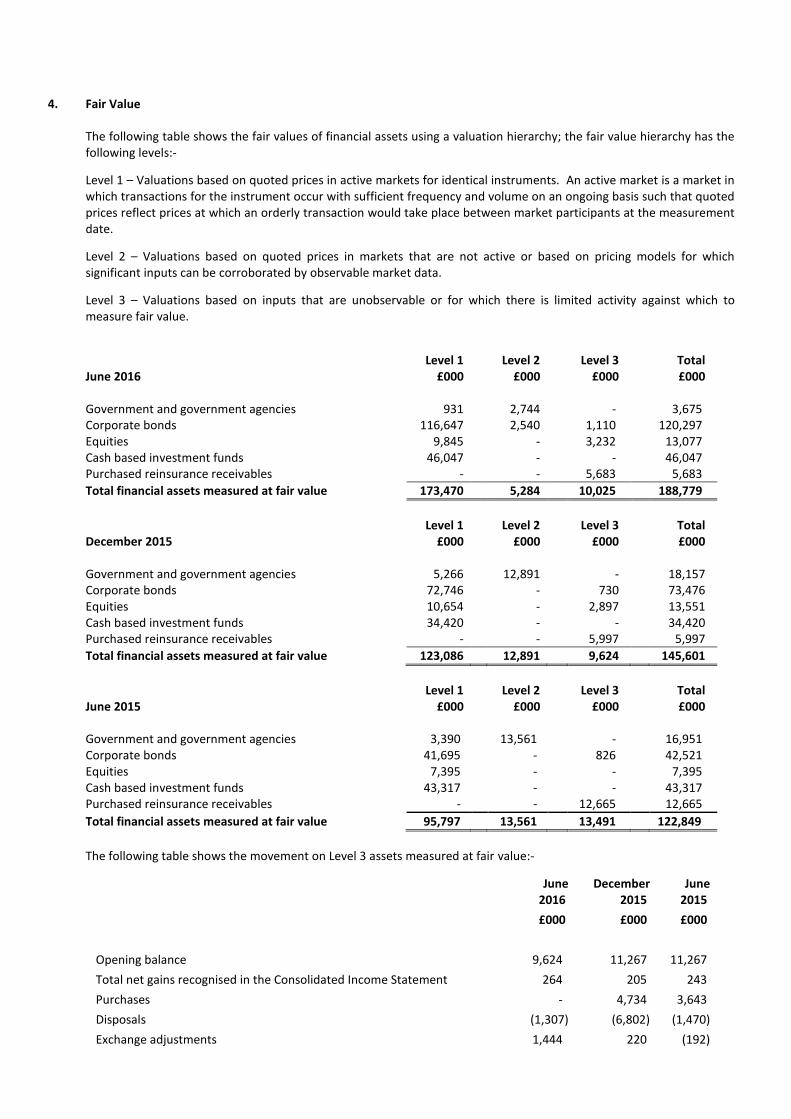
4. Fair Value
The following table shows the fair values of financial assets using a valuation hierarchy; the fair value hierarchy has the following levels:-
Level 1 – Valuations based on quoted prices in active markets for identical instruments. An active market is a market in which transactions for the instrument occur with sufficient frequency and volume on an ongoing basis such that quoted prices reflect prices at which an orderly transaction would take place between market participants at the measurement date.
Level 2 – Valuations based on quoted prices in markets that are not active or based on pricing models for which significant inputs can be corroborated by observable market data.
Level 3 – Valuations based on inputs that are unobservable or for which there is limited activity against which to measure fair value.
June 2016
Level 1 £000
Level 2 £000
Level 3 £000
Total £000
Government and government agencies 931 2,744 - 3,675 Corporate bonds 116,647 2,540 1,110 120,297 Equities 9,845 - 3,232 13,077 Cash based investment funds 46,047 - - 46,047 Purchased reinsurance receivables - - 5,683 5,683
Total financial assets measured at fair value 173,470 5,284 10,025 188,779
December 2015
Level 1 £000
Level 2 £000
Level 3 £000
Total £000
Government and government agencies 5,266 12,891 - 18,157 Corporate bonds 72,746 - 730 73,476 Equities 10,654 - 2,897 13,551 Cash based investment funds 34,420 - - 34,420 Purchased reinsurance receivables - - 5,997 5,997
Total financial assets measured at fair value 123,086 12,891 9,624 145,601
June 2015
Level 1 £000
Level 2 £000
Level 3 £000
Total £000
Government and government agencies 3,390 13,561 - 16,951 Corporate bonds 41,695 - 826 42,521 Equities 7,395 - - 7,395 Cash based investment funds 43,317 - - 43,317 Purchased reinsurance receivables - - 12,665 12,665
Total financial assets measured at fair value 95,797 13,561 13,491 122,849
The following table shows the movement on Level 3 assets measured at fair value:-
June 2016
December 2015
June 2015
£000 £000 £000
Opening balance 9,624 11,267 11,267
Total net gains recognised in the Consolidated Income Statement 264 205 243
Purchases - 4,734 3,643
Disposals (1,307) (6,802) (1,470)
Exchange adjustments 1,444 220 (192)
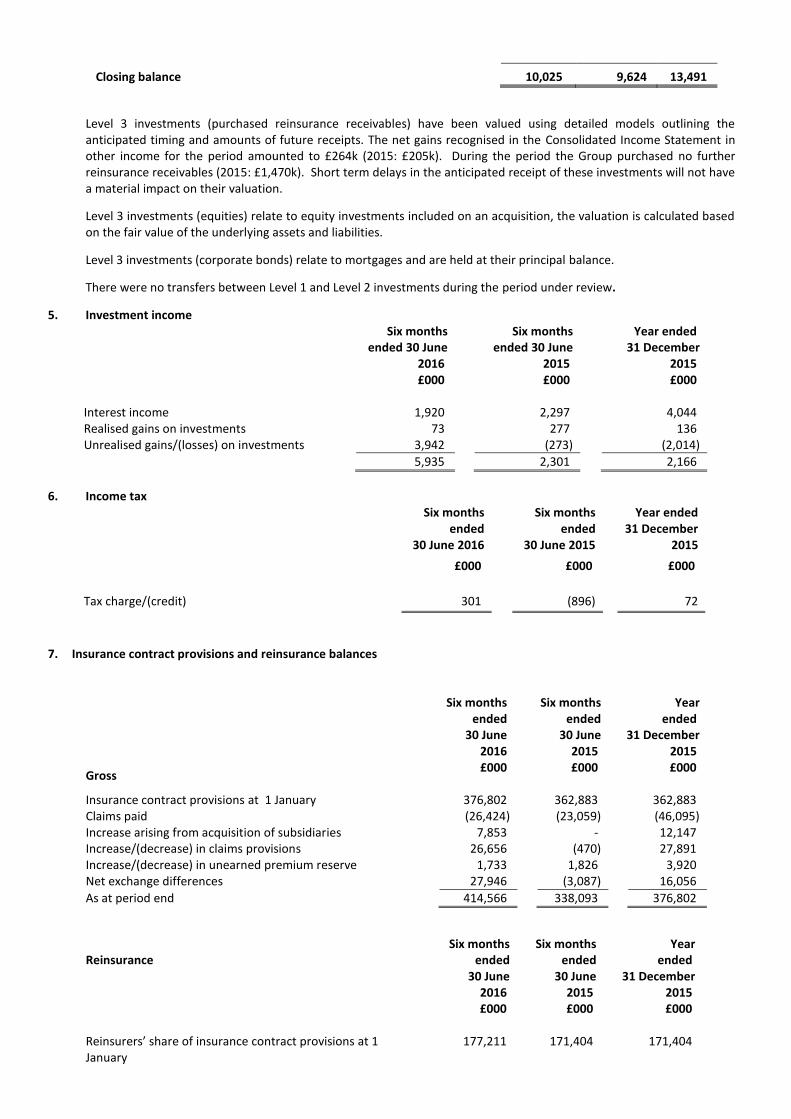
Closing balance 10,025 9,624 13,491
Level 3 investments (purchased reinsurance receivables) have been valued using detailed models outlining the anticipated timing and amounts of future receipts. The net gains recognised in the Consolidated Income Statement in other income for the period amounted to £264k (2015: £205k). During the period the Group purchased no further reinsurance receivables (2015: £1,470k). Short term delays in the anticipated receipt of these investments will not have a material impact on their valuation.
Level 3 investments (equities) relate to equity investments included on an acquisition, the valuation is calculated based on the fair value of the underlying assets and liabilities.
Level 3 investments (corporate bonds) relate to mortgages and are held at their principal balance.
There were no transfers between Level 1 and Level 2 investments during the period under review.
5. Investment income Six months
ended 30 June 2016
Six months ended 30 June
2015
Year ended 31 December
2015 £000 £000 £000 Interest income 1,920 2,297 4,044 Realised gains on investments 73 277 136 Unrealised gains/(losses) on investments 3,942 (273) (2,014)
5,935 2,301 2,166
6. Income tax
Six months ended
30 June 2016
Six months ended
30 June 2015
Year ended 31 December
2015
£000 £000 £000
Tax charge/(credit) 301 (896) 72
7. Insurance contract provisions and reinsurance balances
Six months ended
30 June 2016
Six months ended 30 June 2015
Year ended
31 December 2015
Gross £000 £000 £000
Insurance contract provisions at 1 January 376,802 362,883 362,883 Claims paid (26,424) (23,059) (46,095) Increase arising from acquisition of subsidiaries 7,853 - 12,147 Increase/(decrease) in claims provisions 26,656 (470) 27,891 Increase/(decrease) in unearned premium reserve 1,733 1,826 3,920 Net exchange differences 27,946 (3,087) 16,056
As at period end 414,566 338,093 376,802
Reinsurance
Six months ended
30 June 2016
Six months ended
30 June 2015
Year ended
31 December 2015
£000 £000 £000
Reinsurers’ share of insurance contract provisions at 1 January
177,211 171,404 171,404
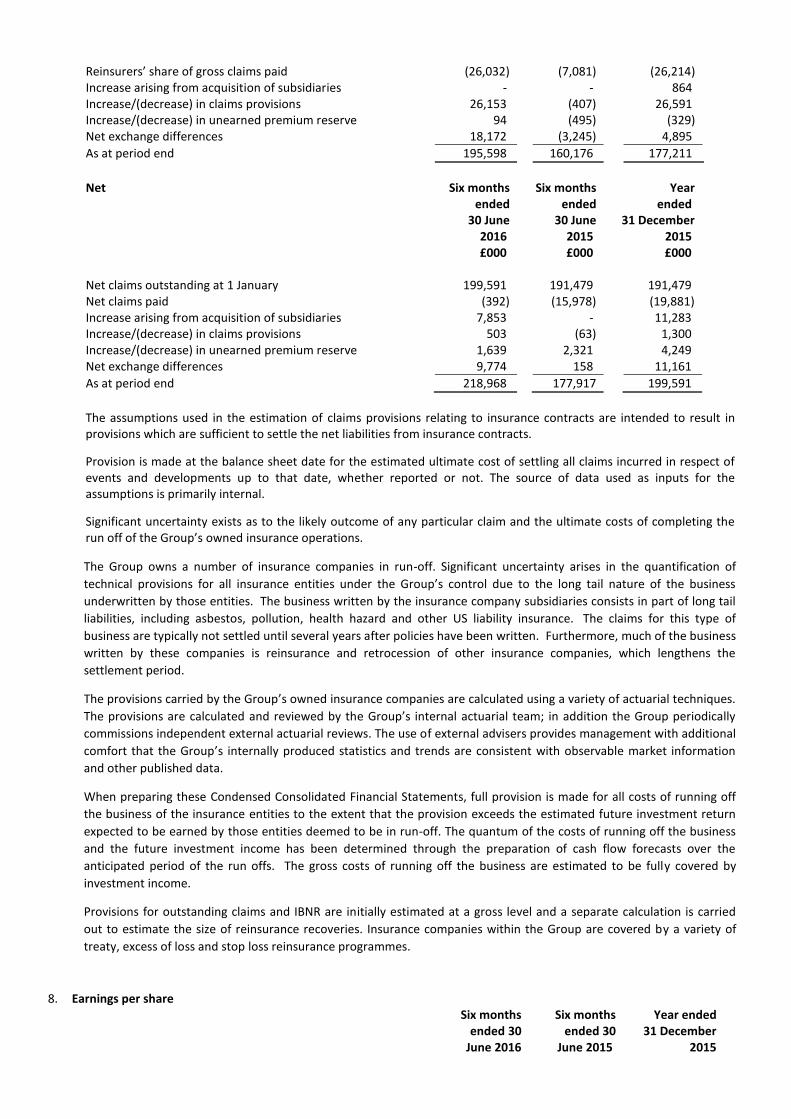
Reinsurers’ share of gross claims paid (26,032) (7,081) (26,214) Increase arising from acquisition of subsidiaries - - 864 Increase/(decrease) in claims provisions 26,153 (407) 26,591 Increase/(decrease) in unearned premium reserve 94 (495) (329) Net exchange differences 18,172 (3,245) 4,895
As at period end 195,598 160,176 177,211
Net Six months
ended 30 June
2016
Six months ended
30 June 2015
Year ended
31 December 2015
£000 £000 £000
Net claims outstanding at 1 January 199,591 191,479 191,479 Net claims paid (392) (15,978) (19,881) Increase arising from acquisition of subsidiaries 7,853 - 11,283 Increase/(decrease) in claims provisions 503 (63) 1,300 Increase/(decrease) in unearned premium reserve 1,639 2,321 4,249 Net exchange differences 9,774 158 11,161
As at period end 218,968 177,917 199,591
The assumptions used in the estimation of claims provisions relating to insurance contracts are intended to result in provisions which are sufficient to settle the net liabilities from insurance contracts.
Provision is made at the balance sheet date for the estimated ultimate cost of settling all claims incurred in respect of events and developments up to that date, whether reported or not. The source of data used as inputs for the assumptions is primarily internal.
Significant uncertainty exists as to the likely outcome of any particular claim and the ultimate costs of completing the run off of the Group’s owned insurance operations.
The Group owns a number of insurance companies in run-off. Significant uncertainty arises in the quantification of
technical provisions for all insurance entities under the Group’s control due to the long tail nature of the business
underwritten by those entities. The business written by the insurance company subsidiaries consists in part of long tail
liabilities, including asbestos, pollution, health hazard and other US liability insurance. The claims for this type of
business are typically not settled until several years after policies have been written. Furthermore, much of the business
written by these companies is reinsurance and retrocession of other insurance companies, which lengthens the
settlement period.
The provisions carried by the Group’s owned insurance companies are calculated using a variety of actuarial techniques.
The provisions are calculated and reviewed by the Group’s internal actuarial team; in addition the Group periodically
commissions independent external actuarial reviews. The use of external advisers provides management with additional
comfort that the Group’s internally produced statistics and trends are consistent with observable market information
and other published data.
When preparing these Condensed Consolidated Financial Statements, full provision is made for all costs of running off
the business of the insurance entities to the extent that the provision exceeds the estimated future investment return
expected to be earned by those entities deemed to be in run-off. The quantum of the costs of running off the business
and the future investment income has been determined through the preparation of cash flow forecasts over the
anticipated period of the run offs. The gross costs of running off the business are estimated to be fully covered by
investment income.
Provisions for outstanding claims and IBNR are initially estimated at a gross level and a separate calculation is carried
out to estimate the size of reinsurance recoveries. Insurance companies within the Group are covered by a variety of
treaty, excess of loss and stop loss reinsurance programmes.
8. Earnings per share
Six months ended 30
June 2016
Six months ended 30 June 2015
Year ended 31 December
2015

£000 £000 £000 Profit/(loss) for the period attributable to Ordinary shareholders 1,067 (3,380) 2,986
No. 000’s No. 000’s No. 000’s Weighted average number of Ordinary shares
71,864 71,678 71,743
Effect of dilutive share options 115 - 114
Weighted average number of Ordinary shares for the purposes of diluted earnings per share
71,979 71,678 71,857
Basic earnings per share 1.5p (4.7p) 4.2p Diluted earnings per share 1.5p (4.7p) 4.2p
Potentially issuable securities that would result in a loss per share if issued are not considered to have a dilution effect.
9. Insurance and other payables
Six months ended 30
June 2016
Six months ended 30
June 2015
Year ended 31 December
2015 £000 £000 £000 Structured liabilities 399,104 345,635 357,802 Structured settlements (399,104) (345,635) (357,802)
- - - Other creditors 33,564 36,955 30,794
33,564 36,955 30,794
Structured Settlements
No new structured settlement arrangements have been entered into during the period. The movement in these structured liabilities during the period is primarily due to exchange movements. The Group has paid for annuities from third party life insurance companies for the benefit of certain claimants. In the event that any of these life insurance companies were unable to meet their obligations to these annuitants, it is possible that any remaining liability may fall upon the respective insurance company subsidiaries. The subsidiary company may retain the credit risk in the unlikely event that the life insurance company defaults on its obligations to pay the annuity amounts. The Directors believe that, having regard to the quality of the security of the life insurance companies together with the reinsurance available to the relevant Group insurance companies, the possibility of a material liability arising in this way is very unlikely. The life companies will settle the liability directly with the claimants and no cash will flow through the Group. These annuities have been shown as reducing the insurance companies’ liabilities to reflect the substance of the transactions and to ensure that the disclosure of the balances does not detract from the users’ ability to understand the Group’s future cash flows.
Segregated Cells
R&Q Quest (SAC) Limited (“Quest”) is a segregated cell company in which assets and liabilities are held separately in segregated cells. The assets and liabilities of the segregated cells not owned by the Group and the profits and losses of each cell not owned by the Group are not available for use by Quest, nor the Group, and as such these balances are not included in the Condensed Consolidated Statement of Financial Position. The amounts held on behalf of the segregated cells as at 30 June 2016 amounted to £24,413k (31 December 2015: £28,017k).
RQLM Limited (“RQLM”) is a segregated cell company in which assets and liabilities are held separately in segregated cells. The assets and liabilities of the segregated cells and the profits and losses of each are not available for use by the Group and as such only the assets and the liabilities of the Groups share of cells are included in the Consolidated Statement of Financial Position. The amounts held on behalf of the third parties as at 30 June 2016 amount to £7,717k (31 December 2015 £7,668k).
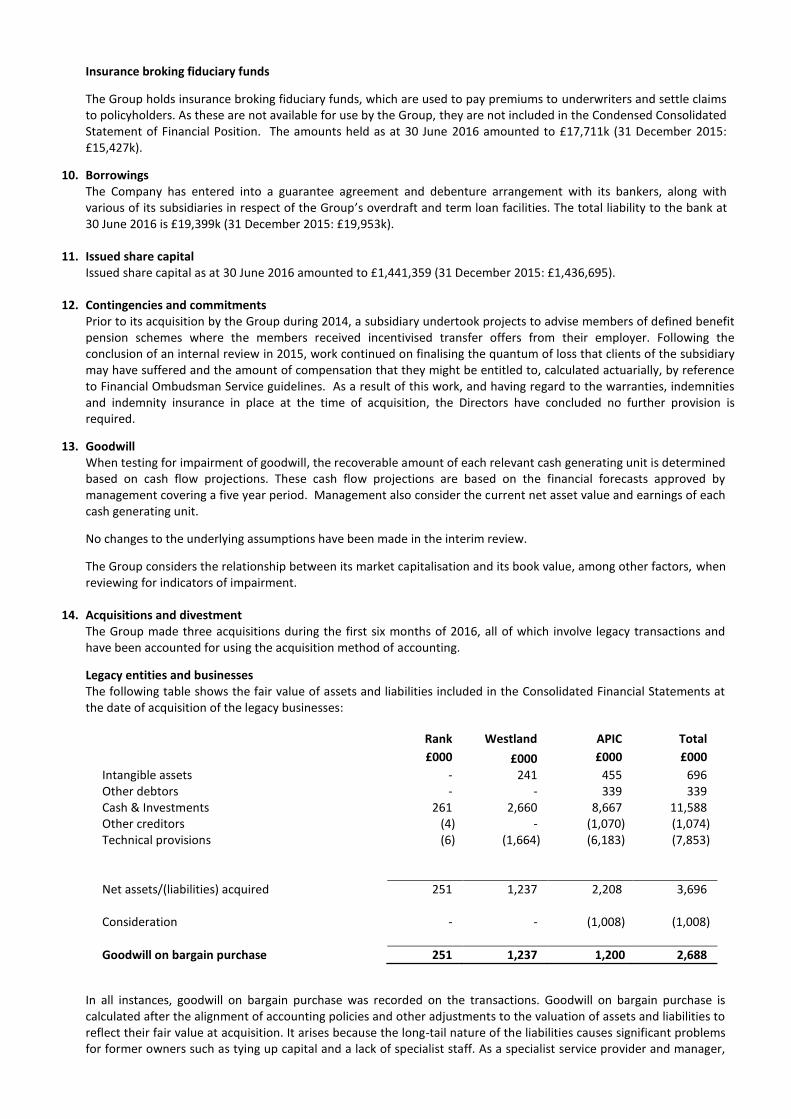
Insurance broking fiduciary funds
The Group holds insurance broking fiduciary funds, which are used to pay premiums to underwriters and settle claims to policyholders. As these are not available for use by the Group, they are not included in the Condensed Consolidated Statement of Financial Position. The amounts held as at 30 June 2016 amounted to £17,711k (31 December 2015: £15,427k).
10. Borrowings The Company has entered into a guarantee agreement and debenture arrangement with its bankers, along with various of its subsidiaries in respect of the Group’s overdraft and term loan facilities. The total liability to the bank at 30 June 2016 is £19,399k (31 December 2015: £19,953k).
11. Issued share capital Issued share capital as at 30 June 2016 amounted to £1,441,359 (31 December 2015: £1,436,695).
12. Contingencies and commitments Prior to its acquisition by the Group during 2014, a subsidiary undertook projects to advise members of defined benefit pension schemes where the members received incentivised transfer offers from their employer. Following the conclusion of an internal review in 2015, work continued on finalising the quantum of loss that clients of the subsidiary may have suffered and the amount of compensation that they might be entitled to, calculated actuarially, by reference to Financial Ombudsman Service guidelines. As a result of this work, and having regard to the warranties, indemnities and indemnity insurance in place at the time of acquisition, the Directors have concluded no further provision is required.
13. Goodwill When testing for impairment of goodwill, the recoverable amount of each relevant cash generating unit is determined based on cash flow projections. These cash flow projections are based on the financial forecasts approved by management covering a five year period. Management also consider the current net asset value and earnings of each cash generating unit.
No changes to the underlying assumptions have been made in the interim review.
The Group considers the relationship between its market capitalisation and its book value, among other factors, when reviewing for indicators of impairment.
14. Acquisitions and divestment The Group made three acquisitions during the first six months of 2016, all of which involve legacy transactions and have been accounted for using the acquisition method of accounting.
Legacy entities and businesses The following table shows the fair value of assets and liabilities included in the Consolidated Financial Statements at the date of acquisition of the legacy businesses:
Rank Westland APIC Total
£000 £000 £000 £000
Intangible assets - 241 455 696 Other debtors - - 339 339 Cash & Investments 261 2,660 8,667 11,588 Other creditors (4) - (1,070) (1,074) Technical provisions (6) (1,664) (6,183) (7,853)
Net assets/(liabilities) acquired 251 1,237 2,208 3,696
Consideration - - (1,008) (1,008)
Goodwill on bargain purchase 251 1,237 1,200 2,688
In all instances, goodwill on bargain purchase was recorded on the transactions. Goodwill on bargain purchase is calculated after the alignment of accounting policies and other adjustments to the valuation of assets and liabilities to reflect their fair value at acquisition. It arises because the long-tail nature of the liabilities causes significant problems for former owners such as tying up capital and a lack of specialist staff. As a specialist service provider and manager,

the Group is more efficient at managing such entities and former owners are prepared to sell at a discount on the fair value of the net assets.
In order to disclose the impact on the Group as though the legacy entities had been owned the whole year, assumptions would have to be made about the Group’s ability to manage efficiently the run-off of the legacy liabilities prior to the acquisition. As a result, and in accordance with IAS 8, the Directors believe it is not practicable to disclose revenue and profit before tax as if the entities had been owned for the whole year.
Where significant uncertainties arise in the quantification of the liabilities, the Directors have estimated the fair value based on the currently available information and on assumptions which they believe to be reasonable.
The Group acquired the following legacy entities and businesses during 2016:
On 24 March 2016, the Group purchased the entire issued share capital of Rank Insurance Limited (“Rank”), a
company incorporated in Guernsey. Post-acquisition Rank arranged employers and public liability insurance with
various front companies and reinsured the fronts for various limits excess of deductibles. Rank has been
amalgamated into Capstan.
On 26 May 2016, the Group novated liabilities from Westland Insurance Company (“Westland”), a Cayman Islands
incorporated company. The liabilities transferred related to workers compensation policies.
On 30 June 2016 the Group purchased the entire issued share capital of Agency Program Insurance Company
(SAC), Limited (“APIC”), a segregated cell captive company incorporated in Bermuda and the cells operated by it.
APIC has 28 separate cells which reinsured various insurance companies for workers compensation, general,
commercial auto, auto, property and inland marine liabilities.
Divestment On 26 February 2016, the Group completed the sale of the Synergy business to Plum Underwriting. The agreed cash consideration was £625k.
15. Related party transactions The following Officers and connected parties received distributions during the period as follows:-
Six months ended
30 June 2016
Six months ended
30 June 2015
Year ended 31 December
2015
£000 £000 £000 K E Randall and family 921 - 1,547 A K Quilter and family 212 - 357 T A Booth 46 - 78 M G Smith 1 - 2
During the period the Group recharged expenses totalling £4,632k to Lloyd’s Syndicates 1991 and 3330 which are managed by the Group (2015: £5,438k).
16. Foreign exchange rates
The Group used the following exchange rates to translate foreign currency assets, liabilities, income and expenses into Sterling, being the Group’s presentational currency:
Six months ended 30
June 2016
Six months ended 30
June 2015
Year ended 31 December
2015 £000 £000 £000
Average US dollar 1.43 1.52 1.53 Euro 1.29 1.36 1.37
Spot US dollar 1.34 1.57 1.49

Euro 1.21 1.40 1.38
Independent Review Report to Randall & Quilter Investment Holdings Ltd. for the six months ended 30 June 2016
Introduction We have been engaged by the Company to review the condensed set of Financial Statements in the interim financial report for the six months ended 30 June 2016 which comprise the condensed consolidated income statement, condensed consolidated statement of financial position, condensed consolidated cash flow statement, condensed consolidated statement of comprehensive income, condensed consolidated statement of changes in equity and related notes. We have read the other information contained in the half-yearly financial report and considered whether it contains any apparent misstatements or material inconsistencies with the information in the condensed set of Financial Statements. Directors’ Responsibilities The interim financial report is the responsibility of, and has been approved by, the Directors. The Directors are responsible for preparing the interim financial report in accordance with International Accounting Standard 34, “Interim Financial Reporting”, as adopted by the European Union, and the AIM Rules for Companies. The annual Financial Statements of the Group are prepared in accordance with IFRSs as adopted by the European Union. The condensed set of Financial Statements included in this interim financial report has been prepared in accordance with International Accounting Standard 34, “Interim Financial Reporting”, as adopted by the European Union and the requirements of the AIM Rules for Companies. Our Responsibility Our responsibility is to express to the Company a conclusion on the condensed set of Financial Statements in the interim financial report based on our review. This report, including the conclusion, has been prepared for and only for the Company for the purpose of the AIM Rules for Companies. We do not, in producing this report, accept or assume responsibility for any other purpose to any other person to whom this report is shown or into whose hands it may come save where expressly agreed by our prior consent in writing. Scope of review We conducted our review in accordance with the International Standard on Review Engagements (UK and Ireland) 2410 “Review of Interim Financial Information Performed by the Independent Auditor of the Entity” issued by the Auditing Practices Board for use in the United Kingdom. A review of interim financial information consists of making enquiries, primarily of persons responsible for financial and accounting matters, and applying analytical and other review procedures. We also read the other information contained in the interim financial report and considered whether it contains any apparent misstatements or material inconsistencies with the information in the condensed set of Financial Statements. A review is substantially less in scope than an audit conducted in accordance with International Standards on Auditing (UK and Ireland) and consequently does not enable us to obtain assurance that we would become aware of all significant matters that might be identified in an audit. Accordingly, we do not express an audit opinion. Conclusion Based on our review, nothing has come to our attention that causes us to believe that the condensed set of Financial Statements in the interim financial report for the six months ended 30 June 2016 is not prepared, in all material respects, in accordance with International Accounting Standard 34 as adopted by the European Union and the AIM Rules for Companies. PKF Littlejohn LLP Chartered Accountants Registered Auditor
1 Westferry Circus Canary Wharf London E14 4HD
02 September 2016