randall children’s hospital at legacy emmanuel portland
TRANSCRIPT
Randal Children’s Hospital at Legacy Emmanuel | ZGF
Page 1 of 12
Randall Children’s Hospital at Legacy Emmanuel – Portland, OR Methodology for Landscape Performance Benefits Prepared by: Research Fellow: Roxi Thoren, Associate Professor, University of Oregon Research Assistant: Andrew Louw, MLA/MCRP Candidate, University of Oregon Firm Liaisons: Meghan Spigle, Associate, ZGF Architects and Kim Isaacson, Senior Associate, ZGF Architects
Environmental
Prevents over 6.7 million gallons of stormwater from entering the city’s combined sewer system, saving approximately $1300 in annual storage and pumping costs. This also avoids a projected $26.8 million in future capital costs to upgrade stormwater infrastructure, such as constructing a larger combined sewer overflow (CSO) tunnel.
Used biofiltration and infiltration equation1:
[annual precipitation (inches) * (feature area (sf) + drainage area (sf)] * % of rainfall captured] * 144
sq inches/sf * 0.00433 gal/cubic inch = total runoff reduction (gal) Calculations: Annual precipitation2: 36.06 inches Features area3: 27,914 sf Drainage Area4: 270,081 sf % rainfall captured5: 100% (36.06*(27,914+270,081)*100)*144*0.00433 = 6,700,158.68 gallons or ~6.7 million gallons
The City of Portland recognizes two avoidance costs for incorporating stormwater infiltration strategies with combined sewer systems (CSS). First, the annual operations and maintenance costs to convey stormwater through the existing CSS. The city measures this by applying a rate of $0.0001 per gallon treated and $0.0001 per gallon
1 American Rivers, Center for Neighborhood Technology. 2011. The Value of Green Infrastructure: A Guide to Recognizing Its Economic, Social and Environmental Benefits. http://www.cnt.org/repository/gi-values-guide.pdf 2 "NowData – NOAA Online Weather Data". National Oceanic and Atmospheric Administration. Retrieved 2012-09-12. 3 The feature area includes all the infiltration planters, and includes some paving areas as the spaces between the motarless paving provides some permeability. 4 The drainage area includes all impermeable surfaces within the scope of work including the roof surfaces of the structures on site. 5 This capture rate is based on personal communication with project landscape architect responsible for the project’s storm water calculations.

Randal Children’s Hospital at Legacy Emmanuel | ZGF
Page 2 of 12
pumped. This equates to an annual O&M avoidance cost of $0.0002 per gallon. Secondly, the City recognizes an avoidance future capital cost of stormwater infrastructure. The cost-effectiveness point for projects/programs that remove stormwater volume from the CSS ($4 per gallon) is also considered as the avoidance cost of constructing a larger CSO tunnel.6 Storage and pumping cost avoidance: 6,700,158.68 gallons * 0.0002 dollars/gallon = $1,340.03 or ~$1300 CSO Upgrade cost avoidance: 6,700,158.68 gallons * 4 dollars/gallon = $26,800,634.71 or ~$26.8 million Limitations of Methodology:
Considering evaporation and other hard-to-estimate losses, the estimated % rainfall captured is difficult to accurately estimate.
The multipliers used to calculate cost avoidance are based on long-term estimates for upgrading Portland’s CSO and not specific estimates for this project.
Reduces irrigation needs by 935,500 gallons per year through a native or adapted plant palette, saving $4,300 in annual irrigation costs when compared to a standard lawn.
Total potable water saved from avoiding irrigation costs = water needed for irrigation + water lost from evaporation – water from rainfall water lost from evaporation = average feet inches of evaporation per year * size of irrigation area 3.28 feet – average annual feet of evaporation per year7 26,403 SF – total irrigation area8 Water lost from evaporation = 3.28 feet/year * 26,403 sqft = 86,711 cubic feet/year or 648,649 gallons/year Water needed for irrigation (@ 20 weeks of irrigation at 1 inch per week) = total irrigation area * 20 weeks * 1 inch = 26,403 sqft * 20 week *1 in/sqft/week = 44,005 SF/year or 329,180 gallons/year
6 R.M. Roseen, T.V. Janeski, J.J. Houle, et al. Forging the Link: Linking the Economic Benefits of Low Impact Development and Community Decision. University of New Hampshire Stormwater Center, Virginia Commonwealth University, and Antioch University New England. July 2011 http://www.unh.edu/unhsc/sites/unh.edu.unhsc/files/docs/FTL_Chapter3%20LR.pdf in American Rivers, the Water Environment Federation, the American Society of Landscape Architects and ECONorthwest. 2012. Banking on Green: A Look at How Green Infrastructure Can Save Municipalities Money and Provide Economic Benefits Community-wide. http://www.asla.org/uploadedFiles/CMS/Government_Affairs/Federal_Government_Affairs/Banking%20on%20Green%20HighRes.pdf 7 http://www.usbr.gov/pn/agrimet/monthlyet.html 8 Total irrigation area includes all vegetated areas.

Randal Children’s Hospital at Legacy Emmanuel | ZGF
Page 3 of 12
Water from rainfall = average annual rainfall * total drainage area = 36.06 in/year * 271,592 sf = 42,396 gallons/year
Total potable water saved from avoiding irrigation costs = 648,649 gallons/year + 329,180 gallons/year -42,396 gallons/year = 935,434 gallons/year or ~ 935,500 gallons/year City of Portland Portable Water Cost9 = $3.44 / CCF (hundred cubic feet) 935,500 gallons / 748 = 1250.58 CCF 1250.58 CCF * $3.44 = $4301.99 or ~ $ 4300 Species numbers and percent of natives were pulled from the 100% construction drawing planting schedule.
It is worth noting that alongside areas of the site with a native plant palette, some parts of the site are turf, due to their function as active play spaces for children. For example, the wave forms (pictured) are clad in artificial turf due to the heavy use this feature receives. Regular turf would have required too much maintenance/replacement due to the feature’s popularity.
Limitations of Methodology:
This comparison assumes a typical irrigation need for a lawn of 1 inch/week
Cost avoidance estimates are based on a 20-week irrigation period at 1 inch of rain per square feet per week. In reality this this will fluctuate in time and amount of rainfall based on weather conditions.
Water loss through evaporation will fluctuate from year to year based on weather conditions.
Reduces total suspended solids (TSS) in stormwater runoff by an average of 92%. This is 22% above the minimum required by the City of Portland 2008 Stormwater Management Manual.
CSI researchers collected water samples from undisturbed water on two occasions on the day following two separate rain events. One sample was collected where water entered the filtration system and another where it exited the filtration system. The following lab method was used to measure the TSS of the samples. Method10:
1. Prepared glass fiber filters by first soaking them in distilled water, drying them at 103o C, and weighing and recording their weights.
2. Placed the dried, weighed glass fiber filter onto a filtering flask. Shook the sample bottle before pouring in the water and turned on the pump. (The amount of water needed varied depending on the water conditions. I typically used 100 mL) Recorded the volume of water filtered.
3. Dried the filter at 103 to 105o C and let it cool to room temperature to weigh it. I
9 http://www.portlandoregon.gov/water/29415 10 American Public Health Association, American Water Works Association, and Water Environment Federation. 1998. Standard Methods for the Examination of Water and Wastewater. American Public Health Association, Washington, D.C.

Randal Children’s Hospital at Legacy Emmanuel | ZGF
Page 4 of 12
repeated this process until the fiber reached a constant weight. Recorded the end weight.
4. Calculated TSS by using the equation below.
TSS (mg/L) = ([End weight of the filter - Initial weight of the filter]*1000) / Volume of water filtered
Summary of Results:
TSS (mg/L)
Sample A - Enter Location 106.11
Sample A - Exit Location 10.74
Sample B - Enter Location 165.71
Sample B - Exit Location 8.74
Sample A Reduction 89.88%
Sample B Reduction 94.73%
Average Reduction 92%
The two samples were averaged for final results of a 92% reduction of TSS The 92% reduction is 22% above the 70% minimum required by the City of Portland 2008 Stormwater Management Manual and 12% above the 80% minimum required by the Green Guide for Health Care. Although flow-control was not required for the project per the Stormwater Management Manual, facilities are sized to accommodate post-development flow-rates consistent with a 10-year storm event.
Limitations of Methodology:
This Benefit was derived from a limited number of samples. Collecting more samples from varying storm sizes and at different times of year (and thus maturity of vegetation) may impact the TSS removal rate.
Stores 5263 pounds of carbon and sequesters 973 pounds of carbon per year in 206 new trees on-site and adjacent to the site. Utilized i-Tree Eco v5 and data collected on site. See table 1 for calculations.
Limitations of Methodology:
Carbon storage and sequestration estimates do not include non-tree vegetation
Carbon storage and sequestration will vary with annual weather fluctuations

Randal Children’s Hospital at Legacy Emmanuel | ZGF
Page 5 of 12
Social Contributes to a reduction in nurse stress. Six months after moving into the new facility, when asked whether they felt stress from: “watching a patient suffer,” “feeling inadequately prepared to help with the emotional needs of a patient,” and “experiencing unpredictable staffing and scheduling,” 42% of nurses answered agreed or strongly agreed. Six months before the move into the same facility, 56% of the same respondents agreed or strongly agreed.
Table 1. Randall Children’s Hospital Carbon Storage and Sequestration

Randal Children’s Hospital at Legacy Emmanuel | ZGF
Page 6 of 12
Researchers utilized anonymous survey data collected by Carrie Binder (PI) for the “Children’s Hospital Nursing Stress Study.” Randall Children’s Hospital (RCH) Nurses were surveyed four times. Six months before the move to the new facility, six week before the move, six week after the move, and six months after the move. The aim of the survey was to capture the level of stress felt by nursing staff during a significant transition and to observe how a significant change of environment affects patient outcomes. Survey protocol available upon request. Limitations of Methodology:
This Benefit is described as contributing to decreased nurse stress (as opposed to independently decreasing nurse stress) given that other factors beyond the landscape changed between the first and second surveys.
Provides outdoor recreational space for patients, with an average of 40 patients and 25% of visitors using outdoor spaces each day. 23% of out-patients observed and 54% of in-patients observed utilized outdoor play facilities in the terrace or courtyard. 92% of this play activity induced social activity.
Provides outdoor spaces for staff use. On average, 3% of staff members per day (in the summer months) used the terrace or courtyard areas for necessary (work-related) activities. 6% (on average during summer months) use the staff terrace area daily for optional (recreational) activities. Researchers collected data on-site in summer 2013 using the Public Space, Public Life (PSPL) survey method developed by Jan Gehl11. The PSPL survey method includes both bicycle/pedestrian counts and a stationary survey. Park users were observed on three separate site visits during summer 2013 (two week days and one weekend day), with the researcher collecting information about use duration and time, user age, gender, purpose (recreation or work), type of activity (necessary, optional, social), position (sit/stand), location within the space, in/out patient/visitor status.
Necessary activities include those things that people would do regardless of the quality of the space. For example, the mail carrier will deliver the package; the business executive will walk to her office. Optional activities these are those activities that people choose to do and—importantly— choose where they do them, such as sitting in a sunny place to eat lunch or reading a book. Social activities occur when people interact spontaneously when they are engaging in necessary or optional activities. Gehl shows that more successful public spaces have a higher number of optional and social activities.
Pedestrian/bicycle counts (including direction) were collected on all four edges of the park (on both park sidewalk and adjacent sidewalk). Each observation period was 6 hours long.
Benefits of methodology:
Offers potentially compelling metrics about social performance
Accepted as rigorous method by professional and academics
Does not require IRB review
Offers valuable learning for Research Assistants
Data can be collected remotely or by groups
Results are objective
11 Gehl, Jan. 1971. Life Between Buildings: Using Public Space. Arkitektens Forlg.

Randal Children’s Hospital at Legacy Emmanuel | ZGF
Page 7 of 12
Limitations of Methodology:
Absence of baseline data means data from such a short-term study has questionable statistical power
Data collection is time intensive (although this can be reduced through group work)
Objective outcomes are not always positive (i.e. – benefits)
Economic Contributes to improved neighborhood property values, with home values increasing after the opening of the hospital, in comparison to a decrease within the same census tract. Since opening at the end of 2011, the land value of properties within a half-block of the campus increased 10% and their assessed value increased 7%. Between 2009 and 2010 the land value of these same properties increased only 7% and their assessed value decreased 8%. Between 2009 and 2011, the average assessed value in this census tract decreased 2% while land value increased 3%.
Figure 1. Randall Children’s Hospital Economic Assessment Area

Randal Children’s Hospital at Legacy Emmanuel | ZGF
Page 8 of 12
Using an assessment boundary definition of half a block (see above), researchers used assessors’ data from the City of Portland12 to determine for the site property and the adjacent property (within a half black radius of the entire campus). This was benchmarked against the Google real estate index13. Since opening at the end of 2011, the land value of properties within a half-block of the campus increased 10% and their assessed value increased 7%. Between 2009 and 2010, the land value of these same properties increased only 7% and their assessed value decreased 8%. For context, between 2009 and 2011 the average assessed value in this census tract decreased 2% while land value increased 3%. Limitations of Methodology:
The data does not allow us to separate out the impacts to property value of the landscape, circulation, and entry improvements alone. Much of this change can be attributable to the new hospital buildings.
The dataset is based on the period 1997 through 2012. This is a relatively short period for a statistically powerful economic analysis.
The project period coincided with a greatest economic downturn in over 40 years, making an objective analysis more challenging.
Cost Comparison Methodology Stormwater on the Randall Children’s Hospital campus is managed with bioretention planters. Nineteen stormwater basins filter and slowly release stormwater into municipal pipes with no pumping or expensive mechanical pollution reduction mechanisms. A cost analysis comparing use of a filtration manhole and stormwater pipe versus installation of 2,400 sf of bioretention planters to treat stormwater runoff from a 48,000-sf garage roof shows an upfront savings of $13,000 in hard costs. Additionally, roughly $900 is saved each year in maintenance costs associated with the manual inspection and cleaning of the manhole filter. Naturalized bioretention planting systems cost between $0.50 and $1 per treated cubic foot of water while traditional sand filter systems range between $3 and $6 per treated cubic foot. Therefore, installing a mechanical treatment system at Randall Children’s Hospital could have cost up to 6 times more than the bioretention system. Extrapolating this analysis across the campus improvements leads to an estimated cost saving of over $4.4 million. Similarly, annual operation costs of the mechanical treatment system are 13 times higher than that of the bioretention planting system, leading to an estimated project-wide annual savings of $650,000. This low-cost, localized solution also saves money ‘downstream’ for the City of Portland due to reduced water volumes and increased stormwater quality being discharged into the municipal system. Method:
Used biofiltration and infiltration equation14:
12 http://www.portlandmaps.com/ 13 https://www.google.com/finance?cid=2055260 14 American Rivers, Center for Neighborhood Technology. 2011. The Value of Green
Randal Children’s Hospital at Legacy Emmanuel | ZGF
Page 9 of 12
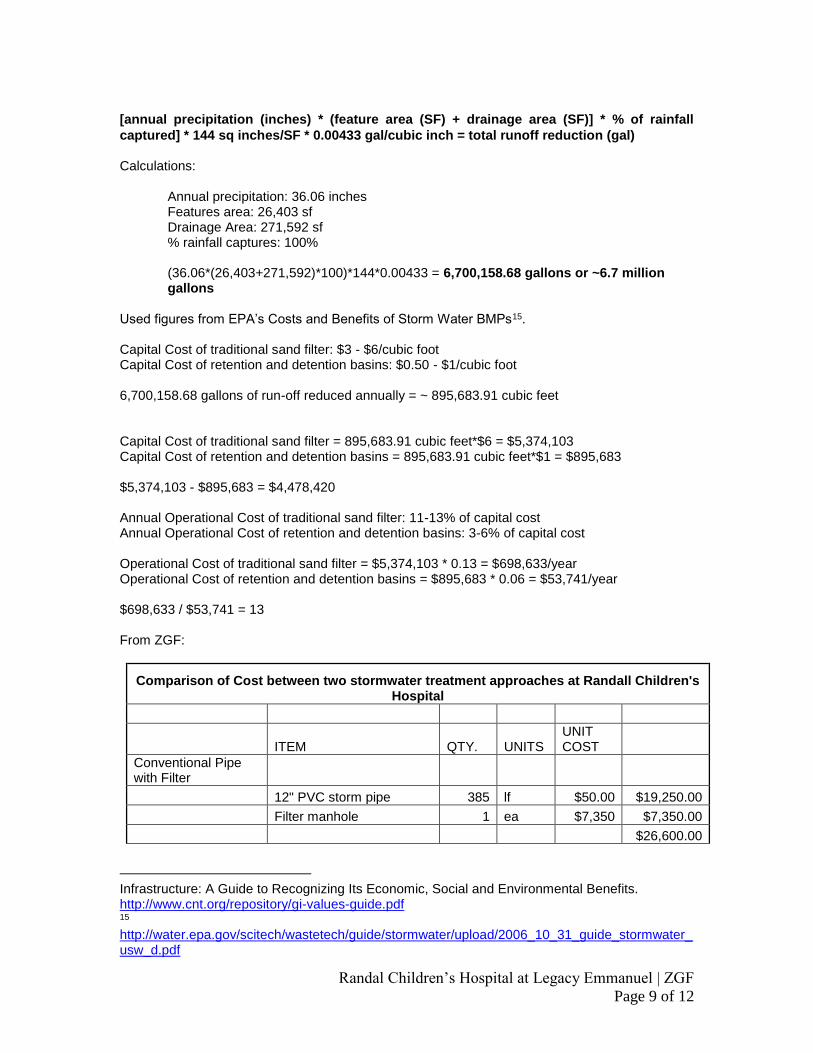
[annual precipitation (inches) * (feature area (SF) + drainage area (SF)] * % of rainfall
captured] * 144 sq inches/SF * 0.00433 gal/cubic inch = total runoff reduction (gal)
Calculations: Annual precipitation: 36.06 inches Features area: 26,403 sf Drainage Area: 271,592 sf % rainfall captures: 100% (36.06*(26,403+271,592)*100)*144*0.00433 = 6,700,158.68 gallons or ~6.7 million gallons
Used figures from EPA’s Costs and Benefits of Storm Water BMPs15. Capital Cost of traditional sand filter: $3 - $6/cubic foot Capital Cost of retention and detention basins: $0.50 - $1/cubic foot 6,700,158.68 gallons of run-off reduced annually = ~ 895,683.91 cubic feet Capital Cost of traditional sand filter = 895,683.91 cubic feet*$6 = $5,374,103 Capital Cost of retention and detention basins = 895,683.91 cubic feet*$1 = $895,683 $5,374,103 - $895,683 = $4,478,420 Annual Operational Cost of traditional sand filter: 11-13% of capital cost Annual Operational Cost of retention and detention basins: 3-6% of capital cost Operational Cost of traditional sand filter = $5,374,103 * 0.13 = $698,633/year Operational Cost of retention and detention basins = $895,683 * 0.06 = $53,741/year $698,633 / $53,741 = 13 From ZGF:
Comparison of Cost between two stormwater treatment approaches at Randall Children's Hospital
ITEM QTY. UNITS UNIT COST
Conventional Pipe with Filter
12" PVC storm pipe 385 lf $50.00 $19,250.00
Filter manhole 1 ea $7,350 $7,350.00
$26,600.00
Infrastructure: A Guide to Recognizing Its Economic, Social and Environmental Benefits. http://www.cnt.org/repository/gi-values-guide.pdf 15 http://water.epa.gov/scitech/wastetech/guide/stormwater/upload/2006_10_31_guide_stormwater_usw_d.pdf

Randal Children’s Hospital at Legacy Emmanuel | ZGF
Page 10 of 12
Landscape Filtration
12" PVC storm pipe 164 lf $50.00 $8,200.00
Premium for stormwater landscape 2400 sf $2.00 $4,800.00
$13,000.00
Additional Information on the Green Guide for Health Care (GGHC) The Randall Children’s Hospital design incorporates many sustainable design strategies and follows The Green Guide for Health Care” (GGHC) as a primary metric and checklist to help gauge and direct sustainable design. The GGHC was selected because it is a widely used and accepted barometer of sustainability practice for medical facilities that is based on LEED, but specific to the special needs of medical facilities. GGHC has a broad focus that includes design, construction, and future operations of the facility. The design met minimum requirements for the following credits: site selection, Development Density & Community Connectivity, alternative transportation, site development, stormwater design, connection to the natural world, community containment prevention.
Site selection
Development Density & Community Connectivity
o Construct or renovate building on a previously developed site AND in a community with a minimum density of 60,000 square feet per acre net
Alternative Transportation o Public Transportation Access: Locate project within 1/2 mile of an existing, or
planned and funded, commuter rail, light rail or subway station. o Bicycle Storage & Changing Rooms: For institutional buildings, provide secure
bicycle racks and/or storage (within 200 yards of a building entrance) for 3% or more of peak building day shift staff, AND, provide shower and changing facilities in the building, or within 200 yards of a building entrance, for 0.5% of peak building day shift staff.
o Parking Capacity: Size parking capacity to meet, but not exceed, minimum local zoning requirements OR health department regulatory authority, whichever is the overriding requirement, AND provide preferred parking for carpools or vanpools for 5% of the total provided parking spaces.
Site Development o Protect or Restore Open Space or Habitat: On both greenfield and previously
developed sites, limit all site disturbance including earthwork and clearing of vegetation to 40 feet beyond the building perimeter, 10 feet beyond surface walkways, patios, surface parking and utilities greater than 12 inches in diameter; and, 15 feet beyond primary roadway curbs and main utility branch trenches. Implement measures to avoid reducing the permeability of the sub-surface below a future permeable lot (such as pervious paving areas, stormwater detention facilities and playing fields).

Randal Children’s Hospital at Legacy Emmanuel | ZGF
Page 11 of 12
AND
• On both greenfield and previously developed sites, protect or restore natural habitat area as follows: Natural Habitat Area Required = (Site Area) (.15 – Site Size Factor) ÷ (Floor Space Ratio)
For the above formula: Floor Space Ratio = the constructed building gross floor building area including all service spaces, excluding parking areas, divided by the site area. Site Size
Factor = (⎷Site Area/Site Area)(10)
o Reduce Development Footprint Achieve GGHC SS Credit 5.1 AND On both greenfield and previously developed sites, limit the minimum building footprint to the square root of Gross Floor Area x 250 Structured Parking Achieve GGHC SS Credit 5.1 AND Provide structured parking for 50% or more of total parking spaces. A minimum of 100 spaces must be provided in structured parking to achieve this credit.
Stormwater
o Quantity Control OPTION 2 – EXISTING IMPERVIOUSNESS IS GREATER THAN 50% Implement a stormwater management plan that results in a 25% decrease in the volume of stormwater run-off from the two- (2) year, 24-hour design storm.
o Quality Control Implement a stormwater management plan that reduces impervious cover, promotes infiltration, and captures and treats the stormwater runoff from 90% of the average rainfall1 using acceptable best management practices (BMPs).
• BMPs used to treat runoff must be capable of removing 80% of the average annual post development total suspended solids (TSS) load based on existing monitoring reports. BMPs are considered to meet these criteria if: (1) they are designed in accordance with standards and specifications from a state or local program that has adopted these performance standards;, or (2) there exists in-field performance monitoring data demonstrating compliance with the criteria. Data must conform to an accepted protocol (e.g., Technology Acceptance Reciprocity Partnership [TARP], Washington State Department of Ecology) for BMP monitoring.
Connection to the Natural World o Outdoor places of respite: Provide patient, staff, and visitor accessible
outdoor places of respite at 5% of the net usable program area. Qualifying spaces should be universally accessible and provide a variety of seating areas for both ambulatory and wheelchair users and provide additional

Randal Children’s Hospital at Legacy Emmanuel | ZGF
Page 12 of 12
dedicated outdoor place(s) of respite for staff at 2% of the net usable program area.
o Exterior Access for Patients: Provide direct access to an exterior courtyard, terrace or balcony with a minimum area of 5 square feet/patient served for 75% of all inpatients and 75% of qualifying outpatients with clinical length of stay (LOS) greater than 4 hours.
• Design balcony edges to ensure patient safety. • Include exterior areas in the credit calculation only if their vegetated areas (including planters) use a non-potable water irrigation system, a high-efficiency irrigation system, or no permanent irrigation system. • Patients with LOS > 4hrs whose treatment restricts their ability to move, such as patients in Emergency, Stage 1 surgical recovery, and critical care, may be excluded. • Qualifying outpatients may include Outpatient Renal Dialysis, Chemotherapy, Ambulatory Surgery Intake, and Stage 2 Recovery. • Direct access to outdoor places of respite, as defined by GGHC SS Credit 9.1, may be used to meet this goal.