raman modes of yba2cu3ox with variable content
TRANSCRIPT

Physica C 181 (1991) 37-44 North-Holland PHYSICA @
Raman modes of YBa2Cu3Ox with variable oxygen content
Gera ld Burns, F.H. Dacol , C. Feild and F. Hol tzberg IBM Research Division, T.J. Watson Research Center, Yorktown Heights, NY 10598-0218, USA
Received 27 June 1991 Revised manuscript received 29 July 1991
We have measured the Raman spectra of single crystals of YBa2Cu3OT_6 as a function of oxygen concentration, that is Y 123- Ox, where x varies from approximately 7 (superconducting) to 6 (insulating). We have made similar measurements on single crystals of Sm 123, Gd 123, and Ho 123. The experimental results from all of these single crystals are very similar. Our single crystal results are in distinct disagreement with experimental results on ceramics of these same materials. For x = 7 the usual five, c-axis polarized modes are observed; mode ~5 occurs at ~ 500 cm-~ and is primarily due to motion of oxygen atoms in the four-coor- dinated Cu chain. At oxygen contents near the metal- insulator (M- I ) phase transition, the intensity of mode ~5 rapidly decreases and disappears, being replaced by a strongly (zz) polarized mode at ~ 600 c m - ~. We assign the 600 c m - ~ mode to oxygen atom vibration in the two-coordinated Cu "sticks". At the oxygen content near the M-I phase transition, other weaker lower-energy modes appear and these are discussed. However, these modes disappear for oxygen content x.~ 6, where the appropriate number of symmetry allowed modes (five) is again observed.
We believe that our results explain the "drastic difference" in the neutron-measured phonon density of states between x = 6 and x = 7. Much of the difference in phonon frequencies is not due to a decrease in the force constants in going from x = 6, to x = 7, but is due to phonon differences resulting from the coordination changes of the chain-Cu atoms. Other effects that occur near the M-I phase transition are discussed. Only some of these effects are in agreement with the Ortho II model.
I. Introduction
Recently, considerable interest has been stimu- lated by results of inelastic neutron measurements on YBa2Cu307_6, (Y123-Ox). The change in the phonon density of states of the insulator (Y 123-06 ) compared to the superconductor (Y123-O7) has been thought of as a indication of a general softening of the high-energy phonon modes [ 1 ] due to the me- tallic phase. The generalized phonon density of states versus energy is reproduced in fig. 1. The two rele- vant structures are represented in fig. 2. Phonon softening, if it did occur in the metallic phase, might account for the high superconducting critical temperature.
Most publications [2] describing the Raman modes in Y123-O7 are in reasonably good agree- ment. There have been fewer reports on Y123-O6 and material with intermediate (between 6 and 7) oxygen content. The Raman spectra on Y123-Ox (intermediate oxygen content) have been generally measured on compressed pellets. A common aspect
of these results [2,3] is the continuous frequency variation for all of the modes as a function of oxygen content. In an earlier paper [4] we reported on Ra- man measurements on single crystal Y 123 as a func- tion of oxygen content. On the basis of the latter re- suits, this paper questions the current interpretation of the neutron data and extends the Raman mea- surements to single crystals of other rare earth sys- tems (Sm123, Gd123 and Ho123).
2.Experimental
The Y 123 and other RE 123 crystals were prepared by methods already described [5,6]. The samples were annealed under flowing O2, first at 600 ° C, fol- lowed for 10 days at 420 ° C, and then furnace-cooled. The oxygenated crystals have sharp superconducting transitions at T¢=93 K and up to 94.3 K for the Gd123 crystals based on AC susceptibility. Crystals with intermediate oxygen content were obtained by annealing in helium gas as described in ref. [4 ]. The
0921-4534/91/$03.50 © 1991 Elsevier Science Publishers B.V. All rights reserved.

38 G. Burns et al. / R a m a n modes o / YBaeCu,O,
7 ~ 2
%
x 1
"6
0 0
cm- I
80 161 242 324 403 484 565 645 726 i i i i
~ YBa2Cu307 Tc = 92 K
YBa?Cu306 No Tc
I i I I I I [ I 20 40 60 80 100
onal notation or 5A~ in the orthorhombic notation [2,7]. We use the former for convenience. The mo- tion can be described as principally involving the fol- lowing (in ascending order of frequency), using the notation in fig. 2:
~#1 Ba-Ba motion
~2 C u p - C u p motion
g3 Op atoms only (Big)
g4 O~-Op motion
~5 O,-O: motion
(1)
E (meV)
Fig. 1. Generalized phonon density of states vs. energy [ 1 ] in the insulating phase, Y123-06, and superconducting phase Y123- Or, as indicated. The four small vertical lines are mentioned in
the discussion section.
dependence of oxygen content on annealing temper- ature under helium will be discussed later. We need only consider Raman active modes with atomic mo- tion along the c-axis because only these are readily observed. There are 4Alg+B~g modes in the tetrag-
3. Results
Using single crystals, we have measured the Ra- man spectra at intermediate oxygen contents and find results in sharp disagreement with compressed pellet results [3]. Our single crystal results are shown in fig. 3 for Y123-O,. For 07 (fig. 3(a)) the spectra are similar to those found by others [ 2 ]. The modes ~1, ..., ~5 are labeled to conform to the notation given above. As oxygen is removed from the sample, mode ~5 decreases, while mode #4 increases in frequency,
~ / Cup ~ ' Op
Oz Oz
Oc(b) L ~ Cuc Cuc
b kd V (a) (b)
Fig. 2. A structural representation of: (a) orthorhombic Y 123-07: (b) tetragonal Y 123-O6. The atoms are labeled in a descriptive m a n n e r .
G. Burns et al. / Raman modes of YBa2Cu30x 39
1 2
1 0
r D 0
° _
~ 4
.c g 2 E
0 0
t i i i
YBa2Cu3OT.~ - Y 123-Ox J P x(zz)x
~ #1 I ~ ) ( a ) 0 7 "1117 / (To - 93 K) #4
~ ] k / 446) •
I I I I
i ( b ) ~ 06.4 [
k~i 126 ( T c ' 3 8 K ) [
I I I t
#5 504
I 487
I I
(c) ~ 06.3 p (Not SC)
q l 2 7 141 458483 554)
1 I I I I
(d) ~ 06 (Not SC)
#1 #2 /
602
k,
600
I I I I I
2 0 0 4 0 0 6 0 0
Energy shift (cm -1)
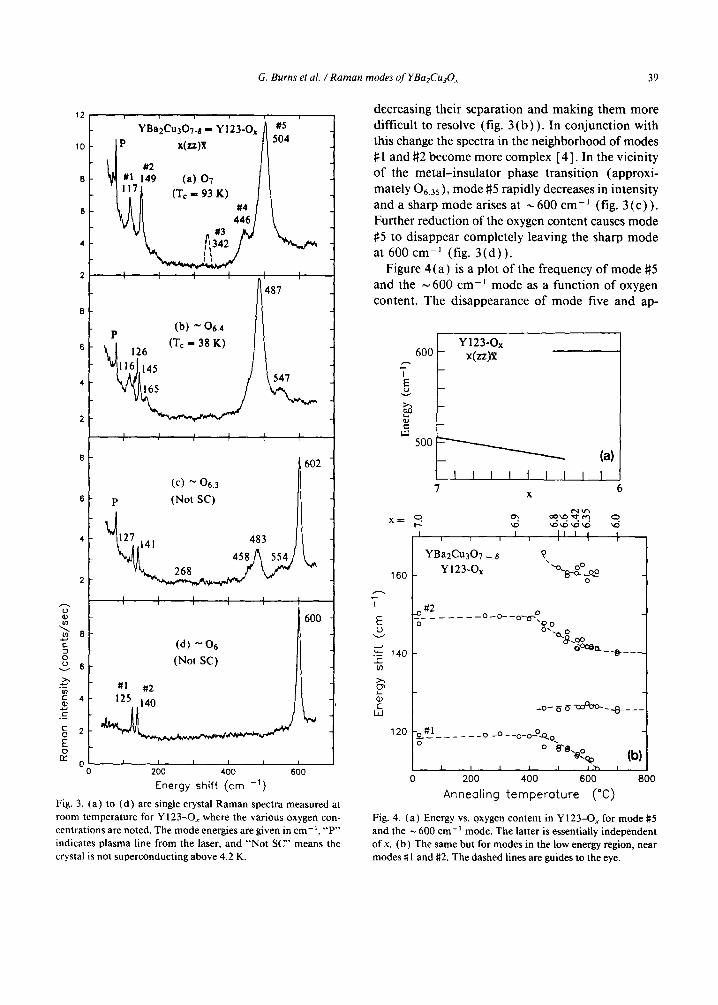
Fig. 3. (a) to (d) are single crystal Raman spectra measured at room temperature for YI23-Ox where the various oxygen con- centrations are noted. The mode energies are given in cm- t, "P" indicates plasma line from the laser, and "Not SC" means the crystal is not superconducting above 4.2 K.
decreasing their separation and making them more difficult to resolve (fig. 3 (b) ). In conjunction with this change the spectra in the neighborhood of modes #1 and #2 become more complex [4]. In the vicinity o f the metal-insulator phase transition (approxi- mately O 6 . 3 5 ) , mode #5 rapidly decreases in intensity and a sharp mode arises at ~ 6 0 0 cm - l (fig. 3 (c ) ) . Further reduction of the oxygen content causes mode #5 to disappear completely leaving the sharp mode at 600 cm -~ (fig. 3 ( d ) ) .
Figure 4 (a ) is a plot of the frequency of mode #5 and the ~ 600 cm-~ mode as a function o f oxygen content. The disappearance of mode five and ap-
I
E
t"- tO
E l . J
i YI23-Ox 600 - x(zz)~ _.-.. I
5O0
I t t I I q f I
(a)
I 7
X= c~. r - -
i i i
YBa2Cu307 _ 8 160 Y123-Ox
6 X
I l l J l I ?
"0 0 0 "8-o- oo
o
140
L" o
...... 0 --o- - O-O~°Q o
o - "0.~ ~0o
- o-OO~¢L_ .@___
..o- ~ ~ -oo°oo-__O____
120 # I . . . . . . . . o _o __o_o-.°.O.o o o "~-0.~
(b) I I I I I I ~ I
0 200 400 600 800
Annealing temperature (*C)
Fig. 4. (a) Energy vs. oxygen content in Y123-Ox for mode ~5 and the ~ 600 cm- ~ mode. The latter is essentially independent ofx. (b) The same but for modes in the low energy region, near modes #1 and #2. The dashed lines are guides to the eye.

40 G. Burns el al. / Raman mo&~s oI YBa:( "u~O,
pearance of the mode at ~ 600 cm ~ (fig. 3 (c) and ( d ) ) dist inguish these single crystal spectra from pressed pellet results. There is a small feature in some of the pressed pellet spectra [2,3] that could be in- terpreted as arising from this highest energy mode.
Figure 5 ( a ) shows this same .v(zz).f spectra for other rare-ear th-O6 single crystals; the top spectra is for an Y123-O7 superconduct ing crystal for com- parison. As can be seen, all of the rare-ear th123-O~ crystals show essentially the same result ( i.e. the loss of mode #5 and the appearance of a sharply defined ~ 6 0 0 cm-~ mode) . Further, all of the rare-earth crystal spectra, at in termedia te oxygen content , are essentially the same as that shown for Y123-O , in fig. 3.
Since the exper imental results for O~, from the sin- gle crystals are different fi'om pressed pellet results, we want to de termine if all o f the allowed Raman modes are obsmwed in the single crystals. For hoH1
Y 1 2 3 - O : and Y123-O~, there are only five allowed Raman-ac t ive modes for mot ion-along the c-axis [2,7]. This is because the chain-oxygen atom, O~ (b) in fig. 2 ( a ) , is at a center of inversion and does not vibrate in the Raman active modes [7] . Hence, ils occurrence in the structure does not effect the count of the Raman modes. Figure 5 (b ) shows : ( . v v ) : re- suits for rare-earth-O6 single cry. stals compared to the spectra for the Y123-O7 superconductor shown at the top of the figure. As can be seen from figs. 5 ( a ) and 5 (b) , in Y 123-O6 all five allowed modes are ob- served. Modes #1, #2, and the one at ~600 cm have considerable intensi ty for .v(z:).*: polar izat ion (fig. 5 ( a ) ) , and modes {¢2, #3, and ~4 are observed for : ( x x ) z polar izat ion. Thus, the proper number of modes are observed in Y123-O6 as in Y123-O: .
4. Discussion
(1) The appearances of the ~ 6 0 0 cm -J in Line Y123-O6 and the d isappearance of mode #5 ( ~ 500 e m - ' , fig. 4 ( a ) ) is one of the surprising results of this work. These results are in sharp disagreement with many publ ished Raman results from pressed pellets [2,3]. The "'new" mode at 600 cm -~ can be readily understood. In the O~ insulator, the highest energy vibra t ion is due to mot ion of the apical ox- ygens O, in fig. 2 ( a ) , v ibrat ing against a s tat ionary
chain Cu,. Of course, this is just the O,-( 'u~.- t L vi- brat ion of the two-coordinated Cu,. "'sticks". On the other hand, the highest energy mode in the super- conductor Y I 2 3 - O : is ~5 due to the same type (), v ibrat ions (cq. 1 ), but in this case the O, a toms arc pan of four-coordinated ('u~ "'chains". To us it secms unlikely to cont inuously vary the frequency of these O, vibrations, while they are part of a four-coordi- nated and part of a two-coordinated Cu configura- tion. The (),-Cut. distances are very different, being - 1 . 9 4 ,4 and -1 .81 .,~ in the chains and sticks, respectively.
It is interesting to note thal thai the superconduc- tor PbeSreYCu~Os has a s imilar O - C u - O stick ar- rangemenl [8] and an intense Raman mode [O] ill 5 7 7 c m ~,which is close to the 600 cm ~ value that we find in Y123-O,,.
(2) Prel iminary single crystal inelastic ncutron diffract ion measurements [10] on Y123-O,, find a mode of ,4q~ symmetry at ~ 600 cm J. Further, in the neutron work, no features were observed at - 501/ cm ~. contrary to Raman observat ions on pressed pellets [2,3]. The neutron results on the other hand are in complete agreement with our Raman single crystal data.
( 3 ) One of the objects of this work was an a t tempt to unders tand the changes in the neutron phonon densi ty of states shown in fig. I. We can now un- ders tand the difference between the high energy part of the phonon density of states of Y 123-()~, and thc shift to lower energy in Y123-O: .
In the insulator Y123-O~,. the highest energy Ra- man mode is ~ 600 cm ' and the highest energy in- frared ( IR) mode [ 11 ], which is due to the O, -Cu , stretch, occurs at 648 cm ~. Both of these modes arc indicated by short vertical lines in the middle of fig. 1.
In the superconductor Y123-O> the highest en- ergy Raman mode is - 500 cm ~ and the highest en- ergy IR mode [ 12] occurs at 577 cm '. Both of these frequencies are indicated by short vertical dashed lines in the lower part of fig. 1. Thus, for both the insulator and superconductor it is just the apical ox- ygen O, a tom vibrat ions along the c-axis that are m the highest frequency range of the phonon density of states.
The difference between the phonon density of states for the insulator and superconductor Y123

G. Burns et aL / Raman modes of YBa2Cu30~ 41
8
%-
54 0
e~ 4 c
.c_ c 2
E
0 0
i " i i i
Sulmreonductor #5 (To - 93 K)
x(zz)X 23"C
I t i I 11 .#2
#,, IA #,
Y 1 2 3 - 0 7 i l
I'j~ I I I I ' I f l t l Insulators II II x ( z z ) ~ 23"C I t
i i
I | i t
II "
i t II I J I I
I I I I f I I I
200 400 600
Energy sh i f t ( c m - 1 )
!
(a)
%
L
10
5
2
I
10
8
"3" (/I
~6 o
~4
r-
C7 n-
O
i
#1
#3
Superconductor ( b ) - (Tc = 93 K )
z(xx)~. 2 3 " C
Y!23 - 07
I
I I I I i
20O 400
Energy shift (cm -1) 600
Fig. 5. ( a ) and (b ) show x(zz).¢ and z(xx)g polar ized R a m a n spectra, respectively. The top mos t panel is for superconduc t ing Y 1 2 3 -
07, as indica ted , and the modes are labeled #1, ... $5 as discussed in the text. The rest o f the results are for insulat ing, 06, crystals o f Y123 and other RE 123 as labeled. The modes are now labeled # 1, ..., #4 and the mode at ~ 600 c m - ~ is the fifth, a l lowed model .
shown in fig. 1 stems from the difference in fre- quency found for the Oz vibrations in two-coordi- nated and four-coordinated Cu sticks and chains, re-
spectively. Thus, the difference in the phonon density o f states is not due to some general softening of the force constants. Rather, it is due to the particular fre-

42 G. Burns et al. / Raman modes o[ YBa2Cu30,
quency change resulting from a coordination change, as described in this paper. However, we must remind the reader that, whatever the cause, the average force constants do decrease (fig. 1 ).
(4) It is clear that the spectra for the other rare- earth123-O6 can be interpreted in the same way as those of Y123. The fact that the mode at ~ 600 c m - varies by only a few cm 1 with rare earth substitu- tion is not surprising; the frequency is determined by' the two-coordinated C u - O stick distance, which should be insensitive to the size of the atom on the Y site.
(5) Another unusual result from these measure- ments is the drastic changes of intensity that occur in the Raman spectra when the Y123 crystals are in the metallic versus the insulating phase. The changes can be seen in figs. 5(a) and 5(b) for the two Ra- man polarizations.
In ( x x ) polarization (fig. 5 ( b ) ) , all of the modes are observable on the metallic side, while on the in- sulating side only modes ~2, ~3, and ~4 can be seen, where ~2 has a large relative intensity increase. Mode ~1 is not observable, while g5 does not exist, but its replacement mode, as ~ 600 cm-~, is also not ob- servable in this polarization. The three observable modes all arise from motion of atoms that are in the planes, while those that are no longer observable come from atoms that are off the planes (Ba and O,). By helium annealing the crystals at different tem- peratures, we can vary the oxygen content [ 13 ]. Then by measuring these spectra as a function o f oxygen content, we find that these spectral changes take place at the metal- insulator transition, which also can be monitored by T,. measurements.
In ( zz ) polarization (fig. 5 ( a ) ) , the four group theoretically allowed modes [2,7 ] are observable on the metallic side, while on the insulating side only the ~2, g3, and ~ 600 cm-~ modes are observable.
The neutron diffraction structural data [ 14,15 ] for Y123 as a function o f oxygen content are useful to help understand these results. The neutron work shows that some of the interatomic distances change fairly abruptly at the metal- insulator phase transi- tion, at approximately Y123-O6.35. In going from a metal to an insulator, the important distance changes are: Cuc-Oz becomes smaller; Cup-Oz becomes quite a bit larger; Ba-Oz becomes somewhat larger or equivalently Ba-Op becomes somewhat smaller; rel- atively little happens to the C u - O planes. Thus, to
a first approximation, distances between the two im- mediately adjacent C u - O planes (with the Y plane in between) are fairly constant at the metal-insu- lator phase transition, while the distance of these two C u - O planes to the Cuc-O~ atoms increases consid- erably. In other words, when the chains become lin- ear Oz-Cuc-Oz sticks, there is a distinct distance in- crease between the planes and sticks [14,15].
Rashba and colleagues [ 16-18 ] have analyzed the A~g Raman line intensities from Y123. They con- clude [ 16-18 ] that changes o f the intensity of the (zz) polarized lines are due to changes in overlap of the Cuc and Oz electronic wave functions with the wave functions of the atoms in the planes. Of course, the large changes in the interatomic distance occur at the M- I (metal- insulator) transition, as dis- cussed above. Thus, their analysis appears to be con- sistent with our data (fig. 5).
(6) It is not clear to us why the Raman measure- ments of Y 123-0 , , for x ~ 6,0 pressed pellets, give results [2,3] so different from our single crystal spectra. However, an observation is offered that may clarify the differences.
We have studied [ 19 ] the Raman spectra o f Y 123- O, in ~ 0.5 lam films with the c-axis in the plane of the film. This film orientation allows (zz) spectral observations. On the metal side of the metal-insu- lator phase transition, the results ae similar to our single crystal results (figs. 3(a) and (b ) ) . However, on the insulator side, for (zz) polarization, most of the green laser light penetrates the 0.5 ~tm thick film causing us to observe intense second-order Raman spectrum from the SrTiO3 substrate. On the insu- lating side of the M-1 phase, the intensity of the phonons appears to decrease by about a factor two, but more importantly they become more difficult to observe because o f the intense background from the substrate.
A similar effect may occur in the pressed pellets [3] which have randomly oriented crystallites. Some of the crystallites are oriented so that approximately a (zz ) spectrum is obtained. In the insulating phase, the intensity of the (zz) spectrum becomes less in- tense. Also, the laser light may then penetrate these crystallites, which would yield more intensity from other oriented crystallites lying below. This latter ef- fect would act similar to a background, emphasizing other modes. As already indicated in fig. 5, the ~ 600 cm-~ mode is very strongly (zz) polarized, so its in-

G. Burns et al. / Raman modes o f YBa2Cu~Ox 43
tensity would be suppressed if the effect discussed here is important.
(7) The last point that we discuss in some detail is the frequency changes of the low energy modes that occur near the M-I phase transition; the results are shown in fig. 4(b). As an experimental point, we should note that the changes that occur near modes
1 and #2 are difficult to measure because the lines are weak. However, the changes are entirely repro- ducible, and reversible when oxygen is put back into the crystal. Figure 4(b) is a plot of the frequency of the modes versus annealing temperature, as dis- cussed in the experimental section. On the top part of the figure, we have put the oxygen concentrations that correspond to the various annealing tempera- tures as discussed below.
The concentrations were obtained by using our Tc values and comparing them to published [ 14,15 ]. T~ versus oxygen content curves. The other way that ox- ygen content was determined was by using the po- sition of mode #5 versus oxygen content [ 2 ]. In all cases, we have found that the agreement is good be- tween oxygen contents obtained by both of these methods. Thus, the oxygen content of crystals just at the M-I phase transition is taken as Y 123-06.35, and that at the low oxygen end of the 60 K plateau is taken as Y 123-06.42. These oxygen contents can be seen at the top of fig. 4(b) and the corresponding annealing temperatures can be obtained. The higher oxygen content values are taken from the position of mode #5 versus oxygen content [2].
Careful electron diffraction studies [ 20 ] ofY 123- Ox show a superstructure with a doubling of the a repeat, for crystals with oxygen contents from ap- proximately O6.61 to 06.28; this covers oxygen con- tents for the T¢ ~ 60 K plateau to insulating material. For lower oxygen contents, the superstructure is barely discernible as expected since there are fewer and fewer oxygen atoms to fill O~ positions.
The plane of atoms containing Cu~ and O¢ for the fully oxygenated Y123-O7 is shown in fig. 6a; this may also be called the Ortho I structure. The super- structure, with doubling along the a axis, is modeled by the so called Ortho II structure [ 8,21,22 ] in which every other row of O¢ along b is missing. For Y123- 06.5 this structure is ideal, and the same plane is shown in fig. 6(b). In the latter, the repeat distance along a is doubled because along b every other O~ row is missing. However, keep in mind that Ortho
(a) Y123-O7.0 (b) Y123-O6. 5
Ortho I Ortho II i i I i 1 i
Fig. 6. (a) The plane containing Cue and O¢ of pure Y 123-07. The Oc positions are fully occupied and the structure has been called Ortho I. (b) The same plane but for the proposed Ortho II structure of Y 123-06.5 where every other Oc row is missing.
II (fig. 6 (b) ) is just a model. The difficulty in trying to understand our fre-
quency results in terms of structural results is that no structural changes have been reported at the M-I phase transition, rather only distance changes have been found [ 14,15 ], as discussed above.
In pure Ortho II, there are two types of Oz atomic positions; those that are part of a four-coordinated Cuc chain and those that are part of a two-coordi- nated Cuc stick. Thus, in superconducting crystals for compositions ofO6.5, and even above, both mode ~5 and the ~ 600 cm-~ mode should be observable. Similarly, there are two types of Cup atomic posi- tions, but just one type of Ba site.
The different types of positions do not correlate very closely with our Raman results. Mode #5, along with the 600 cm-~ mode, is observable to concen- trations about as low as Y123-O6.3 (fig. 3(c) ). The 600 cm-t mode, along with mode #5, is observable in material that shows a superconducting transition below ~ 60 K, and we estimate that the oxygen con- tent is approximately Y 123-06.37. Thus, both of these modes are simultaneously observed over a narrow oxygen content range, and the range appears to have more to do with the metal-insulator phase transition than the ideal Ortho II phase at YI23-O6.s. The structural models would suggest that the 600 cm- mode should be observable well into the supercon- ducting phase at relatively high oxygen contents.
Mode #1, due mostly to Ba motion, splits into two in the 06.5 region (fig. 4(b) ). However, a third fre- quency might be expected to occur for 06 since in the tetragonal phase the Ba atoms, again, are in a

44 G. Burns et al. / Raman modes ~/' YBae('ujO,
sl ightly d i f fe ren t e n v i r o n m e n t t h a n in the O r t h o I a n d
II s t ructures . However , we no te t ha t m o d e ~1 is r a t h e r
b r o a d in the h igh oxygen range, ( o f the o r d e r o f 12
cm ' ) , whi le t he m o d e at 126 c m ', t h a t a p p e a r s to
emerge f rom th i s b r o a d m o d e #1, is qu i t e n a r r o w ( 3.5
c m - t w i d e ) . T h u s , it is poss ib le t h a t the b r o a d m o d e
~tl m a s k s m o r e i n f o r m a t i o n .
O n the o t h e r h a n d , m o d e ~2 is n a r r o w e r for b o t h
O7 a n d 0 6 (7 c m ~ a n d 3.7 c m - ~, r e s p e c t i v e l y ) . T h e
" ' ex t ra" m o d e at ~ 1 6 0 c m ~ is b r o a d ( 14 cm ~),
Because o f the n a r r o w n e s s o f m o d e f{2, we can fo l low
the f r e q u e n c y a n d the m o d e a p p e a r s to va ry c o n t i n -
uous ly f r o m 0 7 to 0 6 (fig. 4 ( b ) ) , w h i c h does no t
seem to be c o n s i s t e n t w i th the s t r u c t u r a l i n f o r m a t i o n
d i s cus sed a b o v e .
It a p p e a r s t h a t at leas t s o m e o f the o b s e r v e d Ra-
m a n effects a re a s s o c i a t e d w i th the e lec t r ica l n a t u r e
o f the m a t e r i a l r a t h e r t h a n j u s t the s t r u c t u r a l aspects .
To s u m m a r i z e : we h a v e c o m p a r e d o u r R a m a n re-
sul ts o f R E I 2 3 h i g h - T c s u p e r c o n d u c t o r s ( 0 7 ) a n d
i n s u l a t o r s ( 0 6 ) wi th n e u t r o n d e t e r m i n e d p h o n o n
d e n s i t y o f s t a tes m e a s u r e m e n t s . T h i s leads us to two
genera l conc lu s ions .
( 1 ) T h e d i f f e r e n c e in spec t r a for t he s u p e r c o n d u c t o r
a n d i n s u l a t o r a re due to a c h a n g e in c o o r d i n a t i o n o f
the c h a i n Cu a t o m s .
( 2 ) T h e n e u t r o n resu l t s a t h i g h e r ene rg ies m u s t be
a t t r i b u t e d to th i s s a m e c o o r d i n a t i o n change , a n d
s h o u l d no t be i n t e r p r e t e d as b e i n g a c o n s e q u e n c e o f
a " ' gene ra l " m o d e so f t en ing .
( 8 ) T h e r e a re m a n y p a p e r s in the l i t e r a t u r e t h a t
bu i ld on the d i f fe rence o f the p h o n o n dens i ty o f s ta tes
as m e a s u r e d by ine las t i c n e u t r o n s c a t t e r i n g [1 ].
O t h e r s t r ea t the 60 K p h a s e as a d e f i n i t e phase . We
t h i n k t h a t t he O r t h o It m o d e l is a usefu l way to t h i n k
a b o u t t he se sys tems , but , i f it exists , it m u s t h a v e a
very w ide p h a s e b o u n d a r y . Also we f ind d i s t i n c t
changes at the M - I phase b o u n d a r y , wh ich m u s t h a v e
effects o n o t h e r m e a s u r e m e n t s . T h u s , p e r h a p s o t h e r
t heo r i e s a n d m e a s u r e m e n t s s h o u l d be looked at aga in [ 2 3 , 2 4 ] .
References
[ 1 ] B. Renker, F. Gompf, E. Gering~ G. Roth, W. Reichardt, D. Ewert, H. Rietschel and H. Mutka, Z. Phys. B 71 (19887 437; ibid., 73 (1988) 309: ibid., 77 (1989) 65.
[ 2 ] R. Feile, Physica C 159 ( 1989 ) 1. [ 3 ] See the references of fig. 4 in the review paper by Feile ( ref.
[21). [4] G. Burns, F.H. Dacol, C. Feild and F. Holtzberg, Solid Slate
Commun. 77 (I991) 367. [5] F. Holtzberg and C. Feild, Eur. J. Solid lnorg. Chem. 27
(1990) 107. [ 6 ] F. Holtzberg and ('. Feild, J. of Crystal Growth, 99 ( 1990 )
915. [ 7 ] G. Bums, F.H. Dacol, P. Freitas, T.S. Plasken and W. K6nig,
Solid State Commun. 64 ( 1987 ) 47 I. [8] G. Burns and A.M. Glazer, Space Groups for Solid State
Scientists (Academic Press, New York, 19907, Chapter 9: R. Beyers and T.M. Shaw, Solid State Physics (Academic Press, New York, 1989) vol. 42, p. 135: K. Yzon and M. Frances, Z. Phys. B 76 ( 1989 ) 413; R.M. Hazen, Physical Properties of High-T~ Superconductors, ed. D.M. Ginsberg (World Scientific, Singapore, 1990). vol. 2, p. 121.
[9] C. Thomsen, M. Cardona, R. Liu, Hj. Mattausch, W. K6nig, F. Garcia-Alvarado, B. Smirez, E. Mor~m and M. Alarin- Franco, Solid State Commun. 69 (1989) 857.
[ 10] W. Reichardt, invited talk at the March APS meeting: paper M31-1 in Bull. of the Am. Phys. Soc. 36 (1991) 838.
[11] M.K. Crawford, G. Burns and F. Holtzberg, Solid State Commun. 70 (1989) 557.
[12] M.K. Crawtbrd, W.E. Farneth, E.M. McCarron I11 and R. Bordia, Phys. Rev. B 38 (1988) 11382.
[ 13 ] G. Burns. F,H. Dacol, C. Feild and F. Holtzberg, Solid State Commun. 75 (1990) 893.
[ 14] J.D. Jorgensen, B.W. Veal, A.P. Paulikas, L.J. Nowicki, G.W. Crabtree, H. Claus and W.K. Kwok, Phys. Rev, B 41 ( 1990 ) 1863.
[ 15 ] R.J. Cava, A.W. Hewat, E.A. Hewat, B. Batlogg, M. Marezio, K.M. Rabe, J.J. Kra]ewski, W.F. Peck Jr. and L.W. Rupp Jr., Physica C 165 (1990) 419; R.J. Cava, B. Batlogg, K.M. Rabe, E.A. Rietman, P.K. Gallagher and L.W. Rupp Jr., Physica C 156 ( 1988 ) 523.
[ 16] E.I. Rashba and E.Ya. Sherman, Sov. Phys. JETP 47 ( 19887 482.
[ 17] L.V. Gasparov, G.A. Emel'chenko, V.D. Kulakovskii, O.V. Misochko, V.B. Timofeev and E.I. Rashba, J. Opt. Soc. Am. B6(1989)440.
[18] O.V. Misochko, E.I. Rashba, E.Ya. Sherman and V.B. Timofeev, Phys. Rep. 197 (1990) 387.
[ 19] G.Burns, F,H. Dacol and A. Gupta, unpublished. [201 R. Beyers, B.T. Ahn, G. Gorman, V.Y. Lee, S.S.P. Parkin,
M.L. Ramirez, K.P. Roche, J.E. Vazquez, T.M. Gur and R.A. Huggins, Nature 340 ( 1989 ) 619.
[21 ] C. Chaillot, M,A. Alario-Franco, J.J. Copponi, J. Chenavas, P. Strobel and M. Marezio, Solid State Commun. 65 (1988) 283: ibid.. Phys. Rev. B 36 (1987) 7118.
[221 H.F. Poulsem N.H. Anderson, J.V, Anderson, H. Bohr and O.G. Mouritsen, Nature 349 ( 1991 ) 594: J.D. Jorgensen, Nature 349 ( 1991 ) 565.
[23] J.C. Phillips, Phys. Rev. Lett. 64 (1990) 1605. [24] R.E. Walstedt el al., Phys. Rev. B 41 (1990) 9574.