ram energy resources, inc. february 2007. 2 disclosure statement this document contains...
TRANSCRIPT

RAM Energy Resources, Inc.
February 2007

2
Disclosure StatementThis document contains forward-looking statements within the meaning of Section 27A
of the Securities Act of 1933, as amended, and Section 21E of the Securities Exchange Act of 1934, as amended. All statements, other than statements of historical fact, including, without limitation, statements that address estimates of RAM’s proved reserves of oil, gas and natural gas liquids, its derivative positions, the impact of derivatives, exploration activities, capital spending, borrowing availability, financial position, business strategy, management’s objectives, future operations, and industry conditions, are forward-looking statements. Although RAM believes that the expectations reflected in such forward-looking statements are reasonable, RAM can give no assurance that such expectations will prove to be correct. Important factors that could cause actual results to differ materially from RAM’s expectations (“Cautionary Statements”) include, without limitation, the actual quantities of RAM’s oil and natural gas reserves, future production levels, future prices and demand for oil and natural gas, the results of RAM’s future exploration and development activities, future operating, development costs and future acquisitions, the effect of existing and future laws and governmental regulations (including those pertaining to the environment), the continued availability of capital and financing, and the political and economic climate of the United States as well as risk factors listed from time to time in our reports and documents filed with the SEC. All subsequent written and oral forward-looking statements attributable to RAM, or persons acting on RAM’s behalf, are expressly qualified in their entirety by the Cautionary Statements.

3
Company OverviewCompany Overview
Operations
Proved Reserves (12/31/05)Proved Reserves (12/31/05)18.8 MMBOE18.8 MMBOE
% Crude% Crude60%60%
% PUD% PUD30%30%
PV-10 ValuePV-10 Value$345.5 MM$345.5 MM
% of PV-10 Value Operated% of PV-10 Value Operated86%86%
Historical Drilling Success RateHistorical Drilling Success Rate93%93%
Latest Twelve Months Financials(1)
LTM RevenueLTM Revenue
$77.5 MM$77.5 MM
LTM EBITDALTM EBITDA
$33.8 MM$33.8 MM
IDID FieldField Proved Reserves (MMBOE)Proved Reserves (MMBOE)
11 Electra / BurkburnettElectra / Burkburnett 9.89.8
22 BoonsvilleBoonsville 3.03.0
33 EganEgan 1.71.7
44 North Texas Barnett ShaleNorth Texas Barnett Shale 0.40.4
55 VinegaroneVinegarone 1.11.1
AA Woodford / Barnett ShalesWoodford / Barnett Shales N / AN / A
BB Wolfcamp FormationWolfcamp Formation N / AN / A
11
22
33
44
AA
55
BB
11
22
33
44
AA
55
BB
(1) Unaudited; As of 9/30/06
4
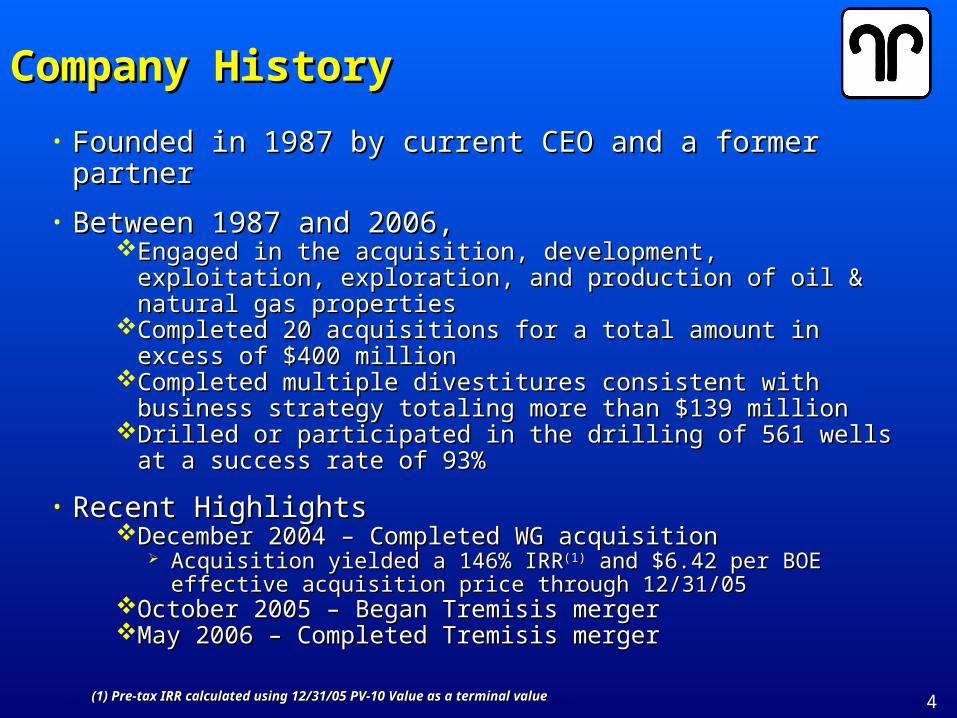
• Founded in 1987 by current CEO and a former partnerFounded in 1987 by current CEO and a former partner
• Between 1987 and 2006,Between 1987 and 2006,Engaged in the acquisition, development, exploitation, Engaged in the acquisition, development, exploitation,
exploration, and production of oil & natural gas propertiesexploration, and production of oil & natural gas propertiesCompleted 20 acquisitions for a total amount in excess of $400 Completed 20 acquisitions for a total amount in excess of $400
millionmillionCompleted multiple divestitures consistent with business Completed multiple divestitures consistent with business
strategy totaling more than $139 millionstrategy totaling more than $139 millionDrilled or participated in the drilling of 561 wells at a success Drilled or participated in the drilling of 561 wells at a success
rate of 93%rate of 93%
• Recent HighlightsRecent HighlightsDecember 2004 – Completed WG acquisitionDecember 2004 – Completed WG acquisition
Acquisition yielded a 146% IRRAcquisition yielded a 146% IRR(1)(1) and $6.42 per BOE effective and $6.42 per BOE effective acquisition price through 12/31/05acquisition price through 12/31/05
October 2005 – Began Tremisis mergerOctober 2005 – Began Tremisis mergerMay 2006 – Completed Tremisis mergerMay 2006 – Completed Tremisis merger
Company HistoryCompany History
(1) Pre-tax IRR calculated using 12/31/05 PV-10 Value as a terminal value(1) Pre-tax IRR calculated using 12/31/05 PV-10 Value as a terminal value

5
Execution of Business StrategyExecution of Business Strategy
• Develop and exploit existing oil & natural gas propertiesDevelop and exploit existing oil & natural gas properties
• Accelerate North Texas Barnett Shale developmentAccelerate North Texas Barnett Shale development
• Increase emphasis on exploration activityIncrease emphasis on exploration activity
• Complete selective acquisitions and divestituresComplete selective acquisitions and divestitures

6
Electra / Burkburnett Boonsville
Barnett Shale Other Total
Proved Reserves (MBOE) 9,802 3,011 408 5,575 18,796Percent proved developed 61% 69% 6% 86% 70%Percent crude 97% 6% 2% 27% 60%
PV-10 Value (in $MM) (2) $182.9 $43.4 $10.4 $108.8 $345.5
Total net acres 12,190 7,313 6,800 11,945 38,248
(1) On an acreage basis(2) Proved reserves and PV-10 value of proved reserves as of 12/31/05
Principal Exploration ProjectsName Objective Net Acres
Wolfcamp Shale Gas 15,000
West Texas Barnett / Woodford Shale Gas 6,600
Principal Exploration ProjectsName Objective Net Acres
Wolfcamp Shale Gas 15,000
West Texas Barnett / Woodford Shale Gas 6,600
Property SummaryProperty Summary
Producing Properties
Exploration Projects
(1)(1)
7
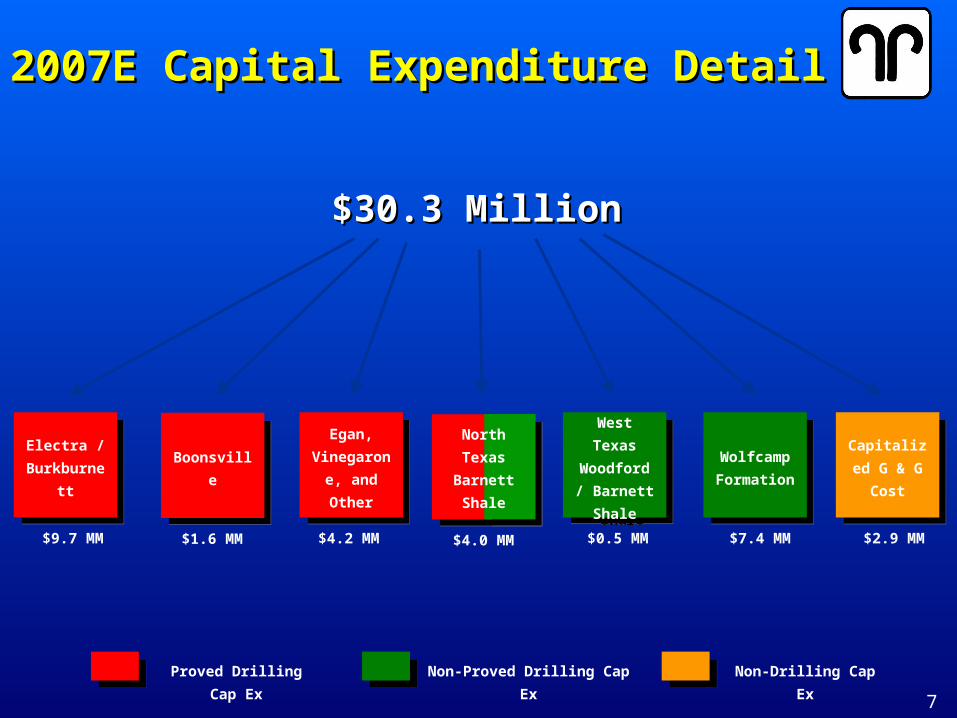
$30.3 Million$30.3 Million
Electra /
Burkburnett
Electra /
Burkburnett
$9.7 MM
BoonsvilleBoonsville
$1.6 MM
Egan,
Vinegarone,
and Other
Egan,
Vinegarone,
and Other
$4.2 MM
West Texas
Woodford /
Barnett
Shale
West Texas
Woodford /
Barnett
Shale
$0.5 MM
Wolfcamp
Formation
Wolfcamp
Formation
$7.4 MM
Capitalized
G & G Cost
Capitalized
G & G Cost
$2.9 MM
Proved Drilling Cap Ex Non-Proved Drilling Cap Ex Non-Drilling Cap Ex
2007E Capital Expenditure Detail2007E Capital Expenditure Detail
$4.0 MM
North
Texas
Barnett
Shale
8
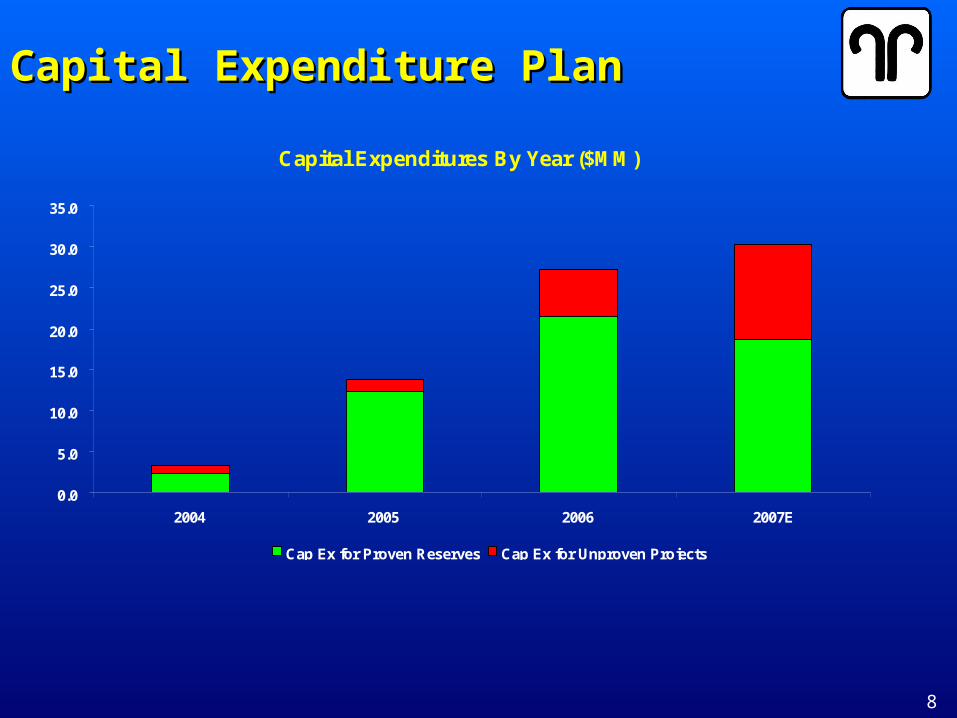
Capital Expenditure PlanCapital Expenditure Plan
Capital Expenditures By Year ($MM)
0.0
5.0
10.0
15.0
20.0
25.0
30.0
35.0
2004 2005 2006 2007E
Cap Ex for Proven Reserves Cap Ex for Unproven Projects
9
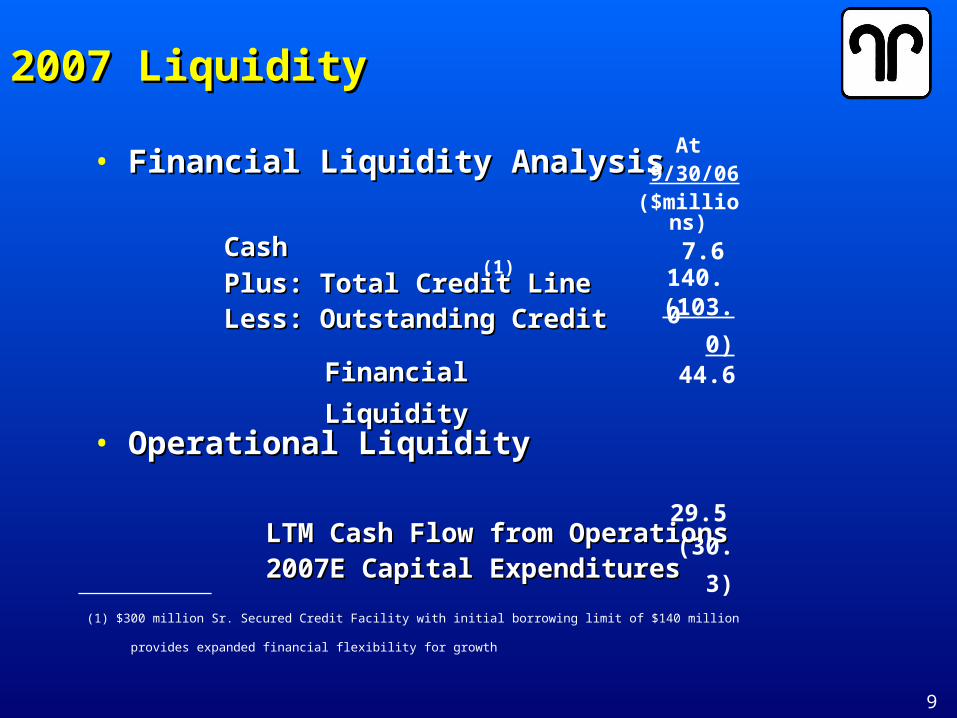
(103.0)
• Financial Liquidity AnalysisFinancial Liquidity Analysis
CashCash
Plus: Total Credit LinePlus: Total Credit LineLess: Outstanding CreditLess: Outstanding Credit
• Operational LiquidityOperational Liquidity
LTM Cash Flow from OperationsLTM Cash Flow from Operations2007E Capital Expenditures2007E Capital Expenditures
(1) $300 million Sr. Secured Credit Facility with initial borrowing limit of $140 million
provides expanded financial flexibility for growth
2007 Liquidity2007 Liquidity
At 9/30/06
($millions)
7.6140.0
29.5(30.3)
44.6Financial LiquidityFinancial Liquidity
(1)

10
• 100% WI ownership & 100% WI ownership & operational controloperational control
• Includes assets that help Includes assets that help maintain drilling schedule maintain drilling schedule and control costs: gas and control costs: gas plant, gathering system, plant, gathering system, one drilling rig, five one drilling rig, five workover rigs, and a supply workover rigs, and a supply companycompany
(1) At 9/30/06
• Wichita and Wilbarger Counties, TexasWichita and Wilbarger Counties, Texas
• 3Q06 production of 169,730 BOE from 3Q06 production of 169,730 BOE from 503 producers503 producers
• 79 wells drilled in 200679 wells drilled in 2006
• 151 identified PUD drilling locations151 identified PUD drilling locations(1) (1)
with a projected D&C of $5.82 per BOEwith a projected D&C of $5.82 per BOE
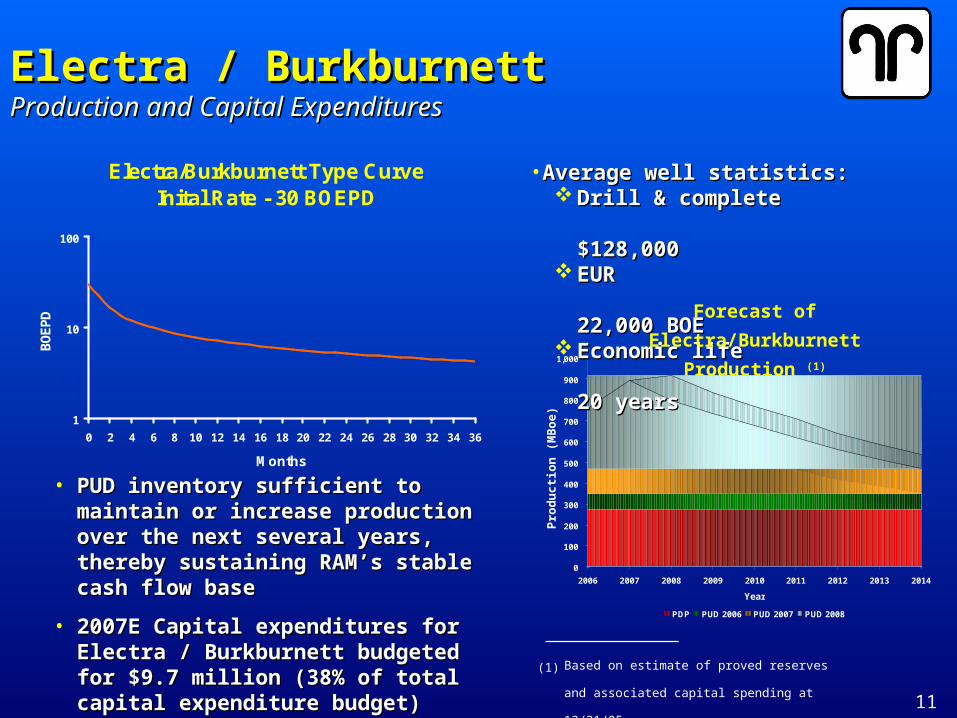
Electra / BurkburnettElectra / Burkburnett
11
0
100
200
300
400
500
600
700
800
900
1,000
2006 2007 2008 2009 2010 2011 2012 2013 2014
Year
PDP PUD 2006 PUD 2007 PUD 2008
• Average well statistics:Average well statistics: Drill & completeDrill & complete
$128,000$128,000 EUREUR
22,000 BOE22,000 BOE Economic lifeEconomic life
20 years20 years
• PUD inventory sufficient to maintain or PUD inventory sufficient to maintain or increase production over the next increase production over the next several years, thereby sustaining RAM’s several years, thereby sustaining RAM’s stable cash flow basestable cash flow base
• 2007E Capital expenditures for Electra / 2007E Capital expenditures for Electra / Burkburnett budgeted for $9.7 million Burkburnett budgeted for $9.7 million (38% of total capital expenditure budget)(38% of total capital expenditure budget)
Forecast of Electra/Burkburnett
Production (1)
Pro
du
ctio
n (
MB
oe
)
Electra / BurkburnettElectra / BurkburnettProduction and Capital ExpendituresProduction and Capital Expenditures
Electra/Burkburnett Type CurveInital Rate - 30 BOEPD
1
10
100
0 2 4 6 8 10 12 14 16 18 20 22 24 26 28 30 32 34 36
Months
BO
EP
D
Based on estimate of proved reserves and
associated capital spending at 12/31/05.
(1)
12
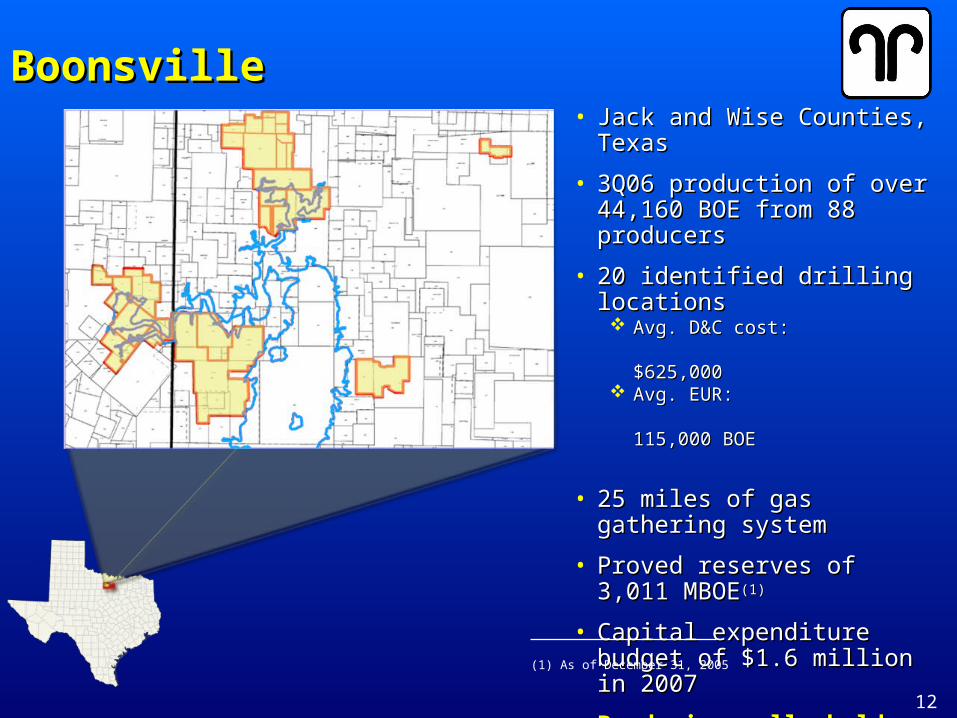
• Jack and Wise Counties, TexasJack and Wise Counties, Texas
• 3Q06 production of over 3Q06 production of over 44,160 BOE from 88 producers 44,160 BOE from 88 producers
• 20 identified drilling locations20 identified drilling locations Avg. D&C cost:Avg. D&C cost:
$625,000$625,000 Avg. EUR:Avg. EUR:
115,000 BOE115,000 BOE
• 25 miles of gas gathering 25 miles of gas gathering systemsystem
• Proved reserves of 3,011 Proved reserves of 3,011 MBOEMBOE(1)(1)
• Capital expenditure budget of Capital expenditure budget of $1.6 million in 2007$1.6 million in 2007
• Producing wells hold Barnett Producing wells hold Barnett Shale rightsShale rights
BoonsvilleBoonsville
(1) As of December 31, 2005

13
• Jack and Wise Counties, TexasJack and Wise Counties, Texas
• 27,700 gross acres27,700 gross acres
• 6,800 net acres6,800 net acres
• All acreage is HBPAll acreage is HBP
• 90% of the acreage located in the 90% of the acreage located in the Core areaCore area
• 325 potential horizontal drilling 325 potential horizontal drilling locations on 80-acre spacinglocations on 80-acre spacing
• 9 gross producing wells existing9 gross producing wells existing
• 35 square miles of 3-D seismic 35 square miles of 3-D seismic acquired and interpretedacquired and interpreted Budgeted to add another 60 square Budgeted to add another 60 square
miles during 2007miles during 2007
• Partners are EOG and DevonPartners are EOG and Devon
RAM’s Barnett Shale operating area
Barnett ShaleBarnett Shale
Core
Tier 1
Tier 2
14
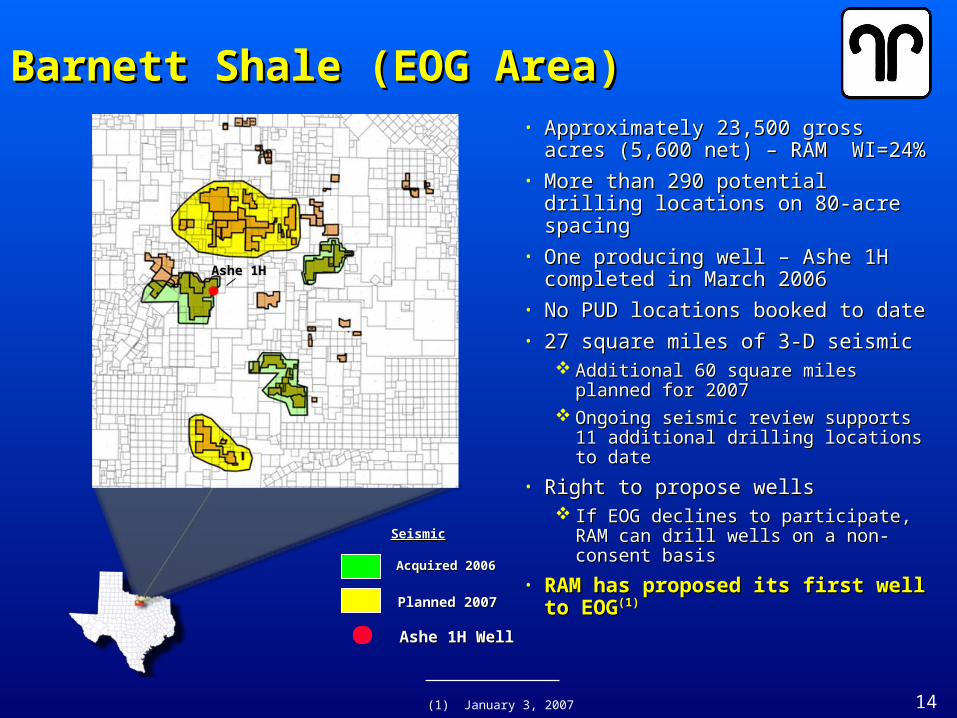
• Approximately 23,500 gross acres Approximately 23,500 gross acres (5,600 net) – RAM WI=24%(5,600 net) – RAM WI=24%
• More than 290 potential drilling More than 290 potential drilling locations on 80-acre spacinglocations on 80-acre spacing
• One producing well – Ashe 1H One producing well – Ashe 1H completed in March 2006completed in March 2006
• No PUD locations booked to dateNo PUD locations booked to date• 27 square miles of 3-D seismic27 square miles of 3-D seismic
Additional 60 square miles planned Additional 60 square miles planned for 2007for 2007
Ongoing seismic review supports 11 Ongoing seismic review supports 11 additional drilling locations to dateadditional drilling locations to date
• Right to propose wellsRight to propose wells If EOG declines to participate, RAM If EOG declines to participate, RAM
can drill wells on a non-consent can drill wells on a non-consent basisbasis
• RAM has proposed its first well RAM has proposed its first well to EOGto EOG(1)(1)
Barnett Shale (EOG Area)Barnett Shale (EOG Area)
Ashe 1H WellAshe 1H Well
Planned 2007Planned 2007
Acquired 2006Acquired 2006
SeismicSeismic
Ashe 1HAshe 1H
(1) January 3, 2007
15
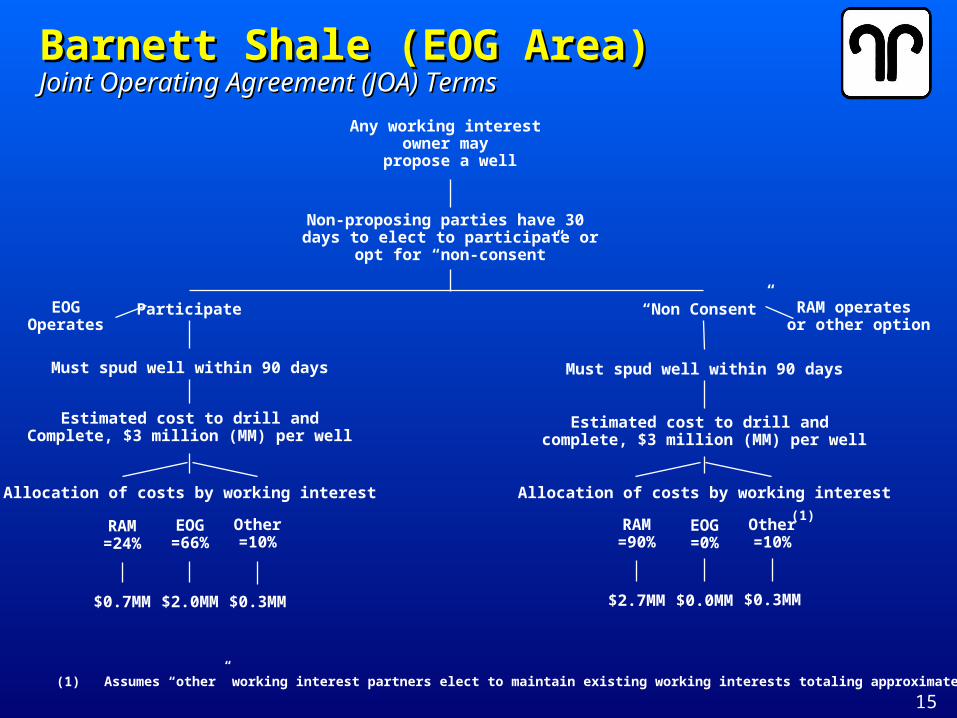
Barnett Shale (EOG Area)Barnett Shale (EOG Area)Joint Operating Agreement (JOA) TermsJoint Operating Agreement (JOA) Terms
Any working interest owner may
propose a well
Non-proposing parties have 30 days to elect to participate or
opt for “non-consent”
Participate “Non Consent”
Must spud well within 90 days
Estimated cost to drill andComplete, $3 million (MM) per well
Must spud well within 90 days
Estimated cost to drill and complete, $3 million (MM) per well
EOG=66%
Other=10%
RAM=24%
$2.0MM $0.3MM$0.7MM
EOG=0%
Other=10%
RAM=90%
$0.0MM $0.3MM$2.7MM
(1)
(1) Assumes “other” working interest partners elect to maintain existing working interests totaling approximately 10%
RAM operates or other option
EOGOperates
Allocation of costs by working interest Allocation of costs by working interest
16
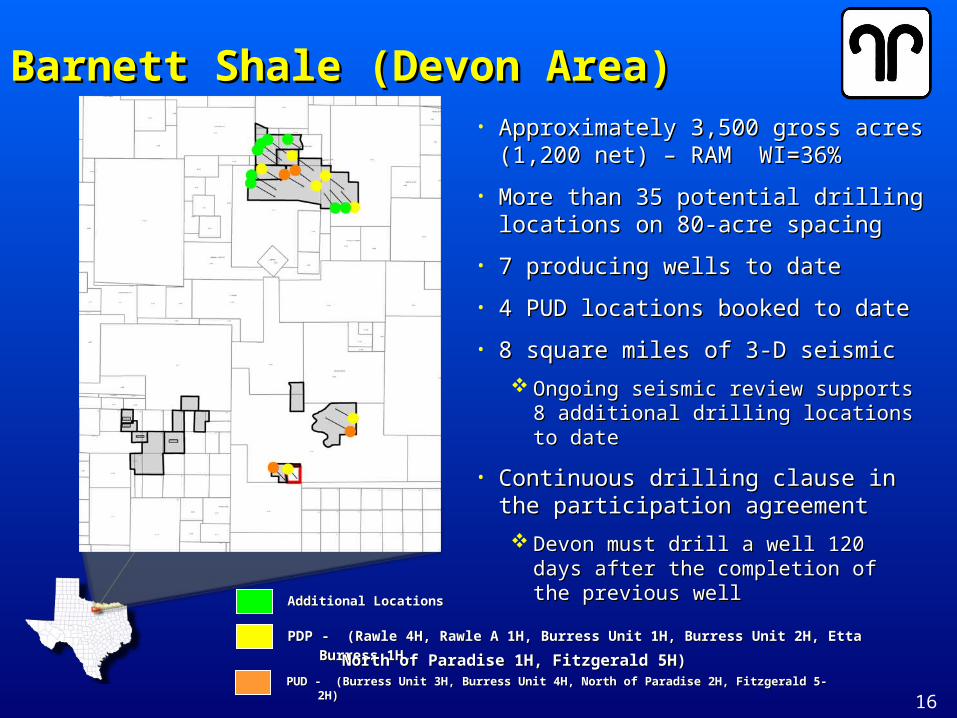
• Approximately 3,500 gross acres (1,200 Approximately 3,500 gross acres (1,200 net) – RAM WI=36%net) – RAM WI=36%
• More than 35 potential drilling locations More than 35 potential drilling locations on 80-acre spacing on 80-acre spacing
• 7 producing wells to date7 producing wells to date
• 4 PUD locations booked to date4 PUD locations booked to date
• 8 square miles of 3-D seismic8 square miles of 3-D seismic
Ongoing seismic review supports 8 Ongoing seismic review supports 8 additional drilling locations to dateadditional drilling locations to date
• Continuous drilling clause in the Continuous drilling clause in the participation agreementparticipation agreement
Devon must drill a well 120 days after the Devon must drill a well 120 days after the completion of the previous wellcompletion of the previous well
Barnett Shale (Devon Area)Barnett Shale (Devon Area)
Additional LocationsAdditional Locations
PDP - (Rawle 4H, Rawle A 1H, Burress Unit 1H, Burress Unit 2H, Etta Burress 1H, PDP - (Rawle 4H, Rawle A 1H, Burress Unit 1H, Burress Unit 2H, Etta Burress 1H,
PUD - (Burress Unit 3H, Burress Unit 4H, North of Paradise 2H, Fitzgerald 5-PUD - (Burress Unit 3H, Burress Unit 4H, North of Paradise 2H, Fitzgerald 5- 2H)2H)
North of Paradise 1H, Fitzgerald 5H)North of Paradise 1H, Fitzgerald 5H)
17
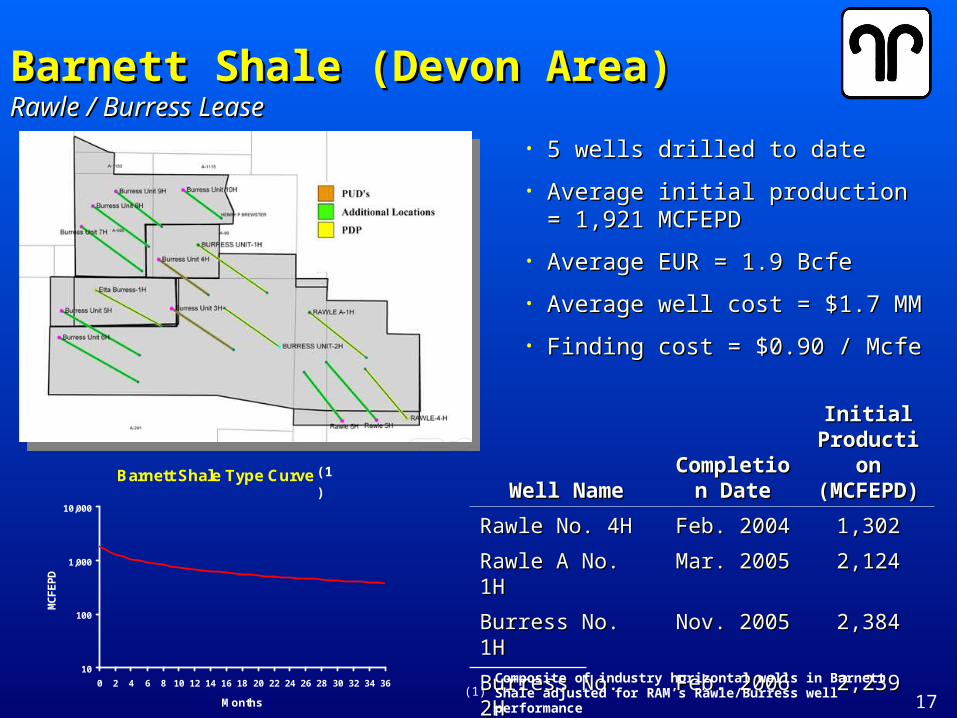
• 5 wells drilled to date5 wells drilled to date
• Average initial production = 1,921 Average initial production = 1,921 MCFEPDMCFEPD
• Average EUR = 1.9 BcfeAverage EUR = 1.9 Bcfe
• Average well cost = $1.7 MMAverage well cost = $1.7 MM
• Finding cost = $0.90 / McfeFinding cost = $0.90 / Mcfe
Barnett Shale (Devon Area)Barnett Shale (Devon Area)Rawle / Burress LeaseRawle / Burress Lease
Well NameWell NameCompletion Completion
DateDate
Initial Initial Production Production (MCFEPD)(MCFEPD)
Rawle No. 4HRawle No. 4H Feb. 2004Feb. 2004 1,3021,302
Rawle A No. 1HRawle A No. 1H Mar. 2005Mar. 2005 2,1242,124
Burress No. 1HBurress No. 1H Nov. 2005Nov. 2005 2,3842,384
Burress No. 2HBurress No. 2H Feb. 2006Feb. 2006 2,2392,239
Etta Burress No. 1Etta Burress No. 1 Sept. 2006Sept. 2006 1,5581,558
Barnett Shale Type Curve
10
100
1,000
10,000
0 2 4 6 8 10 12 14 16 18 20 22 24 26 28 30 32 34 36
Months
MC
FE
PD
(1)
Composite of industry horizontal wells in Barnett Shale adjusted for RAM’s Rawle/Burress well performance(1)

18
• Southwest TexasSouthwest Texas
• Potential high-impact Potential high-impact explorationexploration
• RAM has leased & optioned RAM has leased & optioned 15,000 net acres15,000 net acres
• 100% working interest100% working interest
• Two test wells vertically drilledTwo test wells vertically drilled
• Completion attempt scheduled Completion attempt scheduled for Q1 2007for Q1 2007
• If commercial, significant If commercial, significant potential upside on 80 acre potential upside on 80 acre spacingspacing
Wolfcamp FairwayWolfcamp Fairway

19
• Reeves County, TexasReeves County, Texas
• Exploration play – 84,000 gross Exploration play – 84,000 gross acres (6,600 net)acres (6,600 net)
• Estimated thickness of the Barnett is Estimated thickness of the Barnett is between 400’ – 700’ and the between 400’ – 700’ and the Woodford varies from 200’ – 400’Woodford varies from 200’ – 400’
• Keys to success are horizontal Keys to success are horizontal drilling and fracture stimulationdrilling and fracture stimulation
• Four wells drilled under farmout Four wells drilled under farmout agreementsagreements
• 3-D seismic shot over 10 square 3-D seismic shot over 10 square mile areamile area
Alpine Area
3 wells drilled
J. Cleo Thompson
1 well drilled
Barnett and Woodford ShaleBarnett and Woodford ShaleThompson and Alpine AreasThompson and Alpine Areas
20
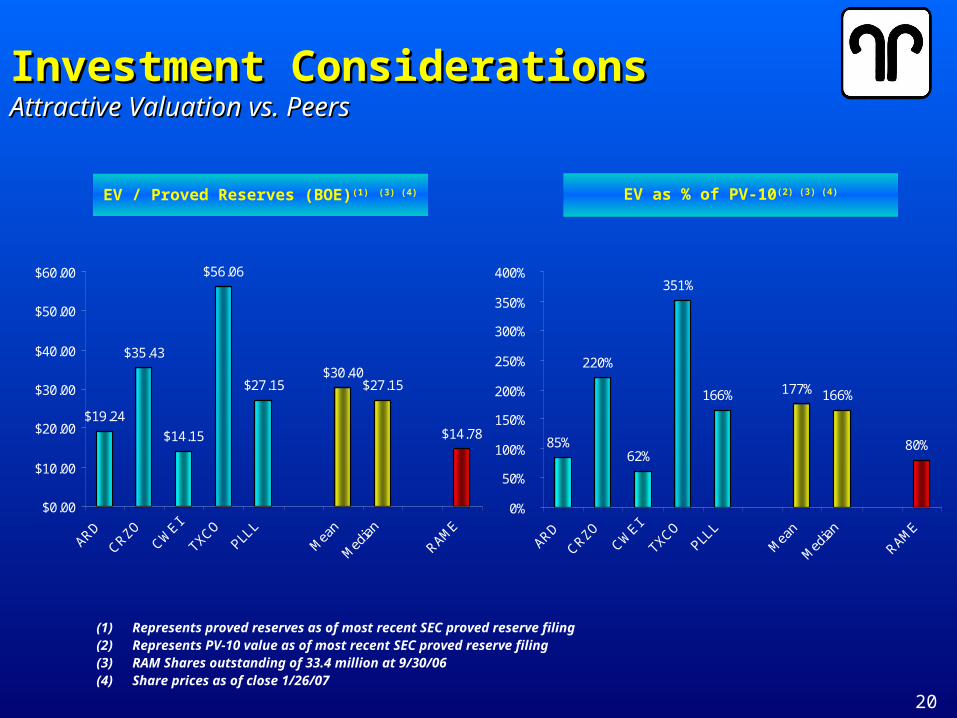
EV / Proved Reserves (BOE)(1) (3) (4) EV as % of PV-10(2) (3) (4)
Investment ConsiderationsInvestment ConsiderationsAttractive Valuation vs. PeersAttractive Valuation vs. Peers
(1) Represents proved reserves as of most recent SEC proved reserve filing(2) Represents PV-10 value as of most recent SEC proved reserve filing(3) RAM Shares outstanding of 33.4 million at 9/30/06(4) Share prices as of close 1/26/07
$19.24
$35.43
$14.15
$56.06
$27.15$30.40
$27.15
$14.78
$0.00
$10.00
$20.00
$30.00
$40.00
$50.00
$60.00
85%
220%
62%
351%
166% 177% 166%
80%
0%
50%
100%
150%
200%
250%
300%
350%
400%
21
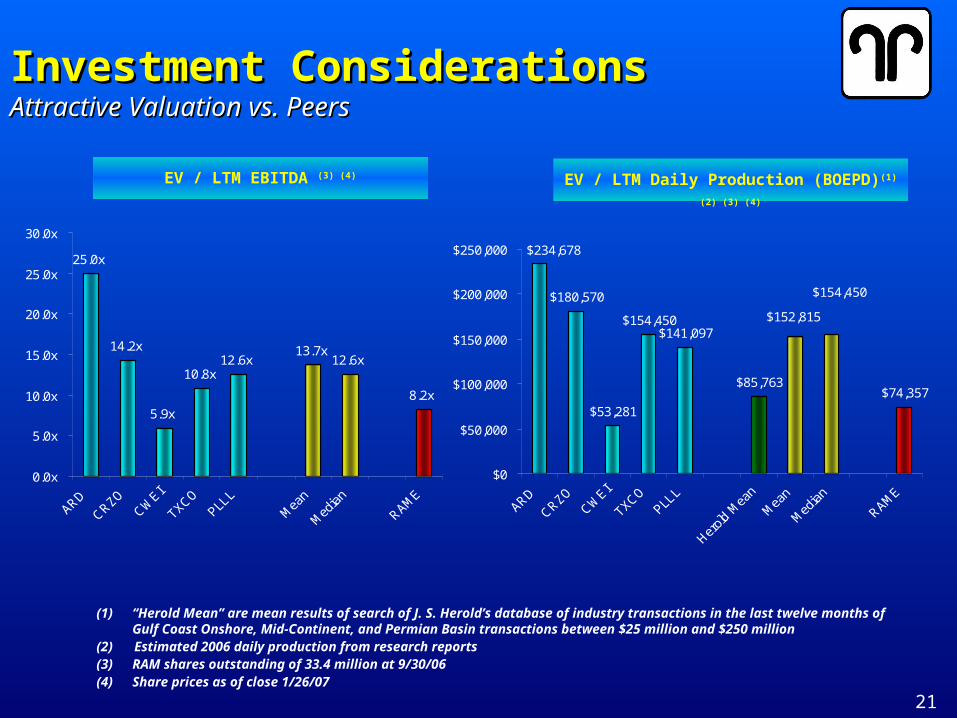
EV / LTM Daily Production (BOEPD)(1) (2) (3) (4)EV / LTM EBITDA (3) (4)
Investment ConsiderationsInvestment ConsiderationsAttractive Valuation vs. PeersAttractive Valuation vs. Peers
(1) “Herold Mean” are mean results of search of J. S. Herold’s database of industry transactions in the last twelve months of Gulf Coast Onshore, Mid-Continent, and Permian Basin transactions between $25 million and $250 million
(2) Estimated 2006 daily production from research reports(3) RAM shares outstanding of 33.4 million at 9/30/06(4) Share prices as of close 1/26/07
$180,570
$53,281
$154,450$141,097
$85,763$74,357
$234,678
$152,815
$154,450
$0
$50,000
$100,000
$150,000
$200,000
$250,00025.0x
14.2x
5.9x
10.8x12.6x
13.7x12.6x
8.2x
0.0x
5.0x
10.0x
15.0x
20.0x
25.0x
30.0x
22
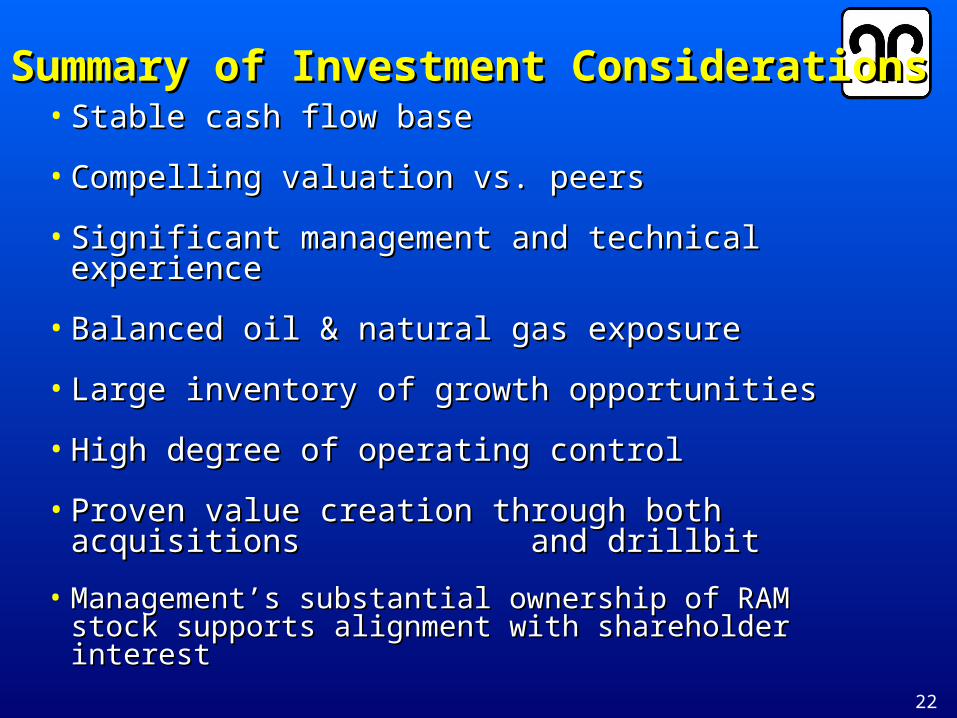
• Stable cash flow baseStable cash flow base
• Compelling valuation vs. peersCompelling valuation vs. peers
• Significant management and technical experienceSignificant management and technical experience
• Balanced oil & natural gas exposureBalanced oil & natural gas exposure
• Large inventory of growth opportunitiesLarge inventory of growth opportunities
• High degree of operating controlHigh degree of operating control
• Proven value creation through both acquisitions Proven value creation through both acquisitions and drillbitand drillbit
• Management’s substantial ownership of RAM stock supports Management’s substantial ownership of RAM stock supports alignment with shareholder interestalignment with shareholder interest
Summary of Investment ConsiderationsSummary of Investment Considerations
25
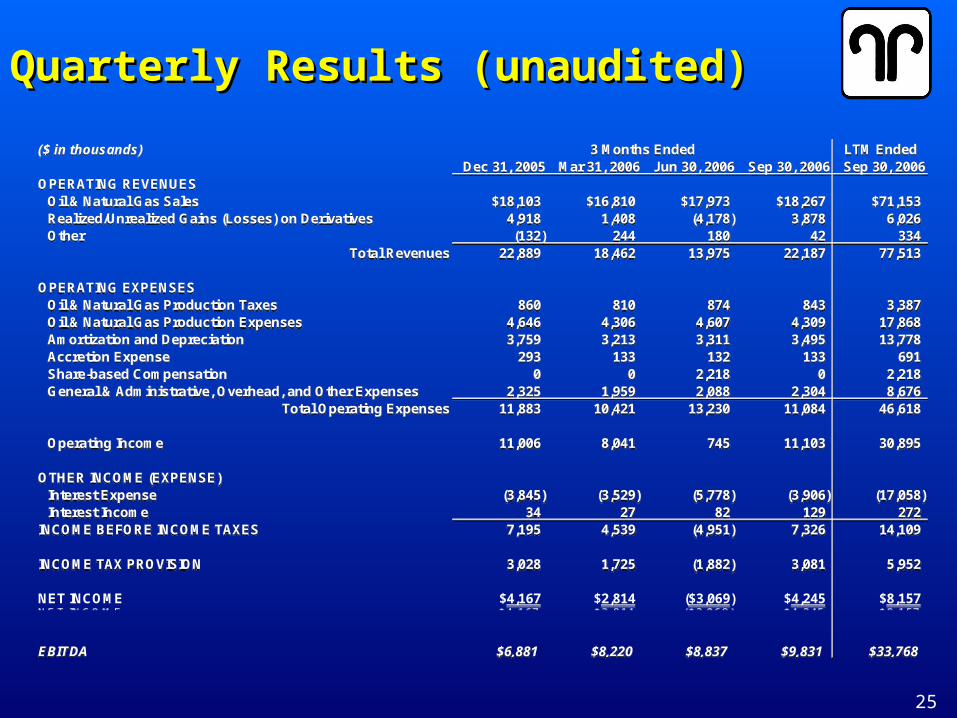
Quarterly Results (unaudited)Quarterly Results (unaudited)
($ in thousands) 3 Months Ended LTM EndedDec 31, 2005 Mar 31, 2006 Jun 30, 2006 Sep 30, 2006 Sep 30, 2006
OPERATING REVENUESOil & Natural Gas Sales $18,103 $16,810 $17,973 $18,267 $71,153Realized/Unrealized Gains (Losses) on Derivatives 4,918 1,408 (4,178) 3,878 6,026Other (132) 244 180 42 334
Total Revenues 22,889 18,462 13,975 22,187 77,513
OPERATING EXPENSESOil & Natural Gas Production Taxes 860 810 874 843 3,387Oil & Natural Gas Production Expenses 4,646 4,306 4,607 4,309 17,868Amortization and Depreciation 3,759 3,213 3,311 3,495 13,778Accretion Expense 293 133 132 133 691Share-based Compensation 0 0 2,218 0 2,218General & Administrative, Overhead, and Other Expenses 2,325 1,959 2,088 2,304 8,676
Total Operating Expenses 11,883 10,421 13,230 11,084 46,618
Operating Income 11,006 8,041 745 11,103 30,895
OTHER INCOME (EXPENSE)Interest Expense (3,845) (3,529) (5,778) (3,906) (17,058)Interest Income 34 27 82 129 272
INCOME BEFORE INCOME TAXES 7,195 4,539 (4,951) 7,326 14,109
INCOME TAX PROVISION 3,028 1,725 (1,882) 3,081 5,952
NET INCOME $4,167 $2,814 ($3,069) $4,245 $8,157
EBITDA $6,881 $8,220 $8,837 $9,831 $33,768
27*Per 12/31/05 Reserve Report
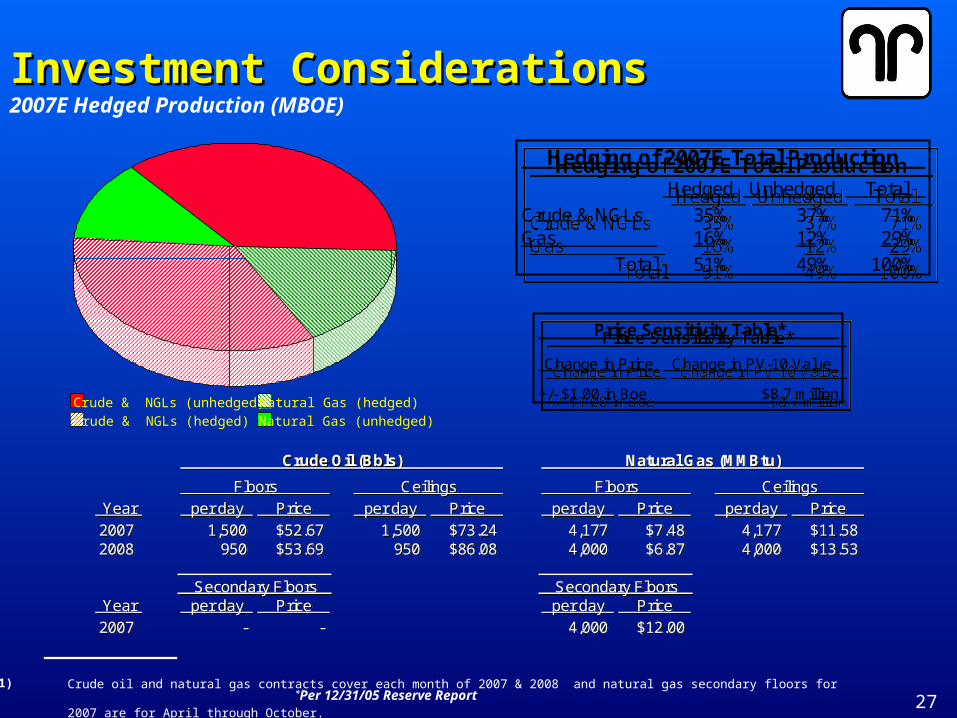
Price Sensitivity Table*
Change in Price Change in PV-10 Value
+/- $1.00 in Boe $8.7 million
Price Sensitivity Table*
Change in Price Change in PV-10 Value
+/- $1.00 in Boe $8.7 million
Investment ConsiderationsInvestment Considerations2007E Hedged Production (MBOE)
Hedging of 2007E Total Production
Hedged Unhedged Total
Crude & NGLs 35% 37% 71%Gas 16% 12% 29%
Total 51% 49% 100%
Hedging of 2007E Total Production
Hedged Unhedged Total
Crude & NGLs 35% 37% 71%Gas 16% 12% 29%
Total 51% 49% 100%
Crude & NGLs (unhedged) Natural Gas (hedged)
Crude & NGLs (hedged) Natural Gas (unhedged)
Crude oil and natural gas contracts cover each month of 2007 & 2008 and natural gas secondary floors for 2007 are for April through October.(1)
Crude Oil (Bbls) Natural Gas (MMBtu)
Floors Ceilings Floors CeilingsYear per day Price per day Price per day Price per day Price
2007 1,500 $52.67 1,500 $73.24 4,177 $7.48 4,177 $11.582008 950 $53.69 950 $86.08 4,000 $6.87 4,000 $13.53
Secondary Floors Secondary FloorsYear per day Price per day Price
2007 - - 4,000 $12.00

28
NAMENAME TITLETITLE RAM EXPERIENCERAM EXPERIENCE INDUSTRY INDUSTRY EXPERIENCEEXPERIENCE
Officers:Officers:
Larry LeeLarry Lee Chairman, President, CEOChairman, President, CEO 23 Years23 Years 31 Years31 Years
Larry RampeyLarry Rampey SVP OperationsSVP Operations 17 Years17 Years 38 Years38 Years
John LongmireJohn Longmire SVP, CFOSVP, CFO 16 Years16 Years 33 Years33 Years
Drake SmileyDrake Smiley SVP Land & ExplorationSVP Land & Exploration 17 Years17 Years 29 Years29 Years
John CoxJohn Cox VP Finance, Secretary, VP Finance, Secretary, TreasurerTreasurer
2 Years2 Years 31 Years31 Years
Robert PhaneufRobert Phaneuf VP Corporate DevelopmentVP Corporate Development 1 Year1 Year 33 Years33 Years
Engineering & Operations:Engineering & Operations:
John FrickJohn Frick Operations ManagerOperations Manager 9 Years9 Years 34 Years34 Years
Sherman HyattSherman Hyatt Reservoir Engineering MgrReservoir Engineering Mgr 8 Years8 Years 34 Years34 Years
Ronald StrawserRonald Strawser Senior Reservoir EngineerSenior Reservoir Engineer 2 Years2 Years 21 Years21 Years
Mike KaiserMike Kaiser Senior Operations EngineerSenior Operations Engineer 9 Years9 Years 35 Years35 Years
Michael ZlomkeMichael Zlomke Senior Acquisitions EngineerSenior Acquisitions Engineer 1 Year1 Year 31 Years31 Years
Tully DavisTully Davis Land ManagerLand Manager 9 Years9 Years 29 Years29 Years
Manny RediferManny Redifer Senior GeologistSenior Geologist 2 Years2 Years 27 Years27 Years
Investment ConsiderationsInvestment ConsiderationsSignificant Managerial Industry ExperienceSignificant Managerial Industry Experience