ralf elsas / sabine mielert - lmu
TRANSCRIPT

Rating validation based on shocks to firms’ credit quality
Ralf Elsas1 / Sabine Mielert2
February 10, 2011
Abstract
This study suggests a new framework for validating issuer credit ratings assigned by credit rating agencies. Using a benchmark rating, based on publicly available information and high frequency market data, our framework builds on identifying severe (and permanent) shocks to firms' creditworthiness, particularly including fi-nancial distress. This leads to a rich data set of credit events which can be used to validate properties of credit ratings, because these shocks should lead to rating ad-justments, even under a rating-through-the-cycle policy.
As an illustration, the framework is applied to assess the information sensitivity of ratings by Standard & Poor's, and the timeliness of their adjustments. We analyze instantaneous shocks, a financial status incompatible with being investment grade, and financial distress for a large sample of European companies from 2000-2010. S&P does not adjust its corporate rating in at least one third of all cases. Moreover, even if a rating change occurs, this happens typically at a lag of about four to six months. This insensitivity seems neither attributable to private information from monitoring nor to the rating-through-the-cycle approach employed by S&P.
JEL classification: G14; G28; G33
Keywords: Credit ratings; Validation; Rating regulation; Financial distress
1 Corresponding author. Institute for Finance & Banking, Ludwig-Maximilians-Universität (LMU), Ludwigstr. 28, 80539 München, Germany. Email: [email protected]. Phone: +49 (89) 2180 2579. Fax: +49 (89) 2180 3607. 2 MECSQUARE Consultants, Munich, Germany. E-mail: [email protected].

2
1 Introduction
The recent subprime crisis in financial markets has raised severe doubts regarding the reliabil-ity of ratings provided by credit rating agencies (CRA) like Moody’s, Standard & Poor’s, or Fitch. Since credit rating agencies are pivotal,3 sometimes even described as the “gatekeepers of financial markets“, this has triggered strong moves towards an international, and more strict regulation of these financial intermediaries.
This study contributes to the discussion on how to design a regulatory framework for credit rating agencies and their corporate ratings,4 by suggesting a new framework to validate (or backtest) desirable properties of agency ratings in an economically well-founded way.
The major obstacle for the design of powerful rating backtests is the low frequency of compa-ny defaults, as the event commonly used to validate ratings. We suggest to use benchmark ratings based on daily stock price data (i.e. estimates of firms' probabilities of default from a structural model) to identify severe credit shocks to firms. These provide a much larger sam-ple of events usable for backtesting purposes than just relying on company defaults, thereby alleviating the small sample size problem.
We illustrate this framework by examining the information sensitivity of issuer ratings by Standard & Poor's. To this end, we test whether S&P ratings change if severe (and thus per-manent) shocks to a company's default risk occur, and how long it takes until ratings are ad-justed. The study’s objective is thus unique not only for suggesting a new backtesting ap-proach, but also since this is the first study (to the best of our knowledge) that does not ana-lyze the determinants of observed ratings or rating changes (Ang/Patel 1975, Blume/Lim/MacKinlay 1998), but rather focuses on the reverse question, whether a rating should have been changed, given the development of economic determinant.5
The study is organized as follows. In the second section we discuss the basic structure of our backtesting approach, describe our data, and explain the estimation of the benchmark rating based on market prices. We then examine the benchmark rating with respect to default risk prediction, by studying the predictive power of the benchmark rating for observed market prices of default risk (i.e. premia on credit-default-swaps, CDS), and by analyzing predictive power for company defaults. These tests are conducted out-of-sample, and demonstrate a high predictive power of the benchmark rating. In the third section, we suggest some definitions of severe (and likely permanent) credit shocks to companies, which can be used for backtesting purposes. These shocks comprise instantaneous increases in default risk, credit quality deteri-orations inconsistent with an investment grade status of the issuer, and, in particular, financial
3 For example, the IOSCO states that “many investors and market participants effectively outsourced their valua-tions and risk analyses to the [Credit Rating Agencies]”, IOSCO 2008, p.2. IOSCO is an abbreviation for Inter-national Organization of Securities Commission. 4 For an analysis of agency ratings with respect to structured securities, see Pagano/Volpin 2009. 5 Robbe/Mahieu (2005) is the study closest to ours. They show that a capital market based rating from the com-mercial provider Moody’s KMV predicts changes in long-term issuer ratings by Standard & Poor’s. However, unlike to the focus of our study, they do not analyze the cases where the KMV rating predicts a change, but S&P does not adjust its corresponding rating.

3
distress of companies. Since financial distress appears as an economically particularly impor-tant credit event, we also provide an in-depth empirical validation of the distress criterion's ability to identify companies truly in financial distress.
In the fourth section, we illustrate our validation framework by empirically testing whether S&P ratings adjust to these credit shocks. Section 5 provides a robustness test, where we re-peat the S&P rating analysis based on industry-adjusted, abnormal DDs. Finally, in Section 6 we discuss our findings and their implications for the current discussion on rating agencies' regulations.
2 Backtest Design and Benchmark Ratings based on Capital Market Prices
2.1 Conceptual Issues
Backtesting of issuer ratings by rating agencies is a difficult task for several reasons:
Ratings fundamentally should reflect default risk of borrowers, but defaults or the init-iation of bankruptcy procedures are relatively rare corporate events. Thus backtests based on corporate defaults tend to have low power due to the small sample size of de-fault data.
Rating agencies, in particular Standard & Poor's, claim to use a so-called rating-through-the-cycle approach.6 Rating-through-the-cycle mandates to change ratings on-ly if quality shocks are persistent rather than transitory, in the light of the current busi-ness cycle (Löffler 2004). Thus, a backtest might have to differentiate between tempo-rary and persistent changes, because only for permanent shocks one could then unam-biguously expect ratings to change when borrower default risk changes.
The theory of financial intermediation suggests that rating agencies have private in-formation about borrowers.7 A backtest from independent third parties (like regula-tors), however, cannot be based on private information, by definition.
We suggest to assess the credit quality of companies based on publicly available capital mar-ket information, and condition the analysis of issuer ratings by CRA on severe credit shocks to firms (but not necessarily firm default). This alleviates the data size limitations of valida-tion based on accounting and/or default information only. It also reduces noise in the rating benchmark due to temporary fluctuations in the credit risk of companies, because we focus on economically severe shocks (in particular financial distress), which by definition reflect per-sistent changes in the credit quality of firms. Finally, with respect to the public versus private information issue, since structural models based on market price are well known to have a good predictive power of future defaults, such a framework provides at least an economically well-founded starting point for regulators to analyze and discuss rating quality with the agen-cies.
6 S&P defines rating-through-the-cycle as follows: „We attempt to avoid assigning high ratings to a company at its peak of cyclical prosperity, if that performance level is expected to be only temporary. Similarly, we may not lower ratings to reflect weakening performance because of cyclical factors, if the downturn is likely to be only temporary or there are good prospects for management to respond to the changed circumstances”, S&P (2008). 7 See Ramakrishnan/Thakor (1984) and Boot/Milbourn/Schmeits (2006).

4
2.2 Data
The empirical analysis of this study is based on the sample of European companies being a constituent of the Dow Jones STOXX Total Market index at some time during the years 2000 and 2009. This constitutes a sample of 1,606 large European companies, out of which 468 are rated by Standard & Poor’s. We use annual and quarterly reports from Worldscope and stock price information provided by Datastream as our main information sources. Information on S&P long-term issuer ratings is taken from both Datastream and S&P.8 We use the period from 2000-2005 for calibration purposes (in particular to estimate DD characteristics as a benchmark for investment-grade rated firms, see below), while the actual testing period starts in 2006 and extends until April 30, 2010. The testing period covers the international subprime crises, which started in Europe at about July 2007 and has (as of mid 2010) not yet ended.9 Companies without rating by S&P are used for comparison and, in particular, rankings in the cross-section of our sample.
To avoid a survivorship bias in the sample construction, we trace all companies which were or have been a constituent of the STOXX index since 2000. Still, the sample is a selection of large companies which might impose some selection bias. However, we do not believe this selection to materially affect our analysis, since in Europe, basically only large firms are rated by credit rating agencies in the first place. Also, firm size is correlated with public attention and information production by investors, analysts and regulators. Analyzing large firms thus ensures the availability of rated firms, a minimum level of available public information, and that reputation costs of false rating attributions by a CRA will be the highest. All of these fea-tures render our sample suitable for the intended analysis. Moreover, the reputation effect should provide incentives for the agencies to quickly adjust their corporate ratings if credit quality of companies changes.
2.3 Capital Market Benchmark Rating
2.3.1 Structural Model Framework
Our validation framework requires a benchmark to assess the credit quality of firms indepen-dently from any CRA’s assessment. There exist many different approaches in the literature to assess the probability of default of a company. Statistical and, in particular, structural models are well known to have good predictive power for firm default (see e.g. Hillegeist et al. 2004, Bharath/Shumway 2008, Reisz/Perlach 2007, or Ericsson et al. 2007).
Still, there is some skepticism regarding the ability of structural models to estimate a firm's probability of default. These concerns are mainly due to two issues: the theoretical framework of the Merton-model relies on some restrictive assumptions (such as a geometric Brownian motion of the asset value process, or the usage of zero-bonds as firm debt), and one of the first
8 We rely on S&P long-term issuer ratings for maximum coverage of European firms and, most importantly, because these are unaffected by the LGD, see the discussion in Section 2.3.1. 9 For a description and analysis of the subprime crisis see Reinhart/Rogoff (2008), Hellwig (2009), and De-myanyk/van Hemert (2009)

5
studies testing the explanatory power of structural models reported a negative bias when ana-lyzing credit spreads for corporate bonds (Eom/Helwege/Huang 2004).
The original Merton-approach has been extended in the literature by relaxing several of the restrictive assumption,10 but evidence that these extended structural models empirically out-perform simpler formulations is rather limited. Also, our analysis mostly depends on the mod-els ability to rank firms according to their default risk, such that we actually do not need to translate the distance-to-default into actual probabilities of default, which alleviates concerns in particular with regard to the assumption of normally distributed asset value changes.
Moreover, there is evidence that the standard Merton approach has good predictive power, despite of the negative results reported by Eom/Helwege/Huang (2004). As shown by Erics-son et al. (2007), the result that structural models tend to underestimate credit spreads is most-ly driven by analyzing credit spreads from corporate bonds, which are affected not only by credit risk determinants but other factors as well (like liquidity). When applying structural models to direct market prices of credit risk (i.e. CDS spreads), the structural approach per-forms well in explaining credit spreads (Ericsson et al. 2007, Das/Hanouna/Sarin 2009).11 Also, Duffie/Saita/Wang (2007) find significant predictive power of the distance-to-default in explaining term structures of default hazard rates for U.S. firms. The commercial success of the implementation by KMV with investors, and the acknowledgement of the model under Basle II banking regulations further illustrate the acceptance of structural models.
Stating that structural models do well in explaining CDS spreads or firm defaults does of course not correspond to saying that structural models are necessarily the best performing models for these tasks. It is actually quite contended which approach (statistical vs. reduced-form vs. structural models) performs best, and some studies show that the DD is not a suffi-cient statistic for forecasting firm default (see for example Bharath/Shumway 2008 and Hil-legeist et al. 2004). However, in the context of this study it is in particular important to have predictive power and timeliness of the assessment for a suitable benchmark rating. Due to the reliance on daily stock prices, structural models do have the unique feature that they allow updates of the PD-estimate with high-frequency, thereby allowing a precise measure, at what time credit events occur. Most other approaches primarily rely on accounting information, where updates occur at best with a quarterly frequency and are therefore less suited to meas-ure adjustment behavior to credit shocks.
Hence, due to the high frequency of stock price observations, the broad coverage of stock markets, and the evidence supporting the predictive power of ratings based on stock prices,
10 For example, Black/Cox 1976 and Leland/Toft 1996 allow for more complex debt structures and firm default on the first passage of the default barrier, instead of assuming that default occurs only at maturity, as in the Mer-ton (1974) model. 11 Monte Carlo evidence suggests that the performance of structural models can be significantly improved when not relying on the (popular) two-equation approach, where the Black/Scholes/Merton-equation (see equation 1) for the equity value and a relationship between equity volatility and asset value volatility (derived using Ito's lemma) are simultaneously solved. This approach leads to highly biased estimates of the asset value and its vola-tility for firms with significant default risk, because one forces equity volatility to be constant over the estimation period, although it is asset volatility which is under the models assumptions constant, such that equity volatility is non-stationary (see Galai/Masulis 1976 and Hirsch 2007). In contrast, the iterative approach suggested by KMV is an implicit maximum likelihood estimation which performs well, see Duane et al. (2005)

6
we employ a capital market rating based on the structural model by Merton (1974). However, to further alleviate concerns regarding the models capability to estimate default risk, we report corresponding evidence in Section 2.3.2, demonstrating the out-of-sample predictive perfor-mance of our implementation of the Merton approach.
Another concern might arise because credit risk consists of two components: the probability that a company defaults, and the loss-given-default (LGD). Using the Merton framework pro-vides an estimate of a firm's probability of default. Note that, for example, credit-default-swap (CDS) spreads are measures of credit risk, i.e., are affected by both LGD and PD expecta-tions. It is less clear whether issuer ratings by CRA measure the probability of default or cre-dit risk, which is PD times LGD. In this study, we rely on S&P issuer ratings because, con-trary to Moody's, S&P quite clearly states that their ratings are not affected by LGD. In their ratings definitions, S&P states "issuer credit rating is a current opinion of an obligor's overall financial capacity (its creditworthiness) to pay its financial obligations. ... It does not apply to any specific financial obligation, as it does not take into account the nature of and provisions of the obligation, its standing in bankruptcy or liquidation, statutory preferences, or the legal-ity and enforceability of the obligation." (S&P 2009, p. 8). This is further substantiated by the fact that S&P in addition offers so-called "recovery ratings", which asses the expected recov-ery in case of default.
Nevertheless, S&P ratings might be affected by LGD empirically (for example simply be-cause LGD is negatively related to the PD, see S&P 2010 and Altman et al. 2003), which then could imply that our capital-market benchmark rating and the S&P issuer rating measure dif-ferent aspects of credit risk. It is unlikely that this will affect our results on the information sensitivity of S&P ratings for two reasons, however. On the one hand, PDs are much more volatile than LGDs empirically, such that changes in ratings will be mostly driven by changes in the PD. On the other hand, we provide a robustness test of our results by adjusting firm DDs by the respective industry-average DD, which is likely to extract most of the changes in LGD expectations because these are likely to be highly correlated within an industry.
In terms of model implementation, we estimate the so-called distance-to-default (DD) as our central measure for the credit quality of firms. The DD is defined as the number of standard deviations a firm’s asset value needs to change in order to hit the default barrier (within one year). We solve for each trading day and each company the central option-pricing equation (1) from Merton (1974), which relates the observable equity market value (the value of the call option of equity owners to buy the firm’s assets by repaying the debt outstanding) to the un-observable asset value and its volatility.12 We employ a numerically efficient iterative proce-dure to solve the one equation for the two unknowns, based on a rolling window of 250 trad-ing days.13 Duane et al. (2005) show such iterative procedures correspond to a maximum like-lihood estimation of parameters, implicitly relying on the expectation maximization (EM) algorithm. Debt information is taken from balance sheets (or quarterly reports, if available),
12 Merton (1974) assumes that the asset value follows a Geometric Brownian motion. 13 The basic algorithm, as suggested by Crosbie/Bohn (2003), uses a time series of 250 equity values, which are transformed into asset values by solving equation (1) using some starting value for the asset volatility. The re-sulting times series of asset values is used to provide a new estimate of asset volatility, which is again used to generate asset values form (1). This is repeated until the asset volatility estimate converges.

7
and is used with a minimum lag of two month relative to the fiscal-year-end day, to avoid a "look-ahead"-bias of the estimates.
(1)
In equation (1), E denotes the market value of equity (the call price), D the nominal amount of
debt due at time T, r the continuous risk-free interest rate, A the asset value, A the volatility of the asset value, and N(.) the cumulative distribution function of the standard normal distri-bution. The term labeled d2 reflects the critical indifference point, where the equity owner’s call option will not be exercised, and thus reflects the probability of default of a company. Hence, (-) d2 is the definition of the so-called distance-to-default (DD), as illustrated by equa-tion (2), where PD denotes probability of default.14
(2) DDNPD
T
TrD
A
DDA
Af
2)5.0(ln 2
The PD is calculated using a first-order approximation of the first-passage time of the Brow-nian motion of the asset value process to cross the default boundary.15 Our implementation thus incorporates firm default before maturity of debt (as opposed to the standard Merton model) in way similar to KMV's approach.
2.3.2 Evidence on the Benchmark Model's Predictive Power of Default Risk
To illustrate the ability of our implementation of the capital-market rating to predict corporate default, we report two exercises. The first consists of analyzing the relationship between a firm's distance-to-default and market prices of default risk (i.e. CDS spreads) for this compa-ny. If the DDs were informative about company default risk, it should be able to explain ob-served CDS prices.
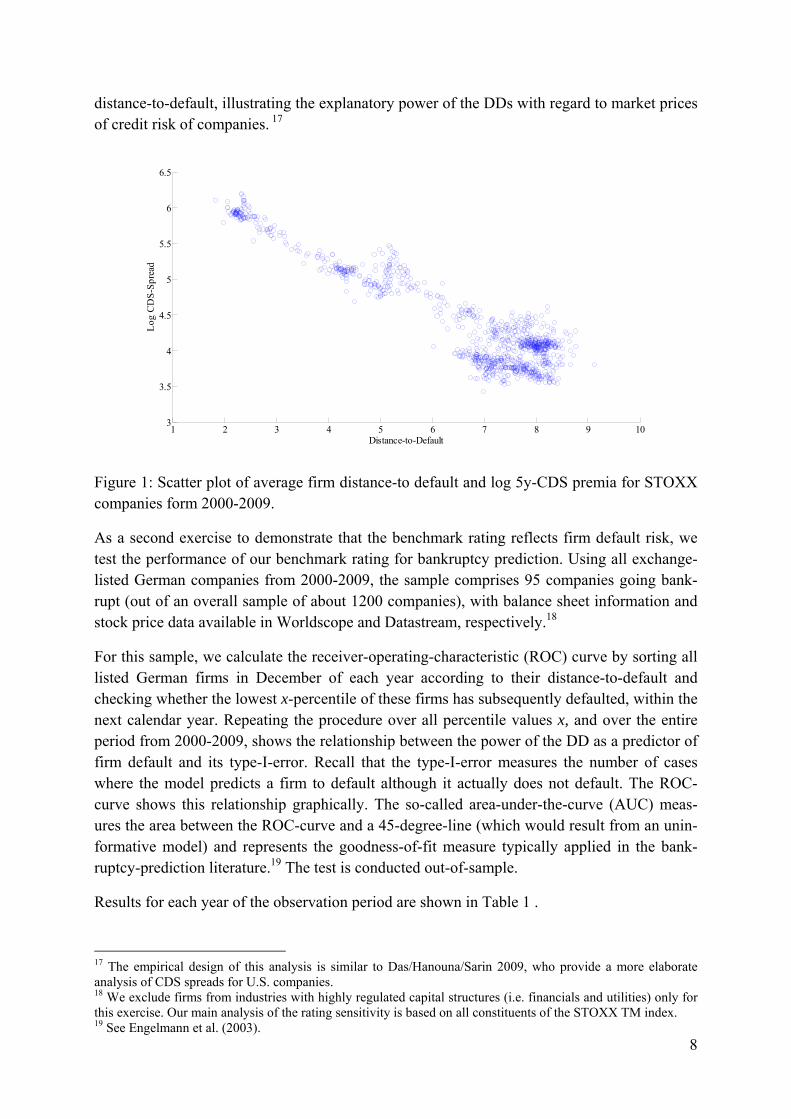
Correspondingly, Figure 1 shows a scatter plot of average firm DDs and the average log of 5y-CDS premia for all companies in the STOXX universe with traded CDS from 2000-2009 (385 firms).16 The figure shows a strong linear relationship between the CDS prices and the
14 For the implementation, we assume that the debt due at time T, which is chosen to be one year, is a company’s total liabilities. Also, we calculate the DD under the risk neutral measure, using daily 3-month Euribor rates as the risk free interest rate. We match balance sheet data to stock price information with a minimum lag of two month after the fiscal-year-end day, in order to avoid relying on information not yet available to investors. Alter-ing these choices (increasing the lag, choosing short term debt plus half the long term debt as debt due etc.) does not qualitatively affect the results of our study. 15 See Martellini et al. (2003), S. 452 or Dwyer/Qu (2007), S. 32. 16 Data on CDS spreads are taken from Datastream. We use the veracity index provided by Datastream to include spreads from traded CDS into the analysis only.
Tdd
T
TrddNDedNAE A
A
DA
rTA
21
2221 ,
lnmit)()(
2
8
distance-to-default, illustrating the explanatory power of the DDs with regard to market prices of credit risk of companies. 17
Figure 1: Scatter plot of average firm distance-to default and log 5y-CDS premia for STOXX companies form 2000-2009.
As a second exercise to demonstrate that the benchmark rating reflects firm default risk, we test the performance of our benchmark rating for bankruptcy prediction. Using all exchange-listed German companies from 2000-2009, the sample comprises 95 companies going bank-rupt (out of an overall sample of about 1200 companies), with balance sheet information and stock price data available in Worldscope and Datastream, respectively.18
For this sample, we calculate the receiver-operating-characteristic (ROC) curve by sorting all listed German firms in December of each year according to their distance-to-default and checking whether the lowest x-percentile of these firms has subsequently defaulted, within the next calendar year. Repeating the procedure over all percentile values x, and over the entire period from 2000-2009, shows the relationship between the power of the DD as a predictor of firm default and its type-I-error. Recall that the type-I-error measures the number of cases where the model predicts a firm to default although it actually does not default. The ROC-curve shows this relationship graphically. The so-called area-under-the-curve (AUC) meas-ures the area between the ROC-curve and a 45-degree-line (which would result from an unin-formative model) and represents the goodness-of-fit measure typically applied in the bank-ruptcy-prediction literature.19 The test is conducted out-of-sample.
Results for each year of the observation period are shown in Table 1 .
17 The empirical design of this analysis is similar to Das/Hanouna/Sarin 2009, who provide a more elaborate analysis of CDS spreads for U.S. companies. 18 We exclude firms from industries with highly regulated capital structures (i.e. financials and utilities) only for this exercise. Our main analysis of the rating sensitivity is based on all constituents of the STOXX TM index. 19 See Engelmann et al. (2003).
1 2 3 4 5 6 7 8 9 103
3.5
4
4.5
5
5.5
6
6.5
Log
CD
S-S
prea
d
Distance-to-Default

9
Table 1: Out-of-Sample Predictive Power of Capital-Market Benchmark Ratings (ROC-Analysis)
Year ROC /AUC # Bankruptcies Default Rate
2001 0,713 15 4,23%
2002 0,803 24 5,52%
2003 0,873 8 2,19%
2004 0,828 10 2,53%
2005 0,905 5 1,23%
2006 0,730 5 1,10%
2007 0,972 3 0,60%
2008 0,899 7 1,38%
2009 0,901 18 3,03%
0,85 95 2,43%
Table 1 shows that the average area-under-the-curve is fairly high with a yearly average of 85% (which compares to the fictitious perfect prediction model with 100% AUC). Clearly, the DD reflects default risk and has out-of-sample predictive power.
2.3.3 Distance-to-Default as a Determinant of Rating Changes
Some results on the dynamics of S&P ratings are shown in Table 2, which also provides the number of firms in the sample (1606) and the number of firms with an S&P rating available (468). The table provides in particular results from a brief analysis of the association between changes in the distance-to-default and changes in S&P corporate ratings, conditioning on S&P changes.
The analysis shown in Panel B of Table 2 establishes that there is some relationship between the DD and changes in the S&P ratings. Downgrades by S&P are associated with a significant decrease in DD before the downgrade, but not afterwards. The table shows that over the 90 days period before the downgrade, the DD decrease by a statistically significant 9.89% in the median. DD changes 90 days before and after upgrades by S&P are significant as well, with an median change of about 7% each. These results are in line with the study by Robbe/Mahieu (2005), who show that the distance-to-default provided by the commercial vendor KMV can predict changes in S&P ratings.20 However, this type of analysis cannot show whether S&P should have changed its ratings, which is the focus of our analysis of adjustments following severe shocks to firms’ credit quality.
20 We also conduct a more elaborate analysis using an ordered probit panel regression. Here, ordinal changes in S&P ratings (downgrade, stay, upgrade) are regressed on cumulative changes of the DD over different time in-tervals, the DD level, and year dummies. The results from this multivariate analysis are similar in that cumula-tive decreases in the DD preceding the rating change by 60 and 180 days significantly explain rating down-grades.

10
Table 2: External Rating Dynamics
The table shows in Panel A the number of firms in our sample (overall and with S&P long-term issuer rating available). Panel B shows the frequency of observed downgrades by S&P (based on a 21-class rating scheme, i.e. treating +/- notches as a separate class). Panel B also shows the median DD at the day of a S&P rating change, and the median percentage change in the DD within a 90 days interval around the rating change. The signific-ance of DD-changes is tested using a Wilcoxon rank test, where ***, ** denote significance at the 1%- and 5%-level, respectively.
Panel A: Sample Structure
S&P-Rating Overall
No. of Firms 468 1606
Panel B: Association between DD and S&P Rating Changes
DD (90 days befo-re)
Median DD at rat-ing change
DD (90 days after)
Upgrades S&P 336 7.95 %** 5.53 7.21%***
Downgrades S&P 686 -9.89 % *** 2.57 +2.78 %
3 Credit Shocks used for Validation
3.1 Instantaneous Deterioration and Non-Investment-Grade Status
The basic idea of our framework is to use severe credit shocks as events for validation pur-poses. Accordingly, we need to define credit events which constitute a significant and likely persistent shock to the credit quality of firms. Although such definitions are to some extent arbitrary, we think it is plausible that the following three events represent such shocks, in as-cending order regarding the severity for the company.
1. Instantaneous Shock: The default risk of a company increases significantly within a short period of time.
2. Non-Investment-Grade: The default risk of a company becomes, over a sustained pe-riod of time, too high to be considered as investment grade.
3. Financial Distress: The default risk of a company becomes critically high, such that the company is in financial distress.
We believe that all three situations characterize severe and persistent shocks to the credit quality of companies, such that a corporate rating needs to be adjusted, even if a rating agency pursued a rating-through-the-cycle approach. To identify these situations using our capital-market-based distance-to-default measure, we mostly rely on empirical calibrations based on the level of the DD and the percentile of the company in the cross-section of sample.
The first situation of an instantaneous shock to the credit quality is measured by
a spontaneous reduction in the DD by at least 25% (which remains stable for at least 10 successive days to avoid relying on outlier movements in the DD), and

11
a DD level of at most 4, to ensure an economically significant level of default risk.21
The second situation of a credit quality inconsistent with an investment grade status of the company occurs if:
the DD is for at least 20 successive days in the lowest quartile of the cross-section of all companies in the STOXX-universe,
the DD is numerically less than 2,
the company is rated at least “BBB-“ by S&P.
This criterion is based on the in-sample characteristics of our sample firms before the testing period, i.e. from 2000 until 2005. A deterioration in a company’s credit quality below an in-vestment grade status is economically an important event, because many institutional inves-tors are mandated (either by law or their own investment guidelines) to invest in investment grade assets only.22 Empirically, in our sample until 2005, the average DD of an investment grade company is 5.2, while it is only 3.7 for non-investment grade firms. Also, the average percentile rank of a non-investment grade firms is 28%. Thus, if a firm is persistently on a DD level of at most 2 and in the lowest quartile rank of all companies, it appears very likely that one would not consider it as being investment grade anymore.
3.2 Financial Distress
Finally, the third and most severe credit event occurs if a firm enters financial distress. Finan-cial distress describes a situation where the default risk of a company is critically high such that stakeholders start engaging in restructuring activities (like recapitalizations, management turnover, etc., see, for example, Andrade/Kaplan 1998). Note that financial distress precedes the initiation of legal bankruptcy proceedings. Also, it does not necessarily lead to bankrupt-cy, because restructuring activities (a workout) might turn out to be successful. The relation-ship between financial distress and bankruptcy is illustrated by Figure 2.
Figure 2: Financial Distress versus Bankruptcy
21 Crosbie/Bohn (2003) report that calibrating DDs to the KMV default database leads to a distribution that cor-responds roughly to a t-distribution with 3 degrees of freedom. Using this approximation, a DD of 4 corresponds to a PD of 1.4% p.a., a DD of 2 corresponds to about 7% PD, and a DD of 1.5 to about 12% PD. 22 Historically, the notion of investment grade status was generally used by regulators and bankers to describe securities “safe enough” to invest in. Nowadays, investment grade is usually defined by an S&P rating of at least “BBB-“.
Financial DistressRestructuring
SuccessfulWorkout
Bankruptcy Procedures

12
Accordingly, the basic idea to measure financial distress is to identify a situation, where a firm has a critically high default risk over a sustained period of time. Correspondingly, we measure financial distress as follows:
The distance-to-default is for at least 10 successive days less than 1.5,
the company is in the lowest 5% percentile in the cross-section of all sample compa-nies.
The combination of a filter on the absolute level of default risk (i.e. the DD) assures that the filter identifies firms with an economically significant default risk. The company also belongs relatively to the firms with the lowest credit quality, due to filtering on the percentile rank of firms. The minimum period of 10 successive days avoids that the criterion picks up only tem-porary default risk fluctuations.
Note that the number of firms classified as being distressed varies over time (with the busi-ness cycle), which corresponds to stylized facts on corporate crises (and defaults). The re-quirement on the DD-level assures that only firms with an economically significant default risk are identified, because in boom times of the business cycle, even low ranked companies might have very high DD and thus a sound financial situation. To illustrate, Figure 3 shows the number of German companies in financial distress (according to the above criterion) over time.
Figure 3: Number of Companies in Financial Distress from 2000 to 2009, Germany (the thick line is a smoothed number of firms)
Validation of this distress criterion is complex since the incidence of financial distress cannot be directly observed (as opposed to the initiation of bankruptcy procedures). Still, validation can be based on several economic implications of financial distress:
i) The number of firms which are classified as distressed can be compared to the number of companies subsequently going into bankruptcy. Although distress does not neces-
Jan01 Jan02 Jan03 Jan04 Jan05 Jan06 Jan07 Jan08 Jan0910
15
20
25
30
35
40
45
50
55

13
sarily imply bankruptcy, the reverse relationship should hold. Thus one should expect that firms which went bankrupt had been in financial distress at some time before.
ii) Firms classified as distressed should exhibit significant restructuring activities subse-quently.
iii) Firms which are not classified as being in financial distress should not show systemat-ic restructuring activities.
These conditions should hold for any feasible distress criterion, although one needs to take into account the inevitable statistical error of any estimator (rejecting the null hypothesis if it is true, the type-I error, or not rejecting the null if it is wrong, the type-II error). Further limi-tations may arise because some firms do not disclose restructuring activities. Also, in applied empirical work, it seems prohibitively costly to screen all listed companies for restructuring activities, since one needs to conduct manual research based on keyword searches to this end.
Elsas/Stephenson/Stein (2009) apply the same criterion for financial distress as used in this study for all German listed companies from 1994-2006. They test the first two validation cri-teria. Regarding the first criterion concerned with bankrupt firms, the authors show that 82% of companies initiating bankruptcy procedures were filtered as financially distressed at some time within the preceding 18 months. Moreover, a German firm classified as distressed goes into bankruptcy within 18 months with a probability of 23%. Hence, the power of the criterion to predict bankruptcy is fairly large, and the corresponding type-II error is low with just 18%.
Elsas/Stephenson/Stein (2010) identify 383 German firms in financial distress in total. Out of these, within the subsequent 18 months
95 firms go into bankruptcy,
47 firms are taken over (including 12 firms with bankruptcy),
164 firms have a forced top management change,
73 firms report explicit restructuring activities in mandatory disclosures or news an-nouncements.
Hence, in only 86 out of 383 filtered cases of firms in financial distress (22.5%), neither re-structuring activities nor bankruptcy can be observed.
Overall, these results indicate that the distress criterion can indeed identify firms in financial trouble, and it seems that the potential number of misclassifications (i.e. firms classified as distressed although no apparent distress consequence occurs subsequently) is reasonably low.
4 Testing Rating Sensitivity to Credit Shocks
4.1 General Description of Results
Table 3 shows the results from examining S&P rating responses to severe shocks in the credit quality of firms. The table differentiates between the three types of credit shocks, correspond-ing results are shown in the second (Instantaneous Shock), third (Non-Investment-Grade), and fourth (Financial Distress) column.

14
From Panel A of Table 3, it can be seen that out of the maximum of 468 STOXX constituent firms with an S&P rating, 118 faced an instantaneous credit shock, 137 faced a credit quality inconsistent with an investment grade status (although investment-grade rated by S&P), and 65 firms entered financial distress.23 The second row in Panel A shows that these shocks are partly overlapping, because e.g. 58 out of 118 firms with an instantaneous drop in the DD also met the distress criterion at some time. Also, the fraction of companies facing the particular credit shock belonging to the financial sector is provided, with fractions ranging from 53% to 81%, as an outcome of the subprime crisis.
Table 3: Credit Shocks and Rating Adjustment (2006 - April 2010)
The table shows the frequency distribution and other information for S&P rated companies, where one of the three credit shocks „Instantaneous Shock” (at least a 25% DD deterioration, for at least 10 successive days), “Non-Investment-Grade Status” (DD is in the lowest cross-sectional quartile, less than 2, for at least 20 succes-sive days, firm is at least “BBB-“ rated by S&P), or “Financial Distress” (DD is in the lowest 5% percentile, less than 1.5, for at least 10 successive days) have occurred for the first time between 2006 and April 2010.
Instantaneous
Shock Non-Investment-
Grad Financial Distress
Panel A: All Rated Companies with Event
No. event firms 118 137 65
Thereof in financial distress 58 53 65
Fraction of financials 54% 64% 75%
Panel B: Companies with Rating Change after Event
Number of firms (Fraction of firms) with rating change
77 (65%) 77 (56%) 44 (68%)
Period from event until rating change [median]
179 days 214 days 151 days
Panel C: Companies without Rating Change after Event
Number of firms (fraction) without rating change
41 (35%) 60 (44%) 21 (32%)
Thereof in financial distress 14 12 21
Fraction of financials 60% 66% 81%
S&P-Rating at last rating change [median]
A- A- A
DD at last rating change [median] 4.66 4.61 2.52
DD at event [median] 1.25 1.88 0.76
Period from last rating change to event [median]
532 days 654 days 476 days
Period since event (final obs. Day: April 30, 2010) [median]
502 days 538 days 570 days
23 For comparison, when not conditioning on firms being rated, out of the overall sample of about 1600 firms we find 373 firms facing an instantaneous shock, and 171 firms entering financial distress, from 2006 to April 2010. Note that the non-investment-grade criterion by definition requires a rating by S&P to be available.

15
4.2 Instantaneous Shock
Focusing first on the group of firms that (for the first time) faced an instantaneous drop in the DD, from Panel B can be inferred that 77 out of 118 cases (65%) were subsequently down-graded by S&P. Note that changes in the S&P rating here are defined as any downgrade in the corporate rating, even if it is just by a “+” or “-“notch. Actually, the observed adjustment be-havior needs to be further qualified, since the median response time between the occurrence of the credit shock and the subsequent rating change is 179 days, i.e. half a year.
In Panel C of Table 3 the subsample of event firms without S&P rating adjustment is de-scribed. In the median, firms facing an instantaneous shock to their DD were “A-“ rated, with a DD of 4.66 at the last rating change by S&P. After the instantaneous shock, the median DD level was only 1.25, which occurred in the median 532 days after the last rating change. Final-ly, the last row of Panel C shows that since the occurrence of the shock, the S&P rating was (at least) not adjusted for 502 days in the median, such that the non-adjustment cannot be ex-plained by having too short an observation period after the event.
Figure 4 provides a case study of one company facing an instantaneous shock to its credit quality, as indicated by the corresponding benchmark rating. The figure shows the DD devel-opment of ArcelorMittal, a large steel manufacturer. Illustrating the typical pattern of a com-pany being subject to an instantaneous shock to its credit quality, the DD-level of ArcelorMit-tal was fluctuating around a level of about 5 and steadily decreasing until the third quarter of 2007, when in the first quarter of 2008 the sudden deterioration occurred.
ArcelorMittal was upgraded to the rating “BBB+” by Standard & Poor’s in November 2007, and only in June 2009 the rating was reversed to “BBB”.
Figure 4: Development of the Distance-to-Default (DD) of ArcelorMittal
Q1-07 Q2-07 Q3-07 Q4-07 Q1-08 Q2-08 Q3-081
2
3
4
5
6
7
8
Shock
Dis
tanc
e-to
-Def
ault
Calendar Time

16
4.3 Non-Investment-Grade
The next group of event firms has a benchmark rating inconsistent with an investment-grade status. As described above, these firms have a DD of less than 2 for at least 20 successive days, belong to the lowest DD-quartile of the cross-section of all STOXX companies at each of these days, and are investment grade rated by S&P. Table 3 shows that out of the 137 firms comprised in this event group, 77 are downgraded by S&P, 214 days after the shock, in the median. However, in 44% of all cases the S&P rating was not changed, at least over the me-dian of the next 583 days. As Panel C shows, the median event firm without rating adjustment has been rated “A-” by S&P since 654 days, where the DD at the last change was 4.61. After the event (i.e reaching a DD-level inconsistent with an investment-grade status), the median DD is 1.88.
Figure 5 shows a typical case study on firms in this event group. The graph shows the DD development of Fiat Spa, the Italian automotive company, and illustrates a steady deteriora-tion of Fiat’s credit quality since the third quarter of 2007 according to the benchmark rating. About one year later (in June 2008), the DD and Fiat’s relative rank in the cross-section be-comes so low, that the company’s financial status seems not consistent with an investment-grade status anymore. Fiat’s rating by S&P, however, was upgraded to “BBB-“ in April 2008, thus becoming investment-grade. In October 2008, the outlook was set to “negative”, and at the end of March 2009, Fiat was once again downgraded to "BB+", i.e. non-investment grade.
Figure 5: Development of the Distance-to-Default (DD) of Fiat Spa
4.4 Financial Distress
Finally, the group of event firms being in financial distress allows to analyze rating adjust-ment by S&P for companies facing the most severe shock to their credit quality. Here (col-
Q1-07 Q2-07 Q3-07 Q4-07 Q1-08 Q2-08 Q3-08 Q4-08 Q1-09 Q2-09 Q3-09 Q4-090
1
2
3
4
5
6
7
8
Non-Investment-Grade
FIAT
Dis
tanc
e-to
-Def
ault
(DD
)
Calendar Time

17
umn 4 of Table 3), a company belongs to the lowest 5% DD-percentile in the cross-section of firms, and the DD is less than 1.5 for at least 10 successive days. As shown in Section 3.2, this distress criterion identifies firms with severe financial difficulties with a high likelihood. Still, the adjustment pattern for S&P ratings is similar to the other events. In 44 out of 65 cas-es (68%), S&P changed the corporate rating after the onset of financial distress. However, a rating downgrade occurs only 151 days after entering financial distress, in the median.
Also similar to the other events, the actual observation period for event firms without a rating change was 570 days, in the median. This time span appears sufficient to allow for the obser-vation of any rating adjustment. This did not occur for 32% of firms in distress.
From Panel C of Table 3 can be seen that the fraction of financial services firms is higher in the event group of financially distressed companies than in the other groups, due to the occur-rence of the subprime crisis. Figure 6 provides a case study. The figure shows the develop-ment of Commerzbank AG’s distance-to-default, where after the failure of Lehman Brothers in the U.S., the DD of Germany’s second largest commercial bank fell dramatically and re-mained subsequently on a level very close to zero. Not surprisingly, in November 2008 Commerzbank received state guarantees as supportive action by the government, and was partly nationalized in January 2009 to avoid bankruptcy.24
Commerzbank has been rated “A” by S&P since March 2007, the outlook was changed to “negative” in September 2008. No further rating actions have been taken since.
Figure 6: Development of the Distance-to-Default (DD) of Commerzbank AG
24 The German government provided capital support of about 18 billion Euro, and received a 25% stake in Commerzbank shares in return in January 2009. At this time, the market capitalization of Commerzbank's equity was only about 4.9 billion (on January 2, 2009).
Dis
tanc
e-to
-Def
ault
(DD
)
Calendar Time
Q1-07 Q2-07 Q3-07 Q4-07 Q1-08 Q2-08 Q3-08 Q4-08 Q1-09 Q2-09 Q3-09-2
-1
0
1
2
3
4
5
Distress
COMMERZBANK

18
5 Robustness: Shocks based on Abnormal Changes in Creditworthiness
One possible objection to the evidence provided in the previous section is that we use uncon-ditional DDs for the identification of credit shocks, thereby ignoring industry-level effects. If S&P applied the rating-through-the-cycle approach, it is possible that they interpret changes in the average default risk of an industry as a fluctuation driven by the business cycle, such that these changes in firm credit risk will not be reflected in their ratings.
To examine this issue, we repeat the analysis of S&P rating sensitivity against financial dis-tress of firms, but use abnormal DDs to identify distressed firms. Accordingly, we change the criterion such that a firm is in financial distress if
the (unadjusted) distance-to-default is for at least 10 successive days less than 1.5, and
the company is in the lowest 5% percentile of abnormal (industry-adjusted) DDs in the cross-section of all sample companies.
This adjusted criterion still assures a significant economic level of default risk by conditioning on the DD, but the firms' rank order has now been adjusted by the average industry develop-ment. The abnormal DD is calculated as a firm's distance-to-default minus the contemporane-ous average DD of the industry the firm belongs to. We identify industries based on the first two digits of the GICS code.
Note that, as a first idea, one might consider calculating abnormal DDs by just taking the market mean/median DD into account, as an alternative approach. However, subtracting any fixed number from all firm DDs at a given point in time does not change the relative ordering of firms. Thus, the distress criterion, based on the DD-percentile of firms in the cross-section, is automatically robust against being driven by the market-wide development of credit risk.

19
Table 4: Financial Distress and Rating Adjustment (2006 - 04/2010), based on abnormal DDs
The table shows the frequency distribution and other information for S&P rated companies that entered financial distress according to our benchmark rating. Information in the column labeled “Financial Distress” is a repetition of column 4 in Table 3, while "Financial Distress (abnormal DD)" indicates the applied distress criterion is based on firm DDs adjusted for their average industry DD level.
Financial Distress
(abnormal DD) Financial Distress
Panel A: All Rated Companies with Event
No. event firms 45 65
Fraction of financials 56% 75%
Panel B: Companies with Rating Change after Event
Number of firms (Fraction of firms) with rating change
27 (60%) 44 (68%)
Period from event until rating change [median]
108 days 151 days
Panel C: Companies without Rating Change after Event
Number of firms (fraction) without rating change
18 (40%) 21 (32%)
Fraction of financials 72% 81%
S&P-Rating at last rating change [median]
BBB+ A
DD at last rating change [median] 3.37 2.52
DD at event [median] 1.25 0.76
Period from last rating change to event [median]
325 days 476 days
Period since event (final obs. Day: April 30, 2010) [median]
423 days 570 days
Table 4 shows the results from the analysis of a distress criterion based on abnormal DDs of firms in column 2. To ease comparison, we repeat the results for the general distress criterion (i.e. no industry adjustment, see Table 3, fourth column) in column 3 of the table.
Comparing results illustrates that using abnormal, industry-adjusted DDs for distress identifi-cation has some impact on the sample. Mostly, the number of distressed firms reduces from 65 to 45, and the fraction of financial firms in distress reduces to 56% from 72%. Hence, the sample is reduced primarily by some firms in the banking industry, which, adjusted by the industry effect, didn't belong to the lower 5%-percentile of the cross-section of firms with regard to their default risk anymore. Given that the financial sector as a whole has been hit hardest by the financial crises, this result was to be expected. On the other hand, the distress sample based on industry-adjusted DD still comprises 80% of firms, who were classified as being in distress under the unadjusted criterion.
Apart from the sample size reduction and the slight change in composition, the main results on the information sensitivity of S&P ratings to credit shocks do not change. Table 4 shows that even when adjusting for the average industry-development, rating downgrades occur (on-

20
ly) in 60% of the cases, and it takes about 4 months for this to happen, in the median. All oth-er characteristics (such as the median rating at the event, the median time of observation after the event etc.) also remain similar to the analysis presented in Section 4.
Thus, as in the case without industry-adjustment, S&P rating changes occur at best with a significant lag relative to the incidence of the economic shock to the firm.
6 Conclusions and Implications for the Regulation of Credit Rating Agencies
This study contributes to the literature on credit rating agencies and the design of financial market regulation by suggesting a new methodology to validate issuer credit ratings. Using a benchmark rating based on publicly available information and high frequency market data, the framework builds on identifying severe shocks to firms' creditworthiness, in particular finan-cial distress. This leads to a rich and sizeable data set of credit events, which can then be used to validate properties of agency (or any other type of) credit ratings. Our backtesting approach is economically well-founded and
alleviates sample size limitations (compared to the situation where validation is based on accounting information or bankruptcies only),
reduces noise in the rating benchmark due to temporary fluctuations in the credit risk of companies, and
provides at least a well defined starting point for regulators to analyze and discuss rat-ing quality with the agencies, even if these relied on private information or a rating-through-the-cycle approach.
We illustrate this framework by analyzing whether a CRA adjusts its corporate ratings to re-flect fundamental credit shocks. The analysis of rating adjustment by Standard & Poor’s shows for a large sample of European firms, that agency ratings frequently do not reflect se-vere credit shocks to the credit quality of firms. We analyze instantaneous shocks, a financial status incompatible with being investment grade, and, as the most severe situation, companies entering financial distress. In these situations, S&P does not adjust its corporate rating in at least one third of all cases. Moreover, even if a rating change occurs, this happens typically (in the median) at a lag of about four to six months.25
Naturally, this observed pattern of information insensitivity asks for an explanation. We have strived at setting-up an empirical design such that the examined credit shocks are too severe to be reasonably classified as temporary deteriorations only. Hence, the observed lack of infor-mation sensitivity in corporate ratings cannot be attributed to a rating-through-the-cycle ap-proach by S&P. This is further illustrated by our analysis of abnormal DDs, which shows that our event criteria automatically control for the average credit risk development of the market, and that the response pattern of S&P ratings remains unchanged, when adjusting for the aver-age industry-development of each firm.
25 We believe that our results based on S&P ratings carry over to the corresponding Moody’s ratings. In general, the migration probabilities for both CRA’s long-term issuer ratings are similarly low. Furthermore, we have verified that Moody’s rating responses are similar to S&P for a random selection of our event cases.

21
Moreover, since these events are publicly observable and frequent, the lack of adjustment seems hard to be justified on average by any private information the CRA might have ga-thered. This becomes particularly clear for the subsample of financially distressed firms, comprising 81% of companies from the financial services sector. Our testing period covers the subprime crises and thus contains several banks that came in severe financial difficulties, as evidenced by the significant supportive actions set up by governments around the world in 2008. S&P ratings often do not reflect these shocks to the credit quality of banks. This is hard-ly explainable by private information of rating agencies, since it’s very unlikely that S&P had any better information on distressed banks’ bailout probabilities than other investors, whose corresponding assessment would be reflected in the capital-market rating.
Another (too) simple explanation is that corporate ratings by rating agencies generally do not reflect fundamental information on companies. We do observe rating adjustments in about two-thirds of our events. Moreover, other studies show that market values of firms react to announcements of rating changes by CRA (Hand/Holthausen/Leftwich 1992, Krahnen/Hirsch 2007), indicating that the rating changes contain some new information for the capital market. Other studies show that rating changes can be explained by economically reasonable determi-nants (Blume/Lim/MacKinlay1998). Hence, it’s too general a conclusion that external ratings are uninformative on borrower default risk. However, our study shows that they are at least slow in reflecting new information.
Another explanation is that rating agencies try to prevent so-called rating reversals, where a current rating is not changed, although fundamentally required, to avoid a reputational loss to the agency by reversing previous rating actions too quickly. Löffler (2005) shows that such a reversal-avoidance could severely diminish the information content of ratings, potentially affecting it more than monitoring credit quality of companies only twice per year.
Finally, at least our results regarding banks could potentially be explained by rating agencies giving in to political pressure during the subprime crisis, not to downgrade banks to avoid further destabilizations of financial systems. Of course, it's at least to be doubted whether such a behavior is desirable from an economic, an investor’s, or a regulatory point of view.
In the light of the current attempts to make credit rating agency regulation more stringent, our results provide important insights. First of all, the current debate on future regulation misses the issue what characteristics a desirable rating should have (at least from a regulatory pers-pective). It appears natural to expect ratings to be reflecting actual probabilities of default for a fixed prediction horizon, based on all available information. These features are not immi-nent to current corporate ratings by CRAs, however, e.g. because of the (alleged) filtering called rating-through-the cycle. But even more so, our evidence shows that ratings frequently reflect severe and likely persistent shocks to the credit quality of borrowers far too late.
Hence, the intended regulation of credit rating agencies not only needs to validate (and maybe redesign) the process of rating generation (for example by making remuneration schemes in-centive-compatible), it needs to define the purpose and desirable characteristics of ratings in the first place.

22

23
Appendix: Descriptive Statistics
In the paper, we use (daily) estimates of the probability of default or its normalized counter-part, the distance-to-default, from a Merton-type structural model as the benchmark to vali-date ratings by rating agencies. Figure A.1 shows the corresponding distance-to-default, DD, estimated from firms’ equity prices and debt information in our sample. The figure shows the development over time of the median, the 10th, and the 90th percentile of the DD of the STOXX firm universe (upper graph). The lower graph plots the corresponding development of the STOXX TM market index (lower graph). Clearly, the DD of these companies reflects the business cycle and has been significantly deteriorated because of the subprime crises, starting at about mid 2007. Note that lower values of the DD reflect higher probabilities of default.
Figure A.1: Time development of the DD compared to the DJ STOXX equity price index
Table A.1 presents descriptive statistics on our firm sample, comparing financial ratios and DD-levels for several industries and at two points in time, before (January 2005) and at the subprime crises (March 2009).
Dis
tanc
e-to
-Def
ault
2006 2007 2008 20090
5
10
15
Median 10%-Percentile 90%-Percentile
2006 2007 2008 2009200
300
400
500
600
Market-Index
Ind
ex

24
Table A.1: Sample Descriptive Statistics
The table shows descriptive statistics for our sample, consisting of constituents of the Dow Jones STOXX Total Market index at some time between 2000 and April 2010. The table is subdivided into ten different industries (rows, according to the GICS classification scheme), and two points in time of our observation period: January 5, 2005 and March 10, 2009. DD denotes distance-to-default, σ the standard deviation of the DD, ROE denotes return on equity (net income before extraordinary items / total common equity), Leverage is calculated as total liabilities / total assets. ROE and Leverage are reported in percentage points. All information from annual or quarterly reports is matched to calendar time with a minimum lag of two month with respect to the fiscal-year-end, to avoid using information that was not yet available to investors.
Sample as of January 2005 Sample as of March 2009
GICS Industry Share of
Sample
[%]
DD
[median]
DD
[σ] ROE [%]
Leverage [%]
Share of
Sample
[%]
DD
[median]
DD
[σ] ROE [%]
Leverage [%]
Financials 21.76 6.14 2.70 9.49 76.55 21.81 1.19 1.39 11.12 76.71
Industrials 21.54 6.35 2.42 3.31 66.06 21.41 1.65 1.13 21.25 65.76
Consumer Discre-tionary
17.36 7.00 2.50 11.15 57.33 15.74 1.91 1.35 12.41 62.29
Information Tech-nology
9.22 4.95 2.99 -9.61 47.71 7.37 2.42 1.38 13.92 47.91
Materials 8.15 7.25 2.37 5.96 56.37 8.86 1.68 1.28 13.00 54.58
Consumer Basics 6.32 8.81 2.71 17.49 61.58 6.08 3.00 1.19 22.62 59.63
Health Care 5.90 8.88 2.78 5.47 45.38 6.77 3.93 1.45 12.45 51.60
Energy, Equipment & Services
3.75 6.60 2.26 2.36 56.49 5.38 1.91 1.00 21.09 58.33
Utilities 3.64 7.94 1.89 9.06 65.54 4.18 2.32 0.92 12.29 68.61
Telecommunicati-ons
2.36 6.70 2.44 -1.74 59.06 2.39 2.87 1.40 25.08 65.86
From Table A.1 can be seen that industry-specific DD levels have dramatically decreased with the subprime crises, although the effect is heterogenous. For example, as to be expected, the financial sector is affected the most, with a median DD of 6.14 in 2005 decreasing to 1.19 in 2009. In comparison, the health care and telecommunications sectors are the least affected by the general deterioration. The table also shows the shares of industries of the overall sam-ple, where financial and industrial firms have persistently the highest share in the STOXX universe.

25
Literature
Ang, James / Patel, Kurwitkumar (1975): Bond rating methods: Comparison and Validation, Journal of Finance 30, 631-640.
Altman Edward / Resti, Andrea / Sironi, Andrea (2004): Default Recovery Rates in Credit RiskModelling: A Review of the Literature and Empirical Evidence, Economic Notes 33, 183-208.
Andrade, Gregor / Kaplan, Steven (1998): How Costly is Financial (Not Economic) Distress? Evidence from Highly Leveraged Transactions that Became Distressed, Journal of Finance 53, 1443-1493.
Bharath, Sreedar / Shumway, Tyler (2008): Forecasting Default with the Merton Distance to Default Model, Review of Financial Studies 21, 1339-1369.
Black, Fischer / Cox, John (1976): Valuing Corporate Securities: Some Effects of Bond In-denture Provisions, Journal of Finance 31, 351-367.
Blume, M. / Lim, F. / MacKinlay, C. (1998): The Declining Credit Quality of U.S. Corporate Debt: Myth or Reality?, Journal of Finance 53, 1389-1413.
Bohn, Jeff / Arora, Navneet / Korablev, Irina (2005): Power and level validation of the EDF credit measure in the U.S. market, Working Paper, Moody’s KMV.
Boot, Arnoud / Milbourn, Todd / Schmeits, Anjolein (2006): Credit ratings as coordination mechanism, Review of Financial Studies 19, 81-118.
Crosbie, Peter / Bohn, Jeff (2003). Modeling Default Risk, Technical Document, Moody’s KMV.
Das, Ranjiv / Hanouna, Paul / Sarin, Atulya (2009): Accounting-based versus market-based cross-sectional models of CDS spreads, Journal of Banking and Finance 33, 719-730.
Demyanyk, Yuliya / van Hemert, Otto (2009): Understanding the subprime mortgage crisis, Review of Financial Studies (forthcoming).
Duane, Jin-Chuan / Gauthier, Genevieve / Simonato, Jean-Guy (2005): On the Equivalence of the KMV and Maximum Likelihood Methods for Structural Credit Risk Models, Working Paper, University of Toronto.
Duffie, Darrell / Saita, Leandro /Wang, Ke (2007): Multi-period corporate default prediction with stochastic covariates, Journal of Financial Economics 83, 635-665.
Elsas, Ralf / Hadder, Nadine / Stein, Ingrid (2009): Financial Distress and Relationship Lend-ing, mimeo, LMU Munich.
Engelmann, Bernd / Haydn, Evelyn / Tasche, Dirk (2003): Measuring the Discriminative Power of Rating Systems, Discussion Paper 01/2003, Deutsche Bundesbank.

26
International Organisation of Securities Commissions IOSCO (2008): Consultation Report: The role of credit rating agencies in structured finance markets, Madrid, Spain.
Löffler, Gunter (2004): An anatomy of rating through the cycle, Journal of Banking and Finance 28, 695-720.
Löffler, Gunter (2005): Avoiding the rating bounce: why rating agencies are slow to react to new information, Journal of Economic Behavior & Organization 56, 365-381.
Merton, Robert (1974): On the Pricing of Corporate Debt: the Risk Structure of Interest Rates, Journal of Finance 28, 449-470.
Hellwig, Martin (2009): Systemic Risk in the Financial Sector: An Analysis of the Subprime-Mortgage Financial Crisis, Working Paper, Bonn.
Hillegeist, Steven / Keating, Elizabeth / Cram, Donald (2004): Assessing the Probability of Bankruptcy, Review of Accounting Studies 9, 5-34.
Hand, John / Holthausen, Robert / Leftwich, Richard (1992): The effect of band rating agency announcements on bond and stock prices, Journal of Finance 47, 733-752.
Hirsch, Christian / Krahnen, Jan Pieter (2007): A primer on rating agencies as monitors: An analysis of the watch list period, Working Paper, Goethe University Frankfurt.
Pagano, Marco / Volpin, Paolo (2009): Credit rating failures and policy options, Working Paper CSEF No. 239, University of Naples.
Ramakrishnan, Ram / Thakor, Anjan (1984): Information reliability and a theory of financial intermediation, Review of Economic Studies 51, 415-432.
Reinhart, Carmen / Rogoff, Kenneth (2008): Is the 2007 US Sub-Prime Financial Crisis So Different? An International Historical Comparison, American Economic Review 99, 466-472.
Robbe, Paul / Mahieu, Ronald (2005): Are the Standards too Poor? An Empirical Analysis of the Timeliness and Predictability of Rating Changes, Working Paper, University of Rotter-dam.
Standard & Poor’s (2008): Corporate Ratings Criteria 2008, version as April 15, 2008, from www.standardandpoors.com
Standard & Poor's (2010): Default, Transition, and Recovery: 2009 Annual Global Corporate Default Study And Rating Transitions, version as of March 17, 2010, from www.standardandpoors.com