rainwater harvesting, alternative to the water supply in
TRANSCRIPT

HAL Id: halshs-00138830https://halshs.archives-ouvertes.fr/halshs-00138830
Submitted on 27 Mar 2007
HAL is a multi-disciplinary open accessarchive for the deposit and dissemination of sci-entific research documents, whether they are pub-lished or not. The documents may come fromteaching and research institutions in France orabroad, or from public or private research centers.
L’archive ouverte pluridisciplinaire HAL, estdestinée au dépôt et à la diffusion de documentsscientifiques de niveau recherche, publiés ou non,émanant des établissements d’enseignement et derecherche français ou étrangers, des laboratoirespublics ou privés.
Rainwater harvesting, alternative to the water supply inIndian urban areas : The case of Ahmedabad in Gujarat
Akil Amiraly, Nathalie Prime, J.P. Singh
To cite this version:Akil Amiraly, Nathalie Prime, J.P. Singh. Rainwater harvesting, alternative to the water supply inIndian urban areas : The case of Ahmedabad in Gujarat. 2004. �halshs-00138830�

RAINWATER HARVESTING, ALTERNATIVE TO THE WATER SUPPLY
IN INDIAN URBAN AREAS: THE CASE OF AHMEDABAD IN GUJARAT
(Akil AMIRALY1, Nathalie PRIME2, Joginder P. SINGH3)
ABSTRACT
Water scarcity is a characteristic of north-western states of India, such as Gujarat. Over
time, the continuous increase of the population as well as the financial, administrative and
technical deficiencies of the new supply system have lead to the deterioration of the water
service in the city. In the meantime, the water demand has considerably increased due to
the improvement of standards of living. This has resulted in an increasing pressure on
underground water resources, which has lead to an alarming depletion of aquifers. From
this overall situation arises the question of the use of complementary alternative sources of
water in Ahmedabad and more particularly of the rehabilitation of the rainwater harvesting
structures still existing in its old city area.
The objective of the research is to evaluate to what extent this traditional system may
constitute an additional source of water within the Old city of Ahmedabad and may locally
reduce the pressure on water demand, assuming that the existing supply system does not
fulfil the needs of the users. The results of an exploratory field study conducted in the Old
city in 2001-02, which combined quantitative and qualitative aspects, give an outlook on
people’s opinions and behaviors regarding both systems. Finally, the rehabilitation of
rainwater harvesting structures in the Old city of Ahmedabad suggests the necessity of
empowering local structures of water management (households, non governmental
association) in semi-arid urban areas to create the conditions for a sustainable
implementation. 1 Ph. D student, Centre de Recherche en Gestion (CRG), Ecole Polytechnique, Paris, France. 2 Associate Professor of International Management at the European School of Management (ESCP-EAP) in Paris, France.
hals
hs-0
0138
830,
ver
sion
1 -
27 M
ar 2
007

2
INTRODUCTION
Water scarcity is a characteristic of north-western states of India, such as Gujarat. In that
context, people have developed, over the time, techniques to meet their water requirements.
Rainwater harvesting is one of them. It was functioning in the Old city of Ahmedabad
before the extension of the modern water supply system to the entire town till the middle of
the 20th century. The continuous increase of the population in the following decades as well
as the financial, administrative and technical deficiencies of the new supply system have
lead to the deterioration of the water service in the city. In the meantime, the water demand
has considerably increased due to the improvement of standards of living. This has resulted
in an increasing pressure on underground water resources, which has lead to an alarming
depletion of aquifers. The growing water demand in both rural and urban areas has
prompted the successive governments of Gujarat to bring water from far away which is
economically, socially and environmentally unsustainable on the long run. From this
overall situation arises the question of the use of alternative sources of water in Ahmedabad
and more particularly of the rehabilitation of the rainwater harvesting structures still
existing in its old city area.
1. OBJECTIVES AND FOCUS OF THE RESEARCH
The issue raised here relates to the search for complementarities between the present
system of water supply and the alternative system of rainwater harvesting, in a context of
water scarcity. The objective of the research is to evaluate to what extent this traditional
system may constitute an additional source of water within the Old city and may locally
reduce the pressure on water demand, assuming that the existing supply system does not
fulfil the needs of the users.
3 Professor of International Management at the Indian Institute of Management Ahmedabad (IIMA), India.
hals
hs-0
0138
830,
ver
sion
1 -
27 M
ar 2
007

3
From that perspective, the results of an exploratory field study was conducted in the Old
city in 2001-02, which combined quantitative and qualitative aspects, that gives an outlook
on people’s opinions and behaviors regarding both systems. Finally, the rehabilitation of
rainwater harvesting structures in the Old city of Ahmedabad suggests the necessity of
empowering local structures of water management (households, non governmental
association) in semi-arid urban areas to create the conditions for a sustainable
implementation.
2. LITERATURE REVIEW
2.1 The Development and the Decline of Traditional Water Management Systems
The monsoon season. “In Indian literature, it is literally depicted as the season of love – a
time when Mother Nature renews herself and gives everybody a precious new lease of life,
and young girls hang swings on tree boughs and sing love songs. Once the rains disappear,
the land becomes as dry as a desert, life is difficult and water scarce to find. The gushing
streams which overflow their banks in the monsoon months soon become tame or dead”
(Agarwal and Narain, 1997, p.25).
2.1.1 The general context: water and people
If Indian literature casts so much light on the monsoon, it is because this climatic
phenomena is at the heart of people’s life in the Indian subcontinent. Since the Indus Valley
civilisation (2500-1500 before Christ) that gave birth to the first urban centres, Man has
appropriated this source of water. The reason is simple: most of the rainfalls occur within
few days or within some hours of heavy rains. Therefore, over the years Man has developed
indigenous techniques to collect and store water during the dry season until the following
monsoon.
Due to the diversity of climates, the concept of water harvesting is materialized by a variety
of techniques over the territory, in relation with physical situations, existing materials and
hals
hs-0
0138
830,
ver
sion
1 -
27 M
ar 2
007

4
people’s needs. The inhabitants and more extensively the rural or urban communities they
belong to are the nerve centre of the functioning of local infrastructures. These people are
both the initiators and the managers but also the warrantors of these systems.
Due to the colonization and the subsequent introduction of new technologies, most of these
traditional systems had been broken down during the last century. Along with their
liquidation, most of the knowledge on these techniques has also disappeared: their use has
declined as also the confidence of the people in these systems. Nowadays, the deficiencies
of the water management by Public authorities and the economic, social and environmental
costs of large infrastructure projects pushes the civil society, under the impulsion of the
NGOs into claiming the valorization of these techniques and their re-appropriation.
Moreover, the successive droughts in arid and semi arid areas in north-west India results in
a growing number of rural communities to go for alternative solutions such as rainwater
harvesting in underground cisterns or artificial ponds.
In such a context many authors have focused on the issue of alternative systems of water
supply. Most of the sources of this literature has been written during the last decade and it
highlights two phenomena: the growing dissatisfaction of the civil society concerning
current water management systems and the increasing movements for the rehabilitation of
alternative management systems. In the next section, we will analyse the growth and the
decline of alternative water management systems, emphasizing the links between their
development and the people’s participation.
2.1.2 The development of traditional water management systems
The development and decline of these systems has not been very much explored, except by
historians whose contribution should be appreciable, since sources on the subject are
scarce.
hals
hs-0
0138
830,
ver
sion
1 -
27 M
ar 2
007

5
Role of individuals in the development of these traditional systems
The major role of individuals, notably, philanthropists and communities in the construction
and the maintenance of traditional water management systems is a permanent feature.
Actually, there is a religious benefits associated to the infrastructure construction related to
water. “To the orthodox Hindus, among different forms of charity, one of the most
important was the provision of water” (Agarwal and Narain, 1997, p.281).
Reflection of the social stratification
The political power, represented by the monarch or the local chief financed or encouraged
the large irrigation projects. Once constructed, the management and maintenance of these
infrastructures depended on the populations. Nevertheless, “innumerable smaller works
were constructed at the initiative of individuals and local communities” (Shankari and
Shah, 1993, p.19).
The construction was probably in the hand of families specialized in the construction of
such specific structures. Nowadays, some families are still perpetuating the know-how of
the construction of underground rainwater harvesting cisterns, in the Chittoor district of
Andhra Pradesh or in Diu in Gujarat. “There were caste communities specialised in earth
and stone work called wadders and boyis. They undertook the construction of tanks, wells,
roads and works where earth and stone was involved. Even today they are the main source
of labour for Irrigation and Roads and Buildings Departments” (Shankari and Shah, op.cit.,
p.27).
One deficiency remains : none of the sources give any information on the cost of
construction and the repartition of the resources between the inhabitants.
Role of the family in the timelessness of the system
The information related to the management and maintenance practices are limited and
incomplete. In the southern part of the country, the maintenance of supply channels and
fields channels was shared out among the members of the communities using it. “Known
as kudi maramath in the south, it was a widely prevalent practice all over India. Wherever,
a repair work needed to be attended to, such as cleaning of the supply channel, each family
hals
hs-0
0138
830,
ver
sion
1 -
27 M
ar 2
007

6
was required to send an able bodied person to contribute labour for the work If it was not in
a position to do so, it should send a hired substitute or contribute the money required for it”
(Shankari and Shah, op.cit., p.28).
Circulation of know-how
In water management, the technology transfers from the Middle East and Persia (in
particular) to South Asia are historically acknowledged. “The technology of qanat was
adopted by the people of the Malabar Coast to build surangams to meet their drinking
water needs”. Another example is the building of “the qanat based water supply system of
the town of Burhanpur in Khandwa district of Madhya Pradesh”(Agarwal and Narain,
1997, p.29).
It is reasonably sure to assume that the concept of rainwater harvesting in underground
cisterns was imported from regions situated in the Western part of the subcontinent. This
system already existed in the 16th century in Herat, an Afghan city in the Khorasan region
or even further west, in Constantinople (Minor Asia). Earlier, archaeological evidence of
rainwater harvesting in over-ground tanks is available at Dhola Vira structure in Gujarat.
2.1.3 The decline of traditional water management systems
Resources repartition and prosperity
When the British arrived on the subcontinent in the 17th century, the patchwork of
kingdoms that later gave birth to India was the richest region highly urbanised in that time.
The development of towns and the opulence of Indian courts were based on the surplus of
wealth generated in the villages that produced a large quantity of goods. The Indian courts
encouraged the production and the mass export of luxury products such as textile and
jewellery. An ingenious water management system was to some extent at the origin of the
economic growth.
The short monsoon season required an equitable repartition of resources between the rural
and urban areas. “There were hundreds thousands of tanks across the country. Locally
hals
hs-0
0138
830,
ver
sion
1 -
27 M
ar 2
007

7
developed technologies were further supported by an elaborate system of property rights
and religious practices” (Agarwal and Narain, op.cit., p.274).
Local strategies and sustainability
Leyes Ferrouki (1997) underlines that “even though these traditional rainwater harvesting
systems can look precarious and casual in the eyes of modern technologists, they have been
perfectly suitable for centuries. The reason for this is that they are compatible with local
lifestyles, institutional patterns and social systems. They represent a fund of solid
experience gained through generations of observations, trials and errors”. This author adds:
“the often forgotten relationship between regions of high biodiversity and high poverty is
often very clear in India (…). This combination has allowed the development of numerous
sustainable indigenous survival strategies. The diversity of rainwater harvesting techniques
in the arid region of Kutch affected by the high water salinity illustrates this situation”.
Ferrouki regrets that “many of these techniques have disappeared or are disappearing along
with their innovators, since the modern civilisation is forcing them to abandon their land
and ways of living”.
These know-how constitute a major cultural and technical heritage because, in a general
context of scarcity (of water and financial resources), they highly contrast with programs
involving high cost technologies and leading to questionable results. It is therefore relevant
to identify the historical factors that have generated and accelerated the disinterest of
Indians for their own water management system.
Destabilisation of the economy and of the social institutions
The Cipayes mutiny in 1857 has marked the ascendancy of the British Crown over the
Indian subcontinent. “The British neglected systematically the resources they could not
own or earn money from”(Agarwal and Narain, 1997, p.309). The production system
formerly designed for the satisfaction of the local demand was turned around to produce
goods for the metropolitan market of the colonizing power. The pattern of agriculture
evolved from subsistence farming to cash crops for the colonial market.
hals
hs-0
0138
830,
ver
sion
1 -
27 M
ar 2
007

8
These successive choices have destabilized the local political institutions which had
previously managed local water infrastructures, such as the panch or local committee.
Without sufficient incomes, the lands and renewable resources that belonged to the
community could be used by anybody without any constraint: “What were once community
managed commons turned into free access resources” (Agarwal and Narain, op.cit., p.309).
The traditional system of maintenance had collapsed. The newly bureaucratic and
centralized system set up by the colonizers was not designed to maintain the innumerable
water works scattered over a vast territory. The British’ taking over of the local
administration was the beginning of the collapse of the village communities run by its
inhabitants.
Centralisation of power and infrastructure deterioration
According to Shankari and Shah, the eagerness of the colonizers in exploiting the country’s
resources and their misunderstanding of the traditional water management systems drew
them to marginalize the existing infrastructures. “When the British government realized
that repairs and restoration of hundreds and thousands of tanks would involve very great
expenses, it tried to enforce kudi maramath by compulsion and by legislation” (Shankary
and Shah, 1993, p.29). This initiative failed. In contrast, Ballabh and Choudhary (1999)
notice that the colonizers initiated the construction of large infrastructure projects such as
canals since this kind of infrastructure was much more adapted to cultivate large crops and
increase State’s incomes.
Having been educated in English language during the Empire and known as brown sahibs,
the Indian elites were behaving like their masters in terms of water management.
Accultured in their early age, they reproduced the mindset of the administators they were
succeeding to. After the Independance, the construction of large infrastructure projects was
achieved by engineers sharing with their predecessors the same disdain for water systems
managed by people. The decline of traditional structures of management was patent. If we
refer to Shankari and Shah, it was the time when “tanks bed have become municipal
garbage dumps, housing colonies, bus station” (Shankari and Shah, 1993, p.37).
hals
hs-0
0138
830,
ver
sion
1 -
27 M
ar 2
007

9
These authors note that “the greater centralisation of policy has reduced village panchayats
to the lowest administrative wings of the state governments with very limited powers and
jurisdiction. Informal associations such as cast councils have also lost their legitimacy and
authority, with modern courts and policy taking over their functions however ineffectively.
New social bases of power have emerged replacing the old village leadership. The new
leadership is oriented more towards competitive electoral politics rather than the old style
politics of consensus. In the meantime, government has so expanded so much in the name
of development that there is little space for people’s initiatives. People have come to expect
the government to carryout every developmental/welfare activity” (Shankary and Shah,
1993, p.37).
2.2 Water Scarcity in Gujarat
2.2.1 Main Characteristics of Water sSarcity
Water Availability: Rainfall Patterns and Physical Data
Water as a resource is available as groundwater and surface water. There are major regional
variations in the availabilty of water in the state due to variations in physical factors such as
climate, hydrology, geology, soils, topography and vegetation. (...). In Gujarat, the climate
is semi-arid to arid, except in the southern part of the state where there is a wet sub-tropical
climate. Rainfalls have a high intensity and a short duration; they are concentrated in the
monsoon season (July to September).
Measuring water scarcity
There are different criteria to measure water scarcity. If we refer to the White paper for
water in Gujarat, the most widely used criterion to measure the water is the level of annual
renewable freshwater supply of water per capita (Falkenmark, XXXX). If it falls below:
- 1.700 m³, there will be local shortages of water;
- 1.000 m³, water supply begins to hamper health, economic growth and human well
being;
hals
hs-0
0138
830,
ver
sion
1 -
27 M
ar 2
007

10
- 500 m³, water availability becomes a primary constraint to life.
On the basis of this indicator based on a supply side approach of defining water scarcity,
Gujarat is a “water stressed region” since the annual per capita freshwater availability is far
below 1.700 m³ (1.321 m³ in 1991). It will become a water-scarce region in the coming
years since this availability of water might drop below the level of 1.000 m³ per annum
(Indian Institute of Rural Management, 2000, p.15).
“The United Nation’s Commission on Sustainable Development defines water scarcity in
terms of the annual withdrawals as a percentage of total freshwater resources available in
an area. According to this criterion, if the total annual withdrawals represent more than 40
per cent of the annual renewable freshwater, the region is said to be water scarce. By this
criterion also, Gujarat is water scarce as both surface and groundwater withdrawals are far
exceeding the 40 per cent limit” (IRMA, 2000, p.16). If this situation affects both urban and
rural areas, this phenomenon becomes more marked in towns at every new drought.
The recurrent phenomenon of drought
Since the 17th century, a major part of Gujarat undergoes a long serie of cyclic droughts, in
average once in every five years: therefore, these are not new or unexpected phenomenon.
After three consecutive droughts from 1985 to 1988, this State faced in 1999 one of the
most severe drought of the past century. Scanty and irregular rains led to a severe drought
during the summer of 2000. Some 25 millions people were affected and more particularly
women, children and the poorest part of the population. “Some 9.500 villages, 4
metroplotain cities and 79 towns faced acute water shortage for basic human survival –
drinking and basic human hygiene and livestock” (IRMA, 2000, p.4). Despite its efforts,
the State did not manage to assure the supply of water for the people and the animals in
affected areas. A mission comprising representatives of UNICEF, UNDP and Action India
was formed in May 2000, on a request from the Government of Gujarat and attributed the
severity of drought in the State to two main reasons (IRMA, 2000, p.5):
- the non recognition of the economic value of water ;
- the deficiencies in managing the water supplies and demand.
hals
hs-0
0138
830,
ver
sion
1 -
27 M
ar 2
007

11
2.2.2 Present solutions to water scarcity
The over-exploitation of undergroundwater resources and their consequences
If the groundwater resources constitutes respectively 77% and 50% of the freshwater
supply of the rural and urban areas, the large share of this renewable resource is consumed
by the irrigation system; the main agricultural and irrigated regions being North Gujarat
followed by Saurashtra, the south and the centre of the state. Several factors have
encouraged the exploitation and the waste of groundwater: the absence of any property
right regimes clearly established, the absence of institutional financing for the construction
of wells, the high subsidy for electricity for the pumping of deep aquifers and the massive
electrification of rural areas.
The depletion of groundwater levels is both the cause and consequence of water scarcity in
Gujarat. We can differentiate the long-term depletion and the seasonal one. The long-term
depletion is the result of an uncontrolled withdrawal of groundwater at rates that exceed the
rates of natural replenishment over long periods of time. This is the situation of alluvial
regions of North and Central Gujarat such as the Ahmedabad district. Their over-
exploitation leads to exponential increases of both pumping depths and of the unit
extraction cost of water (0.50 kilowatt-hours/m³). Finaly, the rapid decrease of bore-wells
yields reach levels that are not economicaly profitable (IRMA, 2000, p.33).
A report of the Gujarat Ecology Commission points out that groundwater extraction has
increased by a 104% within two decades,1978-1997 (Gujarat Ecology Commission, 2000).
Thus, in Mehasana district where the electricity tariffs are highly subsidised, farmers pump
water from a depth of 800-1000 feets leading to a bore-wells depletion at a rate of 3 metres
per annum (IRMA, 2000, p.33). This anarchical exploitation of groundwater led the
Government of Gujarat to classify the districts according to the level of their water tables.
In 1997, the Ahmedabad district was classified as “dark”, since the gross annual withdrawal
exceeded 90% of the usable annual recharge. This situation is likely to worsen : 87% of the
hals
hs-0
0138
830,
ver
sion
1 -
27 M
ar 2
007

12
State’s municipalities rely on groundwater for their supply (Gujarat Ecology Commission,
2000).
The excessive recourse to groundwater leads to a deterioration of the water quality. This
deterioration has two manifestations:
- first, the increase of fluoride level resulting from an excessive withdrawal of
groundwater from deep aquifers;
- second, the increase of salinity levels due to excessive withdrawal from coastal
aquifers. The hydrostatic imbalances between freshwater aquifers and seawater are
the consequences of this situation. The Total Dissolve Solids (TDS) levels in
groundwater far exceeds the permissible levels for irrigation and make the water
improper for many uses. This situation is all the more worrying than the arid regions
of Kutch and Saurashtra constitute the essential part of the coastline of Gujarat
(1.125 km) and the longest coastline (1.600 km) of the country (one third of it).
The excessive fluoride and water salinity are a major source of concern for public health.
This situation which is likely to worsen may constitute an important cost for the society, in
the mid or long run.
The large dams policy • The current exploitation of surface water in Gujarat
Gujarat is divided into two zones separated by the Sabarmati river : a “water rich” area,
south of the Sabarmati and “water scarce” region, north of the Sabarmati. The three
perenial rivers (Narmada, Tapi, Mahi) located in the southern part of the state bring a
significant quantity of water. (Gujarat State Drinking Water Infrastructure, 2000, p.12). The
state has given the priority to the construction of surface water reservoirs, so as to tap the
rivers and distribute the water for irrigation or domestic purpose. The main rivers are
regulated by a series of dams and weirs (GSDWI, op.cit., p.12) which has an impact on
regions located downstream of the rivers and deprived of their flows. The subsequent
hals
hs-0
0138
830,
ver
sion
1 -
27 M
ar 2
007

13
degradation of the estuarine ecosystems leads to salinity in coastal areas as well as to a
change of patterns in erosion and sedimentation and to a loss of mangroves.
To illustrate this impact in the upstream part of the estuaries, the Gujarat Ecology
Commission points out the important decrease of the areas of lake, ponds and tanks in the
Gulf of Khambhat from 1965 to 1975. These traditional water sources used to be a major
lifeline in the arid, semi-arid and coastal parts of the State. “The failure of the centralised
water supply schemes have once again rejuvenated interest in reviving the traditional
sources of water, largely through check dams and other watershed management activities”
(Gujarat Ecology Commission, 2000).
• The cost of Narmada
In continuation of the centralized policy of water resources development that began during
the British colonization, after the Independence, the decision was made at the federal level
to import Narmada water, one of the major rivers of the country, in Gujarat. The essential
part of this river flows through Madhya Pradesh, skirts the north of Maharashtra; it reaches
Gujarat and empties at Bharuch into the Arabian sea. The construction of dams inherent to
this project will lead to the displacement of entire tribal communities of the neighbouring
states of Maharashtra and Madhya Pradesh.
The foundation stone of a dam on the Narmada river was laid in 1961 by Nehru. It was the
starting point of the building of a long list of large dams comprizing the Sardar Sarovar
dam which is at the heart of a polemic. The project consists in having step reservoirs thanks
to the building of 3.200 dams along the river and its tributaries.At the end of the day, “the
Sardar Sarovar in Gujarat and the Narmada Sagar in Madhya Pradesh will, between them,
hold more water than any other reservoir on the Indian subcontinent” (Roy, 1999, p.18).
The World Bank decided to finance the lynchpin of the Sardar Sarovar project, without any
evaluation of the financial, human and environmental costs of the dam. But, an independent
review appointed by the World Bank published in 1992 had unequivocal and unexpected
views : “We think that the Sardar Sarovar Projects as they stand are flawed, that
hals
hs-0
0138
830,
ver
sion
1 -
27 M
ar 2
007

14
resettlement and rehabilitation of all those displaced by the Projects is not possible under
prevailing circumstances, and that environmental impacts of the projects have not been
properly considered or adequately adressed. Moreover, we believe that the Bank shares
responsibility with the borrower for the situation that has developed ... it seems clear that
engineering and economic imperatives have driven the Projects to the exclusion of human
and environmental concerns... India and the states involved... have spent a great deal of
money. No one wants to see this money wasted. But we caution that it may be more
wastefull to proceed without full knowledge of the human and environmental costs... As a
result, we think that the wisest course would be for the Bank to step back from the Projects
and consider them afresh”(Morse and Berger, 1992) . Then, the Bank withdraw its support
to the project.
According to Roy (1999), this project considered by the Indian Government as the “most
studied project in India” lacks of a global approach, since there is a strong willingness of
the State to favour :
- (1) the water supply of the urban areas at the expense of the rural ones;
- (2) the exogenous solutions to local ones.
In addition, she criticises the past diversions of the Sabarmati and Mahi rivers for supplying
the Ahmedabad and Kheda districts as far as the arid areas of Kutch and Saurashtra haven’t
benefited from these projects. Also, she doesn’t believe in the government willingness in
“quenching the thirst of parched throats in Kutch and Saurashtra”, since there was “no
mention of drinking water for villages in Kutch and Saurashtra, the arid areas of Gujarat”
(Roy, 1999, p.22).
The human cost resulting from the sole construction of the Sardar Sarovar dam is so
enormous that the number of displaced families was constantly revised. From 6.000
families (1979), to 12.000 (1987) and 27.000 families (1991). Later, in 1992, the
government aknowledged that 40.000 families would be affected. In 1999, according to the
Narmada Bachao Andolan, the estimation was around 85.000 families - or half a million
people deprived of their land.
hals
hs-0
0138
830,
ver
sion
1 -
27 M
ar 2
007

15
Roy (1999) notes that the major drawback of this kind of infrastructure is that the purposes
(irrigation, power production, and flood-control) conflict with one another. She argues that
once the project will be completed, the scheme will produce only 3% of the production
forcasted, about 50 megawatts. “Finally if you take into account the power needed to pump
water through its vast network of canals, the Sardar Sarovar Projects will end up consuming
more electricity than they produce” (Dharmadhikari, 1995).
After the water losses due to evaporation, the illegal pumpings on canals will remain the
ultimate beneficiaries of the remaining share of water. They will be the influencial
communities of the districts mentioned above, the urban centres, the industrial activities
and the intensive crop areas. Finally, the arid and poor regions of Kutch and Saurashtra will
collect the remaining water...
Alternative Solutions : Rainwater Harvesting
Since the urban population is growing at a much faster rate than rural populations, the
imbalance of water repartition between the urban and the rural areas is likely to go on or
increase in the short-mid run. This phenomenon will be amplified at the costs of rural areas
due to the limited local sources of water in the cities and the exponential demand for water
as a consequence of urban households’ rising income levels.
During summer, the local daily press regularly reports the conflicts between the inhabitants
in villages or towns such as Rajkot to collect their share of water at the public standpost or
at the well. We can add to this picture, the peasants’ irritation whose water is diverted by
the government following the failure of monsoon to quench the thirst of urban dwellers.
Under difficult climatic circumstances, the government gives itself the right to adopt
draconian measures to supply the towns in water. In 1999 and 2000, a significative share of
the Mahi-Kadana canal destinated to the irrigation of the paddy-fields of the region of
Kheda was diverted in Ahmedabad and Baroda. The farmers affected by this arbitrary
situation in 2000 had finally taken into rioting (IRMA, 2000, p.35).
hals
hs-0
0138
830,
ver
sion
1 -
27 M
ar 2
007

16
Regarding Ahmedabad, the White paper for water in Gujarat gives a clear picture of the
water supply situation : “In Ahmedabad city, the areas that are not covered by the
Ahmedabad Municipal Corporation come under the jurisdiction of the Ahmedabad Urban
Development Authority. In these areas, the domestic water supply is to be provided through
the Gram Panchayats. But, given the dramatic increase in the population and the
mushrooming of the multi-storeyed flats in the city outskirts, the Gram Panchayats are not
able to provide the requisite water supply to the households residing in these areas. In view
of this, the societies maintain their own bore wells. However, breakdown of these systems
is very common, resulting from excessive draw down in water levels, collapse of well
packing, burning of motors etc. In such circumstances, the private societies have to look for
other sources of water supply” (IRMA, 2000, p.35).
In case of insufficient water or absence of individual access to water, the rainwater
harvesting system is an alternative solution for the households, both in urban and rural
areas. This rainwater can complement the existing water supply system and reduce the
pressure on a system which is over solicitated. In this regard, the individual rainwater
harvesting cisterns located in the Old city of Ahmedabad constitute an additional system to
have access to water.
The following sections present a description and analysis of the water situation in
Ahmedabad. After defining the profile of the city in terms of administrative organization,
of population and of the existing water supply system (3.), we will present the methodology
(4.) and main results (5.) of the empirical study conducted in the Old city which focused on
the households’opinions and behaviors on the existing and the alternative water supply
systems in the Old city area.
hals
hs-0
0138
830,
ver
sion
1 -
27 M
ar 2
007

17
3. WATER SUPPLY IN AN URBAN SEMI-ARID AREA:
THE CASE OF AHMEDABAD
3.1 Profile of Ahmedabad
3.1.1 Perimeter (ExhibitI - Ahmedabad District Map)
From a global perspective, there are four concentric circles defining the population in the
Ahmedabad area (cf. Table I). According to the perimeter, the population in 2001 varies
from 5 808 378 (District) to 4 214 369 (Ahmedabad Urban Authority), 3 690 305
(Ahmedabad + Outgrowths) or 3 515 361 (Ahmedabad Municipal Corporation).
Table I – Ahmedabad: Various areas and population, 2001
Area Perimeter
Sq.km. Hectare
Population
2001
Ahmedabad Municipal Corporation (AMC) 190.15 19,015 3,515,361
Ahmedabad + Outgrowths 234.15 23,415 3,690,305
Ahmedabad Urban Agglomeration (AUA) 310.00 31,000 4,214,369
Ahmedabad Urban Development Authority (AUDA) 1,294.65 129,465
Ahmedabad District 5,808,378
Source: Census of India 2001, Series-25, Gujarat, Provisional Population Totals, Rural-Urban Distribution,
Directorate of Census Operations, Ahmedabad, 2001.
Ahmedabad District
The overall district population is 5 808 378. This population is mainly urban (4 652 035),
owing to the demographic weight of the town of Ahmedabad. A 20% of the population
lives in rural areas (1 146 343 persons). The district is a main administrative division that
includes the Ahmedabad agglomeration, small towns such as Mandal and villages.
hals
hs-0
0138
830,
ver
sion
1 -
27 M
ar 2
007

18
Ahmedabad Urban Development Authority (AUDA)
It includes the area of the AMC and 163 villages and towns. The fast developing western
fringe of Ahmedabad is under its jurisdiction. But only part of the Ahmedabad District area
falls within the AUDA limits.
Ahmedabad Urban Agglomeration (AUA)
Due to the rapid expansion of the city towards the West and East, several villages and
towns have developed close links with Ahmedabad City. These areas are treated as
Ahmedabad Urban Agglomeration by AUDA.
The Census of India defines A.U.A. area as a “contiguous urban spread consisting of a core
town and adjoining towns and outgrowths”. It includes the Ahmedabad Municipal
Corporation (AMC), seventeen outgrowths, one cantonment board, three Nagar
Panchayats4 (NP) or towns, seven Gram Panchayats5 (VP) or villages. These towns and
villages are mostly situated in the northern and western outskirts of the city.
Outgrowths
Seventeen outgrowths6, representing an area of 44 sq.km and a population of about 175 000
persons, essentially located in the western and southern vicinity of the town constitute a
first circle of agglomerations outside the AMC limits. Due to their geographical proximity,
the probability of their incorporation to the town is foreseeable in the long run.
Ahmedabad Municipal Corporation, (AMC)
The city perimeter has expanded from 5,7 km² in 1872 to 190,15 km² in 2001. Its major and
last extension dates back to 1986, doubling its initial perimeter, with the addition of the
eastern periphery. The previous limit covered an area of 98 km².
AMC has 43 “election wards” and is spatially divided into five zones (North, South, East,
West and Central). This perimeter constitutes our town of reference for the study of water
consumption: 19 000 ha. for a population of 3,5 millions in 2001. 4 The Nagar Panchayats are: Ranip, Ghatlodiya, Kali. 5 The Gram Panchayats are: Thalrej, Memnagar, Vejalpur, Makarba.
hals
hs-0
0138
830,
ver
sion
1 -
27 M
ar 2
007

19
The Old City
It is the historical core of Ahmedabad, where the city was established five centuries ago.
Located at the geographical centre of the city, the Old City is spread over 7.46 km². Its
population was 372 526 in 2001, i.e. 11% of AMC population. It is divided into six election
wards: Khadia (ward 1), Kalupur (ward 2), Dariapur (ward 3), Shahpur (ward 4), Raikhad
(ward 5), and Jamalpur (ward 6).
3.1.1 Population
Past and Present situation
As can be seen from Table II, there has been a constant period of high growth of the
population within the AMC limits, the average growth rate being 3,4% per annum, between
1931 and 19717. This trend culminates in 1941 with an exceptional rate of 4,4% that can be
partly explained by the incorporation of a new area doubling the initial perimeter. A similar
phenomenon is noticeable in the 1981-91 decade, after an extension by half of the city area
in 1986, with the difference that a slow annual growth rate (3,4%) and a high density,
equivalent to the ones of the 1872 and 1881, characterise the 1981-1991 period.
In the present decade (1991-2001), the population keeps on increasing while the annual
growth rate follows its declining trend (2%).
6 The Outgrowths are: Asarwa, Naroda, Nikol, Rakhial, Odhav, Bag-e-Firdos, Shahwadi, Gyaspur (part), Maktampur, Okaf (part), Chenpur, Bodakdev, Muthiya, Vastral (part), Ramol (part), Hatijan and Vatwa. 7 Assuming an exponential growth along the period.
hals
hs-0
0138
830,
ver
sion
1 -
27 M
ar 2
007

20
Table II – AMC: Population, Growth Rate and Density (1872-2001)
Census Area Population Pop. Growth (%) Density
Year Km² Hectare / period / year (*) (pers./ha)
1872 5.72 572 119,672 - 209
1881 5.95 595 127,622 6.6 0.72 214
1891 11.42 1,142 148,412 16.3 1.52 130
1901 14.93 1,493 185,889 25.3 2.28 125
1911 23.08 2,308 216,777 16.6 1.55 94
1921 23.96 2,396 274,007 26.4 2.37 114
1931 25.29 2,529 382,768 39.7 3.40 151
1941 52.47 5,247 591,267 54.5 4.44 113
1951 52.47 5,247 837,163 41.6 3.54 160
1961 92.98 9,298 1,149,918 37.4 3.23 124
1971 92.98 9,298 1,585,544 37.9 3.26 171
1981 98.15 9,815 2,059,725 29.9 2.65 210
1991 190.15 19,015 2,876,710 39.7 3.40 151
2001 190.15 19,015 3,515,361 22.2 2.03 185
(*) Assuming an exponential growth along the period
Source: Census of India 2001, Statistical Outline of Ahmedabad City 1998-99, Planning and Statistics
Source:Department, Ahmedabad Municipal Corporation, Ahmedabad.
hals
hs-0
0138
830,
ver
sion
1 -
27 M
ar 2
007

21
Future population
It has been assumed that in the coming decades the population will go on increasing but at a
slower pace with a diminution of the annual growth rate. This phenomenon not only
concerns the AMC area but also the outgrowths and the adjacent urban agglomerations.
Thus, within the AMC limits, the annual growth rate is assumed to change from 1,4%
(2001-2011) to 0,96% (2011-2021). If the outgrowths’ situation is quite similar but with
higher rates (3,4% and 2,7%), it seems that the adjacent urban agglomerations will
experience a moderate decrease of their annual population growth rates (3,4% and 3%).
3.1.2 Urban development
Spatial growth of the city over time
Ahmedabad was founded in 1411 by Sultan Ahmed Shah on the banks of the Sabarmati
River that flows through the city from North to South. In 1487, a fort wall and 12 gates
enclosed the city that was planned according to the Indo-Aryan tradition of a royal capital,
with main roads passing through the centre and subsidiary roads separating localities. Puras
or suburbs like the existing area of Kalupur (ward 2) were developing around the core of
the town or on the opposite bank, like Navarangpura (ward 10). The insecurity during the
Maratha period (1753-1818) and frequent communal riots led the inhabitants to live in cast-
wise Pols8 secured with gates.
After the British took over the administration in 1818, the city developed on both sides of
the river. The eastern bank started concentrating industries, railway terminus and
commercial activities in the vicinity of the existing residential areas. The expansion of the
textile industry speeded up the growth of the city beyond its medieval fortifications. As a
consequence to this urban pressure, the walls were finally pulled down in the beginning of
the 20th century.
8 The Pols are mazes of narrow lanes with two, three or four storied wooden houses abutting them in a very compact arrangement. They are a special feature of the Old City of Ahmedabad.
hals
hs-0
0138
830,
ver
sion
1 -
27 M
ar 2
007

22
From 1870 till the early sixties, the construction of several bridges across the Sabarmati
accelerated the residential development and later on, the commercial activity on the western
side of the river. A significant phenomenon in the last decades is the multiplication of
commercial centres and apartment resort in the western part of Ahmedabad.
Population density and Type of housing (ExhibitIII – AMC Population Density Map)
The analysis of the ward-wise density of the AMC gives a good understanding of its
historic evolution. Indeed, the highest population densities are situated within the limits of
the ancient walled city; the average density in this area being 466 persons per hectare and
the highest being 928 persons per hectare in Dariapur (ward 3). Another high concentration
of inhabitants is at the Northeast of the Old City, i.e. the wards of Asarva (ward 19),
Naroda Road (ward 20) and Saraspur (ward 21) concentrating some slums. This type of
housing is also found in the East where the textile and ancillary industrial estates are
located. These areas attracted the workers in these activities and consequently the density of
this eastern periphery increased.
Average density zones are in the northern fringes as well as in part of the South and East of
the city. There the average density is 174 persons / km².
The West of Ahmedabad as well as the south-western, southern, eastern and north-eastern
periphery are low density areas.
3.1.3 Geographical approach
This approach lies in comparing the demographic evolution of two distinct parts of the city
under the AMC limits, the Old City and the “Rest of Town”, from 1921 onwards. Its
purpose is to put the emphasis on the movement of population from the Old City to the
“Rest of Town”.
Old City
The population and density of the Old City have increased till 1971 and have reached their
maximum in the same year (480,735 inhabitants and 644 persons per ha.). Then, the
population growth rate decreased and became negative. After a high decrease of its growth
hals
hs-0
0138
830,
ver
sion
1 -
27 M
ar 2
007

23
rate and density in the 1981-1991 decade (-1,73% and 534 persons per ha.), the population
experienced a moderate diminution from 1991 to reach 372,256 in 2001. As the Old City
remains the most densely populated area of Ahmedabad, its density, which doubled
between 1921 and 2001, has been following a constant decline since 1971: from 644
inhabitants per ha. in 1971 to 499 in 2001 (cf. Table IV).
Table IV - Old City area: Population, Growth Rate, Density
Census Area Population Pop. Growth (%) Density
Year Km² Hectare / Period / Year (*) (Pers./ha)
1921 7.46 746 185,552 - - 249
1931 7.46 746 244,792 31.9 2.81 328
1941 7.46 746 314,396 28.4 2.53 421
1951 7.46 746 393,941 25.3 2.28 528
1961 7.46 746 459,535 16.7 1.55 616
1971 7.46 746 480,735 4.6 0.45 644
1981 7.46 746 474,223 -1.4 -0.14 636
1991 7.46 746 398,410 -16.0 -1.73 534
2001 7.46 746 372,256 -6.6 -0.68 499
(*) Assuming an exponential growth along the period.
Source: Statistical Outline of Ahmedabad City (1998-99)
Rest of Town
The population of the “Rest of Town” (i.e. outside the Old City, within the AMC limits)
increased constantly from 1921 to 2001, with an average population growth rate of 4,5%
per year. During the same period, the density increased on a regular pace, except after each
significant extension of the AMC limits: since the perimeter increased by 2,5 between 1931
and 1941, the density slightly decreased (62 persons per ha. in 1941). The same
phenomenon happened during the 1951-1961 and 1981-1991 decades, when the perimeter
of the city almost doubled each time. If we exclude this last period, we notice that there
hasn’t been a significant variation in the density between 1971-1981 (175 persons per ha.)
and 1991-2001 (172 persons per ha.). Moreover, if we disregard the 1981-1991 decade, the
hals
hs-0
0138
830,
ver
sion
1 -
27 M
ar 2
007

24
population growth rate is continuously decreasing from 1971 (4,8%) to 1981 (3,6%) and
2001 (2,3%).
Table V - Rest of town (outside the Old City): Population, Growth Rate, Density
Census Area Population Pop. Growth (%) Density
Year Km² Hectare / Period / Year (*) (Pers./ha)
1921 16.5 1,650 88,455 - - 54
1931 17.83 1,783 137,976 56.0 4.55 77
1941 45.01 4,501 276,871 100.7 7.21 62
1951 45.01 4,501 443,222 60.1 4.82 98
1961 85.52 8,552 690,383 55.8 4.53 81
1971 85.52 8,552 1,104,809 60.0 4.81 129
1981 90.69 9,069 1,585,502 43.5 3.68 175
1991 182.69 18,269 2,487,300 56.9 4.61 136
2001 182.69 18,269 3,143,105 26.4 2.37 172
(*) Assuming an exponential growth along the period.
Source: Statistical Outline of Ahmedabad City (1998-99)
Shift of the population from the Old City to the “Rest of town”
The urban development of the western side of the Sabarmati River in the beginning of the
20th century, which attracted the emerging middle class, is one of the main reasons
explaining a shift of the population from the East towards the West. Two major events have
fostered this trend: the collapse of the textile industry (East) in the eighties as well as the
transfer of the industrial activity to the eastern periphery. The commercial development to
the detriment of housing has brought a number of problems in the Old City, that affected
seriously the quality of life: high traffic, infrastructure deterioration, dilapidation of housing
stock and lack of open space. The subsequent decrease of the population lead to the
multiplication of warehouses disturbing the remaining neighborhood.
Moreover, since the area has a long tradition of communal conflicts, which is still alive, the
risks inherent to frequent riots (1992, 2002) and frictions linked to promiscuity are
additional factors to leave the place. Therefore, the western part of Ahmedabad attracts
hals
hs-0
0138
830,
ver
sion
1 -
27 M
ar 2
007

25
today most of the investments from both public and private actors. In the coming years, the
population of the “Rest of Town” will increase while its population growth rate is likely to
follow its declining trend, due to the shift of residents from the centre to the fringe areas.
3.2 The existing Water supply system: Technical data
Most of the technical data required to understand the existing water supply system have
been collected in the Water Supply Department of AMC, in June 2001. The information
obtained is relevant for this period.
3.2.1 Institutional aspects
AUDA
Within the jurisdiction of Ahmedabad Urban Development Authority, 163 villages, towns
and municipals councils are responsible for service provisions: the Gujarat Town Planning
and Urban Development Act of 1976, under which AUDA was created, does not mention
direct responsibility for the provision of water, although the execution of works is among
the attributions of the AUDA. For planning, design and implementation of water supply,
AUDA relies on private agencies. Finally, this entity is more a co-ordinating agency than
an implementing one.
AMC
The Ahmedabad Municipal Corporation is the technical operator and supply agency of the
water services within the city limits. Provision of water supply, sewerage and drainage is a
compulsory function of the Corporation stipulated by the Bombay Provincial Municipal
Corporation Act of 1949 that provides the framework for its intervention. The following
analysis will focus more specifically on the AMC water supply situation.
hals
hs-0
0138
830,
ver
sion
1 -
27 M
ar 2
007

26
3.2.2 Production
The total daily production of water for AMC is 570 MLD9. The city is both dependent on
surface water (300 MLD), from Mahi River through Raska weir and on ground water (270
MLD) from bore wells, located in various parts of the town10. Some 300 to 350 bore wells
out of 410 are used daily11; the remaining ones are used alternatively, according to the
needs.
Ground water is being extensively developed, through the tube wells, from deep aquifers
for water supply in domestic and industrial sector. The withdrawal from private bore wells
is estimated to 80 MLD12. Most of the industries, large establishments as well as housing
societies supplement the public piped supply by drawing water from their own bore wells,
all through the day and without any restriction, at a comparatively low cost. This is also the
case of the western fringe of AUDA area, which mostly depends on ground water from
private bore wells.
3.2.3 Supply: Network and Quality of service
Network
The water supply distribution is organized according to the existing five zones (North,
South, East, West, and Central), although the network is not fully developed in the newly
added areas in the North and South of the city. Each tube well station commands a certain
area and the entire distribution system, the length of which is 2388 km., is interconnected13.
9 Million Litres per Day (equivalent to 1 000 cubic metres). 10 AMC, Water Supply Department, Interview, May 2001. 11 AMC, Water Supply Department, Interview, June 2001. 12 CEPT (2001), Rapid Environmental Impact Assessment of the Sabarmati River Front Development Project, Ahmedabad. 13 AMC (2000), Statistical Outline of Ahmedabad City, 1998-1999, Planning and Statistics Department, Ahmedabad.
hals
hs-0
0138
830,
ver
sion
1 -
27 M
ar 2
007

27
Hours of supply
The official duration of supply in Ahmedabad is only two hours in the morning, from 6 to
8. Supply duration can differ from one location (getting more than four hours supply) to
another (receiving water during less than two hours).
3.2.4 Non Revenue Water (NRW)
According to AMC, approximately 20% of 570 Millions Liters per Day (MLD) are lost
before consumption, due to technical loss (leakage, seepage) or commercial one
(unauthorized use). Such a level of NRW is usually found in towns located in developed
countries (when the network is well maintained). Therefore, the figures given by the
Corporation can hardly fit to the reality.
We assume that the NRW or total loss is 55% of the production of water of which 40% is
technical (leakage, seepage) and 15% commercial (unauthorized use)14. Therefore, the
consumption (billed or not billed) would be 60% of the production (15% of commercial
loss + 45% of billed consumption), i.e. 342 MLD.
3.2.5 Coverage
According to the Census of India, in 1991, 88,2% of the households had an access to
drinking water through the “Tap” and 11,7% through different sources (well,
handpump/tubewell, river/canal, others). 68,8% of the taps was situated inside premises and
19,4% outside premises. In 2001, we assume that 90% of the households have access to the
tap, which is for 71% inside premises and 19% outside premises (cf. Table VI).
14 Losses are uncertain because the consumption itself is uncertain due to the absence of metering.
hals
hs-0
0138
830,
ver
sion
1 -
27 M
ar 2
007

28
Table VI - Households per source of drinking water in AMC in 1991
Source of drinking water Households Percentage
Tap 521 690 88,2
> (Inside the premises) (407 050) (68,8)
> (Outside the premises) (114 640) (19,4)
Well 37 350 6,3
Hand pump / Tube well 21 275 3,6
River / Canal 230 ε
Tank 175 ε
Others 10 795 1,8
TOTAL 591 515 100
Source: Census of India 1991, Series-7, Gujarat, Part VII, Tables on Houses and
Households Amenities, Directorate of Census Operations, Gujarat, Ahmedabad, 1991.
Individual connections
If we refer to this Census, a first assumption is that taps inside premises are individual.
If we assume that 71% of the population (2 495 906 persons) have an individual connection
in 2001, on the basis of a total number of 246 239 connections, there are 10,1 persons per
individual connection.
Public standposts
Based on the figures given by the Census (Table VI), we assume that in 2001, 19% of
connections outside premises are public standposts supplying water to 667 919 persons.
Since AMC estimates the total number of public standposts to 7 00015, there are 95 persons
per standposts.
To confirm our assumption that tap outside premises corresponds to public standpost, we
can have the following reasoning: if we assume that in 2001, there are 100 persons per
standpost, hence, 700 000 persons are supplied water by this mode i.e. 19,9% of the
population. This figure is close to the percentage of households served by a tap in 1991
(19,4%) and confirms therefore that tap outside premises should correspond to public
hals
hs-0
0138
830,
ver
sion
1 -
27 M
ar 2
007

29
standpost. A study done in 1995 mentions that the Corporation supplied water to the slum
dwellers through 3 100 standposts16.
Shallow wells
A survey published in 2001 attests that shallow wells are not any more in use within the
city limits due to rapid urbanization and low quality of water, except in “low income
housing societies and slums, where assured supply of water does not exist”17. There,
shallow wells like hand pumps are also used for drinking purpose. They are also found in
some areas in the North West (Chandlodia, Ghatlodia), in the South West (Vasna/ward 8,
Vejalpur, Sarkhej) and in the South (Vatva/ward 42, Isanpur/ward 43, Narol, Lambha).
Private Tankers
Private tankers have been operating in Ahmedabad since about 15 years. There has been a
multiplication of their number due to profitability in this sector. Their major consumers are
government offices, construction companies, etc. They are mainly located outside the AMC
limits, in the AUDA area (Thaltej, Vasna and Memnagar) and they extract water from the
wells located in the fields or purchase it from the farmers (Ladda, XXX, p.40-41).
3.2.6 Consumption
Domestic consumption
AMC declares that they provide 160 Litres Per Capita per Day (LPCD) to the population.
This assertion is closer to basic overall calculations than it is to the consumers’ reality: it
doesn’t take into consideration the non-coverage of 10% of the population and the technical
losses, i.e. 40% of the production of water (227MLD).
Let us propose our own estimate: if we assume that 95% of the total consumption is for
domestic purpose (326 MLD) and 90% of the population receive water from an AMC 15 AMC, Water Supply Department, Interview, June 2001. 16 Brijgopal, Ladda (1995), Planning and Financing Urban Water Supply: A Case Study of Ahmedabad. CEPT, Thesis, Ahmedabad, 390 p.
hals
hs-0
0138
830,
ver
sion
1 -
27 M
ar 2
007

30
connection (3 163 825), the LPCD becomes 103. The total number of individual
connections in 1998-99 is 246 239. Based on our assumption of served population by an
individual connection, there is an average of 12,8 persons per connection. Here are the main
characteristics of the domestic demand in 2001, as detailed above (cf. Table VII)
Table VII – Main Characteristics of Domestic Demand (2001)
Distribution Domestic-Non Domestic
> Domestic consumption
95%-5%
> 326 MLD
Coverage from a connection 90%
Connected Population (i.e. population receiving water from an AMC connection)
- Population
- Connection rate (**)
> Served population
3 515 361
90%
> 3 163 825
Litre Per Capita per Day (LPCD)
- Distribution of water
- Served population
> LPCD
326 MLD
3 163 825
> 103
(*) For checking this rate, we consider the served population as derived from the number of connection.
(**) In 1991, the rate was 88,2% (Census of India). We assume a slight improvement during the last decade.
Non-domestic consumption
According to a study achieved in 199818, light industrial, commercial and services activities
representing some 6 000 consumers are metered, in contrast to a very small percentage of
metered domestic consumption.
We assumed that 5% of the total consumption is non-domestic i.e. 17 MLD. And if we take
the estimated production of private bore wells, the total non-domestic consumption is about
100 MLD.
Most of the industrial demand is not met by AMC (textile mills, railways, power plants,
etc.)
17 CEPT, p.14. 18 Shashikant, Pandey (1998), Spatial Decision Support System for Water Supply for Ahmedabad. CEPT, Thesis, 65p.
hals
hs-0
0138
830,
ver
sion
1 -
27 M
ar 2
007

31
3.2.7 Cost of water
The connection cost is Rs.1000. It has to be verified whether this cost varies according to
the type of consumer and the perimeter or not. Figures related to the repartition of
connections by type of housing were not available in AMC. Due to the absence of metering
for domestic connections, billing of water is not based on consumption but on taxes fixed in
relation with property tax. In consequence, the water and conservancy taxes are levied on
the basis of area property.
Water Tax
• Residential properties are charged between 15-25% of the property tax, for area
between 50-200-sq. m. and above; the minimum monthly rate being between Rs.12-
Rs.17.50 according to the area;
• Non residential properties are charged between 15-22% of the property tax, according
to the area; the minimum monthly rate being Rs.30-Rs.50 according to the area;
• “Special industries” are charged between 25-30%, with a minimum monthly rate of
Rs.60.
Conservancy Tax
All properties are charged 18% of the property tax, with a minimum monthly rate of Rs.10.
(residential) and Rs.15 (non-residential).
hals
hs-0
0138
830,
ver
sion
1 -
27 M
ar 2
007

32
Meter Charges
In metered connections, residential, commercial and air-conditioned commercial properties
are charged Rs.3, Rs.8 and Rs.20 per 1000 litres. Construction sites are charged Rs.20 per
sq. m. of built up area.
The case of slums
In Ahmedabad, most of the areas with limited access to piped water are slums and urban
fringes, where the population growth is more rapid than in other areas. Slums are required
to pay Rs.4 and Rs.3 minimum per month as water and conservancy tax. In reality, in
slums, most of the households do not pay property tax or have overdue for the last years19.
As a result, “slum dwellers are provided water free of cost”20. Illegal connections are
common and the prescribed minimum charge is not paid.
Other housing types have 20% population not paying taxes. In the case of bungalows and
flats, taxpayers’ percentage is higher than others.
3.2.8 Storage of water within households
Ahmedabad, as other Indian metropolis is characterized by heterogeneous consumption of
water. Piped network mainly serves central areas of the cities. In these areas, the water
supply is limited to few hours per day (two hours on an average in the Old City) and the
quantity supplied differs from one location to another. As a consequence, a significant
number of households use facilities to ensure continuous water supply. Over the times, in
such a context, storage has been a practical response to the shortage of water. Today, this
practice is found in different areas, without any distinction of social class or housing type.
In various fringes of the town, several households privately construct overhead tanks and
install motor pumps.
19 Rajesh, Suhane (1997), Dynamics of Water Supply Management System: a case of Ahmedabad. CEPT Thesis, Ahmedabad, 77p. 20 Op.Cit., p.33-34.
hals
hs-0
0138
830,
ver
sion
1 -
27 M
ar 2
007

33
The Tanki, to compensate the unreliability of water supply
Within the Old City, the residents of Chawls21 use small cistern called Tanki to collect the
water supplied by the municipality in the morning time, generally from 6 to 8, for using it
all through the day. This solution has been set up to compensate the unreliability of water
supply.
The Tanka, to tackle the water scarcity
Another well spread water storage facility is the Tanka or individual underground cistern,
based on the collection of rain water collected on the roof of private house. This existing
old system, which is not any more utilized, can represent a substantial additional source of
water from a local perspective, i.e. the Pol area of Ahmedabad. This system emerged to
tackle water scarcity in this drought prone city. There are about 10 000 Tankas in the Old
City and their storage capacity ranges from 25 000 to 50 000 litres. See Annextures:
A. Tanka Structure B. Street Map
3.2.9 Assessment of data
Due to the unreliability of some data provided by AMC (NRW, LPCD), part of the analysis
related to the water supply situation is based on assumptions. These hypotheses are the
result of comparison with other towns of the same size and level of development in term of
water supply management.
No appropriate data were found in relation with income groups (size, income, consumption
and connections).
21 Chawls are single room row houses. They constituted an answer to the housing needs consecutive to the development of the textile industry.
hals
hs-0
0138
830,
ver
sion
1 -
27 M
ar 2
007

34
3.2.10 Geographical approach
Old City
Although no data regarding the ward wise LPCD were available in the AMC, the high
densities of population in the Old City presuppose that the availability of water per capita in
that area is among the lowest of the entire city. Therefore, the rehabilitation of the Tankas
in the Old City can be seen as a potential local answer to water scarcity in that zone.
Rest of the town
The significant shift of the population from the central zone towards the eastern and
western part of the city reveals that both of these areas will see their water demand increase
in the coming years.
Conclusion
The notion of water scarcity reveals three distinct situations: absolute scarcity (lack of
sufficient water), poor timeliness (discontinuous distribution of water) and the combination
of both situations. In the case of Ahmedabad, the second hypothesis seems to be
predominant. In such a situation and from a local perspective, the alternative sources of
water could constitute an answer and supplement the present system of water supply, which
is unable to satisfy the needs of the inhabitants. hals
hs-0
0138
830,
ver
sion
1 -
27 M
ar 2
007
35
4 RESEARCH METHODOLOGY OF THE EMPIRICAL STUDY
To the best of our knowledge, detailed studies of the conditions of implementation of local
water management in a specific case have not been developed. In that regard, the
rehabilitation of the rainwater harvesting system in the Old city of Ahmedabad might
constitute an interesting case study, as far as the pols are managed by panchs.
4.1 Identification and Operationalization of the Research
4.1.1 Definition of the research topic
Water scarcity in Ahmedabad is a tangible phenomenon when referring to the evolution of
liter per capita per day (LPCD) during the past decades. This figure has decreased from 191 to
125 LPCD from 1971-72 to 1996-97, despite the increase of the volume of water supplied
which has grown from 317 to 415 millions of liter per day (MLD) during the same period
(IRMA, 2000). In spite of the decrease of its growth rates, the population will keep on
growing from 2001 to 2021. Therefore, we can assume that this situation will lead to acute
water supply issues to be managed by the municipal corporation supplying water in the city,
particularly in the Western part of the city. From this diagnosis, one should think of
alternative solutions of water supply in Ahmedabad, in a geographic and climatic context of
water scarcity.
Like in many other Indian cities, water storage practices in Ahmedabad are a daily routine for
the population, independently of the social class. Hence, the traditional rainwater harversting
system , called tanka, mostly existing in the Old city, can fulfil two major functions:
providing an additional source of water within the Old city, and reducing the pressure on the
water demand from a local perspective. The saving in water would not be negligible since
90% of the population is supplied by a municipal connection, and since 95% of the water
supplied by the municipality is used for domestic purposes.
Nowadays, tankas are mostly unused by the inhabitants of the Old city. The use of the
underground cisterns sets the question of their necessity. According to Zérah (1999), this
necessity can be explained by the unreliability of water supply provided by the municipalities.
hals
hs-0
0138
830,
ver
sion
1 -
27 M
ar 2
007

36
Her study conducted in Delhi has shown that three elements characterize the unreliability of
water supply : discontinuity of supply, insufficiencies and fluctuations in pressure, incapacity
to forecast the water supply service (shortages, seasonal variations…).
The objective of the research is therefore to describe both opinions and behaviors of
households in Ahmedabad regarding the water supply system they are currently using and the
rainwater harvesting system.
4.1.2 Research hypothesis
Under the hypothesis that the water supply system does not fulfil the needs of the population
in a context of water scarcity, the tankas represent a useful source of water, particularly for
non potable water which constitutes most of the total consumption. Indeed, on the basis of a
500 liters per day per household (5 people), only 6% of this consumption must be potable,
that is 30 liters per day per household, or 6 LPCD (liter per capita per day). So the aim is to
know to what extent and under which conditions the rainwater harvesting system can
complement the current supply system, and to what extent the population is ready to use it. It
is therefore important to focus on the quantitative as well as qualitative characteristics of both
systems.
4.2 Framework of the Study
4.2.1 The type of research
The research is descriptive by nature because the primary objective is to describe a situation
(the water supply situation in a given area). It is based on a survey conducted by means of a
questionnaire.
The cross-sectional analysis was chosen for several reasons22. We know that water
consumption practices and that the opinion of inhabitants regarding water supply systems are
not phenomena that are exposed to large variations in a normal situation, that is in times
22 According to Churchill (1991), there are two types of descriptive research: time series analysis and cross-sectional analysis. The first refers to a given phenomena observed at regular intervals of time on a permanent sample (panel), while the second provides a picture of the phenomena at a given moment.
hals
hs-0
0138
830,
ver
sion
1 -
27 M
ar 2
007
37
where there are no exceptional conditions (climatic changes, natural disaster, change in
sanitary conditions, modification of infrastructures). If Ahmedabad is still in some places
under the shock of the Gujarat earthquake that happened in January 2001, the impact of the
quake was not visible at the moment of the survey which started 10 months later. The reason
for it is simple: the Old City was the less damaged part of the urban area.
4.2.2 Data collection methods and measurement instruments
(see Annexture C. – The Questionnaire: the Old city survey)
Data collection requirements on the situation of water supply in the city must be precised. To
obtain information that would be less subjective as possible, it is necessary to have a proper
understanding of the opinions and behaviors of the users of both systems, the water supply
system and the rainwater harvesting system. It is also necessary to describe the
sociodemographic status of respondents. Three 3 major domains were covered in the
questionnaire:
- sociodemographic data;
- opinions and behaviors regarding the current water supply system
- opinions and behaviors regarding the rainwater harvesting system
Based of the literature review and on several qualitative interviews from households
conducted prior to the design of the questionnaire, the following 7 categories of variables
were described by 153 variables composing the questionnaire:
- description of the house, household, cast, education, occupation, income;
- access to water and level of equipment;
- daily consumption per household
- perceived quality of service;
- storage practices;
- maintenance practices;
- willingness to use the alternative system.
Questions asked are essentially multiple choice questions except several open questions when
it was not possible to pre-define the possible choices to be mentioned by respondents.
Linguistic issues were faced when designing the questionnaire since it was designed in
hals
hs-0
0138
830,
ver
sion
1 -
27 M
ar 2
007

38
English and translated into Gujarati, the local language of Ahmedabad city. It was then pre-
tested with 5 households and was slightly modified in accordance (e.g. regarding the
understanding of certain expressions or regarding the identification of the housing unit which
comprises several distinct households). The final version of the questionnaire was established
in English, but it was administered in Gujarati.
4.3 Data collection, Processing and Analysis
4.3.1 Sampling design
(see Exhibit V- Map 5: localisation of the pols surveyed in the Old city)
Definition of the population and selection of the sample
The population targeted by the research lives in the Old City of Ahmedabad because the
individual tankas for rainwater harvesting are essentially concentrated in the pols of this area.
About 500 pols would exist in the Old City (Dupavillon, 2001). Considering that all the pols
of the Old City do not all have tankas, it is necessary to localise those who do have tankas.
The 2 pols that have been studied in the Franco-Indian Old city rehabilitation project were
retained for this survey: Akasheth Kuva no pol (Akasheth) and Jadha Baghat ni pol (Jadha
Baghat). The maps that have been drawn by the project team enabled us to localise the tankas
inside each of the 2 pols (Direction de l’architecture et du patrimoine, 2001). Still the
localisation of tankas remains partial since the number of tankas indicated in the maps is
inferior to the one which was actually observed in the field study.
Studying 2 pols provided many advantages because their differences in many respects:
- the geographical location and the ward;
- the ethnic composition;
- the levels of education, of income and of professional activity.
Sampling unit and respondents
The sampling unit is the housing unit that may gather 2 to 3 households (enlarged family
pattern). In the majority of cases, the respondent is a woman answering the questionnaire in
the name of her household. The final sample is composed of 60 households equally split
between the 2 pols.
hals
hs-0
0138
830,
ver
sion
1 -
27 M
ar 2
007

39
The choice of the sampling unit is first based on the availability of a tanka in the housing unit
because rainwater harvesting requires a tanka to store water. The questionnaire was therefore
administered in priority to households who may use the rainwater harvesting system. Three
types of rainwater harvesting systems were distinguished :
- the “operational systems” (OS): households that have a tanka and that are using it;
- the “non operational systems” (NOS): households that have a tanka but that are not using
it because of their closing;
- the “non existing systems” (NES): households that do not have a tanka.
Sampling method The sampling method is therefore non probabilistic. This method is the most adequate
because we want to identify first the households whose rainwater harvesting system is
operational, followed by the non operational systems and the non existing systems.
Therefore, a combination of snowball and convenience sampling was used to reached the
relevant respondents. The snowball sampling relies on a sequential process by which the
members of one group (e.g. the OS group) can be identified by a first member of the group.
The repetition of the operation rapidly leads to the exhaustive identification of the households
that have an operational system in the pol. In case of convenience sampling, information was
obtained by interviewing people who accepted to answer the questionnaire. This approach is
used to identify the non operational systems and the non existing system.
4.3.2 Data collection and analysis
Data Collection
The survey was conducted between late November 2001 and early January 2002. This is
during winter season, and this must be remembered because the season impacts on the
population’s water needs. The pol of Akasheth was surveyed first, followed by the pol of
Jadha Baghat.
The administration of the questionnaire took 45 minutes per household. It was administered
by the researcher which allowed to minimize the potential bias that would result from
insufficient training of local interviewers.
hals
hs-0
0138
830,
ver
sion
1 -
27 M
ar 2
007

40
During the field study, no explicit resistance was expressed by the households in Akasheth
regarding their participation to the survey. On the contrary, more resistance appeared in Jadha
Baghat and we had to provide more explanations about the rationale of the survey. In the two
pols, we informed the respondents that this study was undertaken with the back-up from the
well known Indian Institute of Management Ahmedabad. In order to address the common
mistrust towards civil agents of the municipality, we insisted on the academic aim of the
study.
Data Analysis
Given the small size sample (60 households), we computed only straight tabulations and
cross-tabulations on the main variables used in the questionnaire relating to socio-
demographic dimensions, to the current water system and to the harvesting water system.
A marginal number of households have refused to collaborate to the survey, therefore a
specific analysis of non responses cases is not necessary. This does not cast doubt on the
validity of the results, even though the small size of the sample allows only for a preliminary
analysis of the hypothesis of the research.
hals
hs-0
0138
830,
ver
sion
1 -
27 M
ar 2
007

41
5 RESULTS AND DISCUSSIONS
5.1 Analysis of Socio-Demographic Datas
5.1.1 Household’s composition
Seven houses out of ten are occupied by a single household. More than the half of the
households interviewed declare that the house they live in has a number of occupants less or
equal to 5 persons. This information confirms that the average households’ size in India is 5
people (standard proposed by the National Council for Applied Economic Research) which
suggests a trend towards the development of nucleus families.
5.1.2 Type of housing
More than half of the houses have 7 or more rooms, in other terms, these are family houses
with multistorey buildings. Moreover, in 50% of cases, the number of rooms occupied by the
households interviewed is inferior or equal to 3. Most of the households are the owners of
their house.
5.1.3 The respondent
Cast belonging Casts and sub casts the more represented in the survey are Brahmins and Patels. The first ones
constitute almost half of the interviewees in Akasheth and the second ones the 2/3 in Jadha
Baghat; the Indo-French study underlines effectively the social permanence of this pol, since
only 3 to 4 houses are occupied by families from other casts (AFAA, 2001, p.62). This
composition fits globally with the social structure of the pols which generally gather a
population of a sole cast. Vaishyas is the second group of population represented in the
sample of both the pols.
hals
hs-0
0138
830,
ver
sion
1 -
27 M
ar 2
007

42
Sex, Age Half of the interviewees are the heads of the family. Two thirds of the respondents are women
answering for their household. They are mothers, daughters, daughters in law. In
consequence, we have two equal age groups among the respondents: the 30-45 and the 46-60.
These groups forms 8/10 of the respondents.
Duration of residence The respondents whose birth home is the one where they live at the time of the survey form
almost half of the population interviewed in each pol. Nevertheless, the inhabitants of
Akasheth are more rooted in their pol compared to Jadha Baghat where the proportion of
inhabitants with a duration of residence superior to 10 years is 2 times less than in Akasheth.
Moreover, the new comers are only noticeable in Jadha Baghat where mobility is a
perceptible phenomenon (1/10 of the respondents).
Education Half of the respondents have a secondary education. In Akasheth, the number of persons
graduated from higher education is the double compared to Jadha Baghat. These educated
people represent almost half of the sample in Akasheth. This situation can be explained by the
predominance of Brahmins in that pol.
Occupation The households whose head of family is an employee account for 2/3 of the population
interviewed in Jadha Baghat ; this is twice more than in Akasheth. At the other extremity of
the hierarchy of occupations, one third of the respondents in Akasheth are professionals
whereas in Jadha Baghat there is only one.
Annual income One can note that ten households have an average income inferior to 10.000 Rs. in Jadha
Baghat against only one in Akasheth. This situation puts the first pol towards the low income
groups. In contrast, more than a third of the households interviewed in Akasheth have an
income superior to 6.000 to 8.000 Rs. This population may be part of the medium class or the
hals
hs-0
0138
830,
ver
sion
1 -
27 M
ar 2
007

43
upper medium class. In between, we find an equal number of households earning from 2000
to 6000 Rs. This population represents half of respondents in each pols.
5.2 Households’ Opinions and behaviors on the Existing Water Supply System
5.2.1 System of water supply
Most households have an individual connection to the municipal water network. If 4/5th have
a single connection, 1/5th use two connections.
One exception must be noted about a household from Akasheth who lives in an apartment
located in a building where the water supply depends on a deep well. Our study has not
covered the households of the pols who live in buildings because the buildings do not match
with the individual houses’ typology retained in the study. But the number of buildings has
been growing during the past years and it would be necessary to know how much population
lives in such a housing within each pol.
5.2.2 Level of Equipment and Households’ practices in Water Storage
The tanki
The storage by means of tanki23 is a very common practice in the two pols : 5/6th of the
households use a tanki and the average storage capacity is 442 liters.
The Buckets
The use of buckets is as common as the use of tanki since one uses the bucket to pour water in
the tanki. The average containance of the buckets used is 9 liters. The households fill up an
average of 216 liters stored daily. Only two households declare that they are not using
buckets: they use an electrical device which is directly connected to the water tap. This illegal
practice has been acknowledged in Akasheth. It should not to be considered as unique in both
pols, eventhough we were exposed to it in a minority of cases during the survey.
23 Generic term for a small cistern of water storage. It is generally installed near to the entrance of the house where the municipal connection stands.
hals
hs-0
0138
830,
ver
sion
1 -
27 M
ar 2
007

44
Roof Cisterns
Water storage within cisterns made out of plastic and located on the upper floor of houses is a
practice that generally strikes a foreigner’s eye when visiting Indian cities. Here, a direct
observation from the ground and from the upper terraces, does not show an important number
of roof cisterns in the pols’ houses. This is confirmed by the survey: ¾ of households do not
use this storage device. Main reasons involved to justify this non use are essentially the
absence of need and the impossibility to install a cistern on the roof. Then comes the cost of a
cistern, this reason being mentioned mainly by households from Jadha Baghat. This
corroborates the fact that ¼ of households who declare using this storage device live in
Akasheth where income is higher.
The households using cisterns have been using it at least for the past 15 years in average,
which is also the average number of years of using the tankis. The parallel is interesting. It
would be useful to know exactly about the water supply situation when modern practices
arose, independently of the fact that water storage has always been a major historical practice
of inhabitants in this region.
Electric pumps
The electric pump is to the roof what the bucket is to the tanki: it enables to pour the water
collected in the buckets on the ground floor into the cistern or any other device located on the
upper floors,. As for the cisterns, our survey shows that 2/3 of households, among which more
than 50% live in Jadha Baghat, don’t use an electric pump. The main reason for not using it is
the absence of need. The impossibility to install the pump is less mentioned, but the cost of a
pump is the major resistance evoked by households in Jadha Baghat. This proportion is the
same as for roof cisterns.
5.2.3 Daily consumption
Total consumption
The total water consumption and the variations of consumption from one season to another
(winter/summer) are globally equivalent in the two pols (see Table VII- Selected Pols:
Average daily consumption per households).
hals
hs-0
0138
830,
ver
sion
1 -
27 M
ar 2
007

45
Table VII – Ahmedabad Selected Pols: Average daily consumption per households (2001) Consumption
(liters/day)
Akasheth
(AKA)
Jadha Baghat
(JAD)
2 pols
(AKA + JAD)
SUMMER Estimates 360 380 370
WINTER Estimates 250 290 270
Survey (WINTER) 285 315 300
Source : Ahmedabad Survey (nov. 01/jan. 02).
The variations of consumption between the two pols in summer as well as in winter are
marginal. Compared to households in Akasheth, households in Jadha Baghat consume a little
more water in summer (20 liters, total 380 liters) and in winter (40 liters, total 290 liters).
Given this proximity of consumption, it is justified to use the average of the two pols as the
indicator. Therefore, the average consumption per households estimated in the survey is 370
liters in summer and 270 liters in winter, meaning the average seasonal variation is 100 liters.
Nevertheless, a rough estimate of water consumption necessary for different usages (cooking,
washing dishes, bath, laundry, house cleaning) indicates a variation of consumption of 30
liters between summer and winter. We therefore have estimated that the average daily water
consumption could be more than 30 liters, that is a total of 400 liters. The new consumption
estimates per households per day are 300 liters in winter and 400 liters in summer.
Socio-demographic data show that ¾ of households are composed of a number of persons less
than or equal to 5 people. If we consider the average of 5 people per households, there are 80
LPDC in summer and 60 LDPC in winter, the annual means being 70 LPDC over the year.
This consumption estimate is consequently inferior by 33 liters when compared to our initial
estimate of 103 LPDC presented in part one24.
Consumption by type of usage
Below are the daily average consumption water by households as a function of different usage
(see Table VIII- Selected Pols: Daily water consumption per households by type of usage).
24 Cf.
hals
hs-0
0138
830,
ver
sion
1 -
27 M
ar 2
007

46
Table VIII – Selected Pols: Daily water consumption per households by type of usage (2001)
Type of usage Consumption (liters/day)
Drinking / Cooking
Washing Utensils
Bathing
Washing clothes
Cleaning the house
Other (toilets)
28
25
70
102
25
50
TOTAL 300
Source : Ahmedabad Survey (nov. 01/jan. 02).
Laundry constitutes 1/3 of daily water consumption of households. Water for drinking and
cooking represents a minimum part of total consumption, less than 10%. The assumption that
at least 6% of water consumption by households should be potable is here confirmed. Overall,
90% of total consumption are used for domestic purposes.
5.2.4 Quality of Service and Satisfaction of Users
The schedule for water distribution
Water distribution by the municipalities start à 5h45 and end at 8h15. Half of households that
were interviewed get their supplies from 6 to 8 in the morning. The other half gets 15 minutes
to 30 minutes less. The supply varies from one house to another for a certain number of
reasons: a week pressure, the floor to be connected, the topographic situation and sometimes
the use of electric pumps plugged on the neighbor’s connection. This situation is not typical
of Ahmedabad since Zérah (1999, p.92) notes a similar phenomena in Delhi. There does not
seem to be any significant seasonal variation in the length of water distribution availability.
One must also note that 9/10th of households are satisfied with the schedule of water
distribution. Besides, 4 households out of 10 would appreciate a longer length of water
distribution, from 30 to 60 minutes more, preferably in the morning.
Water Pressure
50% of households estimate that water pressure is weak. The other half finds it normal.
Reasons of this difference relate to the diversity of situations given the floor of housing, the
topographic situation, the use of electric pumps in the same street, etc.
hals
hs-0
0138
830,
ver
sion
1 -
27 M
ar 2
007

47
Quality of Water
50% of households find that the water is clear, the other half, mainly originating from
Akasheth, find it unclear when civil servants from the municipality are doing work on the
network. Among these, 50% say they have not notice any impurity in the water, 50% declare
they have found solid elements in the water. Once again, it is the people from Akasheth who
complain against this malfunction.
Ultimately, it seems that most households recognize the quality of the water supplied, this in
spite of its brown color at the beginning of distribution or in spite of the presence of sediments
in Akasheth. This suggests that the quality of water is not better there than in Jadha Baghat
where income is lower. Zérah (1999, p. 101) shows the same result in Delhi where the quality
of water is not always better in the richest neighborhoods.
Only 5 households out of 60 declare they have caught diseases relating to water usage. When
asked about the quality of water delivered by the tankis, 3 consider that it is not clean, 1 that it
is clean and 1 who does not know.
5.2.5 Using external sources of water supply
2/3 of households declare having enough water. 1/3 of them complement their water supply
by external additional sources of water, that is the one taken from neighbors. Women and
children are usually responsible for this task. If half of households use this strategy on a daily
basis, the other half uses it during summer only. In both cases, this practice is done
extensively, with several journeys taking place in the morning between the neighbors
connection and the home. These journeys are made easier by the fact that the size of the pols
is not very big, allowing for walking distance activities in narrow streets where few motorized
engines come.
One must note in Akasheth the importance of the water quantity of households that are using
this strategy : 206 liters per day and an average of 17 daily journeys to transport this water,
which is twice of what was observed in Jadha Baghat.
hals
hs-0
0138
830,
ver
sion
1 -
27 M
ar 2
007

48
2/3 of households have an average monthly income between 2000 and 4000 Rupees. Zérah
(1999, p. 114) note that the time spent to storage goes down with the increase of income:
“Households having less than 3500 Rs spend more than 40 minutes to this activity against 26
minutes for households having an income higher that 8000 Rs.” Therefore the lower the
income is, the more time is allocated to solve this issue of unreliability.
5.2.6 Current Price of Water and Willingness to Pay Water at the Real Cost
Given the fact that women represent half of our respondents, they usually don’t know the
amount of water bill to be paid for water consumption, this being even worse due to the
annual payment basis. Still, after asking their husband, some of them have declared that the
bill amounts to 150 – 200 Rs per year. It is a tax on water computed on the basis of the
housing tax that varies depending on the surface of the housing.
To the question about the willingness to pay water at a unit tariff if an improvement of the
quality of service was obtained, 4/5th of households don’t want to benefit from this type of
service. The main reason given is the more expensive cost of the water that would result from
it. Another motive is the impossibility to share water among neighbors. This response is not
surprising given the importance of social links in the pols and of spontaneous mutual help
behaviors among people living there. A third reason against modernized water supply is that it
would mean stopping wasting water : an early morning observation shows the importance of
water waste with water flowing into the houses and allowing women to wash the laundry
more easily, without caring for the waste.
Still the unreliability of water supply has a cost for the households which includes monetary
costs (maintenance of equipments) and opportunity costs in terms of time, that is the monetary
valorization of time lost by the households when collecting water from neighbors, storing
water in buckets, etc. (Zérah, 1999, p. 138).
hals
hs-0
0138
830,
ver
sion
1 -
27 M
ar 2
007

49
5.3 Households’ Opinions and behaviors on the Alternative Rainwater Harvesting
System
5.3.1 Localization of Alternative Rainwater Harvesting Systems
An analysis of the operational state of alternative rainwater harvesting systems in the two pols
shows the following (see Table IX):
- 1 household out of 10 has an operational system (OS);
- more than 1/2 have a non operational system (NOS);
- less than 1/3 of households don’t have this system (NES).
Table IX – Ahmedabad, Selected Pols: Operational State of Rainwater Harvesting System (2001)
Operational State Akasheth
(AKA)
Jadha Baghat
(JAD)
2 pols
(AKA+JAD)
Operational System (OS)
Non Operational System (NOS)
Non Existing System (NES)
7
13
10
3
19
8
10
32
18
TOTAL 30 30 60
Source : Ahmedabad Survey (nov. 01/jan. 02).
A preliminary comparison of the state of systems in the two pols leads to the following
conclusions:
- the OS identified by the Akasheth survey (7/30) represent more than twice those identified
in Jadha Baghat (3/30);
- the share of NOS in each sample is higher in Jadha Baghat ( 19/30) than in Akasheth
(13/30);
- the share of NES in each sample is more or less equivalent between the 2 pols (10/30 and
8/30).
See Annextures: D. Akasheth E. Jadha Bhagat
In spite of the small sample size, a first assumption is that the share of OS would normally be
higher in Akasheth. Also the distribution of the systems by cast shows that the majority of
households having an OS in Akasheth is composed of Brahmans (5/7). This cast is generally
known for its conservatism, for the importance given to the concept of purity, especially in
terms of water consumption.
hals
hs-0
0138
830,
ver
sion
1 -
27 M
ar 2
007

50
The inhabitants who have an OS or a NOS think that these devices have been existing
approximately for the last 130 years, and that their extensive use took place during about a
century.
The OS are used accasionally in 9 cases out of 10. Only one household does not use it at all.
The first reason given by the NOS households to explain why the rainwater harvesting system
was abandoned is the introduction of modern water distribution systems.
5.3.2 Knowledge about the system
The cisterns used in the rainwater harvesting system are built with traditional materials. Walls
are made up of bricks and mortar composed of river sand. They are then covered with plaster
and lime.
The knowledge that households have about the materials used to build these old structures
reflects a certain interest for the system, independently from the operationality of the system.
Therefore, 5 households out of 10 who have an OS, and 6 households out of 32 who have a
NOS know about the materials used in their cistern.
A container in aluminium or in terracota, commonly called dhol, is equipped with a roap to
allow for water collection. The average storage capacity of individual cisterns is 25000 liters,
and some contain even 50000 liters. Only 1 household among the OS and NOS group know
exactly the capacity of their cisterns: 300000 liter for the OS and 10000 for the NOS. This
single observation shows the magnitude of storage capacities.
Finally, only two households with an OS know the surface of their roof which captures
rainwater.
5.3.3 Consumption practices
All the households who have an OS use rainwater exceptionally. In the majority of cases, the
households can’t say the quantity of water being used in these occasions. Here are some
indications about the water usage:
- Weddings or religious celebrations (4/10);
- Religious rituals (2/10);
hals
hs-0
0138
830,
ver
sion
1 -
27 M
ar 2
007

51
- Water scarcity (2/10);
- Civil works (1/10).
5.3.4 Quality of Rainwater
Unanimously, all the households having an OS or a NOS agree to say that rainwater is clear,
smell-less, with a normal taste and without impurities.
One must say that the interior part of the cistern is in the dark, which forbids the development
of chlorophyll propicious to the growth of weeds and germs. In stagnant water, the weeds are
eaten by the germs; hence the absence of weeds makes it difficult for bacteria to grow (Singh,
S.S., 2000).
5.3.5 Water Collection, Filtering and Purification Practices
Traditionally, water coming from the first rain is not collected. This practice allows for
cleaning the roof from impurities. Besides, water is collected in function of the location of
constellations called nakshatras. In the Indian calendar, the year is divided into twelve
months, each month accounting for two nakshatras. According to Indian astrology, there are
seven odd nakshatras considered as propicious for water storage in the tanka. According to
certain predictions, during certain nakshatras, the germs and bacteria growth is minimal
(Singh, 2000, p. 30).
Therefore it is interesting to compare the knowledge and the opinions of households having
an OS about water collection, filtering and purification practices. Contrary to households from
Jadha Baghat, households from Akasheth collect rainwater only after the roof being cleaned
by the first rain. They also respect the principles of nakshatras.
According to the elders, water can be filtered by a cloth or a metal grid located at the entrance
of the cistern. Inside the cistern, maintaining the quality of water can be done by pouring
small quantities of alun, a mineral with antiseptic properties used in medicine25. In Cambay, a
former port in Gujarat, the users of tanki are used to pour lime in the cistern after monsoon
25 Information obtained during the field study from inhabitants known for their knowledge of the rainwater harvesting system.
hals
hs-0
0138
830,
ver
sion
1 -
27 M
ar 2
007

52
season. The lime modifies the water pH. to make it more alkaline. Therefore bacterias that
cannot survive in alkaline water are automatically eliminated (Singh, 2000, p. 25).
According to a popular belief, the water from the tanki is so pure that it does not require any
treatment before it can be used. Therefore, the majority of households that have an OS declare
they don’t filter water at the entrance of the cistern because of its purity. Only 4 households
use, by precaution, a cloth to filter the water at the entrance of the cistern. Similarly, the
households do not purify the water inside the tanki because they think that the purity of water
is properly maintained. By precaution, only one household pours alun in its cistern. Finally,
when water has been extracted, the majority of households (7/10) do not purify it since they
see it as pure. Only 2 households boil that water by precaution.
5.3.6 Maintenance of the Cistern
No precise field information was obtained relative to the maintenance of the storage cistern.
Only the existence of a family specialized in the maintenance of this kind of system in the city
of Diu (Gujarat) suggests that the cisterns should periodically be maintained26. Still, only one
household with an OS confirms this information. Indeed, when summer comes, before the
first summer rainfalls, water must be evacuated from the cistern. This operation requires
members from the family to work half a day.
Apart from this exception, the majority of households (7/10) don’t provide any maintenance
to their cisterns, considering once again that the purity of water does not call for any special
treatment to be given to the cistern.
5.3.7 Willingness to Use the Rainwater Harvesting System
Only 6 households having a NOS out of 32 wish they could use rainwater, essentially for
domestic purposes, exclusive from cooking. When respondents don’t know the approximate
cost of the repair of the tanka, 4 declare to be ready to pay for it. The other two households
who refuse to pay for the repair of the system accept the idea of a cofinancing approach.
26 Information obtained by the Department in charge CONSERVATION DU PATRIMOINE in Ahmedabad municipality.
hals
hs-0
0138
830,
ver
sion
1 -
27 M
ar 2
007

53
A deeper analysis of their storage practices shows that 7 households use their neighbors’
connection to satisfy their water needs. The majority of them have a monthly income of less
than 2000 Rs. Besides, 7 other households have invested in the buying of a roof cistern on
their roof, among which 3 have a monthly income of less than 2000 Rupees.
hals
hs-0
0138
830,
ver
sion
1 -
27 M
ar 2
007

54
5.4 Main Results of the study
The survey conducted in the Old city of Ahmedabad between November 2001 and January
2002 outlines several phenomena, intrinsically linked, relating to the opinions and behaviors
of households regarding the current water supply system and the alternative rainwater
harvesting system. Though exploratory by nature, the empirical study provides a useful
preliminary empirical description of the two systems and of the opinions and behaviors of the
households in terms of local water management.
Concerning the current water supply system, the survey suggests :
- a manifest water scarcity within a certain perimeter of the Old city which supports the
hypothesis that the water supply system does not fulfil the needs of the population in a
context of water scarcity such as in Ahmedabad;
- that unreliability of water does not affect all the households, and that it is independent
from households’ income;
- the existence of compensatory strategies developed by households to face the unreliability
of the water supply (e.g. transporting neighbor’s water);
- that developing these coping strategies generate costs, especially for the households (e.g.
daily time allocation).
Concerning the alternative rainwater harvesting system, the survey suggests:
- the small number of operational systems for rainwater harvesting in the 2 pols studied;
- the important number of non operational systems that may be renovated;
- the near unanimity of inhabitants about the quality of rainwater;
- the willingness of some inhabitants to find alternative solutions to their water supply
difficulties since the rainwater collection system presents the advantage to allow for the
reduction of the unreliability costs, both monetary (maintenance of equipments) and
opportunity costs in terms of time spent by the households in collecting water from
neighbors, storing water in buckets, etc.
hals
hs-0
0138
830,
ver
sion
1 -
27 M
ar 2
007

55
Apart from these economic aspects, the survey suggests that the alternative rainwater
harvesting system, if renewed and effectively used, could allow households to reduce their
dependence from the water supply system and to benefit from an additional water source,
notably during summer and during dryness.
Finally, from the point of view of the water company (the municipality), the rainwater supply
in a given sector of the city (the Old City) would allow for local sparing of the water volumes,
this helping to minimize the global pressure currently existing on the water supply system.
5.5 Limits of the study
Our study suffers from several limits that must be mentioned. The first limit relate the
empirical study and the methodological approach. The non probabilistic nature of the sample
and the small sample size (60 households) do not allow for any generalization nor for the use
of sophisticated statistics. A minimum of 100 households would have been necessary to
improve data analysis.
The field study was conducted during the winter season therefore excluding the summer part
of the year when consumption variations occur. Besides, the data collection approach is cross-
sectional and cannot provide information about the evolution of households’ opinions and
behaviors over time, e.g. between winter and summer seasons.
The linguistic differences between the designed questionnaire (in English) and the
administered questionnaire (in Gujarati) may have generated errors when translating the
questions directly to the respondents during the interviews.
Finally, the questionnaire did not capture precisely the different factors (financial and
psychological) that could hinder the rehabilitation and effective use of the rainwater
harvesting system: if the economical cost of installing a tanka is obviously an important
drawback, the psychological dimension of using an old water supply device that may be in
contradiction with the wish to get water from modern devices should not be neglected. Using
a traditional water system may also not be cognitively accessible given the fact that
knowledge about traditional skills tends to disappear.
hals
hs-0
0138
830,
ver
sion
1 -
27 M
ar 2
007

56
5.6 Future Research Avenues
Several avenues of future research can be suggested relating to the study of the rehabilitation
of rainwater harvesting system in regions of water scarcity in Indian cities:
- The economic cost
- The psychological cost : the rehabilitation and effective use of this alternative water
source would require a precise evaluation of the effective knowledge of inhabitants
regarding the use of the system which seems to be currently low.
- The empowerment of local water supply management
hals
hs-0
0138
830,
ver
sion
1 -
27 M
ar 2
007
57
6. CONCLUSIONS
The deficiencies of the water supply is a reality in various regions of the Indian subcontinent.
Like many cities depending on ground water resources, the depletion of the water table in
Ahmedabad reaches alarming levels: since 1965, this table would have decreased by 90
metres (National Institute of Urban Affairs, 1994). The search for new sources of water
located outside the region is not a situation proper to Ahmedabad and Gujarat: the city of
Madras in Tamil Nadu (south of India) gets its water from a source far from 200 km (Zerah,
1999, p.25). The large projects for the transportation of water represent an economic, social
and environmental cost harmful to the development of entire regions in the short, mid and
long run. This kind of infrastructures don’t participate to a balanced development of the
territory. Generally meant for urban areas, they hinders the development of rural areas that are
less prosperous, but more numerous (about 70% of Indian population is rural).
Beyond the demographic pressure and the lack of resources affecting the water sector, the
insufficiency and inefficiency of the investments largely explain the unreliability of the water
offer (Zerah, op.cit., p.31). This unreliability is obvious in Ahmedabad and in particular in its
Old city. It was observed on the field, during the survey on households’ opinion on the current
and the alternative water supply systems. When we refer to the comments of the interviewees,
we find out that the consequences of this unreliability are both economical, social and
psychological. Women, most of the time, are in charge of the domestic activities and are
therefore the most affected by this situation.
An improvement of the water supply service which would decrease the time given by women
to store water is not likely to happen because of heavy investments. In that regard, the
rainwater harvesting system can constitute a potential alternative source of water which is
likely to reduce the households dependency to the existing water supply system characterised
by its unreliability. But the rehabilitation of the rainwater harvesting cisterns in the Old city of
Ahmedabad raises a major issue : the local knowledge and governance of such water
management systems in India. The rehabilitation of these alternative systems sets the question
of the revitalization of social links and the type of knowledge and governance necessary to
their effective use.
hals
hs-0
0138
830,
ver
sion
1 -
27 M
ar 2
007

58
REFERENCES Articles
Dharmadhikari, S. (1995), “Hydropower at Sardar Sarovar: Is it Necessary, Justified and Affordable? ”, in W.F.
Fisher (Ed.) Towards sustainable Development? Struggling Over Narmada River, M.F. Sharpe, Armonk, New
York, p.141.
Dupavillon, Christian (2001), “Ahmedabad, la belle endolorie”, in Revue des Deux Mondes, septembre-octobre,
p.109-115.
Najimi, Abdul Wasay (1982), “The Cistern of Char-suq : a Safavid Building in Herat”, in The Afghanistan
Journal, vol. 2, p.38-41.
Unpublished Articles
Ferrouki, Leyes (1998), Project Proposal, Ahmedabad, Indian Institute of Management.
Khadpekar, Vivek S. (2001), “Augmenting Ahmedabad’s Water Resources, A discussion note to complement
the Gupta-Nema proposal”, Ahmedabad, Centre for Environment Education, 3 p.
Shah, A. Ashvin (1998), Perspective on Water Management for the City of Ahmedabad, Ahmedabad, Indian
Institute of Management.
Unpublished studies
CEPT (2001), Rapid Environmental Impact Assessment of the Sabarmati River Front Development Project,
Ahmedabad.
Singh, Sarbjit Sahota (2000), Reviving an ancient wisdom: Tanka, a traditional roof top rain harvesting in the
walled city of Ahmedabd, A pilot project undertaken by Ahmedabad Municipal Corporation, Ahmedabad, 65p.
Books
Agarwal Anil, Narain Sunita (eds.) (1997), Dying Wisdom. Rise, Fall and Potential of India’s Traditional
Harvesting Systems, State of India’s Environment, A Citizens’ Report 4, Delhi, Centre for Science and
Environment, 404 p.
hals
hs-0
0138
830,
ver
sion
1 -
27 M
ar 2
007

59
Ballabh Vishwa, Choudhary Kameshwar (1999), Consultation Workshop on Small Water Harvesting Structures:
Technology, Institution and Management, Anand, Institute of Rural Management, 44 p.
Churchill, G.A. jr. (1991), Marketing Research: Methodological Foundations, Hindsdale, Fifth Edition, The
Drysden Press, 756 p.
Cullis Adrian, Pacey Arnold (1991), Rain Water Harvesting, London, Intermediate Technology Publisher.
Gillion, Kenneth L. (1968), Ahmedabad, A Study in Indian Urban History, Berkeley, University of California
Press, 195p.
Maksimovic, Cedo (2001), Les nouvelles frontières de la gestion urbaine de l’eau, Paris, Presses Ponts et
Chaussées, 448 p.
Mishra, Anupam (2000), Traditions de l’eau dans le désert indien, Les gouttes de lumière du Rajasthan, Paris,
L’Harmattan, 173 p.
Roy, Arundhati (1999), The Greater Common Good, Bombay, India Book Distributers, 76p.
Saglio-Yatzimirsky (dir.), Marie-Caroline (2002), Population et développement en Inde, Paris, Ellipses, 224 p.
Shankari Uma, Shah Esha (1993) , Water Management Traditions in India, Madras, PPST Foundations, 193 p.
Wittfogel, Karl (1964), Le despotisme oriental, étude comparative du pouvoir local, Paris, Editions de minuit,
1964, 672 p.
Zérah Marie-Hélène (1999), L’accès à l’eau dans les villes indiennes, Paris, Anthropos, Collection Villes, 192 p.
Governmental and Municipality sources Ahmedabad Municipal Corporation (2000), Statistical Outline of Ahmedabad City, 1998-1999, Ahmedabad,
AMC Planning and Statistics Department.
Census of India (1991), Series-7, Gujarat, Part VII, Tables on Houses and Households Amenities, Ahmedabad,
Directorate of Census Operations.
Census of India (2001), Series-25, Gujarat, Provisional Population Totals, Rural-Urban Distribution,
Ahmedabad, Directorate of Census Operations.
hals
hs-0
0138
830,
ver
sion
1 -
27 M
ar 2
007

60
Direction de l’architecture et du patrimoine, Association française d’action artistique (2001), Recommandations
pour la conservation et la revitalisation du centre historique d’ Ahmedabad, Paris, 83 p.
Gujarat Ecology Commission (2000), State Environmental Action Programme, Phase-I Summary Findings,
Baroda.
Gujarat State Drinking Water Infrastructure (2000), Gujarat Jal-Disha 2010, A Vision of Healthy and Equitable
Future with Drinking Water, Hygiene and Sanitation for all, Ahmedabad, National Institute of Design, 110 p.
National Institute of Urban Affairs (1994), Urban Environmental Maps of Delhi, Ahmedabad and Vadodara,
New-Delhi, National Institute of Urban Affairs, 186 p.
Sardar Sarovar Narmada Nigam Limited (1989), Planning for Prosperity, Government of Gujarat.
Unpublished Theses
Ladda, Brijgopal (1995), Planning and Financing Urban Water Supply : A Case Study of Ahmedabad,
Ahmedabad, CEPT, 390 p.
Pandey, Shashikant (1998), Spatial Decision Support System for Water Supply for Ahmedabad, Ahmedabad,
CEPT, 65 p.
Suhane, Rajesh (1997), Dynamics of Water Supply Management System, A case of Ahmedabad, Ahmedabad,
CEPT, 77 p.
Other sources : Interviews
Ahmedabad Municipal Corporation, Municipal Commisioner, Ahmedabad, June 2001.
Ahmedabad Municipal Corporation, Water Supply Department, Ahmedabad, June 2001.
Ahmedabad Municipal Corporation, Statistics Department, Ahmedabad, June 2001.
hals
hs-0
0138
830,
ver
sion
1 -
27 M
ar 2
007

61
Annexure A
hals
hs-0
0138
830,
ver
sion
1 -
27 M
ar 2
007

62
Annexure B
hals
hs-0
0138
830,
ver
sion
1 -
27 M
ar 2
007

63
Annexure C
Questionnaire POL Khadia :… Number
Date Time
Religion & Cast Seg,emt
……………. Non functioning RWHS Functioning RWHS Not having RWHS
Interviewee > Name > Address > Phone
A. General Information – Mahiti A.1 Neighbourhood Description – Padosh nu Varnan Number of Houses :… Number of Families :… Number of People :… A.2 Household Description – Gharana nu Varnan Number of persons living under the same Roof ≤5 6-10 >10 Number of Households under the same Roof : 1 2 3 ≥4 Number of Persons within your Household ≤5 6-10 >10 A.3 Home Description – Ghar nu Varnan Number of Rooms within the Dwelling ≤3 4-6 ≥7 Number of Rooms occupied by your Household in this dwelling ≤3 4-6 ≥7 Home is Rented > Amount of the Rent :… Owned by the household A.4 Identity of the Interviewee – Karta nu Varnan Household Head Yes No > Relationship to Household Head :… Gender M F Age <30 30-45 46-60 >60 Duration of Residence under this roof <1 year 1-5 years 6-10 years >10 years Native place A.5 Education of the household’s Head – Karta ni Bhartan Illitarate Some schooling X-XII Class College A.6 Occupation of the household’s Head – Karta nu Kam Service / Employee Professional (Doctor, Engineer, etc.) Small entrepreneur Others > Specify :… A.7 Monthly Household Income – Ghar ni Aavak ≤Rs.2000 >2000-4000 >4000 ≤6000 >6000-10000 >10000
hals
hs-0
0138
830,
ver
sion
1 -
27 M
ar 2
007

64
B. Existing water supply – Nal nu Pani B.1 Sources of water – Pani ni Vyavastha Own connection > Number of connection(s) :… Underground Tank (RWHS) Shared connection Neighbour connection Other :… B.2 Description of the Water supply system – Pani ni Vigato Do you use the Tanki ? Yes > Since how long ?…
> Storage capacity ?… > How long do you keep the Tap open daily ?…
No > Why ?… Do you keep the Tap open all through the day ? Yes No Do you use the Bucket ? Yes > How many Litres per Bucket ?…
> How many Bucket do you fill daily ?… No > Why ?… Do you use Overhead Tank ? Yes > Since how long ?… No > Why ?… Do you use the water pump ? Yes > How long daily ?… No > Why ?… B.3 Daily Requirement of Water – Pani no rojni Vaprash Daily Use : * In Summer : > In Litres :… > in Buckets :… * In Winter : > In Litres :… > in Buckets :… Do you use Different Sources of water for Different Purposes ? Yes No Source of water & use for each of these purposes :
Purpose Use Source of water Drinking / Cooling > Washing Utensils > Bathing > Washing Clothes > Cleaning the House > Other > Specify :… > Total =
B.4 User Satisfaction – Pani ni vyavastha kem lage chhe ? Daily Time access to water :… Are these hours convenient ? Yes No > Substitute hours ?… Would you like hours of supply to be Expended ? Yes > How many Hours ?…
> When ?… No
hals
hs-0
0138
830,
ver
sion
1 -
27 M
ar 2
007

65
Water Pressure : Low Normal High Water Quality : - Colour : Colourless Traces Other :… - Odour : Odourless With odour - Taste : Normal Salty Bitter Other :… - Impurities : Without Floatg.part. Sediment Have you ever experienced water born Diseases (ex.Cholera) in your household ? Yes > Opinion about the water from the Tank :… No B.5 Fetching water from outside – Pani Bahaar ti Laavvu Necessity to Fetch water from Outside home ? Yes > When ? Everyday Summer Shortage > How Often ? Occasional use Regular use Extensive use > From which Source(s) ? Neighbours Other :…
> Daily Quantity of > In Buckets :… > In Litres :… water fetched :
> Number of Trips : > Daily :… > Weekly :… > Person Fetching Water : Wife Children Housband All Others :… No B.6 Fulfilment of Water Need & User’s Wishes – Pani Jarooriyat & Vaaparnar Icchha Do you get Enough water for your need ? Yes No What are you wishes for the improvement of the water supply ?
- Quality :… - Quantity :… - Pressure :… - Other :…
B.7 Cost of Water & Willingness to Pay – Pani no Bhaav & Bharva ni Icchha Monthly Cost of water :… Are you willing to pay for water, provided a better service ? Yes > How much/Litre ?…
> For which use ?… No > Why ?… ha
lshs
-001
3883
0, v
ersi
on 1
- 27
Mar
200
7

66
C. Roof water harvesting system (RWHS) – Tanka nu Pani C.1 Existence of RWHS – Tanka ni Vyavastha Functioning RWHS Existing since when ?… Functioning since how long ?… Frequency of use : Not using Occasional use Regular use Extensive use Non-Functioning RWHS Existing since when ? Why abandoned ?… Non-Functioning Since how long ?… Not having RWHS Interest for having that system ? Yes > Why ?… No > Why ?… C.2 Description of RWHS – Tanka ni Vigato Functioning RWHS Non-Functioning RWHS Material used for : - Walls :…
- Floor :… - Ceiling :… - Sealing ot Tank :…
Mode of Fetching water :… Storage capacity (litres) :… Roof Surface (s q. metres) :… C.3 Consumption of water from RWHS Functioning RWHS Quantity of Tank water consumed & frequency of fetching water :
Purpose Quantity fetched Frequency of fetching Drinking / Cooling > Washing Utensils > Bathing > Washing Clothes > Cleaning the House > Other > Specify :… > Total =
C.4 Opinion about RWHS – Tanka ni Vyavastha kém lagé chhé ? Functioning RWHs Non-Functioning RWHS Utility :… Maintenance :… Water Quality : - Colour : Clear Traces Other :… - Odour : Odourless With odour - Taste : Normal Salty Bitter Other :… - Impurities : Without Floatg.part. Sediment. Other :…
hals
hs-0
0138
830,
ver
sion
1 -
27 M
ar 2
007
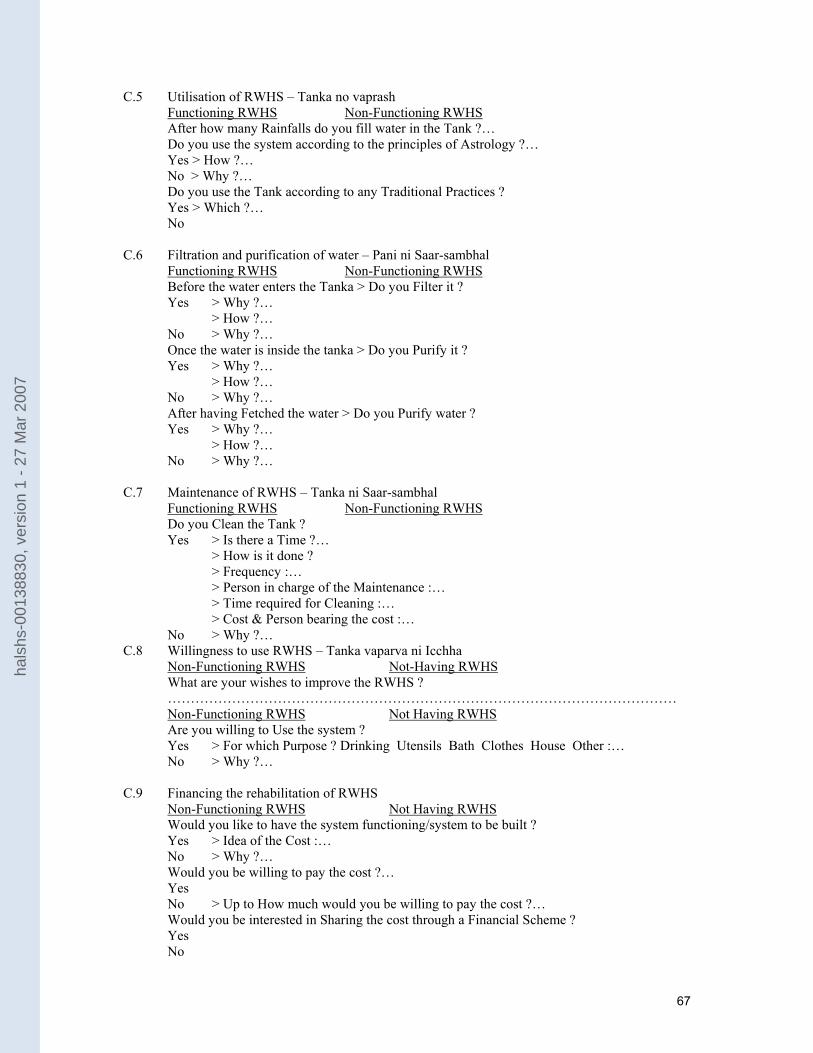
67
C.5 Utilisation of RWHS – Tanka no vaprash Functioning RWHS Non-Functioning RWHS After how many Rainfalls do you fill water in the Tank ?… Do you use the system according to the principles of Astrology ?… Yes > How ?… No > Why ?… Do you use the Tank according to any Traditional Practices ? Yes > Which ?… No C.6 Filtration and purification of water – Pani ni Saar-sambhal Functioning RWHS Non-Functioning RWHS Before the water enters the Tanka > Do you Filter it ? Yes > Why ?… > How ?… No > Why ?… Once the water is inside the tanka > Do you Purify it ? Yes > Why ?… > How ?… No > Why ?… After having Fetched the water > Do you Purify water ? Yes > Why ?… > How ?… No > Why ?… C.7 Maintenance of RWHS – Tanka ni Saar-sambhal Functioning RWHS Non-Functioning RWHS Do you Clean the Tank ? Yes > Is there a Time ?… > How is it done ? > Frequency :… > Person in charge of the Maintenance :… > Time required for Cleaning :… > Cost & Person bearing the cost :… No > Why ?… C.8 Willingness to use RWHS – Tanka vaparva ni Icchha Non-Functioning RWHS Not-Having RWHS What are your wishes to improve the RWHS ?
………………………………………………………………………………………………… Non-Functioning RWHS Not Having RWHS Are you willing to Use the system ? Yes > For which Purpose ? Drinking Utensils Bath Clothes House Other :… No > Why ?… C.9 Financing the rehabilitation of RWHS Non-Functioning RWHS Not Having RWHS Would you like to have the system functioning/system to be built ? Yes > Idea of the Cost :… No > Why ?… Would you be willing to pay the cost ?… Yes No > Up to How much would you be willing to pay the cost ?… Would you be interested in Sharing the cost through a Financial Scheme ? Yes No
hals
hs-0
0138
830,
ver
sion
1 -
27 M
ar 2
007

68
Annexure D
hals
hs-0
0138
830,
ver
sion
1 -
27 M
ar 2
007

69
Annexure E
hals
hs-0
0138
830,
ver
sion
1 -
27 M
ar 2
007