rainbow mobile home park ashford, al · 2015-07-13 · type of ownership fee simple parcel number...
TRANSCRIPT

Rainbow Mobile Home Park Ashford, AL
Exclusively Listed by Maxwell Baker Lee & Associates ǀ One Alliance Center ǀ 3500 Lenox Road, Suite 200, Atlanta, GA 30326
P. 404.442.2807 ǀ Email: [email protected]

Confidentiality and Disclaimer
The information contained in the following Marketing Brochure is proprietary and strictly confidential. It is in-tended to be review only the party receiving it from Lee & Associates and should not be made available to any other person or entity without the written consent of Lee & Associates. This Marketing Brochure has been prepared to provide summary, unverified information to prospective purchasers, and to establish only a pre-liminary level of interest in the subject property. The information contained herein is not a substitute for a thor-ough due diligence investigation. Lee & Associates has not made any investigation, and makes not warranty or representation, with respect to the income or expenses for the subject property, the future projected finan-cial performance of the property, the size and square footage of the property and improvements, the pres-ence or absence of contaminating substances, PCB’s or asbestos, the compliance with State ad Federal reg-ulations, the physical condition of the improvements thereon, or the financial condition or business prospects of any tenant, or any tenant’s plans or intentions to continue its occupancy of the subject property. The infor-mation contained in this Marketing Brochure has been obtained from sources we believe to be reliable; how-ever, Lee & Associates has not verified, and will not verify, any of the information contained herein, nor has Lee & Associates conducted any investigation regarding these matters and makes no warranty or representa-tion whatsoever regarding the accuracy or completeness of the information provided. All potential buyers must take appropriate measure to verify all of the information set forth herein.
NON-ENDORSEMENT NOTICE
Lee & Associates Commercial Real Estate Service—Atlanta, LLC is not affiliated with, sponsored by, or en-dorsed by any commercial tenant or lessee identified in this marketing package. The presence of any corpo-ration’s logo or name is not intended to indicate or imply affiliation with, or sponsorship or endorsement by, said corporation of Lee & Associates, its affiliates or subsidiaries, or any agency, product, service or commer-cial listing of Lee & Associates, and is solely included for the purpose of providing tenant/ lessee information about this listing to prospective customers.

Index
I. Pricing and Financial Analysis
II. Property Description
A. Location Maps
B. Aerial Maps
C. Traffic Counts
D. Retail Map
E. WalMart Map
F. Mobile Home Supply Map
G. School Map
H. Rent Comparables Map
III. Rent & Sales Comparables
IV. Demographics
V. Professional Profile

Price $710,000Down Payment 30% $213,000.00Number of Spaces 43Price Per Pad $16,512CAP Current 10.21%Year Built 1960'sLot Size 9.62 acresType of Ownership Fee SimpleParcel Number 1108284001006001, 1108284001003000Zoning MHP
FINANCINGLoan Type Conventional FinancingLoan Amount $497,000Interest Rate Estimate 5.50%Amortization 20 YearsPayments Per Year 12Total Number of Payments 240Monthly Payment $3,418.80Total Annual Payment $41,025.60Total Principal in Year One $14,041.04Balloon 3-5-7-10 YearsLoan to Value 70%Net Operating Income $72,524.63Cash on Cash 14.79%Cash on Cash with Principal Reduction 21.38%
INFRASTRUCTURENumber of Spaces 43Number of Park-Owned Homes 21Single-Wide Homes 20Double-Wide Homes 1Number of Lot Renters 22Vacant Lots 10Road Type GravelFlood Plane N/A Roadside drainageTopography FlatParking Spaces Individual DrivewaysMowing Responsibilities Landlord ResponsibilityStorage Shed None
UTILITIESWater City Water Sub-metered to Tenants, PVC and plastic water linesElectric Above ground and Sub-Metered Most homes are 200 AMPGas N/ASewer City SewerTrash Tenants ResponsibilityCable TV Billed Directly to Tenants
Rainbow Mobile Home Park1119 North Broadway Street
Ashford, AL 36312

6/4/2015
Income From Operations From Homes From Lots Total Income From Homes From Lots Total Income Rental Income $52,800 $84,300 $137,100 $52,800 $84,300 $137,100 Late Fees $853 $852 $1,705 $773 $772 $1,545 Other Income $194 $194 $388 $0 $0 $0 Return Check Fee $140 $140 $280 $0 $0 $0 Pet Deposit $185 $185 $370 $0 $0 $0 Edward Jones Net Investment Inc. $990 $989 $1,979 $0 $0 $0
Total Income $55,162 $86,660 $141,822 $53,573 $85,072 $138,645
Expense From Operations Bank Charges $944 $943 $1,887 $268 $268 $536 Insurance $4,874 $4,873 $9,747 $7,054 $7,054 $14,108 Legal and Accounting $2,668 $2,667 $5,335 $738 $737 $1,475 Repairs and Maintenance $45,212 $0 $45,212 $64,961 $0 $64,961 Utilities $0 $1,934 $1,934 $0 $1,767 $1,767 Taxes and License $2,167 $2,916 $5,083 $2,042 $2,916 $4,958 Misc. $50 $50 $100 $0 $0 $0
Total Expense $55,915 $13,382 $69,297 $75,063 $12,742 $87,805
Net Operating Income $72,525 $50,840
Expense Ratio 48.86% 63.33%Cap Rate 10.21% 7.16%List Price $710,000 $710,000
2014 P&L 2013 P&L
Rainbow Mobile Home ParkProfit and Loss

Lot Number
Tenant Name Lot Rent Collected
Mobile Home Rent Collected
Total Rent Collected Payment Type Size
3R Jessie Cobb 125.00 $0.00 $125.00 Monthly N/A20R Walter Pippin 125.00 $0.00 $125.00 Monthly N/A
11R Henry Railey 125.00 $0.00 $125.00 Monthly N/A
14R Shirley Beck 125.00 $0.00 $125.00 Monthly N/A
6C Saudra Munch 125.00 $0.00 $125.00 Monthly N/A
3C Khris Miller 125.00 $0.00 $125.00 Monthly N/A
4C Darzell Taylor 125.00 $0.00 $125.00 Monthly N/A
11C William Temples 125.00 $0.00 $125.00 Monthly N/A
15C Wanda Croom 125.00 $0.00 $125.00 Monthly N/A
13C Walter Pippin 125.00 $0.00 $125.00 Monthly N/A
10C Travis Dyson 125.00 $0.00 $125.00 Monthly N/A
7C Joyce Whitten 150.00 $0.00 $150.00 Monthly N/A
16C Clarence Walker 125.00 $0.00 $125.00 Monthly N/A
1C 125.00 $225.00 $350.00 Monthly 2BR/1BA
2C Crystal Jackson 125.00 $275.00 $400.00 Monthly 2BR/2BA
9C 125.00 $275.00 $400.00 Monthly 2BR/2BA
14C Timothy Wilkerson 125.00 $225.00 $350.00 Monthly 2BR/1BACrawford
House Richard Dixon125.00 $450.00 $575.00 Monthly 2000SF
5R Winefred Carroll & Charles Wilson
125.00$425.00 $550.00 Monthly
Modular Home (3BR/2BA)
6R Charles Mount 125.00 $225.00 $350.00 Monthly 3BR/2BA
7R Ann Mann 125.00 $325.00 $450.00 Monthly 3BR/2BA
8ROlna Graham
125.00$425.00 $550.00 Monthly
Modular Home (3BR/2BA)
9R Nick Rogers 125.00 $325.00 $450.00 Monthly 2BR/2BA
10R Ashley Hayes 125.00 $250.00 $375.00 Monthly 2BR/1.5BA
12RDouglas McCray &
Brandie Trivette125.00
$375.00 $500.00 MonthlyDoublewide
13R Roger Holland 125.00 $250.00 $375.00 Monthly 2BR/1.5BA
15R Teresa Brookhart 125.00 $325.00 $450.00 Monthly 3BR/2BA
16R Sequoria King 125.00 $275.00 $400.00 Monthly 2BR/2BA
17R Lee & Sheila Gerstner 125.00 $275.00 $400.00 Monthly 2BR/2BA
18R Reba Emfinger 125.00 $375.00 $500.00 Monthly 3BR/2BA
19RJanie Harper
125.00$425.00 $550.00 Monthly
Modular Home (3BR/2BA)
21R Brittany Presnell 125.00 $325.00 $450.00 Monthly 3-2 MH
25R 125.00 $250.00 $375.00 Monthly 2BR/1BA
26R Crystal Peters & Whitney Tillery
125.00$475.00 $600.00 Monthly
Modular Home (3BR/2BA)
28R Henry Williams 125.00 $250.00 $375.00 Monthly 2BR/1BA
$4,400.00 $7,025.00 $11,425.00
$52,800.00 $84,300.00 $137,100.00
$137,100.00
Rainbow Mobile Home Park
Monthly Totals
Yearly Totals
Total Revenue

Property Description
Investment Highlights
Close Proximity to Dothan, AL
Sub-metered City Water and Sewer
Mix of Park Owned Homes and Lot Rental
All Park Owned Homes Remodeled Since 2011
Below Market Lot Rents
Lee & Associates is pleased to present the sale of Rainbow Mobile Home Park. The park is lo-cated in Ashford, approximately 15 minutes east of Dothan, AL. Currently, the park contains a mix of lot and parked owned home rentals, with all of the park owned homes undergoing extensive re-modeling in the last 5 years. Each parcel is on city water and sewer, and is sub-metered by the county, so the park does not incur a utility expense other than street lights. Rainbow Mobile Home Park is a quickly improving community and a good “value-add” play for an investor, given the mod-erate vacancy and below market lots rents. Bank financing is available for this property for qualified investors.

Property Photos

Location Maps

Aerial Maps
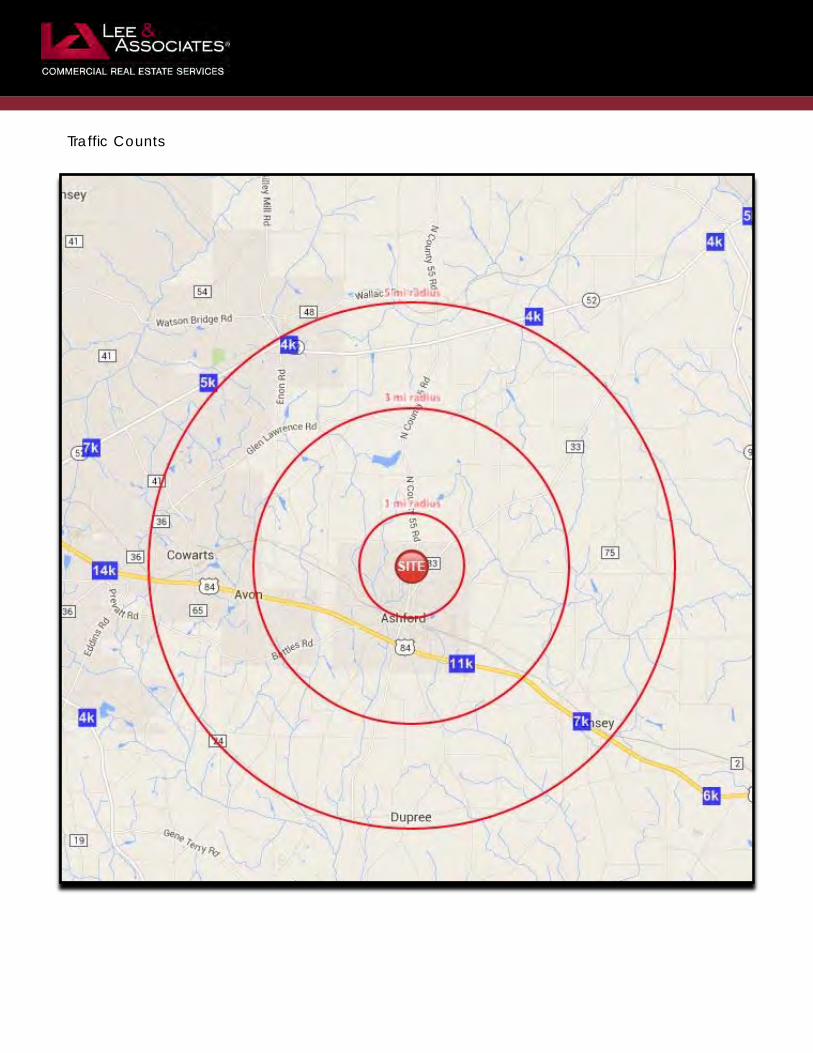
Traffic Counts

Retail Map

Walmart Map

Mobile Home Supply Map

School Map

Rent Comparables Map
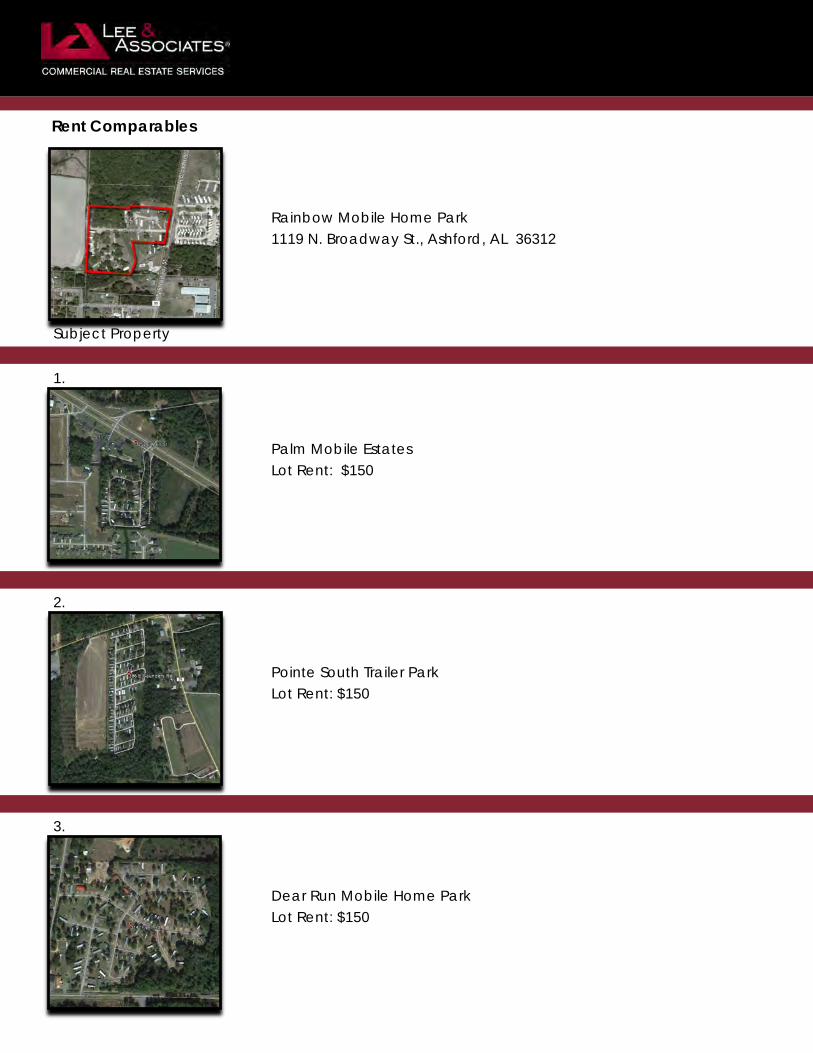
Rent Comparables
Rainbow Mobile Home Park 1119 N. Broadway St., Ashford, AL 36312
Subject Property
1.
Palm Mobile Estates Lot Rent: $150
2.
Pointe South Trailer Park Lot Rent: $150
3.
Dear Run Mobile Home Park Lot Rent: $150

Country Living Mobile Home Park Lot Rent: $150
5.
Downtown Trailer Park Lot Rent: $160
4.

Demographic Source: Applied Geographic Solutions 04/2015, TIGER Geography page 1 of 9©2015, Sites USA, Chandler, Arizona, 480-491-1112
Th
is r
ep
ort
wa
s p
rod
uce
d u
sin
g d
ata
fro
m p
riva
te a
nd
go
vern
me
nt
sou
rce
s d
ee
me
d t
o b
e r
elia
ble
. T
he
info
rma
tio
n h
ere
in is
pro
vid
ed
with
ou
t re
pre
sen
tatio
n o
r w
arr
an
ty.
COMPLETE PROFILE2000-2010 Census, 2015 Estimates with 2020 Projections
Calculated using Weighted Block Centroid from Block Groups
Lat/Lon: 31.1970/-85.2336RFULL9
1119 N Broadway St3 mi radius 5 mi radius 10 mi radius
Ashford, AL 36312
Population
Estimated Population (2015) 3,994 8,625 45,648
Projected Population (2020) 4,138 8,908 47,181
Census Population (2010) 3,831 8,273 44,162
Census Population (2000) 3,282 7,103 40,090
Projected Annual Growth (2015-2020) 143 0.7% 283 0.7% 1,533 0.7%
Historical Annual Growth (2010-2015) 163 0.9% 352 0.9% 1,486 0.7%
Historical Annual Growth (2000-2010) 549 1.7% 1,170 1.6% 4,072 1.0%
Estimated Population Density (2015) 141 psm 110 psm 145 psm
Trade Area Size 28.3 sq mi 78.5 sq mi 314.0 sq mi
Households
Estimated Households (2015) 1,651 3,557 18,869
Projected Households (2020) 1,738 3,736 19,859
Census Households (2010) 1,528 3,294 17,556
Census Households (2000) 1,331 2,825 16,098
Projected Annual Growth (2015-2020) 87 1.0% 179 1.0% 990 1.0%
Historical Annual Change (2000-2015) 321 1.6% 732 1.7% 2,771 1.1%
Average Household Income
Estimated Average Household Income (2015) $52,086 $51,167 $44,803
Projected Average Household Income (2020) $55,039 $54,080 $47,248
Census Average Household Income (2010) $48,031 $48,720 $42,304
Census Average Household Income (2000) $39,972 $40,369 $37,228
Projected Annual Change (2015-2020) $2,953 1.1% $2,913 1.1% $2,445 1.1%
Historical Annual Change (2000-2015) $12,115 2.0% $10,799 1.8% $7,575 1.4%
Median Household Income
Estimated Median Household Income (2015) $42,818 $41,288 $35,894
Projected Median Household Income (2020) $43,982 $42,727 $36,870
Census Median Household Income (2010) $36,318 $37,379 $33,185
Census Median Household Income (2000) $31,668 $32,524 $28,979
Projected Annual Change (2015-2020) $1,164 0.5% $1,438 0.7% $976 0.5%
Historical Annual Change (2000-2015) $11,150 2.3% $8,765 1.8% $6,915 1.6%
Per Capita Income
Estimated Per Capita Income (2015) $21,534 $21,110 $18,762
Projected Per Capita Income (2020) $23,117 $22,687 $20,121
Census Per Capita Income (2010) $19,153 $19,402 $16,817
Census Per Capita Income (2000) $15,984 $15,914 $14,883
Projected Annual Change (2015-2020) $1,583 1.5% $1,577 1.5% $1,359 1.4%
Historical Annual Change (2000-2015) $5,551 2.3% $5,196 2.2% $3,879 1.7%
Estimated Average Household Net Worth (2015) $338,732 $345,134 $290,568

Demographic Source: Applied Geographic Solutions 04/2015, TIGER Geography page 2 of 9©2015, Sites USA, Chandler, Arizona, 480-491-1112
Th
is r
ep
ort
wa
s p
rod
uce
d u
sin
g d
ata
fro
m p
riva
te a
nd
go
vern
me
nt
sou
rce
s d
ee
me
d t
o b
e r
elia
ble
. T
he
info
rma
tio
n h
ere
in is
pro
vid
ed
with
ou
t re
pre
sen
tatio
n o
r w
arr
an
ty.
COMPLETE PROFILE2000-2010 Census, 2015 Estimates with 2020 Projections
Calculated using Weighted Block Centroid from Block Groups
Lat/Lon: 31.1970/-85.2336RFULL9
1119 N Broadway St3 mi radius 5 mi radius 10 mi radius
Ashford, AL 36312
Race and Ethnicity
Total Population (2015) 3,994 8,625 45,648
White (2015) 3,308 82.8% 7,050 81.7% 26,557 58.2%
Black or African American (2015) 589 14.7% 1,310 15.2% 17,297 37.9%
American Indian or Alaska Native (2015) 14 0.4% 35 0.4% 172 0.4%
Asian (2015) 10 0.3% 19 0.2% 194 0.4%
Hawaiian or Pacific Islander (2015) - - 1 - 20 -
Other Race (2015) 23 0.6% 75 0.9% 608 1.3%
Two or More Races (2015) 50 1.2% 135 1.6% 801 1.8%
Population < 18 (2015) 894 22.4% 1,951 22.6% 10,875 23.8%
White Not Hispanic 716 80.1% 1,499 76.9% 5,106 47.0%
Black or African American 131 14.6% 322 16.5% 4,886 44.9%
Asian 2 0.2% 4 0.2% 43 0.4%
Other Race Not Hispanic 28 3.1% 66 3.4% 376 3.5%
Hispanic 17 1.9% 59 3.0% 464 4.3%
Not Hispanic or Latino Population (2015) 3,951 98.9% 8,478 98.3% 44,383 97.2%
Not Hispanic White 3,292 83.3% 7,002 82.6% 26,134 58.9%
Not Hispanic Black or African American 587 14.8% 1,302 15.4% 17,208 38.8%
Not Hispanic American Indian or Alaska Native 14 0.4% 30 0.4% 140 0.3%
Not Hispanic Asian 10 0.3% 19 0.2% 193 0.4%
Not Hispanic Hawaiian or Pacific Islander - - 1 - 16 -
Not Hispanic Other Race 1 - 3 - 36 0.1%
Not Hispanic Two or More Races 48 1.2% 122 1.4% 657 1.5%
Hispanic or Latino Population (2015) 43 1.1% 147 1.7% 1,264 2.8%
Hispanic White 16 38.0% 49 33.1% 423 33.4%
Hispanic Black or African American 2 5.5% 8 5.5% 88 7.0%
Hispanic American Indian or Alaska Native - - 5 3.1% 31 2.5%
Hispanic Asian - - - - 2 0.1%
Hispanic Hawaiian or Pacific Islander - - - - 4 0.3%
Hispanic Other Race 22 51.6% 73 49.6% 572 45.2%
Hispanic Two or More Races 2 5.0% 13 8.8% 144 11.4%
Not Hispanic or Latino Population (2010) 3,796 99.1% 8,147 98.5% 43,063 97.5%
Hispanic or Latino Population (2010) 35 0.9% 126 1.5% 1,099 2.5%
Not Hispanic or Latino Population (2000) 3,248 99.0% 7,040 99.1% 39,681 99.0%
Hispanic or Latino Population (2000) 33 1.0% 63 0.9% 409 1.0%
Not Hispanic or Latino Population (2020) 4,082 98.7% 8,736 98.1% 45,736 96.9%
Hispanic or Latino Population (2020) 55 1.3% 172 1.9% 1,445 3.1%
Projected Annual Growth (2015-2020) 12 5.5% 25 3.4% 180 2.9%
Historical Annual Growth (2000-2010) 2 0.7% 62 9.9% 689 16.8%

Demographic Source: Applied Geographic Solutions 04/2015, TIGER Geography page 3 of 9©2015, Sites USA, Chandler, Arizona, 480-491-1112
Th
is r
ep
ort
wa
s p
rod
uce
d u
sin
g d
ata
fro
m p
riva
te a
nd
go
vern
me
nt
sou
rce
s d
ee
me
d t
o b
e r
elia
ble
. T
he
info
rma
tio
n h
ere
in is
pro
vid
ed
with
ou
t re
pre
sen
tatio
n o
r w
arr
an
ty.
COMPLETE PROFILE2000-2010 Census, 2015 Estimates with 2020 Projections
Calculated using Weighted Block Centroid from Block Groups
Lat/Lon: 31.1970/-85.2336RFULL9
1119 N Broadway St3 mi radius 5 mi radius 10 mi radius
Ashford, AL 36312
Total Age Distribution (2015)Total Population 3,994 8,625 45,648
Age Under 5 Years 206 5.2% 452 5.2% 2,928 6.4%
Age 5 to 9 Years 255 6.4% 536 6.2% 2,970 6.5%
Age 10 to 14 Years 267 6.7% 598 6.9% 3,065 6.7%
Age 15 to 19 Years 273 6.8% 582 6.8% 3,046 6.7%
Age 20 to 24 Years 243 6.1% 480 5.6% 2,900 6.4%
Age 25 to 29 Years 187 4.7% 421 4.9% 2,848 6.2%
Age 30 to 34 Years 230 5.8% 513 5.9% 2,968 6.5%
Age 35 to 39 Years 230 5.8% 510 5.9% 2,811 6.2%
Age 40 to 44 Years 267 6.7% 581 6.7% 2,862 6.3%
Age 45 to 49 Years 308 7.7% 650 7.5% 2,961 6.5%
Age 50 to 54 Years 268 6.7% 604 7.0% 3,044 6.7%
Age 55 to 59 Years 245 6.1% 563 6.5% 3,023 6.6%
Age 60 to 64 Years 272 6.8% 587 6.8% 2,775 6.1%
Age 65 to 69 Years 256 6.4% 546 6.3% 2,455 5.4%
Age 70 to 74 Years 206 5.2% 431 5.0% 1,888 4.1%
Age 75 to 79 Years 125 3.1% 253 2.9% 1,363 3.0%
Age 80 to 84 Years 76 1.9% 158 1.8% 912 2.0%
Age 85 Years or Over 81 2.0% 160 1.9% 830 1.8%
Median Age 41.0 41.0 37.9
Age 19 Years or Less 1,000 25.0% 2,168 25.1% 12,009 26.3%
Age 20 to 64 Years 2,251 56.4% 4,909 56.9% 26,191 57.4%
Age 65 Years or Over 743 18.6% 1,548 18.0% 7,448 16.3%
Female Age Distribution (2015)Female Population 2,046 51.2% 4,395 51.0% 23,632 51.8%
Age Under 5 Years 92 4.5% 206 4.7% 1,395 5.9%
Age 5 to 9 Years 122 6.0% 260 5.9% 1,401 5.9%
Age 10 to 14 Years 128 6.3% 289 6.6% 1,477 6.2%
Age 15 to 19 Years 120 5.9% 272 6.2% 1,515 6.4%
Age 20 to 24 Years 120 5.9% 230 5.2% 1,483 6.3%
Age 25 to 29 Years 93 4.5% 215 4.9% 1,430 6.1%
Age 30 to 34 Years 122 6.0% 261 5.9% 1,574 6.7%
Age 35 to 39 Years 129 6.3% 267 6.1% 1,450 6.1%
Age 40 to 44 Years 140 6.9% 312 7.1% 1,484 6.3%
Age 45 to 49 Years 158 7.7% 326 7.4% 1,498 6.3%
Age 50 to 54 Years 132 6.5% 296 6.7% 1,525 6.5%
Age 55 to 59 Years 113 5.5% 277 6.3% 1,610 6.8%
Age 60 to 64 Years 136 6.6% 297 6.7% 1,474 6.2%
Age 65 to 69 Years 155 7.6% 309 7.0% 1,344 5.7%
Age 70 to 74 Years 104 5.1% 226 5.1% 1,044 4.4%
Age 75 to 79 Years 74 3.6% 141 3.2% 803 3.4%
Age 80 to 84 Years 55 2.7% 106 2.4% 548 2.3%
Age 85 Years or Over 52 2.6% 106 2.4% 577 2.4%
Female Median Age 42.4 42.3 39.5
Age 19 Years or Less 463 22.6% 1,026 23.3% 5,787 24.5%
Age 20 to 64 Years 1,143 55.8% 2,481 56.5% 13,529 57.2%
Age 65 Years or Over 440 21.5% 888 20.2% 4,316 18.3%
Demographic Source: Applied Geographic Solutions 04/2015, TIGER Geography page 4 of 9©2015, Sites USA, Chandler, Arizona, 480-491-1112
Th
is r
ep
ort
wa
s p
rod
uce
d u
sin
g d
ata
fro
m p
riva
te a
nd
go
vern
me
nt
sou
rce
s d
ee
me
d t
o b
e r
elia
ble
. T
he
info
rma
tio
n h
ere
in is
pro
vid
ed
with
ou
t re
pre
sen
tatio
n o
r w
arr
an
ty.
COMPLETE PROFILE2000-2010 Census, 2015 Estimates with 2020 Projections
Calculated using Weighted Block Centroid from Block Groups
Lat/Lon: 31.1970/-85.2336RFULL9
1119 N Broadway St3 mi radius 5 mi radius 10 mi radius
Ashford, AL 36312
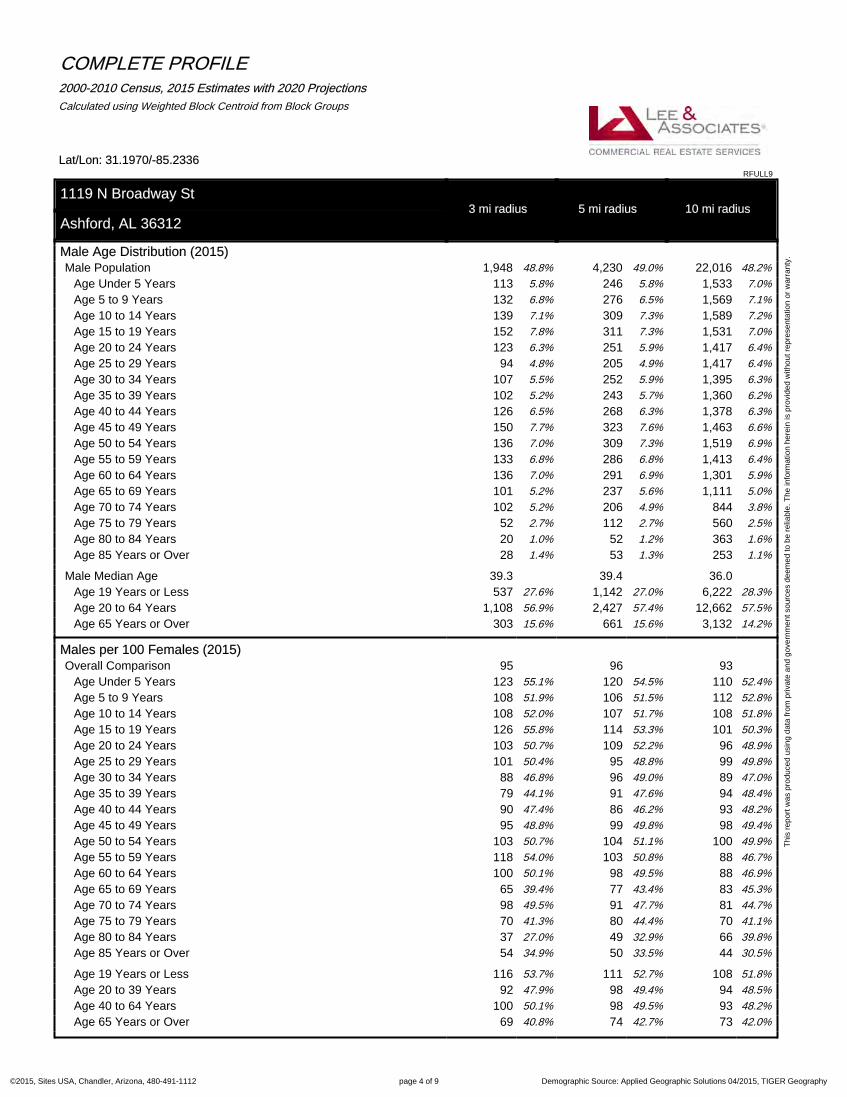
Male Age Distribution (2015)Male Population 1,948 48.8% 4,230 49.0% 22,016 48.2%
Age Under 5 Years 113 5.8% 246 5.8% 1,533 7.0%
Age 5 to 9 Years 132 6.8% 276 6.5% 1,569 7.1%
Age 10 to 14 Years 139 7.1% 309 7.3% 1,589 7.2%
Age 15 to 19 Years 152 7.8% 311 7.3% 1,531 7.0%
Age 20 to 24 Years 123 6.3% 251 5.9% 1,417 6.4%
Age 25 to 29 Years 94 4.8% 205 4.9% 1,417 6.4%
Age 30 to 34 Years 107 5.5% 252 5.9% 1,395 6.3%
Age 35 to 39 Years 102 5.2% 243 5.7% 1,360 6.2%
Age 40 to 44 Years 126 6.5% 268 6.3% 1,378 6.3%
Age 45 to 49 Years 150 7.7% 323 7.6% 1,463 6.6%
Age 50 to 54 Years 136 7.0% 309 7.3% 1,519 6.9%
Age 55 to 59 Years 133 6.8% 286 6.8% 1,413 6.4%
Age 60 to 64 Years 136 7.0% 291 6.9% 1,301 5.9%
Age 65 to 69 Years 101 5.2% 237 5.6% 1,111 5.0%
Age 70 to 74 Years 102 5.2% 206 4.9% 844 3.8%
Age 75 to 79 Years 52 2.7% 112 2.7% 560 2.5%
Age 80 to 84 Years 20 1.0% 52 1.2% 363 1.6%
Age 85 Years or Over 28 1.4% 53 1.3% 253 1.1%
Male Median Age 39.3 39.4 36.0
Age 19 Years or Less 537 27.6% 1,142 27.0% 6,222 28.3%
Age 20 to 64 Years 1,108 56.9% 2,427 57.4% 12,662 57.5%
Age 65 Years or Over 303 15.6% 661 15.6% 3,132 14.2%
Males per 100 Females (2015)Overall Comparison 95 96 93
Age Under 5 Years 123 55.1% 120 54.5% 110 52.4%
Age 5 to 9 Years 108 51.9% 106 51.5% 112 52.8%
Age 10 to 14 Years 108 52.0% 107 51.7% 108 51.8%
Age 15 to 19 Years 126 55.8% 114 53.3% 101 50.3%
Age 20 to 24 Years 103 50.7% 109 52.2% 96 48.9%
Age 25 to 29 Years 101 50.4% 95 48.8% 99 49.8%
Age 30 to 34 Years 88 46.8% 96 49.0% 89 47.0%
Age 35 to 39 Years 79 44.1% 91 47.6% 94 48.4%
Age 40 to 44 Years 90 47.4% 86 46.2% 93 48.2%
Age 45 to 49 Years 95 48.8% 99 49.8% 98 49.4%
Age 50 to 54 Years 103 50.7% 104 51.1% 100 49.9%
Age 55 to 59 Years 118 54.0% 103 50.8% 88 46.7%
Age 60 to 64 Years 100 50.1% 98 49.5% 88 46.9%
Age 65 to 69 Years 65 39.4% 77 43.4% 83 45.3%
Age 70 to 74 Years 98 49.5% 91 47.7% 81 44.7%
Age 75 to 79 Years 70 41.3% 80 44.4% 70 41.1%
Age 80 to 84 Years 37 27.0% 49 32.9% 66 39.8%
Age 85 Years or Over 54 34.9% 50 33.5% 44 30.5%
Age 19 Years or Less 116 53.7% 111 52.7% 108 51.8%
Age 20 to 39 Years 92 47.9% 98 49.4% 94 48.5%
Age 40 to 64 Years 100 50.1% 98 49.5% 93 48.2%
Age 65 Years or Over 69 40.8% 74 42.7% 73 42.0%

Demographic Source: Applied Geographic Solutions 04/2015, TIGER Geography page 5 of 9©2015, Sites USA, Chandler, Arizona, 480-491-1112
Th
is r
ep
ort
wa
s p
rod
uce
d u
sin
g d
ata
fro
m p
riva
te a
nd
go
vern
me
nt
sou
rce
s d
ee
me
d t
o b
e r
elia
ble
. T
he
info
rma
tio
n h
ere
in is
pro
vid
ed
with
ou
t re
pre
sen
tatio
n o
r w
arr
an
ty.
COMPLETE PROFILE2000-2010 Census, 2015 Estimates with 2020 Projections
Calculated using Weighted Block Centroid from Block Groups
Lat/Lon: 31.1970/-85.2336RFULL9
1119 N Broadway St3 mi radius 5 mi radius 10 mi radius
Ashford, AL 36312
Household Type (2015)
Total Households 1,651 3,557 18,869
Households with Children 530 32.1% 1,149 32.3% 6,071 32.2%
Average Household Size 2.4 2.4 2.4
Household Density per Square Mile 58 45 60
Population Family 3,261 81.6% 7,046 81.7% 34,946 76.6%
Population Non-Family 733 18.4% 1,572 18.2% 9,709 21.3%
Population Group Quarters - - 7 0.1% 993 2.2%
Family Households 1,167 70.7% 2,526 71.0% 12,391 65.7%
Married Couple Households 868 74.4% 1,886 74.7% 7,909 63.8%
Other Family Households 299 25.6% 640 25.3% 4,482 36.2%
Family Households with Children 521 44.6% 1,134 44.9% 6,017 48.6%
Married Couple with Children 349 67.0% 751 66.3% 3,107 51.6%
Other Family Households with Children 172 33.0% 382 33.7% 2,911 48.4%
Family Households No Children 647 55.4% 1,392 55.1% 6,374 51.4%
Married Couple No Children 520 80.4% 1,135 81.5% 4,802 75.3%
Other Family Households No Children 127 19.6% 258 18.5% 1,572 24.7%
Non-Family Households 484 29.3% 1,031 29.0% 6,478 34.3%
Non-Family Households with Children 9 1.9% 16 1.5% 54 0.8%
Non-Family Households No Children 475 98.1% 1,015 98.5% 6,424 99.2%
Average Family Household Size 2.8 2.8 2.8
Average Family Income $63,354 $61,209 $54,195
Median Family Income $55,860 $52,268 $46,004
Average Non-Family Household Size 1.5 1.5 1.5
Marital Status (2015)
Population Age 15 Years or Over 3,267 7,039 36,685
Never Married 719 22.0% 1,675 23.8% 10,892 29.7%
Currently Married 1,737 53.2% 3,593 51.0% 14,968 40.8%
Previously Married 811 24.8% 1,772 25.2% 10,825 29.5%
Separated 142 17.5% 304 17.2% 2,322 21.4%
Widowed 351 43.3% 635 35.9% 3,013 27.8%
Divorced 317 39.1% 832 47.0% 5,491 50.7%
Educational Attainment (2015)
Adult Population Age 25 Years or Over 3,294 7,243 37,906
Elementary (Grade Level 0 to 8) 309 9.4% 708 9.8% 4,227 11.2%
Some High School (Grade Level 9 to 11) 569 17.3% 1,318 18.2% 8,048 21.2%
High School Graduate 1,156 35.1% 2,463 34.0% 11,764 31.0%
Some College 520 15.8% 1,215 16.8% 6,506 17.2%
Associate Degree Only 243 7.4% 481 6.6% 2,498 6.6%
Bachelor Degree Only 290 8.8% 550 7.6% 2,559 6.8%
Graduate Degree 207 6.3% 509 7.0% 2,304 6.1%
Any College (Some College or Higher) 1,260 38.2% 2,755 38.0% 13,868 36.6%
College Degree + (Bachelor Degree or Higher) 498 15.1% 1,059 14.6% 4,864 12.8%

Demographic Source: Applied Geographic Solutions 04/2015, TIGER Geography page 6 of 9©2015, Sites USA, Chandler, Arizona, 480-491-1112
Th
is r
ep
ort
wa
s p
rod
uce
d u
sin
g d
ata
fro
m p
riva
te a
nd
go
vern
me
nt
sou
rce
s d
ee
me
d t
o b
e r
elia
ble
. T
he
info
rma
tio
n h
ere
in is
pro
vid
ed
with
ou
t re
pre
sen
tatio
n o
r w
arr
an
ty.
COMPLETE PROFILE2000-2010 Census, 2015 Estimates with 2020 Projections
Calculated using Weighted Block Centroid from Block Groups
Lat/Lon: 31.1970/-85.2336RFULL9
1119 N Broadway St3 mi radius 5 mi radius 10 mi radius
Ashford, AL 36312
HousingTotal Housing Units (2015) 1,779 3,816 20,164Total Housing Units (2010) 1,749 3,751 19,722Historical Annual Growth (2010-2015) 30 0.3% 65 0.3% 442 0.4%
Housing Units Occupied (2015) 1,651 92.8% 3,557 93.2% 18,869 93.6%
Housing Units Owner-Occupied 1,246 75.5% 2,727 76.7% 11,834 62.7%
Housing Units Renter-Occupied 405 24.5% 829 23.3% 7,034 37.3%
Housing Units Vacant (2015) 128 7.7% 259 7.3% 1,295 6.9%
Household Size (2015)Total Households 1,651 3,557 18,8691 Person Households 422 25.6% 896 25.2% 5,647 29.9%
2 Person Households 617 37.4% 1,345 37.8% 6,406 33.9%
3 Person Households 263 15.9% 572 16.1% 3,074 16.3%
4 Person Households 221 13.4% 479 13.5% 2,245 11.9%
5 Person Households 88 5.3% 173 4.9% 971 5.1%
6 Person Households 28 1.7% 65 1.8% 340 1.8%
7 or More Person Households 12 0.7% 28 0.8% 186 1.0%
Household Income Distribution (2015)HH Income $200,000 or More 16 0.9% 33 0.9% 132 0.7%
HH Income $150,000 to $199,999 21 1.3% 45 1.3% 232 1.2%
HH Income $125,000 to $149,999 58 3.5% 101 2.8% 368 2.0%
HH Income $100,000 to $124,999 131 8.0% 255 7.2% 956 5.1%
HH Income $75,000 to $99,999 171 10.4% 359 10.1% 1,589 8.4%
HH Income $50,000 to $74,999 310 18.8% 647 18.2% 3,038 16.1%
HH Income $35,000 to $49,999 239 14.5% 595 16.7% 3,019 16.0%
HH Income $25,000 to $34,999 182 11.0% 445 12.5% 2,441 12.9%
HH Income $15,000 to $24,999 215 13.0% 481 13.5% 2,823 15.0%
HH Income $10,000 to $14,999 130 7.9% 250 7.0% 1,757 9.3%
HH Income Under $10,000 177 10.7% 346 9.7% 2,513 13.3%
Household Vehicles (2015)Households 0 Vehicles Available 99 6.0% 174 4.9% 1,593 8.4%
Households 1 Vehicle Available 467 28.3% 1,074 30.2% 7,192 38.1%
Households 2 Vehicles Available 726 43.9% 1,522 42.8% 6,815 36.1%
Households 3 or More Vehicles Available 359 21.7% 786 22.1% 3,269 17.3%
Total Vehicles Available 3,115 6,772 31,878Average Vehicles per Household 1.9 1.9 1.7
Owner-Occupied Household Vehicles 2,585 83.0% 5,591 82.6% 23,089 72.4%
Average Vehicles per Owner-Occupied Household 2.1 2.0 2.0Renter-Occupied Household Vehicles 530 17.0% 1,181 17.4% 8,789 27.6%
Average Vehicles per Renter-Occupied Household 1.3 1.4 1.2
Travel Time (2010)Worker Base Age 16 years or Over 1,517 3,362 17,230Travel to Work in 14 Minutes or Less 349 23.0% 757 22.5% 5,451 31.6%
Travel to Work in 15 to 29 Minutes 555 36.6% 1,362 40.5% 7,261 42.1%
Travel to Work in 30 to 59 Minutes 456 30.1% 1,004 29.9% 3,663 21.3%
Travel to Work in 60 Minutes or More 69 4.6% 113 3.4% 495 2.9%
Work at Home 87 5.7% 125 3.7% 359 2.1%
Average Minutes Travel to Work 23.0 22.6 19.0

Demographic Source: Applied Geographic Solutions 04/2015, TIGER Geography page 7 of 9©2015, Sites USA, Chandler, Arizona, 480-491-1112
Th
is r
ep
ort
wa
s p
rod
uce
d u
sin
g d
ata
fro
m p
riva
te a
nd
go
vern
me
nt
sou
rce
s d
ee
me
d t
o b
e r
elia
ble
. T
he
info
rma
tio
n h
ere
in is
pro
vid
ed
with
ou
t re
pre
sen
tatio
n o
r w
arr
an
ty.
COMPLETE PROFILE2000-2010 Census, 2015 Estimates with 2020 Projections
Calculated using Weighted Block Centroid from Block Groups
Lat/Lon: 31.1970/-85.2336RFULL9
1119 N Broadway St3 mi radius 5 mi radius 10 mi radius
Ashford, AL 36312
Transportation To Work (2010)Worker Base Age 16 years or Over 1,517 3,362 17,230
Drive to Work Alone 1,311 86.5% 2,963 88.1% 14,999 87.1%
Drive to Work in Carpool 75 4.9% 198 5.9% 1,313 7.6%
Travel to Work by Public Transportation 5 0.3% 7 0.2% 72 0.4%
Drive to Work on Motorcycle 7 0.5% 12 0.3% 37 0.2%
Bicycle to Work - - - - 28 0.2%
Walk to Work 11 0.7% 19 0.6% 124 0.7%
Other Means 21 1.4% 37 1.1% 298 1.7%
Work at Home 87 5.7% 125 3.7% 359 2.1%
Daytime Demographics (2015)Total Businesses 121 237 2,911
Total Employees 1,540 3,002 37,461
Company Headquarter Businesses 2 1.4% 3 1.4% 11 0.4%
Company Headquarter Employees 333 21.7% 654 21.8% 4,381 11.7%
Employee Population per Business 12.8 to 1 12.7 to 1 12.9 to 1
Residential Population per Business 33.1 to 1 36.4 to 1 15.7 to 1
Adj. Daytime Demographics Age 16 Years or Over 3,008 6,153 54,619
Labor ForceLabor Population Age 16 Years or Over (2015) 3,217 6,932 36,090
Labor Force Total Males (2015) 1,537 47.8% 3,341 48.2% 17,004 47.1%
Male Civilian Employed 932 60.7% 2,030 60.7% 9,693 57.0%
Male Civilian Unemployed 48 3.1% 102 3.0% 644 3.8%
Males in Armed Forces 2 0.1% 7 0.2% 47 0.3%
Males Not in Labor Force 555 36.1% 1,203 36.0% 6,620 38.9%
Labor Force Total Females (2015) 1,679 52.2% 3,591 51.8% 19,086 52.9%
Female Civilian Employed 814 48.5% 1,745 48.6% 9,184 48.1%
Female Civilian Unemployed 36 2.1% 79 2.2% 575 3.0%
Females in Armed Forces - - - - 9 -
Females Not in Labor Force 830 49.4% 1,767 49.2% 9,319 48.8%
Unemployment Rate 1,537 2.6% 3,341 2.6% 17,004 3.4%
Labor Force Growth (2010-2015) 200 13.0% 329 9.6% 1,263 7.2%
Male Labor Force Growth (2010-2015) 118 14.4% 205 11.2% 699 7.8%
Female Labor Force Growth (2010-2015) 83 11.3% 124 7.7% 564 6.5%
Occupation (2010)Occupation Population Age 16 Years or Over 1,546 3,445 17,614
Occupation Total Males 815 52.7% 1,825 53.0% 8,994 51.1%
Occupation Total Females 731 47.3% 1,621 47.0% 8,620 48.9%
Management, Business, Financial Operations 125 8.1% 308 8.9% 1,558 8.8%
Professional, Related 267 17.2% 606 17.6% 2,780 15.8%
Service 231 14.9% 498 14.4% 3,414 19.4%
Sales, Office 494 32.0% 1,020 29.6% 4,635 26.3%
Farming, Fishing, Forestry 5 0.3% 19 0.5% 162 0.9%
Construction, Extraction, Maintenance 173 11.2% 413 12.0% 1,893 10.7%
Production, Transport, Material Moving 251 16.2% 582 16.9% 3,172 18.0%
White Collar Workers 886 57.3% 1,934 56.1% 8,973 50.9%
Blue Collar Workers 660 42.7% 1,511 43.9% 8,640 49.1%

Demographic Source: Applied Geographic Solutions 04/2015, TIGER Geography page 8 of 9©2015, Sites USA, Chandler, Arizona, 480-491-1112
Th
is r
ep
ort
wa
s p
rod
uce
d u
sin
g d
ata
fro
m p
riva
te a
nd
go
vern
me
nt
sou
rce
s d
ee
me
d t
o b
e r
elia
ble
. T
he
info
rma
tio
n h
ere
in is
pro
vid
ed
with
ou
t re
pre
sen
tatio
n o
r w
arr
an
ty.
COMPLETE PROFILE2000-2010 Census, 2015 Estimates with 2020 Projections
Calculated using Weighted Block Centroid from Block Groups
Lat/Lon: 31.1970/-85.2336RFULL9
1119 N Broadway St3 mi radius 5 mi radius 10 mi radius
Ashford, AL 36312
Units In Structure (2010)Total Units 1,528 3,294 17,556
1 Detached Unit 1,124 73.6% 2,321 70.4% 12,164 69.3%
1 Attached Unit 13 0.8% 23 0.7% 162 0.9%
2 Units 51 3.3% 69 2.1% 510 2.9%
3 to 4 Units 19 1.2% 33 1.0% 570 3.2%
5 to 9 Units 18 1.2% 36 1.1% 668 3.8%
10 to 19 Units 13 0.9% 27 0.8% 322 1.8%
20 to 49 Units 7 0.5% 15 0.4% 150 0.9%
50 or More Units 6 0.4% 13 0.4% 205 1.2%
Mobile Home or Trailer 277 18.1% 757 23.0% 2,799 15.9%
Other Structure - - 1 - 5 -
Homes Built By Year (2010)Homes Built 2005 or later 194 12.7% 354 10.7% 1,331 7.6%
Homes Built 2000 to 2004 123 8.0% 272 8.2% 1,190 6.8%
Homes Built 1990 to 1999 257 16.8% 616 18.7% 2,895 16.5%
Homes Built 1980 to 1989 241 15.8% 563 17.1% 2,586 14.7%
Homes Built 1970 to 1979 281 18.4% 650 19.7% 3,961 22.6%
Homes Built 1960 to 1969 180 11.8% 356 10.8% 2,204 12.6%
Homes Built 1950 to 1959 115 7.5% 218 6.6% 1,655 9.4%
Homes Built 1940 to 1949 71 4.6% 129 3.9% 923 5.3%
Homes Built Before 1939 66 4.3% 137 4.2% 811 4.6%
Median Age of Homes 34.0 yrs 33.6 yrs 37.1 yrs
Home Values (2010)Owner Specified Housing Units 1,152 2,529 11,093
Home Values $1,000,000 or More 8 0.7% 13 0.5% 32 0.3%
Home Values $750,000 to $999,999 - - - - 19 0.2%
Home Values $500,000 to $749,999 8 0.7% 19 0.8% 68 0.6%
Home Values $400,000 to $499,999 10 0.9% 21 0.8% 79 0.7%
Home Values $300,000 to $399,999 59 5.1% 104 4.1% 363 3.3%
Home Values $250,000 to $299,999 60 5.2% 131 5.2% 405 3.7%
Home Values $200,000 to $249,999 87 7.5% 175 6.9% 650 5.9%
Home Values $175,000 to $199,999 48 4.1% 92 3.6% 393 3.5%
Home Values $150,000 to $174,999 108 9.4% 199 7.9% 861 7.8%
Home Values $125,000 to $149,999 117 10.2% 223 8.8% 932 8.4%
Home Values $100,000 to $124,999 120 10.4% 238 9.4% 1,189 10.7%
Home Values $90,000 to $99,999 50 4.3% 127 5.0% 675 6.1%
Home Values $80,000 to $89,999 50 4.3% 138 5.5% 856 7.7%
Home Values $70,000 to $79,999 70 6.1% 175 6.9% 844 7.6%
Home Values $60,000 to $69,999 85 7.4% 219 8.6% 876 7.9%
Home Values $50,000 to $59,999 68 5.9% 160 6.3% 722 6.5%
Home Values $35,000 to $49,999 50 4.4% 126 5.0% 629 5.7%
Home Values $25,000 to $34,999 45 3.9% 115 4.6% 512 4.6%
Home Values $10,000 to $24,999 73 6.3% 177 7.0% 665 6.0%
Home Values Under $10,000 36 3.1% 76 3.0% 324 2.9%
Owner-Occupied Median Home Value $110,057 $98,274 $96,858
Renter-Occupied Median Rent $378 $405 $406

Demographic Source: Applied Geographic Solutions 04/2015, TIGER Geography page 9 of 9©2015, Sites USA, Chandler, Arizona, 480-491-1112
Th
is r
ep
ort
wa
s p
rod
uce
d u
sin
g d
ata
fro
m p
riva
te a
nd
go
vern
me
nt
sou
rce
s d
ee
me
d t
o b
e r
elia
ble
. T
he
info
rma
tio
n h
ere
in is
pro
vid
ed
with
ou
t re
pre
sen
tatio
n o
r w
arr
an
ty.
COMPLETE PROFILE2000-2010 Census, 2015 Estimates with 2020 Projections
Calculated using Weighted Block Centroid from Block Groups
Lat/Lon: 31.1970/-85.2336RFULL9
1119 N Broadway St3 mi radius 5 mi radius 10 mi radius
Ashford, AL 36312
Total Annual Consumer Expenditure (2015)
Total Household Expenditure $74.2 M $158 M $767 M
Total Non-Retail Expenditure $39.9 M $84.9 M $411 M
Total Retail Expenditure $34.3 M $73.1 M $356 M
Apparel $2.56 M $5.43 M $26.4 M
Contributions $2.83 M $6.01 M $28.8 M
Education $2.41 M $5.04 M $24.6 M
Entertainment $4.10 M $8.74 M $42.0 M
Food and Beverages $11.2 M $23.9 M $117 M
Furnishings and Equipment $2.44 M $5.18 M $24.7 M
Gifts $1.68 M $3.55 M $17.1 M
Health Care $6.27 M $13.4 M $65.8 M
Household Operations $1.94 M $4.12 M $19.7 M
Miscellaneous Expenses $1.12 M $2.39 M $11.7 M
Personal Care $966 K $2.05 M $10.00 M
Personal Insurance $500 K $1.06 M $5.07 M
Reading $163 K $347 K $1.68 M
Shelter $15.3 M $32.6 M $158 M
Tobacco $515 K $1.11 M $5.52 M
Transportation $14.3 M $30.6 M $147 M
Utilities $5.85 M $12.5 M $61.6 M
Monthly Household Consumer Expenditure (2015)
Total Household Expenditure $3,746 $3,702 $3,387
Total Non-Retail Expenditure $2,014 53.8% $1,989 53.7% $1,814 53.6%
Total Retail Expenditures $1,733 46.2% $1,713 46.3% $1,572 46.4%
Apparel $129 3.4% $127 3.4% $117 3.4%
Contributions $143 3.8% $141 3.8% $127 3.8%
Education $122 3.2% $118 3.2% $109 3.2%
Entertainment $207 5.5% $205 5.5% $186 5.5%
Food and Beverages $566 15.1% $559 15.1% $515 15.2%
Furnishings and Equipment $123 3.3% $121 3.3% $109 3.2%
Gifts $85 2.3% $83 2.2% $75 2.2%
Health Care $316 8.4% $314 8.5% $291 8.6%
Household Operations $98 2.6% $96 2.6% $87 2.6%
Miscellaneous Expenses $56 1.5% $56 1.5% $51 1.5%
Personal Care $49 1.3% $48 1.3% $44 1.3%
Personal Insurance $25 0.7% $25 0.7% $22 0.7%
Reading $8 0.2% $8 0.2% $7 0.2%
Shelter $774 20.7% $764 20.6% $699 20.6%
Tobacco $26 0.7% $26 0.7% $24 0.7%
Transportation $724 19.3% $717 19.4% $651 19.2%
Utilities $295 7.9% $293 7.9% $272 8.0%
3500 Lenox Road, Suite 200
Atlanta, Georgia 30326
Specializing in
Lee & Associates | Your Local Market Experts | www.leeatlanta.com
brokerage
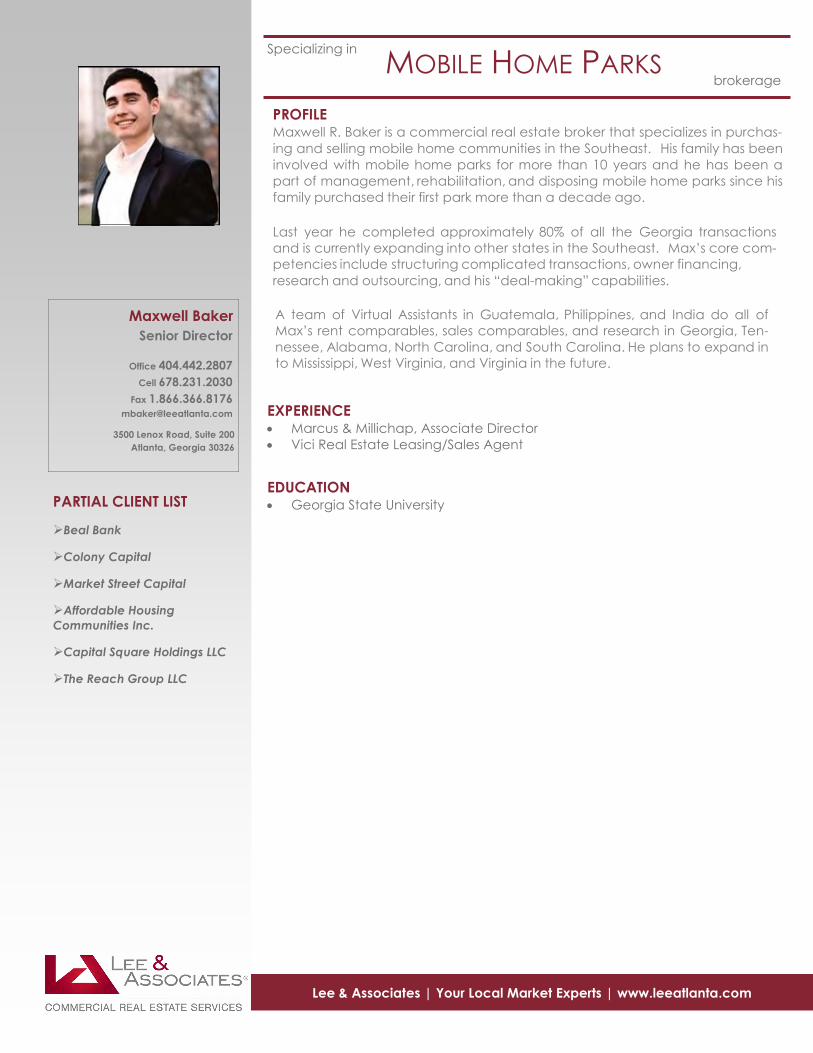
Maxwell Baker
Senior Director
Office 404.442.2807
Cell 678.231.2030
Fax 1.866.366.8176
MOBILE HOME PARKS
PROFILE Maxwell R. Baker is a commercial real estate broker that specializes in purchas-
ing and selling mobile home communities in the Southeast. His family has been
involved with mobile home parks for more than 10 years and he has been a
part of management, rehabilitation, and disposing mobile home parks since his
family purchased their first park more than a decade ago.
Last year he completed approximately 80% of all the Georgia transactions
and is currently expanding into other states in the Southeast. Max’s core com-
petencies include structuring complicated transactions, owner financing,
research and outsourcing, and his “deal-making” capabilities.
A team of Virtual Assistants in Guatemala, Philippines, and India do all of
Max’s rent comparables, sales comparables, and research in Georgia, Ten-
nessee, Alabama, North Carolina, and South Carolina. He plans to expand in
to Mississippi, West Virginia, and Virginia in the future.
EXPERIENCE
Marcus & Millichap, Associate Director
Vici Real Estate Leasing/Sales Agent
EDUCATION Georgia State UniversityPARTIAL CLIENT LIST
Beal Bank
Colony Capital
Market Street Capital
Affordable Housing
Communities Inc.
Capital Square Holdings LLC
The Reach Group LLC