railway technology avalanche no.35, june 20, 2011 205 railway … · 2013. 10. 4. · ballastless...
TRANSCRIPT

205Railway Technology Avalanche No.35, June 20, 2011
RailwayTechnologyAvalanche June 20, 2011 No.35
GENERAL INFOMATION
Newsletter on theLatest TechnologiesDeveloped by RTRI
1
“Incredible” and “Inevitable” Events
On March 11, 2011, a great earthquake and tsumani struck the Tohoku district, a north-eastern part of Japan, destroying hundreds of towns and claiming 28,000 lives.If accidents and disasters are classified into “inevitable” and “incredible” events, the earthquake that occurred in the off-shore area of the Sanriku district was an “inevitable” event, as earthquakes have frequently occurred in that area. However, its magnitude of M9 was certainly an “incredible” figure. The subsequent tsunamis represented an “inevitable” event, as some towns had constructed 10 m-high seawalls to prepare for such tsunamis. Nevertheless, the fact that the tsunamis were far higher than that was an “incredible” event. At the Fukushima Nuclear Power Plant No.1, the nuclear reactors were subject to an emergency shut down when the earthquake occurred. This was an “inevitable” event at the initial stage, which turned into an “incredible” event, however, when subsequent tsunamis completely deprived the plant of power and reactor cooling capabilities. It is anticipated that it will take a long time for normal operations to be completely restored at the power plant.Railways and other social infrastructures have to be constructed and maintained on the assumption that they are subject to earthquakes at some time in the future. This is believed to be the fate of the Japanese archipelago as it rests on earthquake nests. Although all conceivable countermeasures were taken as far as possible against earthquakes, “incredible” events have taken place every time that an earthquake has occurred, causing serious damage and loss of invaluable human lives. If people do not forget “incredible” events that have happened and utilize them as a valuable lesson, however, even an “incredible” event will turn out to be “inevitable”, and “inevitable” events will be prevented with human efforts and wisdom.For the Shinkansen railway that has been designed to withstand earthquakes since its inauguration in 1964, the railway operators are carrying out work to reinforce the structures and make the railway more earthquake-resistant based on lessons learnt from the Great Hanshin-Awaji Earthquake disaster that seriously damaged the high speed railway network in 1995. Thanks to
these precautionary measures, no pas-sengers were injured or killed when the Mid Niigata Pre-fecture Earthquake occurred in 2004, though few cars of the train was de-railed. The railway operators have been introducing a high-performance emergency stop system and other measures to prevent moving trains derailing or leaving the track. As a matter of fact, all the trains in service stopped safely when the East Japan earthquake occurred on March 11 this year. This is a case where “incredible” disasters were prevented, based on the lessons learnt from “inevitable” disasters.Along the Tohoku Shinkansen line, a number of ground facili-ties were damaged by the Earthquake. However, the total route was restored to the original state on April 29, with trains now running on this important transport artery to contribute to the restoration of the Tohoku district.
ARTICLES
Mitsutoshi INAMIVice President
On April 1, 2011, the Railway Technical Research Institute (RTRI), a juridical foundation, became a public interest corporation autho-rized by the Prime Minister. At this juncture, RTRI proclaims its intention to further enrich its research activities, thereby aiming at contributing to the de-velopment of railways, science and culture of the country. Your unchanged support and encouragement from now on will be highly appreciated.
■ Development of the Prestressed Ballast TrackKatsumi MURAMOTO......................................................................................................207
■ Evaluation of the Stability of Rocks on Slopes in Consideration of WeatheringTomokazu ISHIHARA......................................................................................................208
■ Development of a Low-Frequency Track Circuit with Improved Noise-Resistant Features
Mitsuyoshi FUKUDA........................................................................................................209■ Development of a Train Operation/Passenger Behaviour Simulation
SystemTaketoshi KUNIMATSU...................................................................................................210
■ “Incredible” and “Inevitable” EventsMitsutoshi INAMI............................................................................................................205
■ Great East Japan Earthquake DisasterKoichi GOTO...................................................................................................................206
Railway Technical Research Institute2-8-38 Hikari-cho, Kokubunji-shiTokyo 185-8540, JAPANURL: http://www.rtri.or.jp
Copyright © 2011 Railway Technical Reserch Institute.All rights reserved.Reproduction in whole or part without permission is prohibited. Printed in Japan.
Editorial Office: Ken-yusha, Inc.URL: http://www.kenf.or.jp/en/

206 Railway Technology Avalanche No.35, June 20, 2011
2
Great East Japan Earthquake Disaster
A great earthquake, magnitude 9.0, occurred around 14:46 pm on March 11, 2011, at a 24 km-deep submarine epicenter in the sea of the Sanriku District, an area in the north-eastern part of the Main Island of Japan. This was followed im-mediately afterwards by raging tsunamis that completely destroyed the earthquake-stricken towns and villages. When the Earthquake struck that area, a seismic intensity of 7 was observed at Kurihara City, Miyagi Prefecture, and a level of 6 or slightly more was recorded in wide areas in Miyagi, Fukushima, Ibaragi and Tochigi Prefectures. In view of the chaos and disaster caused by the Earthquake and tsunamis along the Pacific coast, extending from the Kanto District to the north-eastern (Tohoku) part of Japan, the Earthquake was named “the 2011 off the Pacific Coast of Tohoku Earthquake” and the ruins in its aftermath “the Great East Japan Earthquake Disaster.”The amount of energy released by the Earthquake was about 1,000 times that released by the Hyogo Prefecture Southern Part Earthquake that devastated Kobe City and its surrounding areas in 1995. Figure 1 illustrates the accelera-tion waveforms of these two earthquakes and reveals that the seismic motion of the Earthquake with large amplitudes lasted for more than 100 seconds. The source mechanism is a reverse fault having a west northwest – east southeast pressure axis at the boundary between the landside and sinking Pacific plates. Figure 2 shows an estimated breaking process of the fault (a distribution of fault slips). Large slips were observed at three points: (1) the epicenter and its vicinity, (2) an offshore area of Iwate Prefecture and (3) the offshore region of Fukushima and Ibaragi Prefectures. Three to four focal regions that had been assumed to trigger earthquakes separately were seemingly interlocked to cause the Earthquake that was unprecedented in the past 1,000 years, with the maximum slippage reaching 23 m. The fault was about 450 km x 200 km in size.
The Earthquake, which completely destroyed the railway networks in the affected area, forced the just opened Hachinohe - Shin-Aomori section of the JR-East Tohoku Shinkansen, to totally suspend train operation. A number of narrow-gauge lines were also wrecked, with many station buildings and tracks lost or washed away on the coastal lines hit by the tsunamis. On Shinkansen lines, however, the Earthquake Early Warning System developed and imple-mented with support of RTRI effectively cut the power supply immediately after detecting the minor vibration at the initial stage of the earthquake and activated emergency brakes to safely stop all the trains in passenger service (except one derailed in deadhead operation near Sendai station located in an area subjected to large-scale seismic motion). As a result, no human beings were injured either on Shinkansen or on narrow-gauge lines. After the Earthquake, RTRI immediately started the Disas-ter Recovery Support Task Force to support the recovery activities of the railway operators. At the request of JR-East, RTRI also surveyed the conditions of landslide areas, examined damaged facilities and derailed rolling stock and assessed the structural vibration experienced in the Earthquake. Then, it proposed recovery work to the railway operator. Thanks to the whole-hearted efforts of railway companies, the damaged railways, both the Shinkansen and the narrow-gauge networks, have steadily been restored to their normal condition, with the Tohoku Shinkansen resum-ing train operation along the entire route on April 29, 2011. However, it is anybody’s guess when full train operations will restart along the coastal lines in the areas which were decimated and thrown into turmoil. As ever, RTRI will sup-port the railways in their recovery work, promote analysis of the seismic incidents experienced in the Earthquake and launch activities to further improve technological measures to counter the effects of earthquakes.
Koichi GOTODirector, International Affairs Division
Fig.1. Comparison.of.seismic.acceleration.waveforms.(source:.National.Research.Institute.for.Earth.Science.and.Disaster.Prevention.(NIED))
Fig.2. Distribution.of.fault.slips.(source:.Dr..Yagi,.Associ-ate.Professor,.University.of.Tsukuba)
1000 200
1000 200
-2000
-1000
0
1000
2000
-3000-2000-1000
0100020003000
The January 1995 acceleration waveform
The March 2011 acceleration waveform
Hyogo Prefecture Southern Part Earthquake (Kobe Marine Observatory)
Tukidate NS
Acc
eler
atio
n(ga
l)A
ccel
erat
ion(
gal)
Time(sec)
Time(sec)
207Railway Technology Avalanche No.35, June 20, 2011
3
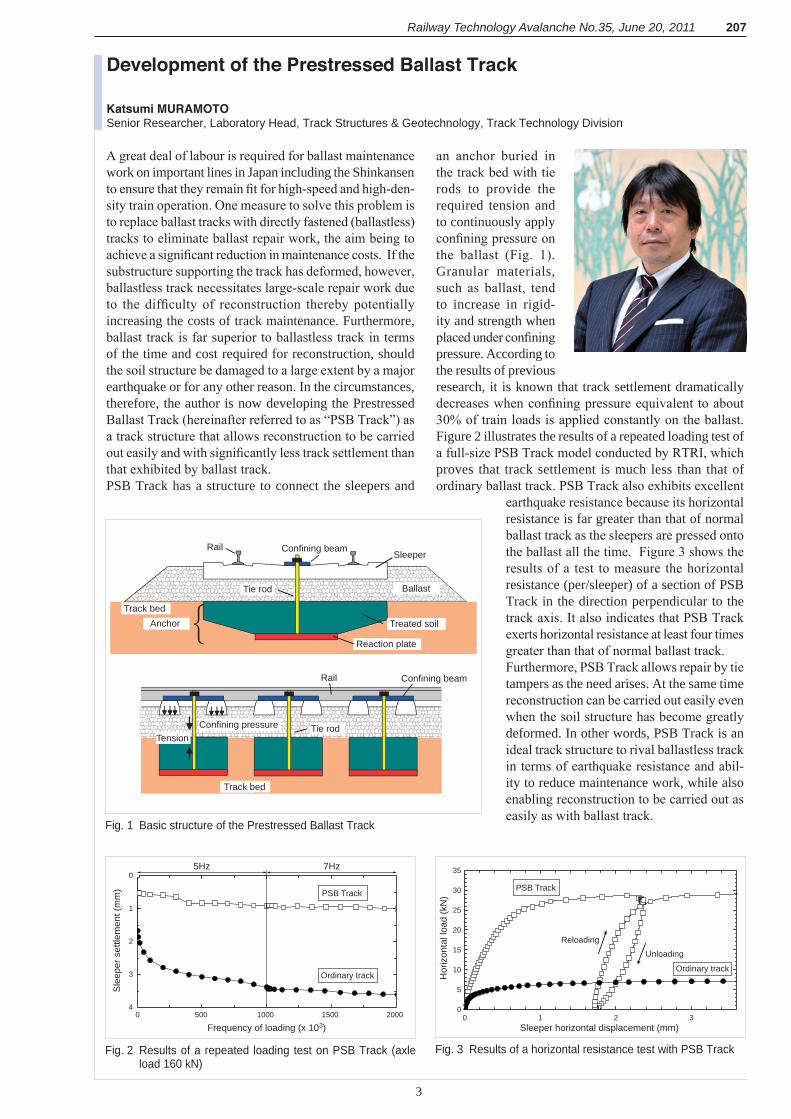
A great deal of labour is required for ballast maintenance work on important lines in Japan including the Shinkansen to ensure that they remain fit for high-speed and high-den-sity train operation. One measure to solve this problem is to replace ballast tracks with directly fastened (ballastless) tracks to eliminate ballast repair work, the aim being to achieve a significant reduction in maintenance costs. If the substructure supporting the track has deformed, however, ballastless track necessitates large-scale repair work due to the difficulty of reconstruction thereby potentially increasing the costs of track maintenance. Furthermore, ballast track is far superior to ballastless track in terms of the time and cost required for reconstruction, should the soil structure be damaged to a large extent by a major earthquake or for any other reason. In the circumstances, therefore, the author is now developing the Prestressed Ballast Track (hereinafter referred to as “PSB Track”) as a track structure that allows reconstruction to be carried out easily and with significantly less track settlement than that exhibited by ballast track.PSB Track has a structure to connect the sleepers and
an anchor buried in the track bed with tie rods to provide the required tension and to continuously apply confining pressure on the ballast (Fig. 1). Granular materials, such as ballast, tend to increase in rigid-ity and strength when placed under confining pressure. According to the results of previous research, it is known that track settlement dramatically decreases when confining pressure equivalent to about 30% of train loads is applied constantly on the ballast. Figure 2 illustrates the results of a repeated loading test of a full-size PSB Track model conducted by RTRI, which proves that track settlement is much less than that of ordinary ballast track. PSB Track also exhibits excellent
earthquake resistance because its horizontal resistance is far greater than that of normal ballast track as the sleepers are pressed onto the ballast all the time. Figure 3 shows the results of a test to measure the horizontal resistance (per/sleeper) of a section of PSB Track in the direction perpendicular to the track axis. It also indicates that PSB Track exerts horizontal resistance at least four times greater than that of normal ballast track.Furthermore, PSB Track allows repair by tie tampers as the need arises. At the same time reconstruction can be carried out easily even when the soil structure has become greatly deformed. In other words, PSB Track is an ideal track structure to rival ballastless track in terms of earthquake resistance and abil-ity to reduce maintenance work, while also enabling reconstruction to be carried out as easily as with ballast track.
Development of the Prestressed Ballast Track
Katsumi MURAMOTOSenior Researcher, Laboratory Head, Track Structures & Geotechnology, Track Technology Division
Fig..2. Results.of.a.repeated. loading.test.on.PSB.Track.(axle.load.160.kN)
Fig..1. Basic.structure.of.the.Prestressed.Ballast.Track
Fig..3. Results.of.a.horizontal.resistance.test.with.PSB.Track
0 500 1000 1500 20004
3
2
1
07Hz5Hz
Frequency of loading (x 103)
Sle
eper
set
tlem
ent (
mm
)
Ordinary track
PSB Track
TensionConfining pressure
Reaction plate
Treated soilAnchorTrack bed
Track bed
BallastTie rod
Tie rod
SleeperConfining beamRail
Confining beamRail
0 1 2 30
5
10
15
20
25
30
35
Sleeper horizontal displacement (mm)
Hor
izon
tal l
oad
(kN
)
UnloadingReloading
Ordinary track
PSB Track

208 Railway Technology Avalanche No.35, June 20, 2011
4
1. IntroductionThe rockfall is one of the slope disaster besides railway lines. In contrast to other types of slope disaster, because rockfalls are caused by various factors including earthquakes, rainfall, and the repetition of freezing and thawing, it is difficult to predict when and where the phenomenon will occur. To evaluate the stability of rock slopes where the phenomenon is anticipated to occur, railway operators conduct site surveys and, based on the results, estimate the risk of rockfalls and implement countermeasures to prevent rockfalls occuring. In most cases, however, these procedures is based on a qualitative judgment through visual observation by expert engineers. In the circumstances, therefore, it is desirable to develop a method to evaluate the stability of rock slopes quantitatively in the usual inspection process.Bearing in mind the above, in this study the author looks at the case of separation type rockfall, introduces a method to estimate the maximum length (La) of falling rocks in a simple manner from the density and tensile strength of the rocks and evaluates the stability of the rocks by comparing the estimated maximum length with the observed length (Lb) of the rocks at the site.
2. Estimation of the size of falling rocks On rock slopes where columnar joints have developed, unstable columnar rocks are frequently observed, often overhanging and suspended with only the top connected to the base rock. This state can be modelled as rocks are held with the tensile strength at the base rock (Fig.1). Figure 1 indicates that the equation (1) expresses the conditions for a rock having a tensile strength of St to hold its own weight W when it is held by the base rock with the tensile strength at the top alone. StA ≥ W = LAρg (1) St ≥ Lρg (2)The equation (2) gives the maximum length of the rock held by the base rock as: La = St/ρg (3)
This equation indicates that the maximum length of falling rocks can be estimated based on their density and tensile strength. Figure 2 shows a nomogram to determine the maximum length of a rock having an arbitrary tensile strength and dry density.
3. Estimation of the degree of the decrease in the tensile strength Weathering usually causes the strength of rocks to decrease. When an unstable rock is separated from a rock slope, it is thought that the weathering causes the strength of the separating plane to decrease.If the decrease in the tensile strength due to weathering is expressed as the ratio of the tensile strength of the weathered part to that of the non-weathered part, the more a rock has been weathered when assessed observed in macroscopy, the more the tensile strength has decreased. Based on the Fig.3, therefore, it is possible to estimate the tensile strength of the separating plane of a rock from the tensile strength of the non-weathered rock and the degree of weathering observed in macroscopy.
4. Evaluation of the stability of rocks on slopeFigure 4 illustrates a flow chart of the process needed to evaluate the stability of rocks based on the descriptions in the paragraphs 2 and 3. First, the macroscopic degree of weathering and the tensile strength of non-weathered rocks should be grasped. Next, the tensile strength of the separating plane from Fig.3 should be
estimated. Then Fig.2 can be used to determine the maximum length (La) of the falling rock based on its density and its tensile strength. Finally, the length (Lb in Fig. 5) of the rocks distributed on the rock slope and the maximum length (La) can be compared to evaluate the stability (Fig. 4).
5. ConclusionIt will be necessary to verify the procedure described above by taking measurements in the field and improving the precision of this method in the future.
Evaluation of the Stability of Rocks on Slopes in Consideration of WeatheringTomokazu ISHIHARAResearcher, Geology, Disaster Prevention Technology Division
Fig..1. Schematic. diagram. and. a. photograph. of.unstable.rock.on.slope
Fig..2. Nomogram.for. the.estimation.of.maximum.length.of.the.falling.rock
Fig..3. Degree.of.the.decrease.in.the.ten-sile.strength.due.to.weathering
Fig..4. Flow.chart.showing.the.process.needed.to.evaluate.the.stability.of.rocks
Fig..5. Length. (Lb). of. the. rocks.observed.at.the.slope
La
StA
A
La g
g
(Sectional area)
: Gravitational acceleration
: Density
(Weight of rock)
(Tensile force)
(Length of rock)
Columnar joint
Unstable overhanging rock
1.5
2.0
2.5
3.0
0.001 0.01 0.1 1
0.06
0.25
1 4 16
Tensile strength (MN/m2) of the separating plane
Dry
den
sity
of r
ocks
(g/c
m3 )
Estimated maximum length La (m) of falling rocks
WeatheredNon-weatheredDegree of weathering at separating plane observed in macroscopy
Rat
io o
f the
dec
reas
e in
the
tens
ile s
treng
th d
ue to
wea
ther
ing
0
0.5
1
La Lb StableLa Lb Unstable
Evaluate the stability of rocks
Assess the length (Lb) of the rocks on the slope (Fig. 5).
Estimate the maximum length (La) of falling rocks (Fig. 2).
Estimate the tensile strength in consideration of the degree of weathering of the part assumed to separate (Fig. 3).
Assess the density and the tensile strength of non-weathered rocks based on the results of laboratory tests and other tests.
Assess the degree of weathering of the part assumed to separate by macroscopy observation.
Lb (m)

209Railway Technology Avalanche No.35, June 20, 2011
5
1. IntroductionTo improve the efficiency of signaling systems main-tenance/construction work by integrating track circuits of different types and to enhance the efficiency of the development of rolling stock by making track circuits insusceptible to the influence of return current ‘down-stream’ of trains that are running, RTRI has developed a highly noise-resistant low-frequency track circuit. This is intended to be used for different tracks regardless of their conditions, thereby facilitating the aforementioned integration of track circuits.
2. Discussions to make the new track circuit im-mune to track conditionsTo make the new track circuit adaptable to any line condi-tions, the circuit length shall be about 2.0 km or the same as that of existing track circuits. This requires carrier waves in comparatively low frequency bands.To ensure noise-resistant performance in the environ-ments of DC and AC(50/60 Hz) electrified systems, the frequency of the track circuit shall avoid frequencies that are the same as or an integer times as high as that of the frequency of the electrification power supply (50/60 Hz) or those in frequency bands lower than 50 Hz. For these reasons, the author adopted the three carrier waves in Fig. 3.
3. Guarantee of the noise-resistant featuresTo guarantee the noise-resistant features and prevent the wrong-side failure if something unusual should occur, the author adopted an MSK modulation method to code track circuit signals and perform code tests. This makes the allowable return current 1 A or higher in each frequency band, thereby solving the problems otherwise anticipated in developing rolling stock.On the other hand, as high speed transmission is difficult in the frequency bands in Fig. 1, the author adopted a cyclic code method to enable the reception of cordword in a short period of time (Fig. 2). The cyclic code method recognizes bit strings that have rotated a codeword as
the same as the origi-nal codeword. This makes synchronizing from any position of bit strings. The author also took advantage of the special features of cyclic codes to devise a method to imple-ment codeword veri-fication by sectioning the massage frame at arbitrary bit positions irrelevant to the fixed massage frame (Fig. 3). With the help of these methods, the author achieved a sufficiently high capability for codeword verification while maintaining the time taken to operate the track circuit at the present level.
4. Verification through a field testThe author overlaid a prototype track circuit of the type described onto an existing track circuit used for a revenue service line for a one-month monitoring test. This field test verified that the prototype functioned in a stable manner while recording no disagreements in train detection with the existing track circuit. Furthermore, the bit error rate originally designed as 1.0 x 10⁻⁴ was as low as 1.0 x 10⁻⁶ or less, so verifying that the new track circuit has sufficiently high transmission quality and excellent performance for practical applications.
5. ConclusionIntroduction of signalling systems without track circuits has long been called for. Nevertheless, the needs of rail-ways still relying on track circuits remain unchanged. The author wishes to promote research on systems using new media and to apply new technologies to conventional track circuits and equipment, thereby aiming at contributing to the improvement of safety and reliability of signalling systems.
Development of a Low-Frequency Track Circuit with Improved Noise-Resistant FeaturesMitsuyoshi FUKUDASenior Researcher, Laboratory Head, Signalling System, Signalling & Telecommunications Technology Division
Fig..2. An.image.of.the.cyclic.code.method
Fig..1. Frequency.band.versus.power.source.harmonic.noise Fig..3. An.example.of.the.test.at.an.arbitrary.frame.position
50Hz,60Hz
100Hz,120Hz150Hz,180Hz
135 Hz band83 Hz band
165 Hz bandInfluence of DC current
Guarantee of clearance
: Frequency band of carrier wave
Frequency
Current1 0100
0 01101 bit rotations
Unchanged codeword after multiple rotations
1 0100 1 0100 1 0100 1 0100
Errors
Agreement of codewords Agreement of codewords

210 Railway Technology Avalanche No.35, June 20, 2011
Train timetables are core products for the railway company, and they should be evaluated from the viewpoint of passengers. For this purpose, it is necessary to estimate the conditions of train operation and passenger behaviour in detail from the origin to the destination, i.e., which trains each passenger selected: at which stations he/she changed his/her train: how long it took for him/her to arrive at their destination: and what degree of congestion he/she experienced during the trip. In urban areas with high levels of commuter traffic in particular, concentration of passengers in certain trains causes delays of the train, which leads to further passenger concentration in the trains, thereby generating a vicious circle. To evaluate timetables effectively, therefore, it is essential to estimate precisely the actual state of train operation including the aforementioned snowballing effect of passenger concentration.In the circumstances, therefore, RTRI has developed “train op-eration/passenger behaviour simulation system” to estimate the state of train operation (train arrival/departure time and degree of congestion) and the behaviour of each passenger (selection of the first train or following trains at an interchange station, if any) when a particular train timetable is implemented.This system conducts three principal estimations: (1) each passenger’s choice of trains, (2) congestion of each train and (3) train arrival/departure time (Fig. 1). The first estimation determines the trains selected by each passenger from the board-ing to the alighting station based on passenger data collected at automatic ticket gates and other sources, while reflecting each passenger’s desire, such as reaching the destination as early as possible or minimize the times of changing trains. The second estimation summarizes the information about the trains selected by each passenger, and calculates the number of passengers on board along with the number of boarding/alighting passengers at intermediate stations. The third estimation calculates the time required for boarding/alighting at each station based on the estimated number of boarding/alighting passengers, thereby calculating the delay of each train due to the boarding/alight-ing action taken by passengers. These three estimations are conducted in parallel on a time series basis starting with the first train of the day. Through this process, this system represents the aforementioned complicated phenomenon whereby the delay of
an overcrowded train at a certain station increases at the successive sta-tions, thereby making it possible to estimate the state of train operation closer to what actually happens in practice. Figure 2 shows the screen of this simulator. The display of train timetable highlights the trains estimated to be overcrowded and/or delayed, while the display showing the status of stations indicates the number of passengers waiting on the platform at each station. This allows the operator of the simulator to easily assess the results of the simulation.Figure 3 illustrates the comparison between an existing train timetable for a specific route providing commuter services and a revised one. The revised one is designed to make express trains stop additionally at Station 4 to improve the convenience of Station 4 passengers. In contrast, however, those who do not use station 4, for example those travelling from Station 1 directly to Station 6, may consider the revised one to be less convenient. Therefore, we want to analyze the result of the simulation to study how many passengers feel the revised one to be convenient or inconvenient as a whole (Fig. 4). For this purpose, we adopt the concept of “disutility” as a comprehensive index for evaluation. This is calculated from the travel time experienced by each passenger, waiting time, the number of changing trains and the degree of overcrowding. As a result, it has been proved that there are about 3.5% more passengers who feel the revised one to be convenient compared with those who feel otherwise.This article has introduced a train operation/passenger behaviour simulation system. In the future, we are planning to apply this system for the evaluation of a train rescheduling plan to be adopted under disturbed train operation.
Development of a Train Operation/Passenger Behaviour Simulation SystemTaketoshi KUNIMATSUAssistant Senior Researcher, Planning Systems, Transport Information Technology Division
Fig..1. Flow.of.simulation Fig..2. Screen.of.simulator
Fig..3. Comparison.of.train.operation.diagrams
6
LocalRapid ARapid BExpress
Express trains stop at Sta.4Express trains stop at Sta.4Sta.Sta. Sta. Sta. Sta.Sta.
Sta.Sta. Sta. Sta. Sta.Sta.
LocalRapid ARapid BExpress
Proposed diagram (B) for comparison
Existing diagram (A)Disu�lity value
Probability of obtaining a seat
Experiencedovercrowding
Frequency ofchanging trains
Waiting time
Travel time Less convenientMore convenient
Less convenientNo changeMore convenient
100%90%80%70%60%50%40%30%20%10%0%
0.34%0.32%
Fig..4. Results.of.comparison
Estimation of the boarding/alighting time
Estimation of the degree of overcrowding (number of onboard passengers)
Prediction of passenger behaviour (selected trains)
Automatic ticket gate Origin-Destination data
Estimation of the actual departure/arrival (delay) times
Display of delay
Colour display showing the amount of overcrowding
Display of the operation control board
Train delayed by 2 minutes or more (heavy green line)
Train overcrowded by 150% or more (heavy red line)
Display of the station status
Display of the train diagram
Display of the train status