railpag - railway project appraisal guidelines · 2016-05-19 · railpag railway project appraisal...
TRANSCRIPT

RAILPAG aim at providing a common framework for the appraisal of railway projects across the EU. These guidelines have been prepared following an initiative of the European Investment Bank, with the support of the European Commission (DGTREN), international fi nancial institutions and key associations of the rail industry. They will be continuously updated through the website www.railpag.com.
RAILPAG
Railway
Pro
ject
Ap
pra
isa
l G
uid
eli
ne
s
RAILPAG Ra i lway P r o j e c t A p p r a i s a l G u i d e l i n e s
European Commission
European Commission


RAILPAG Ra i lway P r o j e c t A p p r a i s a l G u i d e l i n e s
European Commission


R A I L P A G R a i l w a y P r o j e c t A p p r a i s a l G u i d e l i n e s 3
Preamble
The RAILPAG (Railway Project Appraisal Guidelines) aim at providing a common framework for the appraisal of railway projects across the EU. They are the result of a similar harmonisation exercise as that carried out under TINA (Transport Infrastructure Needs Assessment) for transport projects in general in the Accession countries in 1999. The TINA Guidelines were adopted by the UN-ECE1 in 2003.
The guidelines have been prepared following an initiative of the European Investment Bank. The EIB has received financial support from the European Commission (DGTREN) and technical support from experts representing DGTREN, other international financial institutions (IFIs) and the key associations of the rail industry, integrated in a Steering Committee. This report has mainly been carried out by the services of the EIB and has benefitted from some background work carried out by CENIT, Center for Innovation in Transport of the Universitat Politècnica de Catalunya, Barcelona, Spain, and Dr. Nils Bruzelius.
This report is intended to be the first step towards a comprehensive harmonised methodology for appraisal of rail investments in the EU and, eventually, in countries of the European Neighbourhood area. To further develop this framework, the EIB will continue to work closely with the European Commission, the other institutions that have participated in this exercise and other interested parties. EIB will maintain an internet site (www.railpag.com) where updated versions of the Guidelines and new appraisal tools as well as other relevant documents, on-going research and comments will be posted.
The objective is to achieve, in the medium term, a consensus on a harmonised detailed appraisal procedure that would be used by project promoters to present their projects to the European Commission and to the IFIs for funding and, eventually, by planning services of public administration, rail infrastructure managers, rail companies and their consultants as a continuously updated reference to guide their appraisal work.
Mateu Turró (rapporteur)
European Investment Bank
1 United Nations Economic Commission for Europe “Cost Benefit Analysis of Transport Infrastructure Projects”, U.N. New York and Geneva, 2003.

R A I L P A G R a i l w a y P r o j e c t A p p r a i s a l G u i d e l i n e s4
1 Introduction 6
2 Appraisal procedures in the decision-making process for rail investments 10
2.1 The need for a new approach 12
2.2 The place of the various stakeholders in the process 13
2.2.1 Public administrations and infrastructure owners 13
2.2.2 Infrastructure managers 14
2.2.3 Regulator 14
2.2.4 Transport service operators 14
2.2.5 Users 14
2.2.6 Non-users 15
2.2.7 Other stakeholders 15
2.3 RAILPAG: an instrument for investment decision-making 15
3 Appraising rail projects 18
3.1 General issues 20
3.1.1 The screening process 20
3.1.2 Establishing the appraisal context 20
3.1.3 Traffic forecasting 21
3.1.4 Definition of alternatives 22
3.1.5 Environmental, social and cohesion aspects 24
3.1.6 The systemic view 25
4 Financial and economic analyses 28
4.1 The financial analysis 30
4.2 Cost-benefit analysis 31
4.2.1 Investment costs 33
4.2.2 Benefits for users and operators 33
4.2.3 Calculation of safety benefits 34
4.2.4 Values for vehicle operating costs (VOCs) 34
4.2.5 Externalities 35
Table of contents

R A I L P A G R a i l w a y P r o j e c t A p p r a i s a l G u i d e l i n e s 5
4.2.6 Taxes and subsidies 35
4.3 Particular aspects relevant to rail projects 35
4.3.1 Capacity and bottlenecks 35
4.3.2 Appraisal period, project life and residual values 36
4.3.3 Discount rate 37
5 The RAILPAG approach to project appraisal 40
5.1 Ensuring the quality of cost-benefit analysis 42
5.2 Presenting re-distribution impacts 42
5.2.1 Effects and stakeholders 43
5.2.2 SE cells 43
5.2.3 Non-monetisable effects 44
5.2.4 Thresholds 44
6 Applying RAILPAG 46
6.1 General concepts 48
6.2 The appraisal framework 48
6.2.1 Distributional aspects. Filling the SE Matrix 50
6.2.2 From CBA to SE cells 52
6.3 Comparative analysis 55
Annexes 56
A. External costs 58
B. Useful life of specific railway components 60
C. SE cells 62
D. Case studies 83
E. References 130
F. Members of the Steering Committee 158

Introduction
1

Introduction

R A I L P A G R a i l w a y P r o j e c t A p p r a i s a l G u i d e l i n e s8
1The RAILPAG (Railway Project Appraisal Guidelines) respond to the need for EU-harmonised
procedures for the socio-economic and financial appraisal of rail projects following the latest developments in the sector, especially where supra-national financing is under consideration. Indeed, the methods used in the various member states are often tied to the domestic vision of rail transport characterised by integration of infrastructure and service operators, strong public intervention and lack of competition, and tend to obey to short-term political purposes rather than long-term socio-economic objectives. In some cases the evaluation manuals2 have not been updated for many years. There is a common agreement that available appraisal guidelines are not sufficiently adapted to the new context of liberalisation, separation of infrastructure and operations, increased accountability and EU-wide integration of railways.
These guidelines address the key factors that should be taken into consideration in appraising rail investments. They are based on a wide body of literature and EU-sponsored research on transport project evaluation, albeit with a practical approach. They do not pretend to establish rigid criteria, but rather to provide indications leaving the door open to future modifications and developments in the form of manuals or dedicated software. A major objective of this work is to highlight the knowledge gaps existing in the sector and the need for specific research to fill them. In this sense the RAILPAG Guidelines can be seen as a follow-up of the more general TINA Guidelines produced in the context of the Transport Infrastructure Needs Assessment (TINA) exercise, fine-tuned for railway projects. As the TINA Guidelines (simply referred to as TINA from now on), which are widely used for transport projects, notably in the new Member States, tackle the basic issues of socio-economic and financial appraisal, only complementary and/or railway specific aspects will be addressed in detail here.
Project appraisal is a crucial tool for those decision-makers, both in the public and private domains, responsible for the development of the transport system. The latest evolution of railways in Europe is giving rise to important consequences in the way decisions are made in the sector. It is thus important to show the situation of the various stakeholders and the processes leading to decisions in order to begin to establish proper guidance on how appraisal information must be presented. The second chapter deals with this complex issue.
The following chapter gives indications on how to carry out a CBA adapted to the particular conditions of rail projects. RAILPAG proposes a deepening of the typical CBA as described in TINA to provide some guidance regarding both the more general aspects, such as the preparatory work (scenario building, demand forecasts, project alternatives definition, etc.), and the economic analysis. It focuses on those elements that are most relevant for rail projects and on the criteria and parameters to be used in the economic analysis, which should be correctly specified and harmonised at the European level.
For complex or/and larger projects, the distributional effects of an investment are an important component for decision makers. The re-distributional matters are becoming even more important for rail project in the new regulatory setting. Chapter 6 illustrates how the results of the CBA can be presented in a way that facilitates the understanding of the consequences of the project, based on a stakeholders/effects (or SE) matrix. The SE matrix provides an indication of the economic and financial implications for the various stakeholders and of the weight taken by the different costs and benefits.
Introduction
2 Evaluation is used as synonymous to appraisal. When carried out after project execution will be referred to as ex-post evaluation.

R A I L P A G R a i l w a y P r o j e c t A p p r a i s a l G u i d e l i n e s 9
The document includes two annexes (A and B) with tables providing indicators and values that are considered particularly relevant. Annex C consists of general comments followed by a set of fiches on key matrix cells. Annex D shows 10 case studies, reflecting a whole range of rail investments, which can be used to illustrate their practicality. Finally, Annex E provides some references, mostly referring to specific EU documents or research pro jects and Annex F includes the composition of the Steering Committee members. All these annexes should be completed and improved in the following phases of development of the Guidelines, notably with the contribution of sector professionals.
RAILPAG have been developed under a rapidly changing legal set-up for railways in Europe. It is possible that some of the comments made or examples used become obsolete in the next few years. The guidelines have been designed, however, to accommodate the expected evolution of the sector. On the other hand, as will be clearly shown throughout this publication, it should only be considered as a first step towards more detailed methodological documents and towards the development of improved appraisal tools, including specific guidance for the incorporation of the private sector in the financing of rail projects. It will also highlight the importance of better information on the sector and help to orient and prioritise research projects in the field of transport investment appraisal.

R A I L P A G R a i l w a y P r o j e c t A p p r a i s a l G u i d e l i n e s10
Ten Case StudiesC 7
Appraisal procedures in the decision-making process for rail investments
2
R A I L P A G R a i l w a y P r o j e c t A p p r a i s a l G u i d e l i n e s 11
C 11Ten Case Studies
Appraisal procedures

R A I L P A G R a i l w a y P r o j e c t A p p r a i s a l G u i d e l i n e s12
3 From infrastructure to operations, between different parts of the network, from investment to maintenance, etc.4 Most typical were the use of specifications favouring local manufacturers of rolling stock or other dedicated material
or protecting employment in the rail companies.5 Eurotunnel, among those privately financed, and many public sector projects have suffered impressive cost overruns.
Appraisal procedures in the decision-making process for rail investments
This chapter discusses those aspects that distinguish the decision-making process in railways from those of the transport sector in general and explains the need for specific guidelines complementing those prepared under TINA. Several key issues of particular relevance for the appraisal of rail projects are also discussed.
2.1 The need for a new approachTraditionally – at least for the last half of the XX century, investment decisions in the rail sector
have generally been taken by the Ministry in charge of railways – in particular when projects were of some importance, or by the national rail company holding a monopolistic position in the provision of rail services. Quite often the responsible Ministry dealt only with rail or with other public transport modes, leaving roads and, in many cases, ports and airports, in the hands of other ministries. Even where transport infrastructure investment responsibilities were centralised, specific directorates for rail limited a proper multimodal vision and a harmonisation of appraisal procedures in the allocation of financial resources to the transport sector. Intimate relations between the public company and the supervisory authority have prevented proper scrutiny of investment proposals and led too often to misallocation of resources. This is certainly one of the explanations for the poor performance of the sector and decreasing market share in spite of investment levels well beyond its relative traffic volumes.
Project appraisal, in this context, has often been carried out exclusively from a rail perspective, without taking into account proper scenarios – meaning that the evolution of competing modes has been disregarded and forecasts have frequently been too optimistic, with an “integrated” view that facilitated the transfer of the project benefits between different components of the system3 and including constraints that were not always economically justified4. In some countries, appraisal procedures and practice have evolved rapidly. But all too often “old” biases remain due to a lack of control of the administration over rail companies, from which many investment proposals originate. This could lead to cost estimates well below real figures and to an inflation of benefits to justify them. It could also move in the opposite direction, and there is a tendency for rail companies to be technologically driven and “over-design” projects or to add components that are not really needed. These distortions have prevailed in a context of increasingly complex financing mechanisms where, for example, national companies have at times been asked to invest directly in infrastructure in order to disguise public debt, thus reducing the potential for rational decision-making in the sector.
The consequences in terms of inefficiency due to poor appraisal and decision-making have not been established, although some major rail projects have been the focus of much attention5. In spite of the recognition of the problems, very little has been done to improve old appraisal practices. The need to update them also comes from the changing structure of the sector, pushed by the reform “packages” endorsed at Community level in an attempt to stabilise the market share of the rail mode that has been declining for decades. Balancing the weight of the different transport modes and, in particular, favouring the development of sustainable modes of transport such as rail transport, is one of the key priorities of the European Commission. Thus this political preference should be supported by appropriate evaluation tools able to justify the selection of projects and the use of public funds in rail projects.
2

R A I L P A G R a i l w a y P r o j e c t A p p r a i s a l G u i d e l i n e s 13
2.2 The place of the various stakeholders in the processAn investment in the rail sector represents costs and benefits for a wide range of institutions,
companies and individuals. Actual flows of cash constitute the basis for the financial assessment of the project. Most stakeholders (infrastructure managers, service operators, users, etc.) could claim a net financial profit or loss and it is also possible to formulate a “global” financial profitability for the project based on the addition of all the cash-flows. The financial analysis will look not only at this global profitability, which should give a good indication of the sustainability of the project6, but also, in some cases, at its split among the various stakeholders, which will allow the analyst to better understand the redistribution of the financial impacts from the project.
However, some costs and benefits, while relevant for one or the other stakeholder are not marketable and/or are externalities that do not affect the financial flows of the project. These are essential in the socio-economic evaluation, which includes both a CBA, for those aspects that can be somehow monetised, and an analysis of impacts, not included in the CBA, that may be quantified or not, but which affect some stakeholders and should also be considered in the appraisal.
It is thus very important to identify the various stakeholders, in particular in view of the organ isational changes taking place in the European Union:
2.2.1 Public administrations and infrastructure ownersIn the early days of railways, the infrastructure was often owned by private ventures. In the USA
many are still in private hands, but in Europe railway infrastructures providing public services are mostly owned directly by the State or by public administrations or companies. There is, however, a certain trend towards privatisation of infrastructure assets and public-private partnerships (PPPs), which often take the form of concessions for specific sections of the network (e.g. Eurotunnel, Figueres-Perpignan), in some cases including a parallel road link (e.g. Great Belt and Oresund links, although through publicly owned “private” companies). The assets may also be divided on the same infrastructure, as is often the case with separate ownership of the right-of-way itself, or more complex divisions as set up for the Dutch high speed line concession. It is obvious that the possible private “owner” is a main stakeholder, but in most cases property will finally fall under public administration. In any case the public sector will practically always participate in the financing of rail projects, even if it is only in terms of preparatory work or ancillary investments. The various levels of Government (EU, national, regional or local), financing the pro ject and directly or indirectly affected by financial flows originating from the project: complementary investments, payments for public service obligations, tax income, etc. must be identified with precision.
The identification of the increasing number of public and private partners involved in rail investments and the distribution of costs and income among them is politically sensitive and an essential component of the decision-making process. It is thus crucial that all relevant stakeholders be detected at an early stage of project appraisal.
The tendency of governments to look at their own financial interests should not detract from their ultimate goal, which is to promote the interests of society at large. The administration responsible for the final decision on a project will have to take all aspects into consideration and, of course, not only the financial cash-flows affecting its treasury. Actually the appraisal procedures proposed by RAILPAG aim at improving the decision process based on the socio-economic impact for the whole of society, but using a proper knowledge of the implications for the various stakeholders. The costs and benefits for different social groups could be politically important, as it could justify the participation of specific governments in the financing, but the analysis of the merits of the project should be based on non-discriminatory principles.
6 This is why it is often used by Banks and other financing institutions.

R A I L P A G R a i l w a y P r o j e c t A p p r a i s a l G u i d e l i n e s14
2.2.2 Infrastructure managersCommunity regulations foresee the separation of infrastructure managers and service
oper ators, at least from the point of view of their accounts. Infrastructure managers could be the owners of the infrastructure or not. When they are different, they must be included in the appraisal under a separate heading, as they will have their own sources of income (i.e. from track charges, tolls) and their costs, which might include investment costs or not.
A single rail project will usually affect only one infrastructure manager. However, there is a possibility of dividing the national network among several managers. Works on international sections are likely to affect at least two managers. The possibility of various owners and managers being involved in the appraisal has to be taken into account.
2.2.3 RegulatorBetween owners and managers (and, logically service operators) there is a need for a regulator.
This is a most important player in the system, and will certainly influence decision-making. However, the financial impacts of an investment on the regulator are usually negligible and it will thus not be considered as a stakeholder in the appraisal. If necessary, it could be included in the cash-flows of the corresponding government.
2.2.4 Transport service operatorsThe introduction of competition endorsed by the European Commission should erode the
trad itional monopolistic position of the national (or regional) companies on their networks. This means that it is no longer adequate to look at the rail system as a global system. Not only have infrastructure and operations become, in practice, counterparts; competing operators will try to obtain the best deal from any new investment. It is thus necessary to take into account this competition both in the market scenarios (with implications for tariffs, traffic forecasts, etc.) and in the expected distribution of costs and revenues. This should allow for more transparency regarding the position of incumbents and the potential impact of the project on the desired opening of the market.
Any major rail investment should have an impact on the distribution of traffic flows and therefore on the performance of other transport modes. Road hauliers, bus operators and airlines could be affected. In some cases, if severely threatened, they might try to influence the decision-making. Their reaction within the market will have to be included in the forecasts, and the concomitant consequences on their cash-flows in the financial appraisal.
2.2.5 UsersUsers of both rail and alternative modes are the critical components in the financial (as end-
use payers) and socio-economic analysis (as they will obtain most of the benefits not included in the cash flows: travel time savings, safety and comfort improvements, etc.). Curiously enough, being poorly organised, rail users usually have a very modest influence in decision-making, their interests being mostly defended by the public administrations, local governments, trade unions, neighbourhood associations, etc. On the other hand, traditional CBA deals adequately with user costs and benefits, although, as will be seen later, some specific factors of particular relevance to railways (i.e. reliability or comfort) require further refinement.
2 Appraisal procedures in the decision-making process for rail investments

R A I L P A G R a i l w a y P r o j e c t A p p r a i s a l G u i d e l i n e s 15
2.2.6 Non-usersNon-users are essentially affected by externalities, notably environmental and social. They are
not easy to quantify but can have an important weight in decision-making. Concerns about the external impacts of projects should be expressed through the public enquiries foreseen in the Environmental Impact Assessment (EIA) procedures. Although this mechanism should provide enough headway for finding adequate solutions for these impacts in the definition of the project, quite often there are interest groups (in favour or against the project) that will place their position regarding the project firmly in the political arena. Both for decision-making and to provide an adequate response to potential political conflict, it is thus important to signal in the appraisal the impacts on non-users, trying to quantify and monetise them as much as possible.
2.2.7 Other stakeholdersThe investment is spent through construction companies, suppliers of equipment and
services, etc. Maintenance and operations also involve companies outside the realm of infrastructure managers or transport service operators. Landowners could also be affected through expropriation and an increase or reduction in the value of their properties. Although most of these stakeholders will probably have little say on the decision to implement the project, they must be taken into account in the appraisal as some of them may absorb an important part of the cash-flows. Some of these flows (for instance through taxes on profits) might actually come back to the other stakeholders. In specific cases it might be relevant to identify a different set of contractors and suppliers in the first phase of the appraisal7.
2.3. RAILPAG: an instrument for investment decision-makingA large variety of stakeholders is already a good indication that the decision to invest in a rail
project will follow a complex path. Minor projects are often decided at the level of the infrastructure owner or the operator. For major projects, the rational approach should foresee, upfront, a multimodal transport planning exercise and, ideally, a more comprehensive spatial plan in which the rail network will be developed according to some agreed political objectives. This planning exercise should incorp orate a strategic environmental assessment (SEA) and some financial perspectives, often based on public budget constraints, which will frame an investment programme. This programme includes the list of rail projects that appear to make sense within the global multimodal plan. They must, however, be individually analysed to determine their feasibility and to optimise their development timing.
RAILPAG are focused on this part of the process, particularly once a rail solution has already been considered a solid option to solve the transport problem to be dealt with. It is in this phase, closer to the final decision, that specific guidance becomes more relevant. Most indications are obviously also valid for other parts of the decision-making process, notably in project screening and in pre-feasibility studies performed in investment programming.
There are a number of guidelines and manuals that provide good indications on how to carry out CBA’s for rail projects. However, they are not always consistent, nor do they take the approach that is required by the EU or by international financial institutions (IFIs). Community subsidies and loans from IFIs are bound to support only projects of good quality (technical, economic, environmental), showing sustainable financial structures and expected to be properly managed.
7 In particular when there is inadequate competition in the contractor and suppliers market.

R A I L P A G R a i l w a y P r o j e c t A p p r a i s a l G u i d e l i n e s16
The aim of RAILPAG is to respond to these requests whilst keeping the necessary flexibility for a sector that is quickly changing. Regarding technical matters, contrary to most rail project appraisal manuals, which only consider purely rail alternatives to solve a problem, RAILPAG adopt a multimodal approach, meaning that solutions to achieve the project’s objective based on other modes or on inter-modal transport (combination of modes) will be considered. The socio-economic analysis is made from the point of view of society as a whole, meaning that no distinction of citizenship or similar is made. Environmental aspects are also included in a way that make them better understandable and allow a comparison with economic impacts. Finally, the financial quality of the project is also presented from an overall perspective, so that it is possible to ensure that there is a fair distribution of financial burdens and profits among the stakeholders and that competition at EU level is preserved. RAILPAG, proposed as a first step towards a harmonised appraisal procedure, would be particularly useful in the allocation of Community funds.
2 Appraisal procedures in the decision-making process for rail investments

R A I L P A G R a i l w a y P r o j e c t A p p r a i s a l G u i d e l i n e s 17
3Appraising rail projects

Appraising

R A I L P A G R a i l w a y P r o j e c t A p p r a i s a l G u i d e l i n e s20
3 Appraising rail projects
RAILPAG considerations could be used for multimodal planning and particularly for programming, but their main objective is to improve the feasibility studies of well-identified rail pro jects for which there are several alternatives. RAILPAG build on the TINA Guidelines, which provide the basic elements that must be taken into account in the appraisal process of transport infrastructure. TINA can also be applied to the selection of equipment. However, TINA provides a rather general guidance that may be insufficient to address certain aspects particular to railways. This chapter will focus on general appraisal issues that are developed in TINA but which should be clarified for railway investments.
3.1 General issuesThe initial necessary condition for a good appraisal is to correctly establish the scale and scope
of the project and, therefore, the amount of effort reguired for its assessment, and the framework in which it will be carried out. If the appraisal framework is not adapted to the objectives of the exercise or has theoretical flaws, the results can never be correct and could lead to the wrong decisions. Most of these framework conditions are addressed in TINA. Here the discussion will concentrate on those conditions more directly linked to the rail system.
3.1.1 The screening process As indicated in TINA, it is convenient, notably in the investment programming context, to carry
out a screening process prior to the pre-feasibility and feasibility analysis of specific projects. The following is an adaptation of the TINA checklist of the screening process although for railway projects:
- Check that all individual projects are adequately defined in terms of objectives, alternatives (including reference baseline), interoperability conditions, etc.
- Identify the broad performance of the projects and make a preliminary ranking relative to a small number of key indicators. In many instances, the rail sector uses key minimum/max imum ratios such as “investment/minute saved”, etc. that can be a quick means for rejecting projects that are not feasible.
- Ensure that, for demand-driven projects, the effects on the users, such as increased comfort, reduced time, etc. go beyond perception thresholds. If users can not properly perceive the effects of the project, it will not affect their behaviour and its economic benefits are likely to be very low. Projects that cannot produce improvements beyond these threshold values should be systematically questioned.
- Ensure that benefits are not dependent on complementary projects (in the same corridor, or elsewhere on the network) also being implemented. If there is dependency, it should be clear whether the linked projects are part of the investment under consideration or whether they can be assumed to be carried out both in the do-minimum and project scen arios.
- Assess whether there are particular barriers to implementation (physical, ecological, political, etc.).
A simple global assessment based on how the proposal responds to these issues should be able to reduce the number of candidate projects for consideration in the investment programme.
3.1.2 Establishing the appraisal contextThe project will be implemented in a “state of the world” that can only be conjecture at appraisal
stage. It is, however, essential to define the main characteristics of this “context” in order to establish

R A I L P A G R a i l w a y P r o j e c t A p p r a i s a l G u i d e l i n e s 21
the viability of the investment. In general, the scenario building exercise is based on macroeconomic forecasts supported by specialised national and international organisations. They will signal the global trends in which the transport project is expected to thrive and are critical for demand forecasts. For large projects, however, there are also transport specific aspects that could affect the project performance. Some are technological; others are linked to behavioural and market aspects; and some others will depend on regulatory and political features.
TINA doesn’t pay much attention to the appraisal context but, since rail has a modest market share and is undergoing extraordinary changes, the scenarios being considered in the appraisal process are of particular relevance to projects in the sector. So, it is recommended to make a summary description of the context in which the project will develop. The complexity of this scenario-building will depend on the cost and timing of the project and may include:
· Economic, political and social aspects: Macroeconomic forecasts must be aligned with political developments (e.g. the integration of new member countries or the impact of the European Neighbourhood policy) and social trends (including demographics, a change in attitude towards railways, the spatial distribution of activities, tourism, logistics, etc.).
· Technological aspects: To be able to compete, rail has to take advantage of new technologies that are quickly being absorbed by competing modes. Advances in construction (e.g. in tunnelling techniques), energy and environment (e.g. fuel cell technologies) and in traffic control (e.g. using telematics and the location possibilities of GPS/Galileo systems) will certainly affect all transport modes during the life of any major rail project. So, new technological developments should be considered in the scenarios. In certain cases, the possibility of the implementation of new concepts (e.g. maglevs) should also be taken into account.
· Regulatory aspects: The EU political agenda includes important changes in the present structure of railways. The impacts of the first two “packages” are starting to be felt. The eva lua tor must analyse the possible implications of liberalisation and other imposed changes.
· Predictable developments in the transport sector that would significantly influence the railway sector such as charging principles in other modes of transport, major infrastructure development plans in competing modes, etc.
All these aspects should be reflected in appropriate forecasts.
3.1.3 Traffic forecastingAny railway project feasibility study should contain a detailed chapter on demand analysis
and forecasting. The demand analysis should provide forecasts adapted to the characteristics of the project. In general, an investment project will have an influence on modal choice, so it will not be sufficient to simply indicate the rail traffic flows with and without the project; the impact on the existing rail traffic, on the competing modes (diverted traffic) and the amount of traffic generated or induced by the project must be clearly identified. It will be necessary to distinguish between traffic categories that need to be treated differently. This could be done in the CBA calculations (for instance, because their value of time is different) or in the SE Matrix, which shows the effects for the different stakeholders.
The appraisal team should use demand models adapted to the specific type of project. In some cases, regional or national traffic forecasts are available. It is obvious that, in most project appraisals, specific demand analysis will be required. However, when the new forecasts are significantly different from the global ones, a justification of the difference may prove necessary.
Demand models are based on some estimates of fares, travel times, etc. for the various modes. Consistency between the values used in traffic forecasting and in the socio-economic appraisal is essential. Quite often rail tariffs are changed during the project appraisal process without taking

R A I L P A G R a i l w a y P r o j e c t A p p r a i s a l G u i d e l i n e s22
into account the implications on traffic flows and, therefore, its mixed impact on revenues. This is unacceptable. If relevant models cannot be run again8 with the new tariffs, at least an elasticity-based revision will be required.
3.1.4 Definition of alternativesA transport investment project is normally proposed, following a planning exercise, to solve
specific problems (i.e. bottlenecks, latent demand, etc.), to contribute to the improvement of the conditions of the system, or responding to social or political requests (e.g. reduction of environmental nuisances). For smaller projects, or in poorly developed decision-making settings, projects may not be proposed in the context of a plan. In this case, the options may only differ on minor technical details. In any event, though, there is always a range of solutions to attain the objective. The “alternatives” for major projects can be extremely varied and contemplate actions in different transport modes (or even non-transport solutions). They should respond, however, to a similar multimodal transport demand and show reasonably comparable levels of service (speed, comfort, reliability) to allow a valid relative assessment. This multimodal approach9 should also be systematically adopted in the cases where a Strategic Environmental Assessment (SEA) is required by a EU Directive10. RAILPAG focuses on projects where a rail solution appears, in principle, adequate.
Depending on the size of the project and its vocation, the appraisal team is expected to define a set of alternatives covering a range where the optimal solution can be found. This range will depend on the phase of the process. In the pre-feasibility phase, the options are obviously much wider than in the feasibility analysis phase for which a preferred basic technical option should already have been selected.
In any case, one of the options to consider must be the do-minimum alternative, which should be used, in principle, as the reference case for the appraisal of the other options. “Do-minimum” means carrying out as little investment and maintenance as possible to keep the system working without excessive deterioration of the service provided. This definition, in the case of railways, could be interpreted as following the standard pattern of renewal and maintenance of the existing infrastructure and equipment11. This must apply to both the rail system and its modal competitors. Of course, the do-minimum alternative would result in significantly different traffic levels than those foreseen under the project. The do-minimum alternative is very different from the “do-nothing” one, which does not even include any maintenance action and is incompatible with the normal operation in the existing network and thus not a valid reference alternative since it would ultimately not meet the present demand for transport. Therefore the method used by some evaluators, notably in the case of high-speed lines, of taking as do-minimum alternative the investment needed to provide the capacity required by expected normal traffic growth (referred to as “avoided investment”) should not be used. Instead, the comparison with the “do-minimum” of both this “avoided” project, which often consists of a major investment such as track doubling, and the bigger project (i.e. the high-speed line), will clearly reflect the relative value of each one.
The do-something alternatives can be defined in a variety of ways. The range covered and the quality of the proposals will depend on the quality of both the design team and the appraisal team, which should work in close cooperation. Each alternative should be given the precision required
3
8 To avoid this, either proprietary or commercial software for demand analysis is recommended. But ultimately the issue is who does the modelling and controls the assumptions. 9 The best mode or combination of modes to achieve the objectives, so any rail solution should stand up against other modal options.10 SEA Directive No. 2001/42/EC. 11 In most rail companies, maintenance and renewal operations usually follow pre-established patterns for the track, the electrification and signalling components and the rolling stock.
Appraising rail projects

R A I L P A G R a i l w a y P r o j e c t A p p r a i s a l G u i d e l i n e s 23
by the comparison exercise, which will depend on the phase within the process and the size of the project. When the appraisal exercise indicates that some options are quite similar, additional precision may be necessary to discriminate between them. Sometimes an alternative is simply an extension or improvement of another. In this case, if the basic alternative is acceptable, it is the additional investment that must be appraised to see if it is justified: The reference case will exceptionally be this basic alternative instead of the do-minimum12.
Comparison may become more complex when several interlinked projects are proposed. As network effects (see point 3.1.6) are particularly important in railways, the implementation of related projects and their timing can have important effects on the profitability of the whole investment programme. One way to handle such cases is to carry out appraisals of the bunched investment and of each of its individual components, to reach an optimal project selection and their implementation period. In practice this is quite difficult and an individual appraisal of each project, taking into account the proposed timetable, is recommended. It is, however, extremely important to avoid double counting through the inclusion of the same network benefits in all separate schemes. This can only be achieved if the technical and traffic studies are detailed enough to account for the effects of the implementation of the different projects in terms of capacity, level of service and user response.
In the design of rail projects the traditional view has often been to consider investments leading to a continuous piece-meal improvement process rather than options representing a major change in a part of the network. This is due to the integrated character of the rail system that often prevents the spreading of advantages (notably those derived from innovation) to the whole network. Speed restrictions or old electrification and signalling systems on a section can, for instance, make inefficient the deployment of modern rolling stock on an upgraded connected section. Typically, for instance, investments to increase the maximum speeds (e.g. from 140 km/h to 160 km/h) have been distributed over the whole network.
The development of high-speed services and a more aggressive view of the role of railways (for instance, in developing rail-air transport intermodality) are changing this approach and some experts argue that, for specific cases including some urban projects, only high-cost/high-performance alternatives are able to make railways competitive and represent adequate value for money.
The definition of alternatives must, in any case, take into account the implications for the whole transport system and, for large projects, even the wider effects on the territory. The general equilibrium of the economy will not be addressed here. However, this could be relevant for transport plans or for some major investments, but then specific analytical tools may have to be developed. The “partial equilibrium” context adopted means that the comparison of alternatives must be based on the principle that resources not used for the project would be used elsewhere in the economy and produce similar impacts on financial or economic transfers (for instance on generic taxation such as VAT or profit taxes or on employment generation).
In some cases the comparison of technical options should be complemented with an appraisal of different operational setups. In particular, the private participation in the financing of infrastructure (in EU railways it would always be through a public-private partnership) would certainly be reflected not only in important differences in the financial flows, but possibly in the technical definition, the investment and maintenance costs, fares and demand for services and, as a consequence, in the economic profitability of the project.
12 In some exceptional cases the additional investment might make a project feasible for which the basic alternative is poor. If so, the full investment is the real alternative to be analysed.

R A I L P A G R a i l w a y P r o j e c t A p p r a i s a l G u i d e l i n e s24
3.1.5 Environmental, social and cohesion aspectsThe EU transport policy13 supports the development of railways for a more balanced modal split
within a European transport system increasingly dominated by road and air transport. A main argument for this support is that rail transport has environmental advantages with respect to these modes, due to reduced energy consumption, lower emissions of pollutant gases and CO
2 and less occupation of
land. Environmental impacts, both during construction and during the whole operation period must be properly included in the appraisal. There are already a substantial amount of recommendations on how to quantify and monetise environmental impacts. It is always difficult to adapt them to specific projects, but the Environmental Impact Assessment (EIA), which is compulsory for the majority of new rail investments, should provide the required data.
The EIA is actually part of the project definition and appraisal process. This might introduce a timing problem, as ideally the EIA and the feasibility study should be carried out in parallel and feed from each other. The EIA should analyse the different alternatives from the environmental perspective and ideally produce cost estimates of the corresponding impacts. It should also include an estimate of the cost of the proposed mitigating measures to relieve the impacts, which should logically be much lower than the envisaged damage avoided. The adequacy and efficiency of the environmental mitigation measures proposed for the different alternatives corresponds to the EIA.
The cost of these mitigation measures will be included as an integral part of the project cost. The appraisal will thus only consider the impacts remaining after execution of the mitigation measures.
Social externalities are even more difficult to measure than those related to the environment. Only two points should be made here: avoid double counting and observe possible redistribution effects. Indeed, most external social benefits such as higher economic growth for the region or job creation, generated by major projects, can only be estimated through general equilibrium models, which should indicate that some of these impacts are already being incorporated in the appraisal through generated traffic or other elements in the demand model. In some countries, the railway system has low productivity14 and part of the employment generation could simply be redeployment. Also regional impacts due to the investment usually mean that they will not be produced elsewhere. If this social or regional redistribution impact is desired, it can be incorporated into the appraisal. Nevertheless, the most critical redistribution element of rail projects is probably their spatial impact. Railways induce a concentration of activity around stations and produce differential impacts on the territory that are primarily manifested through changes in land values. This point is discussed later.
Rail projects may also be the focal point of wider investment strategies. For instance, the renovation of a station could be essential to the urban renewal of a decaying central area. In such cases, rail investments are only a part of the investment necessary to produce the wanted social impacts, which are the critical part of the project benefits, and RAILPAG might not provide sufficient guidance. In general, the possibility of relevant social externalities must be systematically contemplated. If they could constitute a substantial element in the decision, they should be included in the appraisal, although accompanied by a detailed justification. In any case, the social and territorial impacts of rail investments are still poorly known and research is needed to be able to foresee and quantify these impacts in order to properly introduce them into the appraisal.
Some rail projects may also have strategic value. Trans-border projects and those promoting interoperability have, in particular, a clear interest for the integration of Europe. This aspect has to be pointed out, especially for investments that may require EU support. Similar strategic objectives
3
13 See, in particular, European Commission, White Paper: “European transport policy for 2010: time to decide”, September 2001. 14 The use of railways as an employment management tool by some governments is well known and its effects are still a heavy burden for the sector in most new member countries and even in some of the EU-15.
Appraising rail projects

R A I L P A G R a i l w a y P r o j e c t A p p r a i s a l G u i d e l i n e s 25
at the national or regional levels could also be included in the appraisal. There is no clear procedure for including these political components in the appraisal, but the SE Matrix, with their distinction of stakeholders, provides a means to identify them.
3.1.6 The systemic viewThe transport system must be seen as an integrated system requiring a multimodal approach
to optimise its performance. Each mode constitutes, though, a sub-system that needs specific treatment to improve its contribution to overall efficiency. Indeed, this modal treatment has traditionally been so pervasive that the global multimodal approach is relatively unusual in national and regional planning. In any case, rail is clearly a “sub-system” that, due to its technology – and also to its historical development – must be approached in a particular way. The following three comments, obviously interrelated, refer to the implication in project appraisal of rail particularities.
Integrated system
The production of rail transport services requires a balanced provision of facilities and equipment to be supplied by rail companies usually involved in the operation of a large network with specific technical constraints. This means that the technical definition of the project depends on elements of the system outside the project itself (e.g. if the connecting parts are electrified or not) and that its implementation could require actions apparently outside the scope of the project. It is thus necessary to incorporate in the appraisal all the investments required for successful project implementation: infrastructure, superstructure, rolling stock, stations, etc. It is essential, on the other hand, to be aware of the benefits that the investment can produce for other parts of the network (e.g. additional traffic at marginal cost), to other sectors (e.g. impacts of certain electrification components that can be used outside the rail system), or to produce other services (typically stations are now designed as multi-use facilities).
Interoperability
This refers to regulations being introduced by the EU as a means to eliminate technical discontinuities in the European rail system (mainly characterised by differences in gauges, electrification and signalling technologies, length of trains and rolling stock), which have prevented efficient operation and proper competition within the system. Although there is an overall justification for the interoperability policy, it is not obvious that specific measures required by the regulations are economically justified just from the point of view of the project. It is thus important (even in terms of obtaining potential subsidies from the EU) to identify, whenever possible, additional costs and benefits arising from the compulsory application of interoperability norms. As some of these benefits could arise for users and operators not included in the necessarily restricted project definition, they must be signalled in the appraisal as otherwise the project would be burdened only with the interoperability costs.
Network effects
The impact of an action on part of an integrated transport system could be substantial on other parts. The rail network, due to its relatively reduced extension (at least compared to the road network) and its physical constraints (which, for instance, are much less important in sea navigation or air transport), is particularly sensitive to these network effects. The establishment of a “missing link” between two sub-networks, for instance, will certainly produce additional traffic on the newly connected sub-networks, even in parts that are quite far from the link. When, as in the case of many rail services, marginal production costs are very low, this could have substantial financial and economic implications15. In the context of the EU integration policy these network effects are particularly important. Network effects can, in practice, only be estimated through rather sophisticated planning
15 Of course, they could be negative if some affected sections were becoming congested and additional traffic could contribute to increasing average costs.

R A I L P A G R a i l w a y P r o j e c t A p p r a i s a l G u i d e l i n e s26
models that are not always available to project evaluators. Although there is still a need for both theoretical and practical research on the network effects of rail projects, it is important to introduce the concept in their appraisal. Their identification and estimation should be clearly presented and based on good judgement whenever the required modelling tools are unavailable.
Justifiable network effects should be taken into account in several parts of the appraisal. In the definition of the project and in its demand analysis, as well as in the appraisal itself, it is necessary to include those elements that could be substantially affected by the project. There are, however, wider effects on the network that cannot be properly dealt with simply by looking at the immediate impacts of the investment. They should be included, on the one hand, as part of the scenario building (i.e. future interoperability conditions) and, on the other hand, as an “external” effect of the project on the system, if it has a contribution to network integration that is not properly accounted for through the effects on users and operators.
3 Appraising rail projects

R A I L P A G R a i l w a y P r o j e c t A p p r a i s a l G u i d e l i n e s 27

4Financial
and economic analyses

Financial

R A I L P A G R a i l w a y P r o j e c t A p p r a i s a l G u i d e l i n e s30
4 Financial and economic analyses
The fundamentals of both the financial and socio-economic analyses are described at length in the literature. This chapter reproduces some of the main points set out in the TINA guidelines and in the Guide to Cost-benefit Analysis of Investment Projects16 and highlights some of the particular aspects relevant for railway projects.
4.1 The financial analysisThe financial analysis in TINA is simply presented as the cash-flow impacts of the project on
specific organisations affected by the project including:
· Financial investment costs, including renewals during the appraisal period;
· Financial infrastructure maintenance and operating costs;
· Vehicle operating costs met by operators;
· Revenues for infrastructure and service operators.
Without going into all the specific elements, that must be included in the financial ana lysis, some key issues should be recalled here:
Taxes: Ideally all cash flows, including project-specific taxes such as VAT, should be included in the financial appraisal. However, the net impact of indirect taxes will often be minor and difficult to calculate. It is therefore recommended to exclude VAT from the appraisal except for large infrastructures or for projects generating a substantial amount of new traffic paying VAT17. In such cases the tax flows between administrators may be relevant in the financial structuring of the project.
Operating costs: In calculating operating costs all items that do not give rise to an effective monetary expenditure must be excluded, even if they are items normally included in company accoun ting. In particular the following items must be excluded:
· Depreciation and amortisation;
· Any reserves for future replacement costs;
· Any contingency reserves, because uncertainty of future flows is taken into consideration in the risk analysis.
Revenues: As regards the revenue side, railway projects normally generate their own revenue. Expected revenue will be determined by traffic forecasts and fares. As mentioned above, revenues as well as operating expenditure should be net of VAT. It is worthwhile signalling here that pricing in railways is sometimes politically established, with little relation to actual costs (marginal or average) for the specific service. It is not easy to foresee the evolution of rail pricing policy, but it is important to study its potential impacts on the project’s revenues.
Subsidies (transfers from other authorities, etc.) should be considered separately from oper ation revenues and properly accounted for as pure financial transfers.
In the railway sector a thorough study of the financial implications of the project, based on the observation of the financial transfers between the various stakeholders is becoming important, as the investor may be different from the body that will own and/or operate the infrastructure. As different stakeholders may have contradictory interests, it is necessary to grasp the expected implications of
16 Prepared for the European Commission, DGREGIO.17 When there is little new traffic, VAT related to operation (which includes the impacts on competitive modes) is usually marginal compared to other cash flows in the appraisal. So, in general, only VAT on new investments and maintenance and new revenues would be included.

R A I L P A G R a i l w a y P r o j e c t A p p r a i s a l G u i d e l i n e s 31
the investment on their financial performance or, essentially, what are the redistribution effects on the finances of the various players. So, investment grants (even if they are in the form of subsidised loans), operating subsidies for public service obligations, etc. must be included in the financial analysis. They should be adequately allocated between stakeholders if redistribution effects are to be analysed.
4.2 Cost-benefit analysisThe economic analysis appraises the project contribution to the economic welfare of the whole
society of the “region”, which is the political target of the project promoter. It does not contemplate the specific financial interests of the various stakeholders as is the case in the financial analysis. The concept of target population linked to a specific administrative area (urban area, region or country) is subject to discussion. It is clear that the distinction among users according to nationality or similar could be interesting for the decision-makers. However, discrimination among EU nationals is, in principle, against Community law and unacceptable for EU sponsored projects. So, the overall socio-economic benefits of the project should not make distinctions among users based on their particular nationality18.
The socio-economic analysis is based on resource costs. For many items the market will provide good indications of these costs. However, some others, such as travel time, are not directly tradable. Non-marketable impacts for rail projects usually affect transport users and also non-users through externalities. For existing transport users, the benefit for society is estimated as the reduction of resource costs that the project will bring (some of them, being non-marketable, are estimated using a value based on willingness to pay19). For generated traffic, as there is no prior reference to the willingness to pay of the new users, an estimation of the demand curve is necessary. This explains the need to apply the rule of the half when their benefits are compared with those of existing users.
The final objective of CBA is to see the impact of the investment on society as a whole, calculated simply by summing up its impact on individuals. Usually a single value (IRR, NPV, CBR) provides the main indication of the project’s quality. The distributional analysis will complement this indicator with quantitative and qualitative markers, associated to specific stakeholders, allowing for a more refined global assessment of the project than the traditional CBA.
The CBA process can be illustrated as in Figure 1.
The following items should be included in the economic analysis:
· Investment costs;
· Changes in:
· Maintenance and operating costs of the infrastructure; · Vehicle Operating Costs; · Journey times; · Safety;
· Externalities, such as environmental impacts.
18 It is possible, however, to use this factor positively. For instance the European interest of a project could be related to its integration features and adopt the % of non-national users as a policy indicator. In some cases, a realistic assessment of user’s value of time may need to consider disaggregation in categories, which could include nationality.19 The willingness to pay values might be adapted through “social” values (or shadow values) to take into account global social and economic aspects that are not reflected in user’s behaviour.

R A I L P A G R a i l w a y P r o j e c t A p p r a i s a l G u i d e l i n e s32
4
Inputs from Transport Forecasting and Modelling(multimodel passenger and freight fl ows, journey times, costs)
CBA Scope CBA Value Sets
User Benefit estimationOperating cost and revenue
estimationInvestment costs
Interpolation and extrapolation
Discounting
Aggregation
Presentation of the results
Outputs to the Appraisal Framework: Summary Measures NPV, BCR, IRR
Costs and benefits for the investment period and selected forecast years
Cost and benefits streams
Discounting cost and benefits streams
Present values
Figure 1. The CBA process (for each alternative)
Financial and economic analyses

R A I L P A G R a i l w a y P r o j e c t A p p r a i s a l G u i d e l i n e s 33
Following TINA, it seems useful to make some general recommendations on selected items that are particularly relevant for rail projects:
4.2.1 Investment costsInvestment costs should include the following components:
• planning costs – including the design costs, planning authority resources and other costs directly linked to the project incurred after the initial decision to go ahead;
• land and property costs – including the cost of acquiring land needed for the scheme (and any associated properties), compensation payments necessary under national laws and the related transactions and legal costs; and
• construction costs – including site preparation, infrastructure, superstructure, supervision of works and contingencies;
• rolling stock.
4.2.2 Benefits to users and operatorsA core element of the cost-benefit analysis is the estimation of user benefits. For many projects
the benefits to travellers in terms of time and money savings will be central to the economic case for the project. Three fundamental concepts underlying the definition of user benefits in transport CBA are generalised cost, willingness to pay, and consumer surplus:
• Generalised cost is an amount of money representing the overall disutility (or inconvenience) of travelling between a particular origin and destination. There is thus a different generalised cost for each model option for the trip. In principle this incorporates all aspects of disutility including the time given up, money expenditure and other aspects such as inconvenience/discomfort.
• Willingness-to-pay is the maximum amount of generalised cost that a consumer would be willing to undergo to make a particular trip.
• The consumer surplus is a concept that brings the former two together, since it is defined as the excess of the consumer’s willingness to-pay over the actual generalised cost of his trip.
The basic measure of user benefit is the change in consumer surplus resulting from a change in the transport system. This requires to:
• Estimate the volume of travel by mode and trip category for each origin/destination pair. If the volume of travel is expected to respond to the change in network quality, both the volume “with” the change in place and the volume “without” the change need to be modelled or estimated for the base year and forecast for future years.
• Estimate the change in generalised costs of travel by mode and trip category for each origin/destination pair. This will include travel time savings, changes in money expenditure and improvements in convenience/comfort.
• Combine together the trip volume and cost change information so as to calculate the total user benefits over all origins and destinations.
The gains to the transport service providers or “producer surplus” due to a change in the supply curve produced by the project are taken into account through the variations in investment and operating and maintenance costs.

R A I L P A G R a i l w a y P r o j e c t A p p r a i s a l G u i d e l i n e s34
4
Benefits for various types of traffic:
For railway projects it is normally useful to consider the impact on three different categories of traffic:
· Existing traffic: The CBA includes the effects on users of the existing transport services. The project will probably improve the quality of service (travel time, reliability, comfort, etc.) of rail users and might affect the fares they have to pay (this is a purely financial element). Besides investment costs, this service improvement will generate costs (or, in certain cases, benefits) for the rail service operators that will be included in the operating costs. Non-diverted users of other modes might also perceive some effects (e.g. improvement of congestion on roads) that must be included in the CBA;
· Diverted traffic: The effects on new rail users diverted from other modes (automobile, bus, air transport) to rail as a consequence of the investment are valued comparing their resource costs before and after the project. These usually include user benefits (changes in travel time, safety, reliability, comfort, etc.), changes in operating costs for service providers and even delayed investment costs in the other modes. There could also be some rail traffic diverted to road as a consequence of the project;
· Generated traffic: The impacts on new users, who were not travelling before but which will now be using the railway due to the investment, are usually estimated as being half of those affecting the existing train users.
4.2.3 Calculation of safety benefitsBy convention, safety is treated separately from the other components of user benefits.
Expected changes in accident rates for the different modes and alternatives are used to estimate economic benefits, multiplying them by the relevant unit values per accident and per casualty. These values consist of a part usually paid by users through insurance20, which is thus internal to the transport system, and general expenditure from the public sector and suffering, which are externalities.
4.2.4 Values for vehicle operating costs (VOCs)This component of user benefits relates to car VOCs and own-account freight VOCs only, since
all other VOCs are met by transport operators, not by users. The World Bank’s HDM model, for example, could be used to estimate vehicle operating costs for the road mode21. These data should be entered into the calculation of generalised cost in the do-minimum and the do-something scenarios, in order to calculate the corresponding user benefits.
20 Insurance should, in theory, cover all material damages and medical expenditure linked to accidents.21 But the value of time savings must be excluded to avoid double counting! Attention must be paid, in particular, to lorry drivers’ time.
Financial and economic analyses

R A I L P A G R a i l w a y P r o j e c t A p p r a i s a l G u i d e l i n e s 35
4.2.5 ExternalitiesRailway projects may have a considerable impact on the environment. In the case of the
construction of a new line, environmental impact mitigation measures should be included in the project design and be part of the investment costs. In other cases, traffic may be transferred from more polluting modes of transport (road and air transport) to rail with positive impacts on the environment that should be included in the analysis (see, for illustration, Annex A for values proposed by INFRAS/IWW).
4.2.6 Taxes and subsidiesFinally, it should be recalled that taxes and subsidies are financial transfers, which have no
relevant impact in the economic evaluation. Their redistribution effects could be analysed through the SE matrix.
4.3 Particular aspects relevant to rail projectsSome of the parameters to be considered in the financial and economic analyses are project
related and particular reflections are needed for railway projects.
4.3.1 Capacity and bottlenecksThe definition of capacity of a railway line is a difficult and debated issue. The capacity of
a rail infrastructure has traditionally been measured in trains per day through theoretical “standard” capacities based on its characteristics. The comparison of existing traffic with this theoretical capacity provided an indicative value of its usage and, eventually, of the need to invest to avoid congestion. This methodology is simplistic, as there are other parameters that affect the number of trains able to pass a given section in one day, such as the types of traffic, their heterogeneity, usage over the day and maintenance needs and timing. Although the following values are simplistic, they give an indication of “standard” capacities.
Nº trains/day
Single track (highly dependent on length of blocks)
Phone block 25-60
Electric block 30-70
CTC 60-80
Nº trains/day
Block between stations 100-150
Double track Colour light block 220-270
Bi-directional signalling 300-350
Table 1. Direct measurement of capacity with experimental data.

R A I L P A G R a i l w a y P r o j e c t A p p r a i s a l G u i d e l i n e s36
Other approaches consider the indirect measurement of congestion by means of delays on the line: by plotting the percentage of trains more than 5 minutes late (30 minutes for freight trains) versus the number of trains per day, a practical threshold of 10% of delayed trains may give a value of the practical capacity of the line in trains per day.
The definition of “rail bottlenecks” is equally difficult22. It could be argued that a bottleneck appears when those characteristics of the service relating to time (essentially operating speed, delays) are well below those that can be considered as standard for the track layout and signalling system (control) with low traffic.
Bottlenecks may be due to several reasons23 and there is no agreement on the standards or thresholds to be applied so, for the time being, they essentially respond to qualitative assessment of physically located and identified problems in the network. They are typically observed using space-time diagrams.
Under these circumstances, the measurement of benefits from bottleneck removal is obviously very difficult. In particular because, under congestion conditions, there are always substantial trade-offs (for instance between additional traffic and safety conditions) that are difficult to estimate. This is, in any case, a technical question that requires substantial research and should be dealt with in specific manuals.
4.3.2 Appraisal period, project life and residual valuesThe appraisal period of a project runs from the Project Start Year to the last year of the Operating
Period24, consequently including both Investment Period and Operating Period. The Investment Period is specific for each project and depends not only on construction-related constraints, but also on the availability of financial resources and on administrative and political circumstances. In contrast, the Operating Period is an abstract notion used only for appraisal. It is generally convenient to relate it to the technical characteristics of the elements conforming the investment project and to base it on their useful life.
In rail projects, the main elements of an investment project are: the infrastructure of the line, the track superstructure (which includes electrification and signalling systems) and the rolling stock. The useful life of the various components can be quite different and, for some of them, very long. Annex B includes a list of the useful life of specific railway components. Since only one appraisal period is used for a given CBA calculation, specific attention must be given in rail projects to consistent assumptions on renewals and residual values of the various elements. In fact, the result of an economic appraisal should not depend on the length of the appraisal period selected for the analysis, provided it is long enough to capture the stabilisation of traffic growth under the scenario considered. Regarding infrastructure, the minimal Operating Period is established according to the potential loss of functionality or safety of the element.
The residual value of the assets produced by the investment at the end of the Operating Perioddepends on the remaining functionality of the project components. This is difficult to estimate because it will depend on technological obsolescence, on the potential alternatives to the project at the time and the cost of its eventual disposal. The theoretical residual value is obtained from an assumption about the most efficient use of the assets after the Operating Period. It will usually be positive if the rolling stock can still run without major problems and the infrastructure and superstructure are still operational. It could also be negative, for instance if the best option is to dispose of the assets and this involves important expenditure (for instance, in re-landscaping).
4
22 Actually an experts’ group set up by the European Commission with the objective of defining them could not reach an agreement.23 The “problem” can be physical or related to control systems, to the traffic flow (“congestion”), to priorities accorded to specific trains, etc.24 See TINA for definitions.
Financial and economic analyses

R A I L P A G R a i l w a y P r o j e c t A p p r a i s a l G u i d e l i n e s 37
Residual values are ideally valued as the discounted values of the costs and benefits in an indefinite time series. In this case, the impact of the length of the Operating Period is nil. The residual value is often calculated, however, as the non-depreciated part of the asset. To assume a depreciation method based on the replacement value means accepting that present market conditions will remain stable and that a “replaced” project will be, after its Operation Period, as competitive as it is today. This is linked to adequate maintenance and some minor upgrading expenditure to maintain the project at adequate standards. Under these circumstances a rather high residual value could be acceptable. Another option is to simply adopt a depreciation formula defining the residual value at any given year. The Operating Period should be shorter than the depreciation period of the main asset of the project (i.e. the infrastructure, for major projects). The depreciation formula is usually linear with time, but in many cases convex functions, notably for rolling stock, are used.
A particular component requiring attention is the land purchased for the project. This component, at the end of its useful life, will probably keep its present value (in constant terms) or even increase it. In general a value between the present value in current and in constant terms would be used. Some research is needed to establish residual values for linear rights-of-way and for more adaptable plots such as those used for stations and facilities25.
In summary, CBA calculations in the rail sector need to take into account the useful life spans of various assets. When structuring an appraisal, care should be taken to make a set of assumptions on renewals and residual values that is consistent with the appraisal period selected for the analysis. It is often convenient to place the end of the appraisal period at the end of the useful life of a major component of the investment.
4.3.3 Discount rateThe discount rate and the profitability indicators used in transport sector CBAs should,
in principle, be the same irrespective of the type of project. However, it has been a rather common practice in some countries (and in the analyses of certain institutions) to use lower rates for rail projects under the contention that some benefits of these projects, notably environmental and social, were not included in the CBA. When all benefits are incorporated into the appraisal, this is not justified.
There is no agreement on which discount rate should be used for the transport sector. Theor-etically, it reflects the “preference for the present” of the aggregate of economic actors. Its value is actually a critical criterion applied to select or accept projects. In theory again, it should be linked to the economic situation of those performing the investment. In practice, acceptable rates of discount are often set at country level for infrastructure, and can reflect not only economic realities but budget constraints in the public sector. High discount rates will favour the acceptance of projects with lower investment and/or a concentration of benefits in the short term, whilst lower rates (such as those adopted in countries requiring, for instance, high discounted benefit/cost ratios) will push forward those projects with longer-term returns. This explains, in part, the wide range of discount rates being used: according to references at the end of this document, those currently used in the railway sector fall within the 2.5%-8% range for most of the projects appraised in developed countries.
The use of more sophisticated discount methods such as hyperbolic discounting (i.e. discount rate declining over time) are acceptable provided that they are clearly specified and justified. It is not always clear that the benefits of fine-tuning the yearly discount rates to a theoretical view of the future compensate for the added complexity and the obvious comparability problems.
25 The high value of some urban land owned by railways signals the interest of the proposed research.

R A I L P A G R a i l w a y P r o j e c t A p p r a i s a l G u i d e l i n e s38
Some countries are applying in their appraisal manuals the concept of the cost of public money to reflect, not only the above-mentioned constraints but also the fact that raising money is costly for the public sector. It can be argued that introducing this mark up in the investment costs to reflect their true resource cost is similar to requiring a higher rate of return for the investment. The discussion on this subject is complex and general and does not belong here, but, given its potential impact on the level of profitability requirement for projects, it is recommended to study it further, along with its particular impacts for rail projects, which are mainly publicly financed, in order to standardise practice across the Community.
A separate issue that deserves some attention is the possibility of applying a different discount rate to specific items of the appraisal, in particular those referring to environmental impacts. There are arguments supporting the use of lower discount values for those intergenerational impacts for which the time factor is not so relevant. This subject should be clarified at a political level. In the meantime, the use of different discount rates is acceptable provided that they are clearly signalled.
The same could happen in relation to accidents, where a lower discount rate could be applied to the reduction or the increase of fatalities caused by the project under analysis.
4 Financial and economic analyses

R A I L P A G R a i l w a y P r o j e c t A p p r a i s a l G u i d e l i n e s 39

5The RAILPAG
approach to project appraisal

The RAILPAG

R A I L P A G R a i l w a y P r o j e c t A p p r a i s a l G u i d e l i n e s42
5 The RAILPAG approach to project appraisal
These Guidelines should contribute to facilitating decision-making for rail investments under the evolving structure of the sector. With the increasing number of stakeholders participating in the sector it is important both to clarify and adapt certain aspects of the traditional appraisal methods, based on CBA, and to ensure that the trade-offs between the various stakeholders, triggered by the investment, are properly reflected in the appraisal process. The RAILPAG approach is based on providing indicators not only on the overall quality of the project but also on its implications for the different stakeholders.
To make this useful to the decision-making process a rather simple presentation is required. For uncomplicated projects the distributional effects can be clarified by a simple check of the main costs/benefits flows for the main stakeholders at the end of the normal project appraisal. It is recommended that a short discussion of such a check is included at the end of the appraisal report. However, for larger and more complex projects, a more thorough analysis of the distributional matters is beneficial. This could be achieved through a SE Matrix, which is actually the main novelty of RAILPAG. The distributional issues are particularly interesting for grant providers or other stakeholders who might be asked to contribute to the investment costs.
5.1 Ensuring the quality of cost-benefit analysisPrivate sector stakeholders have clear financial profitability maximisation objectives. Goals
and objectives for the public sector are much more difficult to establish. Classical economic theory assigns to the State the role of optimising the use of scarce resources for the welfare of society as a whole. Optimisation should be based on agreed objectives. These are not only difficult to establish, but also to define. Quantification of the project effects regarding objectives, which is very convenient for the comparison of alternatives, is the key technical challenge of socio-economic appraisal and requires a certain expertise, as has been shown in former chapters. However, the most difficult aspect of appraisal is probably how to integrate the available information regarding objective attainment to produce reasonable advice on the best option and on its qualities.
CBA provides a measure of the efficiency of the investment for society. This covers the most important objectives of the appraisal. The other objectives, in particular redistribution effects and external impacts not properly included in CBA, should also be considered in decision-making and thus be part of the appraisal process. Multicriteria analysis was developed to solve this problem but there is no agreement on how to apply it and, in its present format, it is either too complex or too “black box” (all criteria are often merged into a single unclear figure). This has hindered the use of multicriteria analysis, which is often criticised as being a way of justifying political solutions. The RAILPAG solution is to extend CBA, in particular for large and complex projects, in order to: a) introduce the non-monetised aspects as simple indicators that generate awareness; b) facilitate the calculation of the maximum/minimum relative economic weight that these non-monetised project impacts should have to compensate their effects, and, in particular, c) to clarify how costs and benefits are distributed. This clarification of the effects of the project on the various stakeholders and the estimation of the expected financial transfers between them has become increasingly important with the new organisational setup. It is, in any event, information that could affect the investment decision.
5.2 Presenting re-distribution impactsCBA requires the estimation of the yearly impacts of the project in terms of costs and benefits.
These are integrated in a single indicator (ERR, NPV, B/C ratio) allowing comparisons with benchmarks or an “efficient” distribution of budget. This information is usually handled using a spreadsheet that allows an easy calculation of the indicators. From the background support of CBA, if the spreadsheet is

R A I L P A G R a i l w a y P r o j e c t A p p r a i s a l G u i d e l i n e s 43
properly organised, and provided that reliable data are available, it is relatively simple to obtain specific information on the effects of the project on the various stakeholders. A simple discussion of these effects should be included in the conclusions of the appraisal.
For projects requiring a more refined distributional analysis, a SE Matrix (see Figure 2 for a simplified version) will be most useful. The SE Matrix takes advantage of the information that should be available for the traditional CBA, to present it in a way that relates effects (in the rows) and stakeholders (in columns) summarising the main economic and financial implications of the project and showing the transfers between stakeholders and the distribution of costs and benefits. It also incorporates markers for non-monetised effects and overall indicators of the profitability of the investment.
5.2.1 Effects and stakeholdersThe distributional analysis requires the establishment of a list of relevant effects and
stakeholders for the project. For each project, the stakeholders are all those identifiable groups that will be affected in a noticeable way by the implementation of the project. Relevant effects are those project impacts on any stakeholder that can be properly established and considered to have an observable (noticeable) welfare implication.
Typical effects refer to user service (fares, travel time, reliability of service, comfort, convenience and safety), operation (direct and indirect costs and fees, including subsidies and taxes), assets(investment and maintenance) and to externalities (environmental and territorial development). The stakeholders that are usually considered are: users, transport service operators, infrastructure managers, contractors and suppliers, non-users and government.
The analysis of the re-distribution effects of complex projects is facilitated by the elaboration of the SE Matrix, which should be adapted to each specific project and will contain, in its cells, the key information for this analysis. Indeed, each SE cell reflects the net present value of a specific effect with respect to a specific stakeholder for all the life span of the project (incremental values with respect to the do-minimum alternative). When these effects are purely financial (for instance, for fares paid by the users or the cost of purchasing rolling stock) the cell will contain a single NPV. When a part of the economic costs or benefits are not included in the financial transaction, the cell will contain two sub-cells, one with the financial NPV and the other with the difference between this value and the economic value of the effect for the stakeholder (for instance, a part of the accident costs are paid by transport
SE MATRIX
STAKEHOLDERS
USERSTRANSPORT
SERVICE OPERATORS
INSURANCE COMPANIES
CONTRACTORS & SUPPLIERS
INFRASTRUCTURE MANAGERS
NON USERS GOVERNMENT
EFFE
TCS
USER SERVICE
OPERATION
ASSETS
EXTERNAL EFFECTS
Figure 2. Basic SE matrix

R A I L P A G R a i l w a y P r o j e c t A p p r a i s a l G u i d e l i n e s44
26 It is not unusual to find justifications for rail projects based on environmental considerations that have not been quantified at all or compared with the CBA results.
users through insurance, but this does not fully cover the totality of the economic and moral damages that accidents produce). The division of these cells allows a better understanding of the financial and the economic flows triggered by the project.
Adding the cells in a row provides the overall economic NPV for the corresponding effect. Pure financial transfers vanish in this total, as they appear as negative in the cells of the paying stakeholders and positive in the cells of those receiving the cash-flow. Similarly, the overall economic benefits for the different stakeholders appear in the totals of the columns. For some of these stakeholders, this NPV is purely financial. For others, notably the users and the non-users, the non-market components could be paramount.
5.2.2 Non-monetisable effectsSome effects of the project, whilst relevant, may be impossible to measure or to monetise.
This means that they cannot be introduced in the matrix as NPVs. They could, however, be important in decision-making and it is important to place them appropriately. In the SE Matrix this is done through a colour code that will provide the required message to those studying it. The proposal is to use green for mild effects, yellow for those that deserve some attention and red for those that could have a more substantial weight in the decision. When quantification or a clear and simple qualitative assessment of the effect is available, it may be introduced, along with the colour, in the cell. The totals in the rows and columns should also reflect, through the same colour codes, if some of the NPV totals do not properly reflect the effect or the impact on the stakeholder.
The assignment of colours to non-monetised cells is a relatively subjective exercise. Some criteria are provided in the discussion of the cell calculations, but in most cases the person responsible for the appraisal exercise will have to take responsibility for his assessment of the specific project impact. What is really important is being consistent in the appreciation across the different alternatives and projects that are compared.
5.2.3 ThresholdsThe SE Matrix can be used to show valuable information on these non-monetised cells. In
particular, it could easily be used to indicate the discounted cash (NPV) that it would be necessary to be globally assigned to all these elements (or to any sub-set of them) to ensure that the project reaches the established threshold of profitability. Alternatively (if the value is negative) it would show the reduction of benefits that these qualitative cells should have to lower the ERR of the project to the treshold. These values are extremely important to place the non-monetised impact in the appraisal (at least suggesting the order of magnitude they should have to influence the decision) and to eliminate an important element of subjectivity in the appraisal that has been particularly harming to rail projects26.
The next chapter explains in more detail the application process of RAILPAG. Annex D applies RAILPAG to several case studies.
5 The RAILPAG approach to project appraisal

R A I L P A G R a i l w a y P r o j e c t A p p r a i s a l G u i d e l i n e s 45

6Applying
RAILPAG

Applying

R A I L P A G R a i l w a y P r o j e c t A p p r a i s a l G u i d e l i n e s48
6 Applying RAILPAG
6.1 General conceptsRailway project appraisal needs a methodology that is simple and transparent, but able to
respond to the current changing scenarios in the railway sector, and adaptable to the size and complexity of the project.
RAILPAG aims at facilitating decision-making through an overall understanding of the pro ject’s effects and a simultaneous view of all the important issues at stake, whilst maintaining a rigorous approach that will take into account all the technicalities of the sector.
The RAILPAG approach could be used for planning and programming exercises, including some screening processes, but is mostly focused on the appraisal of specific projects for which a rail solution is envisaged. The following comments on how to apply the Guidelines and the case studies showing how to do it in practice are mostly limited to specific rail projects.
The RAILPAG appraisal process consists of three phases (see Figure 3): the first one is dedicated to defining the problem and choosing reasonable alternatives. The second phase, consists of a thorough CBA of these alternatives, supported by adequate demand studies (notably to establish forecasts –for the project use and for competing options). It should also contain a discussion of the distributional effects of the project including, whenever it is appropriate, the elaboration of an SE Matrix for each do-something alternative. The last phase is dedicated to analysing each alternative and comparing them, expressing their relative values leading to recommendations for the decision-makers.
6.2 The appraisal frameworkThe definition of the project’s objectives and its multimodal alternatives is a critical first phase.
It is not possible to give indications on how to do this for the myriad of projects proposed in the rail sector. The technical quality and the creativity of the design team and its ability to envisage potential solutions outside the rail mode are critical for this phase, which is the most difficult to scrutinise by external evaluators.
The second phase requires the elaboration of the CBA following the indications provided in TINA and those in chapter 3. If a SE matrix is considered necessary, the CBA should include the calculations needed to fill out the SE matrix for each of the alternatives selected in the first phase. Thus, if the SE matrix must be produced, a first step in the CBA will always be the establishment of the main stakeholders and main effects to be taken into consideration.

R A I L P A G R a i l w a y P r o j e c t A p p r a i s a l G u i d e l i n e s 49
PROBLEM IDENTIFICATIONOBJECTIVE OF THE
INVESTMENT
Definition of alternatives
Alternative 1 Alternative NDo-minimum Alternative 0
General aspects Scenarios
Specific issues and constraints
Define stakeholders and effects
FINANCIAL & SOCIO-ECONOMIC CBAs (for each project alternative)
Traffic forecastsDemand analysis
Different fare proposals
Distributional aspects (SE Matrices for complex projects)
Financial analysis External effectsSocio-economicanalysis
COMPARATIVE ANALYSIS Alternative X€ (0,N) compared with
Do-minimum Alternative
PHASE 1
PHASE 2
Cell zooming: description for each cell
PHASE 3
DECISION
Preference map
Socio-economic comparative analysisComparison of financial impacts and their redistribution Non-monetised effects
Figure 3. RAILPAG appraisal process

R A I L P A G R a i l w a y P r o j e c t A p p r a i s a l G u i d e l i n e s50
6
6.2.1 Distributional aspects. Filling the SE MatrixIt is recommended that some consideration be given to the distributional impacts of the project.
For small investments, a simple assessment may be sufficient. For large and/or complex projects, the elaboration of a SE Matrix should be envisaged.
The SE Matrix for a specific investment will, in general, further divide effects and stakeholders to produce a more detailed version of the basic matrix in Figure 2, adapted to the specificities of the project. Figure 4 provides a kind of “maximum” division of the SE Matrix, which includes all the relations that are potentially relevant for a rail project. For each specific case, this matrix will be adapted (reduced) to those effects and stakeholders that are really relevant for the case.
Only some of the cells in the SE Matrix will have a noticeable impact on the appraisal. Figure 5 indicates those that a priori could be active, i.e. cells that are relevant because the relationship between stakeholder and effect represents a significant socio-economic or financial incidence.
Active cells vary from one project to another, and also the criteria to define their contents (the effect for the stakeholder: a NPV or a colour and/or a comment). A main recommendation of RAILPAG is to carefully analyse the stakeholders, the effects and their relationship in order not to overlook any relevant factor in the CBA. In any case, it is more prudent to assume that irrelevant cells will be active ones than the contrary situation.
The estimation of the cell values usually requires a rather complicated modelling exercise. The economic appraisal heavily depends on the traffic demand. Unfortunately very often both studies are being carried out independently. This creates inefficiency and often induces errors. It is strongly recommended that the market analysis contemplates the various alternatives and also the potential impact of changes in fares, in particular for the rail mode. The appraisal team should also be able to run the demand models to observe the likely impacts of changes in the alternatives that might not have been considered in the forecasting exercise.
Usually the CBA, with the calculations leading to the various NPVs that have to be inserted in the SE Matrix, is carried out using a spreadsheet. This type of working environment is particularly useful and the case studies provide examples of how to carry out the CBA in a systematic way. RAILPAG may be further developed in the future through some specific software tools. In the meantime the appraisal team will have to prepare ad-hoc spreadsheets (or equivalent) to produce the values in the matrix.
In the CBA there are effects that only have financial implications, such as fares27, which will appear in the cells of the “disbursing” stakeholders as negative and in the cells of those receiving the cash flows as positive. As they are pure transfers in economic terms, the total value of the effect (in the row totals of the right hand) should be zero. Actually the zero sum of these financial transfers is an important check of the quality of the matrix.
Some effects, such as the value of travel time savings, are purely economic, as they are not marketable. They will appear in the relevant cells with the proper sign and provide a total economic benefit or cost estimation. Finally some cells will have to be split to provide both the financial NPV component and the economic NPV for the part that is not covered by the cash-flow. The economic value for the stakeholder will be the addition of the two components and will be reflected in the column’s total, whilst the row with the financial transfers will have a zero total28.
27 The cost of collecting and managing them are normally included in the global operation costs.28 See, for example, the treatment of safety benefits in case study 6.
Applying RAILPAG

R A I L P A G R a i l w a y P r o j e c t A p p r a i s a l G u i d e l i n e s 51
Figure 4. Detailed SE matrix
CELL CLASSIFICATION
STAKEHOLDERS
SE MATRIX
USERS TRANSPORT SERVICE OPERATORS
INSU
RANC
E COM
PANI
ES
CONTRACTORS & SUPPLIERS
INFRASTRUCTURE MANAGER NON
USERS(external)
GOVERNMENTRAIL LINES
ALTERNA-TIVE
MODESRAIL
Othe
r mod
es
RAIL
Othe
r mod
es
Pax
Freig
ht
Pax
Freig
ht
Rail O
pera
tor 1
Rail O
pera
tor 2
... Infra
struc
ture
Supe
rstru
ctur
e
Rolli
ng st
ock
Elect
rifica
tion
& sig
nalin
g
Rail m
anag
er 1
Rail m
anag
er 2
... LOCA
L
REGI
ONAL
LOCA
L
REGI
ONAL
NATIO
NAL
EUEFFECTS
USE
R SE
RVIC
E
Fares
Travel time
Reliability of service
Comfort
Convenience
Safety / accidents (economic / financial)
Consumer surplus (new traffic)
OPE
RATI
ON D
IREC
T
Fees
Vehicle operating costs
Operating personnel
Facilities operations
IND
IREC
T
Overhead management -HQ
Subsidies
Taxes
ASS
ETS
INV
ESTM
ENT
Land value
Infrastructure
Superstructure
Stations & terminals
Garage & repair facilities
Rolling stock (vehicles)
Residual value
Taxes
MA
INTA
IN-
AN
CE
(RO
UTI
NE) Infrastructure &
Superstructure
Rolling stock
EXTE
RNA
L EF
FEC
TS
NETWORK EFFECTS (not included above)
ENV
IRO
NM
ENTA
L Noise & vibrations
Air pollution
Climate change
Use of space
TERRITORIAL DEVELOPMENT

R A I L P A G R a i l w a y P r o j e c t A p p r a i s a l G u i d e l i n e s52
6
A major problem in project appraisal is the difficulty of translating into monetary terms some effects that are essentially qualitative. The use of the colour code proposed by RAILPAG makes it possible to raise the awareness of the decision-maker on those aspects that have not been integrated into the cash-flow analysis. In general, cells with NPVs will have no colour, although they can be used when certain socio-economic aspects cannot be reflected in the financial or in both the financial and the additional economic component29. This subjective appraisal of non-monetisable impacts is carried through to the total NPV for the stakeholder and the effect in question. This means that the “total” in the corresponding row and column will also have a colour. When there are several coloured cells in a row or column, the “addition” of colours will have to be translated into a single colour for the “total” through a subjective exercise by the evaluator.
This presentation is suited to eliminate some of the appraisal biases that have been affecting rail project appraisals, such as the use of the “environmental friendliness” of the mode or the positive effects on job creation to justify poor projects. A recommended way of dealing with important non-quantified effects is to estimate in the CBA, and then indicate in the SE Matrix, the NPV that should be added to (or subtracted from, when the effects are negative) the total benefits, to reach the desirable minimum ERR for the project. This value would give an indication threshold for the acceptable total of non-quantified costs and benefits. It could also be done for a specific cell, although, in this case, it might be necessary to compare the cell value with the totals in the row and column for the cell or with other cells estimating similar effects30. As for other methodological refinements, the appraisal team will need to balance the time and effort burden of collecting and treating data against the value of the additional information produced.
In conclusion, the SE Matrix: a) provides valuable information, within the cells, on the individual SE relationships; b) the row and column totals allow identification of the relative importance of each type of effect (both financial and economic) and the relative impact of the project on each stakeholder, making it possible to analyse its distributional aspects; c) the standard indicators (NPV, ERR and B/C ratio) and the colour code give an assessment of the overall profitability; and, finally, d) the indications on the value to be given to non-monetised impacts to be able to affect the feasibility of the project provide a reference on those aspects that are most difficult to include in the appraisal.
The information summarised in the SE Matrix thus provides an integrated picture of the consequences of the project. Information on socio-economic, including non-monetised, and financial aspects facilitates a comprehensive appraisal of the qualities of the project. On the other hand, presentation of the financial analysis will help the understanding of redistribution effects which are critical, notably in the context of Public Private Partnerships (PPPs), where global risk analyses heavily depend on an adequate distribution of risks and rewards. It should be noted, however, that PPP structures are likely to introduce a number of additional stakeholders with complex -and sometimes conditional- financial relationships based on risk coverage arrangements.
6.2.2 From CBA to SE cells
Active cells, associated to a particular stakeholder-effect combination, usually contain a NPV that is obtained from the spreadsheet where the CBA has been carried out. In the case studies all data in the CBA have been entered as positive values, except when the differential impact between the
29 There is obviously a risk of double counting when some effects are given partially monetary values and partially qualitative marks. The evaluator should explain the mark when necessary. The double-counting risk is not dissimilar to those found in other methods, which do not provide the same easily readable indicators.30 It is possible to deal with the question in a more systematic way. For instance, the number of cells with different colours could be given a weight (for instance 1, 2, 3) and see how big should be the single cell value to achieve the desired ERR and then observe the logic of this value, multiplied by the weight, for the various effects.
Applying RAILPAG

R A I L P A G R a i l w a y P r o j e c t A p p r a i s a l G u i d e l i n e s 53
Figure 5. Cells most often used in the appraisal of rail
CELL CLASSIFICATION
STAKEHOLDERS
SE MATRIX
USERS TRANSPORT SERVICE OPERATORS
INSU
RANC
E COM
PANI
ES
CONTRACTORS & SUPPLIERS
INFRASTRUCTURE MANAGERS NON
USERS(external)
GOVERNMENTRAIL LINES
ALTERNA-TIVE
MODESRAIL
Othe
r mod
es
RAIL
Othe
r mod
es
Pax
Freig
ht
Pax
Freig
ht
Rail O
pera
tor 1
Rail O
pera
tor 2
... Infra
struc
ture
Supe
rstru
ctur
e
Rolli
ng st
ock
Elect
rifica
tion
& sig
nalin
g
Rail m
anag
er 1
Rail m
anag
er 2
... LOCA
L
REGI
ONAL
LOCA
L
REGI
ONAL
NATIO
NAL
EUEFFECTS
USE
R SE
RVIC
E
Fares
Travel time
Reliability of service
Comfort
Convenience
Safety / accidents (economic / financial)
Consumer surplus (new traffic)
OPE
RATI
ON D
IREC
T
Fees
Vehicle operating costs
Operating personnel
Facilities operations
IND
IREC
T
Overhead management -HQ
Subsidies
Taxes
ASS
ETS
INV
ESTM
ENT
Land value
Infrastructure
Superstructure
Stations & terminals
Garage & repair facilities
Rolling stock (vehicles)
Residual value
Taxes
MA
INTA
IN-
AN
CE
(RO
UTI
NE) Infrastructure &
Superstructure
Rolling stock
EXTE
RNA
L EF
FEC
TS
NETWORK EFFECTS (not included above)
ENV
IRO
NM
ENTA
L Noise & vibrations
Air pollution
Climate change
Use of space
TERRITORIAL DEVELOPMENT

R A I L P A G R a i l w a y P r o j e c t A p p r a i s a l G u i d e l i n e s54
6
Figure 6. Cell expansion program.
CELL CLASSIFICATION
STAKEHOLDERS
SE MATRIX
USERS TRANSPORT SERVICE OPERATORS
INSU
RANC
E COM
PANI
ES
CONTRACTORS & SUPPLIERS
INFRASTRUCTURE MANAGER NON
USERS(external)
GOVERNMENTRAIL LINES
ALTERNA-TIVE
MODESRAIL
Othe
r mod
es
RAIL
Othe
r mod
es
Pax
Freig
ht
Pax
Freig
ht
Rail O
pera
tor 1
Rail O
pera
tor 2
... Infra
struc
ture
Supe
rstru
ctur
e
Rolli
ng st
ock
Elect
rifi ca
tion
& sig
nalin
g
Rail m
anag
er 1
Rail m
anag
er 2
... LOCA
L
REGI
ONAL
LOCA
L
REGI
ONAL
NATIO
NAL
EUEFFECTS
USE
R SE
RVIC
E
Fares
Travel time
Reliability of service
Comfort
Convenience
Safety / accidents (economic / fi nancial)
Consumer surplus (new traffi c)
OPE
RATI
ON D
IREC
T
Fees
Vehicle operating costs
Operating personnel
Facilities operations
IND
IREC
T
Overhead management -HQ
Subsidies
Taxes
ASS
ETS
INV
ESTM
ENT
Land value
Infrastructure
Superstructure
Stations & terminals
Garage & repair facilities
Rolling stock (vehicles)
Residual value
Taxes
MA
INTA
IN-
AN
CE
(RO
U-
TIN
E)
Infrastructure & Superstructure
Rolling stock
EXTE
RNA
L EF
FEC
TS
NETWORK EFFECTS (not included above)
ENV
IRO
NM
ENTA
L Noise & vibrations
Air pollution
Climate change
Use of space
TERRITORIAL DEVELOPMENT
STAKEHOLDERS
CONTRACTORS & SUPPLIERS
INFRASTRUCTURE MANAGER NON
USERS(external)
GOVERNMENTRAIL
Othe
r mod
es
Rolli
ng st
ock
Elect
rifi ca
tion
& sig
nalin
g
Rail m
anag
er 1
Rail m
anag
er 2
LOCA
L
REGI
ONAL
LOCA
L
REGI
ONAL
NATIO
NAL
EU
Financial transfer cell
STAKEHOLDER
PASSENGERSRAIL LINES – USERS
EFFECT DESCRIPTION:
FARE
SU
SER
SERV
ICE
NPV of incremental fare that railway users have to pay. It is often necessary to divide them among existing, diverted and generated users.CALCULATION:
Ideally, for each of the three types of passengers:i) -∑ Fare (€/passenger·km) x Traffi c with this fare (passenger·km) ➞ Considering diff erent faresAlternatively:ii) -Average fare (€/passenger·km) x Traffi c (passenger·km) The fare revenue from the do-minimum case (existing traffi c) to be deducted.SOME VALUES:
0.12 (conventional line) to 0.25 (high-speed line) €/passenger/km (data from Spanish case)
CRITICAL ISSUES:
Demand forecasts (see chapter “General Aspects”). Sophisticated traffi c forecasting models are needed, in particular under yield management.REMARKS:
It is recommended to use method of calculation (i) and consider distribution by classes (business class, etc.), season tickets & discounts.Fares quantifi ed here usually include transport and insurance, except when safety is a major issue for the project. Taxes (i.e. VAT) are considered separately.The total of additional fares paid by users (thus a negative number) must be found as a positive value in the corresponding cell for additional revenues for operators.
Applying RAILPAG
project and the do-minimum alternative goes against the expected sign (i.e. it could be that some impacts that are usually positive, such as time savings, become negative for some users). Some of these “positive” NPVs in the CBA are directly transferred to the matrix. To facilitate the task, a colour code has been used: blue for the NPVs keeping the sign and red for those requiring a change of sign. The pure financial transfers are also indicated using numbers of a different colour or different style in the title of the effect in the CBA.
RAILPAG provides some specific indications on how to produce the values for the SE cells. In Annex C, a fiche for the most relevant SE cells is provided, giving guidance on how to introduce the effect on the stakeholder in the appraisal. The fiches are organised using the same general layout in order to manage information more efficiently. There are several labels for identification of the referenced cell and the following points: description of the effect and the related stakeholder, units used to quantify the effect, some values as a reference, relative importance and other remarks. The RAILPAG website will allow quick access to the specific fiche for each cell, as depicted in Figure 6, which shows the standard contents as applied to fares and rail passengers. These fiches will be continuously updated using

R A I L P A G R a i l w a y P r o j e c t A p p r a i s a l G u i d e l i n e s 55
6.3 Comparative analysisFinally, the third phase consists of the analysis of the alternatives, to establish their overall
socio-economic and financial implications, including the expected redistribution impacts. For this comparative analysis the global indicators will obviously be critical. A major issue arises when the best option in socio-economic terms shows financial feasibility difficulties or unbalanced results for specific stakeholders. This could affect the ranking of alternatives or the elimination of feasible options that do not comply with a benchmark. This link between socio-economic and financial analysis, as well as the link between performance indicators and risk, are left for future developments of RAILPAG.
In most cases the comparison among various alternatives will allow the selection of a preferred alternative or a maximum of two or three acceptable options. For them a more detailed analysis of the different aspects and the trade-offs between effects/stakeholders in the alternatives could be necessary. In some cases a sensitivity analysis30 would be required to assess the robustness of the different options. The final selection of the recommended alternative (or alternatives, if no clear conclusion could be reached) could be performed using some relatively sophisticated mechanisms such as Preference Maps, or simply through a careful explanation of the motivation behind the proposal.
In any case, it is recommended to make a complete and detailed revision of the SE Matrix for the proposed solution, to ensure that no mistakes have been made, and to improve its presentation to the decision-maker.
The selection process described above could be simplified if, for technical reasons, there is only one alternative to the do-minimum option. Then a single SE Matrix should provide the indications for the feasibility or not of the project.
30 The use of Monte Carlo simulations for some key parameters could be appropriate, but in most cases the observation of the impact on the results of up and down variations (i.e. of 10-20%) of the variable or parameter in question will be sufficient.

Annexes


R A I L P A G R a i l w a y P r o j e c t A p p r a i s a l G u i d e l i n e s – A n n e x e s58
Average external costs in 2000 by cost category & transport mode
Average Cost Passenger Average Cost Freight
RoadCar Bus MC Pass.
total Rail Avia-tion
Over -all
RoadLDV HDV Total Rail Avia-
tionWater-borne
Over-all
[Euro / 1000 pkm] [Euro / 1000 tkm]
Accidents 30.9 2.4 188.6 32.4 0.8 0.4 22.3 35.0 4.8 7.6 0.0 0.0 0.0 6.5
Noise1) 5.2 1.3 16.0 5.1 3.9 1.8 4.2 32.4 4.9 7.4 3.2 8.9 0.0 7.1
Air Pollution 12.7 20.7 3.8 13.2 6.9 2.4 10.0 86.9 38.3 42.8 8.3 15.6 14.1 38.5
Climate Change
High17.6 8.3 11.7 16.5 6.2 46.2 23.7 57.4 12.8 16.9 3.2 235.7 4.3 16.9
Climate Change
Low2)(2.5) (1.2) (1.7) (2.4) (0.9) (6.6) (3.4) (8.2) (1.8) (2.4) (0.5) (33.7) (0.6) (2.4)
Nature & Landscape 2.9 0.7 2.1 2.6 0.6 0.8 2.0 10.9 2.0 2.9 0.3 3.8 0.8 2.6
Up-/Down-stream3) 5.2 3.9 3.0 5.0 3.4 1.0 3.9 22.4 7.4 8.8 2.4 7.4 3.3 8.0
Urban Effects 1.6 0.4 1.1 1.5 1.3 0.0 1.1 5.2 1.1 1.5 0.5 0.0 0.0 1.3
Total EU 174) 76.0 37.7 226.3 76.4 22.9 52.5 67.2 250.2 71.2 87.8 17.9 271.3 22.5 80.9
Average external costs of transport in the EU17 countries
A External costs
Remarks:
1) The modal differences in noise costs are directly related to the national noise exposure databases used and thus might be subject to different ways of noise exposure measurement.
2) Average climate change costs for the low scenario (for information only, values not used to calculate total costs).
3) Climate change costs of up- and downstream processes are calculated with the shadow value of the “Climate Change High Scenario”.
4) Total average costs calculated with the climate change high scenario.
5) Noise costs for freight trains might be under-estimated as the simplified traffic assignment procedure applied did allocate most freight trains to daytime traffic.
Figures from INFRAS / IWW 2004

R A I L P A G R a i l w a y P r o j e c t A p p r a i s a l G u i d e l i n e s – A n n e x e s 59

R A I L P A G R a i l w a y P r o j e c t A p p r a i s a l G u i d e l i n e s – A n n e x e s60
B Useful life of specific railway components
Infrastructure components
Type of infrastructure Element of infrastructure Years
Earth worksSmall embankments in soft grounds 50
Large embankments in stable grounds 100
Tunnels, bridges and other works
Drainage works 80-100
Very large works (tunnels, viaducts) 80-100
Access facilities and stations
Structural elements (façade renovation, drainage structures) 10-50
Elements of habitability 2-10
Aesthetic elements 1-5
With regard to track superstructure equipment, its lifespan depends largely on the volume of traffic sustained and speed. Representative values are shown in the next table; the component having the shortest life is the ballast, which requires partial renovation without changing rails or sleepers.
Track superstructure components
Component Expected life Million gross tons
Life in years for an average traffic of 35,000 t/day
Rail UIC-60 in ballasted track 500 40
Concrete sleepers 500 40
Ballast 250 20
Safety facilities 10-50
Electrification facilities (distribution and sub-stations) 10-50

R A I L P A G R a i l w a y P r o j e c t A p p r a i s a l G u i d e l i n e s – A n n e x e s 61
Regarding rolling stock, the expected life depends on the speed characteristics of the material
and the type of service it is assigned to.
Rolling stock
Type of vehicle Top speed Years*
Freight wagons for conventional lines Speed under 100 km/h 40
Freight wagons for both conventional & high-speed lines Speed over 100 km/h 30
Passenger cars for long distance and regional services Speed over 120 km/h 25
Passenger cars for suburban and metropolitan services Speed under 120 km/h 15
Motor train unit Speed under 120 km/h 15-25
Locomotives for services in conventional lines Speed under 200 km/h 25
Locomotives for services in high-speed lines Speed over 200 km/h 20
Cars for high-speed lines Speed over 250 km/h 15
*Some internal elements, such as the interior of passenger cars, may have a shorter service life. This may mean refurbishing a vehicle before the end of its service life.

R A I L P A G R a i l w a y P r o j e c t A p p r a i s a l G u i d e l i n e s – A n n e x e s62
This annex contains fiches referring to the key cells in the SE matrix, providing a description of the link between the relevant stakeholder and the effects, and guidance on how to introduce the cell information in the appraisal. There are essentially six types of cells:
Financial cells, which contain the NPV of the expected cash-flows for effects representing the use of scarce resources, for which market prices adequately reflect their value for society. The financial and economic values can be assumed to be identical. Investment and maintenance costs fall within this category.
Financial transfer cells, which reflect pure cash-flow transfers between stakeholders. Their total economic value (reflected in the row total) is nil. Fares and taxes are typical for this category.
Economic cells for which there is no market price for the effect, but which can be given an economic value. Travel time savings are a typical example of this.
Economic and financial cells are in fact divided cells, with a financial transfer component and an economic component necessary to produce the true economic cost for society of the effect. Accident costs for users often fall into this category, as insurance (a financial transfer between transport users and insurance companies) will cover only a part of the social cost of accidents. The economic “supplement”, in the second sub-cell, should include the users’ and public expenditure and the moral damages (suffering, etc.) that are not covered by the insurance premia. This category also allows for the use of “shadow prices” when considered necessary by the evaluator. Dividing the cell into two components indicates the importance of the “socio-economic bias” introduced in the CBA.
Quantified socio-economic cells include those economic cells for which it is possible to quantify the effect but the evaluator does not have the possibility to make a proper economic estimation of it. The information in the cell could, for instance, refer to the diminution of pollutant emissions, which could be estimated in average tonnes/year, given that the economic value of the various pollutants is under discussion. The figures should be provided in the cell along with a colour indicating the relative importance given to the effect.
Non-quantified socio-economic cells, due to lack of quantitative information or simply of factual data. If the effect is considered relevant, a subjective appraisal through a colour code is recommended to avoid disregarding it in the appraisal. It could be interesting to provide figures regarding the amount of NPV that would be necessary for this effect to change the weight of the overall results (for instance, to reach an ERR of 5%).
The fiches will certainly depend on the cell category. In the first four cases, they will contain indications on how to obtain the NPV, with general comments on financial and economic aspects, reference values that could guide the calculation, an identification of the critical issues that the evaluator must deal with and other relevant remarks. When the SE relationship cannot be monetised (cases 5 and 6), some comments are provided on how to incorporate it in the matrix (through quantification, when possible, and a colour code).
The NPV calculations are part of the CBA supporting the SE matrix presentation. The CBA must always refer to the comparison of the alternative being analysed with the do-minimum option, so the cells must indicate the discounted value of the difference in the specific effect considered for the stakeholder in question.
The fiches are not supposed to provide all the information required to make the calculations in most rail projects. This could be the object of future appraisal manuals. In RAILPAG only general guidance is provided, mostly referring to the approach to be adopted so that theory and practice are balanced for maximum efficiency.
C SE cells

R A I L P A G R a i l w a y P r o j e c t A p p r a i s a l G u i d e l i n e s – A n n e x e s 63
The following SE matrix indicates those cells for which specific fiches could be particularly
useful to guide the evaluators. They are expected to be fully developed during the RAILPAG process, for which this document is just a first step. The eventual aim of these fiches is to develop into a type of appraisal manual for rail projects. However, to be able to provide the detailed information necessary for a Europe-wide standardised reference manual it is necessary to carry out an important exercise of research and data gathering that falls outside the scope of the present exercise.
The fiches in this annex are thus only provided as indications of the type of content that can be expected in the future. The reader should check the web site www. railpag.com for updates.

R A I L P A G R a i l w a y P r o j e c t A p p r a i s a l G u i d e l i n e s – A n n e x e s64
C CELL CLASSIFICATION
STAKEHOLDERS
SE MATRIX
USERS TRANSPORT SERVICE OPERATORS
INSU
RANC
E COM
PANI
ES
CONTRACTORS & SUPPLIERS
INFRASTRUCTURE MANAGERS NON
USERS(external)
GOVERNMENTRAIL LINES
ALTERNA-TIVE
MODESRAIL
Othe
r mod
es
RAIL
Othe
r mod
es
Pax
Freig
ht
Pax
Freig
ht
Rail O
pera
tor 1
Rail O
pera
tor 2
... Infra
struc
ture
Supe
rstru
ctur
e
Rolli
ng st
ock
Elect
rifica
tion
& sig
nalin
g
Rail m
anag
er 1
Rail m
anag
er 2
... LOCA
L
REGI
ONAL
LOCA
L
REGI
ONAL
NATIO
NAL
EUEFFECTS
USE
R SE
RVIC
E
Fares
Travel time
Reliability of service
Comfort
Convenience
Safety / accidents (economic / financial)
Consumer surplus (new traffic)
OPE
RATI
ON D
IREC
T
Fees
Vehicle operating costs
Operating personnel
Facilities operations
IND
IREC
T
Overhead management -HQ
Subsidies
Taxes
ASS
ETS
INV
ESTM
ENT
Land value
Infrastructure
Superstructure
Stations & terminals
Garage & repair facilities
Rolling stock (vehicles)
Residual value
Taxes
MA
INTA
IN-
AN
CE
(RO
UTI
NE) Infrastructure &
Superstructure
Rolling stock
EXTE
RNA
L EF
FEC
TS
NETWORK EFFECTS (not included above)
ENV
IRO
NM
ENTA
L Noise & vibrations
Air pollution
Climate change
Use of space
TERRITORIAL DEVELOPMENT
SE cells

R A I L P A G R a i l w a y P r o j e c t A p p r a i s a l G u i d e l i n e s – A n n e x e s 65
Financial transfer cell
STAKEHOLDER
PASSENGERSRAIL LINES – USERS
EFFECT DESCRIPTION:
FARE
SU
SER
SERV
ICE
NPV of incremental fare that railway users have to pay. It is often necessary to divide them among existing, diverted and generated users.
CALCULATION:
Ideally, for each of the three types of passengers:
i) -∑ Fare (€/passenger·km) x Traffic with this fare (passenger·km)
➞ Considering different fares
Alternatively:
ii) -Average fare (€/passenger·km) x Traffic (passenger·km)
The fare revenue from the do-minimum case (existing traffic) to be deducted.
SOME VALUES:
0.12 (conventional line) to 0.25 (high-speed line) €/passenger/km (data from Spanish case)
CRITICAL ISSUES:
Demand forecasts (see chapter “General Aspects”). Sophisticated traffic forecasting models are needed, in particular under yield management.
REMARKS:
It is recommended to use method of calculation (i) and consider distribution by classes (business class, etc.), season tickets & discounts.
Fares quantified here usually include transport and insurance, except when safety is a major issue for the project. Taxes (i.e. VAT) are considered separately.
The total of additional fares paid by users (thus a negative number) must be found as a positive value in the corresponding cell for additional revenues for operators.
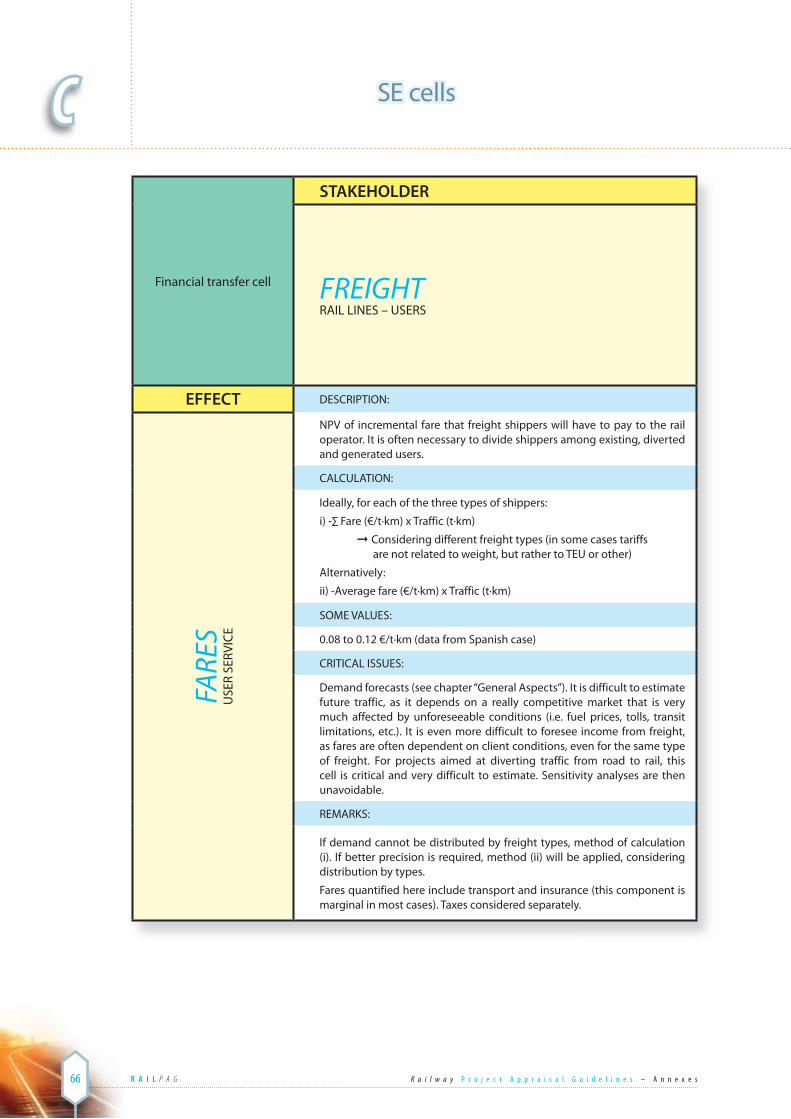
R A I L P A G R a i l w a y P r o j e c t A p p r a i s a l G u i d e l i n e s – A n n e x e s66
C
Financial transfer cell
STAKEHOLDER
FREIGHTRAIL LINES – USERS
EFFECT DESCRIPTION:
FARE
SU
SER
SERV
ICE
NPV of incremental fare that freight shippers will have to pay to the rail operator. It is often necessary to divide shippers among existing, diverted and generated users.
CALCULATION:
Ideally, for each of the three types of shippers:
i) -∑ Fare (€/t·km) x Traffic (t·km)
➞ Considering different freight types (in some cases tariffs are not related to weight, but rather to TEU or other)
Alternatively:
ii) -Average fare (€/t·km) x Traffic (t·km)
SOME VALUES:
0.08 to 0.12 €/t·km (data from Spanish case)
CRITICAL ISSUES:
Demand forecasts (see chapter “General Aspects”). It is difficult to estimate future traffic, as it depends on a really competitive market that is very much affected by unforeseeable conditions (i.e. fuel prices, tolls, transit limitations, etc.). It is even more difficult to foresee income from freight, as fares are often dependent on client conditions, even for the same type of freight. For projects aimed at diverting traffic from road to rail, this cell is critical and very difficult to estimate. Sensitivity analyses are then unavoidable.
REMARKS:
If demand cannot be distributed by freight types, method of calculation (i). If better precision is required, method (ii) will be applied, considering distribution by types.
Fares quantified here include transport and insurance (this component is marginal in most cases). Taxes considered separately.
SE cells

R A I L P A G R a i l w a y P r o j e c t A p p r a i s a l G u i d e l i n e s – A n n e x e s 67
Financial transfer cell
STAKEHOLDER
PASSENGERSALTERNATIVES MODES – USERS
EFFECT DESCRIPTION:
FARE
SU
SER
SERV
ICE
NPV of the fares that diverted users are avoiding in the original mode (usually bus or air transport)
CALCULATION:
i) -Average fare (€/passxkm) x Diverted traffic (passxkm)
SOME VALUES:
0.12 to 0.15 €/passxkm (bus) (data from Spanish case)
0.10 (low cost) to 0.30 €/ passxkm (regular plane) (data from Spanish case)
CRITICAL ISSUES:
Demand forecasts (see chapter “General Aspects”) and determination of average fares (as it is usually not worthwhile to go into detailed analysis of diverted traffic).
Confronted with the new competition due to the project, the supply of service and fares of alternative transport modes may change. The forecasting difficulties may justify a rather simplistic approach (such as average fares).
REMARKS:
If diverted traffic is very important, more detailed forecasts and sensitivity analyses are recommended.
Fares quantified here include transport and insurances. Taxes should be considered separately if they are specifically included in the cell for rail fares for diverted rail users.

R A I L P A G R a i l w a y P r o j e c t A p p r a i s a l G u i d e l i n e s – A n n e x e s68
SE cellsC
Financial transfer cell
STAKEHOLDER
OPERATORSRAIL LINES & OTHER MODES – TRANSPORT SERVICE OPERATORS
EFFECT DESCRIPTION:
FARE
SU
SER
SERV
ICE
NPV of additional income obtained by operators for services offered.
CALCULATION:
These incomes must correspond to the amounts paid by users, without taxes.
CRITICAL ISSUES:
The same as for users’ fares
REMARKS:
Insurance could be treated separately if safety impacts are particularly relevant.
Taxes “circulating” through the operators (VAT paid by users) are not included here.

R A I L P A G R a i l w a y P r o j e c t A p p r a i s a l G u i d e l i n e s – A n n e x e s 69
Financial transfer cell
STAKEHOLDER
INSURANCE COMPANIES
EFFECT DESCRIPTION:
FARE
SU
SER
SERV
ICE
NPV of the insurance fees paid by users. If necessary, columns for different modes can be established.
CALCULATION:
Insurance premia differential between the proposed alternative and the “do-minimum”. Train and airfares usually incorporate an insurance component that goes to the insurer. This amount, multiplied by the difference in the number of users, will provide the yearly amounts to be included in the calculation of the NPV. In the case of road traffic a project will usually not affect the payment of the users, but a reduction in road accidents will have positive financial effects on insurers (see accidents-insurer cell).
SOME VALUES:
In most cases a percentage of the fare will be sufficiently precise. Information on the weight of insurance in fares is not well known to evaluators and should be publicised.
CRITICAL ISSUES:
Demand forecasts (see chapter “General Aspects”)
REMARKS:
The column on insurance can often be excluded, as the financial impact of projects is negligible, except for safety-oriented schemes. In such cases (see the elimination of rail-road crossing case study) it is recommended to include it, paying attention to the consideration of this item in the fare to avoid double counting.
In any case, this is considered a transfer, although it can be argued that insurance premia require resources to be managed. This can be considered irrelevant in the context of a rail project appraisal, even for most safety oriented projects.

R A I L P A G R a i l w a y P r o j e c t A p p r a i s a l G u i d e l i n e s – A n n e x e s70
SE cells
Financial transfer cell
STAKEHOLDER
LOCAL, REGIONAL, NATIONAL – GOVERNMENT
EFFECT DESCRIPTION:
TAXE
SO
PERA
TIO
N
NPV of the difference in indirect taxes perceived by local, regional, national governments.
CALCULATION:
This value is the addition of the NPV of all differential taxes paid by users, operators, managers, etc. distinguishing, when required, among the different recipients: national, regional, local.
SOME VALUES:
The better known indirect taxes are VAT (% of expenditure falling on final consumer) and local taxes for some constructions.
For taxable cash flows that will be similar with and without the project (i.e. VAT on diverted users), it is advisable to exclude taxes altogether, as they will not affect results in a noticeable way.
CRITICAL ISSUES:
Revenue forecasts and tax evolution.
REMARKS:
If these taxes are split among authorities and the issue is relevant (to show contributors and beneficiaries) all columns must be shown. Row total for taxes must be zero, as they are considered a transfer (although it can be argued that there is a cost of raising public money, but this is a complex discussion – see main text on cost of public money).
C

R A I L P A G R a i l w a y P r o j e c t A p p r a i s a l G u i d e l i n e s – A n n e x e s 71
Economic cell
STAKEHOLDER
PASSENGERRAIL LINES – USERS
EFFECT DESCRIPTION:
TRAV
EL T
IME
USE
R SE
RVIC
E
NPV of the value of the reduction of travel time for the passengers using rail services with project.
CALCULATION:
Saved time in comparison with do-minimum:
In general, three types of traffic should be distinguished (they could be separated into three different columns):
Existing traffic: modifications in travel time for current rail users remaining in the mode
Diverted traffic: modifications in total travel time between the original mode and the new mode. If travel time is increased (as is sometimes the case for road to rail diversion) the value would be negative.
Generated traffic: as there is no trip for the do-minimum alternative, all benefits for users are considered in the consumer surplus estimate (see corresponding SE cell).
Time savings may evolve during the life of a project due to road congestion or other reasons. If they are due to improvements requiring in vestment (for instance new rolling stock), this should be included in the investment figures.
Value of time saved:
For existing and diverted trips, the corresponding composition of traffic(i.e. business, commuter and leisure trips, with each having a differentvalue of time) is used to calculate a weighted average value of time (€/pass·hour) that is multiplied by the time savings in hours.
It is recommended to take into account both a change in the composition of traffic (so the average value of time changes over the years) and an evolution of the value of time to take into account the improvement of living standards.
SOME VALUES:
Reference is often made to average wages. See references.
CRITICAL ISSUES:
Value of time (see chapter “General Aspects”).

R A I L P A G R a i l w a y P r o j e c t A p p r a i s a l G u i d e l i n e s – A n n e x e s72
C SE cells
Economic cell
STAKEHOLDER
FREIGHTRAIL LINES – USERS
EFFECT DESCRIPTION:
TRAV
EL T
IME
USE
R SE
RVIC
E
NPV of the value of the reduction of travel time for freight using rail services with project.
CALCULATION:
Saved time in comparison with do-minimum:
As for passengers.
Value of time saved:
It is essential to distinguish between the value of time savings (VTS) of existing and diverted traffic. VTS for existing rail traffic is purely related to the value of freight usually low value for captive rail traffic), whilst diverted road traffic, for instance, must consider the higher value of the cargo and, in particular, the value of time of the driver (and other staff in the lorry), to be calculated at full salary cost. For other modes (maritime or inland navigation, air transport) only the different value of freight could be an issue.
CRITICAL ISSUES:
Value of time (see chapter “General Aspects”).
REMARKS:
Freight travel times should be measured door-to-door. They are difficult to establish as logistic chains depend on many variables. Forecasting models are difficult and not very reliable. On the other hand as train freight services tend to be very slow, reliability becomes more important than travel time. It is thus recommended to spend effort on this cell only when improvement of freight traffic is a main objective of the project. In general this cell is only relevant when there is an important diversion from road traffic (due to the value of time of the driver).

R A I L P A G R a i l w a y P r o j e c t A p p r a i s a l G u i d e l i n e s – A n n e x e s 73
Economic cell
STAKEHOLDER
PASSENGERALTERNATIVE MODES – USERS
EFFECT DESCRIPTION:
TRAV
EL T
IME
USE
R SE
RVIC
E
NPV of the value of the reduction of travel time for passengers affected by the project and using other transport modes.
CALCULATION:
Saved time in comparison with do-minimum:
It will essentially be due to a reduction in congestion due to traffic diversion to rail. There is an argument, in this case, about the possibility of generating additional traffic in the mode as it becomes more attractive. If these effects could be important in the CBA (project in rail to solve a congestion problem in road or air transport), traffic forecasts should take all this into account and distinguish the various types of generated traffic in the appraisal.
It is important to pay attention to car occupancy if traffic is measured in vehicles.
SOME VALUES(*):
Must be consistent with those used for diverted car traffic.
(*) There is plenty of data available to set values for travelling with different modes, as well as for walking and waiting. There is, on the other hand, not so much empirical evidence for determining VOT to reflect congestion and unreliability. Wardman’s analysis (published in Transportation Research 2001) suggests a mark-up of about 50% when travelling during peak hours. This mark-up may well reflect both congestion (less comfort) and poorer reliability.
CRITICAL ISSUES:
Value of time (see chapter “General Aspects”).
REMARKS:
The effects produced by the elimination of bottlenecks must be con sidered (see chapter “General Aspects”).
Due to changes in demand, operators of alternative modes can modify supply, which could affect saved time for users.

R A I L P A G R a i l w a y P r o j e c t A p p r a i s a l G u i d e l i n e s – A n n e x e s74
C SE cells
Economic cell
STAKEHOLDER
FREIGHTALTERNATIVE MODES – USERS
EFFECT DESCRIPTION:
TRAV
EL T
IME
USE
R SE
RVIC
E
NPV of the value of the reduction of travel time for freight affected by the project and using other transport modes.
CALCULATION:
See similar cell for passengers and general comments on travel time - freight users.
CRITICAL ISSUES:
Value of time (see chapter “General Aspects”).
REMARKS:
The effects produced by reduced congestion tend to be less important in slower vehicles. This cell is often of minor importance.

R A I L P A G R a i l w a y P r o j e c t A p p r a i s a l G u i d e l i n e s – A n n e x e s 75
Socio-economic cell
STAKEHOLDER
PASSENGERSRAIL LINE & ALTERNATIVE MODES – USERS
EFFECT DESCRIPTION:
RELI
ABI
LITY
OF
SERV
ICE
USE
R SE
RVIC
E
Present value of improved reliability of service for passengers.
CALCULATION:
Reliability is an important concept for rail services and has proved to be an essential component of their competitiveness. However, there is no standard definition commonly accepted and there are severe difficulties in establishing the differences in reliability between two situations (with project and do-minimum, for instance). The coefficient of variation (stand-ard deviation divided by the mean) of travel times or simpler indicators such as % of trains delayed more than x minutes, would give a quantified estimate of reliability that could be introduced in the cell.
SOME VALUES:
The economic value of reliability or its relation with travel time values have not been properly studied. Even if quantified, a subjective evaluation (through the colour code) will probably be necessary, if this is considered a substantial aspect of the project’s benefits.
CRITICAL ISSUES:
Determination of the distribution of delays with and without the project.
REMARKS:
Some operators warrant punctuality and return a part of the fare if there is any delay. This fact could be included in the cell as a pure financial transfer.
Research is needed to link the characteristics of the infrastructure with reliability and to establish economic values for improvements in this quality.

R A I L P A G R a i l w a y P r o j e c t A p p r a i s a l G u i d e l i n e s – A n n e x e s76
C SE cells
Economic and
financial cell
STAKEHOLDER
PASSENGERSRAIL LINES – USERS
EFFECT DESCRIPTION:
SAFE
TY /
ACCI
DEN
TSU
SER
SERV
ICE
NPV of changes in the value of accidents suffered by passengers.
CALCULATION:
The difference between the alternatives for the economic:
[Risk of mortal accidents (number of deaths/pass·km) x Valuation deceased (€/deceased) x Traffic (pass·km)] +
[Risk of serious accidents (number of serious casualty/passr·km) x Valuation serious injuries (€/serious casualty) x Traffic (pass·km)] +
[Risk of minor accidents (number of slight casualties/pass·km) x Valuation slight injuries (€/slight casualty) x Traffic (pass·km)] +
[Risk of pure-damage accidents (number of accidents/pass·km) x Average valuation damages (€/slight casualty) x Traffic (pass·km)]
Note: damage to user’s goods (cars) included in accident costs; external damages in separate cell
and the financial part:
Insurance compensation for the same amount of deaths, serious injuries and slight injuries
SOME VALUES:
From EU manuals or similar, providing a global view on the value of life and limb. For insurance compensations, information from sector associations.
CRITICAL ISSUES:
Quantification of risks (through statistic studies) and valuation of deceased, seriously injured and slightly injured.
REMARKS:
There is a financial part corresponding to compensations and equivalent to the amount that insurance companies pay for this concept, in a percentage laid down by law and contracts among those stakeholders. The economic component includes non-compensated economic costs (including suffering) for transport users.

R A I L P A G R a i l w a y P r o j e c t A p p r a i s a l G u i d e l i n e s – A n n e x e s 77
Economic and
financial cell
STAKEHOLDER
OPERATORSRAIL LINES & OTHER MODES – TRANSPORT SERVICE OPERATORS
EFFECT DESCRIPTION:
SAFE
TY /
ACCI
DEN
TSU
SER
SERV
ICE
NPV of costs of differential accidents to transport operators.
CALCULATION:
Valuation of material damages + interruption of the service meaning loss of income - Insurance compensation
SOME VALUES:
Accident risks for different types of operation should allow comparison of expected accidents with project and in the do-minimum case. The cost of the “standard” accident for both operations and the % covered by insurance are also necessary. This part would represent a transfer with the insurance companies, and the rest an economic cost to be absorbed by the operator. The cell could be divided into two parts, if these two parts differ substantially.
CRITICAL ISSUES:
Quantification of accidents (through statistic studies).
REMARKS:
Users are usually covered by separate insurance.

R A I L P A G R a i l w a y P r o j e c t A p p r a i s a l G u i d e l i n e s – A n n e x e s78
C SE cells
Economic and
financial cell
STAKEHOLDER
LOCAL, REGIONAL – NON USERS(EXTERNAL)
EFFECT DESCRIPTION:
SAFE
TY /
ACCI
DEN
TSU
SER
SERV
ICE
Valuation of additional accidents suffered by non-users of transport modes present in the corridor.
CALCULATION:
The difference between the alternatives for the economic cost for external elements:
[Risk of mortal accidents (number of deaths/pass·km) x Valuation deceased (€/deceased) x Traffic (pass·km)] +
[Risk of serious accidents (number of serious casualty/passr·km) x Valuation serious injuries (€/serious casualty) x Traffic (pass·km)] +
[Risk of minor accidents (number of slight casualties/pass·km) x Valuation slight injuries (€/slight casualty) x Traffic (pass·km)] +
[Risk of pure-damage accidents (number of accidents/pass·km) x Average valuation damages (€/slight casualty) x Traffic (pass·km)]
SOME VALUES:
Needs a case-by-case assessment.
CRITICAL ISSUES:
Quantification of risks (through statistic studies) and valuation of deceased, seriously injured and slightly injured non-users.
REMARKS:
This is particularly important for specific safety projects such as elimin ation of rail-road crossings. In most cases the impact of rail projects on non-users is very small. The reduction in the number of pedestrian and cyclists that are run over as a consequence of road traffic transferred to rail could, only in special circumstances, be substantial.

R A I L P A G R a i l w a y P r o j e c t A p p r a i s a l G u i d e l i n e s – A n n e x e s 79
Financial transfer cell
STAKEHOLDER
TRANSPORT SERVICE OPERATORS, INFRASTRUCTURE MANAGERS & GOVERNEMENT
EFFECT DESCRIPTION:
SUBS
IDIE
SO
PERA
TIO
N
NPV of changes in subsidies of Government to operators and infrastructuremanagers.
CALCULATION:
The real amount of subsidies arriving to the beneficiaries could have to be increased by the expenditure for the public agencies giving them (this would be a resource cost to be included if there is a differential between alternatives).
CRITICAL ISSUES:
Subsidies (except if concomitant public expenditure is very big) are pure financial transfers). It must be shown if the project allows reduced subsidiessomewhere else in the system (for instance, in other public transport modes).

R A I L P A G R a i l w a y P r o j e c t A p p r a i s a l G u i d e l i n e s – A n n e x e s80
C SE cells
Economicand
financial cell
STAKEHOLDER
INFRASTRUCTUREMANAGER
EFFECT DESCRIPTION:
INVE
STM
ENT
ASS
ETS
NPV of the differential investment to be carried out by the infrastructure manager. Economic costs are included here.
CALCULATION:
The economic costs can be established as the contract cost for the rail manager (if he is doing the investment). This would include a normal profitfor manufacturers and constructors, that can be estimated as a certain percentage (5 to 15%) of the investment. If the profit is exceptional or it is important to indicate it, a separate column for the construction company must be envisaged and a reasonable economic cost plus a transfer to the company included in the matrix. Taxes are considered separately.
SOME VALUES:
Case-by-case.
CRITICAL ISSUES:
Proper design and pricing. Key element in the appraisal.
REMARKS:
Inside this concept of investment is included the cost of land: it is transference between Government and non-user. It is calculated through the price of expropriation. It is important to separate this cost when expropriation is a major cost component.
The tax issue is particularly important here. See discussion on cost of public money.

R A I L P A G R a i l w a y P r o j e c t A p p r a i s a l G u i d e l i n e s – A n n e x e s 81
Economicand
financial cell
STAKEHOLDER
OPERATORS, CONTRACTORS AND SUPPLIERS & INFRASTRUCTUREMANAGERS
EFFECT DESCRIPTION:
MA
INTE
NA
NCE
(RO
UTI
NE)
ASS
ETS
NPV of differences in routine maintenance costs. It is generally considered that the operator is in charge of maintenance works of rolling stock and the infrastructure manager of the maintenance of infrastructure. These works can be done by those stakeholders (hypothesis i) or by contractors (hypothesis ii).
CALCULATION:
i) Only considers costs for operators and infrastructure managers.
ii) Includes a benefit for contractors calculated as a percentage of totalmaintenance cost (5 to 15%). Contractors are supposed to have specialised staff and machinery, and improved management in contrast with operators and infrastructure managers, which allows better economic efficiency.
SOME VALUES:
* Track and infrastructure maintenance
From 10,000 to 15,000 €/line km/year
* Turnouts maintenance
From 8,000 to 12,000 €/line km/year
* Electrification installation maintenance
From 5,000 to 8,000 €/line km/year
CRITICAL ISSUES:
Maintenance costs.
REMARKS:
Periodic major maintenance included in investment costs.

R A I L P A G R a i l w a y P r o j e c t A p p r a i s a l G u i d e l i n e s – A n n e x e s82
C SE cells
Quantified socio-economic cell
STAKEHOLDER
LOCAL, REGIONAL – NON USERS(EXTERNAL)
EFFECT DESCRIPTION:
NO
ISE
AN
D V
IBRA
TIO
NEN
VIRO
NM
ENTA
L –
EXTE
RNA
L EF
FEC
TS
Differences in the amount of noise and vibration between the project and the do-minimum alternative.
CALCULATION:
Example:
Direct estimation:
Reduced noise (average dB(A)) x Affected railway neighbours
Reduced vibrations (average m/s2) x Affected railway neighbours
These figures could be converted into monetary values
SOME VALUES:
In Germany a cost of 19 €/dB(A) is accepted to reduce intensity down to a 55 dB(A) level. As a European reference, an average value of 3.9 €/1000 pax-km and 3.5 €/1000 t-km have been estimated as costs associated with noise generated by railways.
CRITICAL ISSUES:
Estimation of noise and vibrations. Valuation.
REMARKS:
The cost associated with noise can be estimated according to the investment in elements for acoustic screening, in health expenditure produced by the diseases associated with this effect or by declared preferences, a method that calculates the amount the community is willing to pay to avoid this kind of illness. In the European Union there are several established methods for measuring intensity of noise and various regulations fixing target values depending on the area (urban area or rural one). Pro ject appraisals have to take into consideration whether noise and vibration level are in accordance with limits defined by regulations.

R A I L P A G R a i l w a y P r o j e c t A p p r a i s a l G u i d e l i n e s – A n n e x e s 83
Case studies
This annex presents different case studies, reflecting a whole range of rail investments, which have allowed the improvement of the RAILPAG Guidelines and can now be used to illustrate their practicality:
Page
Case Study 1 – Line upgrading 86
Case Study 2 – Line renewal 92
Case Study 3 – Bottleneck removal 98
Case Study 4 – Interoperabillity 100
Case Study 5 – Line electrification 102
Case Study 6 – Level crossing elimination 104
Case Study 7 – Link to terminal 110
Case Study 8 – Rail terminal development 116
Case Study 9 – Line closure 124
Case Study 10 – Construction of a new high-speed rail line 126
The spreadsheets, which may be updated in the future, can be download from the webside (www.railpag.com). Some other case studies will be added through the RAILPAG website to this first selection, notably with the contribution of sector professionals
All spreadsheets contain the corresponding SE Matrix for illustration purposes. In simple cases a discussion on re-distribution impacts should be sufficient to complete the appraisal.
D

R A I L P A G R a i l w a y P r o j e c t A p p r a i s a l G u i d e l i n e s – A n n e x e s84
D 1
Case Study 1 - Line upgrading
This is a simplified case based on assumed data.
1. Main purpose of the project
To upgrade the railway line between A and B to improve the layout for higher speeds and to reduce the distance and thereby the duration of travel by train as well as the train operating costs.
2. Technical characteristics of current situation
The distance between A and B by rail is at present 200 km, and the time of travel is 2 hours; the railway is only used by passengers.
The two places are also connected by road, with travellers making on average 230 km door-to-door. There is no congestion on the road in the “do-minimum” situation.
3. Project description
The investment provides new sections (some of them including tunnels) where the old layout was poor and increases the radius of some curves. It reduces the distance between A and B to 180 km by railway and results in a travel time saving of 30 minutes.
4. Demand
A comprehensive forecasting model, covering mainly road and rail, has been used. Before the investment, on an average day, there are 2000 rail journeys and 4000 journeys by car between the two towns. The composition of types of journeys is the same on both modes, viz. 75% private and 25% business trips. The occupancy of a car is 1.7 persons, on average.
If the project is carried out, then there will be 700 additional journeys by train, of which 400 will be diverted from car transport and 300 will be genuinely new traffic.
Demand is expected to have a modest growth during the first 10 years and remain constant thereafter.
5. Costs
Investment
The investment is costed at 250 million € exclusive of VAT. The investment, to be made full in year zero, will have a 40 year life span and a residual value of 50%.
In the “do-minimum” situation there is a need for reinvestment, mostly in track renewal and electrification in order to allow the current level of service to be retained, estimated at 50 million €, excl. of VAT. It is also expected to have a life of 40 years, with a residual value of 20%.
Maintenance and operation
Maintenance cost of the track is assumed to be determined by a fixed amount (11000 € per km/year) plus a variable amount related to train production (€0.25 /train x km). Maintenance costs are reduced in the project on account of the reduced distance.
Line upgrading

R A I L P A G R a i l w a y P r o j e c t A p p r a i s a l G u i d e l i n e s – A n n e x e s 85
Train operating costs are also reduced on account of reduced distance, but there are more trains, due to increased patronage. Additional traffic involves some additional costs (sales, etc.) per passenger, estimated at 0.2 €/pass.
Track charges
Revenues from track charges (3 € /train x km) are paid to the rail manager. The increase in the number of trains outweighs the reduction in distance, so the rail manager will receive additional (even if very modest) income.
6. Benefits
The method used identifies and measures all the changes in consumers’ and producers’ surpluses that the project gives rise to. In addition, effects on the fiscal balance of the government are taken into account and valued and external effects are also measured and valued.
User benefits
The benefits for the existing traffic are, in this case, assumed to be due entirely to time savings, with no improvements in comfort, reliability or other service characteristics. The train fare for the journey is assumed to be the same with and without the project, so the financial cash flow between the existing rail users and the operator is not modified.
There is diverted traffic from road to rail due to the perceived reduction in generalised costs. The benefit for society from diverted users is measured as the difference between the resource costs of their travel by road (time, operating costs and accidents) and the cost of rail transport (time, accidents and the cost of producing the rail trip, which is included in the operating costs of the rail line) plus the differences in externalities. In this case, the potential costs or benefits related to different quality of service between road and rail, such as comfort, reliability, etc. are not included.
The value of the change in the surplus for generated traffic, for which the minimum willingness to pay for the trip was not known, is measured from the surplus of existing traffic with the rule of the half.
External effects
The CBA should take full account of the external effects produced by the project due to changes in modal split and generated traffic. The external effects include, in this case, not internalised (insurance-covered) accident costs, noise and gas pollution and global warming effects. The project is assumed not to have any additional external effects such as railway accidents, as their frequency is negligible. The reduction in train x km due to the shorter distance and same number of trains/day, will have positive impacts on emissions as a consequence of less energy consumption. Positive external effects (reduction of emissions and non-covered accident costs) due to reduced number of car trips are included. The negative impacts are due to the construction works and the occupation of land for the new layout. These are relatively minor and mitigated by the measures required by the EIA and included in the project investment cost.
7. Results of Economic analysis
The project shows a reasonable economic rate of return, at 5.8%, which could justify the investment. As most benefits are due to time-savings, the profitability of the project is most sensitive to the value of travel time. The suitability of the value adopted (for instance, with good information on the purpose of travel) must be ensured. The robustness of the investment cost estimate is also critical to ensure the feasibility of the project.

86 R A I L P A G R a i l w a y P r o j e c t A p p r a i s a l G u i d e l i n e s – A n n e x e s
D 1
8. Results of Stakeholder analysis
The case demonstrates that rail improvement projects could have a very negative impact on rail managers if they charge operators purely on train x km. The reduction in distance finally represents a reduction in revenue for the infrastructure manager. The rail operator is also making a loss on the project in spite of a major improvement of the service, increase in users and reduced travel distance. This is an indication of excessively low fares (which have been assumed to remain constant, although in the traditional fare calculation system based on distance it could even be reduced in spite of providing better service) or high operating costs. Essentially, in this case, rail users are the main beneficiaries of the project, along with some external effects that would benefit those suffering from road traffic and the population at large (greenhouse effect). On the other hand it will create some nuisances for those living close to the railway and also affect the landscape.
The impacts on the national government are very modest if its allocations to the rail manager are not included.
9. Comments
The case could be further refined taking into account a more complex demand situation and more complex funding schemes, but it is useful to indicate that, to balance the stakeholders impacts, there is a need to have a relatively flexible (and complex) fare and track charges policy.
Line upgrading

R A I L P A G R a i l w a y P r o j e c t A p p r a i s a l G u i d e l i n e s – A n n e x e s 87
ECONOMIC EVALUATION
NPV Rate Year3.00% 1 2 40
INVESTMENT & MAINTENANCE; m €Rail infrastructureProject cost to Rail manager 290.0 290.0 0.0 0.0 0.0Investment; project economic cost 250.0 250.0 0.0 0.0 0.0VAT revenue to National gov’t 40.0 40.0 0.0 0.0 0.0Residual value; project (50% end of period) 38.3 0.0 0.0 0.0 125.0Cost to Rail manager; do-min 58.0 58.0 0.0 0.0 0.0Investment; do-min; economic cost 50.0 50.0 0.0 0.0 0.0VAT revenue to National Gov’t 8.0 8.0 0.0 0.0 0.0Residual value; do-min 3.1 0.0 0.0 0.0 10.0
Net investment: financial cost to Rail manager 232.0 232.0 0.0 0.0 0.0Net investment cost (econ) 200.0 200.0 0.0 0.0 0.0Net VAT revenue to National government 32.0 32.0 0.0 0.0 0.0Net residual value 35.3 0.0 0.0 0.0 115.0
Maintenance cost to Rail manager -3.2 0.0 -0.15 -0.15 -0.13
Total financial cost 193.5 232.0 -0.2 -0.2 -115.1Total economic cost 161.5 200.0 -0.2 -0.2 -115.1
BENEFITS; thousand €UsersTrain users
Existing trafficTravel time savings 190.8 5.1 5.3 12.7
Diverted traffic from carsReduction in car operating costs 82.2 3.6 3.6 3.6Travel time savings 6.4 0.2 0.2 0.4Safety improvements 45.7 2.0 2.0 2.0Additional revenue for train operator 57.4 2.5 2.5 2.5Reduction in petrol taxes 23.3 1.0 1.0 1.0
Generated trafficUser benefit 79.6 2.5 2.6 4.0Additional revenue for train operator 55.6 1.9 1.9 2.6Additional VAT 8.9 0.3 0.3 0.4
Service providersTrain operator
Additional operating costs 115.5 3.7 3.7 5.5Impact on revenues 113.0 4.3 4.4 5.1Track charges -13.7 -0.4 -0.4 -0.7
ExternalitiesReduction in emissions (cars)
Total economic benefits 289.16 0.00 9.67 9.95 17.15Economic benefits-costs 127.62 -200.00 9.82 10.10 132.28
ERR = 5.8%

R A I L P A G R a i l w a y P r o j e c t A p p r a i s a l G u i d e l i n e s – A n n e x e s88
D 1
Supporting information for economic evaluationCosts
Indirect tax factor 1.16
Residual value after 40 years 50%
Maintenace cost per km; thousand €/year 11.00
Marginal maintenace cost per train x km 0.30 euro
Share financed by rail manager 100%
Track charges per train x km 3 euro
DemandRail users before 2% growth 10 years 730000 744600 907663
Rail users after 985500 1005210 1225345
Net rail traffic gain 255500 260610 317682
Transferred from cars 0% growth 146000 146000 146000
Generated traffic 3% growth 10 years 109500 112785 151574
ProductionTrains per year before additional train/30000 6570 6570 7300
Trains per year after 7300 7300 8395
Distance present, km 200
Distance after; km 182
Train-km before; million 1.31 1.31 1.46
Train-km after; million 1.46 1.46 1.68
Consumers’ surplus dataDistance for road to train passengers 203 km
Travel time savings for existing rail users 0.50h
Travel time savings for road to train travellers 0.10 h Train/car
Value of travel time; commuter 10 €/h 0%
Value of travel time; business 20 €/h 50%
Value of travel time; leisure 7 €/h 50%
Average value of time 13.5 13.99 14.24 28.05
Growth in VOT pa 1.80%
Car occupancy 1.70
Reduction in accident costs 0.10 €/carxkm
Operating costs Costs per additional users (sales, etc.); million € 0.20 euro/pass 0.05 0.05 0.06
Train operating cost; per train x km 25 euro
Investment in train sets; annuity; 000 € 250
Operating costs car per pass x km 0.11
Fuel taxes 0.03 €/pass x km
Line upgrading

R A I L P A G R a i l w a y P r o j e c t A p p r a i s a l G u i d e l i n e s – A n n e x e s 89
Ra
il us
ers
Road
to ra
il us
ers
Gen
erat
ed tr
affic
Ra
il op
er.
Rail
man
ager
Lo
cal n
on u
ser
Nat
iona
l gvt
EC
ON
OM
IC V
ALU
E
USE
R SE
RV
ICE
Trav
el ti
me
190.
8 6.
4
197.
2
Safe
ty
45
.7
45
.7
Con
s. s
urp
lus
(new
traf
fic)
79.6
79
.6
OPE
RAT
ION
Trac
k ch
arge
s
13.7
-1
3.7
0.0
Road
op
erat
ing
cost
s
82.2
82.2
Rail
oper
atin
g co
sts
-1
15.5
-115
.5
Fare
s
-57.
4 -5
5.6
113.
0
0.0
Taxe
s (f
uel);
VAT
23.3
-8
.9
-1
4.4
0.0
ASS
ETS
In
fras
truc
ture
-2
00.0
-2
00.0
Resi
dual
val
ue
35.3
35
.3
Taxe
s
-3
2.0
32
.0
0.0
Infr
astr
uctu
re m
aint
enan
ce
3.2
3.2
Air
pol
lutio
n
Clim
atic
cha
nge
ECO
NO
MIC
PR
OFI
TAB
ILIT
Y
1
90.8
100.
115
.111
.2-2
07.2
17.6
127.
6
ERR
= 5
.8%

R A I L P A G R a i l w a y P r o j e c t A p p r a i s a l G u i d e l i n e s – A n n e x e s90
D 2
Case Study 2 - Line renewal
This case refers to a real case in a EU member state, originally prepared during the second part of the 1990’s. Most of the data have been generated by the promoter of the project when
it was appraised. Some additional data have been introduced as part of the case.
1. Main purpose of the project 1
Renewal of a 386 km railway line between three cities A, B and C to allow for increased speeds of passenger trains and the introduction of high-speed trains operating at a speed of up to 200 km/h. For simplicity, it is assumed that short-distance passenger and freight traffic is not affected by the project.
2. Technical characteristics of current situation
• Track on parts of the line between A and B is more than thirty years old, and traffic is very dense. In the absence of investments, it would be necessary to scale up maintenance significantly, yet it would still be necessary to impose speed restrictions on parts of the line in the near future and these sections would gradually grow in number and length, and would likely have significant cost and revenue implications for rail operations;
• The track on the B to C section is approaching 30 years, and unless investments are made sometime in the future, maintenance costs would increase significantly and it would be necessary to impose speed restrictions on sections of the line, and these sections would gradually grow in number and length.
The do-minimum case represents, in principle, the minimum investments required to keep the A-B and B-C sections of the line open to traffic at current speeds and capacity. They include some major maintenance works.
3. Project description
The project comprises the upgrading of the permanent way of the 187 km double-track section A to B (including 11.5 km of new alignment) and of the 159 km single-track section B to C, allowing an overall speed increase from 140 km/h to 160 km/h and even to 200 km/h on some parts of the line. The capacity of the single track section is estimated at about 80 trains/day and of the double track section at about 200 trains/day. In the project situation, it is assumed that high-speed train services, requiring adapted rolling stock, will be introduced.
4. Demand
Passengers
The data in Table 1 reflect million single trips. Year 1 is the first year of investment, and the new services will be introduced in year 8.
Table 1: Passenger forecast; million trips per annum
Year 2 6 7 8 16 37 A-B; project case 7.6 7.9 7.9 9.1 10.1 13.4 A-B; do-minimum case 7.6 7.9 7.9 7.9 7.9 7.9 B-C; project case 2.1 2.2 2.2 2.7 3.0 4.0 B-C; do-minimum case 2.1 2.2 2.2 2.2 2.2 2.2
1 Whilst the data used in this example are assumed to be reasonable, they should not be applied to a real situation, for which the analyst should obtain relevant data.
Line renewal

R A I L P A G R a i l w a y P r o j e c t A p p r a i s a l G u i d e l i n e s – A n n e x e s 91
The forecast of passengers travelling with high-speed trains are set out in Table 2.
Table 2: Forecast of traffic on high-speed trains; million trips per annum
Train plan and train production
Based on these demand forecasts, as well as the capacity of the trains, the train plan in Table 3 is assumed to apply: It reflects an average load factor of 80%. The average distance travelled by high-speed passengers is estimated to be 170 km on the A-B line and 150 km on the B-C line. An average trip with a long distance train is 135 km between A and B and 150 km between B and C. The cap acity of a high-speed train is 280 passengers, while a long-distance train with 5 passenger cars can accommodate 450 passengers. Trips on the A-B and B-C lines may be part of the same journey.
Table 3: Future train plans and train production
5. Costs
Investments
Infrastructure
The investment expenditures in infrastructure in the two alternatives during years 1 to 8 are set out in the cost-benefit table.
The investments are assumed to have a residual value of 10% after the end of the entire project period, assumed to be 38 years, 8 of investment and 30 years of operation. Some investments are made also in year 8, i.e. during the first year of the new services.
Rolling stock
A high-speed train costs about € 12.2 million and a complete 5-wagon long-distance train costs about € 8.7 million. The initial locomotives and rolling stock investment, and its replacement, are introduced in the CBA as annuities calculated by assuming an 8% real rate of interest and a 25 year technical life. This method is adopted in view of the fact that the trains on the lines A-B and B-C are part of a large fleet of trains used in the whole rail network.
Maintenance and operating costs
These costs reflect only additional routine maintenance of the rails and catenary, as the other routine maintenance costs are assumed to remain at a similar level and major maintenance needed in the do-minimum alternative are included in the investment. In the project case incremental costs for the additional traffic have been calculated on the basis that each gross tonne-km gives rise to additional maintenance cost at € 0.002.
Year 8 16 37 A-B 2.20 2.45 3.27 B-C 0.57 0.65 0.90
Year 8 16 37
Trains M km M g.t.km Trains M km M g.t.km Trains M km M g.t.km
A-B Project LD 27 1.84 896 30 2.05 995 40 2.73 1327
HS 27 1.84 625 30 2.05 694 40 2.73 925
Total 54 3.68 1521 60 4.10 1689 80 5.46 2252
A-B Do-min. LD 41 41 2.80 1360 41 2.80 1360
B-C Project LD 16 0.93 451 18 1.04 508 24 1.39 677
HS 7 0.41 138 8 0.46 157 11 0.64 216
Total 23 1.34 589 26 1.50 665 35 2.03 893
B-C Do-min. LD 16 0.93 451 16 0.93 451 16 0.93 451

R A I L P A G R a i l w a y P r o j e c t A p p r a i s a l G u i d e l i n e s – A n n e x e s92
Train maintenance and operating costs
The operating costs (personnel, energy and maintenance) are reflected in Table 4.
Table 4: Assumptions used to calculate train costs
Further details are provided in the cost-benefit table.
6. Benefits
The economic analysis is a conventional one. The change in the consumers’ surplus takes into account the improvement of the quality of service (speed, comfort and convenience). The rule of the half has been applied, in this case, both to generated and diverted traffic (assumed to be 60% and 40% of the new traffic). The utility of the project for diverted traffic is estimated as the fare plus half of the time savings to existing rail users (the estimated surplus). This approach is used due to the lack of precise information on the trips (and their cost) of those changing modes, so the rule represents an acceptable proxy for the real economic benefits (the fare is a proxy for the foregone car operating costs). The reduction in fuel taxes from diverted cars (note that there is no effect on freight traffic) is (roughly) estimated from the number of diverted pass x km.
The rail manager is paying value added taxes to the National Government. The rail operator is assumed to pay track charges to the rail manager.
To be noted is that rail users pay a surcharge for using the high-speed train services. This charge must be inferior to the value of saved time plus the additional comfort and convenience offered by the high-speed services. Also to be noted is that the effects to remaining road users of traffic diverted from road to rail are not reflected in the analysis. This reflects the assumption that, at present, there is no congestion on the roads.
The project produces some positive external effects due to the diversion of car traffic to rail, mitigated by some additional costs incurred by rail in the form of additional emissions and accidents due to additional traffic and higher speeds.
Time savings
The following country specific values of time are used:
Business: 22 €/h
Commuting: 9 €/h
Leisure: 5 €/h
When calculating the value of time savings, adjustment has been made to consider expected future growth in real incomes. The values of time are assumed to increase by 1.5% p.a. during the period years 1 to 8 and by 1.0% p.a. between years 9 and 37. On the A-B line it is estimated that about 25% of the trips are on business, 25 % is in commuting, and 50% on leisure. The total demand on the B-C line is composed of 15% business trips, 25% commuter trips and 60% leisure trips.
When calculating the value of time savings for the A-B line, the average time saving is assumed to be 18 minutes. For the B-C line the average time saving has been estimated at 15 minutes. The same assumptions apply to generated and diverted traffic.
Revenues
The average revenue per km in long-distance traffic is assumed to be € 0.07. It is expected that a surcharge of about 15% will be imposed on passengers travelling by high-speed trains. It is further assumed that the surcharge on the A-B and B-C lines will generate € 0.013 per passenger-km, and that this additional charge will be implemented in a way - and through market segmentation - that it has marginal effect on the demand for travel (and therefore can be ignored for the purposes of economic analysis).
Capital cost Operating cost Utilisation of a train € million per train and year €/km average km per day
LD 0.51 5.74 400
HS 0.78 6.26 700
D 2Line renewal

R A I L P A G R a i l w a y P r o j e c t A p p r a i s a l G u i d e l i n e s – A n n e x e s 93
Track charges
It is assumed that the rail operator has to pay a €0,003 non-taxed charge per gross tonne-km to the rail manager for use of the track.
Accidents and emissions
In the project case, additional economic costs will be incurred by the additional train traffic in the form of accidents and emissions, of the order of € 0.17 per train-km for accidents and € 0.0004 per gross tonne-km for emissions. The additional rail accidents will be borne by the rail operator (as its insurance premium is related to its train x km). The external component of reduced road accidents are estimated from pass x km of diverted traffic (the internal component is included in the consumer surplus).
7. Results of Economic analysis
The project shows a modest rate of return, close to 5%, that would require in depth analysis of the various parameters, notably through sensitivity analysis, to ensure that the project is economically feasible. Considered discount rate was 5%.
8. Results of Stakeholder analysis
The main beneficiaries are the rail passengers and the rail operator. The rail manager incurs losses about equal to the net investments that must be made. The track charges just cover the variable maintenance costs for the line.
9. Comments
This investment is highly dependent on the following:
• the investment required in the do-minimum alternative
• increase in demand on account of the improved services
• the values of time used.
There is hence a special need to ensure that the technical definition of the project is the most suitable (analysing other renewal possibilities), and also that forecasts and values of time are reasonable.

R A I L P A G R a i l w a y P r o j e c t A p p r a i s a l G u i d e l i n e s – A n n e x e s94
D 2
ECO
NO
MIC
EVA
LUAT
ION
N
PV
Rate
Ye
ar
5%
1
2 3
4 5
6 7
8 9
10
20
30
38IN
VES
TMEN
T &
MA
INTE
NA
NC
E; m
€
Rai
l in
fras
tru
ctu
re
Proj
ect c
ost t
o R
ail m
anag
er
2544
348
378
485
512
521
380
329
154
0 0
0 0
0In
vest
men
t; p
roje
ct e
cono
mic
cos
t 21
67
29
6 32
2 41
3 43
6 44
4 32
4 28
0 13
1 0
0 0
0 0
VAT
reve
nue
to N
atio
nal g
ov’t
377
52
56
72
76
77
56
49
23
0
0 0
0 0
Resi
dual
val
ue; p
roje
ct (1
0% e
nd o
f per
iod)
34
0 0
0 0
0 0
0 0
0 0
0 0
217
Cos
t to
Rai
l man
ager
; do
-min
16
91
17
6 23
4 29
9 29
6 26
1 23
0 15
3 29
29
29
29
29
29
Inve
stm
ent;
do-m
in; e
cono
mic
cos
t 14
41
15
0 19
9 25
5 25
2 22
2 19
6 13
0 25
25
25
25
25
25
VAT
reve
nue
to N
atio
nal G
ov’t
251
26
35
44
44
39
34
23
4
4 4
4 4
4Re
sidu
al v
alue
; do-
min
23
0 0
0 0
0 0
0 0
0 0
0 0
144
Net
inve
stm
ent:
fin
anci
al c
ost t
o R
ail m
anag
er
853
17
2 14
4 18
5 21
6 26
1 15
0 17
6 12
4 -2
9 -2
9 -2
9 -2
9 -2
9N
et in
vest
men
t cos
t (ec
on)
726
14
6 12
3 15
8 18
4 22
2 12
8 15
0 10
6 -2
5 -2
5 -2
5 -2
5 -2
5N
et V
AT re
venu
e to
Nat
iona
l gov
ernm
ent
126
25
21
27
32
39
22
26
18
-4
-4
-4
-4
-4
Net
resi
dual
val
ue
11
0
0 0
0 0
0 0
0 0
0 0
0 73
Mai
nte
nan
ce c
ost t
o R
ail m
anag
er
13
0
0 0
0 0
0 0
1 1
1 1
2 3
Tota
l fi n
anci
al c
ost
854
172
144
185
216
261
150
176
125
-29
-29
-28
-27
-99
Tota
l eco
no
mic
cos
t72
814
612
315
818
422
212
815
010
7-2
4-2
4-2
4-2
3-9
5
BEN
EFIT
S; m
illio
n €
U
sers
Tr
ain
user
s
Ex
istin
g tr
affic
Tra
vel t
ime
savi
ngs
400
0
0 0
0 0
0 0
32
33
33
36
40
43
D
iver
ted
traf
fic fr
om c
ars
U
tilit
y (s
urp
lus
+ fa
re)
190
0
0 0
0 0
0 0
8 8
9 17
27
36
S
afet
y im
pro
vem
ents
(ext
erna
l) 23
0 0
0 0
0 0
0 1
1 1
2 3
4
Add
ition
al re
venu
e fo
r tra
in o
pera
tor
160
0
0 0
0 0
0 0
7 7
8 15
22
29
R
educ
tion
in p
etro
l tax
es
46
0
0 0
0 0
0 0
2 2
2 4
6 8
Gen
erat
ed tr
affic
Use
r ben
efit
327
0
0 0
0 0
0 0
13
15
16
30
46
61
Add
ition
al re
venu
e fo
r tra
in o
pera
tor
240
0
0 0
0 0
0 0
10
11
12
22
33
44
Add
ition
al V
AT
42
0
0 0
0 0
0 0
2 2
2 4
6 8
Add
ition
al a
ccid
ents
cos
ts ra
il us
ers
3
0 0
0 0
0 0
0 0
0 0
0 0
0In
crem
enta
l rev
enue
s; h
igh-
spee
d tr
ains
78
0 0
0 0
0 0
0 6
6 6
7 8
9
Add
ition
al V
AT
14
0
0 0
0 0
0 0
1 1
1 1
1 2
Serv
ice
pro
vid
ers
Trai
n op
erat
or
Add
ition
al o
per
atin
g co
sts
256
0
0 0
0 0
0 0
13
14
15
23
33
42
A
dd. a
ccid
ent c
osts
bor
ne b
y ra
il op
erat
or
1
0 0
0 0
0 0
0 0
0 0
0 0
0
Im
pact
on
reve
nues
47
8
0 0
0 0
0 0
0 23
24
26
44
64
82
Trac
k ch
arge
s 20
0 0
0 0
0 0
0 1
1 1
2 3
4Ex
tern
al e
ffec
ts (p
osit
ive)
20
0 0
0 0
0 0
0 1
1 1
2 3
4Ex
tern
al e
ffec
ts ra
il; e
mis
sion
s 3
0
0 0
0 0
0 0
0 0
0 0
0 1
Exte
rnal
eff
ects
road
; red
uced
em
issi
ons
23
0
0 0
0 0
0 0
1 1
1 2
3 4
Tota
l eco
no
mic
ben
efi t
s70
00
00
00
00
4143
4564
8610
6Ec
on
om
ic b
enefi
ts-
cost
s-2
7-1
46-1
23-1
58-1
84-2
22-1
28-1
50-6
567
6987
109
201
ERR
= 4
.8%
Line renewal

R A I L P A G R a i l w a y P r o j e c t A p p r a i s a l G u i d e l i n e s – A n n e x e s 95
Ra
il us
ers
Road
to ra
il us
ers
Gen
erat
ed tr
affic
Ra
il op
er.
Rail
man
ager
Lo
cal n
on u
ser
Nat
iona
l gvt
EC
ON
OM
IC V
ALU
E
USE
R SE
RV
ICE
Trav
el ti
me
400.
2
40
0.2
Safe
ty
-2.9
22
.8
-1
.0
19
.0
Con
s. s
urp
lus
(new
traf
fic)
19
0.0
326.
7
51
6.6
OPE
RAT
ION
Trac
k ch
arge
s
-19.
6 19
.6
0.0
Road
op
erat
ing
cost
s
-255
.6
-2
55.6
Fare
s -7
8.1
-159
.9
-239
.8
477.
7
0.0
Taxe
s -1
3.6
45.7
-4
1.7
9.
6 0.
0
ASS
ETS
In
fras
truc
ture
-7
26.2
-7
26.2
Resi
dual
val
ue
11.4
11
.4
Taxe
s
-1
26.4
126.
4 0.
0
Infr
astr
uctu
re m
aint
enan
ce
-13.
0
-1
3.0
Emis
sion
s
20.2
20
.2
ECO
NO
MIC
PR
OFI
TAB
ILIT
Y
305
.798
.645
.220
1.6
-834
.620
.213
6.0
-27.
4
ERR
= 4
.8%

R A I L P A G R a i l w a y P r o j e c t A p p r a i s a l G u i d e l i n e s – A n n e x e s96
D 3
Case Study 3 – Bottleneck removal
The presentation of this case is limited to an identification of important aspects to be considered in a CBA of a bottleneck removal. The following will have to be taken into account:
1. Main purpose of the project
Bottleneck removal implies that a serious capacity limiting constraint is eliminated. The do-minimum alternative will entail minor modifications to the existing situation, thereby allowing the existing constraint to essentially remain. The constraint is likely to have significant implications for choice of route and mode, for passengers as well as freight. There will therefore often be a need to employ more sophisticated demand forecasting techniques than for an ordinary line upgrading. In addition, as a bottleneck can affect flows of traffic in many parts of the rail network, these forecasting models may have to cover a large area, and not be limited to the immediate area of the bottleneck.
2. Technical characteristics of current situation
When forecasting traffic consecutive to the removal of a bottleneck, it is important to consider the capacity constraints on the rest of the network. The growth of traffic on the section selected for appraisal may be constrained by capacity on distant points of the network in a way which is not apparent in the existing situation. Often, several bottlenecks must be removed at the same time or in rapid sequence to achieve the desired traffic growth. The project analyst must make sure that the “next most critical bottleneck” has been identified and does not prevent the envisaged traffic growth.
3. Project description
A bottleneck will typically be associated with congestion. Small deviations to train plans (train delays) will result in the need to readjust train schedules significantly. A removal of the bottleneck will hence often have significant repercussions on reliability. The improvement in reliability will affect the costs of the rail operators, and these savings could be significant but difficult to trace and measure. Improvement in reliability will also lead to shorter travel times and so to an improvement in the welfare of travellers over and above average time savings. These improvements will have to be valued separately and accounted for in the analysis, otherwise the real benefits of the project will not be covered. On the other hand attention must be paid not to double-count time savings under the “reliability” label.
4. Demand
The removal of serious capacity constraints may allow for the introduction of new strategies to serve the market on the part of rail operators. The investments may e.g. allow the introduction of new rail services which are better integrated from both an operating and the travellers point of view. There is therefore a need to consider new approaches to the supply of rail services and to evaluate their impact on costs, as well as their impact on demand and on user benefits.
5. Costs
Investments in the removal of a clearly identified single bottleneck can often be expected to yield high economic returns, but also to be financially beneficial for the train operators. Financial profitability could be more elusive for the infrastructure manager unless specific track access charges can be considered.
Bottleneck removal

R A I L P A G R a i l w a y P r o j e c t A p p r a i s a l G u i d e l i n e s – A n n e x e s 97

R A I L P A G R a i l w a y P r o j e c t A p p r a i s a l G u i d e l i n e s – A n n e x e s98
D 4Interoperability
Case Study 4 - Interoperability
The presentation of this case is limited to an identification of important aspects to be considered in the CBA of an interoperability project concerning the harmonisation of the train control and signalling system. However, it is important to point out that the need to ensure interoperability between railway systems could also include other items such as: • the gauge of the track• the voltage and type of electric systems• width and maximum length of wagons• couplings of wagons• maximum length of trains
A further example is the use of different types of traction; Case 5, for instance, focuses on the conversion of a line or a network of lines from diesel to electric traction.The case of ensuring interoperability between train control and signalling systems is especially important in view the new Community legislation in this area. In this case we assume that the interoperability dimension to be considered is the harmonisation of the train control and signalling system between the railway systems of two or more countries. A development of this nature will essentially entail investment in on-board and track-side equipment following new European standards in this area in order to allow cross-border operations of complete high-speed train sets but also of other types of trains.The following will have to be considered as part of the analysis of the benefits:
1. Main purpose of the project
User benefits: By allowing for cross-border operations, travellers save time because of smoother border crossings.
2. Technical characteristics of current situation
Operation benefits: Interoperability will allow for reduced costs of locomotives and rolling stock, which could benefit from standardisation and scale economies (see point 5). In addition, in many cases, the rotation of trains may be shortened allowing for reduced investments in train sets as well as reduced operating costs.
3. Project description
Network effects (non quantified): Some of the effects of an interoperability project could not be translated into specific elements within the project “boundaries”, as they are diffuse and may occur in parts of the network located far from the geographical location of the project itself. It could also affect overhead costs of the companies. Indeed, these aspects are those that have justified the EU interoperability regulations, which often require additional investments that are included in the CBA. Not taking into account all the benefits of these additional costs would bias the appraisal. It is therefore recommended to include them, even if, at this stage, it can only be in a qualitative way, in the SE matrix. There is a specific line for this and, lacking data, a colour code could be used. If this is a major qualitative impact of the project, the amount of benefits needed to reach a desirable rate of return could be used to appraise if they are reasonable.
4. Demand
If interoperability is introduced on a larger scale, and involving several countries, it may be necessary to evaluate the impact of reduced travel times by way of an econometric demand model to properly account for the impact on competing modes of transport and to take into account network effects.

R A I L P A G R a i l w a y P r o j e c t A p p r a i s a l G u i d e l i n e s – A n n e x e s 99
5. Costs
Fewer standards will strengthen competition between suppliers of rolling stock as well as train control equipment. Also, manufacturers will be able to produce longer series and thereby achieve cost reductions through economies of scale. These benefits are very difficult to capture, but cautious assumptions about possible cost reductions over time may be employed as a possible measure of these benefits.
6. Benefits
A new train control system will likely also show higher performance than the existing one, in effect allowing for a higher capacity on the lines where it is installed. The higher capacity is a benefit, which has to be evaluated although this may be difficult. The marginal cost of expanding the capacity of the system could possibly be used as a measure. To obtain a proxy of this cost it will be necessary to calculate the average incremental cost, i.e. what it would cost to expand the capacity of the existing line with conventional technology, e.g. by adding a track, and then divide by the number of train services this would allow for as a maximum.

R A I L P A G R a i l w a y P r o j e c t A p p r a i s a l G u i d e l i n e s – A n n e x e s100
D 5 Case Study 5 – Line electrification
Only the main elements of line electrification are identified here. Typically, electrification will allow conversion of diesel to electric traction on a subsystem (usually a line) of the network of a country. The following will have to be considered as part of the analysis of the benefits:
1. Main purpose of the project
Electrification will often allow travellers to save time because of elimination of need to change traction on their train, or by avoiding overlays. In addition, the rotation of trains may be shortened which could allow for reduced investments in train sets as well as reduced operating costs. Of course, the difference in operating costs of diesel and electric trains will have to be accounted for, in addition.
2. Technical characteristics of current situation
Electrification does not preclude the operation of some diesel traction on certain sections of electrified lines, which certain operators may prefer for some rail services if the cost of changing traction is not justified by operating cost savings for some short distance services.
3. Project description
If the conversion to electrification is on a large scale, and involving a large part of the network it may be necessary to evaluate the impact of reduced travel times by way of an econometric demand model to properly account for the impact on competing modes of transport.
4. Demand
Electrification will result in lower emissions of noise and air pollutants It is to be noted, however, that modern diesel electric trains are becoming much cleaner and more silent than older ones, which will have to be taken into account. Furthermore, the analyst should consider not only gross emissions but their actual impact. While the impacts on global warming do not depend on the location of the emission source, local and regional impacts obviously do.
5. Costs
Electrification may allow for the introduction of a different type of train, e.g. comprising a complete train set, which may be better suited to demand. As a consequence, additional time and operating cost savings may be achieved.
6. Benefits
Electrification can be a source of productivity for operators when it is justified by sufficient traffic flows on significant portions of networks. In financial terms, the outcome for operators and infrastructure manager will depend on the arrangements for the purchase of track access and energy and the actual level of the related charges.
Line electrifi cation

R A I L P A G R a i l w a y P r o j e c t A p p r a i s a l G u i d e l i n e s – A n n e x e s 101

R A I L P A G R a i l w a y P r o j e c t A p p r a i s a l G u i d e l i n e s – A n n e x e s102
Case Study 6 - Level crossing elimination
This is a realistic example in terms of the values used. The purpose is to show the application of CBA on a safety related intervention in the railways sector, but also to analyse in further detail the effects on stakeholders of a level crossing elimination. To this end additional assumptions,
over and above those employed in the other cases, are introduced.There are no taxes to be considered in this case.
1. Main purpose of the project 1
Removal of a level crossing in a rural area protected by an automatic barrier, through the construction of a flyover for vehicles to eliminate a safety hazard and unnecessary delays and costs.
2. Technical characteristics of current situation
Level crossing between a 2 lane country road and a single track rail line protected by centrally controlled automatic barriers that are closed for 2 minutes for every train passage. It requires a speed reduction of the trains (time loss of 0.2 minutes) and implies an average time loss of 1 minute for stopped road traffic. Road vehicles also suffer from the crossing in terms of comfort and additional operating costs (fuel spent – 0.08 litres per stopped vehicle – and some damage due to braking, vibrations, etc. that has not been considered).
In the do-minimum scenario this situation will continue.
3. Project description
Construction of a bridge over the rail line, which represents the least cost solution for separating road from rail traffic.
4. Demand
Road traffic: ADT: 400 cars and 100 trucks. 75% of traffic during 12 peak hours. No pedestrians or buses.
Rail traffic: 20 trains/day (80% passenger and 20% freight); 90% during 12 peak hours.
Traffic growth (per year): Trains 1%; cars 3%; trucks 4%.
Hypothesis: Demand is not affected by the project.
5. Costs
Investments
The total estimated cost of the proposed new bridge is 150 000 €. It will be built during the first year of the project life and will be paid by the infrastructure manager (40%) and the regional government (60%), as the project will be of benefit to both road and rail users/operators.
The project is assumed to have a residual value of 40% of its original asset cost after 20 years2.
1 Whilst the data used in this example are assumed to be reasonable, they should not be applied to a real situation, for which the analyst should obtain relevant data.
2 See discussion on residual values in the main text.
D 6 Level crossing elimination

R A I L P A G R a i l w a y P r o j e c t A p p r a i s a l G u i d e l i n e s – A n n e x e s 103
Maintenance and operating costs
In the do-minimum scenario: Barriers are assumed to require some manning from the control centre and specific attention from staff, assumed to be 20% of a full-time job for the infrastructure manager valued at 10000 €/year1. They also involve power consumption and specialised maintenance (including communication system). Rail track in crossings also need special maintenance. All this has been assumed to have a cost of 1000 €/year.
In the project scenario: All do-minimum maintenance and operating costs are eliminated, but the road administration will face some additional maintenance costs (assumed to be approx. 2% of investment cost: 3000 €/year).
6. Benefits
In addition to the elimination of operating costs for the barriers and specific costs of level crossing maintenance, the benefits are due to:
a) time savings from vehicles not being stopped (value of time: 12€/h car and 20 €/h truck) and increased speed of trains (this represents a time saving that has been valued at 3 €/hour per passenger; it is assumed that a passenger train has 100 passengers on average).
b) reduced operating costs of stopped vehicles (no impact on trains considered)2.
c) improved comfort for all road users (0.02 €/vehicle)
d) increased safety both for road and rail users, the value of which has been calculated based on the following assumptions:
1 Whilst the data used in this example are assumed to be reasonable, they should not be applied to a real situation, for which the analyst should obtain relevant data.
2 See discussion on residual values in the main text.
Accidents
Probability of death/severed injured/
slightly injured in level crossings
5.15·10-7/6.50·10-7/15·10-7accident/vehicles / day
Cost of fatal accident/severely injured/slightly injured
1,000,000 € / 100,000 € / 2,200 €
Estimated average cost borne by insurance companies
50% of average cost per road accident
100% of costs to train operators
Estimated cost for train operators10% of average cost
per road accident

R A I L P A G R a i l w a y P r o j e c t A p p r a i s a l G u i d e l i n e s – A n n e x e s104
7. Results of the Economic analysis
The cost/benefit analysis carried out is synthesised in the annexed table. Costs are essentially due to investment and maintenance.
The values in the economic analysis table reflect the NPV (at 5% discount rate) of the flows associated with the various items considered in the cost/benefit analysis. It can be seen that economic benefits come mostly from travel time savings and safety improvement, although other compon ents are also relevant, mostly operating costs. Non-quantified benefits (improved reliability and environmental externalities) are all positive.
A sensitivity analysis shows that increasing the train users’ value of time for marginal savings could have quite an impact. Doubling the value time for rail passengers (to 6€/h), would make them the main beneficiaries and total profitability would rise above 17%. In certain projects like this one, with small impacts on train schedules, it would be wise to analyse carefully both the real time improvements of the service and the value that could be placed on time savings. It is important to carefully evaluate accident risks and the value to be placed on reduced number of accidents.
8. Results of Stakeholder analysis
The values in the Stakeholder row are relevant to show who benefits the most from the project and who pays. In this case the regional government is taking most of the burden whilst the national government is obtaining some net gain through tax revenues. Insurance companies appear as major beneficiaries of the project (free riders).
The table shows how some of the economic cost and benefits can only be partially reflected in financial cash flows. For some stakeholders, however, the benefits (i.e. travel time savings) are not reflected in financial cash flows. The measure of stakeholder impact on the rail manager and rail operator in the bottom row reflect the financial impact on the rail businesses, independently of any subsidies (i.e. as if no regional subsidies were received, in this case) or expenditure by other stakeholders (for instance, for road maintenance). In this case a strong negative value indicates that subsidies are necessary to avoid that the economic benefits of the project imply a financial loss for the rail system.
It is also interesting to observe that, in the case of safety, the project will produce savings for the insurance company, which is assumed to keep the same level of income from road users and rail operators with the project. Road users will not benefit from the compensations insurance com panies would have to pay without the project due to accidents (negative cash flow for users) but will benefit from the economic value of accident reductions, which is assumed to be, in this case, twice the amount of the insurance compensations. For the rail operator and users (no severe injuries are assumed for them) it is assumed that insurance will cover the whole amount of damage, established at 10% of road economic costs.
A similar procedure has been applied for taxes, which have certainly a financial impact on stakeholders.
9. Comments
The analysis indicates a reasonable project, at 13% economic rate of return, with benefits distributed among users, essentially paid by a public authority (the regional government) and an important free rider, the insurance companies, that could be requested to contribute to finance level crossing elimination.
D 6 Level crossing elimination

R A I L P A G R a i l w a y P r o j e c t A p p r a i s a l G u i d e l i n e s – A n n e x e s 105
ECONOMIC EVALUATION
NPV Rate Year 3.00% 0 1 2 3 20COSTS Investment cost (fin.) 181500 181500 0 0 0 0 Rail manager contribution 66000 66000 Taxes paid by rail manager 6600 6600 Regional authority 99000 99000 Taxes paid by regional auth. 9900 9900
Investment; project economic cost 165000 165000 0 0 0 0 Taxes 16500 16500 0 0 0 0 Residual value 36543 0 0 0 0 66000 Maintenance road 53559 0 3600 3600 3600 3600
Total fi nancial cost 144957.4 181500 0 0 0 -66000Total economic cost 182016.3 165000 3600 3600 3600 -62400
BENEFITS Value of time savings 125202 0 7375 7494 7391 10062 VTS cars 20313 0 984 1024 1034 2005 VTS trucks 10157 0 492 512 517 1002 VTS train users 94733 0 5898 5957 5840 7055
Comfort improvement 71193 0 3760 3872 3988 6400 Safety improvements cars 125211 0 6068 6313 6374 12357 Operating costs saved 6446 0 312 325 328 636 Operating costs saved cars value 2763 0 134 139 141 273 Taxes saved cars 3683 0 179 186 188 364 Operating costs saved trucks value 691 0 33 35 35 68 Taxes saved trucks 921 0 45 46 47 91
Op. costs rail infrastructure 47054 0 3000 3020 3040 3392 Central operation 32176 0 2000 2020 2040 2392 Op & maint (barrier & rail) 14877 0 1000 1000 1000 1000 Safety rail (50/50 users & operator) 12521 0 607 631 637 1236
Financial benefi ts rail sector 47054 0 3000 3020 3040 3392
Economic benefi ts 384634 0 20977 21504 21607 33788
Financial benefi ts-costs -97904 -181500 3000 3020 3040 69392
Economic benefi ts-costs 202618 -165000 17377 17904 18007 96188
ERR = 11.7%
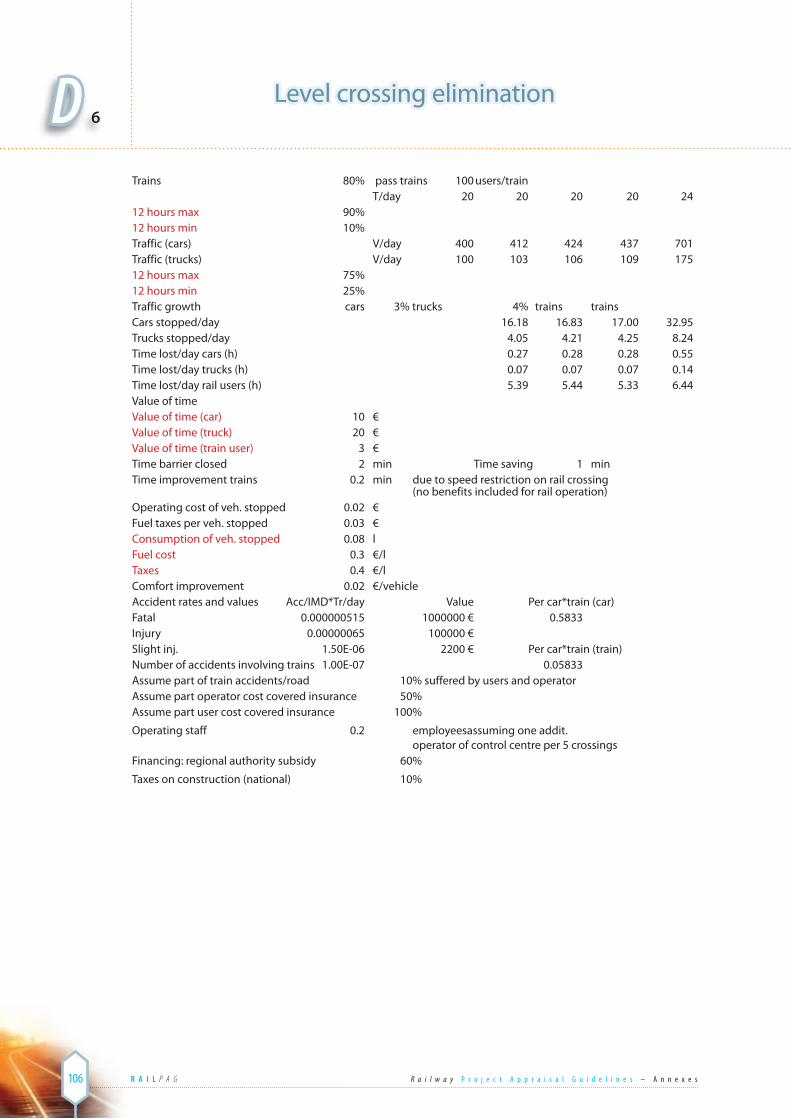
R A I L P A G R a i l w a y P r o j e c t A p p r a i s a l G u i d e l i n e s – A n n e x e s106
Trains 80% pass trains 100 users/train T/day 20 20 20 20 2412 hours max 90% 12 hours min 10% Traffic (cars) V/day 400 412 424 437 701Traffic (trucks) V/day 100 103 106 109 17512 hours max 75% 12 hours min 25% Traffic growth cars 3% trucks 4% trains trains Cars stopped/day 16.18 16.83 17.00 32.95Trucks stopped/day 4.05 4.21 4.25 8.24Time lost/day cars (h) 0.27 0.28 0.28 0.55Time lost/day trucks (h) 0.07 0.07 0.07 0.14Time lost/day rail users (h) 5.39 5.44 5.33 6.44Value of time Value of time (car) 10 € Value of time (truck) 20 € Value of time (train user) 3 € Time barrier closed 2 min Time saving 1 min Time improvement trains 0.2 min due to speed restriction on rail crossing (no benefits included for rail operation) Operating cost of veh. stopped 0.02 € Fuel taxes per veh. stopped 0.03 € Consumption of veh. stopped 0.08 l Fuel cost 0.3 €/l Taxes 0.4 €/l Comfort improvement 0.02 €/vehicle Accident rates and values Acc/IMD*Tr/day Value Per car*train (car) Fatal 0.000000515 1000000 € 0.5833 Injury 0.00000065 100000 € Slight inj. 1.50E-06 2200 € Per car*train (train) Number of accidents involving trains 1.00E-07 0.05833 Assume part of train accidents/road 10% suffered by users and operator Assume part operator cost covered insurance 50% Assume part user cost covered insurance 100%
Operating staff 0.2 employees assuming one addit. operator of control centre per 5 crossings Financing: regional authority subsidy 60%
Taxes on construction (national) 10%
D 6 Level crossing elimination

R A I L P A G R a i l w a y P r o j e c t A p p r a i s a l G u i d e l i n e s – A n n e x e s 107
Rail
user
sRo
ad
pax
Road
fr
eigh
tRa
il op
er.
Insu
ranc
eRa
il m
anag
erLo
cal
non
user
Loca
l gvt
Regi
onal
gvt
Nat
iona
l gvt
ECO
NO
MIC
VA
LUE
USE
R SE
RV
ICE
Trav
el ti
me
94
733
2031
3 10
157
12
5202
Relia
bili
ty
Com
fort
71
193
7119
3
Safe
ty
Fina
ncia
l -3
130
-626
05
-6
261
7199
6
0
Ec
onom
ic
6261
12
5211
6261
13
7732
OPE
RAT
ION
Vehi
cle
oper
atin
g co
sts
27
63
691
34
53
Op
erat
ing
per
sonn
el
32
176
3217
6
Taxe
s (f
uel)
3683
92
1
-4
604
0
ASS
ETS
Infr
astr
uctu
re
-660
00
-990
00
-1
6500
0
Resi
dual
val
ue
3654
3
36
543
Taxe
s
-6
600
-990
0 16
500
0
Infr
astr
uctu
re m
aint
enan
ce
14
877
-535
59
-3
8681
Noi
se a
nd v
ibra
tions
Air
pol
lutio
n
Clim
atic
cha
nge
FIN
AN
CIA
L PR
OFI
TAB
ILIT
Y
97
863
1605
5711
768
071
996
1099
6-1
6245
911
896
2026
18
ERR
= 1
1.7
%

R A I L P A G R a i l w a y P r o j e c t A p p r a i s a l G u i d e l i n e s – A n n e x e s108
Case Study 7 – Link to terminal
This is a simplified case partially based on actual data for the building of a new rail link to an airport. The case incorporates a particular aspect, which is the proposal to have it built as a BOT project for the construction of part of the infrastructure and the operation of the airport train services. The purpose is to show how RAILPAG could facilitate the discussion concerning the participation of private players in the sector.
1. Main purpose of the project
To link an international airport by high-speed rail with the central station of the main city, A, served by the airport. Providing continuity to the next city (B) allows this more modest market to be served, but the new line also serves as a shortcut of 15 km for passenger trains between A and B. The existing line will be still used for other regional services and freight trains.
2. Technical characteristics of current situation
The airport is 65 km away from the centre of A and 80 km from B. Without the project, the majority of the travellers, including employees at the airport, would make use of bus services. Taxis and cars are also used for accessing the airport. In the do-minimum situation, road transport is assumed to expand to accommodate increasing demand over time without additional investment. Should roads be expanded, it is assumed to be mostly due to non-airport traffic, so a conservative approach (no positive impact on the road traffic) is assumed.
3. Project description
The project involves a dual rail track linking up the airport with a main existing railway line running to A. After passing under the airport, the railway links up again with the existing railway line towards B (80 km from the airport), creating a detour of 15 km for through – long-distance - trains on the main railway line. This existing line will be partly upgraded in order to allow for the new high-speed services to the airport and a part of the central station in A will be upgraded to allow for dedicated platforms for the high-speed train services to the airport, paid for by the public rail manager.
The project further envisages that the airport train services will be exclusively provided by a 60-year rail concessionaire, on a BOT basis. The concessionaire will invest in all the dedicated facilities required by the airport services. The rail manager will only handle investments required for the through-train services, including one of the two links between the airport and the main railway line, i.e. the one that will be used only by long-distance services. Long-distance train operators will pay the same track charges.
The bus service will be able to continue to provide transport in the project case in order to ensure competition, with the bus operators adapting their service to the new demand conditions.
4. Demand
The demand projections indicated that the airport would have 18.3 million passengers during the opening year of the new service, year 6 after an investment period of five years. This is expected to generate up to 6 million trips between A and the airport, of which the rail service would be able to catch 2,5 million during the first year of operation. The pricing policy proposed by the train operator meant that the bus service could continue retaining a substantial part of the market, alongside private car and taxi users. The total demand for travel is expected to increase by 1.5% every year. The growth of rail traffic should be higher, at about 2%. No generated traffic is envisaged, as traffic to the airport is assumed not to be dependent on the quality of its access.
The project will have an impact on the modal choice of those travellers between the airport and B, but the effects of the old line improvement on through-train services is assumed to be negligible in terms of demand generation (conservative assumption).
D 7 Link to terminal

R A I L P A G R a i l w a y P r o j e c t A p p r a i s a l G u i d e l i n e s – A n n e x e s 109
5. Costs
Investments
Investments in the infrastructure to be paid for by the BOT operator are estimated at 585 million€, exclusive of VAT. The BOT operator is assumed to have to reinvest 50 million € (exc. VAT) for the years 25, 45 and at the end of the period in order to maintain the infrastructure in adequate condition and hand it over to the rail manager.The public investment in the new line is estimated at 86,5 € million, to be paid for by the rail manager (plus three times 10 million € along with the concessionaire).
The initial investments are evenly spread over a period of 5 years; the appraisal period covers this period as well as a 60 year operation period. At the end of that period, the investments are assumed to have a 50% residual value.
Maintenance and operating costs
Maintenance costs of the track are assumed to be the responsibility of the rail manager, but will be partly paid for by the concessionaire through a fixed amount estimated at 1% of the investment cost.
To provide the services, the BOT operator will initially require 7 train sets in total. Each set costs 7,2 million€. These trains have a life of about 25 years. Additional trains are necessary to accommodate increasing demand. Thus, at the end of the concession period, the rail operator is assumed to have 16 train sets, representing a residual value of almost 16 million €.
Train operating costs consist of two components, one mainly determined by the number of train x km and the other by the number of passengers. During the first year of operation these costs are assumed to be 22.2 million €.
Subsidies
In principle, no subsidies will be paid to the BOT operator.
6. Benefits
The calculated benefits focus on the effects for those who switch to the high-speed train service, and the change in the consumers’ surplus for these travellers, as well as the producer’s surplus of the high-speed service.
The impacts on the remaining road traffic are ignored, although some congestion improvements could have been considered.
User benefits and evaluation
A simplified approach is used in order to determine the value of the user benefits. The base assumption is that in the absence of the rail service, those travelling between A and the airport would be going by bus, and essentially between the same two points. The train service, on average, implies a time saving of about 20 minutes, also taking into account frequencies of the rail and bus service. This time saving is the same for just about everyone travelling by rail. On the other hand, these travellers also face the payment of a fare about twice as high for rail than for bus, 13,3 € to be compared with 6,7 €. The train service additionally provides better reliability and a higher level of comfort than the bus service, since it is more spacious. For travellers between the airport and B, the time saved is 25 minutes, and the fares respectively 18 and 10 €.
Given the normal values of time applying to leisure travellers it is clear that they will not be attracted to the rail service. It will primarily attract those who travel on business, and then by air, and possibly some of those who travel to and from the airport for work purposes. at.The average value of time used for the traveller diverted to rail is 25 €. All the switchers in addition gain in reliability and comfort equal to 1,2 € per trip.

R A I L P A G R a i l w a y P r o j e c t A p p r a i s a l G u i d e l i n e s – A n n e x e s110
D 7 Producers’ surplus
The producers’ surplus is measured in the traditional way, viz. gross revenues minus cost. There is a need to identify specifically the share of the revenues paid to the government in the form of VAT (6%). This issue requires a detailed financial analysis not carried out here. It is assumed that bus operators will adapt their supply to the new demand without noticeable loss.
Externalities
Externalities will have a negative component regarding the construction of the new line, that cannot be quantified. The positive impacts due to the reduction of emissions and noise of the reduced road traffic are included in the analysis.
7. Results of Economic analysis
The investment is economically sound and the ERR is robust. Values of time and train operating costs appear as important variables on the economic profitability of the project. Of course, the reliability of the investment estimates is also very relevant.
8. Results of Stakeholder analysis
The stakeholder analysis shows that although the government wishes to engage a BOT operator in order to reduce its investment in public infrastructure, the project could be implemented as proposed. Under the assumptions made, the BOT operator will not be making money. It would require higher volumes of traffic or some financial advantages (i.e. subsidies) to achieve break-even. However, the risks faced by the BOT operator are fundamental since he is totally dependent on air traffic, which, in turn, is very much decided on by economic development in general. The BOT operator cannot protect himself against this kind of uncertainty; and for that reason he is likely to undertake an evaluation of the project at a much higher rate of discount than the one used in the economic analysis, i.e. 6%. Given the assumptions reflected in this example, the BOT operator would not participate in the project, unless able to recover a larger part of the consumers’ surplus, or by obtaining financial advantages such as reduced maintenance payments to the rail manager or direct subsidies.It is important to observe that the national government is obtaining financial benefits from the project (which are almost identical to the losses made by the rail manager).
A detailed analysis of taxes, notably the real impact of VAT, would be needed to better assess the potential financial profitability for the rail concessionaire, but it appears obvious that, even though the project is economically profitable, the proposed BOT structure is not suitable.
9. Comments
Some factors that could improve the economic profitability of the project such as the effects of the through train rail services and the improved road traffic or its access to the airport, have not been considered. But, as they would only increase an already acceptable profitability, they are not particularly relevant in this case.
Link to terminal

R A I L P A G R a i l w a y P r o j e c t A p p r a i s a l G u i d e l i n e s – A n n e x e s 111
ECO
NO
MIC
EVA
LUAT
ION
NPV
Ra
te
Year
5.00
%
1 2
3 4
5 6
65
INV
ESTM
ENT
& M
AIN
TEN
AN
CE;
mill
ion
€
Rai
l in
fras
truc
ture
C
ost t
o Ra
il m
anag
er
94,6
3
0,00
0,
00
36,0
4 36
,04
36,0
4 0,
00
12,5
0In
vest
men
t; p
roje
ct e
cono
mic
cos
t 75
,71
0,
00
0,00
28
,83
28,8
3 28
,83
0,00
10
,00
VAT
reve
nue
to N
atio
nal g
ov’t
18,9
3
0,00
0,
00
7,21
7,
21
7,21
0,
00
2,50
Resi
dual
val
ue o
f tot
al p
roje
ct (5
0% e
nd o
f per
iod)
14
,08
0,
00
0,00
0,
00
0,00
0,
00
0,00
33
5,75
Cos
t to
Rail
oper
ator
(con
cess
ionn
aire
) 66
1,22
146,
25
146,
25
146,
25
146,
25
146,
25
0,00
62
,50
Inve
stm
ent;
pro
ject
eco
nom
ic c
ost
528,
98
11
7,00
11
7,00
11
7,00
11
7,00
11
7,00
0,
00
50,0
0VA
T re
venu
e to
Nat
iona
l gov
’t 13
2,24
29,2
5 29
,25
29,2
5 29
,25
29,2
5 0,
00
12,5
0
Tota
l inv
estm
ent:
finan
cial
cos
t 74
1,77
146,
25
146,
25
182,
29
182,
29
182,
29
0,00
-2
60,7
5To
tal i
nves
tmen
t cos
t (ec
on)
590,
60
11
7,00
11
7,00
14
5,83
14
5,83
14
5,83
0,
00
-275
,75
VAT
reve
nue
to N
atio
nal g
over
nmen
t 15
1,17
29,2
5 29
,25
36,4
6 36
,46
36,4
6 0,
00
15,0
0
Mai
nten
ance
cos
t to
Rail
man
ager
16
,04
0,
00
0,00
0,
00
0,00
0,
00
1,08
1,
08N
orm
al m
aint
enan
ce c
osts
(eco
nom
ic)
12,8
3
0,00
0,
00
0,00
0,
00
0,00
0,
87
0,87
VAT
reve
nue
to N
atio
nal g
ov’t
3,21
0,00
0,
00
0,00
0,
00
0,00
0,
22
0,22
Mai
nten
ance
cos
t to
Rail
oper
ator
(con
c.)
108,
46
0,
00
0,00
0,
00
0,00
0,
00
7,31
7,
31N
orm
al m
aint
enan
ce c
osts
(eco
nom
ic)
86,7
6
0,00
0,
00
0,00
0,
00
0,00
5,
85
5,85
VAT
reve
nue
to N
atio
nal g
ov’t
21,6
9
0,00
0,
00
0,00
0,
00
0,00
1,
46
1,46
Rolli
ng s
tock
C
ost t
o Ra
il m
anag
er
82,0
4
0,00
0,
00
0,00
0,
00
0,00
63
,00
15,8
4In
vest
men
t; p
roje
ct e
cono
mic
cos
t 65
,10
0,
00
0,00
0,
00
0,00
0,
00
50,4
0 0,
00VA
T re
venu
e to
Nat
iona
l gov
’t 16
,28
0,
00
0,00
0,
00
0,00
0,
00
12,6
0 0,
00Re
sidu
al v
alue
of t
rain
set
s 0,
66
0,
00
0,00
0,
00
0,00
0,
00
0,00
15
,84
Tota
l fi n
anci
al c
ost
948,
3114
6,25
146,
2518
2,29
182,
2918
2,29
71,3
9-2
36,5
2
Tota
l eco
nom
ic c
ost
754,
6311
7,00
117,
0014
5,83
145,
8314
5,83
57,1
2-2
84,8
8
VAT
reve
nue
to N
atio
nal g
over
nmen
t 19
2,34
29,2
5 29
,25
36,4
6 36
,46
36,4
6 14
,28
16,6
8

R A I L P A G R a i l w a y P r o j e c t A p p r a i s a l G u i d e l i n e s – A n n e x e s112
D 7 Link to terminalEC
ON
OM
IC E
VALU
ATIO
N
BEN
EFIT
S; m
illio
n €
USE
R SE
RV
ICE
Trai
n us
ers
Exis
ting
long
-dis
tanc
e tr
affic
Tra
vel t
ime
savi
ngs
138,
32
0,
00
0,00
0,
00
0,00
0,
00
5,8
24,9
Div
erte
d tr
affic
from
bus
A
irpor
t-A
F
are
pay
m. d
iffer
ence
-2
56,7
6
0,00
0,
00
0,00
0,
00
0,00
-1
4,5
-26,
1
T
rave
l tim
e sa
ving
37
4,14
0,00
0,
00
0,00
0,
00
0,00
17
,3
56,1
Com
fort
& re
liab
ility
59
,86
0,
00
0,00
0,
00
0,00
0,
00
2,8
9,0
Airp
ort-
B
F
are
pay
m. d
iffer
ence
-7
0,73
0,00
0,
00
0,00
0,
00
0,00
-4
,0
-7,2
Tra
vel t
ime
savi
ng
118,
10
0,
00
0,00
0,
00
0,00
0,
00
5,5
17,7
Com
fort
& re
liab
ility
13
,61
0,
00
0,00
0,
00
0,00
0,
00
0,6
2,0
Tot
al
Far
e p
aym
. diff
eren
ce
-327
,49
0,
00
0,00
0,
00
0,00
0,
00
-18,
5 -3
3,3
Tra
vel t
ime
savi
ng
492,
24
0,
00
0,00
0,
00
0,00
0,
00
22,8
73
,8
C
omfo
rt &
relia
bili
ty
73,4
7
0,00
0,
00
0,00
0,
00
0,00
3,
4 11
,0D
iver
ted
traf
fic fr
om c
ars
F
are
-349
,57
0,
00
0,00
0,
00
0,00
0,
00
-9,0
-8
6,4
T
rave
l tim
e sa
ving
80
,57
0,
00
0,00
0,
00
0,00
0,
00
1,6
27,2
O
per
atin
g co
sts
savi
ng (e
xcl.
pet
rol t
axes
) 24
4,70
0,00
0,
00
0,00
0,
00
0,00
6,
3 60
,5
Pet
rol t
axes
81
,57
0,
00
0,00
0,
00
0,00
0,
00
2,1
20,2
S
afet
y im
pro
vem
ents
(ext
erna
l) 91
,35
0,
00
0,00
0,
00
0,00
0,
00
2,4
22,6
Tota
l
Add
ition
al re
venu
e fo
r tra
in o
per
ator
10
26,1
2
0,00
0,
00
0,00
0,
00
0,00
47
,3
155,
2
Los
s of
reve
nue
for b
us o
per
ator
34
9,06
0,00
0,
00
0,00
0,
00
0,00
19
,7
35,5
R
educ
tion
in p
etro
l tax
es
81,5
7
0,00
0,
00
0,00
0,
00
0,00
2,
1 20
,2
Serv
ice
pro
vide
rs
Long
-dis
tanc
e tr
ain
oper
ator
Re
duct
ion
in o
per
atin
g co
sts
29,2
3
0,00
0,
00
0,00
0,
00
0,00
2,
0 2,
0Ra
il op
erat
or (c
once
ssio
nnai
re)
Op
erat
ing
cost
s 40
9,38
0,00
0,
00
0,00
0,
00
0,00
21
,2
48,6
Sale
s co
sts
21,3
1
0,00
0,
00
0,00
0,
00
0,00
1,
0 3,
2Bu
s op
erat
or re
duct
ion
in o
per
atin
g co
sts
349,
06
0,
00
0,00
0,
00
0,00
0,
00
19,7
35
,5
Exte
rnal
eff
ects
Ex
tern
al e
ffec
ts ra
il; e
mis
sion
s gl
obal
-1
7,66
0,00
0,
00
0,00
0,
00
0,00
-0
,9
-2,1
Exte
rnal
eff
ects
rail;
em
issi
ons
loca
l -9
,63
0,
00
0,00
0,
00
0,00
0,
00
-0,5
-1
,1Ex
tern
al e
ffec
ts ro
ad; r
educ
ed e
mis
sion
s gl
obal
12
6,68
0,00
0,
00
0,00
0,
00
0,00
5,
4 21
,4Ex
tern
al e
ffec
ts ro
ad; r
educ
ed e
mis
sion
s lo
cal
87,8
5
0,00
0,
00
0,00
0,
00
0,00
3,
2 17
,5
Tota
l eco
nom
ic b
enefi
ts
1255
,50
0,0
0,0
0,0
0,0
0,0
48,8
241,
4
Econ
omic
ben
efi t
s-co
sts
500,
87-1
17,0
0-1
17,0
0-1
45,8
3-1
45,8
3-1
45,8
3-8
,352
6,3
ERR
= 7
.7%

R A I L P A G R a i l w a y P r o j e c t A p p r a i s a l G u i d e l i n e s – A n n e x e s 113
Exis
ting
rail
user
sRo
ad to
ra
il us
ers
Bus
to
rail
user
sRa
il co
nces
s..Lo
ng-d
ist
rail
oper
.Bu
s op
erat
orr
Rail
man
ager
Loca
l no
n us
erG
lob
al
non
user
tN
atio
nal g
vtEC
ON
OM
IC
VALU
E U
SER
SER
VIC
E
Tr
avel
tim
e
138,
3 80
,6
492,
2
711,
1
Safe
ty
91,4
91
,4
Com
fort
& re
liab
ility
73
,5
73
,5
OPE
RAT
ION
0,0
Trac
k ch
arge
s
0,
0
0,
0
0,0
Rail
oper
atin
g co
sts
-4
30,7
29
,2
-4
01,5
Bus
oper
atin
g co
sts
34
9,1
349,
1
Road
op
erat
ing
cost
s
244,
7
24
4,7
Fare
s
0,0
-349
,6
-327
,5
1026
,1
0,0
-349
,1
0,0
Petr
ol ta
xes
81,6
-81,
6 0,
0
ASS
ETS
0,
0
Infr
astr
uctu
re
-529
,0
-75,
7
-604
,7
Resi
dual
val
ue
14
,1
14
,1
Taxe
s
-1
53,9
-3
8,4
192,
3 0,
0
Infr
astr
uctu
re m
aint
enan
ce
-8
6,8
-12,
8
-99,
6
Rolli
ng s
tock
-6
5,1
-65,
1
Resi
dual
val
ue
0,7
0,7
Emis
sion
s ra
il
-9
,6
-17,
7
-27,
3
Con
stru
ctio
n im
pac
ts
Emis
sion
s ro
ad
87,9
12
6,7
21
4,5
ECO
NO
MIC
PRO
FITA
BIL
ITY
138,
314
8,6
238,
2-2
38,7
29,2
0,0
-112
,978
,210
9,0
110,
850
0,9
ERR
= 7
.7 %
Dis
coun
t rat
e: 5
%

R A I L P A G R a i l w a y P r o j e c t A p p r a i s a l G u i d e l i n e s – A n n e x e s114
D 8 Rail terminal development
Case Study 8 – Rail terminal development
This is a simplified case based on real data.
1. Main purpose of the project
To construct a new station in A on a recently developed urban area crossed by an existing rail line.
2. Technical characteristics of current situation
At present a double track runs through A, but there is no station. A is served by bus, with services from the town centre to stations in B and C, nearby towns served by the same rail line.
3. Project description
The establishment of a station, comprising two platforms, a footbridge to connect the two platforms, a terminal building and parking areas, which would allow all trains to stop in A. It is assumed that all ordinary passenger trains (approx. one train in each direction every hour from early morning to late evening) would stop. This would result in 12 400 trains stopping at A on an annual basis. The existing bus services to B and C would be discontinued. Travel time for bus travellers between A and B will be reduced by 20 minutes and for those between A and C by 10 minutes. For simplicity reasons an average 15 minutes has been adopted. Car users diverting to the train are making, on average, 60 km (as they go far in the line) and their travel time will be increased by 13 minutes.
4. Demand
The new station will result in the transfer of all previous 90 bus passengers per day to the train services. In addition, each weekday an additional 60 passengers to and from A will be deviated from cars (occupation ratio 1.3) and 20 trips will be generated by the rail service. To estimate annual traffic, weekday traffic has been multiplied by 325, for a total of 48750.
The number of through passengers on the ordinary passenger services before the new terminal is constructed is estimated at 400 000/year. Because of a loss of 2 minutes for the stop, through passengers are assumed to be reduced by 8000 on an annual basis. These passengers, spread over the line, are expected to divert to cars (with an average travel time improvement of 12 minute, but a car trip of 40 km).
Bus fares (A to B or C) are, on average, 2 € per trip. Equivalent train fares will be, on average, 3€ per trip.
Traffic is assumed to grow by 2% per year during the first 10 years and stay constant thereafter.
5. Costs
Investments
The investment is costed at 2,06 million €, plus indirect tax at 17%. It will be paid for by the rail manager. The project can be completed during one year, and no additional investments will be required thereafter. The residual value after 50 years is assumed to 50% of the original investment, due to good maintenance.
As rotation time will be increased by 2+2 minutes, and there is additional patronage in the line, it is assumed that one new train set is necessary and will be sufficient for the duration of the project. This train must be replaced after 30 years. The replacement will have a residual value of 20% in year 50. The investment on this train set and the differences of the operating costs due to longer rotations should cover all additional costs for the train operator. The cost for the operator of a new train, is 3.6 million € plus VAT.

R A I L P A G R a i l w a y P r o j e c t A p p r a i s a l G u i d e l i n e s – A n n e x e s 115
Maintenance costs
The rail manager is assumed to face a maintenance cost of the new station of some 11 000 € per year. Additional costs for the rail operator are assumed to be covered by additional revenues from commercial revenues made at the station.
The annual cost of a train set maintenance is estimated at 0.1 million € per year.
Train and bus operating costs
Two minutes additional time will require more train operating staff and energy. The marginal time-related costs of train operation are estimated at € 100 per hour.
The savings in the annual bus operating costs have been estimated at 110 000 €, which are now borne by the regional government, which only covers 45500 € of the costs with bus fares.
The impact of VAT on changes in operations and on train and bus fares is considered to be negligible overall.
There are no impacts on track charges to the rail manager.
6. Benefits
The method used identifies and measures all the changes in consumers’ and producers’ surpluses that the project gives rise to. In addition, effects on the fiscal balance of the national and regional governments are taken into account and valued. External effects are not quantified in this particular case. It is implicitly assumed that the additional diverted passengers, which at present make use of car do not face congestion on the roads. The benefits to generated passengers are estimated using the rule of the half.
The benefits of the project for stakeholders in the transport sector come from changes in resource costs for trip production and from changes in travel time, other potential benefits (comfort, reliability, etc.) are not considered.
User benefits
The bus users switching to rail are expected to make a gain of 15 minutes, whilst the generated traffic to and from A is assumed to make, on average, a gain which is half as large. Through passengers lose on average two minutes because of the stop at the proposed new station. The 8000 passengers who stop making use of the train services because of this delay, are expected to divert to cars (40 km and reduction of 12 minutes compared to the present situation).
It is assumed that existing rail and bus traffic comprises 40% commuters, 10 % business travellers and 50% leisure trips. Car users diverting to rail and rail users diverting to car have a different composition and a higher value of time These compositions will remain constant. The weighted average value of time for these types of users is 8.2 € and 9.6 €, in year 0; the value of time is assumed to grow by 1.8% annually.
Resource operation costs of cars are assumed to be 0.2 €/km. Fuel taxes are estimated at 0.4 €/km.
Operators benefits
The rail operator obtains additional revenues from incoming traffic and losses from traffic diverting due to additional travel time. Besides investment and additional maintenance for the new train set, it will have some additional costs due to longer trips and to the additional traffic (sales, etc.).
The bus service will be eliminated with all its operating costs and subsidies. The regional government will strongly benefit from this.
Externalities
The elimination of the bus services will have substantial impacts on urban pollution (air an noise). The net reduction of car traffic will also have positive impacts. The new station may become a catalyst for urban development. This might have a positive impact if well-planned and focused on the use of the new public transport facility.

R A I L P A G R a i l w a y P r o j e c t A p p r a i s a l G u i d e l i n e s – A n n e x e s116
7. Results of Economic analysis
The economic evaluation shows that the proposal is poor from an economic point of view. It is very sensitive to the number of future users. The modest number of bus users indicates that there is a poor demand for public transport. It could be interesting to study if proper marketing of available rail services would improve rail traffic forecasts.
8. Results of Stakeholder analysis
The stakeholder analysis shows that only the regional government stands to gain from the proposal. In addition, some of the rail users are, of course, winners, but their improvement drowns in the losses made by the through passengers.
9. Comments
This case quite clearly shows the opposing forces that some investments will give rise to in the railway sector. The station is in the interests of those who travel to and from A, as well as the regional government. Also, on account of the financing arrangements, substantial costs are not easily seen, and only borne indirectly by the public, often at a later date.
D 8Rail terminal development

R A I L P A G R a i l w a y P r o j e c t A p p r a i s a l G u i d e l i n e s – A n n e x e s 117
ECONOMIC EVALUATION
NPV Rate Year3.00% 1 30 50
INVESTMENT & MAINTENANCE; thousand €Rail infrastructure
Project cost to Rail manager 2412.3 2412.3 0.0 0.0 0.0Investment; project; economic cost 2060.0 2060.0 0.0 0.0 0.0VAT revenue to National gov’t 352.3 352.3 0.0 0.0 0.0Residual value; project (50% end of period) 235.0 0.0 0.0 0.0 1030.0Cost to Rail manager; do-min 0.0 0.0 0.0 0.0 0.0Investment; do-min; economic cost 0.0 0.0 0.0 0.0 0.0VAT revenue to National Gov’t 0.0 0.0 0.0 0.0 0.0Residual value; do-min 0.0 0.0 0.0 0.0 0.0 Net investment: financial cost to Rail manager 2412.3 2412.3 0.0 0.0 0.0Net investment cost (econ) 2060.0 2060.0 0.0 0.0 0.0Net VAT revenue to National government 352.3 352.3 0.0 0.0 0.0Net residual value 235.0 0.0 0.0 0.0 1030.0 Maintenance cost to Rail manager 331.4 12.9 12.9 12.9Cost to Rail manager; maintenance 283.0 11.0 11.0 11.0VAT revenue to National gov’t 48.4 1.9 1.9 1.9 Rolling Stock Project cost to Rail operator 8.5 4.2 0.1 4.3 0.1Train set investment cost 5.1 3.6 0.0 3.6 0.0VAT revenue to National Gov’t 0.9 0.6 0.0 0.6 0.0Residual value 0.2 0.0 0.0 0.7Maintenance 2.6 0.0 0.1 0.1 0.1
Total fi nancial cost 2519.7 2416.5 13.0 17.2 -1017.0Total economic cost 2115.6 2063.6 11.1 14.7 -1019.6
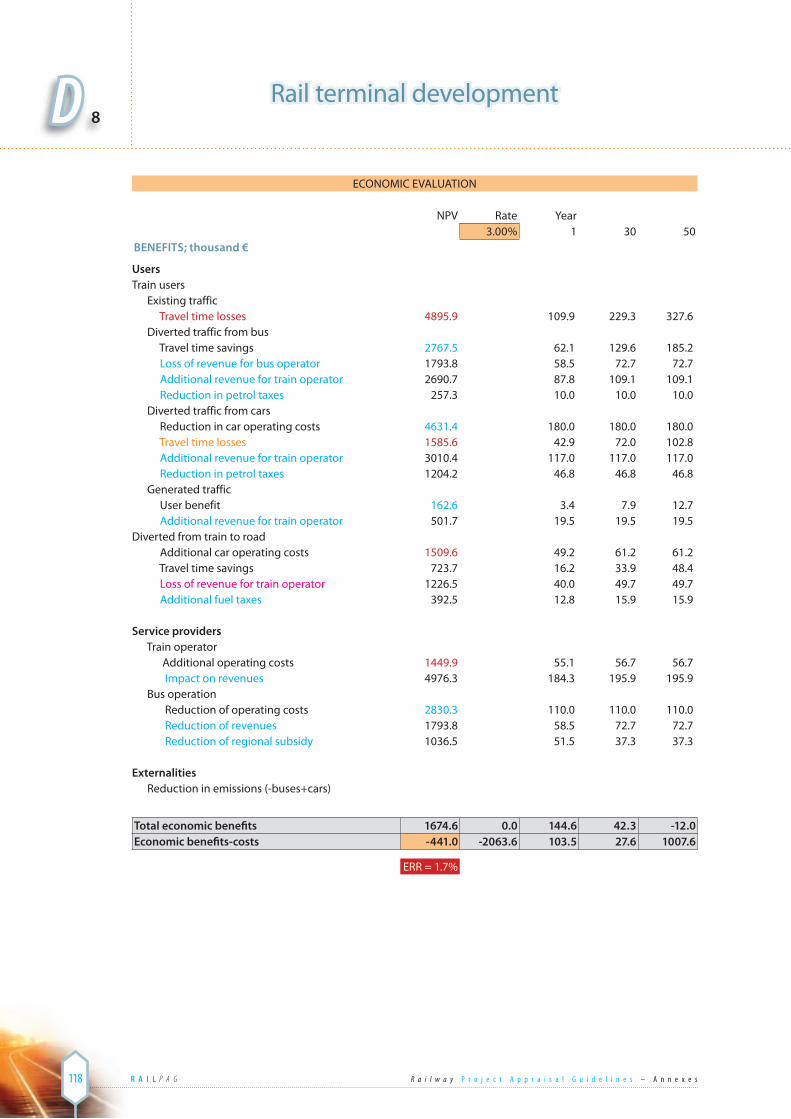
R A I L P A G R a i l w a y P r o j e c t A p p r a i s a l G u i d e l i n e s – A n n e x e s118
D 8
ECONOMIC EVALUATION
NPV Rate Year3.00% 1 30 50
BENEFITS; thousand €
Users Train users Existing traffic Travel time losses 4895.9 109.9 229.3 327.6 Diverted traffic from bus Travel time savings 2767.5 62.1 129.6 185.2 Loss of revenue for bus operator 1793.8 58.5 72.7 72.7 Additional revenue for train operator 2690.7 87.8 109.1 109.1 Reduction in petrol taxes 257.3 10.0 10.0 10.0 Diverted traffic from cars Reduction in car operating costs 4631.4 180.0 180.0 180.0 Travel time losses 1585.6 42.9 72.0 102.8 Additional revenue for train operator 3010.4 117.0 117.0 117.0 Reduction in petrol taxes 1204.2 46.8 46.8 46.8 Generated traffic User benefit 162.6 3.4 7.9 12.7 Additional revenue for train operator 501.7 19.5 19.5 19.5Diverted from train to road Additional car operating costs 1509.6 49.2 61.2 61.2 Travel time savings 723.7 16.2 33.9 48.4 Loss of revenue for train operator 1226.5 40.0 49.7 49.7 Additional fuel taxes 392.5 12.8 15.9 15.9
Service providers Train operator Additional operating costs 1449.9 55.1 56.7 56.7 Impact on revenues 4976.3 184.3 195.9 195.9 Bus operation Reduction of operating costs 2830.3 110.0 110.0 110.0 Reduction of revenues 1793.8 58.5 72.7 72.7 Reduction of regional subsidy 1036.5 51.5 37.3 37.3 Externalities Reduction in emissions (-buses+cars)
Total economic benefi ts 1674.6 0.0 144.6 42.3 -12.0Economic benefi ts-costs -441.0 -2063.6 103.5 27.6 1007.6
ERR = 1.7%
Rail terminal development

R A I L P A G R a i l w a y P r o j e c t A p p r a i s a l G u i d e l i n e s – A n n e x e s 119
Supporting information for economic evaluation Costs Indirect tax factor 1.171 Cost of tax funding factor 1.20 VAT on investments and maintenance 25% Investment in the project alternative; net VAT; thousand 2060 Investment in the do-min alternative; net VAT; thousand Residual value after 50 years 50% Maintenace cost of station; thousand € 11.00 Share financed by rail manager 100%
Demand Through rail users before 2% growth 10 years 400000 497350 497350Through rail users after 392000 487403 487403Net loss of through traffic 8000 9947 9947Transferred from bus 29250 36369 36369Transferred from cars 19500 19500 19500New traffic generated by station 6500 6500 6500Total traffic through the station 55250 62369 62369
Production Departures per year 12410 12410 12410
Consumers’ surplus data Distance for train to road passengers 40 km Distance for road to train passengers 60 km Travel time saving for bus travellers 0.25 h Travel time losses for through travellers 0.03 h 0.5 11.5Travel time gains for train to road travellers 0.20 h Travel time losses for road to train travellers 0.22 h Bus & train Value of travel time; commuter 8 €/h 40% Value of travel time; business 20 €/h 10% Value of travel time; leisure 6 €/h 50% Average value time bus&train 8.2 8.35 8.50 14.26 20.37Average value time diverting road-train 9.8 9.98 10.16 17.04 24.34Growth in VOT pa 1.80%
Operating costs Costs per additional user (sales, etc.) 0.3 euro 14.18 15.73 15.73Operating cost; per hour 100 17 17Investment in train set; annuity; 000 € 250 Operating cost of busservice; net 000 € 95 15 15Operating costs car per pass x km 0.15385 Fuel taxes 0.04 €/pass x km Bus operation fuel taxes 10000 Bus fare 2 Train fare station users 3 Train fare through users 5 Train fare car to train users 6

R A I L P A G R a i l w a y P r o j e c t A p p r a i s a l G u i d e l i n e s – A n n e x e s120
D 8
Rail
Ro
ad to
Bu
s to
Ra
il to
G
ener
ated
Ra
il
Bus
Rail
Loca
l N
atio
nal
ECO
NO
MIC
us
ers
rail
user
s ra
il us
ers
road
use
rs
traf
fic
oper
ator
op
erat
or
man
ager
no
n us
er
gvt
VA
LUE
USE
R SE
RV
ICE
Tr
avel
tim
e -4
895.
9 -1
585.
6 27
67.5
72
3.7
-299
0.2
Con
s. s
urp
lus
(new
traf
fic)
162.
6
162.
6
OPE
RAT
ION
0.
0
Road
op
erat
ing
cost
s
4631
.4
-1
509.
6
31
21.8
Rail
oper
atin
g co
sts
-1
449.
9 28
30.3
1380
.4
Fare
s
0.
0
Taxe
s (f
uel);
VAT
0.
0
ASS
ETS
0.0
Infr
astr
uctu
re
-2
060.
0
-2
060.
0
Resi
dual
val
ue
23
5.0
235.
0
Taxe
s
-352
.3
35
2.3
0.0
Infr
astr
uctu
re m
aint
enan
ce
-2
83.0
-2
83.0
Taxe
s in
fr. M
aint
enan
ce
-4
8.4
48
.4
0.0
Rolli
ng s
tock
-5.1
-5
.1
Taxe
s
-0.9
0.9
0.0
Resi
dual
val
ue
0.
2
0.
2
Mai
nten
ance
rolli
ng s
tock
-2.6
-2
.6
Exte
rnal
ities
ECO
NO
MIC
PRO
FITA
BIL
ITY
-489
5.9
3045
.816
2.6
-145
8.2
-250
8.7
401.
1-4
41.0
ERR
= 1
.7 %
Rail terminal development

R A I L P A G R a i l w a y P r o j e c t A p p r a i s a l G u i d e l i n e s – A n n e x e s 121

R A I L P A G R a i l w a y P r o j e c t A p p r a i s a l G u i d e l i n e s – A n n e x e s122
D 9 Case Study 9 – Line closure
The presentation of this case is limited to an identification of important aspects to be considered in a CBA of a line closure. The following will have to be taken into account:
1. Main purpose of the project
A disinvestment in a line serving as a feeder to a main network is very similar to the analysis of a project involving the building of a new line to feed into a network, or the reopening of a closed line, for which the right of way has remained untouched.
2. Technical characteristics of current situation
A key question to be considered up front is if the areas being served by the line are well served by other modes, ensuring good accessibility for freight as well as people, and at reasonable costs. If the answer to that question is yes, then the CBA will be fairly straightforward. It will have to focus on the costs savings to be attained by closing the line to be compared with the worsened conditions to be experienced by those who before closure will travel by rail but after a closure will have to use an alternative mode, e.g. bus or truck. These conditions will have to be evaluated based on time losses, effects related to regularity of service, additional cost related to the need to transfer to rail at some other place (comfort), additional costs of freight transport, etc. Additional external effects caused by road traffic may also have to be considered explicitly.
3. Project description
The network effects will have to be considered as closure of a line can have negative effects on the network as a whole.
4. Demand
Assume, on the other hand, that some communities along the existing railway line are not served well in the existing situation. Then it may be necessary to consider possible alternative investments that will have to be made in order to improve accessibility. This may involve extending a road or improving public transport. The costs for improving accessibility in case of a line closure must be considered in the CBA. If it turns out that not closing the railway line is the cheapest means for ensuring accessibility to the area served by the line, it may be necessary to also consider a subsidy (a PSO) to sustain the train services. If, on the other hand, it is concluded that the line should be closed but that improvement should be made to the alternative modes, it may be necessary to ensure expansion of e.g. a bus service by way of subsidies.
5. Costs
A further case to be considered is when some of the traffic is captive, normally freight, in the sense that it would disappear entirely from the market if the line is closed. A line closure is thus expected to lead to the concomitant closure of a factory or a mine as well. In principle, also in this case the line closure should be evaluated as before, but disregarding the captive traffic. If the conclusion is that the line should be closed, then before doing so it should be offered to the captive user to take it over. This is the easiest way to assess the actual willingness to pay by the captive user.
6. Benefits
A line closure will tend to improve the financial position of the rail manager and the rail operator. The users will typically face higher costs.
Line closure

R A I L P A G R a i l w a y P r o j e c t A p p r a i s a l G u i d e l i n e s – A n n e x e s 123

R A I L P A G R a i l w a y P r o j e c t A p p r a i s a l G u i d e l i n e s – A n n e x e s124
D 10Construction of a new high-speed rail line
Case Study 10 – Construction of a new high-speed rail line
This case refers to a real case. Most of the data have been generated by the promoter of the project when it was appraised. Some additional data have been introduced as part of the case.The main features of this case are:• The demand models used incorporate several modes and are also directly used – as part of
the preparation of the forecast – to calculate the changes in consumers’ surplus. • The effect on the budget balance of the national government is measured explicitly.
1. Main purpose of the project
The project is the second phase of a new high-speed (HS) line between a major provincial town and a coastal area. The project comprises 155 km, to be completed 7 years after commencement of construction. The first phase, some 500 km, was completed 9 years ago, connecting a national capital city with a regional capital city. The line will be served by new high-speed trains, capable of operating at speeds of up to 350 km/h on the new line.
2. Technical characteristics of current situation
All the cities that will be linked by the new section of high-speed line are connected by conventional rail at the present time, and will be assumed to remain so in the reference case. In this alternative it is also assumed that investments would be made as usual in rolling stock and that reinvestments would be undertaken as required in order to minimise overall costs of the railway services. All these costs are reflected in the do-minimum alternative in the economic analysis.
3. Project description
The project is mainly greenfield and therefore includes a new double track, with associated right of way, for 155 km. In addition, 3 new railway stations will be constructed. The capacity of the new line is estimated at 200 trains per day. The existing rail network and services will remain, albeit be reduced, in the project case.
The CBA of the project has been determined for a period of 37 years, reflecting a seven-year design and construction period and 30 years of operation. It is assumed that GDP grows on average by 2.5% p.a.
4. Demand
The annual rail passenger transport market served by the line is estimated at less than 3 million one-way journeys. The project is expected to have a significant impact on the market, resulting primarily from sharply reduced rail travel times (from 75 minutes to 100 minutes depending on the O/D).
Based on earlier experience and by using econometric demand functions, the promoter has estimated that the project will result in a total growth in the number of one-way rail journeys of 100% in comparison with the case without the project.
The change in demand reflects the assumption that the new line will capture a substantial part of the air transport market, attract part of the present road traffic and induce new traffic. After initiation of the high-speed services, the promoter expects that growth will be high for about 7 years, as experienced by other high-speed routes after opening of services. Eventually – after 7 years – growth is assumed to slow down and to be more or less in line with growth in GDP. Again, this pattern is demonstrated by existing high-speed lines, for which sustained growth has been experienced.

R A I L P A G R a i l w a y P r o j e c t A p p r a i s a l G u i d e l i n e s – A n n e x e s 125
5. Costs
Investments
The investment expenditures are set out in Table 1, for both the rail operator and the rail manager. Additional investments in rolling stock will have to be made by the rail operator in order to accommodate the increase in traffic. These investments are reflected in the analyses (25 years is assumed to be the economic life of the high-speed trains and other rolling stock).
Table 1: Investment expenditures (EUR million)
Rail manager Rail operator
Year Infrastructure Rolling Stock
1 2
2 28
3 29
4 492
5 279
6 312
7 307 62
8 99 93
9
10
Maintenance and operating costs
Operating costs have been estimated separately for the manager and the operator and are based on detailed assumptions about the various resources required in the with and without project case.
The maintenance costs are about 84,100 EUR per kilometre and year and the operation costs are estimated to be 8,400 EUR per kilometer and year. In addition, every 20 years, 2,4 M EUR per kilometre will be needed for major renovations.
The operation costs for rail operators are estimated to be 0.05 EUR per user-kilometer for high speed trains and 0.04 EUR per user-kilometer for trains running at around 250 km/h.
The operating costs for the operator include the track charges and station charges to be paid to the manager and have been calculated in accordance with the basic principles applicable in the country for the setting of these charges. Track charges are per train-km and station charges per user. They vary with the type of train service, being higher for high-speed lines, with differences between those with high and low traffic.
6. Benefits
User benefits and evaluation
User benefits, i.e. changes in consumers’ surplus, are measured directly by way of the demand functions that are employed. The user benefits mainly reflect time savings made by traffic on the existing railway traffic, diverted traffic and generated traffic. The values of time implicit in the demand models are as set out in Table 2. It is assumed that real values of time grow at 1%, an assumption which is reflected in the calculations of the user benefits.

R A I L P A G R a i l w a y P r o j e c t A p p r a i s a l G u i d e l i n e s – A n n e x e s126
D 10
Table 2: Average values of time
Type €/h
Air 12
Rail 8
Private car 10
Bus 6
External effects
The model takes full account of the external effects produced by the project due to changes in modal split and generated traffic. In addition, account is taken of the fact that diversion of traffic away from air transport and roads will result in less congestion on the roads. The quantitative impact thereof has been calculated by way of a separate analysis. The parameter values used are of the same nature and order of magnitude as those used by several European countries for evaluating external effects in the transport sector.
7. Results of Economic analysis
The project shows a positive rate of return.
8. Results of Stakeholder analysis
This project is characterised by substantial subsidies from the national government. The main beneficiaries are rail users in the form of time savings. Also the rail manager and rail operator will benefit from the project. The part of the public burdened by external effects will see its situation improved.
9. Comments
This project is highly sensitive to the demand forecast. It must therefore be viewed as risky, and would warrant additional analysis to shed further light on this particular aspect.
Construction of a new high-speed rail line

R A I L P A G R a i l w a y P r o j e c t A p p r a i s a l G u i d e l i n e s – A n n e x e s 127
ECO
NO
MIC
EVA
LUAT
ION
NPV
2000
2001
2002
2003
2004
2005
2006
2007
2008
2010
2015
2025
2038
COST
S; m
illio
n €
Proj
ect c
ost
Inve
stm
ent e
cono
mic
cos
t12
702
2829
492
279
312
369
192
00
014
0C
ost t
o ra
il m
anag
er
1171
228
2949
227
931
230
799
00
00
0C
ost t
o ra
il op
erat
or (r
ollin
g st
ock)
990
00
00
062
930
00
140
Taxe
s p
aid
by ra
il m
anag
er
187
04
579
4550
4916
00
00
0Ta
xes
pai
d by
op
erat
or16
00
00
00
1015
00
02
0Re
sidu
al v
alue
660
00
00
00
00
00
077
4
Do
min
imum
cos
tIn
vest
men
t eco
nom
ic c
ost
00
00
00
00
00
00
00
Cos
t to
rail
man
ager
0
00
00
00
00
00
00
0C
ost t
o ra
il op
erat
or (r
ollin
g st
ock)
00
00
00
00
00
00
00
Taxe
s p
aid
by ra
il m
anag
er &
op
erat
or0
00
00
00
00
00
00
0Re
sidu
al v
alue
00
00
00
00
00
00
00
Net
inve
stm
ent c
ost
Inve
stm
ent e
cono
mic
cos
t12
702
2829
492
279
312
369
192
00
014
0C
ost t
o ra
il m
anag
er
1171
228
2949
227
931
230
799
00
00
0C
ost t
o ra
il op
erat
or99
00
00
00
6293
00
014
0Ta
xes
pai
d by
rail
man
ager
18
70
45
7945
5049
160
00
00
Taxe
s p
aid
by o
per
ator
160
00
00
010
150
00
20
Resi
dual
val
ue66
00
00
00
00
00
00
774
O&
M c
ost f
or ra
il m
anag
er98
00
00
00
00
1212
1212
12O
&M
cos
t for
rail
oper
ator
276
00
00
00
00
2123
3043
69
Tota
l fin
anci
al c
ost
1220
2.5
27.6
2949
2.1
278.
931
1.6
379.
220
6.5
00
016
.2-7
74To
tal e
con
omic
cos
t15
782
2829
492
279
312
369
192
3335
4270
-693

R A I L P A G R a i l w a y P r o j e c t A p p r a i s a l G u i d e l i n e s – A n n e x e s128
D 10Construction of a new high-speed rail line
ECO
NO
MIC
EVA
LUAT
ION
BEN
EFIT
S; m
illio
n €
USE
RS Trai
n us
ers
Tim
e sa
ving
s24
40
00
00
00
030
3132
3122
Op
erat
ing
cost
s44
00
00
00
00
33
47
13Sa
fety
/Com
fort
00
00
00
00
00
00
00
Envi
ronm
enta
l ext
erna
litie
s0
00
00
00
00
00
00
0N
PV20
0020
0120
0220
0320
0420
0520
0620
0720
0820
1020
1520
2520
38
Priv
ate
vehi
cle
user
sTi
me
savi
ngs
570
00
00
00
07
78
75
Op
erat
ing
cost
s50
10
00
00
00
029
3551
8315
0Sa
fety
/Com
fort
150
00
00
00
00
910
1525
45En
viro
nmen
tal e
xter
nalit
ies
630
00
00
00
05
58
913
Bus
user
s0
Tim
e sa
ving
s11
00
00
00
00
11
11
1O
per
atin
g co
sts
00
00
00
00
00
00
00
Safe
ty/C
omfo
rt5
00
00
00
00
00
11
1En
viro
nmen
tal e
xter
nalit
ies
30
00
00
00
00
00
01
Air
user
s0
Tim
e sa
ving
s-5
50
00
00
00
0-7
-7-7
-7-5
Op
erat
ing
cost
s25
70
00
00
00
015
1826
4277
Safe
ty/C
omfo
rt69
00
00
00
00
45
711
21En
viro
nmen
tal e
xter
nalit
ies
330
00
00
00
02
34
57
Gen
erat
ed tr
affic
260
00
00
00
00
1819
2344
79
TRA
IN O
PER
ATO
RIm
pac
t on
reve
nue
699
00
00
00
00
5560
7610
816
7Im
pac
t on
reve
nue
991
00
00
00
00
7886
108
153
237
From
exi
stin
g us
ers
204
00
00
00
00
1618
2232
49Fr
om P
V us
ers
143
00
00
00
00
1112
1622
34Fr
om b
us u
sers
140
00
00
00
01
11
23
From
air
user
s13
20
00
00
00
010
1114
2032
From
gen
erat
ed tr
affic
207
00
00
00
00
1618
2232
49A
dditi
onal
VAT
from
gen
erat
ed tr
affic
290
00
00
00
02
23
47
RA
IL M
AN
AG
ERTr
ack
char
ges
420
00
00
00
00
3135
4566
105
AIR
OPE
RAT
OR
264
00
00
00
00
2123
2941
63
BU
S O
PER
ATO
R11
00
00
00
00
11
12
3
Tota
l eco
nom
ic b
enef
its
1643
00
00
00
00
117
131
175
260
428
Econ
omic
ben
efit
-cos
ts64
-2-2
8-2
9-4
92-2
79-3
12-3
69-1
9284
9613
319
011
21
ERR
= 6
.8 %

R A I L P A G R a i l w a y P r o j e c t A p p r a i s a l G u i d e l i n e s – A n n e x e s 129
Rail
user
sD
iver
ted
user
sG
ener
ated
tr
affic
Rail
man
ager
Rail
oper
ator
Air
oper
ator
Bus
oper
ator
Loca
l no
n us
erN
atio
nal
GV
TEC
ON
OM
IC
VALU
ERo
adBu
sA
ir
USE
R SE
RV
ICE
Trav
el ti
me
244
5711
-55
257
Safe
ty15
05
6922
4
Gen
erat
ed T
raff
ic26
026
0
OPE
RAT
ION
Rail
oper
atin
g co
sts
44-2
76-2
32
Trac
k ch
arge
s42
0-4
200
Road
op
erat
ing
cost
s50
150
1
Air
tran
spor
t op
erat
ing
cost
s25
725
7
Fare
s-2
04-1
43-3
132
-207
699
-264
-11
0
VAT
-29
290
ASS
ETS
Infr
astr
uctu
re-1
171
-117
1
Rolli
ng s
tock
-99
-99
Resi
dual
val
ue66
66
Taxe
s-1
87-1
620
30
Infr
astr
ucut
re m
aint
enan
ce-9
8-9
8
ENV
IRO
NM
ENTA
L EX
TERN
ALI
TIES
9999
8456
513
403
25-9
71-1
11-2
64-1
199
232
64
ERR
= 6
.8 %

R A I L P A G R a i l w a y P r o j e c t A p p r a i s a l G u i d e l i n e s – A n n e x e s130
E References
This annex contains comments on relevant references prepared by CENIT and used as background for RAILPAG.

R A I L P A G R a i l w a y P r o j e c t A p p r a i s a l G u i d e l i n e s – A n n e x e s 131
TITLE White Paper:
European transport policy for 2010: time to decide
AUTHOR/SCommission of the European Communities
EDITORCommission of the European Communities
YEAR 2001
INSTITUTIONS INVOLVED
Commission of the European Communities
SUBJECT European transport policy for 2010
SUMMARY
The aim of this document is to analyse the main current problems existing in the European transport network and propose counter measures in order to improve it in terms of efficiency and sustainability. Nowadays, there is a growing imbalance among modes of transport in the European Union. The increasing success of road and air transport is resulting in worsening congestion, while, paradox ically, failure to exploit the full potential of rail and short-sea shipping is impeding the development of real alternatives to road haulage.
A sign of this imbalance is that over the last 30 years an average of 600 km of railway lines have been closed each year in Europe, while at the same time the motorway network has increased by 1200 km a year. Of the thousands of kilometres of lines which have been closed to traffic, or even dismantled, there are branches and lines which today would have been extremely useful for coping with saturation on parts of the rail network.
Railway infrastructure is no longer able to cope with the growth in traffic and, in recent years, more and more bottlenecks have formed in the vicinity of the largest conurbations, where trains of different types share the same infrastructure. Priority is given to passenger trains, with the result that goods consignors have lost confidence in the railways. Between 1970 and 1998 the share of the goods market carried by rail in Europe fell from 21.1% to 8.4% (down from 283 billion tonnes per kilometre to 241 billion), even though the overall volume of goods transported rose spectacularly.
Because of congestion, there is a serious risk that Europe will lose economic competitiveness. The most recent study on the subject showed that the external costs of road traffic congestion are 0.5% of European Community GDP and will reach 1.0% by 2010, which entails 80 billion euros a year.
In this context, rail transport is the strategic sector, on which the success of the efforts to shift the balance will depend. Revitalising this sector means competition among the railway companies themselves. The priority is to open up the markets, not only for international services, but also for cabotage on the national markets (to avoid trains running empty) and for international passenger services.
R A I L P A G R a i l w a y P r o j e c t A p p r a i s a l G u i d e l i n e s – A n n e x e s132
The European Commission has been studying a package of measures which should restore the credibility, in terms of regularity and punctuality, of this mode in the eyes of operators, particularly for freight. Step by step, a network of railway lines must be dedicated exclusively to goods services so that, commercially, railway companies attach as much importance to goods as to passengers.
This package will have to take into account tasks of general interest and economic and territorial cohesion, and will include:
• opening up the national freight markets to cabotage;
• setting high safety standards for the rail network, based on regulations established by an independent body and on a clear definition of the responsibilities of each player involved in order to ensure smooth operation of this market in which several operators will share the same stretches of the network;
• updating the Interoperability Directives to harmonise the technical requirements and provisions on use of all components of high-speed and conventional railway networks;
• gradual opening-up of international passenger services;
• promotion of measures to safeguard the quality of rail services and users’ rights; and
• creation of a Community structure for safety and interoperability.
Related to the above measures, Member States may introduce rates that take into consideration environmental costs and other external costs connected with accidents and congestion. The instruments for integrating infrastructure costs and external costs are, firstly, charging for infrastructure use, which is a particularly effective means of managing congestion and reducing other environmental impacts, and, secondly, fuel tax, which lends itself well to controlling carbon dioxide emissions.
The European Commission plans to propose a framework Directive to establish the principles of infrastructure charging and a pricing structure for all modes of transport. The proposal, which leaves each Member State a wide scope in terms of implementation, will include a common methodology for setting price levels which incorporates external costs, and will specify the conditions for fair competition between modes
ReferencesE

R A I L P A G R a i l w a y P r o j e c t A p p r a i s a l G u i d e l i n e s – A n n e x e s 133
TITLEGoing Trans-European.
Planning and financing transport networks for Europe
AUTHOR/S Mateu Turró
EDITOR Pergamon, Elsevier YEAR 1999
SUBJECT Planning and financing transport investments
SUMMARY
In this book we can find a profound reflection on the present state of European transport networks. The most important topical issues analysed are the planning and financing of European transport projects, taking into account subjects such as future challenges in Europe, the Community policy on transport infrastructure, the priority projects, etc.
The new transport network framework proposed by Dr. Mateu Turró is based on the goals of efficiency, sustainability and cohesion. Specifically, he translates these general principles into more detailed objectives:
a) integration of Member States action;
b) integration between the infrastructure policy and other common policies;
c) multimodal integration; and
d) integration of the European, national, regional and local scales.
To try to achieve these objectives, the author suggests quite a few different procedures. Some of them concern transport investment appraisal directly, e.g.:
• Applying the “polluter pays” principle and adequate payment mechanisms;
• Introducing global and long-term considerations in major transport infrastructure planning;
• Ensuring that environmental considerations have been adequately taken into account in decision-making on investment in transport infrastructure;
• Using the design and implementation of major transport investments to enhance social cohesion.
In chapter 7, the reader can find an excellent summary of the funding options of the Trans-European transport projects, in relation to an important subject: the ideal level of co-operation between the public and private sector.
Finally, the last themes analysed are the expected and needed improvements for the future of transport: in relation to European policy, investment financing, additional funds, the European Institutions, etc.

R A I L P A G R a i l w a y P r o j e c t A p p r a i s a l G u i d e l i n e s – A n n e x e s134
ReferencesE
SUMMARY
This document introduces the principles that must be considered when studying a new investment connected with transport. Nowadays, there are a large variety of methods and values as regards the benefits and costs that a new transport infrastructure entails. The document is focused on obtaining general tools that can be used for different modes of transport in order to evaluate and establish a comparison among the alternatives proposed. Not only do the internal costs have to be taken into consideration but also the external costs and the nature of the investment.
As an example, the distribution of investments in the conventional network of SNCF, depending on their nature, is the following:
• 47% for maintenance investments;
• 30% for quality improvement; and
• 23% for safety.
Anyway, it is necessary to compare and contrast the present or future situation in which there is only the current transport infrastructure with the present or future situation considering the investments made and all of their consequences. In this process, the study has to take into account aspects such as traffic demand forecasts, shares of modes of transport, length of the journeys, safety conditions, comfort for passengers, external environmental costs (noise, vibrations, water pollution, air pollution), economic development and cost of the infrastructure.
In order to define traffic demand forecasts for its high-speed lines, SNCF considers:
• passengers using the existing conventional railway line;
• passengers using planes, who are known by using a price-time model; and
• generated traffic and traffic from the road.
Finally, one of the most difficult parts in the process of evaluation investments is how to quantify effects that refer to quality. Some impacts (especially environmental ones) can be determined in terms of cost of avoidance, cost of repairs, indemnities and costs which society is willing to pay so as to reduce nuisance.
TITLETransports: pour un meilleur choix des investissements
Transports: for a better choice of investments
AUTHOR/S Marcel Boiteux et al.
EDITOR La Documentation Française YEAR 1994
INSTITUTIONS INVOLVED
Commissariat Général du Plan
SUBJECT Principles and general considerations about transport investments

R A I L P A G R a i l w a y P r o j e c t A p p r a i s a l G u i d e l i n e s – A n n e x e s 135
SUMMARY
The Transport Infrastructure Needs Assessment (TINA) process was designed to initiate the development of a multi-modal transport network within the territory of the candidate countries for accession: Estonia, Latvia, Lithuania, Czech Republic, Slovakia, Hungary, Poland, Slovenia, Romania, Bulgaria, and Cyprus. This network development, which takes into account relevant work of the UN-ECE and previous analysis of the European Commission assisted by groups of experts from the Member States, should comply with the principles, objectives and criteria as set out in the guide for the development of a Trans-European Transport Network in the territory of the European Union (Decision No 1692/96/EC of the European Parliament and of the Council on Community guidelines for the development of the trans-European transport network).
This study establishes a common methodology for project appraisal to be endorsed by international financial institutions. So it must be regarded a guide in order that TINA project proposals, for submission to the various international financial institutions and organisations by different states, can be selected and appraised.
The use of a Framework approach is recommended, containing at its core a cost-benefit analysis of those elements that can justifiably be evaluated in monetary terms. The socio-economic cost benefit analysis was placed in the context of a necessary wider project and investment appraisal, which covers safety, environmental and policy-related aspects.
The initial stages of the assessment methodology for publicly funded projects include the definition and initial screening of candidate projects. Screening should include ensuring that projects are adequately defined, identifying their board performance relative to main indicators, identifying other dependent projects and assessing barriers to implementation. For those projects that are carried forward to a formal appraisal, it is necessary to assess the effects or impacts on a key group of indicators such as transport system efficiency and safety, environmental impacts, wider policy impacts and financial implications.
Comparing the state of these indicators in the do-minimum scenario with their state in the do-something scenario assesses the effects of the project. In order to form this comparison it will be necessary to collect data and other relevant information relating to the indicators. The cost-benefit analysis, which forms the core of the assessment, is then calculated using both computed costs and benefits.
TITLE TINA Socio-economic Cost Benefit Analysis
AUTHOR/SProf. Peter Mackie, Dr. Susant Grant/Muller, Mr. John Nellthorp and Prof. Alan Pearman
EDITOR TINA Secretariat YEAR 1999
INSTITUTIONS INVOLVED
Commission of the European CommunitiesTINA Secretariat University of Leeds
SUBJECT Appraisal guidance for TINA project proposals

R A I L P A G R a i l w a y P r o j e c t A p p r a i s a l G u i d e l i n e s – A n n e x e s136
E References
Apart from that, the use of spreadsheet software is recommended because storing data in a relatively detailed form within a spreadsheet or similar would assist the sensitive testing process (on particular parameters or values), ease the updating of information and allow decision-makers to form comparisons more readily.
The project analyses the context of the appraisal of a single project but concludes that the real world is more complex and, typically, that the decision-makers need to assure themselves that they have chosen the best of the available alternatives, and that the project is sufficiently high in the merit or ranking order to warrant funding. But, although the analysis must be capable of allowing for the existence of many project alternatives and should facilitate prioritisation, the task of weighing up the economic, environmental and policy impacts in order to determine ranking, rests with the decision-makers themselves.
It’s not possible to undertake a complete appraisal of all the project alternatives because of the large number of combinations of routing, alignment, layout and capacity. However, and especially where strategic routing options exist, the full appraisal of a few alternatives should be undertaken so as to demonstrate that the preferred option is superior, not just to the do-minimum but to the available alternatives. This should help to minimise the risk of over- or under design. For large projects, where many technical choices exist, such as bridges and tunnels, many alternatives may need to be evaluated. But a full comparison between the project alternatives will be needed based on each of the criteria listed in the appraisal framework, in theory. In practice, however, it is likely that for several of the impacts, the performance of the project options will be similar or identical so that in comparing alternatives, it should be possible to focus on the aspects in which the project alternatives differ. These are likely to be in cost-benefit analysis plus any location specific effects of particular alternatives (loss of heritage, natural assets, opportunities created, etc.)
In terms of cost-benefit analysis, the decision taker should consider whether the net differences in user benefit, revenue and operating costs justify the additional capital outlay for each project alternative. The analysis should list the alternatives in ascending order of capital cost and show the incremental Net Present Value (NPV) for each increment of capital outlay thus showing a a form of incremental analysis.
But, usually not all the acceptable projects can actually be funded. In this situation, prioritisation becomes important. So, in terms of project appraisal and conditions of capital rationing, it’s recommended that some form of explicit prioritisation or ranking exercise be undertaken between the projects being considered. The key indicator for this will be the cost-benefit- ratio (CBR) of projects because this is the indicator of benefit per unit of capital cost, obtained for each project. But a single indicator will not take into account important differences between projects and will be an incomplete measure.
A more complete approach will require the decision-maker to balance or trade-off the performance of the project in terms of the cost-benefit, environmental and wider policy dimensions with information and support of the socio-economic analysis.

R A I L P A G R a i l w a y P r o j e c t A p p r a i s a l G u i d e l i n e s – A n n e x e s 137
SUMMARY
The aim of this study is the elaboration of a methodology for planning the investments of the Autoritat del Transport Metropolità, an organisation that regulates the public transport in the metropolitan area of Barcelona (Spain). This study is included in the Master Plan of Public Transport Infrastructures 2001-2010.
The public investment project appraisal allows the PTA to know which is the most beneficial project for the whole community or for a group. This is a very difficult task for transport investments because of the generation of several, different and difficult to calculate costs and benefits. The main benefit of transport investments used to be the time saving aspect but there are other impacts that can be important such as environmental externalities or safety.
There are several methodologies for evaluating projects. Some of them are very well known – for instance, cost-benefit analysis – but there are other useful ones that have had less exposure – e.g., the achievement of objectives matrix. Apart from that, these methodologies consider not only different sorts of costs and benefits but also different valuations and aggregations of them.
Six appraisal methods were compared: investment financial appraisal; cost-benefit analysis; multicriteria analysis; cost-effectiveness analysis; achievement of objectives matrix and threshold analysis.
The analysis of these six methods led to an elimination of the less useful ones when analysing a public transport investment alternative appraisal in the metropolitan area of Barcelona and the study used the most apposite methods, which are the multi-criteria analysis and the cost-benefit analysis. The fact that both methodologies have their benefits and problems led to the formulation of a mix model in order to make the best use of the benefits and avoid any disadvantages. Besides this, availability of the data is another possible handicap that must be taken into account.
This mix method appraises with a cost-benefit analysis all the impacts (in monetary terms or not, depending on the availability of good data). Basically, the features in monetary terms are the investment costs, the operating costs and maintenance costs and non-monetary impacts with monetary value in the metropolitan area of Barcelona are variation in travel time, variation in safety and some environmental externalities such as air pollution or noise.
TITLE
Metodologia per a l’avaluació d’alternatives d’inversió en transport públic
Methodology for the appraisal of public transport investment options
AUTHOR/S Pere Riera and Margarida Macian
EDITOR Autoritat del Transport Metropolità YEAR 1998
INSTITUTIONS INVOLVED
Autoritat del Transport MetropolitàUniversitat Autonoma de Barcelona
SUBJECT Profitability of public investments. Planning public transport investments

R A I L P A G R a i l w a y P r o j e c t A p p r a i s a l G u i d e l i n e s – A n n e x e s138
First of all, it appraised the economical efficiency of projects. It has got an important weight but there are other factors related to the viability of the operators and social equity that must be taken into account. The incorporation of these indicators in the appraisal process is done by multi-criteria analysis.
Afterwards, five criteria are used in a multi-criteria analysis:
• social economic profitability, appraised by the cost-benefit analysis (internal economic rate of return);
• private economic profitability, appraised by the cash-flow of the operator (net present value);
• increase in potential accessibility, in terms of the increase in the number of inhabitants served;
• increase in the supply of public transport, comparing the value of the indicators based on daily public transport trips and people served with and without project; and
• equity, that shows if the new situation leads to a more equal distribution of the resources for the whole of society or not.
The proposed method of aggregation can synthesise the impact of projects in a quantitative way. It has got three important benefits: its simple application, its easy interpretation and the possibility of obtaining a complete ranking of all the projects to be appraised. So, the final result will be a global index of the social need for every project.
ReferencesE

R A I L P A G R a i l w a y P r o j e c t A p p r a i s a l G u i d e l i n e s – A n n e x e s 139
SUMMARY
At the end of the 1980’s and the beginning of the 1990’s in Spain a new impetus was given to the financing and construction of rail infrastructure. In that socio-political framework the Ministerio de Transportes, Turismo y Comunicaciones promoted the elaboration of the “Manual de evaluación de inversiones en ferrocarriles de vía ancha”.
The main objective of this document is to measure the contribution from each investment project in relation to the objectives defined by the government; going beyond the purely financial investment in appraisal of infrastructure projects.
For the analysis of the different railway investment projects it proposes an evaluation of the aforementioned on three different levels (including the option of not investing at all):
• Financial evaluation: It outlines a balance, by means of typical indicators, between expenses and revenues during the service life of the public work. It is based on real prices, including taxes and subsidies.
• Economic evaluation: Costs and profits are compared, for real market value (excluding taxes and subsidies).
• Social evaluation: The fundamental aspect to keep in mind is social fairness. Looking at themes such as the impact on the environment, the effect on the growth of employment or energy consumption is also included.
The most remarkable quality in the proposed procedure is that it is compact, practical and self-sufficient, so that it only requires a periodic upgrading of the indexes. Also, it outlines a control method of the effectiveness of the investment once the project is executed and in operation.
In spite of the obvious advantages of the document, there exists, however, some limitations for the use of this methodology in a European environment.
• On the one hand it should be pointed out that the method is set up from a local point of view. It is also programmed assuming that there is only one owner of the infrastructure, who is also the agent and the operator.
TITLEManual de evaluación de inversiones en ferrocarriles de vía ancha
Manual of wide-gauge railway investment appraisal
EDITOR
Dirección General de Infraestructura del TransporteMinisterio de Transporte, Turismo y Comunicaciones
YEAR 1987
INSTITUTIONS INVOLVED
Dirección General de Infraestructura del TransporteMinisterio de Transporte, Turismo y Comunicaciones
SUBJECT Profitability of railway investments
R A I L P A G R a i l w a y P r o j e c t A p p r a i s a l G u i d e l i n e s – A n n e x e s140
• It establishes the convenience of carrying out (or not) certain investments in railways but it does not include an analysis of investments in other transport modes.
• It does not consider, in a general way, the external effects of transport.
• The social and environmental effects considered are not always translated into monetary terms.
Finally, and to conclude, the analysed document proposes a procedure to evaluate investments in railways that is normative, specific, self-sufficient and easy to review periodically; but whose layout is local (both geographically and in terms of transport modes) and it also suffers from a lack of the externality concept.
E References

R A I L P A G R a i l w a y P r o j e c t A p p r a i s a l G u i d e l i n e s – A n n e x e s 141
SUMMARY
This document analyses in a systematic way the issues involved in the incorporation of externalities in the socio-economic evaluation of transport projects. There were analysed, and quantified absolute and relative costs of air pollution as well as noise and global warming for the different transport modes. Although the results provided in this paper are quite old, the methodology of obtaining them and the differences of rates between countries has still got great value.
According to the obtained results and regarding air pollution, external costs were in the range of 0,3% to 1% of GDP for the seventeen UE studied countries (EUR 17). Average relative costs for passenger transport in EUR 17 were highest for cars and aviation and significantly lower for railways (about 6 and 5 ECU/1000 pass-km for cars and aviation respectively, and about 2 ECU/1000 pass-km for railways). In the domain of freight transport, average relative costs were highest by far for aviation (about 26 ECU/1000 ton-km), followed by road transport (13 ECU/1000 ton-km). Shipping on inland waterways and rail showed significantly lower values (about 4 and 1 ECU/1000 ton-km respectively).
Annual noise costs of transport added up to 0,65% of the GPD on average in EUR 17. In terms of relative costs, EUR 17 average relative costs for passenger transport are 4,5 ECU/100 pass-km for cars, 4,2 ECU/1000 pass-km for buses and 3,1 ECU/1000 pass-km for rail transport and the EUR 17 average noise costs for freight transport are 12,7 ECU/1000 ton-km for road transport and 4,7 ECU/1000 ton-km for rail transport.
In relation to the climate change, it can be concluded that overall prevention costs represent about 0,7% of GPD for EUR 17. For passenger transport, relative costs are highest for aviation (below 10 ECU/1000 pass-km), but are also high for cars (about 6 to 7 ECU/1000 pass/km). Values are slightly below 3 ECU/1000 pass-km for buses and rail. Apart from that, airfreight transport (about 50 ECU/1000 ton-km) showed the highest value and railways freight transport (about 1 ECU/1000 ton-km), the lowest.
TITLEEffets Externes du Transport
External Effects of Transport
AUTHOR/S S.P. Mauch and W. Rothengatter
EDITOR INFRAS and IWW YEAR 1994
INSTITUTIONS INVOLVED
International Union of Railways, UICUniversität Karlsruhe Institut für Wirtschaftspolitik und Wirtschaftsforschung, IWW
SUBJECT External effects

R A I L P A G R a i l w a y P r o j e c t A p p r a i s a l G u i d e l i n e s – A n n e x e s142
E References
SUMMARY
It recommends a consistent methodology, quantitative measures of profitability and validity as indicators of a project’s worth in the evaluation of transport projects. But, a consistent method ology implies using consistent parameters, to the greatest extent it is possible to estimate them. So, this document presents recommended parameter values for EU member countries, as main inputs into the standard cost-benefit analyses conducted at the EIB in the case of transportation projects, namely the value of time savings and the value of safety.
The value of time is by far the most important variable used in appraising transport projects. About the valuation of travel time, this report says that:
• “The value of working time for a traveller should be equal to the average gross wage in that country”.
• “Values for non-working time should be valued as a proportion of net wages”. On average, these represent about 35% and 25% of the gross wage.
This paper also provides a methodology for estimating the growth in the value of time, because it increases with real wages. For appraisals, it is proposed to use an annual growth rate of 1,5% for the real value of time in all the EU countries. However, in Spain, Portugal, Ireland and Greece, it is recommended to use a growth rate of 2% a year in the short and medium term and 1,5% after 2005. It is also recommended to keep the proportional relationship of working time to non-working time in member countries constant over time.
Apart from that, the value of time could be expected to vary according to the mode of transport. Their concept of the value of time includes a disutility of transport (except arguably in the case of working time), and this would also tend to vary with the mode of transport.
The value of time could also be expected to vary according to regions within a country. Regions will differ in their income levels based on such factors as industry mix, the degree of specialisation in production and the existence of other externalities in production due to an urban environment. So, national values outlined in the tables of results should be altered to reflect particularly significant regional differences.
TITLEHarmonising Parameter. Values in Transport Project Appraisal: The Values of Time and Safety*
Foot note: This document has been recently updated.
AUTHOR/S Pierre Vilain
EDITOR EIB Projects Directorate YEAR 1996
INSTITUTIONS INVOLVED
European Investment Bank
SUBJECT Evaluation of Time and Safety
* This document has been recently updated

R A I L P A G R a i l w a y P r o j e c t A p p r a i s a l G u i d e l i n e s – A n n e x e s 143
For non-member countries (not available in tables), it is encouraged that all value of time estimates be based, to the greatest degree possible, on wage data. The short and medium-term growth rate of the value of time should reflect expected economic growth rates considerably above those forecast for member countries.
On the other hand, values for safety improvements would ideally be based on an individual’s own evaluation of these improvements. Unfortunately, the empirical results of estimation of individual valuations for reduction risk, yield divergent results. So, while an individual’s risk evaluation may take into account the effects of her/his death or injury, it is likely that the wider social cost (which would include, for example, lost human capital) is not taken into account.
According to these considerations, a “hybrid” cost of fatalities is proposed, composed of two different costs. The first is the “human capital” cost the value of which is based on several variables and is different across EU countries. The second is the average “human suffering” cost, equal for all EU countries in its base value, but adjusted for variations in purchasing power. This value is estimated from an average of official values from member states for human suffering and material damages used in project evaluation.
The annual growth rates of these values should be the same as used for the value of time.

R A I L P A G R a i l w a y P r o j e c t A p p r a i s a l G u i d e l i n e s – A n n e x e s144
E References
SUMMARY
Within ExternE Transport a new methodology for quantifying energy-related environmental externalities of transport based on a bottom-up approach was developed. This methodology allows the calculation of marginal external costs of different transport activities in a detailed and consistent way, considering operation and the life cycle of the transport modes.
Energy-related impacts and associated costs resulting from transport activities are assessed using the “impact pathway” approach, which was developed in the ExternE Project. The “impact pathway” is the sequence of events which links a “burden” to an “impact”. The main stages of the ‘impact pathway’ are: emission modelling, dispersion modelling, estimation of physical impacts using exposure-response functions and, finally, the monetary valuation of impacts.
The methodology was applied to a variety of case studies in different countries, giving a European-wide overview of site-specific results. The technologies assessed cover passenger and goods transport with road, rail, and waterway transport.
It can be concluded that health impacts dominate the damages quantified in this study; in particular, mortality due to primary (PM2.5) and secondary particulates (nitrates, sulphates). Carcinogens, which were expected to play an important role due to their high specific toxicity, proved to be of much lower importance compared to the particles.
It was found that the population density around a road is a key parameter for the magnitude of impacts, particularly for diesel fuelled vehicles. This effect is caused mainly by the importance of the primary particles for the total damage. With respect to the occurring site-specific damages, three main categories of locations could be identified: agglomerations, urban areas, extra-urban areas.
TITLE External costs of transport in Europe(EXTERNE)
AUTHOR/S(Coordinator)
P. Bickel, S. Schmid, W. Krewitt, R. Friedrich
EDITOREuropean Commission DG Transport & Energy
YEAR 1996 - 1997
INSTITUTIONS INVOLVED
European Commission DG Transport & EnergyInstitute for Energy Economics and Rational use of Energy (IER)Institute of Occupational Medicine LtdAssociation pour la Recherche et le Développement des Méthodes et Processus IndustrielsNational Technical University of AthensAEA Technology PlcInstitut National de l’Environnement Industriel et des RisquesVrije Universiteit AmsterdamUniversità Commerciale Luigi Bocconi
SUBJECT Energy externalities in transport

R A I L P A G R a i l w a y P r o j e c t A p p r a i s a l G u i d e l i n e s – A n n e x e s 145
The external costs due to airborne pollutants and greenhouse gases quantified in the different case studies were between 0.005 to 0.051 ECU/pkm (passenger kilometre) for petrol cars fitted with three way catalyst, depending on the location (low value for extra-urban areas, high value for agglomerations). For diesel cars the range quantified was 0.020 to 0.375 ECU/pkm (extra-urban areas - agglomerations). Damages due to up- and downstream processes (fuel production, production, maintenance and disposal of vehicles and infrastructure) were quantified to about 0.007 ECU/pkm for a car. Quantified external costs of passenger trains ranges from 0.001 to 0.007 ECU/pkm (electric and diesel train respectively). For electric and diesel goods trains the range quantified was 0.001 to 0.009 ECU/tkm (tonne kilometre), compared to about 0.040 to 0.300 ECU/tkm for heavy goods vehicles (different sizes and locations).

R A I L P A G R a i l w a y P r o j e c t A p p r a i s a l G u i d e l i n e s – A n n e x e s146
E References
SUMMARY
The research project “Policy assessment of trans-european networks and common transport policy” – acronym “TENASSESS’” – was financed by the European Commission within the framework of the 4th PCRD on transport.
Its main objectives were:
1. To provide a preliminary policy assessment methodology related to decision making on transport infrastructure investments and service evaluations; more specifically, the aim is to develop a methodology that could be utilised in the assessment of different solutions.
2. To provide a comprehensive policy assessment of the European Common Transport Policy (CTP) with a view to evolving recommendations that may assist its further development and implementation.
3. To provide input and data for further or parallel research on the subject.
The general focus of the project was on the decision making process in transport policy. It is considered that transport policy is complex as it is characterised by decisions that must consider lots of interests from different groups and actors.
In this research, special attention was paid to possible conflicts between different measures or objectives observed in the different geographical scales of concurrence (european, national, regional).
TITLE Policy Assessment of Trans-European Networks & Common Transport Policy
(TENASSESS)
AUTHOR/S(Coordinator)
Dr. Liana GIORGI
EDITOREuropean Commission DG Transport & Energy
YEAR 1996 - 1999
INSTITUTIONS INVOLVED
European Commission DG Transport & EnergyInterdisciplinary Centre for Comparative Research in the Social SciencesHalcrow FoxINRETSPLANCO Consulting GmbHSYSTEMAIVTBERRITRTUKONEANEILESECICCR-LondonUWCC
SUBJECT Decision process in transport policy

R A I L P A G R a i l w a y P r o j e c t A p p r a i s a l G u i d e l i n e s – A n n e x e s 147
SUMMARY
The broad aim of EUNET was to develop a comprehensive method for modelling and assessing the socio-economic impacts of new strategic transport initiatives.
There were four main strands to the work:
• The development of a new regional economic/transport modelling method, with the em phasis on research to extend the input-output framework which is at the heart of the approach.
• Recommendations on costs, prices and values to feed into the assessment process, including the development of a set of standardised ‘European’ values for use in assessments.
• Development of an assessment method and prototype assessment software, which can be linked to the regional economic/transport model, including the incorporation of accessibility analysis and the specific treatment of uncertainty.
• Application of the model and assessment tool to demonstration examples which can be linked to three demonstration models. The three demonstration examples cover the Trans-Pennine area of Northern England, the Baltic region and Greece.
The study includes a “Costs values and prices in appraisal” section aiming to provide a full set of values for the EUNET appraisal tool. Impacts which have been considered include direct impacts (such as time savings), environmental impacts, and socio-economic impacts (e.g. on employment).
TITLE Socio-Economic and Spatial Impacts of Transport Improvements
EUNET
AUTHOR/S(Coordinator)
Marcial Echenique & Partners
EDITOREuropean Commission DG Transport & Energy
YEAR 1996 - 1999
INSTITUTIONS INVOLVED
European Commission DG Transport & Energy Marcial Echenique & PartnersNational Technical University of AthensInstitute for Transport Studies, University of LeedsPlanco ConsultingInstitut National de Recherche sur les Transports et leur Sécurité (INRETS)Facultés Universitaires Catholiques de MonsTechnical University of Denmark; LT-Consultants, Finland; Gruppo CLASThe Interdisciplinary Centre for Comparative Research in the Social Sciences
SUBJECT Modelling socio-economic impacts of new strategic transport initiatives

R A I L P A G R a i l w a y P r o j e c t A p p r a i s a l G u i d e l i n e s – A n n e x e s148
There were three main tasks on the issues surrounding appraisal values, and a fourth task to construct a database of transport costs, as follows:
• to review current appraisal practice for major transport projects across member states. Information on member states’ current use of formal CBA (Cost-Benefit Analysis) and MCA (Multi Criteria Analysis) methods was gathered by the project partners and recorded in a series of Country Reports. Detailed information was requested on the scope of appraisals – the range of impacts included, which were monetised and how those monetary values had been derived.
• to identify the key issues to be addressed in developing the appraisal values for EUNET and to agree the approach.
• to prepare for each impact a common definition, units of measurement and accompanying monetary values where appropriate, using the information gathered through the Country Reports.
• to obtain operating cost data, by mode for each Member State where available, and develop a vehicle operating cost database.
It was decided that a European value set and a Country-Specific value set were necessary in EUNET. Although it could be argued that the philosophy underlying CBA implied the need to use local values (the values for the people actually affected by a project), projects of European significance will need to be appraised within a common framework for European Institutions to determine funding allocation issues. On the other hand, Member States may wish to appraise projects using a similar framework, though with values relating to country-specific objectives.
The list of impacts has been finalised using material from the country reports and the assessment work’s proposals for the framework variants. The key direct impacts have been defined and a set of EU and country specific values derived.
The assessment methodology developed within the EUNET project was expected to be innovative, but also to provide a functioning and practical product within the three years of the project.
Overall, the proposed EUNET assessment framework has three main steps:
• Decision tree: what are the project objectives, what criteria should be used to assess it and how are they connected
• Weighting: prioritisation of the criteria in the appraisal
• Evaluation and ranking: utilisation of criteria, weights and structure to meet the objectives.
E References

R A I L P A G R a i l w a y P r o j e c t A p p r a i s a l G u i d e l i n e s – A n n e x e s 149
SUMMARY
The general aim of the CODE-TEN project was to assist with decision-making in the complex environment of contemporary transport geography characterised by the new concept of “corridor”. It applies the scenario approach in order to elaborate consistent ‘images’ of the future that combine information on the socio-economic development, policy development and infrastructure planning. These are, in turn, subjected to impact assessment in order to reveal the effects or consequences of specific strategies.
The specific aims of CODE-TEN are:
1. Compilation of an information and political database about the development of trans-Europeancorridors within a global & long term perspective;
2. Elaborate scenarios for future development of CEEC/CIS countries affecting transport demand –Economy, Integration, Population & Policy Strategy;
3. Comparative analysis of the temporal and spatial impacts of socio-economic parameters on the development corridors;
4. Compile studies and indicators related to the environmental effects on European regions;
5. Develop a methodology for the assessment of transport policy and large-scale projects;
6. After this methodology development, define and develop political support tools aimed at improving the interaction between political instruments and corridors / networks;
7. Make recommendations for transport policy.
TITLE
Strategic Assessment of Corridor Developments, TEN Improvements and Extensions to the CEEC/CIS
CODE-TEN
AUTHOR/S(Coordinator)
The Interdisciplinary Centre for Comparative Research in the Social Sciences
EDITOREuropean Commission DG Transport & Energy
YEAR 1996 - 1999
INSTITUTIONS INVOLVED
The Interdisciplinary Centre for Comparative Research in the Social SciencesIFP, DenmarkVTT Technical Research Centre of FinlandSystema Systems Planning & Management Consultants s.a.CesurPlanco ConsultingTRT Transporte e TerritorioInstitute for Transport StudiesHalcrow FoxIncertransWEUGKTICTC EngineeringSCCTPTallinn College of Engineering
SUBJECT Scenario development

R A I L P A G R a i l w a y P r o j e c t A p p r a i s a l G u i d e l i n e s – A n n e x e s150
Different case studies were considered:
Corridor I: Warszawa – Riga – Tallinn – Helsinki – “Via Baltica”;
Corridor II: Berlin – Warszawa – Minsk – Moscou – Nizny Novgorod;
Corridor IV: Berlin – Prague – Vienne – Budapest – Sofia – Constanta / Thessaloniki;
Corridor V: Venise – Trieste / Koper – Budapest – Kiev;
Corridor VII: Danube waterways;
Corridor IX: St.. Petersburg – Helsinki – Stockholm – Copenhague;
Corridor X: Salzburg – Ljubljana – Zagreb – Beograd – Thessaloniki;
Corridor: Lisbonne – Madrid - Paris;
Zone MSS: Zone de transport à courte distance dans la Méditerranée (Mediterranean Short-sea Shipping).
As a result, the study provided:
• Scenario development – Development of scenarios up to the year 2015 for socio-economic development, integration and policy developments;
• Transport Information system – Development of a comprehensive information system on a CD-ROM on 30 European countries providing information on politics, regionalised socio-economic data, regionalised road information, foreign trade, transport costs – behavioural and resource costs, networks and maps;
• In-depth corridor studies – I, II, IV, V, VII, IX, X, the Mediterranean short sea shipping and the Lisbon-Madrid-Paris trans-European link;
• Development of infrastructure strategies based on priorities developed by combining the policy performance of projects with the degree of adaptability of projects to the national policy goals;
• Traffic flow estimations and assignments based on the development of the various scenarios and corridors up to the year 2015;
• Impact assessment of the various corridor development alternatives on accessibility, environment and socio-economic factors.
E References

R A I L P A G R a i l w a y P r o j e c t A p p r a i s a l G u i d e l i n e s – A n n e x e s 151
SUMMARY
MAESTRO’s aim is to provide practical advice on the selection, design and evaluation of transport-related pilot projects, to play a supporting role in the current 4th Framework Programme, and to assist with the preparation for future Programmes. In doing so, MAESTRO expects to strengthen the link between pilot projects and their contribution to identifiable policy aspects, thus bridging the gap between theoretical knowledge and practical applications and providing a synthesising role for pilot projects within the RTD Transport Research Programme. The MAESTRO project identifies the following main goals:
• to conduct a review of existing evaluation methodologies, and assess their value in relation to policy objectives;
• to develop a Maestro methodology for the selection, design and evaluation of pilot and demonstration projects within the Transport RTD workplan;
• to develop evaluation procedures to be incorporated into the MAESTRO methodology;
• to play a supporting advisory role in the Transport RTD programme in the setting up and establishment of all pilot and demonstration projects;
• based upon the MAESTRO methodology, to produce practical guidelines for the selection, design and evaluation of pilot and demonstration projects in the Transport RTD workplan.
TITLE
Acronym
Monitoring Assessment and Evaluation Scheme for Transport Policy options in Europe
MAESTRO
AUTHOR/S(Coordinator)
Dr. Laurie PICKUP
EDITOREuropean Commission DG Transport & Energy
YEAR 1998 - 1999
INSTITUTIONS INVOLVED
Transport & Travel Research LtdArise - European Economic Interest Grouping Technical Research Centre of FinlandNetherlands Economic InstituteBeratung und Planung im Verkehrswesen GmbhSalford University Business Services Limited Università degli studi di Roma “La Sapienza”Gestionnaires sans Frontières Romania Center of Interdisciplinary System Research AEA Technology PlcUniversity of LeedsSystems Planning and Management Consultants S.A. University of TwenteBarcelona Tecnologia S.A.European Transport and Telematics Systems Ltd.
SUBJECT Project appraisal

R A I L P A G R a i l w a y P r o j e c t A p p r a i s a l G u i d e l i n e s – A n n e x e s152
SUMMARY
PROFIT looked at options to bridge the gap between the financial profitability of TEN projects and their socio-economic rentability by facilitating and promoting public-private-partnerships (PPP) to finance and operate TEN projects. The project has:
• developed a structured methodology for assessing the PPP potential of a TEN project, based on financial attractiveness and socio-economic costs and benefits;
• defined and assessed the network effects in TENs;
• established an Expert Group consisting of private companies and government bodies in PPPs, which will function as a consultative body for the project;
• provided a user friendly and easy-to-use tool (handbook) to make a quick-scan of the PPP potential of a TEN or other infrastructure project.
TITLE
Acronym
Private Operation and Financing of Trans-European Networks
PROFIT
EDITOREuropean Commission DG Transport & Energy
YEAR 2000 - 2001
INSTITUTIONS INVOLVED
Netherlands Economic Institute (NEI)National Technical University of AthensThe University of LeedsSTRATECUniversity of North LondonTransek
SUBJECT PPP promoting and advising
E References

R A I L P A G R a i l w a y P r o j e c t A p p r a i s a l G u i d e l i n e s – A n n e x e s 153
SUMMARY
The IASON project (Integrated Appraisal of Spatial economic and Network effects of transport investments and policies) intended to provide the Commission with an assessment framework and procedures for the evaluation of transport policies and investments, and to produce new insights for assessments by studying spatial impacts of transport investments and policies.
For that purpose IASON has:
1. introduced a comprehensive but practical assessment framework for the evaluation of indirect effects;
2. used a set of EU level models for quantifying spatial and socio-economic impacts of transport investments and policies;
3. provided a methodology for the analysis and measurement of network effects and Communityadded value of TENs;
4. built up and maintained a discussion platform, and
5. provided recommendations for inclusion of indirect impacts in cost benefit analysis and the development of supporting tools and databases.
TITLE
Acronym
Integrated Assessment of Spatial Economic and Network Effects of Transport Investments and Policies
IASON
AUTHOR/S(Coordinator)
Tavasszy, Lorant A.
EDITOREuropean Commission DG Transport & Energy
YEAR 2001
INSTITUTIONS INVOLVED
Organisation for Applied Scientific Research TNO
SUBJECT Transport policies and investments evaluation
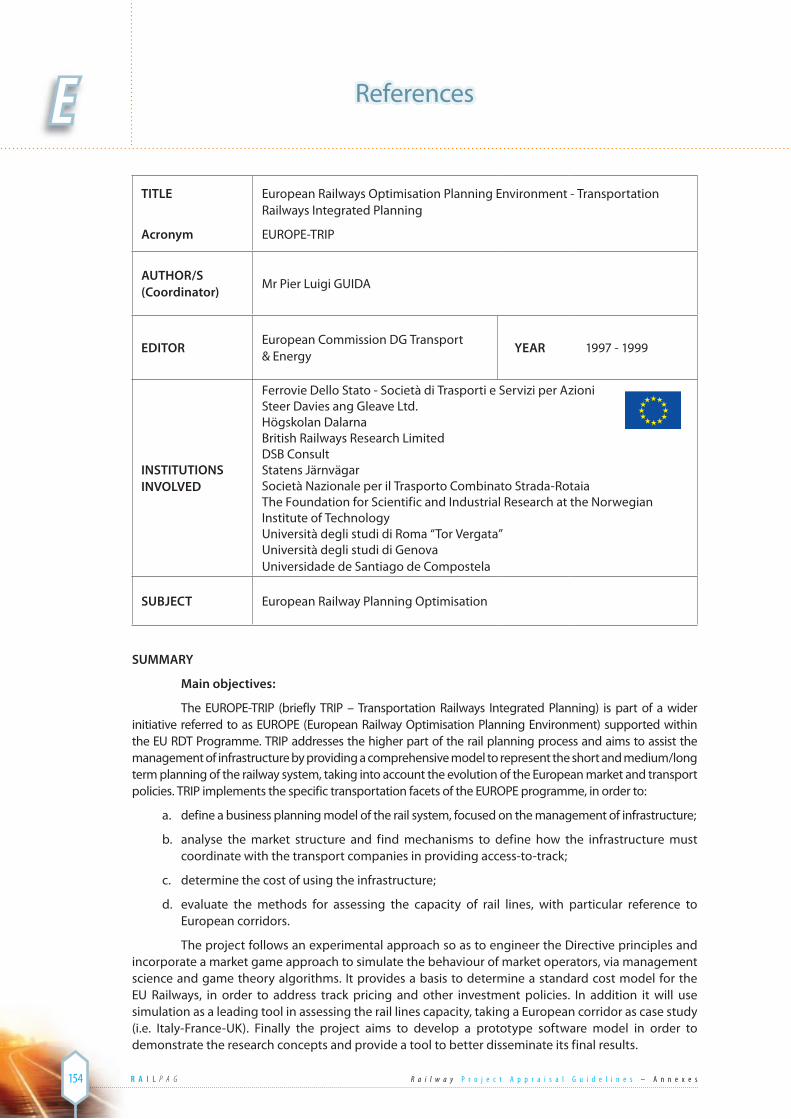
R A I L P A G R a i l w a y P r o j e c t A p p r a i s a l G u i d e l i n e s – A n n e x e s154
E References
SUMMARY
Main objectives:
The EUROPE-TRIP (briefly TRIP – Transportation Railways Integrated Planning) is part of a wider initiative referred to as EUROPE (European Railway Optimisation Planning Environment) supported within the EU RDT Programme. TRIP addresses the higher part of the rail planning process and aims to assist the management of infrastructure by providing a comprehensive model to represent the short and medium/long term planning of the railway system, taking into account the evolution of the European market and transport pol icies. TRIP implements the specific transportation facets of the EUROPE programme, in order to:
a. define a business planning model of the rail system, focused on the management of infrastructure;
b. analyse the market structure and find mechanisms to define how the infrastructure must coordinate with the transport companies in providing access-to-track;
c. determine the cost of using the infrastructure;
d. evaluate the methods for assessing the capacity of rail lines, with particular reference to European corridors.
The project follows an experimental approach so as to engineer the Directive principles and incorporate a market game approach to simulate the behaviour of market operators, via management science and game theory algorithms. It provides a basis to determine a standard cost model for the EU Railways, in order to address track pricing and other investment policies. In addition it will use simulation as a leading tool in assessing the rail lines capacity, taking a European corridor as case study (i.e. Italy-France-UK). Finally the project aims to develop a prototype software model in order to demonstrate the research concepts and provide a tool to better disseminate its final results.
TITLE
Acronym
European Railways Optimisation Planning Environment - Transportation Railways Integrated Planning
EUROPE-TRIP
AUTHOR/S(Coordinator)
Mr Pier Luigi GUIDA
EDITOREuropean Commission DG Transport & Energy
YEAR 1997 - 1999
INSTITUTIONS INVOLVED
Ferrovie Dello Stato - Società di Trasporti e Servizi per AzioniSteer Davies ang Gleave Ltd.Högskolan DalarnaBritish Railways Research LimitedDSB ConsultStatens JärnvägarSocietà Nazionale per il Trasporto Combinato Strada-Rotaia The Foundation for Scientific and Industrial Research at the Norwegian Institute of TechnologyUniversità degli studi di Roma “Tor Vergata”Università degli studi di GenovaUniversidade de Santiago de Compostela
SUBJECT European Railway Planning Optimisation

R A I L P A G R a i l w a y P r o j e c t A p p r a i s a l G u i d e l i n e s – A n n e x e s 155
SUMMARY
The SONERAIL project examines the role of socially necessary railways, i.e. those railways, which under EC regulations 1191/69 and 1893/91 cannot be provided on a commercial basis and may therefore be financially supported by a Member State. The overall workplan consisted of four main tasks as follows:
• Task 1: Establish the current situation with respect to definitions used and evaluation criteria applied along with the development of an evaluation methodology for socially necessary railways which can be applied to other passenger services. This will form the basis for the next stages;
• Task 2: Apply the developed evaluation methodology to specific passenger services with the aim of testing this methodology and utilising it to provide information about the performance of the selected passenger services;
• Task 3: Identify and assess future European operations scenarios which will contribute to narrowing gaps between supplied and demanded service level for different dimensions of service level (including a range of policy options regarding socially necessary railways and other passenger modes);
• Task 4: Provide conclusions and recommendations on best practice operations of socially necessary railways in terms of optimal operations scenarios for reducing the gap between supplied and demanded service levels for different dimensions of service.
TITLE
Acronym
SOCIALLY NECESSARY RAILWAYS
SONERAIL
AUTHOR/S(Coordinator)
Prof. Stuart COLE
EDITOREuropean Commission DG Transport & Energy
YEAR 1997 - 1999
INSTITUTIONS INVOLVED
University of North LondonNetherlands Economic InstituteTechnische Universität DresdenUniversity of PardubiceT.M.T. Pragma S.R.L.
SUBJECT Socially necessary railways

R A I L P A G R a i l w a y P r o j e c t A p p r a i s a l G u i d e l i n e s – A n n e x e s156
E References
SUMMARY
The specific aim of the OEEI programme was to achieve greater uniformity among policy-makers and researchers on appropriate calculations of the economic pay-off of large-scale transport infrastructure projects.
In recent years many Dutch economic research institutes have worked on the “research programme on the economic effects of infrastructure” (OEEI). It was initiated by the Ministries of Transport and Economic Affairs after discussions on the benefits of various major transport infrastructure projects. This large-scale research programme has produced about ten reports, which are integrated into this guide for cost-benefit analysis. These reports are primarily aimed at large projects. For smaller projects some effects (such as indirect effects) were not examined, or not as extensively as for large projects.
Some conclusions of this initiative are:
• A thorough and complete cost-benefit analysis is an indispensable tool in evaluating transport infrastructure projects. For large projects, the indirect economic effects (effects on clusters) should be explicitly taken into account, as the reasons for such projects usually involve “strategic” considerations;
• In assessing costs and benefits of infrastructure projects, it is important to include the possible benefits of flexible investment strategies, which are stable to very different developments of economic growth, reactions of competitors and other key determinants of the results. Moreover, uncertainties should be taken into account by adding a (project-specific) risk premium to the discount rate;
• The OEEI research program has resulted in a broad consensus among research institutes on the importance of cost-benefit analysis in the evaluation of major infrastructure projects and on the outlines of the way in which such analysis needs to be made. It has been an important step towards improving the scientific basis for decisions on infrastructure.
TITLEResearch programme on the economic effects of infrastructure (OEEI)
AUTHOR/S NEI and CPB
EDITOR Netherlands Economic Institute (NEI) YEAR Up to 2002
INSTITUTIONS INVOLVED
Central Planning (CPB)Netherlands Economic Institute (NEI)
SUBJECT Infrastructure planning

R A I L P A G R a i l w a y P r o j e c t A p p r a i s a l G u i d e l i n e s – A n n e x e s 157
SUMMARY
The Dutch government was considering the construction of a High Speed Rail (HSR) section, the HSL-Oost, between Utrecht and the German border, as a part of the HSR-link connecting Schiphol Amsterdam Airport with the German Ruhrgebiet. This working-paper presents a cost-benefit analysis of the construction of the railway section. The cost-benefit analysis (CBA) closely followed the guidelines for project evaluation that have been worked out by a number of economic research institutes within the OEEI project (CPB/NEI, 2000). The economic effects of this project appear to be rather small. This is due mainly to the limited savings in travel time. As a result, a new railway seems to be unprofitablein the circumstances analysed. The base-case, or no-build option, is preferable. In the base-case, many benefits can be reaped when high-speed rolling stock is used on conventional track.
TITLE Kosten-batenanalyse van HSL-Oost infrastructuur
Cost benefit analysis of high speed rail infrastructure
AUTHOR/SHenri Dijkman, Carl Koopmans and Martin Vromans
EDITORCPB Netherlands bureau for economic policy analysis
YEAR 2000
INSTITUTIONS INVOLVED
CPB Netherlands bureau for economic policy analysis
SUBJECT High speed rail project evaluation

R A I L P A G R a i l w a y P r o j e c t A p p r a i s a l G u i d e l i n e s – A n n e x e s158
F Members of the Steering Committee1
NAME ORGANISATION
Mr. Matthew Arndt European Investment Bank
Mr. Edward Calthrop Community of European Railways
Mr. José Carbajo European Bank for Reconstruction and Development
Mr. Gerard Dalton International Union of Railways
Mr. Gunther Ellwanger(*) International Union of Railways
Mr. James A. C. Evans European Rail Infrastructure Managers
Mr. Christian Faure European Commission (Directorate-General for Energy and Transport)
Ms. Kristina Geiger-Weichbrodt(*) European Commission (Directorate-General for Energy and Transport)
Dr. Carl-Henrik Lundstrøm(*) Community of European Railways
Ms. Susana Martins Union of European Railway Industries
Ms. Catherine Prudhomme European Commission (Directorate-General for Energy and Transport)
Ms. Sabine Simmross World Bank
Ms. Maj Theander European Investment Bank
Dr. Mateu Turró (chairman) European Investment Bank
Ms. Ainhoa Zubieta(*) European Commission (Directorate-General for Energy and Transport)
(*) Members who have contributed to RAILPAG but are not currently active
Many other people have contributed to the elaboration of this first phase of RAILPAG and to the publication of this book. The rapporteur wishes to express his gratitude, in particular to J. Dionisio González García, Elizabeth McKell, Marc Bello, Daniel Cima and Manuel Fernández Rivero. RAILPAG have also bene fited from the advice of other transport economists under the management of Chris Hurst, Director for the Projects Infrastructure Department, and José Luis Alfaro, responsible for the appraisal of rail projects at the EIB.
1 See website for active members.

R A I L P A G R a i l w a y P r o j e c t A p p r a i s a l G u i d e l i n e s – A n n e x e s 159


RAILPAG aim at providing a common framework for the appraisal of railway projects across the EU. These guidelines have been prepared following an initiative of the European Investment Bank, with the support of the European Commission (DGTREN), international fi nancial institutions and key associations of the rail industry. They will be continuously updated through the website www.railpag.com.
RAILPAG
Railway
Pro
ject
Ap
pra
isa
l G
uid
eli
ne
s
RAILPAG Ra i lway P r o j e c t A p p r a i s a l G u i d e l i n e s
European Commission
European Commission