rail trends 2017 - · pdf filetraining railway services canadian rail research laboratory...
TRANSCRIPT

www.railcan.ca
RAIL TRENDS 2017

������������������
� � � � � �
����� ����� ����� ������ ����� ������
������
������� ��������
����� ��
������������
��������
�������
������
����������� �����������
�����������
���������
������������������
���
���
����
����
��
�� ��
�
�
�
��
�
��
���
���
����
���
����
���
����
���
������
���
��
��
���
���
���
���
��
����
���
���
���
���
���
��
�
����
����
������
���
���
������
���
���
���
��
��������
����
����
���
���� ����
������
��������
����
��
������
������
����
������
������
������������
�� ��
��������
������
������������
������
������
������
������
������
������������
������������
������
��������
��������
��������
������
��������
����������������
������
��������
�� ����
����
���������������
� ������
���������
������
���������������
���������� ���
�������
����
������
�������
�����������
���������
���� ������ �� ��������������
���� ���
����� �������
��������������������
��������
����������������
������������������
������������������
ISBN: 978-1-927520-07-9
RAC members as of Dec. 31, 2016
TM

������������������
� � � � � �
����� ����� ����� ������ ����� ������
������
������� ��������
����� ��
������������
��������
�������
������
����������� �����������
�����������
���������
������������������
���
���
����
����
��
�� ��
�
�
�
��
�
��
���
���
����
���
����
���
����
���
������
���
��
��
���
���
���
���
��
����
���
���
���
���
���
��
�
����
����
������
���
���
������
���
���
���
��
��������
����
����
���
���� ����
������
��������
����
��
������
������
����
������
������
������������
�� ��
��������
������
������������
������
������
������
������
������
������������
������������
������
��������
��������
��������
������
��������
����������������
������
��������
�� ����
����
���������������
� ������
���������
������
���������������
���������� ���
�������
����
������
�������
�����������
���������
���� ������ �� ��������������
���� ���
����� �������
��������������������
��������
����������������
������������������
������������������
R a i l T r e n d s 2 0 1 7 I
99 Bank Street Suite 901 Ottawa, ON K1P 6B9
Phone: (613) 567-8591 Fax: (613) 567-6726 Email: [email protected]
www.railcan.ca

R a i l T r e n d s 2 0 1 7II
MEMBER COMPANIES2016
6CL 6970184 Canada AMT Agence métropolitaine
de transportAP Alberta Prairie Railway
ExcursionsAMTK AmtrakAMIC ArcelorMittal Infrastructure
Canada BCRY Barrie-Collingwood RailwayBRRY Battle River Railway BCRP BCR Properties BSRY Big Sky Rail CorpBNSF BNSFBTRC Boundary Trail RailwayCBNS Cape Breton & Central
Nova Scotia RailwayCR Capital RailwayCTRW Carlton Trail RailwayCMQR Central Maine & Québec
RailwayCEMR Central Manitoba Railway CN CNCFL Compagnie du Chemin
de Fer Lanaudière CP CPCSXT CSX Transportation EMRC Eastern Maine RailwayETR Essex Terminal RailwayGEXR Goderich-Exeter RailwayGCRC Great Canadian Railtour
Company GSR Great Sandhills Railway GWR Great Western Railway HBRY Hudson Bay RailwayHCRY Huron Central Railway KRC Keewatin RailwayKFR Kettle Falls International
RailwayKLT Knob Lake and Timmins Railway
LMRY Last Mountain RailwayGO MetrolinxNBSR New Brunswick Southern
RailwayNCRC Nipissing Central RailwayNS Norfolk Southern RailwayONTC Ontario Northland
Transportation CommissionOSR Ontario Southland Railway OBRY Orangeville Brampton RailwayOVRR Ottawa Valley RailwayPDCR Prairie Dog Central Railway —
Vintage Locomotive SocietyCFQG Québec Gatineau Railway QNSL Québec North Shore and
Labrador Railway Company RS Roberval and Saguenay
Railway CompanyCFRR Romaine River Railway
CompanySFG Société du chemin de fer
de la GaspésieSSR South Simcoe RailwaySORR Southern Ontario RailwaySRY Southern Railway of British
Columbia SLQ St. Lawrence & Atlantic
Railroad (Québec) SSR Stewart Southern RailwaySCR Sydney Coal RailwayTTR Toronto Terminals Railway
CompanyTTCI Train Touristique de Charlevoix TRC Trillium Railway Co. TRT Tshiuetin Rail Transportation UP Union Pacific Railroad
CompanyVIA VIA Rail Canada WCE West Coast Express WP&YR White Pass and Yukon Route
Railroad
R a i l T r e n d s 2 0 1 7 III
ASSOCIATE MEMBERS2016
Absopulse Electronics Accuworx Acrow LimitedAlexander Holburn Beaudin + Lang LLPAlmita PilingAmsted RailAtlantic Industries LimitedAvL Construction Group Bayside Canadian RailwayBombardier TransportationBritish Columbia Institute of TechnologyCAD Railway Industries Canada Heavy Haul Railway United Technologies Canadian Heartland Training Railway Services Canadian Rail Research LaboratoryCanadian Urban Transit AssociationCégep de Sept-IlesCentrePort Canada Consultants F. Drapeau Contrans Flatbed GroupCPCS Transcom LimitedCrescent Point EnergyCSTP Davanac Dillon Consulting Limited
Dominion Railway Services Drain-All Elbow River Marketing Entretien ferroviaire Boivin IncEnvirotec Services IncorporatedFlood Risk CanadaForma-TrainGATX Rail Canada CorporationGaz Propane RainvilleGeoSolv Design/Build Gestion AFM-Séma HDR CorporationHewitt Equipement IBI GroupKenneth PeelKevin McKinnonLe Groupe TraqMarathon Drilling Co. McCarthy TétraultMecfor Montréal Port AuthorityNARSTCONorth American Rail SafetyOntario Steel Haulers PNR Railworks Power Drives Quantum Murray LPRail CantechRail Technology International
RailTermRB&C Maintenance of WayRed River CollegeRéparations ferroviaires K.L.N. Resolute Forest ProductsRTC Rail Solutions Sait PolytechnicSandy Cooke Consulting Saskatchewan Grain Car CorporationServices Passagers Ferroviaires du Grand Montréal SLR Consulting (Canada) Société du port ferroviaire de Baie-Comeau - Haute-RiveSoulanges Railway Services Stantec Suncor Energy Products PartnershipSupco Canada Railway Supply GroupTerrapure EnvironmentalTervitaT-Rail Products TTX Railcar Canada Vidal Street Industrial Park Wabtec CorporationWhiting Equipment CanadaX-Rail Signalisation

FOREWORDThis is the 25th edition of Rail Trends, the Railway Association of Canada’s (RAC) annual report on the performance of Canada’s railway industry. This publication contains a rolling 10-year review of financial and statistical results, reflecting multiple aspects of railway performance in Canada.1
The data in Rail Trends is reported by RAC member companies: Class 1 and shortline freight railways, as well as tourist, intercity and commuter passenger rail service providers. Canadian Class 1 freight railways (CN and CP) account for the majority of freight rail activity in Canada. For that reason, most of the data presented in Rail Trends reflects Class 1 railway performance. While RAC represents the vast majority of non-Class 1 railways in Canada, it does not represent that entire sector.
A detailed profile of railway industry performance by province is available upon request.2
The data in Rail Trends is categorized into the following sub-sections:• Safety• Freight traffic• Passenger transportation• Financial information, investments and taxes• Employment• Track and equipment
Data reflects performance in Canada only. Figures may not add up to totals due to rounding. A glossary of railway terms appears in Appendix A, conversion factors can be found in Appendix B and safety-specific definitions are provided in Appendix C.
__________________1 In some cases, relative variations reflect a change in the way certain members report data.2 Contact Enrique Rosales ([email protected]).
R a i l T r e n d s 2 0 1 7IV

TABLE OF CONTENTSMEMBER COMPANIES . . . . . . . . . . . . . . . . . . . . . . . . . . . . . . . . . . . . . . . . . . . . . . . . . . . II
ASSOCIATE MEMBERS. . . . . . . . . . . . . . . . . . . . . . . . . . . . . . . . . . . . . . . . . . . . . . . . . . III
FOREWORD . . . . . . . . . . . . . . . . . . . . . . . . . . . . . . . . . . . . . . . . . . . . . . . . . . . . . . . . . . . IV
EXECUTIVE SUMMARY . . . . . . . . . . . . . . . . . . . . . . . . . . . . . . . . . . . . . . . . . . . . . . . . . . 1
STATISTICAL SUMMARY . . . . . . . . . . . . . . . . . . . . . . . . . . . . . . . . . . . . . . . . . . . . . . . . 2
SAFETY . . . . . . . . . . . . . . . . . . . . . . . . . . . . . . . . . . . . . . . . . . . . . . . . . . . . . . . . . . . . . . . .3 FREIGHT . . . . . . . . . . . . . . . . . . . . . . . . . . . . . . . . . . . . . . . . . . . . . . . . . . . . . . . . . . .4 PASSENGER . . . . . . . . . . . . . . . . . . . . . . . . . . . . . . . . . . . . . . . . . . . . . . . . . . . . . . 5 CROSSING AND TRESPASSING . . . . . . . . . . . . . . . . . . . . . . . . . . . . . . . . . . . . . 6 ACCIDENTS INVOLVING DANGEROUS GOODS . . . . . . . . . . . . . . . . . . . . . . .7
FREIGHT TRAFFIC . . . . . . . . . . . . . . . . . . . . . . . . . . . . . . . . . . . . . . . . . . . . . . . . . . . . . . 8 REVENUE TON-MILES, GROSS TON-MILES AND FREIGHT TRAIN-MILES . . . . . . . . . . . . . . . . . . . . . . . . . . . . . . . . . . . . . . . . 8 CARLOADS . . . . . . . . . . . . . . . . . . . . . . . . . . . . . . . . . . . . . . . . . . . . . . . . . . . . . . . 9 INTERMODAL TRAFFIC . . . . . . . . . . . . . . . . . . . . . . . . . . . . . . . . . . . . . . . . . . . . . 10 CARLOADS BY COMMODITY . . . . . . . . . . . . . . . . . . . . . . . . . . . . . . . . . . . . . . . 11 FREIGHT REVENUE BY COMMODITY . . . . . . . . . . . . . . . . . . . . . . . . . . . . . . . . 12 AVERAGE LENGTH OF HAUL AND AVERAGE CARS PER FREIGHT TRAIN . . . . . . . . . . . . . . . . . . . . . . . . . . . . . . . . 14 FREIGHT RATES . . . . . . . . . . . . . . . . . . . . . . . . . . . . . . . . . . . . . . . . . . . . . . . . . . . . . 15 PRODUCTIVITY . . . . . . . . . . . . . . . . . . . . . . . . . . . . . . . . . . . . . . . . . . . . . . . . . . . . . . 16 FUEL CONSUMPTION AND COST . . . . . . . . . . . . . . . . . . . . . . . . . . . . . . . . . . . . . 17
PASSENGER TRANSPORTATION . . . . . . . . . . . . . . . . . . . . . . . . . . . . . . . . . . . . . . . . . 18 COMMUTER RAIL . . . . . . . . . . . . . . . . . . . . . . . . . . . . . . . . . . . . . . . . . . . . . . . . . . . . 18 INTERCITY PASSENGER RAIL . . . . . . . . . . . . . . . . . . . . . . . . . . . . . . . . . . . . . . . . . 19
FINANCIAL INFORMATION, INVESTMENTS AND TAXES . . . . . . . . . . . . . . . . . . . 20 OPERATING EXPENSES, REVENUES AND INCOME . . . . . . . . . . . . . . . . . . . . . 20 INVESTMENTS. . . . . . . . . . . . . . . . . . . . . . . . . . . . . . . . . . . . . . . . . . . . . . . . . . . . . . 22 TAXES . . . . . . . . . . . . . . . . . . . . . . . . . . . . . . . . . . . . . . . . . . . . . . . . . . . . . . . . . . . . . 24
EMPLOYMENT . . . . . . . . . . . . . . . . . . . . . . . . . . . . . . . . . . . . . . . . . . . . . . . . . . . . . . . . 26
TRACK AND EQUIPMENT . . . . . . . . . . . . . . . . . . . . . . . . . . . . . . . . . . . . . . . . . . . . . . 27
APPENDIX A — GLOSSARY. . . . . . . . . . . . . . . . . . . . . . . . . . . . . . . . . . . . . . . . . . . . . 28
APPENDIX B — CONVERSION FACTORS . . . . . . . . . . . . . . . . . . . . . . . . . . . . . . . . 29
APPENDIX C — SAFETY DEFINITIONS . . . . . . . . . . . . . . . . . . . . . . . . . . . . . . . . . . . 30

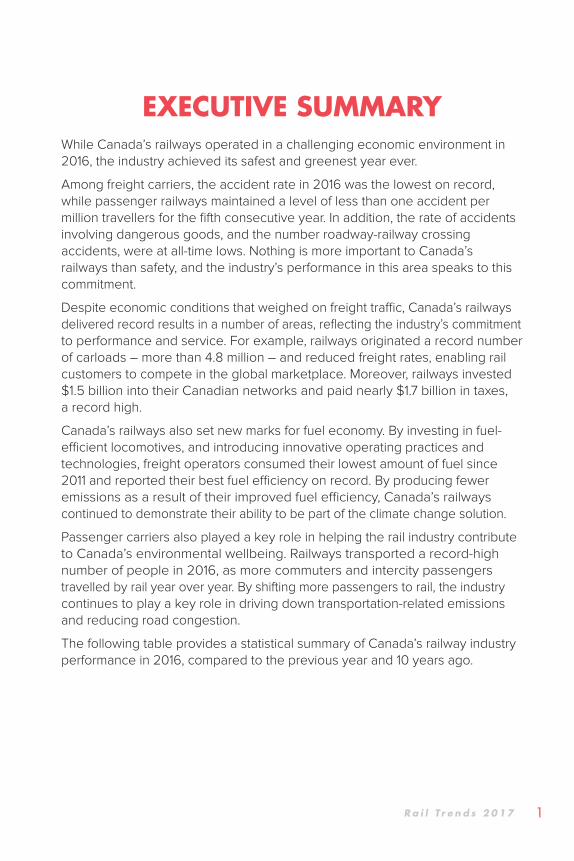
EXECUTIVE SUMMARYWhile Canada’s railways operated in a challenging economic environment in 2016, the industry achieved its safest and greenest year ever.
Among freight carriers, the accident rate in 2016 was the lowest on record, while passenger railways maintained a level of less than one accident per million travellers for the fifth consecutive year. In addition, the rate of accidents involving dangerous goods, and the number roadway-railway crossing accidents, were at all-time lows. Nothing is more important to Canada’s railways than safety, and the industry’s performance in this area speaks to this commitment.
Despite economic conditions that weighed on freight traffic, Canada’s railways delivered record results in a number of areas, reflecting the industry’s commitment to performance and service. For example, railways originated a record number of carloads – more than 4.8 million – and reduced freight rates, enabling rail customers to compete in the global marketplace. Moreover, railways invested $1.5 billion into their Canadian networks and paid nearly $1.7 billion in taxes, a record high.
Canada’s railways also set new marks for fuel economy. By investing in fuel-efficient locomotives, and introducing innovative operating practices and technologies, freight operators consumed their lowest amount of fuel since 2011 and reported their best fuel efficiency on record. By producing fewer emissions as a result of their improved fuel efficiency, Canada’s railways continued to demonstrate their ability to be part of the climate change solution.
Passenger carriers also played a key role in helping the rail industry contribute to Canada’s environmental wellbeing. Railways transported a record-high number of people in 2016, as more commuters and intercity passengers travelled by rail year over year. By shifting more passengers to rail, the industry continues to play a key role in driving down transportation-related emissions and reducing road congestion.
The following table provides a statistical summary of Canada’s railway industry performance in 2016, compared to the previous year and 10 years ago.
R a i l T r e n d s 2 0 1 7 1

STATISTICAL SUMMARY(year-over-year and 10-year comparisons)
2007 2015 2016Freight trafficRevenue ton-miles (RTM) (millions) 247,709 283,188 275,485Revenue tonne-kilometres (RTK) (millions) 361,619 413,414 402,167Gross ton-miles (GTM) (millions) 463,356 544,791 523,071Gross tonnes-kilometres (GTK) (millions) 676,433 795,315 763,607Freight train-miles (thousands) 74,100 68,044 61,584Freight train-kilometres (thousands) 119,253 109,506 99,110Carloads originated (thousands) 4,196 4,831 4,846Tons originated (thousands) 337,989 361,342 373,108Tonnes originated (thousands) 306,623 327,809 338,483Tons per carload 81 75 77Tonnes per carload 73 68 70Total intermodal units (thousands) 2,436 3,205 3,139Average length of haul – Class 1 (miles) 807 943 937Average length of haul – Class 1 (kilometres) 1,299 1,517 1,508Average length of haul – Shortline (miles) 151 87 80Average length of haul – Shortline (kilometres) 243 140 128Average cars per freight train 81 102 108Freight revenue per RTM (cents) 3.84 4.69 4.59Freight revenue per RTK (cents) 2.63 3.21 3.15Productivity (RTM per employee) 8,045 9,839 9,356Gallons of fuel consumed (millions) 492.0 469.9 440.6Litres of fuel consumed (millions) 2,237.0 2,136.0 2,002.9RTM per gallon of fuel consumed 529 642 668RTK per gallon of fuel consumed 170 206 215Passenger transportationTotal passengers carried (thousands) 68,249 81,767 84,185Financial informationOperating expenses ($ millions) 8,495 10,468 9,641Operating revenues ($ millions) 10,704 14,679 14,113Operating income ($ millions) 2,209 4,211 4,473InvestmentsInvestments ($ millions) 1,399 1,801 1,500TaxesTaxes paid ($ millions) 989 1,442 1,667EmploymentEmployees 34,938 32,958 31,103Average wage per employee ($) 73,440 96,445 93,896Track and equipmentMiles of track operated 29,713 27,428 27,069Kilometres of track operated 47,816 44,141 43,562Freight cars 92,373 59,509 55,230Locomotives 3,165 2,400 2,315
R a i l T r e n d s 2 0 1 72

SAFETYThe safety data presented in Rail Trends is calculated using statistics from the Transportation Safety Board of Canada (TSB) and RAC. It reflects the performance of RAC’s federally and provincially regulated freight and passenger member railways. The TSB maintains a database of safety performance statistics for federally regulated railways, as well as provincially regulated railways that voluntarily report their data. The safety data found in Rail Trends is an aggregate of railway statistics from the TSB and information provided to RAC by provincially regulated member companies that aren’t required to report safety data to the TSB. Each organization uses the same safety definitions, and the data reflects railway operations in Canada only.
Excluding crossing and trespassing accidents, non-main-track collisions and derailments accounted for more than three-quarters of all railway accidents in 2016. Most non-main-track accidents are minor and occur during switching operations at speeds of less than 10 miles per hour. Main-track collisions and derailments represented less than 7 per cent of accidents in 2016.
Safety summary (year-over-year and 10-year comparisons)2007 2015 2016
Main-track collisions 9 4 7Main-track derailments 179 80 67Crossing accidents 246 180 147Non-main track collisions 104 95 74Non-main track derailments 745 679 569Collisions/derailments involving track units 34 53 40Employee/passenger accidents 36 15 27Trespassing accidents 132 52 73Fires/explosions 34 32 41Other accident types 50 63 78Total Accidents 1,569 1,253 1,123
R a i l T r e n d s 2 0 1 7 3

FREIGHT
In 2016, Canada’s freight rail sector’s accident rate decreased by 4.4 per cent from the previous year to a record-low 2.02 accidents per billion gross ton-miles (GTM).3 This accident rate was 3.5 per cent lower than the 2011-2015 average of 2.16.
Freight accidents GTM (billions) Accident rate2007 1497 463.4 3.232008 1304 449.9 2.902009 1104 397.3 2.782010 1155 447.1 2.582011 1057 473.3 2.232012 1060 503.9 2.102013 1149 529.4 2.172014 1191 564.3 2.112015 1187 544.8 2.182016 1054 523.1 2.02
Freight accident rate
Acc
iden
ts p
er b
illio
n G
TM
4.0
3.5
3.0
2.5
2.0
1.5
1.02016201520142013201220112010200920082007
__________________3 The freight rail sector’s accident rate is calculated by dividing the number of reportable
freight rail accidents by the freight sector’s workload in gross ton-miles.
R a i l T r e n d s 2 0 1 74
S A F E T Y

PASSENGER
In 2016, the passenger rail sector’s accident rate was 0.82 accidents per million passengers, up 1.5 per cent from 2015 and up 4.3 per cent from the five-year average.4
Accidents involving passenger trains Passengers (000) Accident Rate
2007 72 68,249 1.062008 71 72,303 0.982009 73 70,675 1.032010 67 73,261 0.912011 74 73,080 1.012012 52 75,982 0.682013 51 76,466 0.672014 61 80,366 0.762015 66 81,767 0.812016 69 84,185 0.82
Passenger accident rate
Acc
iden
ts p
er
mill
ion
rail
pass
enge
rs 1.2
0.9
0.6
0.3
02016201520142013201220112010200920082007
__________________4 The passenger rail sector’s accident rate is calculated by dividing the number of accidents involving
passenger trains by the total number of intercity and tourist passengers and rail commuters.
R a i l T r e n d s 2 0 1 7 5
S A F E T Y

CROSSING AND TRESPASSING
Each year, crossing and trespassing accidents account for roughly one-fifth of all rail accidents in Canada. In 2016, there were 147 accidents at roadway-railway crossings. This total represents an 18.3 per cent decrease from the previous year and a 22.4 per cent decline from the 2011-2015 average. In addition, 74 accidents occurred as a result of illegal trespassing on railway property in 2016, up 42.3 per cent compared to 2015 and up 17.8 per cent versus the five-year average.
Crossing accidents Trespassing accidents Other accident types2007 246 132 502008 237 77 542009 206 75 382010 204 91 282011 179 69 472012 198 75 402013 206 62 652014 184 56 472015 180 52 632016 147 73 78
300
250
200
150
100
50
02016201520142013201220112010200920082007
Trespasser accidents
Other accident types
Crossing accidents
R a i l T r e n d s 2 0 1 76
S A F E T Y

ACCIDENTS INVOLVING DANGEROUS GOODS
In 2016, the freight rail sector’s accident rate involving dangerous goods decreased by 13.3 per cent, both from the previous year and from the 2011–2015 average, to a record-low 0.26 accidents per 1,000 dangerous goods carloads.5
Accidents involving
dangerous goods
Dangerous goods
carloads
Accident rate (accidents per 1,000 dangerous
goods carloads)2007 206 426,789 0.482008 170 422,764 0.402009 145 379,650 0.382010 149 400,318 0.372011 129 425,124 0.302012 124 428,660 0.292013 157 493,360 0.322014 179 576,226 0.312015 147 491,802 0.302016 112 436,053 0.26
Accidents involving dangerous goods
Acc
iden
ts p
er 1
,00
0
dang
erou
s go
ods
carlo
ads 0.50
0.45
0.40
0.35
0.30
0.25
0.202016201520142013201220112010200920082007
__________________5 The freight rail sector’s accident rate involving dangerous goods is calculated by dividing
total accidents involving dangerous goods by the number of dangerous goods carloads moved by Canada’s railways.
R a i l T r e n d s 2 0 1 7 7
S A F E T Y

FREIGHT TRAFFICREVENUE TON-MILES, GROSS TON-MILES AND FREIGHT TRAIN-MILES
In 2016, freight rail traffic, measured by revenue ton-miles (RTM), decreased by 2.7 per cent from 2015 and by 2.3 per cent compared to the 2011–2015 average. Year over year, the freight rail sector’s workload, measured by GTM, fell by 4 per cent. Workload was roughly in line with the five-year average. The distance travelled by Canada’s freight trains, measured by freight train-miles, fell by 9.5 per cent to 61.6 million in 2016 versus 2015.
RTM (millions)
RTK (millions)
GTM (millions)
GTK (millions)
Freight train miles (000)
Freight train kilometres
(000)2007 247,709 361,619 463,356 676,433 74,100 119,2532008 237,323 346,457 449,922 656,821 71,712 115,4092009 210,898 307,880 397,293 579,990 59,576 95,8772010 247,154 360,809 455,047 664,303 65,157 104,8592011 255,001 372,264 473,312 690,960 66,082 106,3482012 273,504 399,275 503,879 735,590 68,145 109,6682013 291,172 425,069 529,379 772,816 67,207 108,1602014 306,282 447,127 564,313 823,815 70,313 113,1572015 283,188 413,414 544,791 795,315 68,044 109,5062016 275,485 402,167 523,071 763,607 61,584 99,110
RTM (left axis)
Freight train-miles (right axis)
Bill
ions
Mill
ions
600
550
500
450
400
350
300
250
200
150
100
50
0
108
99
90
81
72
63
54
45
36
27
18
9
02016201520142013201220112010200920082007
GTM (left axis)
R a i l T r e n d s 2 0 1 78

CARLOADS
In 2016, the number of carloads that originated in Canada increased by 0.3 per cent to a record-high 4.8 million, led by machinery and motor vehicle shipments. Consequently, the overall weight of goods transported by RAC members increased by 3.3 per cent, as railways carried more heavy commodities such as coal and minerals. As a result, the tonnage per carload grew by 2.9 per cent from the previous year.6 Compared to the 2011-2015 average, the number of carloads originated in Canada increased by 12.9 per cent in 2016, while tonnage increased by 1.8 per cent.
Carloads originated
(000)
Tons originated
(000)
Tonnes originated
(000) Tons per carload6
Tonnes per carload
2007 4,196 337,989 306,623 81 732008 3,984 318,688 289,114 80 732009 3,367 269,028 244,062 80 732010 3,872 334,264 303,258 86 782011 4,044 337,074 305,793 83 762012 4,113 375,780 340,907 91 832013 4,234 388,621 352,557 92 832014 4,238 368,970 334,730 87 792015 4,831 361,342 327,809 75 682016 4,846 373,108 338,483 77 70
Carloads originated (left axis) Tons per carload (right axis)
Mill
ions
Tons
5.0
4.5
4.0
3.5
3.0
2.5
2.0
1.5
1.0
0.5
0
100
90
80
70
60
50
40
30
20
10
0201620152013201220112010200920082007 2014
__________________6 Tons (tonnes) per carload is calculated by dividing tons (tonnes) originated by carloads originated.
R a i l T r e n d s 2 0 1 7 9
F R E I G H T T R A F F I C

INTERMODAL TRAFFIC
In 2016, intermodal traffic that originated in Canada decreased by 2.1 per cent from 2015 as Canadian Class 1 railways transported fewer trailers and containers.7 The 2016 total was 11.5 per cent higher than the 2011–2015 average of 2.8 million intermodal units.
Trailers (000) Containers (000) Total (000)2007 102 2,334 2,4362008 101 2,396 2,4972009 83 2,033 2,1162010 81 2,361 2,4422011 80 2,424 2,5042012 98 2,540 2,6382013 118 2,628 2,7462014 93 2,883 2,9782015 73 3,132 3,2052016 55 3,084 3,139
Intermodal units originated (000) (containers & trailers)3,500
3,000
2,500
2,000
1,500
1,000
500
0201620152013201220112010200920082007 2014
__________________7 Total intermodal traffic originated in Canada reflects both the Canadian and U.S. operations
of Canadian Class 1 railways. Intermodal units are actual counts of trailers and containers, regardless of size, and are not “twenty-foot equivalent units (TEUs).”
R a i l T r e n d s 2 0 1 710
F R E I G H T T R A F F I C
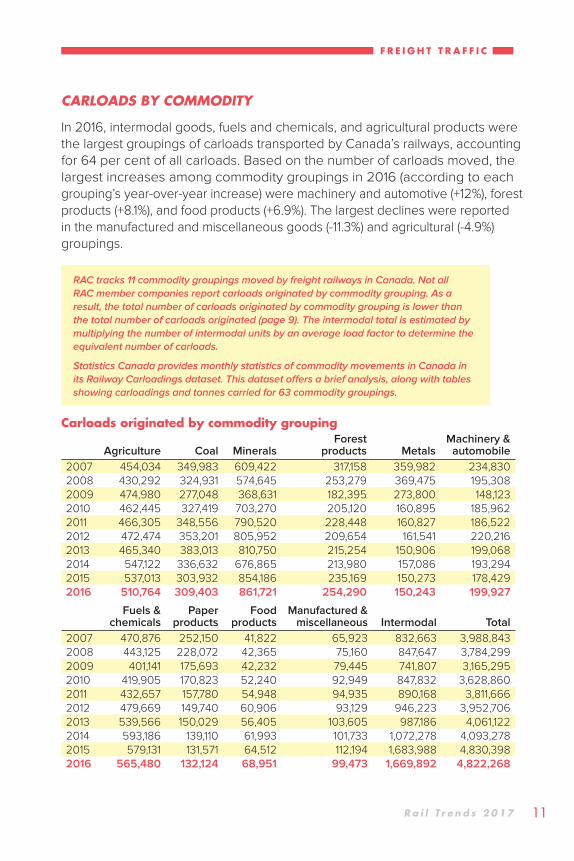
CARLOADS BY COMMODITY
In 2016, intermodal goods, fuels and chemicals, and agricultural products were the largest groupings of carloads transported by Canada’s railways, accounting for 64 per cent of all carloads. Based on the number of carloads moved, the largest increases among commodity groupings in 2016 (according to each grouping’s year-over-year increase) were machinery and automotive (+12%), forest products (+8.1%), and food products (+6.9%). The largest declines were reported in the manufactured and miscellaneous goods (-11.3%) and agricultural (-4.9%) groupings.
RAC tracks 11 commodity groupings moved by freight railways in Canada. Not all RAC member companies report carloads originated by commodity grouping. As a result, the total number of carloads originated by commodity grouping is lower than the total number of carloads originated (page 9). The intermodal total is estimated by multiplying the number of intermodal units by an average load factor to determine the equivalent number of carloads.
Statistics Canada provides monthly statistics of commodity movements in Canada in its Railway Carloadings dataset. This dataset offers a brief analysis, along with tables showing carloadings and tonnes carried for 63 commodity groupings.
Carloads originated by commodity grouping
Agriculture Coal MineralsForest
products MetalsMachinery &
automobile2007 454,034 349,983 609,422 317,158 359,982 234,8302008 430,292 324,931 574,645 253,279 369,475 195,3082009 474,980 277,048 368,631 182,395 273,800 148,1232010 462,445 327,419 703,270 205,120 160,895 185,9622011 466,305 348,556 790,520 228,448 160,827 186,5222012 472,474 353,201 805,952 209,654 161,541 220,2162013 465,340 383,013 810,750 215,254 150,906 199,0682014 547,122 336,632 676,865 213,980 157,086 193,2942015 537,013 303,932 854,186 235,169 150,273 178,4292016 510,764 309,403 861,721 254,290 150,243 199,927
Fuels & chemicals
Paper products
Food products
Manufactured & miscellaneous Intermodal Total
2007 470,876 252,150 41,822 65,923 832,663 3,988,8432008 443,125 228,072 42,365 75,160 847,647 3,784,2992009 401,141 175,693 42,232 79,445 741,807 3,165,2952010 419,905 170,823 52,240 92,949 847,832 3,628,8602011 432,657 157,780 54,948 94,935 890,168 3,811,6662012 479,669 149,740 60,906 93,129 946,223 3,952,7062013 539,566 150,029 56,405 103,605 987,186 4,061,1222014 593,186 139,110 61,993 101,733 1,072,278 4,093,2782015 579,131 131,571 64,512 112,194 1,683,988 4,830,3982016 565,480 132,124 68,951 99,473 1,669,892 4,822,268
R a i l T r e n d s 2 0 1 7 11
F R E I G H T T R A F F I C

FREIGHT REVENUE BY COMMODITY
In 2016, the freight rail sector’s revenue decreased by 5.6 per cent to $10.1 billion. Similar to the previous year, freight railways generated most – 55 per cent in 2016 – of their revenue from transporting intermodal goods, agricultural products, and fuels and chemicals. On a revenue basis, the largest changes among commodity groupings (based on each grouping’s year-over-year change) were minerals (-20.5%), metals (-12.1%) and fuels and chemicals (-11.1%). Compared to 2015, railways earned more revenue from transporting forest products (+11.0%) and food products (+9.9%).
Not all RAC member companies record revenue from carloads originated by commodity grouping. The data in this section reflects reported freight revenue from originated carloads grouped by commodity grouping. As a result, total freight revenue from carloads originated by commodity grouping is lower than total freight operating revenue (page 20).
Revenue from carloads originated by commodity grouping ($ millions)
Agriculture Coal MineralsForest
products MetalsMachinery &
automotive2007 1,157 709 819 780 476 4452008 1,161 706 833 646 531 4432009 1,259 502 525 478 317 3372010 1,221 598 772 500 381 3942011 1,297 713 898 564 424 3812012 1,374 749 926 611 455 5082013 1,433 833 973 660 448 4812014 1,725 760 1,030 702 501 4812015 1,871 632 1,336 857 487 5412016 1,730 628 1,062 951 428 567
Fuels & chemicals
Paper products
Food products
Manufactured & miscellaneous Intermodal Total
2007 837 541 81 116 2,452 8,4132008 902 531 89 126 2,702 8,6722009 818 423 94 113 2,273 7,1392010 853 437 128 130 2,592 8,0062011 928 427 146 133 1,893 7,8052012 1,155 411 161 153 1,997 8,4992013 1,420 406 155 174 2,019 9,0012014 1,756 393 181 177 2,162 9,8692015 1,934 426 235 192 2,171 10,6822016 1,719 423 258 181 2,135 10,083
R a i l T r e n d s 2 0 1 712
F R E I G H T T R A F F I C

The chart below illustrates carloads originated by commodity groupings as a percentage of all commodity carloads in 2016.
Agriculture (11%)
Coal (6%)
Minerals (18%)
Forest products (5%)
Metals (3%)
Machinery & automotive (4%)
Fuels & chemicals (12%)
Paper products (3%)
Food products (1%)
Manufactured & miscellaneous (2%)
Intermodal (35%)
The chart below illustrates revenues by commodity grouping as a percentage of all revenues in 2016.
Agriculture (17%)
Coal (6%)
Minerals (11%)
Forest products (9%)
Metals (4%)
Machinery & automotive (6%)
Fuels & chemicals (17%)
Paper products (4%)
Food products (3%)
Manufactured & miscellaneous (2%)
Intermodal (21%)
R a i l T r e n d s 2 0 1 7 13
F R E I G H T T R A F F I C

AVERAGE LENGTH OF HAUL AND AVERAGE CARS PER FREIGHT TRAIN
In 2016, each separate shipment transported by Canada’s Class 1 railways (CN and CP) travelled an average distance of 937 miles (1,508 kilometres), down 0.6 per cent from the record-high length of haul reported in 2015.8 Shipments carried by Canada’s shortline railways travelled an average distance of 80 miles (128 kilometres), down 8.2 per cent from the previous year. Freight sector-wide, the average number of railcars per train increased by 6 per cent to a record high of 108.9
Average miles (kilometres) hauled by Class 1 railways
(CN and CPR)
Average miles (kilometres) hauled by
shortline railways
Average cars per freight
trainMiles Kilometres Miles Kilometres Cars
2007 807 1,299 151 243 812008 818 1,316 146 235 822009 830 1,336 159 256 872010 850 1,368 138 163 922011 849 1,366 170 274 812012 868 1,396 99 159 902013 871 1,402 186 300 992014 908 1,462 190 306 1002015 943 1,517 87 140 1022016 937 1,508 80 128 108
Average length of haul
Class 1s (left axis)
Shortlines (left axis)
Mile
s
1,000
800
600
400
200
0
140
120
100
80
60
402016201520142013201220112010200920082007
Average cars per freight train (right axis)
__________________8 Length of haul is calculated by dividing RTM (RTK) by revenue tons (revenue tonnes).9 Average cars per freight train is calculated by dividing loaded and empty car-miles (car-kilometres)
by train-miles (train-kilometres).
R a i l T r e n d s 2 0 1 714
F R E I G H T T R A F F I C

FREIGHT RATES
Freight revenue per RTM is often viewed as a proxy for railway rates because it shows the level of revenue collected by railways for moving goods over a certain distance.10 In 2016, freight operating revenue decreased by 4.7 per cent from 2015, while freight rail traffic decreased by 2.7 per cent. As a result, freight revenue per RTM decreased by 2 per cent to 4.59 cents. The decrease was the first since 2013. Between 2011 and 2015, freight revenue per RTM increased by an average of 3.5 per cent each year.
Freight revenue (cents) perFreight revenue per RTM index
Commodity price index11
RTM RTK 2001 = 100 2001 = 1002007 3.84 2.63 117.4 196.72008 4.20 2.87 128.4 238.52009 4.00 2.74 122.3 160.62010 3.99 2.74 122.0 194.92011 4.04 2.77 123.5 229.92012 4.14 2.84 126.6 215.52013 4.13 2.83 126.5 214.62014 4.46 3.06 136.5 210.32015 4.69 3.21 143.3 134.12016 4.59 3.15 140.4 121.4
Freight revenue per RTM
Cen
ts (C
AD
)
5.0
4.0
3.0
2.0
1.0
02016201520142013201220112010200920082007
__________________10 Freight revenue per RTM is calculated by dividing freight operating revenue by RTM (RTK).11 Source: Bank of Canada data.
R a i l T r e n d s 2 0 1 7 15
F R E I G H T T R A F F I C
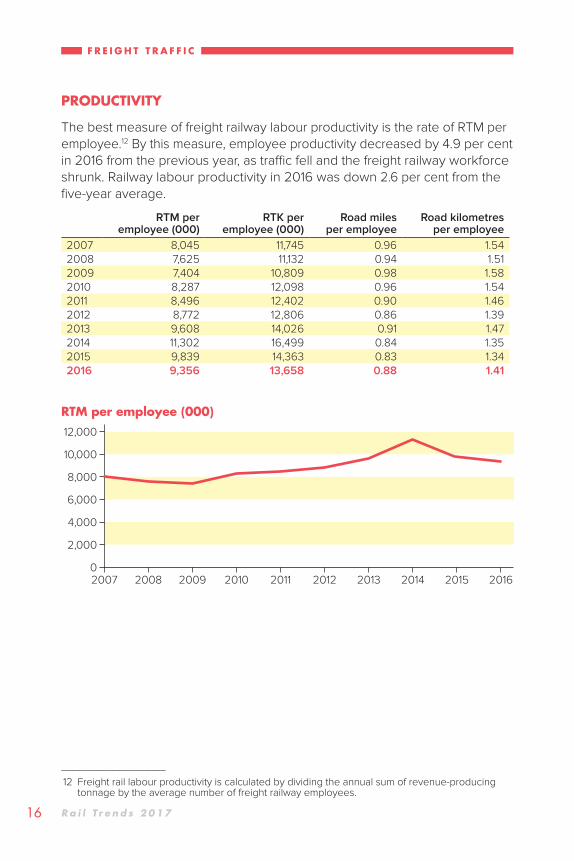
PRODUCTIVITY
The best measure of freight railway labour productivity is the rate of RTM per employee.12 By this measure, employee productivity decreased by 4.9 per cent in 2016 from the previous year, as traffic fell and the freight railway workforce shrunk. Railway labour productivity in 2016 was down 2.6 per cent from the five-year average.
RTM per employee (000)
RTK per employee (000)
Road miles per employee
Road kilometres per employee
2007 8,045 11,745 0.96 1.542008 7,625 11,132 0.94 1.512009 7,404 10,809 0.98 1.582010 8,287 12,098 0.96 1.542011 8,496 12,402 0.90 1.462012 8,772 12,806 0.86 1.392013 9,608 14,026 0.91 1.472014 11,302 16,499 0.84 1.352015 9,839 14,363 0.83 1.342016 9,356 13,658 0.88 1.41
RTM per employee (000)
12,000
10,000
8,000
6,000
4,000
2,000
02016201520142013201220112010200920082007
__________________12 Freight rail labour productivity is calculated by dividing the annual sum of revenue-producing
tonnage by the average number of freight railway employees.
R a i l T r e n d s 2 0 1 716
F R E I G H T T R A F F I C

FUEL CONSUMPTION AND COST
In 2016, freight railways consumed 440.6 million gallons (2 billion litres) of fuel, down 6.2 per cent, while also moving 2.7 per cent less traffic than the previous year. As a result, the freight railway sector’s fuel efficiency improved by 4.1 per cent to 668 RTM per gallon of fuel consumed.13 The cost of diesel fuel in 2016 decreased by 12.6 per cent to $3.02 per gallon ($0.66 per litre), the lowest level reported since 2009.14
Total fuel consumedRTM per gallon of
fuel consumedRTK per litre of fuel consumed
Cost of diesel fuelgallons
(000)litres (000)
per gallon ($)
per litre (cents)
2007 492,125 2,237,237 529 170 3.07 67.62008 480,661 2,185,120 520 167 4.23 93.02009 411,612 1,871,221 545 175 2.94 64.82010 450,782 2,049,289 562 182 3.25 71.402011 436,558 1,984,178 621 202 4.25 93.462012 471,912 2,145,346 615 198 4.24 93.332013 464,275 2,110,651 664 214 4.44 97.632014 484,572 2,202,872 667 215 4.83 106.212015 469,855 2,135,996 642 206 3.46 76.012016 440,587 2,002,939 668 215 3.02 66.41
__________________13 Freight rail fuel efficiency is calculated by dividing total RTM (RTK) by the total volume
of fuel consumed.14 This total includes fuel expenses and gallons (litres) consumed by both freight
and passenger railways.
R a i l T r e n d s 2 0 1 7 17
F R E I G H T T R A F F I C

__________________15 Commuter passenger-miles (commuter passenger-kilometres) statistics before 2013 exclude
GO Transit, which began reporting this data to RAC in 2013.16 Rail commuter totals from 2012-2014 have been revised.
R a i l T r e n d s 2 0 1 718
PASSENGER TRANSPORTATIONCOMMUTER RAIL
In 2016, commuter railways in British Columbia, Ontario and Quebec transported a record-high 79.6 million passengers, up 3.1 per cent from the previous year and up 9.1 per cent from the 2011–2015 average.
The average number of commuters per train in 2016 edged up by 0.6 per cent from the previous year to its highest level since 2012. In addition, commuter passenger-miles rose by 4.4 per cent year over year.15
Commuter passenger Commuter train Average rail commuters
per train
Rail commuters (000) in British
Columbia, Ontario and Quebec16
miles (000)
kilometres (000)
miles (000)
kilometres (000)
2007 247,066 397,615 2,808 4,518 339 63,3932008 256,123 412,190 2,832 4,558 340 67,0522009 245,942 395,806 2,876 4,628 301 65,9622010 256,134 412,209 3,008 4,841 310 68,5622011 278,244 447,791 3,171 5,103 255 68,4272012 288,161 463,752 4,356 7,011 342 71,5222013 320,596 515,950 4,477 7,205 287 72,0022014 326,969 526,206 4,610 7,419 276 75,9012015 400,666 644,810 4,022 6,473 297 77,2332016 418,334 673,243 4,448 7,159 298 79,626
Rai
l com
mut
ers
(00
0) i
n B
ritis
h C
olum
bia,
Ont
ario
and
Que
bec
80,000
70,000
60,000
50,000
40,000
30,000
20,000
10,000
02016201520142013201220112010200920082007

INTERCITY PASSENGER RAIL
In 2016, intercity passenger railways transported 4.2 million people, up 1.7 per cent from 2015 and slightly above the five-year average.
In the intercity passenger rail sector, passenger-miles and passenger train-miles increased by 2.1 and 1 per cent, respectively, year over year. The average number of intercity passengers per train grew by 1.1 per cent to 128, while the average length of journey increased by 1.4 per cent to 216 miles (348 kilometres).
Passenger cars in service
Number of passengers
(000)
Passengermiles
(millions)kilometres
(millions)2007 538 4,478 912 1,4682008 540 4,899 986 1,5882009 559 4,538 894 1,4392010 545 4,477 877 1,4122011 544 4,461 888 1,4282012 542 4,246 871 1,4022013 552 4,186 861 1,3862014 552 4,094 834 1,3432015 551 4,171 857 1,3802016 527 4,241 876 1,409
Passenger train Passenger carmiles (000)
kilometres (000)
miles (000)
kilometres (000)
2007 7,330 11,796 48,708 78,3882008 7,414 11,932 49,140 79,0832009 7,334 11,803 47,290 76,1062010 7,331 11,799 46,275 74,4722011 7,273 11,705 48,239 77,6332012 7,075 11,386 48,725 78,4152013 6,809 10,958 43,673 70,2852014 6,720 10,814 41,587 66,9282015 6,781 10,913 43,843 70,5592016 6,850 11,024 44,884 72,234
Average intercity
passengers per train
Average length of journey
Average passenger load factor
(%)
On-time performance
(%)miles kilometres2007 124 209 336 55 772008 133 206 332 59 752009 122 203 327 57 832010 120 204 328 57 822011 122 204 328 55 842012 123 213 342 54 822013 126 214 344 56 822014 124 213 342 60 762015 126 213 343 56 712016 128 216 348 54 73
PA S S E N G E R T R A N S P O R TAT I O N
R a i l T r e n d s 2 0 1 7 19
R a i l T r e n d s 2 0 1 720
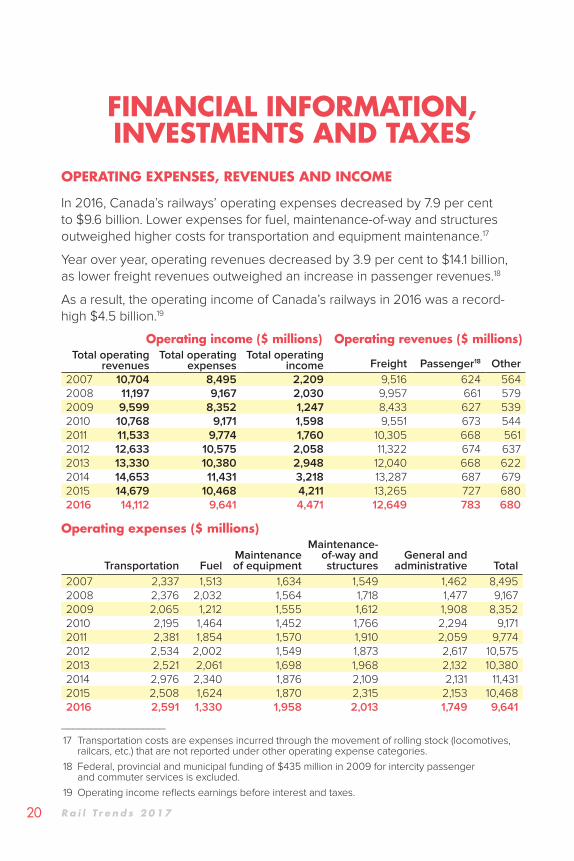
FINANCIAL INFORMATION, INVESTMENTS AND TAXES
OPERATING EXPENSES, REVENUES AND INCOME
In 2016, Canada’s railways’ operating expenses decreased by 7.9 per cent to $9.6 billion. Lower expenses for fuel, maintenance-of-way and structures outweighed higher costs for transportation and equipment maintenance.17
Year over year, operating revenues decreased by 3.9 per cent to $14.1 billion, as lower freight revenues outweighed an increase in passenger revenues.18
As a result, the operating income of Canada’s railways in 2016 was a record-high $4.5 billion.19
Operating income ($ millions) Operating revenues ($ millions)Total operating
revenuesTotal operating
expensesTotal operating
income Freight Passenger18 Other2007 10,704 8,495 2,209 9,516 624 5642008 11,197 9,167 2,030 9,957 661 5792009 9,599 8,352 1,247 8,433 627 5392010 10,768 9,171 1,598 9,551 673 5442011 11,533 9,774 1,760 10,305 668 5612012 12,633 10,575 2,058 11,322 674 6372013 13,330 10,380 2,948 12,040 668 6222014 14,653 11,431 3,218 13,287 687 6792015 14,679 10,468 4,211 13,265 727 6802016 14,112 9,641 4,471 12,649 783 680
Operating expenses ($ millions)
Transportation FuelMaintenanceof equipment
Maintenance- of-way and structures
General and administrative Total
2007 2,337 1,513 1,634 1,549 1,462 8,4952008 2,376 2,032 1,564 1,718 1,477 9,1672009 2,065 1,212 1,555 1,612 1,908 8,3522010 2,195 1,464 1,452 1,766 2,294 9,1712011 2,381 1,854 1,570 1,910 2,059 9,7742012 2,534 2,002 1,549 1,873 2,617 10,5752013 2,521 2,061 1,698 1,968 2,132 10,3802014 2,976 2,340 1,876 2,109 2,131 11,4312015 2,508 1,624 1,870 2,315 2,153 10,4682016 2,591 1,330 1,958 2,013 1,749 9,641
__________________17 Transportation costs are expenses incurred through the movement of rolling stock (locomotives,
railcars, etc.) that are not reported under other operating expense categories.18 Federal, provincial and municipal funding of $435 million in 2009 for intercity passenger
and commuter services is excluded.19 Operating income reflects earnings before interest and taxes.

R a i l T r e n d s 2 0 1 7 21
$ M
illio
ns (C
AD
)
16,000
14,000
12,000
10,000
8,000
6,000
4,000
2,000
02016201520142013201220112010200920082007
Operating expenses
Operating income
Operating revenues
The charts below illustrate operating revenues and expenses by category as a percentage of RAC member railway totals in 2016.
Operating revenues
Freight (90%)
Passenger (5%)
Other (5%)
Operating expenses
Transportation (27%)
Fuel (14%)
Maintenance of equipment (20%)
Maintenance of way (21%)
General & administration (18%)
F I N A N C I A L I N F O R M AT I O N , I N V E S T M E N T S A N D TA X E S

R a i l T r e n d s 2 0 1 722
F I N A N C I A L I N F O R M AT I O N , I N V E S T M E N T S A N D TA X E S
INVESTMENTS
Canada’s railways invested $1.5 billion into their Canadian networks in 2016, down 16.7 per cent from the previous year and down 16.8 per cent from the 2011-2015 average. Track and roadway reflected the majority (51%) of capital expenditures in 2016.
Investments ($ millions)
Track & roadway
Buildings & related machinery &
equipment
Signals, communications
& powerTerminals &
fuel stations2007 618 255 44 432008 688 189 79 262009 706 257 72 242010 804 231 109 162011 971 314 108 152012 961 269 122 412013 892 357 100 322014 982 287 93 102015 888 309 130 262016 771 298 102 8
Rolling stock
Intermodal equipment
Work equipment & roadway machines
Other equipment
Total investments
2007 350 30 41 18 1,3992008 290 29 68 22 1,3912009 317 34 42 72 1,5242010 427 15 49 55 1,7062011 307 11 53 64 1,8442012 255 22 49 77 1,7952013 239 17 50 77 1,7642014 230 53 48 102 1,8062015 233 61 92 62 1,8012016 145 53 55 70 1,500

R a i l T r e n d s 2 0 1 7 23
F I N A N C I A L I N F O R M AT I O N , I N V E S T M E N T S A N D TA X E S
Investments
$ M
illio
ns (C
AD
)
2,000
1,800
1,600
1,400
1,200
1,000
800
600
400
200
0201620152013201220112010200920082007 2014
The chart below illustrates investments by category as a percentage of all investments made by RAC member railways in 2016.
Track & roadway (51%)
Buildings & related machinery & equipment (20%)
Signals, communications & power (7%)
Terminals & fuel stations (1%)
Rolling stock (10%)
Intermodal equipment (4%)
Work equipment & roadway machines (4%)
Other equipment (5%)

R a i l T r e n d s 2 0 1 724
F I N A N C I A L I N F O R M AT I O N , I N V E S T M E N T S A N D TA X E S
TAXES
In 2016, Canada’s railways paid a record-high $1.67 billion in taxes, up 15.6 per cent from the previous year. The main contributor to this increase was a 26 per cent – more than $201 million – increase in the total income tax paid by railways from the previous year.
Taxes by category ($ millions)Locomotive
fuel & excise tax
Property tax
Other sales
tax
Capital tax & customs
dutiesIncome
tax Payroll
taxesCarbon
tax Total2007 188 154 97 15 381 154 n/a 9892008 187 152 99 14 323 155 n/a 9302009 177 152 97 14 265 148 n/a 8532010 195 150 96 14 185 147 n/a 7872011 204 153 70 0 372 158 n/a 9572012 220 158 70 0 159 170 n/a 7772013 219 169 43 1 629 150 n/a 1,2092014 186 179 65 1 462 154 44 1,0912015 159 168 115 3 775 178 45 1,4422016 187 180 114 1 976 167 43 1,667
Locomotive fuel & excise tax (11%)
Property tax (11%)
Other sales tax (7%)
Capital tax & customs duties (0%)
Income tax (58%)
Payroll tax (10%)
Carbon tax (3%)

R a i l T r e n d s 2 0 1 7 25
F I N A N C I A L I N F O R M AT I O N , I N V E S T M E N T S A N D TA X E S
Payroll taxes ($ millions)Canada/Quebec
Pension PlanUnemployment
insurance Health taxes Total2007 75 33 46 1542008 77 33 45 1552009 74 30 44 1482010 73 31 43 1472011 77 34 47 1582012 84 37 49 1702013 75 32 43 1502014 77 37 40 1542015 82 36 53 1712016 79 37 50 167
Taxes by jurisdiction ($000)
Locomotive fuel & excise tax
Fuel tax per litre (cents) Property tax
2015 2016 2016 2015 2016Alberta 6,944 17,827 5.5 17,769 19,020British Columbia 15,425 15,393 10.7 43,947 46,610Manitoba 11,421 10,046 6.3 15,549 15,407Nfld. & Labrador 0 0 21.5 33 145New Brunswick 1,252 1,279 4.3 1,184 1,091Nova Scotia 0 0 15.4 3,017 3,021Ontario 25,889 23,052 4.5 30,162 32,327Quebec 6,706 3,296 3.0 36,102 40,780Saskatchewan 40,442 38,976 15.0 20,655 21,537Northwest Territories 22 16 11.4 80 79Federal 50,769 76,685 4.0 0 0Total 158,871 186,570 168,497 180,016
Other sales taxCapital tax &
customs duties Income tax2015 2016 2015 2016 2015 2016
Alberta 0 85 0 1 66,715 87,457British Columbia 36,443 38,809 0 0 23,435 34,057Manitoba 21,986 17,732 132 99 8,820 10,162Nfld. & Labrador 143 143 0 0 0 0New Brunswick 0 0 0 0 0 0Nova Scotia 0 0 0 0 0 412Ontario 1,785 1,282 0 0 63,694 93,927Quebec 16,573 17,599 0 10 28,428 31,910Saskatchewan 11,261 9,081 65 77 16,466 19,419Northwest Territories 0 0 0 0 0 0Federal 26,723 28,936 2,422 1,016 567,329 698,681Total 114,914 113,667 2,619 1,203 774,888 976,026
R a i l T r e n d s 2 0 1 726
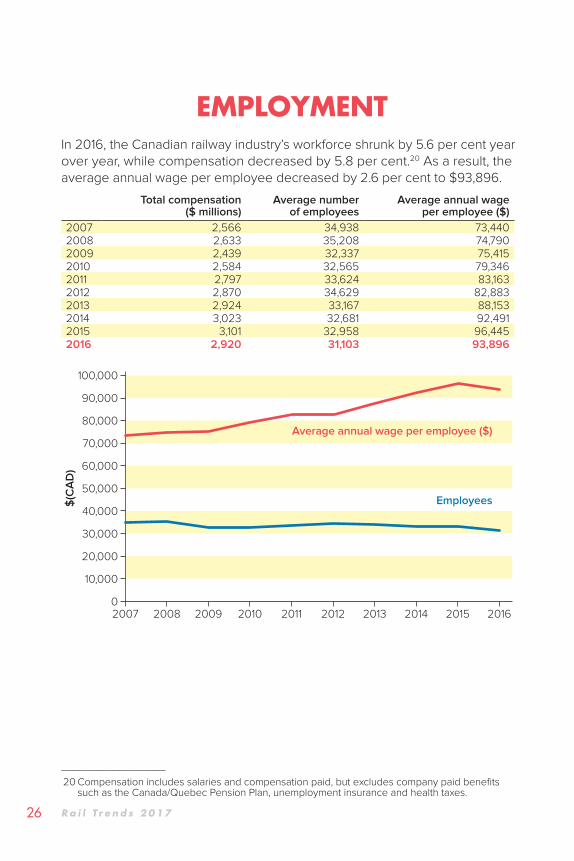
EMPLOYMENTIn 2016, the Canadian railway industry’s workforce shrunk by 5.6 per cent year over year, while compensation decreased by 5.8 per cent.20 As a result, the average annual wage per employee decreased by 2.6 per cent to $93,896.
Total compensation ($ millions)
Average number of employees
Average annual wage per employee ($)
2007 2,566 34,938 73,4402008 2,633 35,208 74,7902009 2,439 32,337 75,4152010 2,584 32,565 79,3462011 2,797 33,624 83,1632012 2,870 34,629 82,8832013 2,924 33,167 88,1532014 3,023 32,681 92,4912015 3,101 32,958 96,4452016 2,920 31,103 93,896
Average annual wage per employee ($)
Employees
100,000
90,000
80,000
70,000
60,000
50,000
40,000
30,000
20,000
10,000
02016201520142013201220112010200920082007
$(C
AD
)
__________________20 Compensation includes salaries and compensation paid, but excludes company paid benefits
such as the Canada/Quebec Pension Plan, unemployment insurance and health taxes.

R a i l T r e n d s 2 0 1 7 27
TRACK AND EQUIPMENTIn 2016, Canadian freight railways operated 27,069 miles (43,562 kilometres) of track, down 1.3 per cent from the previous year.21 The industry’s freight car fleet shrunk by 7.2 per cent in 2016, mainly due to railways owning fewer railcars. The number of locomotives in service fell by 3.5 per cent year over year.
Miles KilometresIndex
2000 = 100Freight cars
in serviceLocomotives
in service2007 29,713 47,816 102.6 92,373 3,1652008 29,366 47,258 101.4 83,984 3,0462009 28,163 45,323 97.3 75,836 2,7422010 27,654 44,501 95.5 71,788 2,9542011 27,102 43,617 93.6 71,750 2,9772012 26,923 43,328 93.0 64,485 3,0632013 27,270 43,887 94.2 59,395 3,0432014 27,304 43,942 94.3 58,577 2,6962015 27,428 44,141 94.7 59,509 2,4002016 27,069 43,562 93.5 55,230 2,315
Track operated, by provinces and territories2015 2016
Miles Kilometres Miles KilometresAlberta 3,988 6,418 3,940 6,341British Columbia 4,218 6,788 4,170 6,710Manitoba 2,847 4,582 2,816 4,532Nfld. & Labrador 175 282 175 282New Brunswick 720 1,159 720 1,159Nova Scotia 419 674 416 670Ontario 6,271 10,092 6,222 10,013Quebec 3,662 5,893 3,694 5,944Saskatchewan 5,053 8,132 4,841 7,790Northwest Territories 75 121 75 121Total 27,428 44,141 27,069 43,562Intercity passenger trains22 7,922 12,749 7,767 12,500Commuter and tourist trains23 2,955 4,736 3,024 4,867Segments terminating in the U.S.24 152 244 152 244Grand total 38,457 61,870 38,012 61,174
__________________21 Miles (kilometres) of track operated includes rail over which a railway has operating rights.
Segments of track acquired by non-RAC-member railways would have the effect of reducing the total track mileage reported in Rail Trends.
22 Reflects intercity passenger railways’ track and operating rights over track owned by other railways.23 Reflects commuter and tourist railways’ track and operating rights over track owned by other railways.24 Reflects railway subdivisions that begin in Canada and terminate in the United States.
R a i l T r e n d s 2 0 1 728
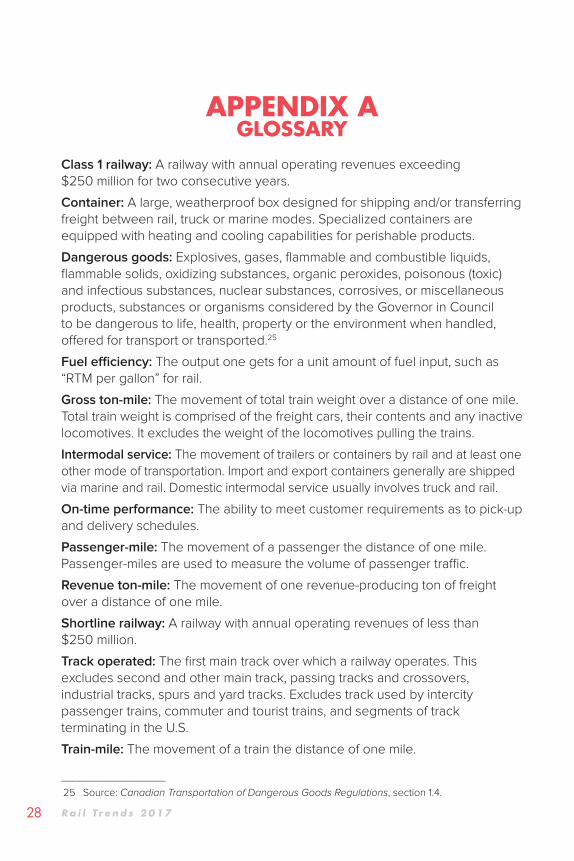
APPENDIX AGLOSSARY
Class 1 railway: A railway with annual operating revenues exceeding $250 million for two consecutive years.
Container: A large, weatherproof box designed for shipping and/or transferring freight between rail, truck or marine modes. Specialized containers are equipped with heating and cooling capabilities for perishable products.
Dangerous goods: Explosives, gases, flammable and combustible liquids, flammable solids, oxidizing substances, organic peroxides, poisonous (toxic) and infectious substances, nuclear substances, corrosives, or miscellaneous products, substances or organisms considered by the Governor in Council to be dangerous to life, health, property or the environment when handled, offered for transport or transported.25
Fuel efficiency: The output one gets for a unit amount of fuel input, such as “RTM per gallon” for rail.
Gross ton-mile: The movement of total train weight over a distance of one mile. Total train weight is comprised of the freight cars, their contents and any inactive locomotives. It excludes the weight of the locomotives pulling the trains.
Intermodal service: The movement of trailers or containers by rail and at least one other mode of transportation. Import and export containers generally are shipped via marine and rail. Domestic intermodal service usually involves truck and rail.
On-time performance: The ability to meet customer requirements as to pick-up and delivery schedules.
Passenger-mile: The movement of a passenger the distance of one mile. Passenger-miles are used to measure the volume of passenger traffic.
Revenue ton-mile: The movement of one revenue-producing ton of freight over a distance of one mile.
Shortline railway: A railway with annual operating revenues of less than $250 million.
Track operated: The first main track over which a railway operates. This excludes second and other main track, passing tracks and crossovers, industrial tracks, spurs and yard tracks. Excludes track used by intercity passenger trains, commuter and tourist trains, and segments of track terminating in the U.S.
Train-mile: The movement of a train the distance of one mile.
__________________25 Source: Canadian Transportation of Dangerous Goods Regulations, section 1.4.
R a i l T r e n d s 2 0 1 7 29
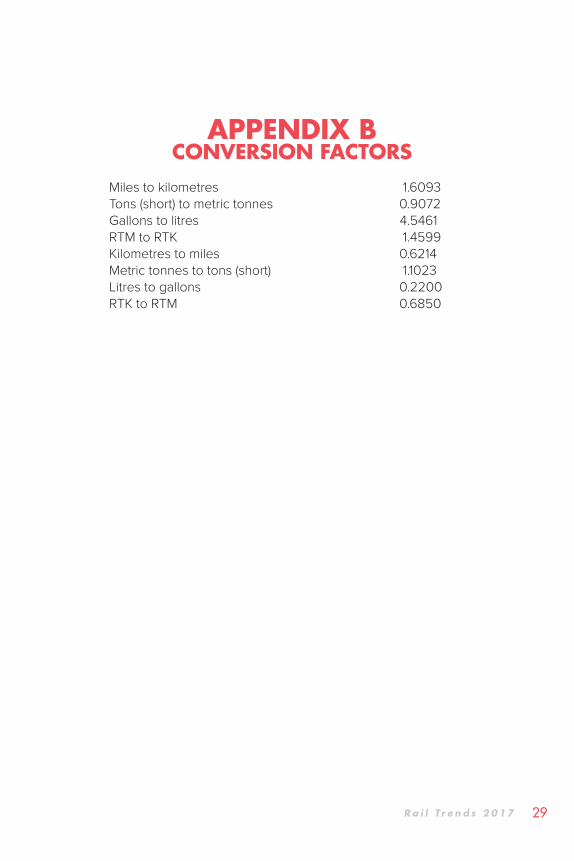
APPENDIX B CONVERSION FACTORS
Miles to kilometres 1.6093Tons (short) to metric tonnes 0.9072Gallons to litres 4.5461RTM to RTK 1.4599Kilometres to miles 0.6214Metric tonnes to tons (short) 1.1023Litres to gallons 0.2200RTK to RTM 0.6850

R a i l T r e n d s 2 0 1 730
APPENDIX CSAFETY DEFINITIONS
The following definitions apply to railway occurrences that are required to be reported pursuant to the Canadian Transportation Accident Investigation and Safety Board Act and the associated regulations.
Reportable railway accidentAn incident in which:
1. a person is killed or sustains a serious injury as a result of (i) getting on or off or being on board the rolling stock, or (ii) coming into contact with any part of the rolling stock or its contents;
2. the rolling stock or its contents (i) are involved in a collision or derailment, (ii) sustain damage that affects the safe operation of the rolling stock, (iii) cause or sustain a fire or explosion, or (iv) cause damage to the railway that poses a threat to the safe passage of rolling stock or to the safety of any person, property or the environment.
Dangerous goods involvement“Dangerous goods” has the same meaning as in section 2 of the Transportation of Dangerous Goods Act, 1992. An accident is considered to have dangerous goods involvement if any of a train’s cars carrying (or having last contained) a dangerous good derails, strikes or is struck by any other rolling stock or object. It does not mean that there was any release of product. Also included are crossing accidents in which the motor vehicle involved (e.g., tanker truck) is carrying a dangerous good.
Crossing accidentA crossing accident is when a locomotive or railcar is involved in a collision with a motor vehicle or pedestrian at a railway crossing, resulting in death, serious injury or property damage.
Trespassing accidentTrespassing accidents occur when people – primarily pedestrians who are not authorized to be on railway rights-of-way – are struck by locomotives or railway cars anywhere other than at railway crossings.
Other accident typesOther accident types include, but are not limited to, trespassing, collisions/derailments involving track units, rolling stock collisions with objects, or employee/passenger accidents.