rail competition changes since the staggers act
TRANSCRIPT

111
by Marvin E. Prater, Ken Casavant, Eric Jessup, Bruce Blanton, Pierre Bahizi, Daniel Nibarger, and Isaac Weingram
Agriculturalandothershippersareconcernedaboutthesufficiencyinruralareasoftransportationcapacity,thesufficiencyofcompetitioninthetransportationsystem,thereliabilityoftransportationservices, and the reasonableness of rates. This paper examines the sufficiency of rail freightcompetitionandtheeffectsofintramodalcompetitiononrailrates.
ThepaperbeginswithareviewoftheimportanceofrailtransportationforU.S.agriculturalproducers. Specificattention ispaid to thenatureof competition facedby railroads, especiallysincederegulation,using theanalytical toolof inverseHerfindahl-Hirschman Indices (HHI),byUSDACropReportingDistricts(CRD). Asshownbythe inverseHHIs, theoverall levelofrailcompetition for grains and oilseeds has generally decreased since the 1985-1992 period, eventhoughrailcompetitionhasincreasedforsomeCRDs.Inaddition,revenuetovariablecostratios(R/VC)increasedinmostoftheCRDsanalyzed,andtheanalysisfoundthemrelatedtothenumberofrailroadscompetingintheCRD.
Competition is thenanalyzed relative to the revenueper ton, revenueper ton-mile,and therevenuetovariablecostratios(R/VC)associatedwiththelevelofcompetitionforsixstateswiththeleastrail-to-railcompetition,anddistantfromwatertransportation,withthoseforfourstateshavingmorerail-to-railcompetitionandcloseproximitytowatertransportation.
INTRODUCTION
Railroad deregulation encouraged greater reliance on free markets to promote railroad profitability and public benefits (Grimm and Winston 2000). The Staggers Act significantly reduced economic regulation in the railroad industry, which has benefited shippers as well as railroads, but relies on competition to protect shippers and the public.
Since the Staggers Act, the average rate of return on investment for the railroad industry has increased from less than 2.5% during the 1970s to slightly more than 10% during 2006 and 2007 (AAR 2008). The return on equity for the railroad industry, when compared with revenue adequacy standards using STB’s Capital Asset Pricing Model (CAPM),1 has exceeded revenue adequacy2 levels from 2002 through 2006. In addition, railroad industry earnings above CAPM revenue adequacy standards have widened from 2004 through 2006 (Christensen & Associates 2008). However, when using the STB’s historical revenue adequacy standard, the Discounted Cash Flow model (DCF), the railroad industry did not appear to be revenue adequate (Christensen & Associates 2008).
During the first decade after the Staggers Act, the annual benefits to shippers from railroad deregulation amounted to more than $12 billion in 1999 dollars, equivalent to $14.7 billion in 2007 dollars (Grimm and Winston 2000). Shippers have benefitted from 20 years of decreasing rail rates (in terms of inflation-adjusted revenue per ton-mile) and the preservation of rural lines sold or leased to smaller railroad firms. Many of these new short line railroads have been able to operate profitably on rail lines abandoned by the major railroads, and have generally provided more individualized service to shippers (Babcock, Prater, Morrill, and Russell 1995).
As expected, the distribution of benefits has tended to favor grain producers and shippers in regions with more transportation competition (Bitzan, Vachal, VanWechel, and Vinge 2003). In addition, rates have not declined uniformly across commodities, and rates for some commodities are significantly higher than those for other commodities. In particular, from 1987 to 2004, rail rates for
Rail Competition Changes Since the Staggers Act

Rail Competition Changes
112
grain have increased 9%, but rates have declined for coal, motor vehicles, and miscellaneous mixed shipments (GAO 2006).
Despite the initial success of the Staggers Act, agricultural producers and shippers continue to express concern about decreased rail-to-rail competition, rapidly increasing rail rates, poor rail service, rail capacity constraints, and the fair allocation of rail capacity (NGFA 2005, USDA 2005). Because of these shipper concerns, Congress required USDA and USDOT in Section 6206 of the Food, Conservation, and Energy Act of 2008 (PL 110-246) to submit a report on rural transportation issues. The basis for this paper comes from some of the analysis from that report (USDA/DOT 2010).
Current Congressional debate includes proposals to reform railroad regulation because of decreases in rail competition since 1980, which have increased the amount of railroad market power relative to that of shippers (USDA 2000). Thus, a major purpose of this paper is to measure the level of rail competition for the transportation of grains and oilseeds in each crop reporting district (CRD). Two common ways of measuring changes in competition are the four-firm concentration ratio and the use of a Herfindahl-Hirschman Index (HHI). This paper examines changes in the four-firm concentration ratio in the United States since 1980 and changes in the inverse HHI by CRD since 1985 and finds that the amount of rail-to-rail competition for the shipment of grain and oilseeds has decreased for both measures.
In addition, this paper compares nominal rail rates per ton and per ton-mile as well as revenue-to-variable cost ratios of six states with limited rail-to-rail competition, and distant from barge-loading facilities, with those of four states with more rail-to-rail competition and close proximity to barge-loading facilities.
An affordable and reliable transportation network is necessary to maintain the strength and competitiveness of American agriculture and rural communities. Rail service is a particularly important part of that network for U.S. agriculture, because it is virtually the only cost-effective shipping alternative available for low-value, bulky commodities in rural areas that are distant from water transportation and markets. Therefore, examining the performance of the railroad system in agricultural movements is timely and policy relevant.
Agricultural producers are dispersed over the entire country, and unlike most other industries, are unable to move their operations at will as their production is tied to the land, and often to a particular climate. Because agricultural production is tied to arable land, producers must be able to transport their products to markets, many of which are located long distances from the farms.
Nine of the 10 top wheat-producing states are more than 150 miles from barge transportation on the Mississippi River, which usually provides the strongest intermodal competition to railroads for the long-distance movement of grain to export ports. Unlike other agricultural shippers in the United States, wheat shippers in much of the Great Plains have no cost-effective transportation alternatives to railroads. The wheat produced in these areas moves long distances to domestic markets for processing and consumption or to coastal ports for export. Shippers in these regions have little direct access to inland waterway transportation, and the distances involved make truck transportation uneconomical. Consequently, wheat is particularly dependent on rail; 66% of all wheat and wheat exports moved by rail during 2007 (USDA 2010).
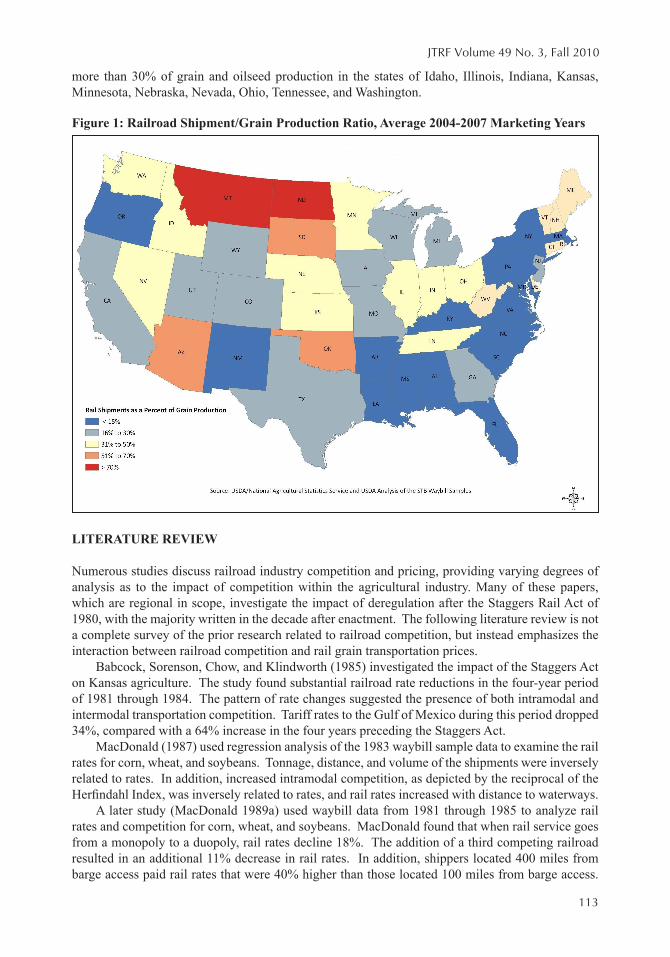
Agricultural shippers in Montana and North Dakota are particularly dependent on rail transportation because of their distance to inland waterways and the prohibitive distance for the use of trucks. On average, railroads transported more than 70% of the grains and oilseeds originated in Montana and North Dakota during the crop marketing years from 2004 to 2007 (Figure 1). A study by Tolliver and Dybing (2007) revealed that during crop marketing year 2004, railroads transported 78% of North Dakota crops. Another recent study states that Montana ships nearly 100% its wheat by rail, which corresponds with USDA findings for Montana (Cutler, Goldstein, Fauth, Crowley, and Whiteside 2009).
During the crop marketing years 2004–2007, railroads transported more than 50% of the grain production of Arizona, Oklahoma, and South Dakota. During the same time period, rail moved
JTRF Volume 49 No. 3, Fall 2010
113
more than 30% of grain and oilseed production in the states of Idaho, Illinois, Indiana, Kansas, Minnesota, Nebraska, Nevada, Ohio, Tennessee, and Washington.
LITERATURE REVIEW
Numerous studies discuss railroad industry competition and pricing, providing varying degrees of analysis as to the impact of competition within the agricultural industry. Many of these papers, which are regional in scope, investigate the impact of deregulation after the Staggers Rail Act of 1980, with the majority written in the decade after enactment. The following literature review is not a complete survey of the prior research related to railroad competition, but instead emphasizes the interaction between railroad competition and rail grain transportation prices.
Babcock, Sorenson, Chow, and Klindworth (1985) investigated the impact of the Staggers Act on Kansas agriculture. The study found substantial railroad rate reductions in the four-year period of 1981 through 1984. The pattern of rate changes suggested the presence of both intramodal and intermodal transportation competition. Tariff rates to the Gulf of Mexico during this period dropped 34%, compared with a 64% increase in the four years preceding the Staggers Act.
MacDonald (1987) used regression analysis of the 1983 waybill sample data to examine the rail rates for corn, wheat, and soybeans. Tonnage, distance, and volume of the shipments were inversely related to rates. In addition, increased intramodal competition, as depicted by the reciprocal of the Herfindahl Index, was inversely related to rates, and rail rates increased with distance to waterways.
A later study (MacDonald 1989a) used waybill data from 1981 through 1985 to analyze rail rates and competition for corn, wheat, and soybeans. MacDonald found that when rail service goes from a monopoly to a duopoly, rail rates decline 18%. The addition of a third competing railroad resulted in an additional 11% decrease in rail rates. In addition, shippers located 400 miles from barge access paid rail rates that were 40% higher than those located 100 miles from barge access.
Figure 1: Railroad Shipment/Grain Production Ratio, Average 2004-2007 Marketing Years

Rail Competition Changes
114
Finally, MacDonald calculated inverse Herfindahl-Hirschman indices for each CRD and concluded that each CRD was characterized by rail oligopolies.
Harbor (2008) found similar results for rail rates for soybeans. Rail rates decreased 10.9% when moving from a monopoly to two-railroad competition in a market 300 miles from a barge-loading facility. Adding a third railroad decreased rates another 6.5%. Furthermore, in the 12-state region studied, the average inverse HHI for corn had dropped to 1.86 in 2004 from 2.30 in 1983. The average inverse HHI for soybeans and wheat decreased from 2.46 in 1983 to 1.90 in 2004 and from 1.85 in 1983 to 1.58 in 2004, respectively.
Chow (1986) studied post-Staggers rail grain rates for the Central Plains region. The analysis indicated an overall reduction in wheat rail rates of 34.5% in the five-year period after enactment of the Staggers Act, with the most significant reductions occurring in movements to the export markets.
Kwon, Babcock, and Sorenson (1994) examined the impacts of the Staggers Act in the latter half of the 1980s and found that railroads practiced differential pricing for intra-Kansas and export shipments of wheat. There were substantial differences in the factors affecting the revenue-to-variable cost ratios for intra-Kansas wheat movements versus that of Kansas export wheat movements. They found revenue-to-variable cost ratios increased steadily from 1986 through 1989, but may have been caused by diminishing export demand.
Fuller, Bessler, MacDonald, and Wohlgenant (1987) found deregulation to have had a significant effect on rail corridors linking Kansas and Texas with Gulf ports and a relatively modest effect on the corridor linking Indiana with East Coast ports. Real rail rates declined $.37 per bushel in the Kansas corridor and $.31 per bushel in the Texas corridor during the 1981-1985 period. In the Indiana corridor, estimated real rail rates decreased $.08 per bushel. Railroad deregulation had little statistically significant effect on real rail rates from Iowa and Illinois to the Gulf ports.
Koo, Tolliver, and Bitzan (1993) examined railroad pricing behavior in North Dakota. The authors stated that the region has unique transportation characteristics that include limited intermodal competition due to great distances to barge-loading facilities and to major domestic and export markets. They found that distance, volume, weight per car, intramodal competition, and intermodal competition had significant negative effects on rail rates.
Thompson, Hauser, and Coughlin (1990) evaluated the pre- and post-Staggers effect of competition on railroad revenue-to-variable cost ratios for export shipments of corn and wheat. The regression results for corn rates were less significant than those for wheat rates. There was a lack of identifiable differences in pre- and post-Staggers pricing, which they felt may be attributable to the close correlation between changes in operating factors, such as shipment size and destination opportunity. They concluded that their results did not indicate a clear effect of the Staggers Rail Act on rail rate competitiveness.
Wilson and Wilson (2001) examined rail rates per ton-mile for barley, corn, sorghum, wheat, and soybeans moved by rail. The explanatory variables include commodity ton-miles, commodity prices, average length of haul, and a non-linear specification of deregulation that allows the effects to phase in over time. The results showed that commodity prices have positive effects on rail rates per ton-mile and length of haul has a strong negative effect. The results indicated a large negative effect on rates per ton-mile from deregulation, which dissipate with time.
RAIL COMPETITION IN AN ERA OF DEREGULATION
This section discusses the deregulation of the railroad industry, the role of competition, and various types of competition in the railroad industry today to establish a foundation for the analysis of changes in railroad competition for grain and oilseed transportation.

JTRF Volume 49 No. 3, Fall 2010
115
Deregulation of the Railroad Industry
The constraints of pervasive economic regulation, although meant to protect shippers from the abuse of railroad market power, resulted in nearly bankrupting the railroad industry as well as increasing shipper costs. Furthermore, federal legislators recognized that industry regulation was expensive for both industry and government, and created market distortions for nearly all regulated markets (Hovenkamp 2005). Congress deregulated railroads in response to arguments that the industry needed greater pricing and operating freedom to avoid more bankruptcies (Meyer 1973).
As the nation deregulated the railroad industry, conflicting goals included the preservation of effective transportation competition, the regulatory protection of captive shippers, deregulation of rail rates when sufficient competition is present, and revenue adequacy of railroad firms.
The concept of adequate competition is so important that competition is mentioned four times, avoidance of undue concentration of market power is mentioned once, and adequate railroad revenues or sound economic conditions is mentioned twice in the 15 Rail Transportation Policy goals of the Staggers Act and ICCTA (Public Law 104-88). The presence of transportation competition was expected to protect most shippers by constraining the use of railroad market power. On the other hand, adequate revenues are necessary for rail service to remain viable and continue providing service.
In cases when rail-to-rail competition is not present, captive shippers need meaningful and cost-effective rate appeals processes to protect against the excessive use of railroad market power (GAO 1999, USDA 2004). Until 2008, the only rail rate appeals used by shippers were Stand-Alone Cost procedures, which cost millions to adjudicate and involve the construction and operation of a hypothetical railroad (GAO 1999, USDA 2004, USDA and USDOT 2010). Whereas a coal case typically involves the construction of a hypothetical railroad between a single origin and a single destination, a rate case for agricultural shippers would typically involve single or multiple origins to multiple destinations (USDA 2004). Agricultural shippers in the Northern Plains appealed rail rates in the McCarty Farms case, but spent millions of dollars and lost on appeal after 16 years (USDA and USDOT 2010). Thus, coal shippers are the main users of the Stand-Alone Cost procedures, which are considered far too expensive and complicated for agricultural shippers to use. Indeed, an agricultural shipper would spend far more filing a Stand-Alone Cost rate appeal than the value of the case (USDA 2004, USDA and USDOT 2010).
Even though Congress had required small rate case appeals procedures as early as 1986, small shippers essentially had no protection until 1996, when the STB first made small rate case appeals procedures available (USDA and USDOT 2010). Small shippers, however, did not use those procedures because they did not perceive them to be cost effective and were concerned about the uncertainty of the process (USDA 2004). The STB held a proceeding regarding small rate case appeals procedures and set new rules for small rate case appeals in 2008. Although chemical shippers (i.e., E.I. Dupont v. CSX Transportation) have successfully used these procedures, so far no agricultural shipper has appealed rail rates under these new appeals procedures (USDA and USDOT 2010).
Role of Competition
Some economists claim that the way to preserve and extend the benefits of deregulation is to increase rail competition (Grimm 2004). Many shipper groups have echoed this conclusion in comments prepared for various proceedings before the Surface Transportation Board. Market-based competition is a fundamental economic policy of the United States (National Commission 1979). Competition requires businesses to become efficient and effective in providing the kinds and quality of goods and services the consumer desires.3 Competitive markets reduce market distortions and result in the efficient allocation of resources, providing a basis for economic development. “The U.S. economy is an example of how free markets can lead to the creation of wealth, making possible

Rail Competition Changes
116
improved living standards and greater prosperity (Lewis 2004).” Furthermore, industries sheltered from competition are less vigorous and successful than industries subject to competition (Porter 1990).
When economic regulation is imposed on an industry, competition is not as important because government protects the consumer and social welfare (Kahn 1998). When an industry is deregulated, however, competition and antitrust enforcement become the major forces protecting the consumer and society from unfair business practices (Kahn 1998). The loss of competition, combined with deregulation, could lead to the unrestrained use of market power (Kahn 1998). This is especially true in highly concentrated industries that possess market power, such as the railroad industry (Kahn 1998). Unrestrained use of railroad market power would likely result in unnecessarily high rail rates and the inability of agricultural producers to reach multiple and competing markets. Because agricultural producers typically receive a price net of transportation, higher rail rates and inability to access a variety of markets result in reduced producer income. The preservation and protection of competition is vital for the economic prosperity of agricultural producers and shippers contending with a mostly deregulated railroad industry.
Effective Competition
In order for competition to be effective, it must be cost competitive. Four types of competition can constrain the use of railroad market power (Tye 1991, STB 1998):
• Intermodal competition from other transportation modes, such as motor carrier, multimodal, and barge transportation
• Intramodal (rail-to-rail) competition among individual, independent railroads• Geographic competition, in which a producer can haul products to rail loading facilities
located on competing railroads or in which a buyer could obtain products from other originating locations
• Product competition, in which a producer can substitute other inputs in the manufacture of a product
Barges, railroads, and trucks not only compete against each other, they also complement each other. Before agricultural products reach the market, they have often been transported by two or more transportation modes. This balance between competition and complementaries provides agricultural shippers with a highly efficient, low-cost system of transportation (USDA 2006).
Decreased rail-to-rail competition among Class I railroads has resulted in an increased ability of railroads to raise rates. The presence of a competing railroad has a noticeable effect on rail rates. Rail rates rise well above incremental costs in regions with one or two railroads and are far removed from navigable rivers (MacDonald 1989b).
Although product and geographic competition can limit railroad pricing in some cases, these forms of competition are less relevant to market dominance today in light of the rapid consolidation of the rail industry (STB 1998).
The average number of route miles operated by each of the Class I railroads in the United States has more than tripled since 1980, resulting in dominance over larger geographic regions by a single Class I railroad. Railroad mergers of the 1960s and 1970s combined smaller rail systems that operated in smaller geographic territories. In the 1980s, newly merged rail systems began to gain dominance within some geographic regions. For instance, in 1960, the average Class I railroad in the United States operated 1,956 route miles. By 1980, this had increased to 4,226 miles, and by 2007, to 13,473 miles (AAR Ten-Year Trends various editions).
As a result, many farmers in the Plains States no longer have a cost-effective option of hauling grain to an elevator served by a competing railroad. In 1980, the ability of a farmer to haul grain to an elevator served by a competing railroad often provided the competition necessary to constrain rail rates. Today, only two Class I railroads are dominant in the western United States and two are
JTRF Volume 49 No. 3, Fall 2010
117
dominant in the eastern United States. This decrease in rail-to-rail competition has decreased the effectiveness and the relevance of geographic and product competition (USDA 1998).
RAILROAD CONCENTRATION AND MARKET SHARES
Since the 1920s, many railroads have merged. During the 1960s and 1970s, many of the mergers combined financially weak railroads with stronger firms in the hope of developing a financially stable railroad that was large enough to compete effectively with other transportation modes. After deregulation, the pace of merger activity picked up as railroads strove to increase geographic range, eliminate duplicate lines, reduce costs by increasing the size of the firm, and gain increased market power.
Many at the time of enactment of the Staggers Act did not foresee the extent of the loss of rail-to-rail competition because of rail mergers, which has resulted in increased market power. Many economists, however, anticipated the rationalization of the rail network because the regulated railroad industry was characterized by over-capacity. Consequently, reduction in excess capacity was a logical and expected result of deregulation. The concentration of increased tonnage on fewer track miles has enabled railroads to reap enormous economies of scale. Rail costs have fallen 60% in real terms, and most of these savings have been passed on to shippers (STB 2009).
Today there are two major duopolies—one serving the western United States and the other serving the East. In addition to these four mega railroads, during 2007 there were three smaller Class I railroads serving the central portion of the nation, 33 regional railroads, and 523 local railroads (AAR 2008).
Market Concentration and Share
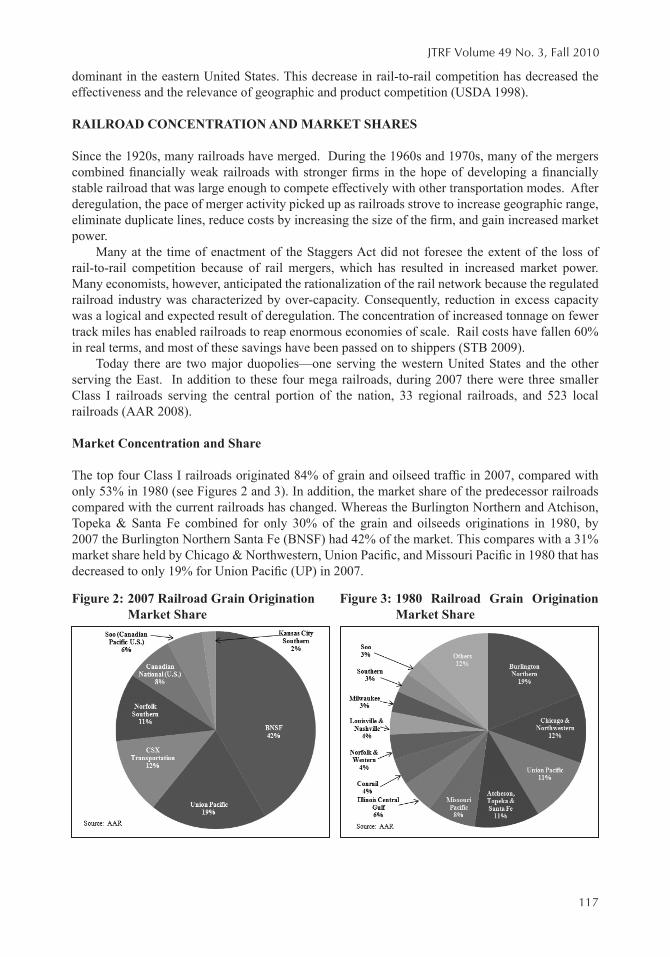
The top four Class I railroads originated 84% of grain and oilseed traffic in 2007, compared with only 53% in 1980 (see Figures 2 and 3). In addition, the market share of the predecessor railroads compared with the current railroads has changed. Whereas the Burlington Northern and Atchison, Topeka & Santa Fe combined for only 30% of the grain and oilseeds originations in 1980, by 2007 the Burlington Northern Santa Fe (BNSF) had 42% of the market. This compares with a 31% market share held by Chicago & Northwestern, Union Pacific, and Missouri Pacific in 1980 that has decreased to only 19% for Union Pacific (UP) in 2007.
Figure 2: 2007 Railroad Grain Origination Market Share
Figure 3: 1980 Railroad Grain Origination Market Share
Rail Competition Changes
118
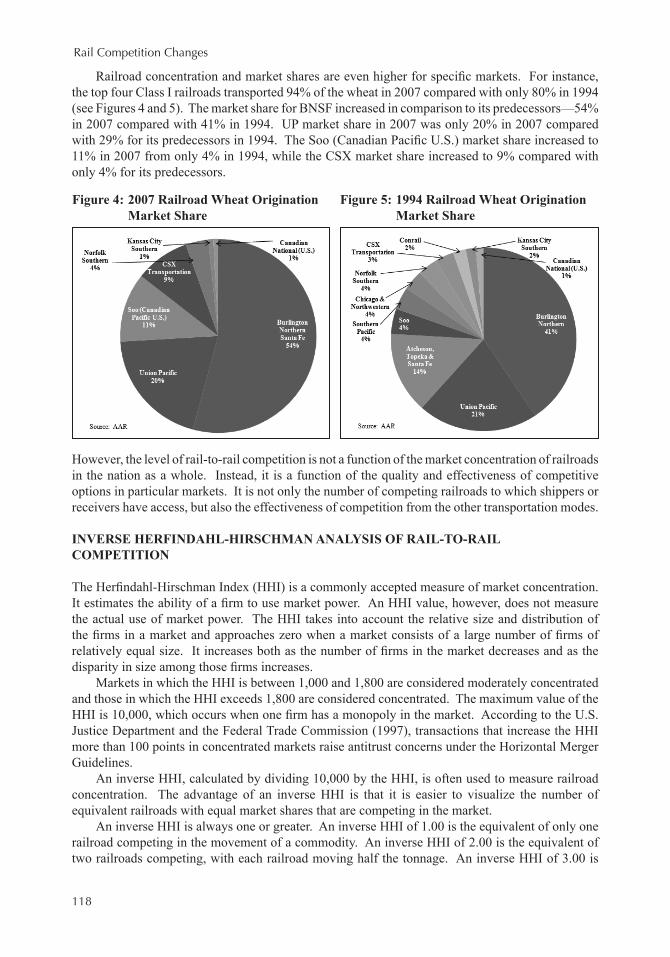
Railroad concentration and market shares are even higher for specific markets. For instance, the top four Class I railroads transported 94% of the wheat in 2007 compared with only 80% in 1994 (see Figures 4 and 5). The market share for BNSF increased in comparison to its predecessors—54% in 2007 compared with 41% in 1994. UP market share in 2007 was only 20% in 2007 compared with 29% for its predecessors in 1994. The Soo (Canadian Pacific U.S.) market share increased to 11% in 2007 from only 4% in 1994, while the CSX market share increased to 9% compared with only 4% for its predecessors.
However, the level of rail-to-rail competition is not a function of the market concentration of railroads in the nation as a whole. Instead, it is a function of the quality and effectiveness of competitive options in particular markets. It is not only the number of competing railroads to which shippers or receivers have access, but also the effectiveness of competition from the other transportation modes.
INVERSE HERFINDAHL-HIRSCHMAN ANALYSIS OF RAIL-TO-RAIL COMPETITION
The Herfindahl-Hirschman Index (HHI) is a commonly accepted measure of market concentration. It estimates the ability of a firm to use market power. An HHI value, however, does not measure the actual use of market power. The HHI takes into account the relative size and distribution of the firms in a market and approaches zero when a market consists of a large number of firms of relatively equal size. It increases both as the number of firms in the market decreases and as the disparity in size among those firms increases.
Markets in which the HHI is between 1,000 and 1,800 are considered moderately concentrated and those in which the HHI exceeds 1,800 are considered concentrated. The maximum value of the HHI is 10,000, which occurs when one firm has a monopoly in the market. According to the U.S. Justice Department and the Federal Trade Commission (1997), transactions that increase the HHI more than 100 points in concentrated markets raise antitrust concerns under the Horizontal Merger Guidelines.
An inverse HHI, calculated by dividing 10,000 by the HHI, is often used to measure railroad concentration. The advantage of an inverse HHI is that it is easier to visualize the number of equivalent railroads with equal market shares that are competing in the market.
An inverse HHI is always one or greater. An inverse HHI of 1.00 is the equivalent of only one railroad competing in the movement of a commodity. An inverse HHI of 2.00 is the equivalent of two railroads competing, with each railroad moving half the tonnage. An inverse HHI of 3.00 is
Figure 4: 2007 Railroad Wheat Origination Market Share
Figure 5: 1994 Railroad Wheat Origination Market Share

JTRF Volume 49 No. 3, Fall 2010
119
the equivalent of three railroads competing in the market, with each railroad moving a third of the tonnage.
The value of an inverse HHI also can be barely above 1.01 even when multiple railroads are competing in a CRD, depending on the relative market share of each. A market with two railroads, one of which carries 95% of the traffic, has an inverse HHI of 1.10. The value of the inverse HHI for a market with two railroads can range from 1.01 to 2.00. Likewise, the inverse HHI for a market with three competing railroads can range from 1.01 to 3.00.
Key Differences in This Analysis
This study has two major differences from the two recent studies by GAO (2006) and Laurits R. Christensen Associates, Inc. (2008) that used HHI to analyze railroad concentration and rates in markets.
Only the tariff rates have been used for revenue calculations because the STB has no jurisdiction over contract rates. The STB has jurisdiction only on tariff rates having a revenue-to-variable cost ratio of 180% or more. In addition, the actual contract rail rates are not shown in the Confidential Waybill Sample. Therefore, tariff rates were separated from contract rates using a “Contract Flag” field that STB provided to supplement the Confidential Waybill Sample. Due to contract confidentiality concerns, STB has provided the Unmasked Confidential Waybill Sample, which contains the actual contract rates, for only very few studies (i.e., Christensen and Associates [2008], GAO [2006]). Many other studies examining railroad revenues and rates were not able to remove the bogus contract rates because the contract field flag is not available in the Public Waybill Sample.
When calculating the tonnages for use in the inverse HHIs, data from all movements were used. Other studies used similar methods to calculate the inverse HHIs.
The second major difference in this study is that tonnages originated on smaller railroads connecting to only one other railroad were considered as part of the connecting railroad. This gives a more accurate portrayal of actual market share controlled by each railroad. When smaller railroads connected to two or more railroads, no attempt was made to assign the smaller railroads’ volumes to a particular railroad. This is because little industry data are available regarding which railroads have contractual interchange commitments that may or may not strictly limit their ability to interchange with other railroads.
This study split the period from 1985 to 2007 into three multi-year time periods (periods were chosen to reflect structural changes in the industry) rather than using data for single years. This was done to obtain more CRDs having more than 30 observations, below which no results were reported for the CRD. The three periods include:
• Period 1: 1985–1992, an eight-year period representing the early years of deregulation, and including some important railroad mergers.
• Period 2: 1993–2002, 10 years that saw many mergers and the formation of the Eastern and Western railroad duopolies. Important operational issues arose during the implementation of these mergers.
• Period 3: 2003–2007, five years in which capacity constraints on the rail system first ap-peared, when the early retirement of engineers and conductors caused operational prob-lems, and disruptions caused by storms were unusually severe. Major increases in rail rates due to capacity constraints and high fuel costs also occurred during this period.
An inverse HHI for originated tonnage by CRD was calculated and mapped for four major commodity groups:
• Grain and oilseeds• Grain products including dried distillers grains with solubles (DDGS)• Food products excluding grain products and DDGS• Fertilizers

Rail Competition Changes
120
Analysis of Inverse HHI and Revenue-to-Variable Cost Ratio
As rail-to-rail competition decreases in a CRD, the market power of the railroads increases. A decrease in competition could result in higher rail rates and could give railroads the market power to change service terms. The revenue-to-variable cost ratio is an indicator of that market power.
The first part of this study used inverse HHIs to measure the degree of rail-to-rail competition in each CRD. The absolute value of the inverse HHIs and the degree of change are both important to an understanding of competitive status.
Inverse HHI Analysis
A markedly decreasing trend in rail-to-rail competition for shippers of the four product groups was found; many of the CRDs having higher inverse HHIs during Period 1 (1985 to 1992) moved to lower inverse HHIs by Period 3 (2003 to 2007) (see Table 1). The level of rail-to-rail competition for grain and oilseeds shippers decreased in 109 CRDs, and only 38 CRDs had an increase in rail-to-rail competition. The percentage of CRDs having a decrease in the level of rail-to-rail competition for the other three product groups ranged from 67% to 76%, which is similar to that of grains and oilseeds.
Revenue-to-variable cost ratios (R/VC) for all product groups shifted into the higher R/VC ranges. For grains and oilseeds, 108 CRDs (83%) had an increase in the R/VC ratio, but only 22 (17%) had a decrease. The percentage of CRDs experiencing increases in the R/VC ranged from 77% for food products to 83% for grain and oilseeds. The R/VC ratios were calculated by dividing the freight revenue field in the Confidential Waybill Sample by the variable cost field.
Table 1: Summary of HHIs and R/VCs for Four Commodity Groups AnalyzedChange in HHI Change in R/VC No. of CRDs HHI =1
Commodity Group >0 Same <0 >0 <0 Period 1 Period 3Grains & oilseeds No. 38 9 109 108 22 20 25
% 24 6 70 83 17 10 15Grain Products No. 23 2 59 48 13 14 13
% 27 2 70 79 21 11 13Food Products No. 25 11 113 84 25 20 40
% 17 7 76 77 23 11 25Fertilizers No. 12 5 35 19 5 11 12
% 23 10 67 79 21 13 21
Source: USDA analysis of STB Waybill Samples
The percentage of CRDs in which a railroad had a monopoly (inverse HHI equal to 1.00) for all product groups increased between Period 1 and Period 3. For grain and oilseeds, the number of CRDs with a rail monopoly increased from 20 (10% of the total CRDs) in Period 1, to 25 (15%) in Period 3. Eleven CRDs in this group of 20 had a change in the inverse HHI and nine had no change. Only two CRDs had an increase in competition since Period 1; one had an increase of 0.09 and the other had an increase of 0.80.4

JTRF Volume 49 No. 3, Fall 2010
121
R/VC Ratio Analysis
Increased competition is expected to result in lower rail rates. The percentage of CRDs having average R/VC ratios below 180 increases as the level of rail competition increases during periods 1 and 3 (Table 2). For example, during Period 3, only 50% of the CRDs that were served by a rail monopoly had average R/VC ratios below 180. In contrast, during the same period, 93% of the CRDs had average R/VC ratios below 180 when more than four strong railroads were competing. The finding that increased competition results in lower rail rates is consistent with the conclusions of studies by MacDonald (1989) and Harbor (2008).
Table 2: Grain and Oilseeds, Changes in R/VC Ratios by Inverse HHIa Number of Crop Reporting Districts
Inverse HHI Range Revenue-to-Variable Cost (R/VC) Range
R/VC Period 1
Percent of HHI Range
R/VC Period 3
Percent of HHI Range
1.00 < 100 0 0% 0 0%> 100 and <= 180 6 60% 5 50%> 180 and <= 240 4 40% 5 50%> 240 and <= 300 0 0% 0 0%> 300 0 0% 0 0%
> 1.00 and <= 2.00 < 100 8 12% 2 4%> 100 and <- 180 53 83% 43 78%> 180 and <= 240 3 5% 10 18%> 2.40 and <= 3.00 0 0% 0 0%> 3.00 0 0% 0 0%
> 2.00 and <= 3.00 < 1.0 7 15% 4 10%> 1.0 and <= 1.80 37 80% 29 75%> 1.80 and <= 2.40 2 5% 6 15%> 2.40 and <= 3.00 0 0% 0 0%> 3.00 0 0% 0 0%
> 3.00 and <= 4.00 < 1.0 3 11% 1 4%> 1.0 and <= 1.80 22 85% 20 87%> 1.80 and <= 2.40 1 4% 2 9%> 2.40 and <= 3.00 0 0% 0 0%> 3.00 0 0% 0 0%
> 4.00 and <= 5.75 < 1.0 1 6% 0 0%> 1.0 and <= 1.80 16 94% 13 93%> 1.80 and <= 2.40 0 0% 1 7%> 2.40 and <= 3.00 0 0% 0 0%> 3.00 0 0% 0 0%
Total Number of CRDs 163 141Maximum R/VC 198.62 228.56Minimum R/VC 65.17 68.98
Calculated on tariff rail rates only when more than 30 observations in a CRD.Source: Surface Transportation Board, Confidential Waybill Sample.
Rail Competition Changes
122
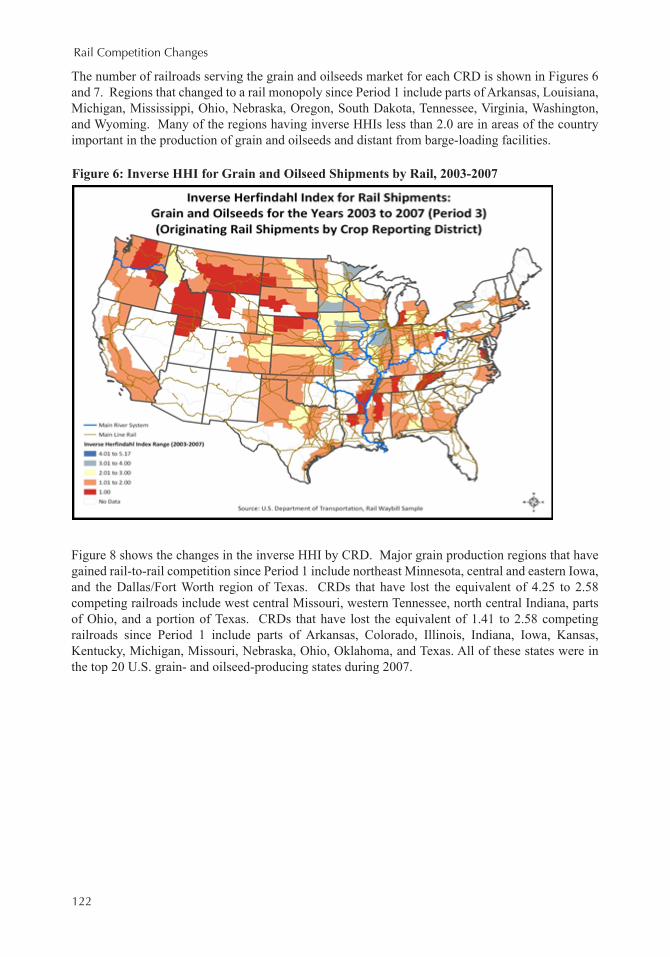
The number of railroads serving the grain and oilseeds market for each CRD is shown in Figures 6 and 7. Regions that changed to a rail monopoly since Period 1 include parts of Arkansas, Louisiana, Michigan, Mississippi, Ohio, Nebraska, Oregon, South Dakota, Tennessee, Virginia, Washington, and Wyoming. Many of the regions having inverse HHIs less than 2.0 are in areas of the country important in the production of grain and oilseeds and distant from barge-loading facilities.
Figure 8 shows the changes in the inverse HHI by CRD. Major grain production regions that have gained rail-to-rail competition since Period 1 include northeast Minnesota, central and eastern Iowa, and the Dallas/Fort Worth region of Texas. CRDs that have lost the equivalent of 4.25 to 2.58 competing railroads include west central Missouri, western Tennessee, north central Indiana, parts of Ohio, and a portion of Texas. CRDs that have lost the equivalent of 1.41 to 2.58 competing railroads since Period 1 include parts of Arkansas, Colorado, Illinois, Indiana, Iowa, Kansas, Kentucky, Michigan, Missouri, Nebraska, Ohio, Oklahoma, and Texas. All of these states were in the top 20 U.S. grain- and oilseed-producing states during 2007.
Figure 6: Inverse HHI for Grain and Oilseed Shipments by Rail, 2003-2007

JTRF Volume 49 No. 3, Fall 2010
123
Figure 7: Inverse HHI for Grain and Oilseed Shipments by Rail, 1985-1992
Figure 8: Change in Inverse HHI for Grain and Oilseed Shipments by Rail, 1985-1992 Compared to 2003-2007

Rail Competition Changes
124
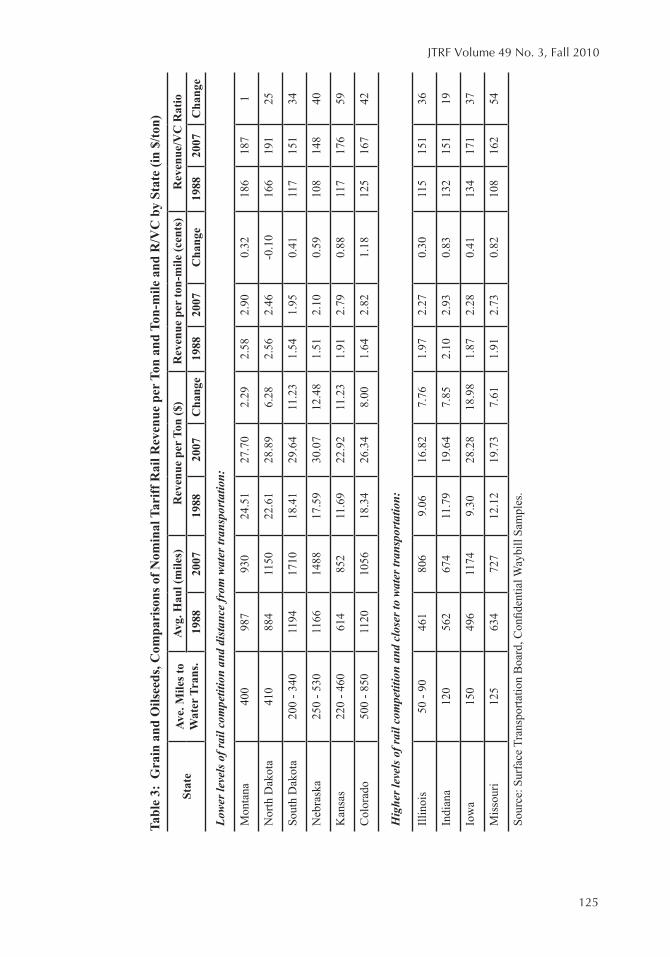
Comparison of Rail-to-Rail Competition and Distance-to-Water Transportation by State
The study then examined annual statewide tariff rail rates from 1988 through 2007 for a group of six states with limited rail-to-rail competition and varying distances from barge-loading facilities, and a group of four states with more rail-to-rail competition and closer to barge loading facilities.
States in the first group—with less rail-to-rail competition and varying distances from barge-loading facilities—include Montana, North Dakota, South Dakota, Nebraska, Kansas, and Colorado. The average distance to barge-loading facilities from the middle of these states ranges from 200 to 850 miles. For states showing a range of distances to water, the shorter distances are to facilities on the Missouri, Arkansas, Snake, or Illinois Rivers; the longer distances are to facilities on the Mississippi or Ohio Rivers (Table 3). Barge movements on the Missouri and Arkansas Rivers have fewer cost efficiencies compared with rail transportation; barge movements on the Mississippi, Ohio, and Illinois rivers do realize cost efficiencies compared with rail.
All these states produce large amounts of grain and oilseeds. For instance, Nebraska is ranked third in the United States in grain and oilseed production, Kansas sixth, South Dakota seventh, North Dakota ninth, Colorado fourteenth, and Montana eighteenth.
Grain producers in Montana and North Dakota have raised issues for many years about high rail rates. Rates in Montana and North Dakota have often been higher than for South Dakota, Nebraska, and Kansas grain, even though the grain travels shorter distances over the same track to reach Pacific Northwest markets. Montana and North Dakota have appropriated funds to study grain and oilseed rail rates and to appeal those rates to the STB.
The states with more rail-to-rail competition and proximity to barge-loading facilities are Illinois, Indiana, Iowa, and Missouri. These states, also, are major grain and oilseed producers; Iowa is ranked first in the United States, Illinois second, Indiana fifth, and Missouri tenth. All of these states border the Mississippi or Ohio rivers, and the Illinois River runs through Illinois. The average distance from the middle of these states to barge-loading facilities is from 50 to 150 miles.
The levels of intermodal and intramodal competition, average length of haul, and time are among the factors expected to affect revenue per ton and revenue per ton-mile. The levels of intramodal and intermodal competition would be among the factors expected to affect the R/VC ratio.
In 1988, Montana and North Dakota paid the highest nominal (not adjusted for inflation) rail rates in the nation to move grain and oilseeds (see Table 3).5 Montana grain shippers paid $25.41 per ton and North Dakota $22.61. Kansas shippers paid only $11.69 and Nebraska $17.59. The average rates for states with more transportation competition ranged from $9.06 to $12.12 per ton, but the average length of haul for those states was only 538 miles, compared with 994 miles for the states having less transportation competition.
By 2007, however, four states paid more to ship grain than shippers in Montana ($27.70): Nebraska paid $30.07 per ton, South Dakota $29.64, North Dakota $28.89, and Iowa $28.28. The average length of haul for the states paying more than Montana ranged from 1,150 to 1,710 miles (STB Waybill samples). Montana rates per ton had increased 8.3% and North Dakota 21.7% since 1988, but the rate increase for the other eight states shown in Table 3 ranged from 30.4% (Colorado) to 67.1% (Iowa). The greater shipping distances since 1988 for Iowa shippers contributed to the unusually large increase in their rate per ton (the average length of haul increased from 497 miles to 1,240 miles). By 2007, the average length of haul for the states having less transportation competition had increased to 1,198 miles, compared with only 845 miles for states having more transportation competition (STB Waybill samples).
Nominal tariff rates per ton-mile show that states lacking transportation competition do not always pay higher rates than states having more transportation competition; both transportation competition and length of haul are expected to be negatively related to the rate per ton-mile. In 1988, Montana (987 miles) and North Dakota (1,150 miles) paid the highest nominal tariff rates per ton-mile, but Illinois (460 miles), Indiana (561 miles), Kansas (612 miles), and Missouri (635 miles) paid the next highest rates (see Table 3). By 2007, Indiana (674 miles) paid the highest tariff rates
JTRF Volume 49 No. 3, Fall 2010
125
Tabl
e 3:
Gra
in a
nd O
ilsee
ds, C
ompa
riso
ns o
f Nom
inal
Tar
iff R
ail R
even
ue p
er T
on a
nd T
on-m
ile a
nd R
/VC
by
Stat
e (in
$/to
n)
Stat
eAv
e. M
iles t
o W
ater
Tra
ns.
Avg.
Hau
l (m
iles)
Rev
enue
per
Ton
($)
Rev
enue
per
ton-
mile
(cen
ts)
Rev
enue
/VC
Rat
io19
8820
0719
8820
07C
hang
e19
8820
07C
hang
e19
8820
07C
hang
e
Low
er le
vels
of r
ail c
ompe
titio
n an
d di
stan
ce fr
om w
ater
tran
spor
tatio
n:
Mon
tana
400
987
930
24.5
127
.70
2.29
2.58
2.90
0.32
186
187
1
Nor
th D
akot
a41
088
411
5022
.61
28.8
96.
282.
562.
46-0
.10
166
191
25
Sout
h D
akot
a20
0 - 3
4011
9417
1018
.41
29.6
411
.23
1.54
1.95
0.41
117
151
34
Neb
rask
a25
0 - 5
3011
6614
8817
.59
30.0
712
.48
1.51
2.10
0.59
108
148
40
Kan
sas
220
- 460
614
852
11.6
922
.92
11.2
31.
912.
790.
8811
717
659
Col
orad
o50
0 - 8
5011
2010
5618
.34
26.3
48.
001.
642.
821.
1812
516
742
Hig
her l
evel
s of r
ail c
ompe
titio
n an
d cl
oser
to w
ater
tran
spor
tatio
n:
Illin
ois
50 -
9046
180
69.
0616
.82
7.76
1.97
2.27
0.30
115
151
36
Indi
ana
120
562
674
11.7
919
.64
7.85
2.10
2.93
0.83
132
151
19
Iow
a15
049
611
749.
3028
.28
18.9
81.
872.
280.
4113
417
137
Mis
sour
i12
563
472
712
.12
19.7
37.
611.
912.
730.
8210
816
254
Sour
ce: S
urfa
ce T
rans
porta
tion
Boa
rd, C
onfid
entia
l Way
bill
Sam
ples
.

Rail Competition Changes
126
per ton-mile, followed by Montana (930 miles), Colorado (1,056 miles), and Kansas (852 miles) (STB Waybill samples). The states having the least increase in tariff rates per ton-mile include North Dakota (with a 0.10 cent decrease), Illinois, South Dakota, Iowa, and Montana. Colorado, Kansas, and Indiana had the steepest increases.
An analysis of R/VC ratios based on tariff rates, which indicate the profitability of a movement for the railroads, shows mixed results relative to the amount of transportation competition. In 1988, Montana and North Dakota grain shippers had the highest R/VC ratios, at 186 and 166. The R/VC ratio for Montana was nearly 40% higher than it was for Iowa, which had the third highest R/VC rate among the 10 states selected for comparison (see Table 3). In 2007, North Dakota and Montana grain shippers still paid the highest R/VC ratio, and Kansas, Iowa, and Colorado paid the next highest ratios. In 2007, however, the Montana R/VC ratio was only 10% higher than Iowa’s. The R/VC ratio for Montana increased 0.5% and North Dakota’s 13% between 1988 and 2007. The R/VC ratio for Missouri increased 33%, that of Kansas 34%, and that of Nebraska 27%.
The use of statewide averages may have masked the relationship between transportation competition and R/VC. Prior studies by McDonald (1989a) and Harbor (2008), which are based upon individual waybills, show a relationship between rail-to-rail and intermodal competition and rail rates.
SUMMARY AND CONCLUSIONS
An affordable and reliable transportation network is necessary to maintain the strength and competitiveness of American agriculture and rural communities. Agricultural commodities are often produced in large quantities at locations distant from domestic and international markets, making rail a natural and preferred choice of transportation. Truck transportation is not cost-effective for many agricultural shippers, who are often located long distances from markets, and barge transportation is not an option for most. Rail is the only cost-effective transportation mode broadly available for many agricultural producers. Railroads transport nearly all of the grains and oilseeds produced in Montana, more than 70% of that produced in North Dakota, and more than 50% of that produced in Arizona, Oklahoma, and South Dakota.
Rail deregulation encouraged greater reliance on free markets to promote railroad profitability and public benefits, but relied on competition to protect shippers and the public. The extent of the loss of rail-to-rail competition due to railroad mergers, and the associated increase in market power, was not foreseen by many when the Staggers Act was passed. However, the abandonment of rail lines was a predictable outcome of railroad deregulation. Railroads under regulation were burdened by significant excess capacity. Deregulation permitted mergers and line abandonments, which eliminated overcapacity as a problem for railroads, and greatly increased railroad market power and profitability on remaining lines.
The preservation of competition as a substitute for regulation is vital for the economic prosperity of agricultural producers and shippers contending with a deregulated railroad industry. In deregulating the rail industry, however, Congress recognized that intermodal competition had the potential to be as effective as rail-to-rail competition in restraining the exercise of market power.
Railroad concentration for grains and oilseeds shipments has increased substantially since 1980 due to railroad consolidation and rail abandonment. The four-firm concentration ratio for U.S. railroad grain and oilseed traffic increased from 53% in 1980 to 84% in 2007. Market concentration is even greater for some individual commodities, such as wheat. The four-firm concentration ratio for U.S. railroad wheat traffic increased from 80% in 1994 to 94% in 2007.
Inverse HHI analysis shows the level of rail-to-rail competition for grains and oilseeds decreased significantly between 1985 and 2007. The number of competing lines decreased in 70% of the CRDs and increased in only 24%. The CRDs served by only one railroad increased from 10% in 1985 to 15% by 2007. As rail-to-rail competition fell, rail rates rose. The ratio of revenue to variable costs increased in 83% of the CRDs, but declined in only 17%.

JTRF Volume 49 No. 3, Fall 2010
127
The percentage of CRDs having average R/VC ratios below 180 increases as the level of rail competition increases. During period 3, only 50% of the CRDs that were served by a rail monopoly had average R/VC ratios below 180. In contrast, during the same period, 93% of the CRDs had average R/VC ratios below 180 when more than four strong railroads were competing.
Many grain- and oilseed-producing regions that are distant from barge-loading facilities changed to rail monopolies after deregulation. Many areas with less rail-to-rail competition are in regions important in the production of grain and oilseeds and are distant from barge-loading facilities.
Since the early 1990s, portions of west central Missouri, western Tennessee, north central Indiana, parts of Ohio, and a portion of Texas have lost the equivalent of 4.25 to 2.58 competing railroads. Parts of Arkansas, Colorado, Illinois, Indiana, Iowa, Kansas, Kentucky, Michigan, Missouri, Nebraska, Ohio, Oklahoma, and Texas have lost the equivalent of 1.41 to 2.58 competing railroads. All were among the top-20 grain and oilseed producing states in 2007.
This study also examined annual statewide tariff rail rates from 1988 through 2007 for a group of six states with limited rail-to-rail competition and varying distances from barge-loading facilities, and a group of four states with more rail-to-rail competition and closer to barge loading facilities. States in the first group include Montana, North Dakota, South Dakota, Nebraska, Kansas, and Colorado. States in the second group include Illinois, Indiana, Iowa, and Missouri.
The levels of intramodal and intermodal competition, as well as length of haul, affect rail rates per ton. In 1988, Montana and North Dakota shippers paid the highest nominal tariff rail rates in the nation to move grain and oilseeds. By 2007, however, Nebraska, South Dakota, North Dakota, and Iowa all paid more to ship grain than Montana. The average length of haul for the states paying more than Montana ranged from 1,150 to 1,710 miles.
Nominal tariff rates per ton-mile show that states lacking rail-to-rail competition do not necessarily pay higher rates than states with more transportation competition; both the level of transportation competition and length of haul are expected to be negatively related to the rate per ton-mile. In addition, data analyzed at the state level can mask relationships that may be more apparent in analyses done at the CRD level. Such possibilities warrant further research and examination.
An analysis of R/VC ratios based on tariff rates, which indicate the profitability of a movement for the railroads, showed that Montana and North Dakota grain shippers had the highest R/VC ratios during 1988 and 2007.
Due to data limitations and time constraints, the authors were unable to do further analyses to examine more fully the relationship between rail-to-rail competition and R/VC ratios. Analyses that are more exhaustive are required, such as the R/VC ratios presented in this study are an average of the R/VC ratios for movements by tariff rates only. It is possible that some contract rail rates, which were not available for this analysis, are less than, are equal to or exceed the tariff rates in particular CRDs.
Endnotes
1. At the time of the Christensen study, the STB used the CAPM standard to evaluate the revenue adequacy of the railroad industry. On January 28, 2009, STB adopted a new measure that is the simple average of the CAPM and a multi-stage discounted cash flow method of estimating revenue adequacy.
2. Simply stated, revenue adequacy is the ability of a firm to attract adequate capital in competitive capital markets. Regulated firms are considered revenue adequate when the return on owners equity exceeds the calculated cost of equity capital.
3. USDA defines “efficient” as being cost-efficient; “effective” is the production of a product or service having the features and quality that consumers want.
Rail Competition Changes
128
4. Not all CRDs are represented in both Period 1 and Period 3. Thus, the numbers do not always tally.
5. We did not adjust for inflation because we are comparing relative rates state to state and not trying to show whether real rates have gone up or down for each state. We are looking at whether there are rate differences between states having more transportation competition and those having less transportation competition at the given points in time.
References
Association of American Railroads (AAR). TheGrainBook, 1981, 1995.
Association of American Railroads (AAR). TheRailTransportationofGrain,2008.
Association of American Railroads (AAR). RailroadFacts. 2008.
Association of American Railroads (AAR). “Economics and Policy Department.” RailroadsandGrain, 2009.
Association of American Railroads (AAR). RailroadTen-YearTrends. Various editions.
Babcock, Michael W., L. Orlo Sorenson, Ming H. Chow, and Keith Klindworth. “Impact of Staggers Rail Act on Agriculture: A Kansas Case Study.” ProceedingsoftheTransportationResearchForum26(1), (1985): 364-372.
Babcock, Michael W., Marvin E. Prater, John Morrill, and Eugene R. Russell. “Short-Line Railroads’ Performance.” TransportationQuarterly 49(2), (1995): 73-86.
Bitzan, John, Kimberly Vachal, Tamara VanWechel, and Dan Vinge. TheDifferentialEffectsofRailRateDeregulation:U.S.Corn,Wheat,andSoybeanMarkets. Upper Great Plains Transportation Institute, June 2003.
Christensen, Laurits R. and Associates, Inc. AStudyofCompetitionintheU.S.FreightRailroadIndustryandAnalysisofProposalsThatMightEnhanceCompetition.Surface Transportation Board(2008): 8-54.
Chow, Ming H. “Interrail Competition in Rail Grain Rates on the Central Plains.” ProceedingsoftheTransportationResearchForum27(1), (1986): 164-171.
Cutler, John, Andrew Goldstein, G. W. Fauth III, Thomas Crowley, and Terry Whiteside. RailroadRatesandServicesProvidedtoMontanaShippers:AReportPreparedfortheStateofMontana.February 2009.
Fuller, Stephen, David Bessler, James MacDonald, and Michael Wohlgenant. “Effects of Deregulation on Export-Grain Rail Rates in the Plains and Corn Belt.” Proceedings of theTransportationResearchForum28(1), (1987): 160-167.
Government Accountability Office (GAO). RailroadRegulation:CurrentIssuesAssociatedWiththeRateReliefProcess. GAO/RCED-99-46, 1999.
Government Accountability Office (GAO). FreightRailroads:IndustryHealthHasImproved,ButConcernsAboutCompetitionandCapacityShouldBeAddressed. GAO-07-94, pg. 14, 2006.
JTRF Volume 49 No. 3, Fall 2010
129
Grimm, Curtis M. Testimony before the U.S. House of Representatives, Committee on Transportation and Infrastructure, Subcommittee on Railroads, March 31, 2004.
Grimm, Curtis M., and Clifford Winston. “Competition in the Deregulated Railroad Industry: Sources, Effects and Policy Issues.” Sam Pelzman and Clifford Winston eds. Deregulation ofNetworkIndustries. Washington, D.C.: Brookings Institution Press (2000).
Harbor, Anetra L. “Competition in the U.S. Railroad Industry: Implications for Corn, Soybeans, and Wheat Shipments.” Presentation by Marvin E. Prater at the 2008 Transportation Research Forum in Fort Worth, Texas, March 17, 2008.
Hovenkamp, Herbert. TheAntitrustEnterprise:PrincipleandExecution.Harvard University Press,Cambridge, MA, (2005): 237-238.
Kahn, Alfred. STB Ex Parte No. 575, ReviewofRailAccessandCompetitionIssues. April 2, 1998: 73.
Koo, Won W., Denver D. Tolliver, and John Bitzan. “Railroad Pricing in Captive Markets: An Empirical Study of North Dakota.” LogisticsandTransportationReview 29(2), (1993): 123-137.
Kwon, Y.W., Michael W. Babcock, and Orlo L. Sorenson. “Railroad Differential Pricing in Unregulated Transportation Markets: A Kansas Case Study.” TheLogistics andTransportationReview 30(3), (1994): 223-244.
Lewis, William W. ThePowerofProductivity,Wealth,Poverty,andtheThreattoGlobalStability. University of Chicago Press,Chicago, IL, (2004): 91.
MacDonald, James M. “Competition and Rail Rates for the Shipment of Corn, Soybeans, and Wheat.” RandJournalofEconomics 18(1), (1987): 151-163.
MacDonald, James M. EffectsofRailroadDeregulationonGrainTransportation.U.S. Department of Agriculture, ERS Technical Bulletin No. 1759, Washington, D.C., 1989a.
MacDonald, James M. “Railroad Deregulation, Innovation, and Competition: Effects of the Staggers Act on Grain Transportation.” JournalofLawandEconomics 32, (1989b): 63-96.
Meyer, John R., Chair of Task Force, et. al. ImprovingRailroadProductivity:FinalReportoftheTaskForceonRailroadProductivity.A Report to the National Commission on Productivity and the Council of Economic Advisors, Washington, D.C.,1973.
National Commission for the Review of Antitrust Laws and Procedures. ReporttothePresidentandtheAttorneyGeneral. Washington, D.C., (1979): 177.
National Grain and Feed Association (NGFA). STB Ex Parte No. 658, The25thAnniversaryoftheStaggersRailActof1980:AReviewandLookAhead. October 19, 2005.
Porter, Michael. TheCompetitiveAdvantageofNations. The Free Press, New York, NY, (1990): 117-120, 225-238, 416, 708.
Public Law 104-88, §10101 (1), (3), (4), (5), (6), and (12).
Surface Transportation Board (STB). Confidential Waybill Sample. (1985-2007).
Surface Transportation Board (STB). STB Ex Parte No. 627: MarketDominanceDeterminations—ProductandGeographicCompetition. Decision 29540, December 10, 1998.

Rail Competition Changes
130
Surface Transportation Board (STB). StudyofRailroadRates:1985-2007. January 2009.
Thompson, S. R., R. J. Hauser, and B. A. Coughlin. “The Competitiveness of Rail Rates for Export-Bound Grain.” TheLogisticsandTransportationReview26(1), (1990): 35-53.
Tolliver, Denver and Alan Dybing. “Impacts of Transportation Infrastructure on the Economy of North Dakota.” A report to the North Dakota Legislative Council by the Upper Great Plains Transportation Institute. 2007. p. 37.
Tye, William B. The Transition to Deregulation: Developing Economic Standards for PublicPolicies. Quorum Books, Westport, CT, (1991): 151.
U.S. Department of Agriculture (USDA). STB Ex Parte No. 627, Market DominanceDeterminations—ProductandGeographicCompetition. Http://www.ams.usda.gov/AMSv1.0/getfile?dDocName=STELDEV3020178&acct=atpub, May 29, 1998.
U.S. Department of Agriculture (USDA). STB Ex Parte No. 582, PublicViews onMajorRailConsolidations. Http://www.ams.usda.gov/AMSv1.0/getfile?dDocName=STELDEV3020172&acct=atpub, February 29, 2000.
U.S. Department of Agriculture (USDA). STB Ex Parte No. 646, RailRateChallengesinSmallCases. Http://www.ams.usda.gov/AMSv1.0/getfile?dDocName=STELDEV3020187&acct=atpub, July 21, 2004.
U.S. Department of Agriculture (USDA). STB Ex Parte No. 658, The 25thAnniversary of theStaggersRailActof1980:AReviewandLookAhead. October 19, 2005.
U.S. Department of Agriculture (USDA), National Agricultural Statistical Service (NASS). CropProduction. 2005-2008.
U.S. Department of Agriculture (USDA). TransportationofU.S.Grains:AModalShareAnalysis. September 2006.
U.S. Department of Agriculture (USDA). Updated data for Transportation ofU.S.Grains: AModalShareAnalysis. To be released in 2010.
U.S. Department of Agriculture and the U.S. Department of Transportation (USDA/DOT). StudyofRuralTransportationIssues. Http://www.ams.usda.gov/AMSv1.0/RuralTransportationStudy, April 2010.
U.S. Department of Justice and the Federal Trade Commission. HorizontalMergerGuidelines. Washington, D.C.: (1997) §1.51.
Wilson, Wesley W. and William W. Wilson. “Deregulation, Rate Incentives, and Efficiency in the Railroad Market.” B. Starr McMullen ed. TransportationAfterDeregulation. New York: Elsevier (2001): 1-24.
JTRF Volume 49 No. 3, Fall 2010
131
Marvin Prater is a transportation economist specializing in railroad transportation and ruralinfrastructure issues and is employed by the Transportation Services Division, AgriculturalMarketingService,U.S.DepartmentofAgriculture.MarvinearnedaB.S.degreeinhorticulture,amaster’s inbusinessadministration, andaPh.D. in economics fromKansasStateUniversity.MarvinhasbeenamemberoftheTransportationResearchForumsince1997,presentedpapersattheannualforum,andauthoredpapersfortheJournal of the Transportation Research ForumandtheU.S.DepartmentofAgriculture.
Ken Casavant is a professor in the School of Economic Sciences and a nationally renownedtransportationeconomist,afterspending35yearsatWashingtonStateUniversity.Hehasreceivednumerous teaching, research and service awards throughout his tenure at Washington StateUniversity,includingrecipientofthe“LifetimeAchievementAward”fromtheUpperGreatPlainsTransportationInstitute2006,the“WashingtonStateUniversitySahlinFacultyExcellenceAward”2004,andbeingnamed“DistinguishedScholar”bytheWesternAgriculturalEconomicsAssociationin2003.KenalsoservesasthefacultyathleticrepresentativetothePresidentforWashingtonStateUniversity.
Eric Jessup is an associate professor in the School of Economic Sciences atWashington StateUniversity.Hisresearchfocusandareaofspecialtyistransportationeconomicsandfreightsystemsmodeling. Heisalsoco-principalinvestigatorforthemulti-year,statewidefreightresearchandimplementationprojectforthestateofWashington,theStrategicFreightTransportationAnalysis(SFTA)study.
Bruce BlantoncurrentlyservesasDirectoroftheTransportationServicesDivisionwiththeU.S.Department of Agriculture’s Agricultural Marketing Service. Over the years he has served invariouspositionsinbothgovernmentandindustry.PastpositionshehasheldatUSDAinclude:deputyassistantsecretaryforCongressionalRelations,specialassistanttotheFarmServiceAgencyadministrator, special assistant to the under secretary for InternationalAffairs andCommodityPrograms,andconfidentialassistanttothedeputysecretary.BlantonalsoworkedasasenioranalystforagriculturefortheUnitedStatesSenateCommitteeontheBudget.IntheprivatesectorBlantonservedas: executivedirectorof theNationalRenderersAssociation, vicepresidentof renderingsalesforMoyerPackingCompany,andasaneconomicresearchassociatefortheAmericanFarmBureauFederation.AnativeoftheSouthwest,Blantonholdsabachelor’sdegreeinagriculturalbusinessmanagement fromNewMexico StateUniversity and amaster’s degree in agriculturaleconomicsfromtheUniversityofMissouri-Columbia.
Pierre Bahizi isaneconomistwith theTransportationServicesDivisionat theU.S.DepartmentofAgriculture.PriortoworkingforUSDA,PierrewasaneconomistintheDivisionofConsumerExpenditure Surveys at the Bureau of Labor Statistics. He has also worked in the Travel andToursDepartmentattheSmithsonianInstitution.PierregraduatedfromtheUniversityofTexasatArlingtonwithaB.A.ineconomics.
Daniel Nibarger isaneconomistwith theU.S.DepartmentofAgriculture,ForeignAgriculturalService. Daniel is fromGardner, Kansas, and attended Kansas State University inManhattan,Kansas.AtKansasState,DanielearnedaB.S.degreeineconomicswithaninternationaleconomicsoverlay,andanM.S.ineconomicswithanemphasisininternationaltrade.Duringhisgraduatecoursework,DanielspentasummerinWuhan,HubeiProvince,China,teachingEnglishlanguagecoursesatHuazhongUniversity.AftercompletinghisM.S.,DanielearnedaLegislativeFellowshipwith theStateofKansasLegislature. Hehasalsoservedasa laboreconomistwith theKansasDepartment of Labor, researching ways to project employment and unemployment. Daniel hasalsoservedasaneconomist for theTransportationServicesDivisionof theU.S.Departmentof
Rail Competition Changes
132
Agriculture. Daniel has presented his research at the 2006 Western Economics Association-Internationalannualmeeting,the2010TransportationResearchForum,andthe2009CaribbeanConferenceforAgriculturalTrade.
Isaac Weingram isaresearchassistantattheFederalReserveBankofBoston.Previously,IsaacworkedasanagriculturaleconomistassistantintheTransportationServicesDivisionoftheU.S.DepartmentofAgriculture.HegraduatedfromWashingtonUniversityinSaintLouiswithanA.B.inmathematicsandeconomics.