rail commissioner service standard report · rail commissioner service standard report...
TRANSCRIPT

Rail Commissioner
Service Standard Report July-September 2012
Page 2
Sample and Methodology 3
Main Findings 4-5
TRAIN
On-Time Running 7
Interior Cleanliness 8-9
Exterior Cleanliness 10
Wheelchair Ramp Deployment 11
Station Announcements 12
Passenger Service Assistants 13-14
Ticket Vending Machines 15
Validators 16
Fare Evasion 16
TRAM
On-Time Running 18
Interior Cleanliness 19
Exterior Cleanliness 20
Ticket Inspections 21
Conductor Behaviour 22-23
Fare Evasion 23
Contents

Page 3
Table 1.1 – Trips Sampled
* The number of trips supplied is defined as the number of train and tram trips available in both directions for five weekdays, plus
a Saturday and Sunday.
Sample and Methodology
The sample size was derived from the number of trips supplied in any given week, with separate sample sizes defined for each
contract area, given the sample size the number of trips deemed appropriate to give a valid sample is stratified across the day
types based upon their respective proportion in a given week.
Between the 1st July and 30th September 2012:
• 400 audits onboard Rail Commissioner services.
• 170 audits on-board Train services.
• 230 audits on-board Tram services.
The trips audited represent 10.2% of the 3,940 trips supplied (defined as the number of trips available for five weekdays, plus a
Saturday and Sunday) for one whole week Sunday to Saturday. The sample base is selected from trips listed on PTS approved
timetables submitted by the Rail Commissioner.
Contract Area
Weekday Trips
Audited Saturday Trips Audited
Sunday Trips
Audited Trips Audited
Trips
Supplied
RailCommissioner Train 114 30 26 170 3,065
Rail Commissioner Tram 162 35 33 230 875
TOTAL 276 65 59 400 3,940

Page 4
In relation to On-Time Running:
A train is considered to be on-time if it departs a time-point along a route no more than 1 minute early and no more than 5.59
minutes late.
• 91.2% of services ran on time.
• No services were recorded as Did Not Run.
• Early departing was recorded at 0.0%.
• Late departing totalled 8.8%.
In relation to Cleanliness:
• 99.7% of services had acceptable ratings for interior cleanliness.
• 99.4% of services had acceptable ratings for exterior cleanliness.
In relation to Driver Station Announcements:
• Station announcements were made by the driver for all stations in 99.1% of situations.
In relation to PSAs’ Customer Service:
• PSAs used Portable Reading Devices (PRDs) when checking tickets in 97.6% of cases.
• PSAs were rated as having been polite when asking to check passengers tickets in 100.0% of cases.
• A ticket offence report was issued in 14.3% of cases.
In relation to Fare Evasion:
• Overall Fare Evasion was 21.41%.
Main Findings - Train

Page 5
In relation to On-Time Running:
A tram is considered to be on-time if it departs a time-point along a route no more than 1 minute early and no more than 5.59
minutes late.
• 87.4% of services ran on time.
• No services were recorded as Did Not Run.
• Early departing was recorded at 6.9%.
• Late departing totalled 5.7%.
In relation to Cleanliness:
• 100.0% of services had acceptable ratings for interior cleanliness.
• 99.6% of services had acceptable ratings for exterior cleanliness.
In relation to Conductors Customer Service:
• Tram conductors achieved acceptable ratings in relation to their acknowledgment of passengers in 99.4% of cases.
In relation to Fare Evasion:
• Overall Fare Evasion on trams was 8.74%.
Main Findings - Tram

Train
Service Standard Report July—September 2012

Page 7
In July - September 2012:
• 91.2% of services departed on time.
• Early running occurred on 0.0% of services.
• Late running was 8.8%
• Services reported as Did Not Run was 0.0%.
Figure 1.2 – On Time Running Trend
April - June 2012
Table 1.2 – On Time Running
July - September 2012
Figure 1.1 – On Time Running
On-Time Running
0
10
20
30
40
50
60
70
80
90
100
Oct-Dec-10 Jan -Mar-11 Apr -Jun -11 Jul -Sep-11 Oct-Dec-11 Jan -Mar-12 Apr -Jun -12 Jul -Sep-12
On-Time Late Departing Early Departing
Train On Time Running
Percentage
Train On Time Running
0.0%
91.2%
8.8%0.0%
0.0%
92.9%
7.1%0.0%
EarlyOn TimeLate
Did Not Run
Apr-Jun-12 Apr-Jun-12 Jul-Sep-12 Jul-Sep-12
Departures
10+ minutes early 0 0.0% 0 0.0%
3 to 9 minutes early 0 0.0% 0 0.0%
1 to 2 minutes early 0 0.0% 0 0.0%
On Time* 158 92.9% 155 91.2%
6 to 9 minutes late 10 5.9% 9 5.3%
10+ minutes late 2 1.2% 6 3.5%
Did Not Run 0 0.0% 0 0.0%
TOTAL 170 100.0% 170 100.0%
Arrivals
10+ minutes late 1 0.6% 5 2.9%
Number of Carriages Audited

Page 8
Train Vehicle Interior Cleanliness
0.0%
94.6%
5.1%0.3%
1.2%
94.2%
4.7%0.0%
Excellent
Good
Fair
Poor
Figure 1.3 – Train Interior Cleanliness
Figure 1.4 – Interior Cleanliness
April - June 2012 July - September 2012
Interior Cleanliness
0
10
20
30
40
50
60
70
80
90
100
Oct-Dec-10 Jan-Mar-11 Apr -Jun -11 Jul -Sep-11 Oct-Dec-11 Jan-Mar-12 Apr -Jun -12 Jul -Sep-12
Wear and tear-none Scratched windows-none Other vandalism-none
Train Vehicle Interior
Percentage

Page 9
Table 1.3
Interior Cleanliness
In July - September 2012:
• The vehicles interior was acceptable in 99.7% of trips surveyed.
• There was evidence of wear and tear on 0.3% of services.
• There were scratched windows on 98.6% of services.
• There was no evidence of graffiti on 68.3% of services.
• There was no evidence of other vandalism on 98.9% of services.
Apr-Jun-12 Apr-Jun-12 Jul-Sep-12 Jul-Sep-12
Vehicle interior clean
Excellent 4 1.2% 0 0.0%
Good 324 94.2% 331 94.6%
Fair 16 4.7% 18 5.1%
Poor 0 0.0% 1 0.3%
TOTAL 344 100.0% 350 100.0%
Evidence of wear and tear
None 344 100.0% 349 99.7%
Slight 0 0.0% 1 0.3%
Medium 0 0.0% 0 0.0%
Severe 0 0.0% 0 0.0%
TOTAL 344 100.0% 350 100.0%
Scratched windows
None 9 2.6% 5 1.4%
Slight 284 82.6% 335 95.7%
Medium 51 14.8% 10 2.9%
Severe 0 0.0% 0 0.0%
TOTAL 344 100.0% 350 100.0%
Evidence of graffiti
None 249 72.4% 239 68.3%
Slight 91 26.5% 103 29.4%
Medium 4 1.2% 8 2.3%
Severe 0 0.0% 0 0.0%
TOTAL 344 100.0% 350 100.0%
Evidence of other vandalism
None 342 99.4% 346 98.9%
Slight 2 0.6% 4 1.1%
Medium 0 0.0% 0 0.0%
Severe 0 0.0% 0 0.0%
TOTAL 344 100.0% 350 100.0%
Number of Carriages Audited

Page 10
April - June 2012 July - September 2012
In July - September 2012:
• Acceptable ratings for exterior cleanliness were 99.4%.
• Exterior graffiti was not evident on any services audited.
Table 1.5 – Exterior Cleanliness
Figure 1.5 - Exterior Cleanliness
Figure 1.6 - Exterior Cleanliness Trend
Exterior Cleanliness Train Vehicle Exterior Cleanliness
0.0%
97.7%
1.7%0.6%
0.0%
99.7%
0.3%0.0%
Excellent
Good
Fair
Poor
Apr-Jun-12 Apr-Jun-12 Jul-Sep-12 Jul-Sep-12
Vehicle exterior cleanliness
Excellent 0 0.0% 0 0.0%
Good 343 99.7% 342 97.7%
Fair 1 0.3% 6 1.7%
Poor 0 0.0% 2 0.6%
TOTAL 344 100.0% 350 100.0%
Evidence of exterior graffiti
None 344 100.0% 350 100.0%
Slight 0 0.0% 0 0.0%
Medium 0 0.0% 0 0.0%
Severe 0 0.0% 0 0.0%
TOTAL 344 100.0% 350 100.0%
Number of Carriages Audited
75
80
85
90
95
100
Oct-Dec-10 Jan-Mar-11 Apr-Jun-11 Jul-Sep-11 Oct-Dec-11 J an-Mar-12 Apr-Jun-12 Jul-Sep-12
Exterior Cleanliness (Exc/Good) Interior Cleanliness (Exc/Good)
Train Vehicle Cleanliness

Page 11
• The wheelchair ramp was deployed for a passenger in 100.0% of cases.
• The ramp was deployed in 96.6% of these occasions by the Driver.
Table 1.5 - Wheelchair Ramp Deployment
Wheelchair Ramp Deployment
Apr-Jun-12 Apr-Jun-12 Jul-Sep-12 Jul-Sep-12
Yes 30 96.8% 29 100.0%
No 1 3.2% 0 0.0%
TOTAL 31 100.0% 29 100.0%
Driver 26 83.9% 28 96.6%
PSA 5 16.1% 1 3.4%
Passenger 0 0.0% 0 0.0%
TOTAL 31 100.0% 29 100.0%
Who deployed the wheelchair ramp?
Wheelchair ramp deployed for disabled/ wheelchair bound passengers?
Number of Carriages Audited

Page 12
Table 1.6 – Station Announcements
In July - September 2012;
• 99.1% of drivers announced all stations and were clearly audible.
• The driver did not announce any stations in 0.0% of cases.
• In 0.9% of cases the driver announced some stations but not all and in 0.0% of cases the announcements were not clear.
• In situations where the driver could have announced a reason for delay, the driver did so in 76.9% of cases.
Figure 1.17 – Station Announcements
July - September 2012 April - June 2012
Station Announcements
Train Station Announcements
99.1%
1.5%
0.9%0.0%
99.4%
0.0%
0.6%0.0%
Yes
No
Announced some but not allAnnouncements weren't clear
Apr-Jun-12 Apr-Jun-12 Jul-Sep-12 Jul-Sep-12
Yes 342 99.4% 347 99.1%
No 0 0.0% 0 0.0%
Announced some but not all 2 0.6% 3 0.9%
Announcements weren't clear 0 0.0% 0 0.0%
TOTAL 344 100.0% 350 100.0%
Yes 8 80.0% 10 76.9%
No 2 20.0% 3 23.1%
TOTAL 10 100.0% 13 100.0%
Did driver announce reasons for delays?
Number of Carriages Audited
Did driver announce all stations?

Page 13
Table 1.7 – PSA Personal Behavior
During July - September 2012;
• There were no instances of a Passenger Service Assistant observed to be Drinking or Smoking whilst onboard the railcar.
• There was no instances of a Passenger Service Assistant observed to be Eating.
• There was no instances of Reading the Newspaper whilst onboard the railcar.
• Acceptable ratings for the PSAs’ Response to Ticketing Enquiries was 100.0% in July - September 2012.
• In the Response to Destination/Route Enquiries category, 100.0% of relevant situations scored acceptable ratings.
Table 1.8 – PSAs’ Customer Service
Passenger Service Assistants
Apr-Jun-12 Apr-Jun-12 Jul-Sep-12 Jul-Sep-12
Eating
Yes 0 0.0% 0 0.0%
No 56 100.0% 66 100.0%
TOTAL 56 100.0% 66 100.0%
Drinking
Yes 0 0.0% 0 0.0%
No 56 100.0% 66 100.0%
TOTAL 56 100.0% 66 100.0%
Smoking
Yes 0 0.0% 0 0.0%
No 56 100.0% 66 100.0%
TOTAL 56 100.0% 66 100.0%
Reading Newspaper
Yes 0 0.0% 0 0.0%
No 56 100.0% 66 100.0%
TOTAL 56 100.0% 66 100.0%
Number of Carriages Audited
Apr-Jun-12 Apr-Jun-12 Jul-Sep-12 Jul-Sep-12
Excellent 2 7.7% 2 5.3%
Good 24 92.3% 30 78.9%
Fair 0 0.0% 6 15.8%
Poor 0 0.0% 0 0.0%
TOTAL 26 100.0% 38 100.0%
Excellent 2 20.0% 1 12.5%
Good 7 70.0% 3 37.5%
Fair 1 10.0% 4 50.0%
Poor 0 0.0% 0 0.0%
TOTAL 10 100.0% 8 100.0%
Response to ticketing enquiries
Response to destination/route enquiries
Number of Carriages Audited

Page 14
In July - September 2012:
• 97.6% of applicable cases the PSA used a PRD (Portable Reading Device) to check passenger tickets.
• Of the 41 cases in which the PSA conducted a ticket check, a ticket offence report was issued 14.3% of the time.
• The PSA was rated as being polite when asking to view passengers tickets in all cases.
Table 1.9 – PSA’s Customer Service
Figure 1.8 - PSA Behaviour
Passenger Service Assistants
Apr-Jun-12 Apr-Jun-12 Jul-Sep-12 Jul-Sep-12
Yes 26 100.0% 41 97.6%
No 0 0.0% 1 2.4%
TOTAL 26 100.0% 42 100.0%
Yes 3 11.5% 6 14.3%
No 23 88.5% 36 85.7%
TOTAL 26 100.0% 42 100.0%
One 2 4
Two 1 0
Three 0 0
Four + 0 2
TOTAL 3 N/A 6 N/A
Yes 26 100.0% 42 100.0%
No 0 0.0% 0 0.0%
TOTAL 26 100.0% 42 100.0%
Did the PSA use a PRD to check passenger's tickets?
Was a ticket offence report issued?
If yes, how many?
Was the PSA polite when asking to see passenger's tickets?
Number of Carriages Audited
0
0.5
1
1.5
2
2.5
3
3.5
4
4.5
5
Oct-Dec-10 Jan-Mar-11 Apr-Jun-11 Jul-Sep-11 Oct-Dec-11 J an-Mar-12 Apr-Jun-12 Jul-Sep-12
Eating Drinking Smoking Reading Newspaper
Train PSA Behaviour
Percentage

Page 15
Table 1.10 – TVM Operating
Ticket Vending Machines were present on all audited railcars in July - September 2012.
• In 65.1% of railcars, the Ticket Vending Machine, when used, was functioning correctly.
• In 6.0% of cases the Ticket Vending Machine was not functioning due to equipment failure.
• There were zero reported cases of the Ticket Vending Machine not functioning because of vandalism.
Figure 1.9 – Ticket Vending Machine within Railcar
July - September 2012 April - June 2012
Ticket Vending Machines Train Ticket Vending Machines
100.0%
0.0%
100.0%
0.0%
Yes No
Apr-Jun-12 Apr-Jun-12 Jul-Sep-12 Jul-Sep-12
Yes 344 100.0% 350 100.0%
No 0 0.0% 0 0.0%
TOTAL 344 100.0% 350 100.0%
If yes was it operating?
Operating 210 61.0% 228 65.1%
Not operating (broken) 21 6.1% 21 6.0%
Not operating (vandalised) 1 0.3% 0 0.0%
Not used 112 32.6% 101 28.9%
TOTAL 344 100.0% 350 100.0%
Number of Carriages Audited
Was there a ticket vending machine in the railcar?

Page 16
Figure 1.10 – Stamp on Test Tickets
Test tickets are inserted in each validator in each railcar at the commencement of each trip audited. This is to verify that the
validators are functioning correctly and this also verifies that the correct trip information has been entered into the Crouzet system
by the driver.
In July - September 2012 test tickets with correct trip details stamped on the ticket amounted to 93.1% of instances.
April - June 2012 July - September 2012
Validators Stamp on Test Ticket
93.1%
5.7%
1.1%
87.8%
11.3%
0.9%Yes
No
Trip Identifier
Fare Evasion
Fare Evasion Rail
Jul-Sep-09 12.09%
Oct-Dec-09 11.16%
Jan-Mar-10 10.39%
Apr-Jun-10 9.26%
Jul-Sep-10 10.80%
Oct-Dec-10 9.50%
Jan-Mar-11 11.42%
Apr-Jun-11 10.96%
Jul-Sep-11 17.07%
Oct-Dec-11 15.74%
Jan-Mar-12 15.54%
Apr-Jun-12 18.76%
Jul-Sep-12 21.41%
Table 1.11– Train System Fare Evasion

Tram
Service Standard Report July—September 2012
Page 18
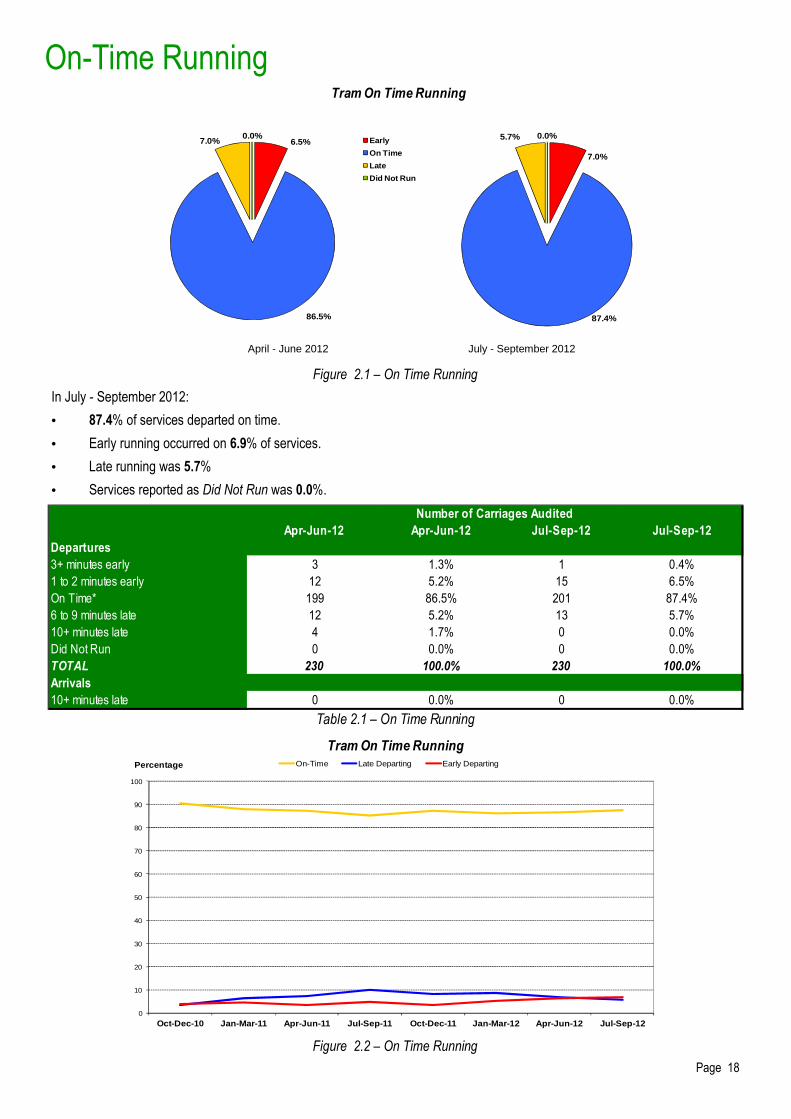
Figure 2.2 – On Time Running
In July - September 2012:
• 87.4% of services departed on time.
• Early running occurred on 6.9% of services.
• Late running was 5.7%
• Services reported as Did Not Run was 0.0%.
Figure 2.1 – On Time Running
July - September 2012 April - June 2012
On-Time Running
Table 2.1 – On Time Running
Tram On Time Running
7.0%
87.4%
5.7% 0.0%6.5%
86.5%
7.0%0.0% Early
On Time
Late
Did Not Run
Apr-Jun-12 Apr-Jun-12 Jul-Sep-12 Jul-Sep-12
Departures
3+ minutes early 3 1.3% 1 0.4%
1 to 2 minutes early 12 5.2% 15 6.5%
On Time* 199 86.5% 201 87.4%
6 to 9 minutes late 12 5.2% 13 5.7%
10+ minutes late 4 1.7% 0 0.0%
Did Not Run 0 0.0% 0 0.0%
TOTAL 230 100.0% 230 100.0%
Arrivals
10+ minutes late 0 0.0% 0 0.0%
Number of Carriages Audited
0
10
20
30
40
50
60
70
80
90
100
Oct-Dec-10 Jan-Mar-11 Apr-Jun-11 Jul-Sep-11 Oct-Dec-11 J an-Mar-12 Apr-Jun-12 Jul-Sep-12
On-Time Late Departing Early Departing
Tram On Time Running
Percentage

Page 19
In July - September 2012:
• The vehicles interior was acceptable in 100.0% of trips surveyed.
• There was evidence of wear and tear on 0.0% of services.
• There were scratched windows on 67.0% of services.
• There was no evidence of graffiti on 100.0% of services.
• There was no evidence of other vandalism on 98.3% of services.
Table 2.2 - Interior Cleanliness
Figure 2.3 – Interior Cleanliness
July - September 2012 April - June 2012
Interior Cleanliness Tram Vehicle Interior Cleanliness
4.3%
88.3%
7.4%
0.0%3.9%
90.0%
6.1%
0.0%Excellent
Good
Fair
Poor
Apr-Jun-12 Apr-Jun-12 Jul-Sep-12 Jul-Sep-12
Vehicle interior clean
Excellent 9 3.9% 10 4.3%
Good 207 90.0% 203 88.3%
Fair 14 6.1% 17 7.4%
Poor 0 0.0% 0 0.0%
TOTAL 230 100.0% 230 100.0%
Evidence of wear and tear
None 229 99.6% 230 100.0%
Slight 1 0.4% 0 0.0%
Medium 0 0.0% 0 0.0%
Severe 0 0.0% 0 0.0%
TOTAL 230 100.0% 230 100.0%
Scratched windows
None 97 42.2% 76 33.0%
Slight 133 57.8% 154 67.0%
Medium 0 0.0% 0 0.0%
Severe 0 0.0% 0 0.0%
TOTAL 230 100.0% 230 100.0%
Evidence of graffiti
None 226 98.3% 230 100.0%
Slight 4 1.7% 0 0.0%
Medium 0 0.0% 0 0.0%
Severe 0 0.0% 0 0.0%
TOTAL 230 100.0% 230 100.0%
Evidence of other vandalism
None 225 97.8% 226 98.3%
Slight 5 2.2% 4 1.7%
Medium 0 0.0% 0 0.0%
Severe 0 0.0% 0 0.0%
TOTAL 230 100.0% 230 100.0%
Number of Carriages Audited

Page 20
Figure 2.4– Exterior Cleanliness
In July - September 2012:
• Acceptable ratings for exterior cleanliness were 99.6%.
• Exterior graffiti was evident on 1.3% services audited.
Table 2.3 – Exterior Cleanliness
April - June 2012 July - September 2012
Exterior Cleanliness
Figure 2.5 – Exterior and Interior Cleanliness Trend
Tram Vehicle Exterior Cleanliness
3.5%
91.7%
4.3%0.4%
2.6%
94.3%
3.0%0.0% Excellent
Good
Fair
Poor
Apr-Jun-12 Apr-Jun-12 Jul-Sep-12 Jul-Sep-12
Vehicle exterior cleanliness
Excellent 6 2.6% 8 3.5%
Good 217 94.3% 211 91.7%
Fair 7 3.0% 10 4.3%
Poor 0 0.0% 1 0.4%
TOTAL 230 100.0% 230 100.0%
Evidence of exterior graffiti
None 230 100.0% 227 98.7%
Slight 0 0.0% 3 1.3%
Medium 0 0.0% 0 0.0%
Severe 0 0.0% 0 0.0%
TOTAL 230 100.0% 230 100.0%
Number of Carriages Audited
70
75
80
85
90
95
100
Oct-Dec-10 Jan-Mar-11 Apr -Jun -11 Jul -Sep-11 Oct-Dec-11 Jan-Mar-12 Apr -Jun -12 Jul -Sep-12
Exterior Cleanliness (Exc/Good) Interior Cleanliness (Exc/Good)
Tram Vehicle Cleanliness
Percentage

Page 21
Table 2.4– Ticket Inspections
Figure 2.6– Ticket Inspection
July - September 2012 April - June 2012
Figure 2.7– Tram Conductor Behavior
Ticket Inspections
• There were 24 cases (10.4%) in which a Ticket Inspection was carried out by an inspector in July - September 2012.
• There were 13 instances of a PRD being used to check tickets.
Tram Ticket Inspections
10.4%
89.6%
9.1%
90.9%
Yes
No
Apr-Jun-12 Apr-Jun-12 Jul-Sep-12 Jul-Sep-12
Was a ticket inspection carried out?
Yes 21 9.1% 24 10.4%
No 209 90.9% 206 89.6%
TOTAL 230 100.0% 230 100.0%
Did the Inspector use a PRD to check tickets?*
Yes 2 9.5% 13 54.2%
No 19 90.5% 11 45.8%
TOTAL 21 100.0% 24 100.0%
*Percentage base excludes not applicable cases
Number of Carriages Audited
65
70
75
80
85
90
95
100
Oct-Dec-10 Jan -Mar-11 Apr -Jun -11 Jul -Sep-11 Oct-Dec-11 Jan -Mar-12 Apr -Jun -12 Jul -Sep-12
Acknowledging Passengers exc/good Interaction with Passengers exc/good
Response to Ticketing Inquiries exc/good Response to Destination/Route Inquiries exc/good
Tram Conductor
Percentage

Page 22
• Acceptable ratings of the Conductor’s Acknowledging Passengers category was 99.4% in July—September 2012.
• In the Conductor’s Interaction with Passengers category 100.0% were rated as acceptable.
Figure 2.8 – Conductor Behavior
Table 2.5 – Conductor Courtesy
Conductor Behaviour
Apr-Jun-12 Apr-Jun-12 Jul-Sep-12 Jul-Sep-12
Acknowledging passengers*
Excellent 16 8.4% 23 14.3%
Good 156 82.1% 119 73.9%
Fair 16 8.4% 18 11.2%
Poor 2 1.1% 1 0.6%
TOTAL 190 100.0% 161 100.0%
Interaction with passengers*
Excellent 14 8.0% 22 13.9%
Good 138 78.9% 121 76.6%
Fair 22 12.6% 15 9.5%
Poor 1 0.6% 0 0.0%
TOTAL 175 100.0% 158 100.0%
Response to ticketing enquiries*
Excellent 10 6.4% 14 11.5%
Good 136 86.6% 101 82.8%
Fair 11 7.0% 7 5.7%
Poor 0 0.0% 0 0.0%
TOTAL 157 100.0% 122 100.0%
Response to destination/route enquiries*
Excellent 5 9.8% 9 21.4%
Good 43 84.3% 31 73.8%
Fair 3 5.9% 2 4.8%
Poor 0 0.0% 0 0.0%
TOTAL 51 100.0% 42 100.0%
Number of Carriages Audited
0
1
2
3
4
5
6
7
8
9
10
Oct-Dec-10 Jan-Mar-11 Apr-Jun-11 Jul-Sep-11 Oct-Dec-11 J an-Mar-12 Apr-Jun-12 Jul-Sep-12
Eating Drinking Smoking Reading Newspaper
Tram Conductor Behaviour
Percentage

Page 23
Table 2.6 – Conductor Behaviour
In July - September 2012:
• There was no instance of the conductor drinking while in the railcar.
• There were no instances of a conductor eating.
• There were no instances of smoking while in the railcar.
• There were no instances of the conductor reading a newspaper.
Conductor Behaviour
Apr-Jun-12 Apr-Jun-12 Jul-Sep-12 Jul-Sep-12
Eating
Yes 0 0.0% 0 0.0%
No 56 100.0% 66 100.0%
TOTAL 56 100.0% 66 100.0%
Drinking
Yes 0 0.0% 0 0.0%
No 56 100.0% 66 100.0%
TOTAL 56 100.0% 66 100.0%
Smoking
Yes 0 0.0% 0 0.0%
No 56 100.0% 66 100.0%
TOTAL 56 100.0% 66 100.0%
Reading Newspaper
Yes 0 0.0% 0 0.0%
No 56 100.0% 66 100.0%
TOTAL 56 100.0% 66 100.0%
Number of Carriages Audited
Table 2.7 – Tram Fare Evasion
Fare Evasion Fare Evasion Tram
Jul-Sep-09 3.01%
Oct-Dec-09 2.55%
Jan-Mar-10 5.09%
Apr-Jun-10 5.87%
Jul-Sep-10 3.74%
Oct-Dec-10 3.03%
Jan-Mar-11 2.38%
Apr-Jun-11 3.41%
Jul-Sep-11 6.21%
Oct-Dec-11 7.16%
Jan-Mar-12 8.21%
Apr-Jun-12 8.00%
Jul-Sep-12 8.74%