ragni hege kitterød and marit rønsen - ssb · ragni hege kitterød and marit rønsen...
TRANSCRIPT
Discussion Papers No. 607, January 2010 Statistics Norway, Research Department
Ragni Hege Kitterød and Marit Rønsen
Untraditional couples in a neo-traditional setting Which women perform as much paid work as their partner?
Abstract: An equal division of paid and unpaid work is a central political ambition in Norway. Yet, couples’ division of paid work has been less studied than their division of unpaid work. This paper shows that women seldom work more than their partner, but equal sharing is now increasing. Still, about half of all women spend less time than their partner on paid labour. When the woman works most, the partner often has health problems, is unemployed or retired. Women with an untraditional arrangement are often well-educated, have no young children, are self-employed, leaders, or have a partner in the public sector. Nurses often work less than their partners, as do women who have young children, health restrictions or a partner who works in the private sector, is self-employed or a leader.
Keywords: Dual-earner couples, female labour supply, gender equality.
JEL classification: J22, J24, J45
Acknowledgement: The analysis is funded by the Norwegian Research Council and constitutes a part of a research project called “Mobilizing unutilised labour reserves: the role of part-time work and extended employment interruptions”.
Address: Ragni Hege Kitterød, Statistics Norway, Research Department. E-mail: [email protected]
Marit Rønsen, Statistics Norway, Research Department. E-mail: [email protected]
Discussion Papers comprise research papers intended for international journals or books. A preprint of a Discussion Paper may be longer and more elaborate than a standard journal article, as it may include intermediate calculations and background material etc.
Abstracts with downloadable Discussion Papers in PDF are available on the Internet: http://www.ssb.no http://ideas.repec.org/s/ssb/dispap.html For printed Discussion Papers contact: Statistics Norway Sales- and subscription service NO-2225 Kongsvinger Telephone: +47 62 88 55 00 Telefax: +47 62 88 55 95 E-mail: [email protected]
3
Introduction Norwegian work-family policies aim at promoting an equal division of paid and unpaid work between
women and men. An important goal is to facilitate and enhance women’s labour market participation
as well as to increase men’s involvement at home. However, while a large number of studies have
examined the division of housework and childcare in Norwegian couples (e.g. Kitterød 2002,
Kjeldstad and Lappegård 2009), less attention has been directed at the division of paid labour.
Certainly, there are numerous studies of the factors affecting women’s labour supply, but the partners’
relative time inputs in the labour market have rarely been explored. Given the great demand for female
labour in Norway, and the political stress on the so-called dual-earner model, this is remarkable. In
this paper, we examine the division of paid labour among couples in Norway, with a particular focus
on what characterises the rather small group of couples in which the female part works more hours
than her male partner, as well as the somewhat larger group of couples in which both partners work
approximately the same number of hours. We explore the possible effects of characteristics of each
partner as well as of the couple.
There has been a significant rise in women’s labour market participation in Norway in recent decades,
and in the younger generations women now take more education than men. Extended parental leave
rights combined with improved supply of affordable and high quality childcare have facilitated
women’s employment, and although women still spend more time on housework and childcare than
men, there has been a certain increase in men’s family work (Vaage 2002). Moreover, the cultural
climate in Norway is now more supportive of women’s full-time work than only a decade ago.
Women’s employment rate is at present only marginally lower than men’s (84 and 90 percent
respectively for people 25-54 years of age, according to Statistic Norway’s Labour Force Survey), and
increasing proportions of women work full time. Nevertheless, part-time work is still common for
women, particularly when there are children in the household. There has been a decline in women’s
short part-time work (less than 20 hours per week) in recent decades, but even now nearly half of all
partnered mothers work less than full hours, and by far the most of this is voluntary part-time
(Kjeldstad and Nymoen 2009, Rønsen and Kitterød 2009). Moreover, women seldom work long
hours. On the other hand, men rarely work part time and often have long hours.
Hence, despite the ideal of dual earning and equal sharing, there may still be gendered norms
regarding breadwinning in Norway. Alongside the political ambition of dual earning, there is a strong
focus on parental choice concerning the combination of paid labour and family work, exemplified by
4
the implementation of the cash for childcare reform in the late 1990s. Although the discourse on
parental choice has been presented in gender neutral terms, the policies seem to have gendered effects
in that women more often than men curtail their paid working hours when children arrive (Skrede
2004, Ellingsæter and Leira 2006). Men are still expected to be good breadwinners, whereas women
face norms of comprehensive caring and often experience more freedom of choice in deciding their
working hours. The Norwegian Work Environment Act lays down parents’ right to reduced working
hours, unless this is of serious inconvenience to the employer. In addition, the Norwegian labour
market is strongly gender segregated. Men often work in professions in which long hours are common
and reduced hours discouraged, whereas women are concentrated in professions with less long hours
and more part time (Abrahamsen 2000).
A considerable proportion of couples have a so-called “neo-traditional” practice where priority is
given to men’s work efforts, and women take the role of co-providers. Previous descriptive analyses of
couples’ working hours indicate that equal sharing of paid work has become fairly common in
Norway, but women rarely work longer hours than their partner. The exact proportions are of course
sensitive to the definitions used. Given the demand for increased female labour participation, as well
as the fact that part-time work may have negative effects on women’s career, income and pension
disbursement, we argue that it is important to identify the factors that promote a more equal input of
paid work among both partners in a couple, and also factors that characterise the so-called “role-
reversal couples” (Tyre and McGinn 2003) where the female part works most. Our analysis is based
on the survey LOGG – Survey on Life course, Generation and Gender 2007. We look at couples
where the female part is 25-54 years old, i.e. the age group where most people have finished their
education and few have yet retired. The analysis comprises both women with and without children in
the household, and both formally married and cohabiting women are included. Hopefully, the study
will give a better understanding of the factors hindering and promoting women’s labour supply, at
least in a period of strong economic activity, which characterised Norway in 2007.
Relevant theories and perspectives Whereas sociological research on couples’ division of unpaid domestic work has developed several
well-defined theories that have been tested and discussed in a vast number of studies (for instance
Greenstein 2000, Bittman et al. 2003), theories on the partners’ allocation of paid work are fewer and
less well-defined, at least in sociological research. We do not aim at testing a number of clearly
formulated theories in this paper, but rather try to clarify the relevance of some selected perspectives.
One of the most central theories in explaining couple’s division of labour is Gary Becker’s theory on
5
comparative advantages (Becker 1991). The key assumption is that the individual members of the
family pool their resources and take decisions in order to maximize the joint family utility. According
to the theory, the decision on how to allocate market work and domestic work between the partners is
taken by comparing the husband’s marginal productivity in market and domestic work with the wife’s
marginal productivity in the same areas. One interpretation of this is that the woman’s labour market
participation is negatively affected by the husband’s resources and positively affected by her own
resources. The opposite is true for the husband’s labour supply. Usually, the partners’ marginal
productivity in market work is measured by the relative wages of the spouses. In this paper, we use the
partners’ educational attainment as a proxy for their labour market resources as we lack good
information on their wages.
Being in good health may also bee looked upon as a type of labour market resource, as sickness and
health limitations may reduce the partners’ labour supply and good health facilitates full-time work.
Hence, including the partners’ health in the analysis may shed additional light on the comparative
advantage perspective.
In a more sociological interpretation, the partners’ labour market resources, particularly their
educational attainment, are seen as a type a social capital that affects their spouse’s labour supply
positively (Bernardi 1999). It is assumed that the partners may provide each other with skills, network
resources and knowledge, and thereby help each other to find good jobs and enhance their labour
supply. According to this theoretical tradition, having a resourceful partner would facilitate people’s
employment and increase their labour supply. In a more specialized version of this theory, education is
seen as an indicator of norms and values. Since highly educated men usually have more modern views
on women’s work and family role than the less educated, it is hypothesised that they are more
supportive of the wife’s employment. It may therefore be expected that women with well-educated
husbands have higher employment than other women, regardless of their own educational level. When
it comes to women’s own education, we know that well-educated women have higher employment
rates and longer working hours than the less educated. This is consistent with the assumption of
economic theory that long education leads to higher wages, which result in higher employment. It is
difficult to investigate all these associations in the same model. In this paper we look at the effect of
the partners’ relative educational level, as well as of the women’s educational attainment. We expect
that women seldom work more than their partner when they have less education than their partner,
whereas the opposite is true when the woman has more education than her partner. We also expect that
6
highly educated women more often than others work as much as, or more than, their partner,
irrespective of their relative educational level.
In spite of generous parental leave rights and a high coverage of affordable and high quality childcare,
many Norwegian couples still find it too demanding with two full-time jobs, especially when they
have small children. Therefore, one of the partners, most often the mother, may limit her labour
market participation somewhat. A recent study reveals that men, too, tend to cut down on their paid
hours to some extent when there are children in the household (Dommermuth and Kitterød 2009), but
these reductions are far more modest than those undertaken by women. Moreover, it is first and
foremost men with very young children who limit their paid hours. We explore the effects of the age
of the youngest child in the household and expect that women with small children more seldom than
others work as much as, or more than, their partner in the labour market.
We also assume that equal or untraditional sharing of paid work is more common in younger than in
older age groups. Since young people more often than the older ones have grown up in a dual-earner
family, they probably have more positive attitudes towards women’s paid labour. We therefore expect
to find more equal or unconventional arrangements among younger women. However, it could also be
that the oldest women work long hours in order to compensate for modest time inputs in the labour
market when they had small children, when there was a lack of kindergartens and after school
programmes. We also look at the age difference between the partners, but are not quite sure what
relationship to expect. Being older than her partner may give women more responsibility for the
economic provision and imply longer working hours than the partner. Having an older partner may, on
the one hand, imply that the partner has achieved his ambitions in the labour market and therefore is
more willing to support his wife’s career than younger men. On the other hand, if the older partner has
started to scale back his labour market participation, the woman may feel obliged to reduce her own
hours in order to spend time with her husband.
Because there are significant regional variations in norms and practices regarding women’s labour
force participation in Norway, we explore possible differences between provinces. In particular, it
seems that norms and practices are more traditional in the Southern part of the country than elsewhere
(Magnussen et al. 2005), a fact that is corroborated by an index of gender equality, prepared by
Statistics Norway (http://www.ssb.no/likekom/). On the other hand, some of the municipalities in the
Northern part of the country have very high scores on this index, indicating a high level of gender
equality.
7
Like the other Scandinavian countries, Norway has a highly gender segregated labour market with
high percentages of women in the public sector and in education, health and social work, and men
concentrated in the private sector and in manufacturing and finance. Previous research has shown that
typical female and typical male jobs are often characterised by different “work-cultures” and different
practices regarding part-time, full-time and overtime work (Kjeldstad and Nymoen 2004, Abrahamsen
2002). Long hours are more widespread in typical male jobs than in typical female jobs, whereas part
time is most common in typical female jobs. We also know that self-employment is more common
among men than among women, and that self-employed people usually work longer hours than
employees. Hence, the partners’ type of work will probably be important when couples consider how
much time each partner should spend on paid labour. We therefore investigate possible effects of
variables capturing sector and type of work, both by looking at field of education and by looking at the
partners’ work characteristics and their occupations.
Data
The analysis is based on LOGG – Survey on Life course, Generation and Gender 2007- a large survey
of people’s lives and activities at various stages of the life course, undertaken by Statistics Norway
and the research institute NOVA (Brunborg et al. 2009). Information on employment, health, family,
household and childcare and various other topics was collected from individual women and men 18-79
years of age. The information on employment is fairly detailed. Respondents were also asked to give
information about their household members, and especially about their partner. In this paper we make
use of the respondents’ information on their partner’s employment, working hours, job characteristics
and occupation, as well as on their partner’s health. The survey is supplemented with information from
various registers, for instance on the respondent’s and the partner’s level and field of education.
LOGG has a larger sample than most other Norwegian surveys, which allows us to look at various
sub-groups and still include a large number of explanatory variables in the analysis. The rich
information about the respondent’s partner also makes LOGG particularly suitable for our purpose.
We utilise a sub-sample of female respondents 25-54 years of age, who live with a partner. Both
formally married and cohabiting women are included. However, we exclude those with children below
two years of age because the question on working hours asked in the survey is not particularly suitable
for parents with very young children. The question captures usual weekly working hours for the
respondent and her partner. As most parents take shorter or longer periods of parental leave during the
child’s first two years, it is not entirely clear how to interpret their information on usual working
hours. This leaves us with a sub-sample of 2,571 partnered women.
8
Our dependent variable is constructed from women’s reports on their own and their partner’s usual
weekly working hours. Both main and secondary jobs (if any) are included.
Definition of traditional, equal and untraditional sharing of paid work It is not obvious what should be regarded as traditional division, equal sharing and untraditional
division of paid work in a couple. One may look at the absolute or relative differences between the
partners’ working hours, and the cutting points used to delineate equal sharing from traditional or
untraditional arrangements are not clear a priori. In this paper, we look at the absolute differences
between the partners’ working hours and discuss three different definitions of equal sharing.
According to the first one, the partners are said to share equally if they work exactly the same number
of hours per week. The second definition says that the partners share equally if they work the same
number of hours plus/minus two, which means that they share unequally if one of them works at least
three hours more than the other. The third definition, which is used in the multivariate analyses, says
that the partners share equally if they work the same number of hours plus/minus four. Hence, a
difference of at least five hours means unequal sharing.
In studies of couple’s allocation of unpaid domestic work, partners are usually regarded as sharing
equally even if none of them spend any time on a certain chore. We also allow for this definition of
equal sharing by first looking at the allocation of paid work among all couples, irrespective of the
partners’ employment. Next, we look at couples where both partners have employment as their main
activity and thereby exclude couples where one of the partners is mainly a student, a homemaker,
unemployed or retired. Finally, we look at couples where both partners have employment as their main
activity, and where the male part works at least 35 hours per week.
Independent variables We include the following independent variables in the multivariate analyses:
Respondent’s education: We use a combination of the level and field of the respondent’s education.
Her educational level is supposed to capture her labour market resources and also her attitudes towards
gender equality (Ellingsæter et al. 1994), while field of education is supposed to indicate the type of
job she performs. We distinguish between four levels of educational attainment; primary school,
secondary school, and short and long university education (1-4 years vs minimum 5 years). The
9
expectation is that highly educated women more often than others spend as much time as their partner,
or more time than their partner, on paid work. We define field of education only for those with a short
university education. Most professional trainings such as nurses and school teachers fall in this
category. We are particularly interested in the group with medical and social education, since part-time
work is especially common among nurses and other health workers. For women with long university
education there are too few observations to split by field.
Partners’ education: We look at the relationship between the partners’ educational attainment,
distinguishing between couples where the partners have the same educational level, couples where the
male part has most education and couples where the female part has most education. We differentiate
between four levels of education in constructing this variable, namely primary school, secondary
school, and short and long university education. Unfortunately, the data provides less precise
information on the partner’s than on the respondent’s education,1 and we lack information on
education for about ten percent of the partners. A category for “unknown” is therefore included in the
analyses.
Respondent’s health: Respondents were asked whether they were curtailed in their daily activities
because of bad health, psychological problems or disability. Those who gave a positive answer are
defined as having health restrictions in our analysis.
Partner’s health: We use a somewhat different measure for the partner’s health than for the
respondent’s health. Respondents where asked whether any of their household members had a long-
lasting disease, chronic health problem, disability or psychological problem. Those who reported such
problems for their partner, are here defined as having a partner with health problems.2
Children: We distinguish between those with no children below 20 years of age in the household,
those with a youngest child 2-6 years of age, those with a youngest child 7-12 years of age and those
with a youngest child 13-19 years of age in the household. The expectation is that younger children
imply a more traditional allocation of paid work between the partners.
1 Data on education was added to the survey data from Statistics Norway’s educational register for the respondent and most of the partners. When the partner could not be identified in this register, the respondent gave some information on his educational level. 2 Those who reported such health problems for one of the household members, where asked what type of health problems of disability this was, and also to what degree the person in question was limited in his or her daily activities because of this health problems. Regarding the respondents’ health, the question on health limitations was asked to everybody, not only those who reported a long lasting or chronic disease.
10
Age: We distinguish between women in the age groups 25-34 years, 35-44 years and 45-54 years. The
expectation is that younger women more often than the older ones work at least as much as their
partner. We include also a variable for the age difference between the partners in the analyses,
discriminating between respondents who are the same age as their partner, those who are at least five
years younger than their partner and those who are at least five years older.
Province: We distinguish between seven geographical areas and choose the capital and its
surroundings (Oslo and Akershus) as the reference group. We split the South-Eastern part of the
country in two, namely Agder and Rogaland, because traditional gender norms and practices are
particularly common in Agder. We assume that women in Agder more seldom than other women
perform as much as, or more, paid work than their partner, whereas the opposite is expected for the
Northern part of the country (Northern Norway). Splitting Agder and Rogaland reduces the number of
observations in these categories. Hence, only strong effects will show statistical significance.
Main activity: We differentiate between respondents who see employment as their main activity, and
those who do not. Those who did not consider themselves as mainly employed chose one of the
following alternatives: student, unemployed, disability pension, retired, housework and childcare,
military service, other. A similar dummy was constructed for the partner. The expectation is that
women with a partner who do not have employment as his main activity, more often than others work
as much as, or more than, her partner. The opposite relationship is expected when the respondent
herself do not see employment as her main activity.
Employment relationship: We discriminate between couples where both partners are employees,
couples where the respondent is an employee and the partner self-employed, couples where the partner
is an employee and the respondent self-employed, and couples where both partners are self-employed.
We expect that female employees with a self-employed partner less often than others work as much as,
or more than, their partner. The opposite is expected when the respondent, and not the partner, is self-
employed.
Sector of work: We distinguish between couples where both partners work in the public sector,
couples where the respondent works in the public and the partner in the private sector, couples where
the respondent works in the private and the partner in the public sector, and couples where both
partners work in the private sector. We assume that publicly employed women with a partner in the
11
private sector less often than others work as much as, or more than, their partner. The reverse pattern
is expected for women in the private sector with a partner in the public sector.
Leadership: We differentiate between couples where none of the partners are leaders, couples where
the partner is a leader and the respondent not, couples where the respondent is a leader and the partner
not, and couples where both partners are leaders. Leadership was captured by the question: Do you
(your partner) conduct or coordinate other people’s work? A significant proportion gave a positive
answer. We anticipate that when the partner, but not the respondent, is a leader, women less often than
otherwise work as much as, or more than, her partner. The reverse relationship is expected when the
respondent, and not the partner, is a leader.
Flexible working hours: Assuming that flexible hours facilitate full-time work and long hours, we
distinguish between couples where none of the partners have flexible hours, couples where the partner,
but not the respondent has flexible hours, couples where the respondent, but not the partner has
flexible hours, and couples where both partners have flexible hours.
Occupation: Based on the Norwegian Standard Classification of Occupations,3 we differentiate
between seven occupational groups for the respondent, namely professional and practical nurses, other
health and social work, leaders and academic workers, other university professions, clerical work and
sales and services, and finally a residual group of “other occupations”. These groups are particularly
suitable for classifying women’s occupations, but for the sake of comparison we use the same groups
for the partner. As a certain number of observations, particularly among the partners, lack information
on occupation, we include a dummy for “unknown occupation” in the analyses. Because occupation is
closely correlated with employment relationship, public/private employment, leadership and flexible
hours, and also with respondent’s type of education, we do not include these variables in the same
model, but rather run two separate models.
Results
All partnered women 25-54 years of age We start by presenting results for all couples, irrespective of the partners’ employment status and main
activity. Table 1 shows frequencies for the number of weekly working hours among women and men
3 The standard is based on the International Standard Classification of Occupations - ISCO-88, prepared by ILO. EU has developed a version of this standard ((ISCO-88(COM)), which is the base for the Norwegian standard.
12
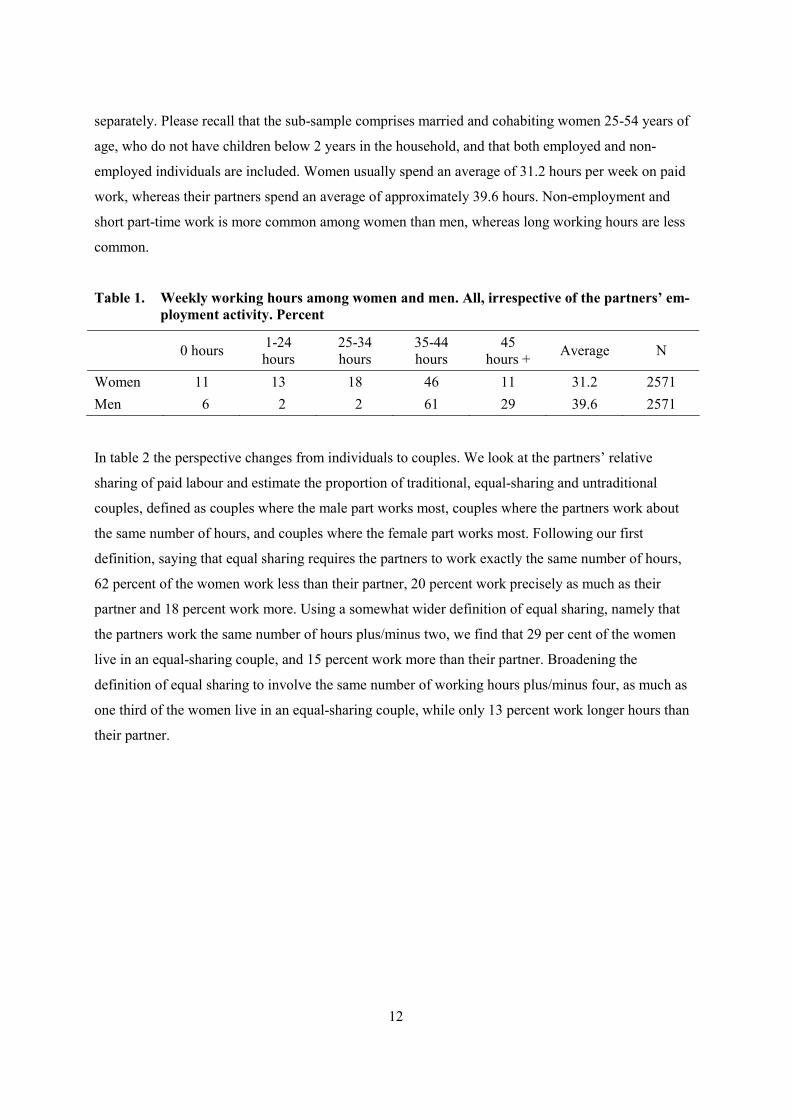
separately. Please recall that the sub-sample comprises married and cohabiting women 25-54 years of
age, who do not have children below 2 years in the household, and that both employed and non-
employed individuals are included. Women usually spend an average of 31.2 hours per week on paid
work, whereas their partners spend an average of approximately 39.6 hours. Non-employment and
short part-time work is more common among women than men, whereas long working hours are less
common.
Table 1. Weekly working hours among women and men. All, irrespective of the partners’ em-ployment activity. Percent
0 hours 1-24 hours
25-34 hours
35-44 hours
45 hours + Average N
Women 11 13 18 46 11 31.2 2571 Men 6 2 2 61 29 39.6 2571
In table 2 the perspective changes from individuals to couples. We look at the partners’ relative
sharing of paid labour and estimate the proportion of traditional, equal-sharing and untraditional
couples, defined as couples where the male part works most, couples where the partners work about
the same number of hours, and couples where the female part works most. Following our first
definition, saying that equal sharing requires the partners to work exactly the same number of hours,
62 percent of the women work less than their partner, 20 percent work precisely as much as their
partner and 18 percent work more. Using a somewhat wider definition of equal sharing, namely that
the partners work the same number of hours plus/minus two, we find that 29 per cent of the women
live in an equal-sharing couple, and 15 percent work more than their partner. Broadening the
definition of equal sharing to involve the same number of working hours plus/minus four, as much as
one third of the women live in an equal-sharing couple, while only 13 percent work longer hours than
their partner.

13
Table 2. The relationship between the partners’ working hours, based on different definitions. All couples, irrespective of the partners’ employment activity. Percent
Definitions He works most Equal sharing She works most N At least 1 hour difference 62 20 18 2571 At least 3 hours difference 56 29 15 2571 At least 5 hours difference 52 35 13 2571
We argue that the third definition is most relevant for the purpose of this paper. In order for the
partners to take notice of the difference between their working hours, the discrepancy needs to be of a
certain size. People who work at least five hours more or less than their partner will most likely
ascribe some importance to this. Five hours do make a difference when it comes to time available for
housework, child care and leisure activities.
It is still rare that women work longer hours than their partner in Norway, but equal sharing of paid
work seems to be rather common. However, more than half of the couples still have traditional
arrangements with the male part spending most time in the labour market. An important aim of this
paper is to disentangle the characteristics of the equal-sharing and non-traditional couples. Table 3
provides some initial information on this, showing frequencies for the partners’ main activity, health
and age by the couples’ division of paid work. Not surprisingly we see that when a woman works
longer hours than her partner, a significant proportion of the partners do not have employment as their
main activity, one out of five has a chronic disease and a similar proportion is at least 55 years old. 18
percent of the men in these couples have disability pension, 5 percent are students, 7 percent are
unemployed, 4 percent are retired and only 1 percent has housework and childcare as their main
activity. These men may perform some paid work, but the amount is too modest to be counted as their
main activity. Hence, its seems that in a sizeable proportion of the unconventional couples, the unusual
division of paid labour is due to men’s health problems, retirement or unemployment, rather than to
women working very long hours. This is consistent with findings in American studies on partners’
relative income (Winkler et al. 2005, Raley et al. 2006). It may be questioned whether these couples
should really be characterised as untraditional. Looking at women who work less than her partner we
see that 77 percent have employment as their main activity, whereas the rest are either students,
unemployed, disabled or homemakers. None of the women are retired, which is what we should expect
given the age limit of the sub-sample.

14
Table 3. The partners’ main activity, health and age in couples where he works most, with equal sharing and where she works most. All couples, irrespective of the partners’ employment activity. Percent.
He works most Equal sharing She works most All Partner’s main activity Employed 99 96 61 93 Student 1 0 5 1 Unemployed - 1 7 1 Disability pension 0 2 18 3 Retiree 0 0 4 1 Housework and childcare
0 - 1 0
Other 0 1 5 1
Partner’s health Chronic disease 7 9 22 9 No chronic disease 93 91 78 91
Partner’s age 25-34 years 14 15 12 14 35-44 years 37 35 31 36 45-54 years 40 36 37 38 55 years + 9 13 19 12
Respondent’s main activity
Employed 77 96 98 87 Student 6 0 1 3 Unemployed 1 0 0 1 Disability pension 8 2 0 5 Housework and childcare
5 0 0 3
Other 3 1 - 2
Respondent’s health Health limitations 23 10 11 17 No health limitations 77 90 89 83
Respondent’s age 25-34 years 21 23 17 21 35-44 years 41 39 41 40 45-55 years 38 37 42 38 N 1329 900 342 2571
15
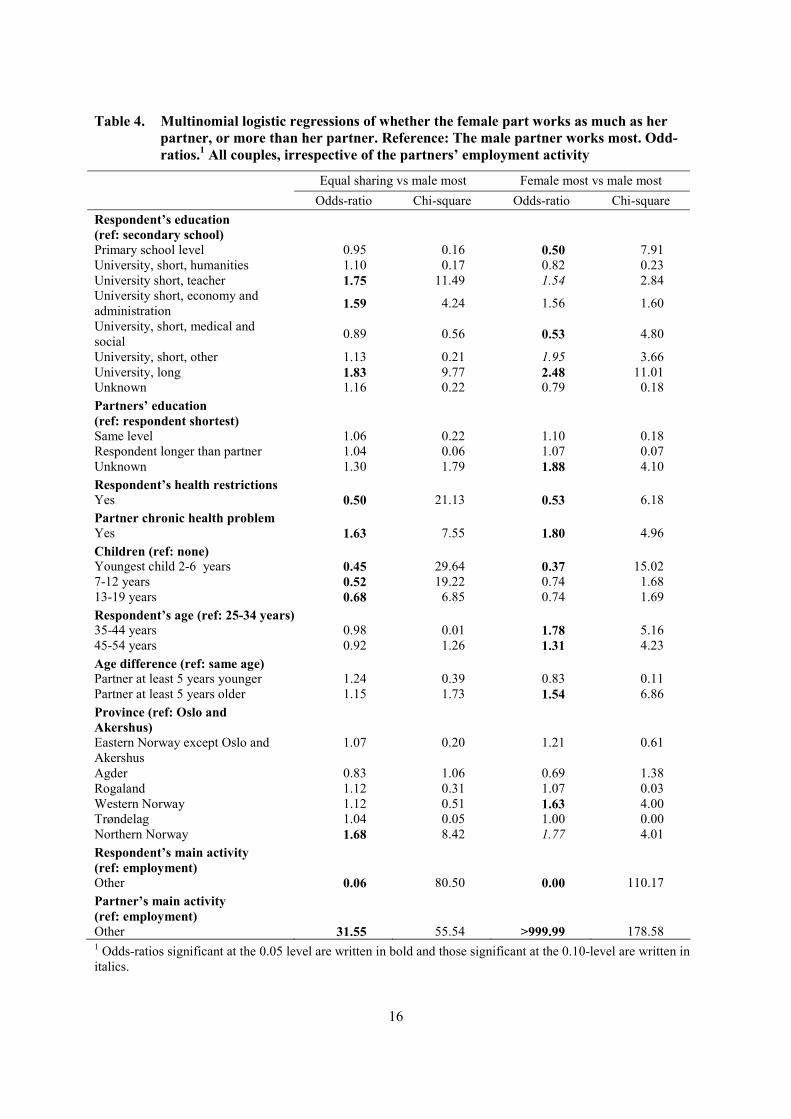
In order to gain further knowledge of the characteristics of equal-sharing and unconventional couples,
we have run a multinomial regression, estimating the odds of women spending as much time as her
partner on paid labour rather than having a traditional arrangement, and the odds of women working
more than her partner rather than having a traditional arrangement. Because the analysis comprises
both employed and non-employed individuals, we do not include any characteristics of the partners’
jobs. The results are shown in table 4. Odds-ratios significant at the 0.05 level are written in bold and
those significant at the 0.10-level are written in italics.
16
Table 4. Multinomial logistic regressions of whether the female part works as much as her partner, or more than her partner. Reference: The male partner works most. Odd-ratios.1 All couples, irrespective of the partners’ employment activity
Equal sharing vs male most Female most vs male most Odds-ratio Chi-square Odds-ratio Chi-square Respondent’s education (ref: secondary school)
Primary school level 0.95 0.16 0.50 7.91 University, short, humanities 1.10 0.17 0.82 0.23 University short, teacher 1.75 11.49 1.54 2.84 University short, economy and administration 1.59 4.24 1.56 1.60
University, short, medical and social 0.89 0.56 0.53 4.80
University, short, other 1.13 0.21 1.95 3.66 University, long 1.83 9.77 2.48 11.01 Unknown 1.16 0.22 0.79 0.18 Partners’ education (ref: respondent shortest)
Same level 1.06 0.22 1.10 0.18 Respondent longer than partner 1.04 0.06 1.07 0.07 Unknown 1.30 1.79 1.88 4.10 Respondent’s health restrictions Yes 0.50 21.13 0.53 6.18 Partner chronic health problem Yes 1.63 7.55 1.80 4.96 Children (ref: none) Youngest child 2-6 years 0.45 29.64 0.37 15.02 7-12 years 0.52 19.22 0.74 1.68 13-19 years 0.68 6.85 0.74 1.69 Respondent’s age (ref: 25-34 years) 35-44 years 0.98 0.01 1.78 5.16 45-54 years 0.92 1.26 1.31 4.23 Age difference (ref: same age) Partner at least 5 years younger 1.24 0.39 0.83 0.11 Partner at least 5 years older 1.15 1.73 1.54 6.86 Province (ref: Oslo and Akershus)
Eastern Norway except Oslo and Akershus
1.07 0.20 1.21 0.61
Agder 0.83 1.06 0.69 1.38 Rogaland 1.12 0.31 1.07 0.03 Western Norway 1.12 0.51 1.63 4.00 Trøndelag 1.04 0.05 1.00 0.00 Northern Norway 1.68 8.42 1.77 4.01 Respondent’s main activity (ref: employment)
Other 0.06 80.50 0.00 110.17 Partner’s main activity (ref: employment) Other 31.55 55.54 >999.99 178.58 1 Odds-ratios significant at the 0.05 level are written in bold and those significant at the 0.10-level are written in italics.
17
In accordance with the results in table 3, table 4 demonstrates that the odds of equal and untraditional
sharing of paid work decrease significantly when the respondent does not see employment as her main
activity and increase drastically when the partner is not mainly employed. Likewise, the odds of equal
and untraditional sharing are reduced when the respondent herself has health problems, and raise when
the partner has health problems. Concerning the respondent’s educational level, we see that consistent
with our assumption, women with a long university education are more likely to work as much as their
partner, or more than their partner, than the reference group (secondary school), whereas women with
primary school are less likely to have an untraditional arrangement. Looking at women with a short
university education, we find significant differences between various fields. Having a short university
education in teaching or in economics and administration increases the odds of equal sharing of paid
work compared to the reference group. Having a short university education in teaching also increases
the odds of untraditional sharing, and the same is true for women with certain others types of short
university education. However, women with a short university education in medical and social
subjects have lower odds of untraditional sharing than women with secondary school.
The effect of the partners’ relative education is unclear as the only significant effect is found for those
with unknown education. Our assumption that a woman with longer education than her partner often
works as much as, or more than, the partner, is not supported. However, this needs to be researched
further with more complete data on partner’s education.
Consistent with our assumption, there is a strong negative association between equal and untraditional
division of paid work and having children in the household. It is particularly very young children that
lower the odds of an untraditional arrangement.
Contrary to our supposition, women 35 years or older are more prone to work longer hours than their
partner compared to the youngest ones. As far as equal sharing of paid work is concerned, there are
no significant differences between age groups. Having a partner who is at least five years older than
herself, increases women’s odds of working longer hours than her partner. As previously mentioned,
one possible explanation of this may be that older partners prioritize their wife’s career over their own.
An alternative explanation may be that these partners have poorer health than their wife and therefore
work less. Even though partner’s health is included in the model, there may be health problems that
are not captured by this variable.
18
As expected, women in the Northern part of the country have higher odds of equal or untraditional
work arrangements than other women, and somewhat unexpectedly, women in the Western part of the
country have higher odds of unconventional sharing than other women. Contrary to our assumption
there is no significant negative effect of living in Agder. The estimates have the anticipated sign, but
due to the small number of observations in this group, we need strong associations to gain statistical
significance.
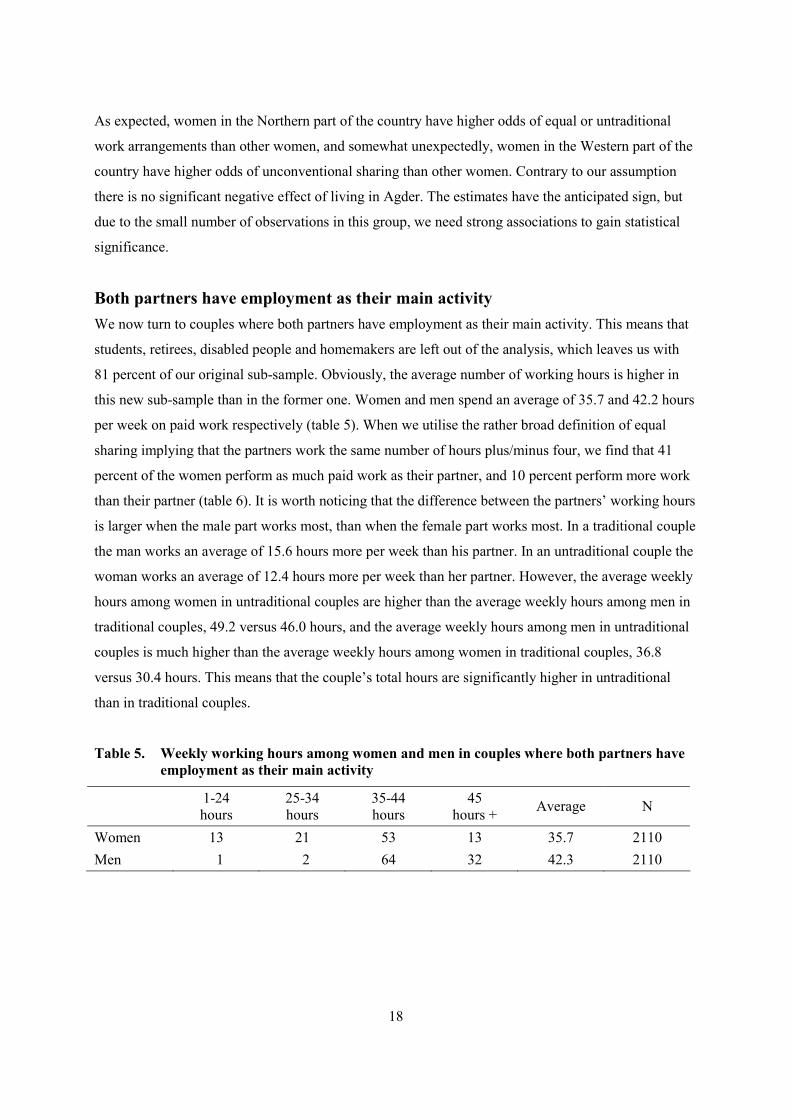
Both partners have employment as their main activity We now turn to couples where both partners have employment as their main activity. This means that
students, retirees, disabled people and homemakers are left out of the analysis, which leaves us with
81 percent of our original sub-sample. Obviously, the average number of working hours is higher in
this new sub-sample than in the former one. Women and men spend an average of 35.7 and 42.2 hours
per week on paid work respectively (table 5). When we utilise the rather broad definition of equal
sharing implying that the partners work the same number of hours plus/minus four, we find that 41
percent of the women perform as much paid work as their partner, and 10 percent perform more work
than their partner (table 6). It is worth noticing that the difference between the partners’ working hours
is larger when the male part works most, than when the female part works most. In a traditional couple
the man works an average of 15.6 hours more per week than his partner. In an untraditional couple the
woman works an average of 12.4 hours more per week than her partner. However, the average weekly
hours among women in untraditional couples are higher than the average weekly hours among men in
traditional couples, 49.2 versus 46.0 hours, and the average weekly hours among men in untraditional
couples is much higher than the average weekly hours among women in traditional couples, 36.8
versus 30.4 hours. This means that the couple’s total hours are significantly higher in untraditional
than in traditional couples.
Table 5. Weekly working hours among women and men in couples where both partners have employment as their main activity
1-24 hours
25-34 hours
35-44 hours
45 hours + Average N
Women 13 21 53 13 35.7 2110 Men 1 2 64 32 42.3 2110
19
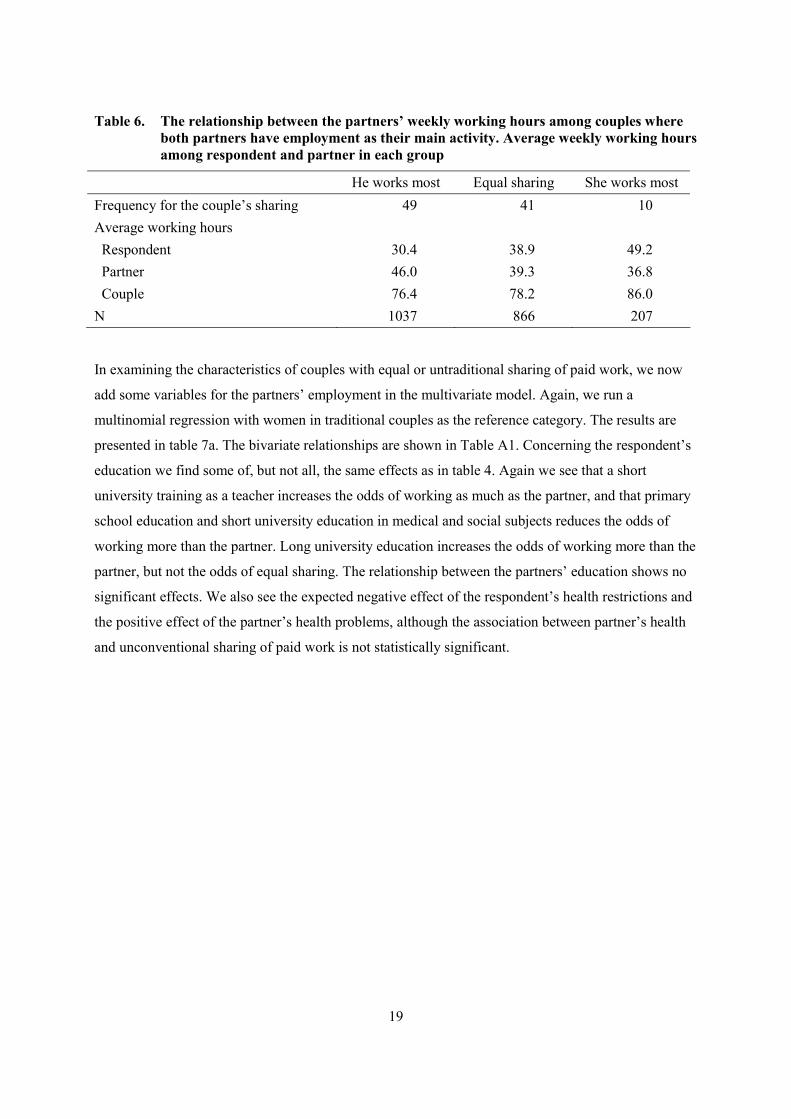
Table 6. The relationship between the partners’ weekly working hours among couples where both partners have employment as their main activity. Average weekly working hours among respondent and partner in each group
He works most Equal sharing She works most Frequency for the couple’s sharing 49 41 10 Average working hours Respondent 30.4 38.9 49.2 Partner 46.0 39.3 36.8 Couple 76.4 78.2 86.0 N 1037 866 207
In examining the characteristics of couples with equal or untraditional sharing of paid work, we now
add some variables for the partners’ employment in the multivariate model. Again, we run a
multinomial regression with women in traditional couples as the reference category. The results are
presented in table 7a. The bivariate relationships are shown in Table A1. Concerning the respondent’s
education we find some of, but not all, the same effects as in table 4. Again we see that a short
university training as a teacher increases the odds of working as much as the partner, and that primary
school education and short university education in medical and social subjects reduces the odds of
working more than the partner. Long university education increases the odds of working more than the
partner, but not the odds of equal sharing. The relationship between the partners’ education shows no
significant effects. We also see the expected negative effect of the respondent’s health restrictions and
the positive effect of the partner’s health problems, although the association between partner’s health
and unconventional sharing of paid work is not statistically significant.
20
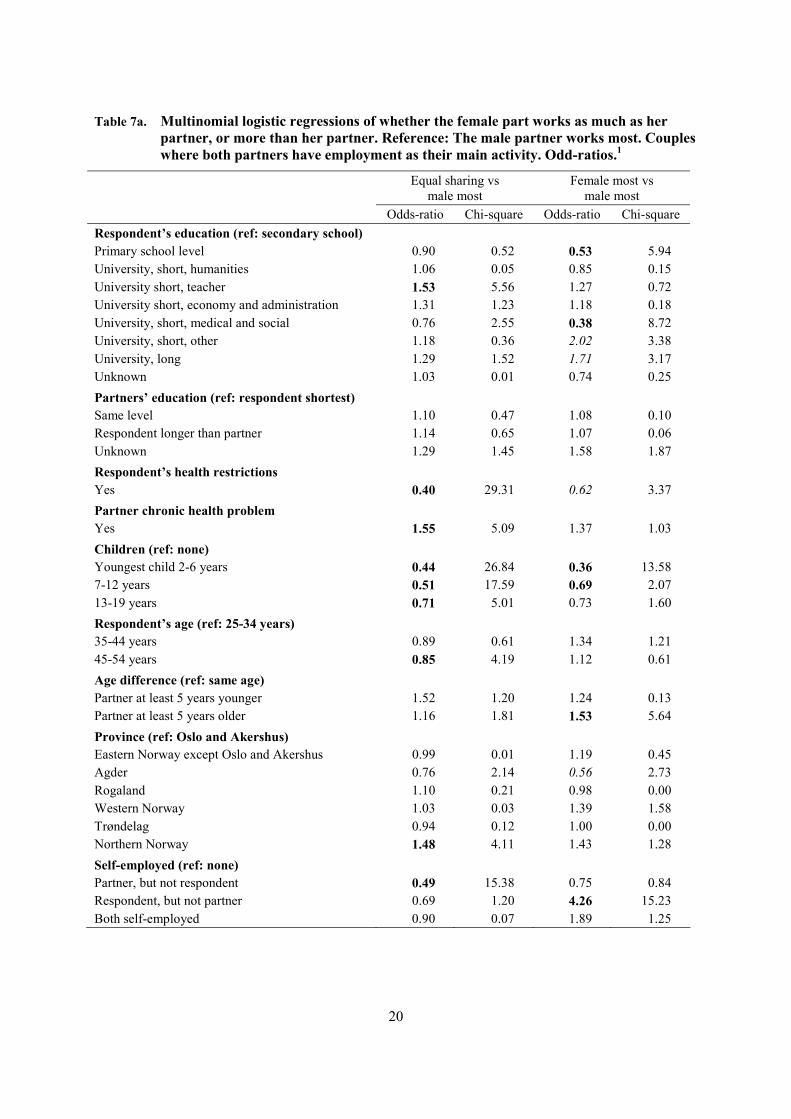
Table 7a. Multinomial logistic regressions of whether the female part works as much as her partner, or more than her partner. Reference: The male partner works most. Couples where both partners have employment as their main activity. Odd-ratios.1
Equal sharing vs male most
Female most vs male most
Odds-ratio Chi-square Odds-ratio Chi-square Respondent’s education (ref: secondary school) Primary school level 0.90 0.52 0.53 5.94 University, short, humanities 1.06 0.05 0.85 0.15 University short, teacher 1.53 5.56 1.27 0.72 University short, economy and administration 1.31 1.23 1.18 0.18 University, short, medical and social 0.76 2.55 0.38 8.72 University, short, other 1.18 0.36 2.02 3.38 University, long 1.29 1.52 1.71 3.17 Unknown 1.03 0.01 0.74 0.25 Partners’ education (ref: respondent shortest) Same level 1.10 0.47 1.08 0.10 Respondent longer than partner 1.14 0.65 1.07 0.06 Unknown 1.29 1.45 1.58 1.87 Respondent’s health restrictions Yes 0.40 29.31 0.62 3.37 Partner chronic health problem Yes 1.55 5.09 1.37 1.03 Children (ref: none) Youngest child 2-6 years 0.44 26.84 0.36 13.58 7-12 years 0.51 17.59 0.69 2.07 13-19 years 0.71 5.01 0.73 1.60 Respondent’s age (ref: 25-34 years) 35-44 years 0.89 0.61 1.34 1.21 45-54 years 0.85 4.19 1.12 0.61 Age difference (ref: same age) Partner at least 5 years younger 1.52 1.20 1.24 0.13 Partner at least 5 years older 1.16 1.81 1.53 5.64 Province (ref: Oslo and Akershus) Eastern Norway except Oslo and Akershus 0.99 0.01 1.19 0.45 Agder 0.76 2.14 0.56 2.73 Rogaland 1.10 0.21 0.98 0.00 Western Norway 1.03 0.03 1.39 1.58 Trøndelag 0.94 0.12 1.00 0.00 Northern Norway 1.48 4.11 1.43 1.28 Self-employed (ref: none) Partner, but not respondent 0.49 15.38 0.75 0.84 Respondent, but not partner 0.69 1.20 4.26 15.23 Both self-employed 0.90 0.07 1.89 1.25
21
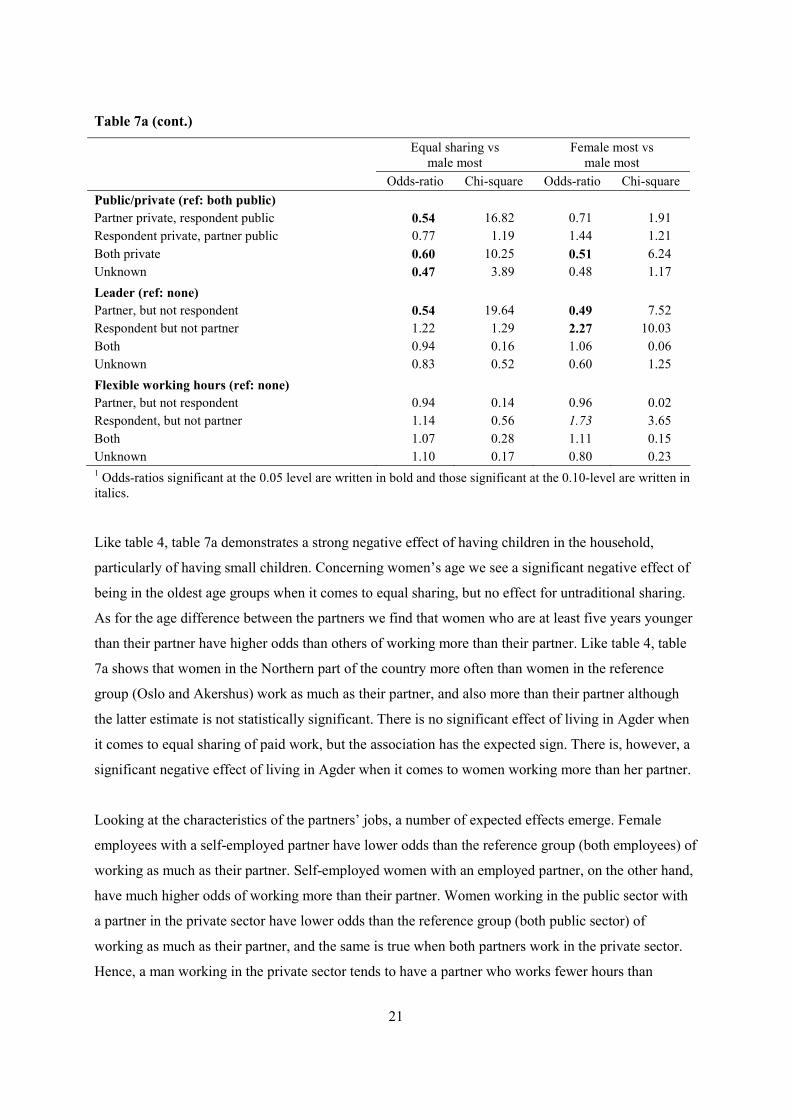
Table 7a (cont.)
Equal sharing vs male most
Female most vs male most
Odds-ratio Chi-square Odds-ratio Chi-square Public/private (ref: both public) Partner private, respondent public 0.54 16.82 0.71 1.91 Respondent private, partner public 0.77 1.19 1.44 1.21 Both private 0.60 10.25 0.51 6.24 Unknown 0.47 3.89 0.48 1.17 Leader (ref: none) Partner, but not respondent 0.54 19.64 0.49 7.52 Respondent but not partner 1.22 1.29 2.27 10.03 Both 0.94 0.16 1.06 0.06 Unknown 0.83 0.52 0.60 1.25 Flexible working hours (ref: none) Partner, but not respondent 0.94 0.14 0.96 0.02 Respondent, but not partner 1.14 0.56 1.73 3.65 Both 1.07 0.28 1.11 0.15 Unknown 1.10 0.17 0.80 0.23 1 Odds-ratios significant at the 0.05 level are written in bold and those significant at the 0.10-level are written in italics.
Like table 4, table 7a demonstrates a strong negative effect of having children in the household,
particularly of having small children. Concerning women’s age we see a significant negative effect of
being in the oldest age groups when it comes to equal sharing, but no effect for untraditional sharing.
As for the age difference between the partners we find that women who are at least five years younger
than their partner have higher odds than others of working more than their partner. Like table 4, table
7a shows that women in the Northern part of the country more often than women in the reference
group (Oslo and Akershus) work as much as their partner, and also more than their partner although
the latter estimate is not statistically significant. There is no significant effect of living in Agder when
it comes to equal sharing of paid work, but the association has the expected sign. There is, however, a
significant negative effect of living in Agder when it comes to women working more than her partner.
Looking at the characteristics of the partners’ jobs, a number of expected effects emerge. Female
employees with a self-employed partner have lower odds than the reference group (both employees) of
working as much as their partner. Self-employed women with an employed partner, on the other hand,
have much higher odds of working more than their partner. Women working in the public sector with
a partner in the private sector have lower odds than the reference group (both public sector) of
working as much as their partner, and the same is true when both partners work in the private sector.
Hence, a man working in the private sector tends to have a partner who works fewer hours than
22
himself irrespective of what sector his partner works in. However, there is no effect of the woman
working in the private sector and her partner in the public sector. Unfortunately, some women did not
answer the question on sector of partner’s job, and although these are few (2 per cent) the unknown-
group shows a significant effect in the analysis. The effects of sector of work must therefore be
interpreted with some caution. Having a partner who is a leader while not being a leader herself,
reduces the odds of a woman working as much as, or more than, her partner. On the other hand, a
woman who is herself a leader whereas her partner is not, more often than others works longer hours
than her partner. Finally, respondents who have themselves flexible working hours, while their partner
has not, have higher odds of working more than their partner. This supports our assumption that
flexible hours facilitate long hours, although there is no effect of the partner having flexible hours.
In a separate regression we investigate the possible effects of the respondent’s and the partner’s
occupations. Because of the strong correlations between both partners’ occupations on the one hand
and the employment related variables on the other, the latter variables are excluded from this analysis.
The respondent’s education is also excluded because of the strong association between occupation and
level and type of education. All the other variables from table 7a are, however, included in the
analysis. Ideally we would prefer to combine the partners’ occupations and investigate differences
between for instance couples with a female nurse and a male leader on the one hand and couples with
a male nurse and a female leader on the other, but due to the low number of observations in some of
the occupational categories we look at effects of each partner’s occupation separately. The results are
shown in table 7b. Only the effects of the partners’ occupations are shown. The effects of the other
variables (difference between the partners’ education, respondent’s and partner’s health, children,
respondent’s age, age difference between the partners and province) are approximately identical with
those displayed in table 7a. As for the respondent’s occupation we see that professional and practical
nurses more seldom than the reference group (teachers) work as much as their partner or more than
their partner. The same is true for clerical workers and those working with sales and services. Other
health and social workers have lower odds of working more than their partner, but not of equal sharing
of paid work. Leaders and academic workers more often than others work as much as their partner or
more than their partner. This corroborates the findings from table 7a although being a leader is defined
more narrowly in table 7b.
23
Table 7b. Multinomial logistic regressions of whether the female part works as much as her partner, or more than her partner Reference: The male partner works most. Couples where both partners have employment as their main activity. Odd-ratios.1
Equal sharing vs male most
Female most vs male most
Odds-ratio
Chi-sqaure
Odds-ratio
Chi-square
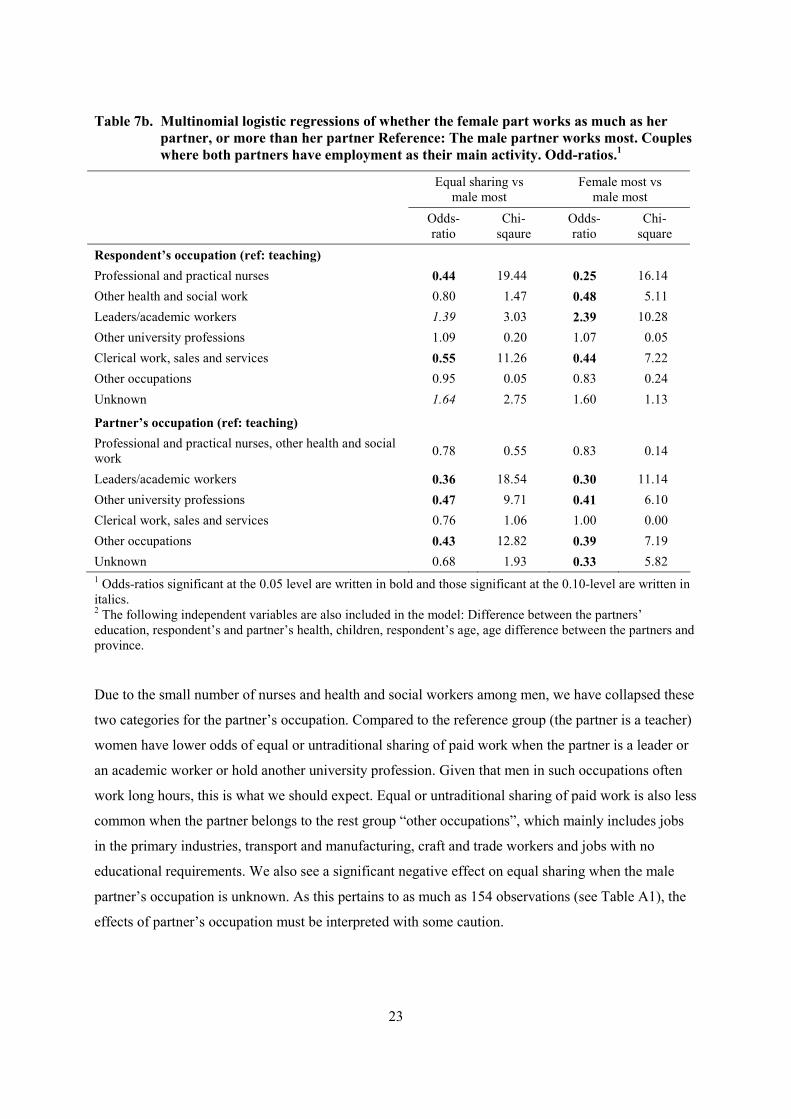
Respondent’s occupation (ref: teaching) Professional and practical nurses 0.44 19.44 0.25 16.14 Other health and social work 0.80 1.47 0.48 5.11 Leaders/academic workers 1.39 3.03 2.39 10.28 Other university professions 1.09 0.20 1.07 0.05 Clerical work, sales and services 0.55 11.26 0.44 7.22 Other occupations 0.95 0.05 0.83 0.24 Unknown 1.64 2.75 1.60 1.13
Partner’s occupation (ref: teaching) Professional and practical nurses, other health and social work 0.78 0.55 0.83 0.14
Leaders/academic workers 0.36 18.54 0.30 11.14 Other university professions 0.47 9.71 0.41 6.10 Clerical work, sales and services 0.76 1.06 1.00 0.00 Other occupations 0.43 12.82 0.39 7.19 Unknown 0.68 1.93 0.33 5.82 1 Odds-ratios significant at the 0.05 level are written in bold and those significant at the 0.10-level are written in italics. 2 The following independent variables are also included in the model: Difference between the partners’ education, respondent’s and partner’s health, children, respondent’s age, age difference between the partners and province.
Due to the small number of nurses and health and social workers among men, we have collapsed these
two categories for the partner’s occupation. Compared to the reference group (the partner is a teacher)
women have lower odds of equal or untraditional sharing of paid work when the partner is a leader or
an academic worker or hold another university profession. Given that men in such occupations often
work long hours, this is what we should expect. Equal or untraditional sharing of paid work is also less
common when the partner belongs to the rest group “other occupations”, which mainly includes jobs
in the primary industries, transport and manufacturing, craft and trade workers and jobs with no
educational requirements. We also see a significant negative effect on equal sharing when the male
partner’s occupation is unknown. As this pertains to as much as 154 observations (see Table A1), the
effects of partner’s occupation must be interpreted with some caution.
24
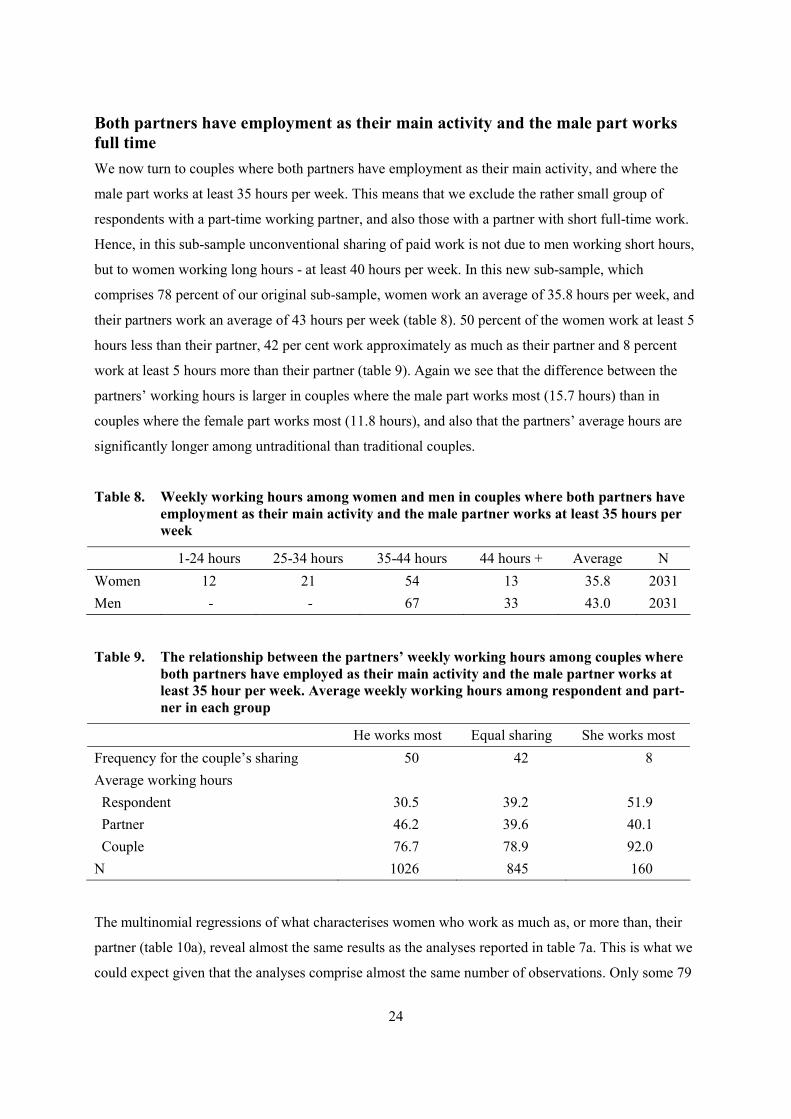
Both partners have employment as their main activity and the male part works full time We now turn to couples where both partners have employment as their main activity, and where the
male part works at least 35 hours per week. This means that we exclude the rather small group of
respondents with a part-time working partner, and also those with a partner with short full-time work.
Hence, in this sub-sample unconventional sharing of paid work is not due to men working short hours,
but to women working long hours - at least 40 hours per week. In this new sub-sample, which
comprises 78 percent of our original sub-sample, women work an average of 35.8 hours per week, and
their partners work an average of 43 hours per week (table 8). 50 percent of the women work at least 5
hours less than their partner, 42 per cent work approximately as much as their partner and 8 percent
work at least 5 hours more than their partner (table 9). Again we see that the difference between the
partners’ working hours is larger in couples where the male part works most (15.7 hours) than in
couples where the female part works most (11.8 hours), and also that the partners’ average hours are
significantly longer among untraditional than traditional couples.
Table 8. Weekly working hours among women and men in couples where both partners have employment as their main activity and the male partner works at least 35 hours per week
1-24 hours 25-34 hours 35-44 hours 44 hours + Average N Women 12 21 54 13 35.8 2031 Men - - 67 33 43.0 2031
Table 9. The relationship between the partners’ weekly working hours among couples where both partners have employed as their main activity and the male partner works at least 35 hour per week. Average weekly working hours among respondent and part-ner in each group
He works most Equal sharing She works most Frequency for the couple’s sharing 50 42 8 Average working hours Respondent 30.5 39.2 51.9 Partner 46.2 39.6 40.1 Couple 76.7 78.9 92.0 N 1026 845 160
The multinomial regressions of what characterises women who work as much as, or more than, their
partner (table 10a), reveal almost the same results as the analyses reported in table 7a. This is what we
could expect given that the analyses comprise almost the same number of observations. Only some 79

25
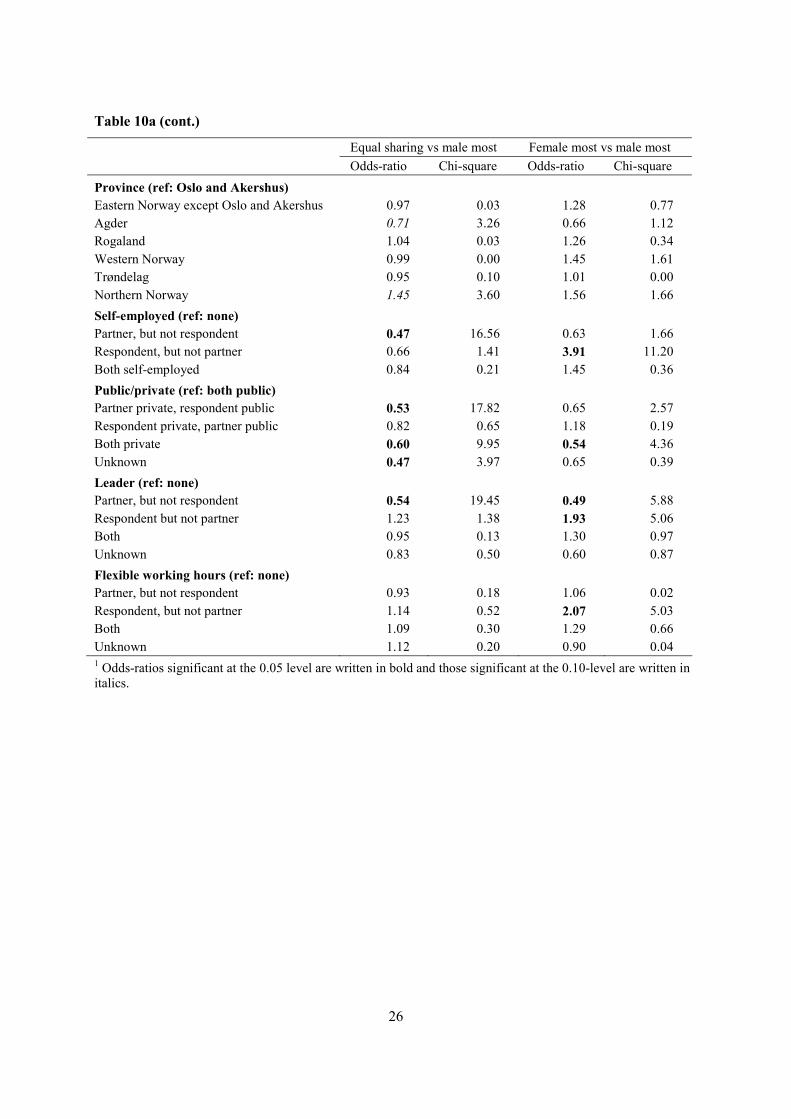
respondents were left out in table 10a compared to table 7a. What is new in table 10a is that we see a
significant negative effect of living in Agder when it comes to women working the same number of
hours as her partner, but not when it comes to working more than her partner. Both associations have
the expected sign, though, and the latter one is fairly strong, but probably lacks significance due to the
small number of observations. Also when we look at the effects of the partners’ occupations we see
almost the same results in table 10b as in table 7b. The bivariate associations are shown in Table A2.
Table 10a. Multinomial logistic regressions of whether the female part works as much as her partner, or more than her partner. Reference: The male partner works most. Couples where both partners have employment as their main activity and the male partner works at least 35 hour per week. Odd-ratios.1
Equal sharing vs male most Female most vs male most Odds-ratio Chi-square Odds-ratio Chi-square Respondent’s education (ref: secondary school) Primary school level 0.92 0.33 0.53 4.46 University, short, humanities 1.07 0.06 0.85 0.11 University short, teacher 1.58 6.22 1.44 1.33 University short, economy and administration 1.33 1.38 1.26 0.29 University, short, medical and social 0.79 1.61 0.46 4.63 University, short, other 1.15 0.27 1.84 1.94 University, long 1.26 1.20 2.17 5.73 Unknown 1.06 0.03 1.02 0.00 Partners’ education (ref: respondent shortest) Same level 1.08 0.31 1.08 0.08 Respondent longer than partner 1.12 0.44 1.18 0.27 Unknown 1.21 0.78 2.13 4.31 Respondent’s health restrictions Yes 0.41 27.28 0.73 1.23 Partner chronic health problem Yes 1.44 3.30 1.03 0.01 Children (ref: none) Youngest child 2-6 years 0.41 30.50 0.32 13.11 7-12 years 0.50 18.23 0.73 1.28 13-19 years 0.70 5.30 0.68 1.98 Respondent’s age (ref: 25-34 years) 35-44 years 0.87 0.89 1.23 0.47 45-54 years 0.83 5.21 1.15 0.83 Age difference (ref: same age) Partner at least 5 years younger 1.69 1.80 1.16 0.05 Partner at least 5 years older 1.17 1.89 1.38 2.62
26
Table 10a (cont.)
Equal sharing vs male most Female most vs male most Odds-ratio Chi-square Odds-ratio Chi-square Province (ref: Oslo and Akershus) Eastern Norway except Oslo and Akershus 0.97 0.03 1.28 0.77 Agder 0.71 3.26 0.66 1.12 Rogaland 1.04 0.03 1.26 0.34 Western Norway 0.99 0.00 1.45 1.61 Trøndelag 0.95 0.10 1.01 0.00 Northern Norway 1.45 3.60 1.56 1.66 Self-employed (ref: none) Partner, but not respondent 0.47 16.56 0.63 1.66 Respondent, but not partner 0.66 1.41 3.91 11.20 Both self-employed 0.84 0.21 1.45 0.36 Public/private (ref: both public) Partner private, respondent public 0.53 17.82 0.65 2.57 Respondent private, partner public 0.82 0.65 1.18 0.19 Both private 0.60 9.95 0.54 4.36 Unknown 0.47 3.97 0.65 0.39 Leader (ref: none) Partner, but not respondent 0.54 19.45 0.49 5.88 Respondent but not partner 1.23 1.38 1.93 5.06 Both 0.95 0.13 1.30 0.97 Unknown 0.83 0.50 0.60 0.87 Flexible working hours (ref: none) Partner, but not respondent 0.93 0.18 1.06 0.02 Respondent, but not partner 1.14 0.52 2.07 5.03 Both 1.09 0.30 1.29 0.66 Unknown 1.12 0.20 0.90 0.04 1 Odds-ratios significant at the 0.05 level are written in bold and those significant at the 0.10-level are written in italics.

27
Table 10b. Multinomial logistic regressions of whether the female part works as much as her partner, or more than her partner Reference: The male partner works most. Couples where both partners have employment as their main activity and the male partner works at least 35 hour per week. Odd-ratios.1, 2
Equal sharing vs male most Female most vs male most Odds-ratio Chi-sqaure Odds-ratio Chi-square Respondent’s occupation (ref: teaching) Professional and practical nurses 0.43 22.58 0.18 18.39 Other health and social work 0.78 1.82 0.39 6.93 Leaders/academic workers 1.38 2.91 2.13 6.99 Other university professions 1.11 0.28 0.84 0.31 Clerical work, sales and services 0.55 11.03 0.33 10.52 Other occupations 0.97 0.02 0.53 1.97 Unknown 1.58 2.27 1.58 0.96
Partner’s occupation (ref: teaching) Professional and practical nurses, other health and social work
0.84
0.28
1.44
0.40
Leaders/academic workers 0.36 17.78 0.49 2.78 Other university professions 0.47 9.65 0.58 1.58 Clerical work, sales and services 0.77 0.88 1.42 0.58 Other occupations 0.43 12.84 0.56 1.88 Unknown 0.66 2.18 0.51 1.67 1 Odds-ratios significant at the 0.05 level are written in bold and those significant at the 0.10-level are written in italics. 2 The following independent variables are also included in the model: Difference between the partners’ education, respondent’s and partner’s health, children, respondent’s age, age difference between the partners and province.
Summary and discussion The dual-earner model with equal sharing of paid and unpaid labour among women and men is a
central political ambition in Norway. While numerous studies have looked at couples’ relative division
of unpaid domestic work, there has been less focus on the partners’ division of paid market work. This
paper aims to fill this gap by investigating the characteristics of couples in which the female part
works longer hours than her male partner, as well as couples where the partners put in approximately
the same number of hours. Given the great demand for female labour in Norway, and the high part-
time rates among women, we argue that it is important to disentangle factors that promote and hinder
women’s labour supply.
We do not aim at testing a number of clearly outlined theories in this paper, but rather try to shed light
on some relevant perspectives. In addition to the theory on the partners’ comparative advantages
28
measured by human capital and labour market resources, we direct attention to factors such as the
strongly gender segregated labour market in Norway, the gendered norms of providing and caring,
possible differences between younger and older age groups, and also between various parts of the
country. The empirical analyses are based on a survey from 2007, in which individual respondents
gave information about themselves and their partners. Several interesting findings emerge.
Equal sharing of paid labour is now increasing in Norway (Kitterød 2007), but women seldom work
longer hours than their partner. Still, about half of all partnered women spend less time than their
partner in the labour market. The exact proportions are of course sensitive to categorisations and
definitions. If we define traditional sharing as men working at least five hours more than their female
partner, and untraditional sharing as women working at least five hours more than their male partner,
we find that 52 percent of all partnered women 25-54 years of age have a traditional arrangement and
13 percent have an untraditional arrangement. However, in a considerable proportion of the
unconventional couples, the male part is a student, has health problems or is unemployed or retired.
Untraditional sharing is then more due to the male partner putting in a modest number of hours in paid
work, than to the female partner working long hours. When both partners have employment as their
main activity, 49 per cent of the women work less than their partner, 41 per cent work the same
number of hours as their partner, and 10 percent work more than their partner. It is important to notice,
however, that the difference between the partners’ working hours is larger in couples where the male
part works most, than in couples where the female part works most.
We have not been able to test the comparative advantage perspective directly in this paper, but our
analysis lends some support to this theory. Highly educated women are more prone to work as much
as, or more than, their partner than are those with less education. However, we find no effect of the
partners’ relative educational level. Data with more complete information on the partner’s educational
attainment is required to investigate this further. Good health may also be regarded as a labour market
resource, and consistent with our assumptions, women’s health restrictions imply less equal or
untraditional sharing, while men’s health problems imply more equal or untraditional sharing. The
gender segregated labour market in Norway seems to play a role over and above the partners’
resources. Women with medical and social education at lower university level are particularly inclined
to work less than their partner. Looking at respondents’ occupation we see that professional and
practical nurses often work less than their partner. This reflects the high part-time rates in these
professions. Moreover, having a partner in the private sector implies less equal and less untraditional
sharing for women. Along the same vein, having a self-employed partner while being an employee
29
herself, results in more traditional sharing for women, whereas self-employed women with a partner
who is an employee more often than others have an untraditional arrangement. However, teacher
training at the lower university level increases the odds of equal sharing of paid work for women, even
though this is a typical female job in the public sector. Untraditional sharing is not particularly
common for women with a teacher training, though. This indicates that women with such
qualifications tend to work full time, but not very long hours.
Our assumption that small children imply more gender specialisation is clearly supported. Women
with children in the household tend to have more traditional sharing of paid labour than women with
no children present, and the tendency is particularly strong for those with the youngest children.
The expectation that equal or untraditional sharing of paid work is more common in younger than in
older age groups, is only partly supported. Looking at all respondents irrespective of the partners’
employment, we find that the youngest women (25-35 years of age) are less prone to work more than
their partner than are the older women. However, looking at couples where both partners have
employment as their main activity, women 45-54 years of age are somewhat less prone to work as
much as their partner than are the younger ones. If this association reflects differences between
generations, and not changes over the life course, we may expect more equal sharing of paid work in
the years to come. Being at least five years younger than her partner seems to involve more
untraditional sharing of paid work. This may be due to health problems among older partners that are
not captured by our health variable, or to older partners’ stronger support of their wife’s career.
The presumption of regional variation in couples’ sharing of paid work receives some support.
Women in the Northern part of the country more often than other women perform as much paid work
as their partner, and women in the Southern part of Norway (Agder) have less equal and less
untraditional sharing of paid work than women living elsewhere, although some of these latter effects
are only marginally significant. A larger sample would probably produce more significant results.
We believe that this paper provides new information on couples’ allocation of paid labour in Norway,
a topic that has previously received only modest attention in quantitative studies. However, there are
many questions left to be answered. Even though our statistical analyses give some hints, we cannot
disentangle the negotiations and considerations producing the observed patterns. We do not know
whether the partners would have preferred a different arrangement, and if so, which of them most
often has to accommodate his or her practice to the needs of their family or other circumstances. Such
30
questions can only be answered satisfactorily through qualitative studies. However, additional survey
information on the partners’ preferences would lead us a step further. It would also be useful with
more complete information on both partners’ education, and additional information on the job
characteristics of the partners.
Considering the good access to high-quality and affordable childcare in Norway for preschool children
as well as younger school children it is a paradox that a traditional allocation of paid work is still
widespread among parents with children in the household. Perhaps this indicates that many parents
find it too strenuous with two full-time jobs. If this is the case, it needs to be accounted for in estimates
of women’s future labour supply. It would be important to realize, then, that continuous full-time work
for both parents during the child-rearing years is not a realistic scenario for all couples, at least not in
all types of work. As long as pension credits and other work related entitlements are based on peoples’
working hours, it is also important for policy-makers to understand that the dual-earner model, which
is presupposed by much Norwegian social policy, is only practiced by a limited proportion of couples.
If women continue to restrict their paid work when children arrive, they continue to face the risk of
loosing out economically compared to their partners.
The analysis in this paper applies to a period with high economic activity in Norway. It cannot be
ruled out that we would get a somewhat different picture in times of economic recession. As
employees in many private sector jobs face higher risks of unemployment than employees in the
public sector, some couples would have to rely on the female part as the main provider. Hence,
economic recession may result in some couples involuntarily becoming unconventional sharers of paid
work.
It remains to be seen whether equal and unconventional sharing of market work will become more
common in Norway in the years to come. The gender segregated labour market seems to play an
important role in cementing traditional arrangements. As long as women and men continue to choose
different types of education, and typical female jobs are less well paid than typical male jobs, this
pattern may be hard to change. This is corroborated by the fact that many couples seem to find it too
exhausting with two full-time jobs. Moreover, as many typical male jobs require very high time inputs,
women may find it difficult to have a full-time job and at the same time shouldering most of the
family work. It is also important to remember that many families in Norway are now quite well off
economically and do not really need to have two full-times jobs. A part-time job for one of the spouses
may release time for leisure activities for all family members and thereby increase the quality of life.
31
Literature Abrahamsen, B. (2002) Heltid eller deltid? Kvinners arbeidstid i kvinnedominerte og mannsdominerte yrker. Rapport 2002:6, Oslo: Institutt for samfunnsforskning. Becker, G. (1991) A treatise on the Family. Cambridge: Harvard University Press. Bernardi, F. (1999) ‘Does the Husband Matter? Married Women and Employment in Italy’, European Sociological Review 15 (3): 285-300. Bittman, M., P. England, N. Folbre, L. Sayer, G. Matheson (2003) ‘When Does gender Trump Money? Bargaining and Time in Household Work’, American Journal of Sociology 109 (1): 186-214. Brunborg, H., B. Slagsvold and T. Lappegård (2009) ’LOGG 2007 - en stor undersøkelse om livsløp generasjon og kjønn’, Samfunnsspeilet 23 (1): 2-8. Dommermuth, L. and R. H. Kitterød (2009) ‘Fathers’ employment in a father-friendly welfare state. Does fatherhood affect men’s working hours?’ Community, Work and Family 12 (4): 417-436. Ellingsæter, A. L. and A. Leira (2006) ‘Epilogue: Scandinavian policies of parenthood – a success story?’, In A. L. Ellingæter and A. Leira (eds): Polticising Parenthoood in Scandinavia. Gender relations in welfare states (pp. 265-277). Bristol: The Polity Press. Ellingsæter, A. L., T. Noack and M. Rønsen (1994) ’Likestilling - et ideal for velutdannede kvinner?’, Samfunnsspeilet 8 (4): 7-10. Greenstein, T. N. (2000) ‘Economic dependence, Gender and the Division of Labour in the Home: A Replication and Extension’, Journal of Marriage and the Family 62 (May 2000): 322-335. Kitterød, R. H. (2002) ’Utdanning og ulikhet? En diskusjon av utdanningsnivåets betydning for deling av husarbeid blant småbarnsforeldre’, Sosiologisk tidsskrift 10 (3): 179-208. Kitterød, R. H. (2007): ’Far jobber nesten alltid mest. Arbeidstid blant par av foreldre’. In E. Kvande and B. Rasmussen (eds): Arbeidslivets klemmer. Paradokser i det nye arbeidslivet (291-309). Bergen: Fagbokforlaget. Kjeldstad, R. and E. H. Nymoen (2009) Part-time work, underemployment and gender. Worker versus job explanations. Discussion paper No. 602, Oslo: Statistics Norway, Research Department. Kjeldstad, R. and T. Lappegård (2009) ’Likestilling på hjemmebane: Mest fornøyd med delvis likestilling’, Samfunnsspeilet 23 (1): 52-57. Magnussen, M.-L., T. Stalberg Mydland and G. Kvåle (2005) Arbeid ute og hjemme: Sørlandske mødres valg og vurderinger. Rapport fra prosjektet Likestilling og arbeidsliv på Agder. Fou-rapport 5/2005, Kristiansand: Agdeforskning. Raley, S. B., M. J. Mattingly and S. M. Bianchi (2006) ‘How Dual Are Dual Income Couples? Documenting Change From 1970 to 2001’, Journal of Marriage and Family 68 (February): 11-28. Rønsen, M. and R. H. Kitterød (2009) ’Kvinners arbeidstid – avtalt og ønsket: Er kvinner fornøyd med arbeidstiden sin?’, Samfunnsspeilet 23 (4): 22-30.
32
Tyre, P. and D. McGinn (2003) ‘Se Works, He Doesn’t. The Latest Twists in Jobs and Family’, Newsweek 12th of May 2003. Skrede, K. (2004) ’Familiepolitikkens grense – ved ”likestilling light”?’ In A. L. Ellingsæter and A. Leira (eds) Velferdsstaten og familien. Utfordringer og dilemmaer. Oslo: Gyldendal akademisk (pp 160-200). Vaage, O. (2002) Til alle døgnets tider. Tidsbruk 1971-2002. SA no. 52, Oslo: Statistics Norway. Winkler, A. E., T. D. McBride and C. Andrews (2005) ‘Wives who outearn their husbands: A transitory or persistent phenomenon for couples?’, Demography 42 (3): 523-535.
33
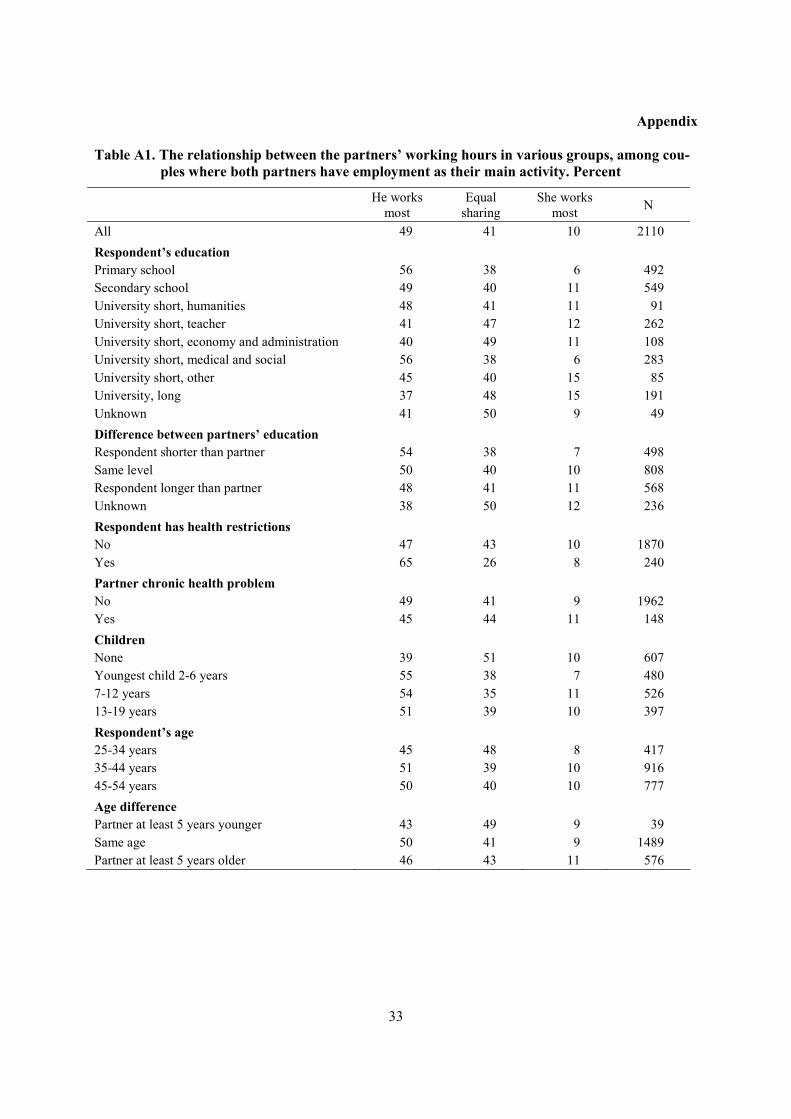
Appendix Table A1. The relationship between the partners’ working hours in various groups, among cou-
ples where both partners have employment as their main activity. Percent
He works most
Equal sharing
She works most N
All 49 41 10 2110 Respondent’s education Primary school 56 38 6 492 Secondary school 49 40 11 549 University short, humanities 48 41 11 91 University short, teacher 41 47 12 262 University short, economy and administration 40 49 11 108 University short, medical and social 56 38 6 283 University short, other 45 40 15 85 University, long 37 48 15 191 Unknown 41 50 9 49 Difference between partners’ education Respondent shorter than partner 54 38 7 498 Same level 50 40 10 808 Respondent longer than partner 48 41 11 568 Unknown 38 50 12 236 Respondent has health restrictions No 47 43 10 1870 Yes 65 26 8 240 Partner chronic health problem No 49 41 9 1962 Yes 45 44 11 148 Children None 39 51 10 607 Youngest child 2-6 years 55 38 7 480 7-12 years 54 35 11 526 13-19 years 51 39 10 397 Respondent’s age 25-34 years 45 48 8 417 35-44 years 51 39 10 916 45-54 years 50 40 10 777 Age difference Partner at least 5 years younger 43 49 9 39 Same age 50 41 9 1489 Partner at least 5 years older 46 43 11 576
34
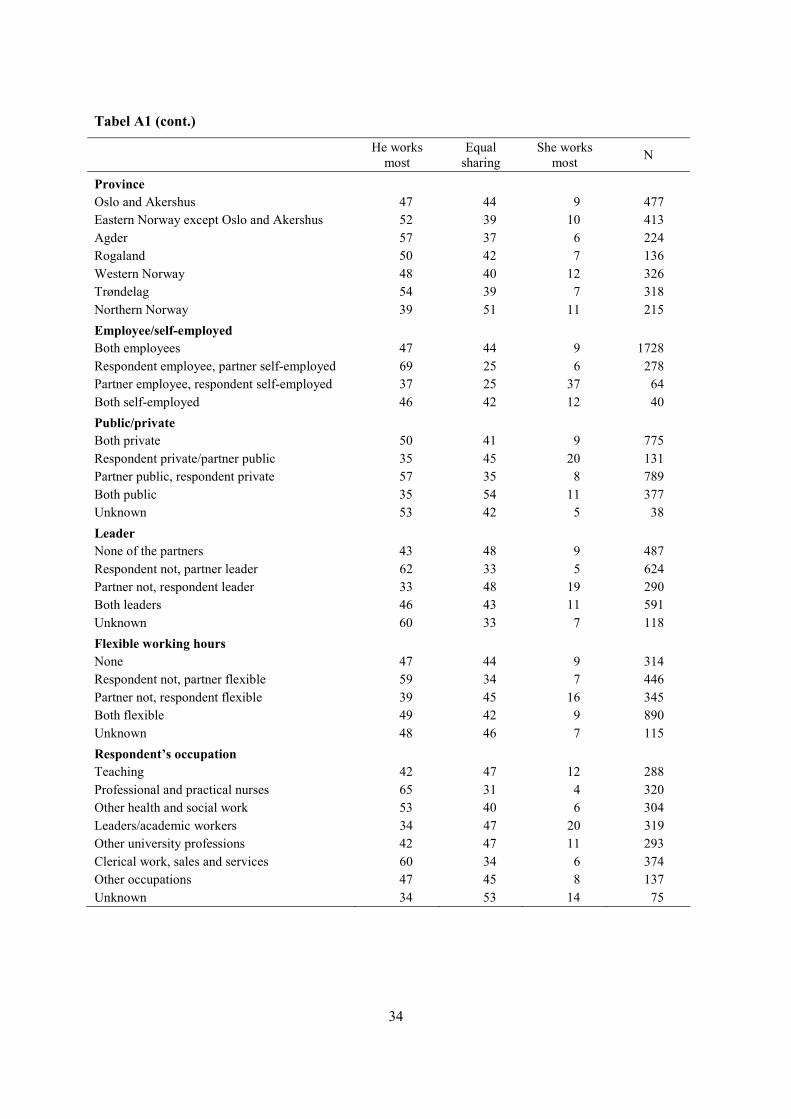
Tabel A1 (cont.)
He works most
Equal sharing
She works most N
Province Oslo and Akershus 47 44 9 477 Eastern Norway except Oslo and Akershus 52 39 10 413 Agder 57 37 6 224 Rogaland 50 42 7 136 Western Norway 48 40 12 326 Trøndelag 54 39 7 318 Northern Norway 39 51 11 215 Employee/self-employed Both employees 47 44 9 1728 Respondent employee, partner self-employed 69 25 6 278 Partner employee, respondent self-employed 37 25 37 64 Both self-employed 46 42 12 40 Public/private Both private 50 41 9 775 Respondent private/partner public 35 45 20 131 Partner public, respondent private 57 35 8 789 Both public 35 54 11 377 Unknown 53 42 5 38 Leader None of the partners 43 48 9 487 Respondent not, partner leader 62 33 5 624 Partner not, respondent leader 33 48 19 290 Both leaders 46 43 11 591 Unknown 60 33 7 118 Flexible working hours None 47 44 9 314 Respondent not, partner flexible 59 34 7 446 Partner not, respondent flexible 39 45 16 345 Both flexible 49 42 9 890 Unknown 48 46 7 115 Respondent’s occupation Teaching 42 47 12 288 Professional and practical nurses 65 31 4 320 Other health and social work 53 40 6 304 Leaders/academic workers 34 47 20 319 Other university professions 42 47 11 293 Clerical work, sales and services 60 34 6 374 Other occupations 47 45 8 137 Unknown 34 53 14 75
35
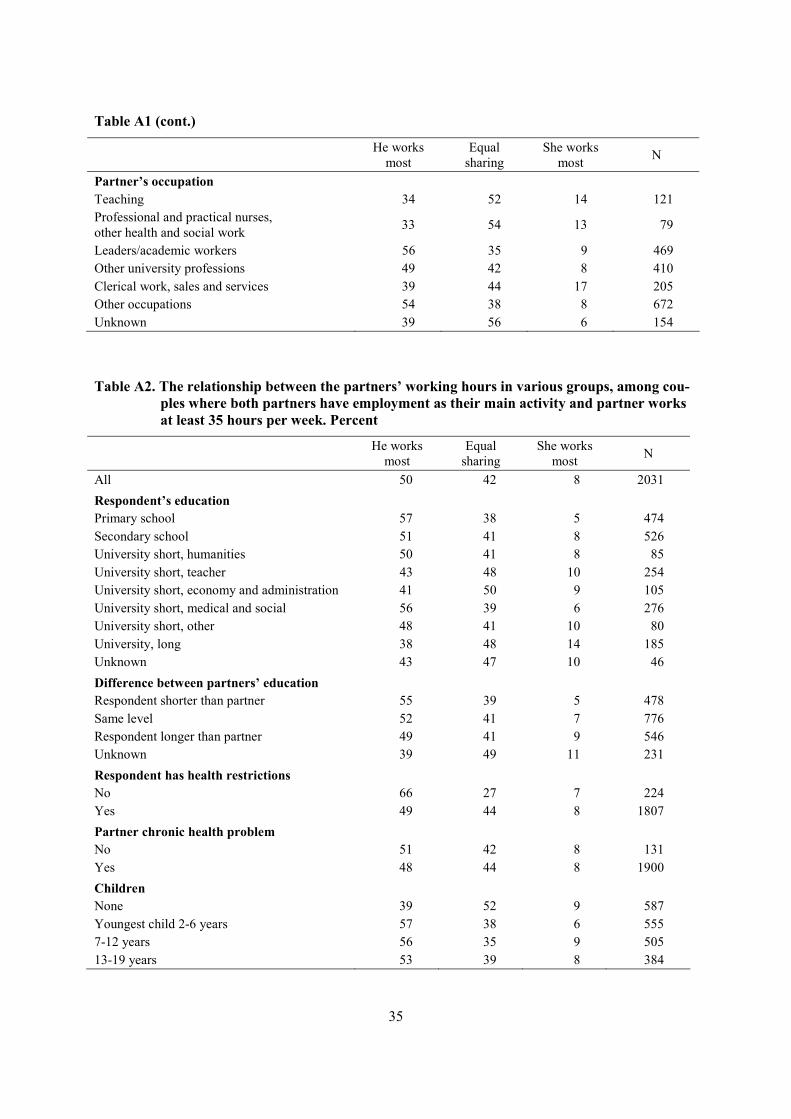
Table A1 (cont.)
He works most
Equal sharing
She works most N
Partner’s occupation Teaching 34 52 14 121 Professional and practical nurses, other health and social work 33 54 13 79
Leaders/academic workers 56 35 9 469 Other university professions 49 42 8 410 Clerical work, sales and services 39 44 17 205 Other occupations 54 38 8 672 Unknown 39 56 6 154
Table A2. The relationship between the partners’ working hours in various groups, among cou-ples where both partners have employment as their main activity and partner works at least 35 hours per week. Percent
He works most
Equal sharing
She works most N
All 50 42 8 2031 Respondent’s education Primary school 57 38 5 474 Secondary school 51 41 8 526 University short, humanities 50 41 8 85 University short, teacher 43 48 10 254 University short, economy and administration 41 50 9 105 University short, medical and social 56 39 6 276 University short, other 48 41 10 80 University, long 38 48 14 185 Unknown 43 47 10 46 Difference between partners’ education Respondent shorter than partner 55 39 5 478 Same level 52 41 7 776 Respondent longer than partner 49 41 9 546 Unknown 39 49 11 231 Respondent has health restrictions No 66 27 7 224 Yes 49 44 8 1807 Partner chronic health problem No 51 42 8 131 Yes 48 44 8 1900 Children None 39 52 9 587 Youngest child 2-6 years 57 38 6 555 7-12 years 56 35 9 505 13-19 years 53 39 8 384
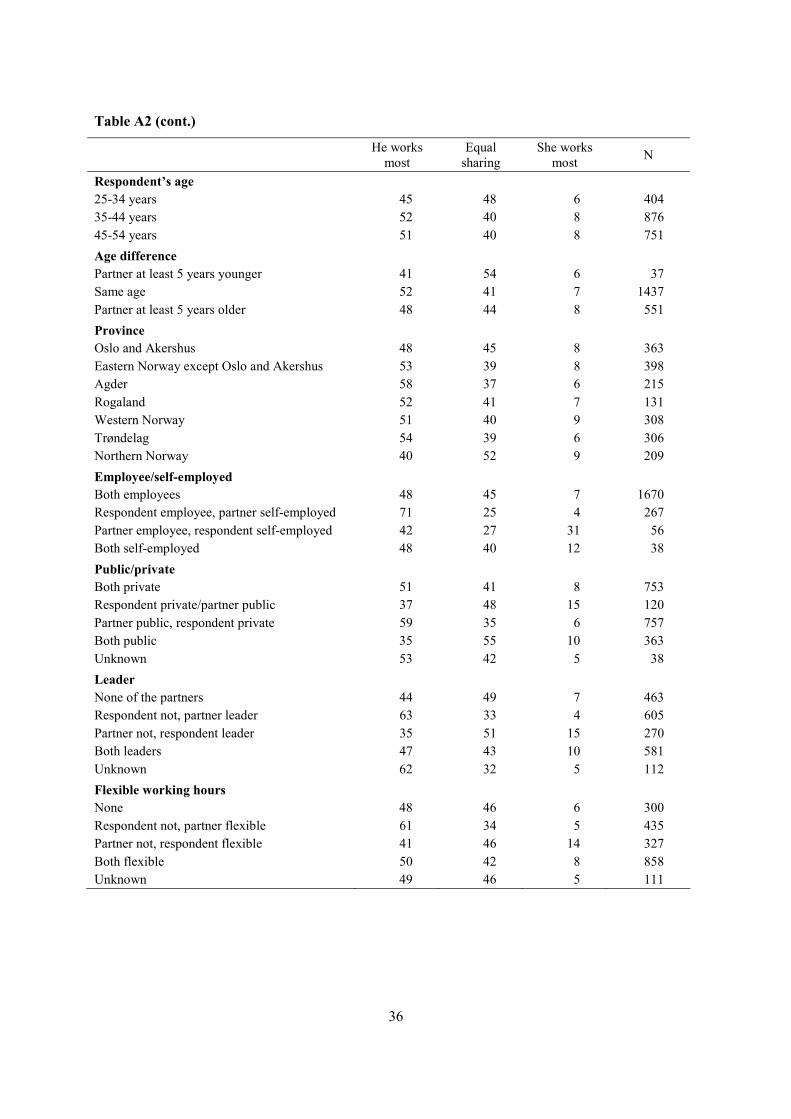
36
Table A2 (cont.)
He works most
Equal sharing
She works most N
Respondent’s age 25-34 years 45 48 6 404 35-44 years 52 40 8 876 45-54 years 51 40 8 751 Age difference Partner at least 5 years younger 41 54 6 37 Same age 52 41 7 1437 Partner at least 5 years older 48 44 8 551 Province Oslo and Akershus 48 45 8 363 Eastern Norway except Oslo and Akershus 53 39 8 398 Agder 58 37 6 215 Rogaland 52 41 7 131 Western Norway 51 40 9 308 Trøndelag 54 39 6 306 Northern Norway 40 52 9 209 Employee/self-employed Both employees 48 45 7 1670 Respondent employee, partner self-employed 71 25 4 267 Partner employee, respondent self-employed 42 27 31 56 Both self-employed 48 40 12 38 Public/private Both private 51 41 8 753 Respondent private/partner public 37 48 15 120 Partner public, respondent private 59 35 6 757 Both public 35 55 10 363 Unknown 53 42 5 38 Leader None of the partners 44 49 7 463 Respondent not, partner leader 63 33 4 605 Partner not, respondent leader 35 51 15 270 Both leaders 47 43 10 581 Unknown 62 32 5 112 Flexible working hours None 48 46 6 300 Respondent not, partner flexible 61 34 5 435 Partner not, respondent flexible 41 46 14 327 Both flexible 50 42 8 858 Unknown 49 46 5 111
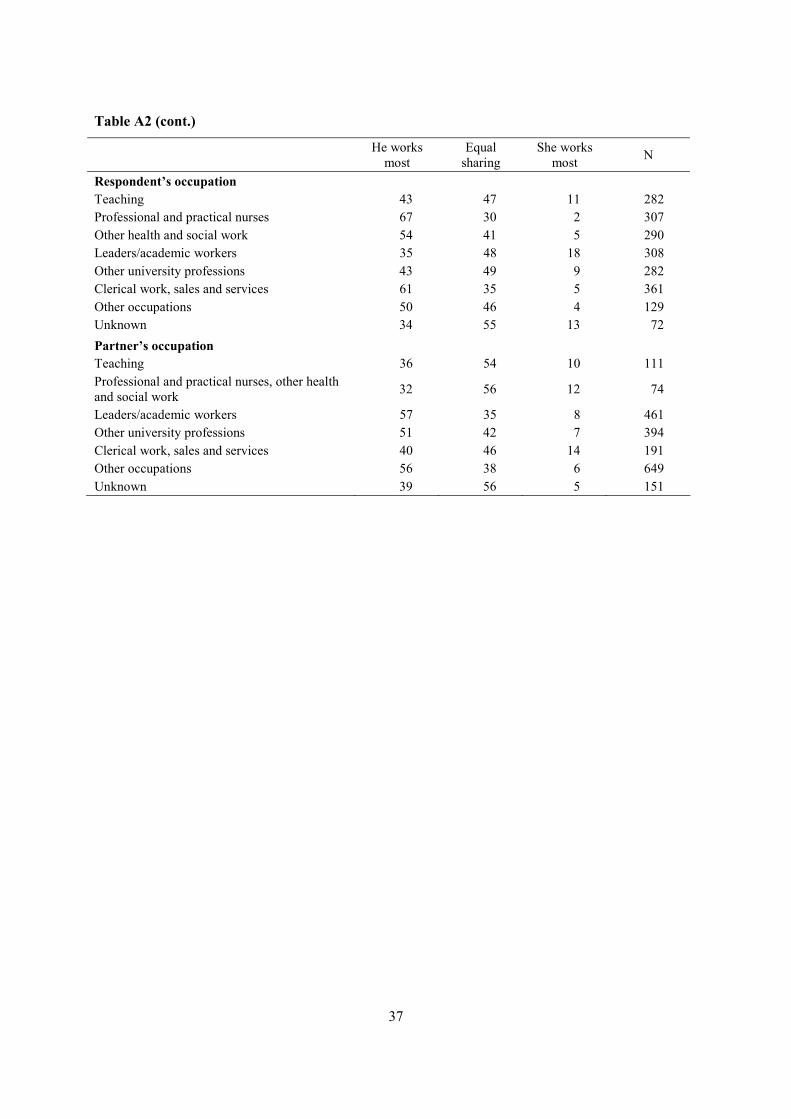
37
Table A2 (cont.)
He works most
Equal sharing
She works most N
Respondent’s occupation Teaching 43 47 11 282 Professional and practical nurses 67 30 2 307 Other health and social work 54 41 5 290 Leaders/academic workers 35 48 18 308 Other university professions 43 49 9 282 Clerical work, sales and services 61 35 5 361 Other occupations 50 46 4 129 Unknown 34 55 13 72 Partner’s occupation Teaching 36 54 10 111 Professional and practical nurses, other health and social work 32 56 12 74
Leaders/academic workers 57 35 8 461 Other university professions 51 42 7 394 Clerical work, sales and services 40 46 14 191 Other occupations 56 38 6 649 Unknown 39 56 5 151