radxunderserved populations (radx-up) return to school
TRANSCRIPT

RADx Underserved Populations (RADx-UP) Return to SchoolAugust Workshop August 9, 2021

2
AgendaTopic Speaker TimeWelcome & Introductions Dr. Alison Cernich 1:30pm
Overview of RADx-UP Initiative Dr. Eliseo J. Pérez-Stable 1:35 pm
Overview of the Return to School Initiative Dr. Alison Cernich 1:40 pm
Phase II Overview of Projects Dr. Sonia Lee 1:45 pm
COVID-19 and Children Dr. Shamez Ladhani 1:50 pm
HHS Partner Programs Angelica O’Conner (CDC)Dr. Matthew Humbard (HHS)Dr. Joseph Miller (HHS)
2:15 pm
RADx-UP Coordination and Data Collection Center (CDCC) Dr. Michael Cohen-Wolkowiez 2:45
Break All 3:00
Team Presentations Dr. Chris Lindsey 3:15 (15 minutes per team)
Closing Remarks Dr. Alison Cernich 5:15

3
RADx-UP Program
Eliseo J. Pérez-Stable, M.D.
Director, National Institute on Minority Health and Health Disparities (NIMHD)

4
Rapid Acceleration of Diagnostics (RADx) Initiative
RADx Tech – $908M*
Highly competitive, rapid three-phase challenge to identify the best candidates for at-home or point-of-care tests for COVID-19
RADx Underserved Populations (RADx-UP) – $533M
Interlinked community-engaged research projects focused on implementation strategies to enable and enhance testing of COVID-19 in vulnerable populations
RADx Radical (RADx-rad) – $187M
Develop and advance novel, non-traditional approaches or new applications of existing approaches for testing
RADx Advanced Testing Program (RADx-ATP) –$192M
Rapid scale-up of advanced technologies to increase rapidity and enhance and validate throughput — create ultra-high throughput laboratories and “mega labs”
Data Management Support – $70M
Build an infrastructure for and support coordination of the various data management needs of many of the COVID-19 efforts
At-Home Diagnostic Testing– $20M
Evaluate the effectiveness of existing diagnostic technologies and platforms in at-home environments
* Includes $185M in BARDA funds for development of RADx tests (funds were not transferred to NIH)

5
RADx-Underserved Populations (RADx-UP)
Overarching Goals
Enhance COVID-19 testing among underserved and vulnerable populations across the US
Develop/create a consortium of community-engaged research projects designed to rapidly implement testing interventions
Strengthen the available data on disparities in infection rates, disease progression and outcomes, and identify strategies to reduce these disparities in COVID-19 diagnostics
September – November 2020
Phase I
Build infrastructure
Rapidly implement testing, other capabilities
2021
Phase II
Integrate new advances
Expand studies/ populations

6
RADx-UP Strategies
• Expand capacity to test broadly for SARS-CoV-2 in highly affected populations, including asymptomatic persons only with tests with FDA Emergency Use Authorization. These may include self-test and saliva-based methods.
• Deploy surveys with Common data Elements that will be applied across all RADx projects plus additional survey items that are defined for RADx-UP consortium.
• Inform implementation of mitigation strategies based on isolation, testing and contact tracing to complement mask wearing and physical distancing to limit community transmission and maximize implementation of vaccines.
• Understand factors that contribute to COVID-19 disparities and implement interventions to reduce these disparities.
• Establish research and data infrastructure that could facilitate data sharing and current and future research questions

7
RADx-UP Phase I Snapshot: 69 Funded Research Projects and Coordination and Data Collection Center
NOT-OD-20-121, NOT-OD-20-120, NOT-OD-20-119Funded sites and research projects span a total of 31 states in addition to DC and Puerto Rico and include 55 institutions.
Puerto Rico
Projects include diverse health disparity population affected by COVID-19.
3
5
15
19
24
25
33
41
Native Hawaiians andother Pacific Islanders
Underserved RuralPopulations
Socioeconomicallydisadvantaged…
Sexual and GenderMinorities
American Indians/AlaskaNatives
Asian Americans
Blacks/African Americans
Hispanics/Latinos/as
Populations with Health Disparities
1
1

807/21/208
RADx-UP Return to School Diagnostic Testing Initiative
Alison Cernich Ph.D.Deputy Director,
Eunice Kennedy Shriver National Institute of Child Health and Human Development (NICHD)

907/21/20
RADx-UP Return to SchoolDiagnostic Testing Approaches
GoalDevelop and test COVID-19 diagnostic testing approaches to safely return children and staff to the in-person school setting in underserved and vulnerable communities.
MechanismOther Transaction Authority to provide flexibility for changing circumstances and funding of non-traditional partners
Approach• Focus on children and adolescents below the age eligible for vaccination via
Emergency Use Authorization (age 12+) and all school personnel
• Advance methods to integrate testing in return to or maintenance of in-person instruction
• Identify effective, scalable, and sustainable testing implementation strategies
Budget$50 million commitment from the OD congressional appropriation

10
Return to School Phase IOTA-21-004
Program Information: ~$33M awarded in Phase I; 8 sites
• Focus on children and adolescents below the age eligible for vaccination via Emergency Use Authorization (age 16) and all school personnel
• Advance methods to integrate testing in return to or maintenance of in-person instruction
• Identify effective, scalable, and sustainable testing implementation strategies, including in-school testing, in community pediatric primary care clinics, childcare centers, preschool, and school settings serving primarily underserved or disadvantaged children and their families.
Overview Awarded 8 projects in April FY21 Strategies for school-based settings to combine frequent testing with proven safety
measures to reduce the spread of COVID-19
11
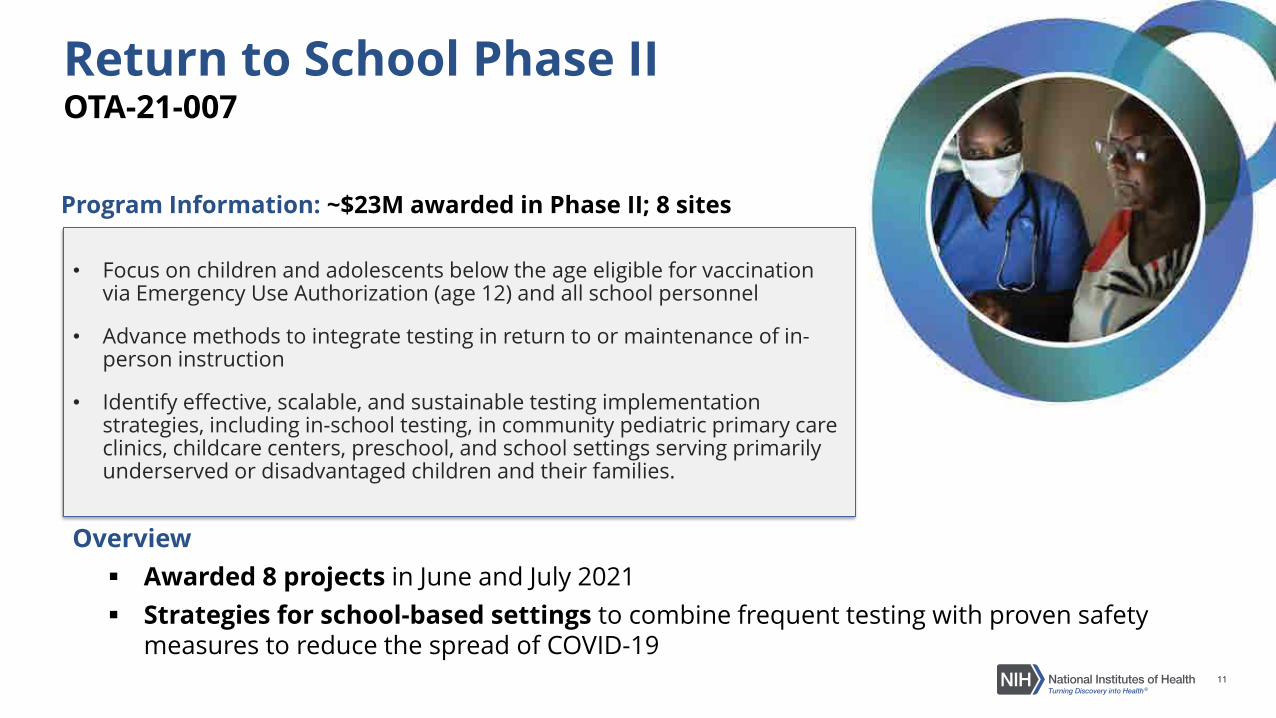
Return to School Phase IIOTA-21-007
Program Information: ~$23M awarded in Phase II; 8 sites
• Focus on children and adolescents below the age eligible for vaccination via Emergency Use Authorization (age 12) and all school personnel
• Advance methods to integrate testing in return to or maintenance of in-person instruction
• Identify effective, scalable, and sustainable testing implementation strategies, including in-school testing, in community pediatric primary care clinics, childcare centers, preschool, and school settings serving primarily underserved or disadvantaged children and their families.
Overview Awarded 8 projects in June and July 2021 Strategies for school-based settings to combine frequent testing with proven safety
measures to reduce the spread of COVID-19

12
Overview of Phase II Projects
Sonia Lee Ph.D.Eunice Kennedy Shriver National Institute of Child Health and Human
Development (NICHD)

Pre-decisional – Not for distribution 13
Applications Awarded during Phase IIPI INSTITUTION Project Title GEOGRAPHIC LOCATION
Inkelas University of California,Los Angeles
Impact of COVID-19 testing and mitigation on equitable return-to-school in the second largest US school district Los Angeles, California
Lee Arizona State University-Tempe Campus
Back to ECE Safely with SAGE: Reducing COVID-19 Transmission in Hispanic and Low-income Preschoolers Phoenix, Arizona
Okihiro University of Hawaiiat Manoa
Empowering schools as community assets to mitigate the adverse impacts of COVID-19 Hawaiian Islands
Gwynn University of MiamiSchool of Medicine
Maximizing Child Health and Learning Potential: How to Promote A School Culture of Safety in the era of COVID-19 Miami, Florida
McCulloh University of Nebraska Medical Center
Mobile Health-Targeted SARS-CoV-2 Testing and Community Interventions to Maximize Migrant Children's School Attendance
During the COVID-19 Pandemic
Buffalo, Hall and Adams Counties, Nebraska
Kiene San Diego State University Communities Fighting COVID!: Returning Our Kids Back to School Safely
South San Diego County, California
Wu University of UtahSCALE-UP Counts: A health information technology approach to increasing COVID-19 testing in elementary and middle schools
serving disadvantaged communitiesGranite School District, Utah
JohnsonJohns Hopkins University,
University of Maryland, Morgan State University
Social, ethical, and behavioral factors in the return to school among underserved communities in Maryland Baltimore, Maryland

Pre-decisional – Not for distribution 14
Geographic Distribution of Awarded Projects
FL
NM
DEMD
TX
OK
KS
NE
SD
NDMT
WY
COUT
ID
AZ
NV
CA
OR
KY
ME
PA
MI
VT
NHMA
RICT
VAWV
OHINIL
TN
SC
ALMS
AR
LA
IA
MN
NJ
GA
DC
AK
HI
Seattle
Tempe (x2)
St. Louis
Omaha
Kansas City
Miam
Miami
Los Angeles
Rochester
Baltimore (x2)
Madison
San Diego
Salt Lake City
Legend
Award Institution City
Phase I Awarded Site
Phase II Awarded Site
Phase I & II Awarded Sites
Honolulu

1507/21/20
Health Disparity and Vulnerable Populations
1
0
1
5
4
4
4
1
2
2
4
6
6
American Indians/Alaska Natives
Native Hawaiian and other PacificIslanders
Underserved Rural Populations
Black/African Americans
Asian Americans
Hispanics/Latinos/as
Low SES
Number of Projects
Populations with Health Disparities
Phase I Awards Phase II Awards
2
1
1
1
0
0
0
3
1
1
1
1
6
Children with IDD
Children (6-12yrs)
Children with Medical Complexities
Adolescents (13-17yrs)
Homeless Youth
Migrant Youth
Preschool Aged Children (3-5yrs)
Children and adolescents (6-17)
Number of Projects
Vulnerable Populations
Phase I Awards Phase II Awards
Note: There are projects working with multiple populations; the number of projects is not additive

1607/21/20
Educational Settings
1
2
1
1
4
4
5
4
1
5
6
7
7
0 2 4 6 8 10 12 14
Charter Schools
Special Education
Tribal schools
Early Childhood Education Sites
High School
Elementary
Middle School
Public Schools
Phase I Awards Phase II Awards
Note: There are projects working with multiple populations; the number of projects is not additive

COVID-19 & ChildrenWhat have we learnt so far?
Dr Shamez LadhaniPaediatric Infectious Diseases ConsultantEmail: [email protected]
Twitter: @shamezladhani

Impact of School Closures on children• Educational development• Emotional development• Social development• Physical activity• School meals• Child protection & social services• School vaccinations
18

Risk of SARS-CoV-2 Infection
Children vs Adults

Children as likely to be infected as adults
20

Antibody Seroprevalence in a New York City Hospital
21 Yang et al. JAMA Network Open. 2021;4(3):e214302. doi:10.1001/jamanetworkopen.2021.4302

Antibody Seroprevalence in a New York City Hospital
• Antibody levels in children decline with age and then increase in adults
IgG antibody titres by age
22 Yang et al. JAMA Network Open. 2021;4(3):e214302. doi:10.1001/jamanetworkopen.2021.4302

Antibody Rates IgG antibody titre RBD antibody titre
Neutralising antibody Antibody avidity
23 Yang et al. JAMA Network Open. 2021;4(3):e214302. doi:10.1001/jamanetworkopen.2021.4302

sKIDsCOVID-19 Surveillance in School
Kids
192 Primary Schools Contacted
138 Primary Schools recruited• Weekly Swabs: 89• Bloods & Swabs: 49
Participants recruited:
>12,000 staff & students

Infection rates in primary and secondary schools
• Early studies showed lower infection rates in children vs adults:
• Children less likely to be exposed than adults
• Symptoms-based testing• PCR-testing
• More recent antibody studies show similar seropositivity in adults and children
Primary Schools
Secondary Schools
25

Higher Antibody titres in Children than Adults
Children retain higher antibodies than adults >6 months after SARS-CoV2 infection:
• Spike • Nucleocapsid• RBD• N-terminal domain
26 Dowell et al. unpublished data
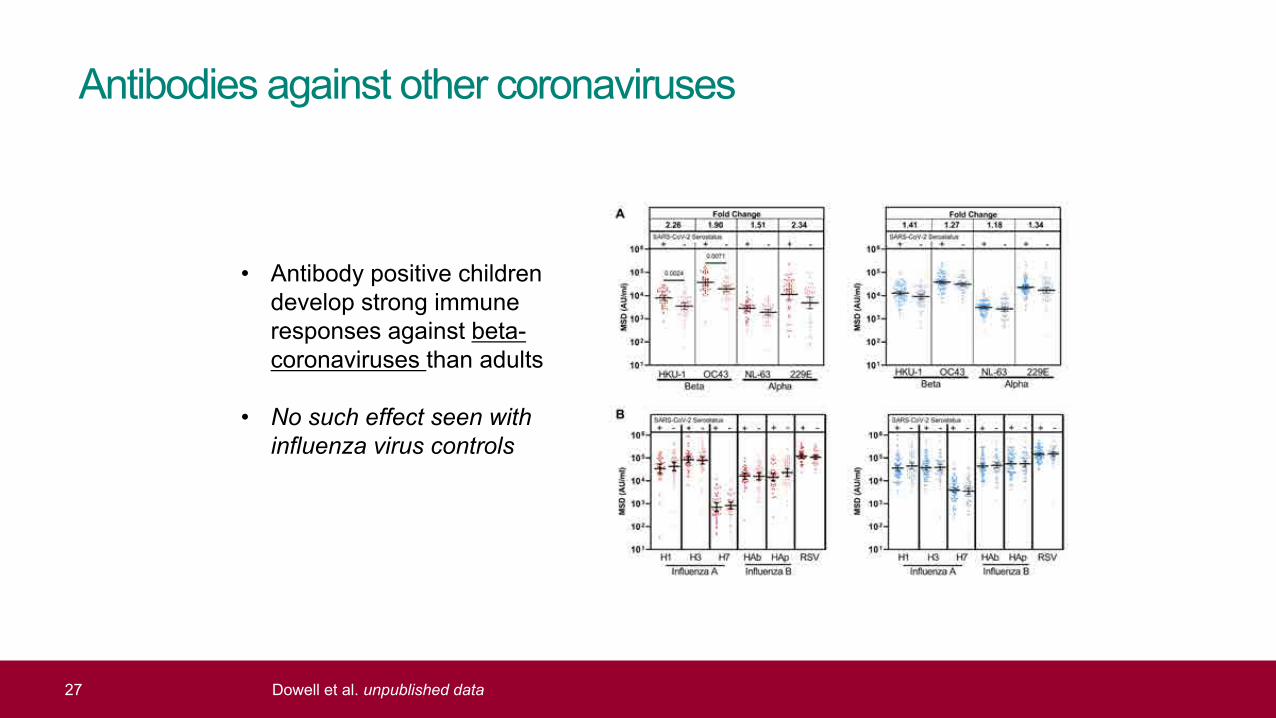
Antibodies against other coronaviruses
• Antibody positive children develop strong immune responses against beta-coronaviruses than adults
• No such effect seen with influenza virus controls
27 Dowell et al. unpublished data

Cellular responses in seropositive children
• Elispot responses to Spike were 86% (32/37) of seropositive children vs 69% (45/64) of seropositive adults
• Magnitude of cellular response against spike was 2.1-fold higher in children (p=0.0003)
28 Dowell et al. unpublished data
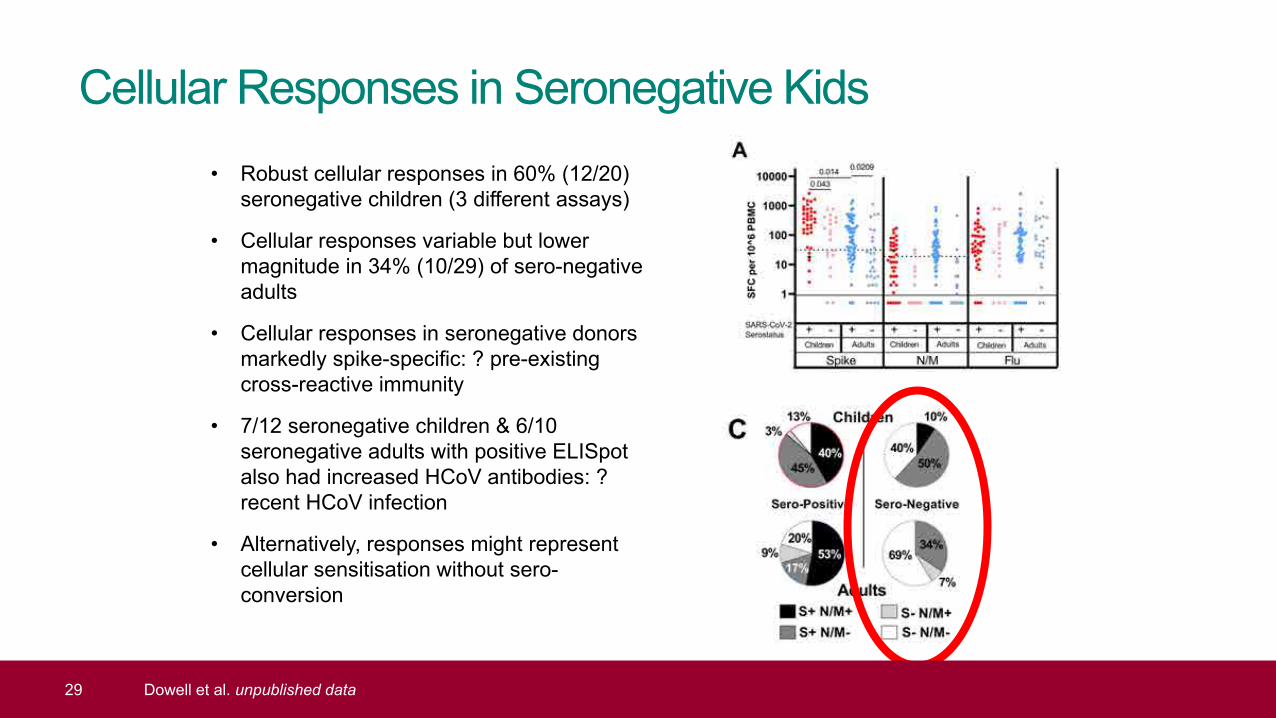
Cellular Responses in Seronegative Kids• Robust cellular responses in 60% (12/20)
seronegative children (3 different assays)
• Cellular responses variable but lower magnitude in 34% (10/29) of sero-negative adults
• Cellular responses in seronegative donors markedly spike-specific: ? pre-existing cross-reactive immunity
• 7/12 seronegative children & 6/10 seronegative adults with positive ELISpot also had increased HCoV antibodies: ? recent HCoV infection
• Alternatively, responses might represent cellular sensitisation without sero-conversion
29 Dowell et al. unpublished data

Antibody persistence in Seropositive Kids
• After 6 months, children have better antibody persistence than adults, possibly because they start with higher antibodies
30 Dowell et al. unpublished data

Infection Trends in School-aged Children

Trends in school-aged children
32

Weekly SARS-CoV-2 infection rates in children: Correlation with Community Rates (England)
Low Community Transmission Week High Community Transmission Week
33
Schools Reopening during national lockdown
(March 2021)

Schools Reopening (March 08-31, 2021)
35

Schools Reopening: Hospitalisations by age
36
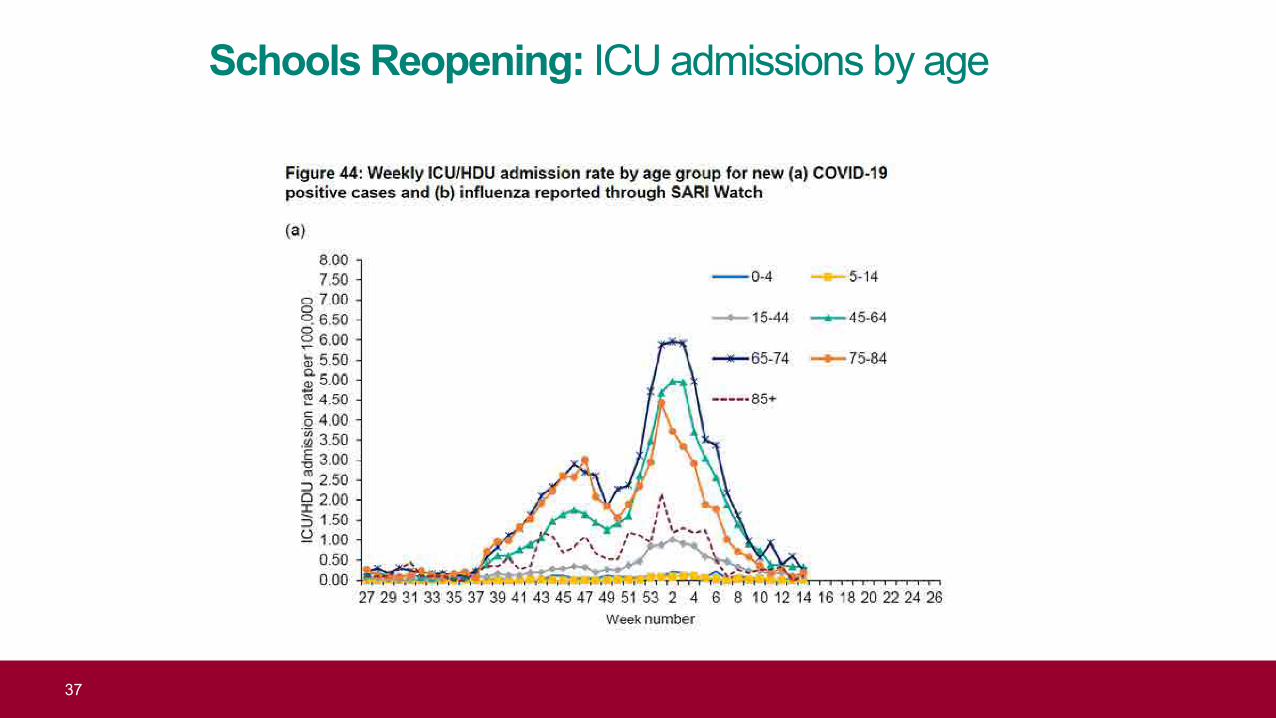
Schools Reopening: ICU admissions by age
37

Schools Reopening 2: 19 April 19 – 08 May, 2021
38
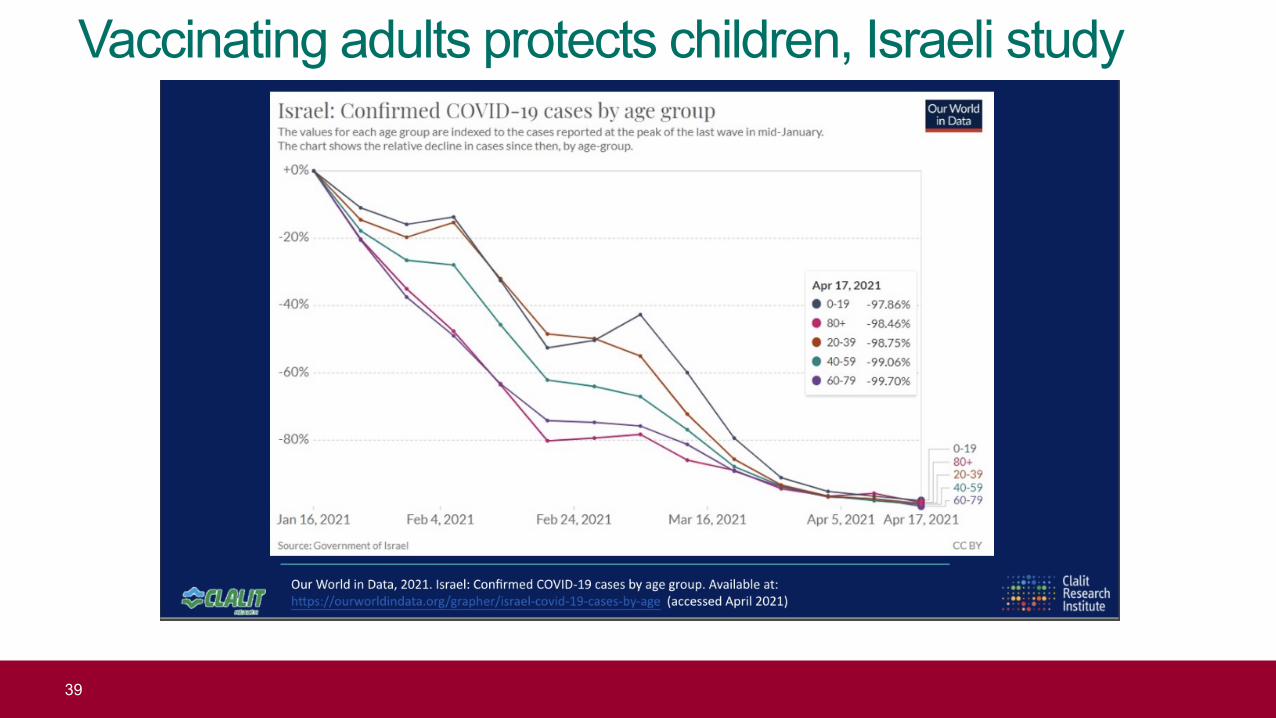
Vaccinating adults protects children, Israeli study
39

Infection rates in children who continued to attend school with daily LFD testing were similar compared to those who were sent home to self-isolate
• Infection rates in children who continued to attend school with daily LFD testing were similar compared to those who were sent home to self-isolate (<2%)
• Not powered to detect improvement in school attendance rates but logical?
40

Secondary attack rates in primary and secondary school bubbles
Secondary attack rate in students:
* 10.0% (6/60) primary * 3.9% (4/102) secondary
Secondary attack rate in staff:* 6.3% (1/16) primary* 0% (0/1) secondary
Household contacts of students:
* 6.6% (12/183) primary* 3.5% (11/317) secondary
Household contacts of staff: * 3.7% (1/27) primary* 0% (0/1) secondary
41
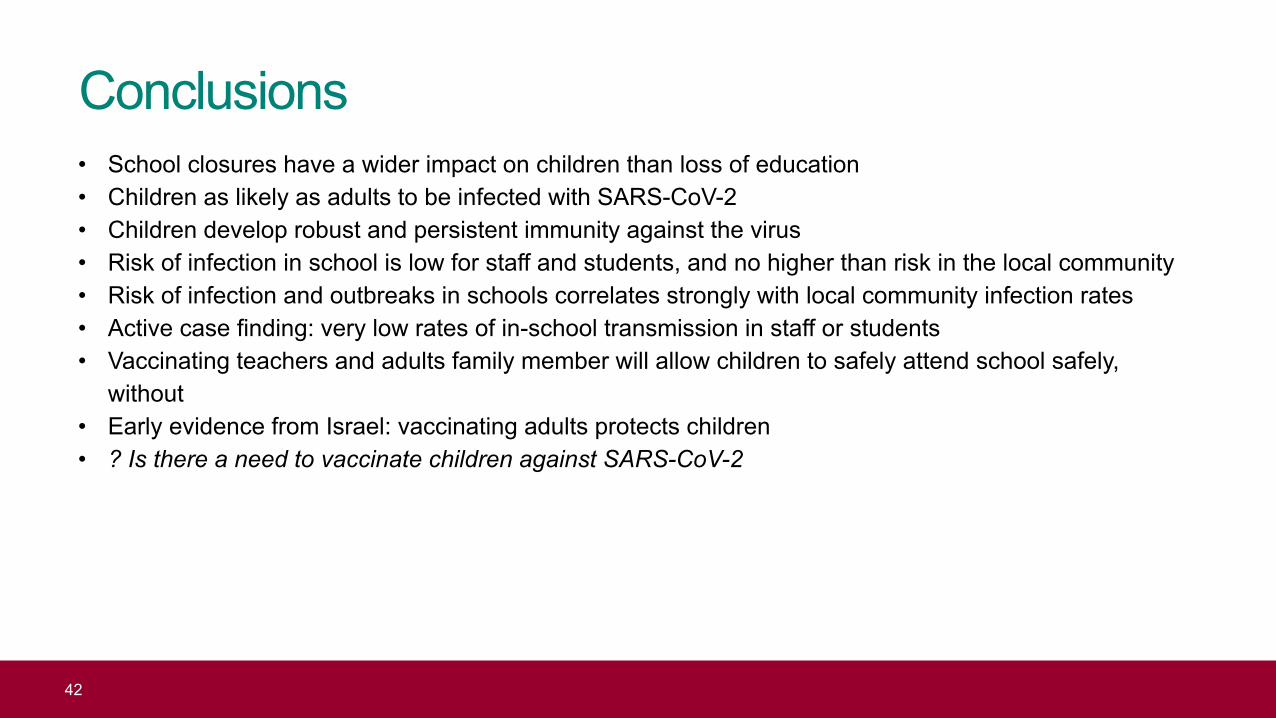
Conclusions• School closures have a wider impact on children than loss of education• Children as likely as adults to be infected with SARS-CoV-2• Children develop robust and persistent immunity against the virus• Risk of infection in school is low for staff and students, and no higher than risk in the local community • Risk of infection and outbreaks in schools correlates strongly with local community infection rates• Active case finding: very low rates of in-school transmission in staff or students• Vaccinating teachers and adults family member will allow children to safely attend school safely,
without • Early evidence from Israel: vaccinating adults protects children • ? Is there a need to vaccinate children against SARS-CoV-2
42
AcknowledgementsSKIDs Investigators: Frances Baawuah, Joanne Beckmann, Ifeanichukwu Okike, Shazaad Ahmad, Joanna Garstang, Andrew J Brent, Bernadette BrentsKIDs Team: Felicity Aiano, Zahin Amin-Chowdhury, Louise Letley, Oliver Martin, Jessica Flood, Emily-Jane Picton, Samuel Jones, Anna Mensah, Paul Charter, Corinne Whillock, Deborah Cohen, Kim Taylor, Johanna Bosowski, Yves-Pearl Hurley, Cherstyn Hurley, Francine Stalham, Hiran Hirani, Alpa ShahPHE Statisticians: Jemma Walker, Nick AndrewsPHE Immunisation and Countermeasures Division: Vanessa Saliba, Gayatri Amirthalingam, Jamie Lopez Bernal, Michael Lattimore, Kevin Brown, Mary RamsayPHE Virus Reference Department: Maria Zambon, John Poh, Shabnam Jamarani, Andrew Mumford, Neil Woodford, Steve HarbourPHE Manchester: Ray Borrow, Ezra LinleyBirmingham: Paul Moss, Alexander Dowell
43

Girl with COVID-19 warrior sign

sKIDsCOVID-19 Surveillance
in Primary School Kids

Girl getting a COVID serology test

Seroconversion in primary school staff and students
47

sKIDsPLUSCOVID-19 Surveillance
in Secondary School Students

sKIDsPLUS:
COVID-19 surveillance in
Secondary Schools
Seroconversion rates in staff and
students
49

COVID-19 outbreaksin Educational Settings
after full reopening of schools(September – October 2020)

Outbreaks in Educational Settings
51

Outbreaks in Educational Settings
• Full reopening of all preschool, primary school and secondary school years in September 2020
• Outbreak investigation during first half-term (31 August - 18 October 2020)
• 969 primary (n=450) & secondary school outbreaks (n=519) reported to PHE 3% of primary schools and 15% of secondary schools in England.
• 369 schools contacted in November 2020 190 geographically-representative schools completed questionnaire; 2,425 cases reported.
52

Size of outbreaks
53

Attack Rates in Students and staff
54

Index Case in Outbreaks
55
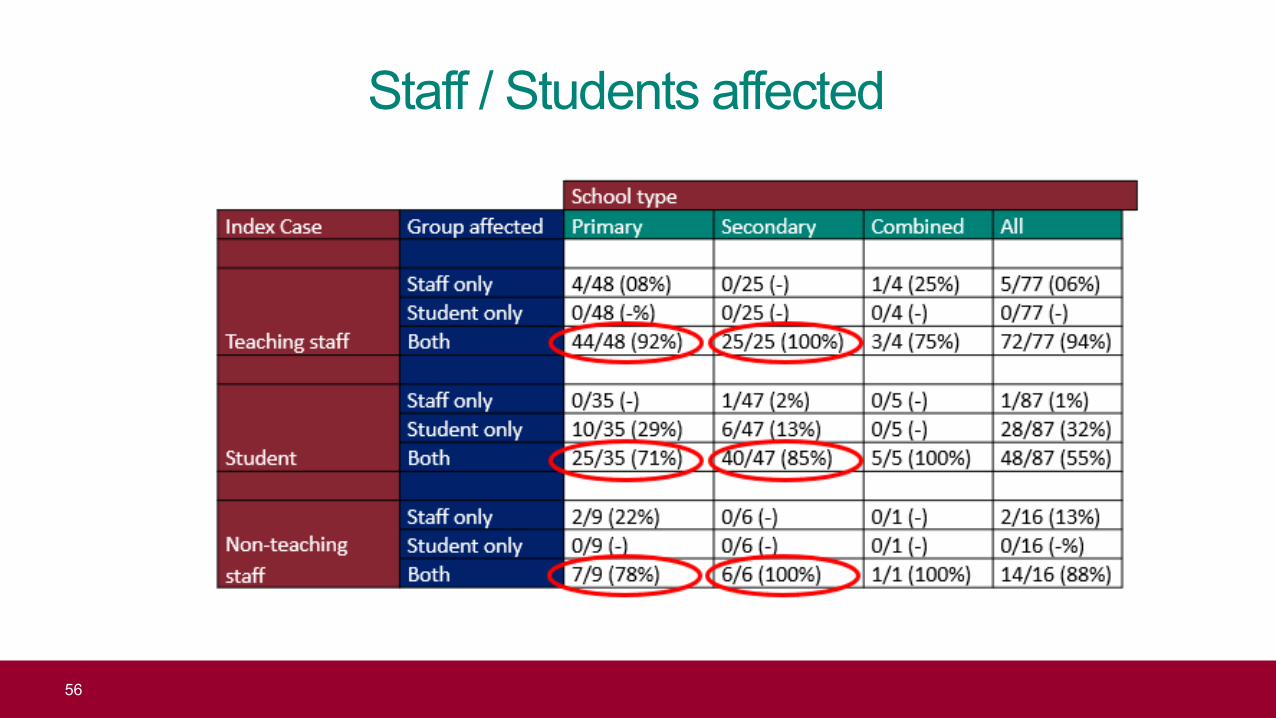
Staff / Students affected
56

Serological studies in Educational Settings
Lachassinne, • 327 children, 197 staff, 164 controlsFrance (Jun-Jul 2020) • 3·7% (1·3–6·8), children, 6·8% (3·2-11·5) staff, 5·0% adult contols – children most 22 daycare centres likely exposed to household adult with COVID-19 (43% vs 19; RR 7·1 [2·2-22·4).
• ol adults
Ladhani • 5.6% (19/340; 3·4-8·6) children vs. 4·8% (36/745; 3·4–6·6) staff seroconvertedEngland (Jun-Dec 2020) • Seropositivity not associated with school attendance during lockdown or staff 45 primary schools contact with students in school
Ladhani • 2,209 participants: 1,189 (53.8%) students & 1,020 (46.2%) staffEngland (Sep-Dec 2020) • SARS-CoV-2 infection rates similar in staff & students, and national prevalence18 secondary schools • 8.3% (53/641) staff vs. 6.5% (35/542) students seroconverted (p=0.24).
57

SARS-CoV-2 Transmission in Schools
Buonsenso, Italy 1,350 (1,059 students, 145 teachers,146 others) had COVID-19 1,212/65,104 (1.8%) schools affected>90% had only 1 case in school, only 1 high school had >10 cases 192 (15.8%) schools closed entirely, esp nursery/kindergartens
Larosa, Italy SARS-CoV-2 transmission in 41 classes of 36 schoolsSecondary attack rate was 3.2%, reaching 6.6% in middle/high schools. More timely isolation and testing of classmates reduce transmission
Zimmerman, 11 school districts, >90,000 students and staff attending school in-person for 9 weeksNorth Carolina, 773 community-acquired SARS-CoV-2 infectionsUSA Only 32 additional infections identified through contact tracing that were acquired in school
Falk 17 rural Wisconsin schools, 4,876 students & 654 staff (August 31–November 29, 2020)Wisconsin Incidence (3,453/100,000) lower than in the county overall (5,466 per 100,000).USA Of 191 cases in students/staff, only 7 (3.7%), all among students, linked to in-school spread
Varma, COVID-19 prevalence in public schools similar or less than community rates (Oct-Dec 2020)New York Of 36,423 school-based close contacts, only 191 (0.5%) subsequently tested positive USA Likely index case was an adult for 78.0% of secondary cases.
RIVM, Just over half the cases in secondary school clusters were acquired outside school, Netherlands Mainly during intensive contact with friends or classmates in their free time
Most infections restricted to small groups of students without affecting teachers
58

SISSchool Infection Survey
(PHE, ONS, LSHTM)
- 12,204 participants (5,114 staff; 7,089 pupils) - 121 Primary (41) & Secondary (42) Schools-- 7,751 both rounds (3,322 staff; 4,429 pupils)

SARS-CoV-2 antibodies in School Staff
12.63% of primary staff12.27% of secondary staff
14.61% of primary staff15.72% of secondary staff
Covid-19 Infection Survey, working age population same local authorities • 12.51% (November)• 18.22% (December)

Long COVID in Children

COVID effect on the body
• After symptomatic or asymptomaticinfections
• After confirmed or suspectedCOVID-19
• Persistent• Intermittent• Relapsing• New onset
Lopez-Leon et al. MedRxiv20 January 2021: doi: https://doi.org/10.1101/2021.01.27.21250617

Office for National Statistics, UK (March 2021)
Over the four-week period ending 6 March 2021, an estimated 1.1 million people in private households in the UK were experiencing self reported long COVID.
“Would you describe yourself as having ‘long COVID’, that is, you are still experiencing symptoms more than 4 weeks after you first had COVID-19, that are not explained by something else?”
Reference: Prevalence of ongoing symptoms following coronavirus (COVID-19) infection in the UK - Office for National Statistics (ons.gov.uk)

Illness duration and symptom profiles
• 1,734 children with confirmed COVID-19
• Median illness duration: 6 days (vs. 3 days in test-negative children)
• Positive association between illness duration and increasing age (p<0.0001)
• 77 (4.4%) had illness ≥28 days ( older >younger children; 5.1% vs. 3.1%; p=0.046)
• Commonest symptoms: fatigue (84%), headache (80%) & anosmia (80%);
• At 56 days, 1.8% had persistent symptoms vs. 0.9% of controls
64

PIMS-TS / MIS-C in Children

Hyperinflammatory syndrome, UK
66
0
5000
10000
15000
20000
25000
30000
0
10
20
30
40
50
60
02-Mar 09-Mar 16-Mar 23-Mar 30-Mar 06-Apr 13-Apr 20-Apr 27-Apr 04-May 11-May 18-May 25-May 01-Jun 08-Jun 15-Jun
Num
ber of laboratory confirmedSAR
S-CoV-2 cases
Num
ber o
f PIM
S/Ka
was
aki/T
SS c
ases
Week of onset (PIMS/Kawasaki/TSS) / Week of sample date (SARS-CoV-2)
Case curves for SARS-CoV-2 and PIMS/Kawasaki/TSS cases
PIMS/KD/TSS cases Laboratory confirmed SARS-CoV-2 cases

Latent Class analysis, PIMS cases
67

Supporting implementation of screening testing in K-12 schools
Angelica O’Connor, MPH ELC Program Coordinator
Division of Preparedness and Emerging Infections
National Center for Emerging and Zoonotic Infectious Diseases
cdc.gov/coronavirus

National Center for Emerging and Zoonotic Infectious Diseases (NCEZID)

National Capacity Building Cooperative Agreement
Mission: To build the governmental public health system capacity for emerging infectious disease prevention, detection, response, and control.
ELC supports the nation State Health Departments = 50 Largest Local Health Departments = 6 Territories and affiliates = 8
Customer-service focus
https://www.cdc.gov/ncezid/dpei/elc/elc-recipient-history.html

Federal COVID funding and impact on ELC budget
Coronavirus Aid Relief and Economic Security Act (CARES Act)
Paycheck Protection Program and Health Care Enhancement Act
Coronavirus Preparedness and Response Supplemental Appropriations Act
Coronavirus Response and Relief Supplemental Appropriations Act
American Rescue Plan Act
$200 Million
$42 Billion

ELC Reopening Schools award
$10 billion to 64 ELC recipients from American Rescue Act Plan of 2021
Comprehensive screening testing for K-12 schools (public, charter, and private) 2020-2021 School year
Spring: immediate implementation of pilot school screening testing where possibleSummer: summer school, camps and planning for Fall
2021-2022 School year: Fall: Widespread screening testing implemented in schoolsSummer: Funding period ends 7/31/22

Technical Assistance: School Support Section and ELC
One-on-one calls with jurisdictions Rockefeller STAT K-12 Calls Bi-weekly Community of Practice Calls Targeted regional and topical calls Communication toolkit in development

Initial K-12 Plans for screening testingTe
stin
g Ap
proa
ches BinaxNOW
antigen test expansion
Pooled specimen (class and lab)
NAAT/PCR
Saliva and home-based testing
Vend
ors Majority to use
vendor(s)
Turnkey solutions
Menu of options
ICATT
Operation ET Scho
ol C
oord
inat
ion Centralized
coordination
Decentralized

Challenges
School Participation Schools overwhelmed by numerous priorities For schools that stayed open, uncertainty of the need for screening testing Lack of support from parents, community members, state/local government Continued concern about testing being painful for students
Trade offs Example: Dropping distancing requirements and the need for close contacts
to quarantine if schools achieve a certain percentage of participation in screening testing program

Feedback from recipientsAlternatives to full screening testing implementation Only providing screening testing at high-risk sports or events Testing for surveillance purposes Limiting screening testing to a particular subset of students (e.g., those living
and going to school in a confinement setting for youths)
Common feedback and requests
Diagnostic testing Ventilation upgrades Vaccination promotion

Integrating feedback: Updated ELC Reopening Schools
Focus remains on screening testing as a critical layer of protection against the spread of COVID-19 in K-12 setting
Scope broadened and/or explicitly allows for: Diagnostic testing Testing events at school that may include family and/or community
members (e.g., athletic events) PPE Portable HEPA filtration units or fans
Description of current plan for the Fall and how districts may scale based on community transmission levels
https://www.cdc.gov/ncezid/dpei/pdf/guidance-elc-reopening-schools-508.pdf

Next steps

For more information, contact CDC1-800-CDC-INFO (232-4636)TTY: 1-888-232-6348 www.cdc.gov
The findings and conclusions in this report are those of the authors and do not necessarily represent the official position of the Centers for Disease Control and Prevention.

HHS Confidential Information – For Official Use Only – Not to be Disseminated
INFORMATION NOT RELEASABLE TO THE PUBLIC UNLESS AUTHORIZED BY LAW: This information has not been publicly disclosed and may be a privileged, confidential, deliberative, and/or pre-decisional communication. It is for internal government use only and must not be disseminated, distributed, or copied to persons not authorized to receive the information. Unauthorized disclosure may result in prosecution to the full extent of the law.
Operation Expanded Testing
HHS Testing and Diagnostics Work Group
Dr. Matthew Humbard | Operation E.T. Program Lead
AUGUST 2021

81
FOR OFFICIAL USE ONLY – DO NOT DISTRIBUTE
DRAFT – PRE-DECISIONAL & DELIBERATIVE
Testing and Diagnostics Working Group (TDWG) administers 2 testing programs focused on support of vulnerable and underserved groups
Focus for today
1 Testing Programs
Operation Expanded Testing (Op ET):
• Provides no-cost testing to K-8 schools and underserved congregate settings
• Manages testing through regional "coordination hubs"
Increasing Community Access to Testing (ICATT):
• Provides no-cost testing to underserved populations
• Operates in pharmacies, schools, surge & pop-up sites, hot spots, and priority surveillance locations
2 Procurement & Distribution
Direct Procurement:• Purchases constrained (Binax)
or novel (Ellume) supplies and distributes to target groups
Federal Supply Schedule (FSS):• Supports the addition of tests
to the FSS
Supply Exchange: • Offers a forum for orgs. to ask
for or offer up testing supplies
Strategic National Stockpile (SNS):• Builds and stores the national
testing supply stockpile
3 Information Exchange
Industry Engagement: • Engages with MFRs and labs
to assess testing landscape and monitor supply trajectory
State Engagement:• Enable visibility across TDWG
of state specific testing issues• Assists with SW border
migration testing needs
Data Analytics & Informatics:• Creates automated diagnostic
test reporting systems• Synthesizes federal and state
data into cohesive analysis

82
FOR OFFICIAL USE ONLY – DO NOT DISTRIBUTE
DRAFT – PRE-DECISIONAL & DELIBERATIVE
OpET objective to expand COVID testing for schools, underserved populations and congregate settings via coordination hubs
U.S. VirginIslands
Puerto Rico
Columbus, Ohio
West Midwest
South
Valencia, California
Alexandria, VAfor South and NE regions
Northeast
Program highlights
• Operation E.T. is divided into 4regions served by 3 coordinationhubs, with USG oversight acrossthe entire program
– West - Perkin Elmer– Midwest – Battelle– Northeast – Eurofins– South - Eurofins
• Screening services provided atno-cost to schools and otherqualifying sites (e.g., homelessshelters, women's shelters,prisons, HBCUs, congregatesettings with high SVIs etc.)
• Coordination hubs work withenrolled sites to create tailoredtesting plan

83
FOR OFFICIAL USE ONLY – DO NOT DISTRIBUTE
DRAFT – PRE-DECISIONAL & DELIBERATIVE
Coordination hubs connect testing laboratories with qualifying sites to rapidly establish COVID-19 screening services
Illustrative view of partnership model
ReportResults
State and local health organizations
4
ReportResults
Collect and test samples
Request testing services
Assign basedon capacity
Coordination hub
Labs with excess capacity1
Schools and Local Gov’t for the underserved
4
3
21
1. Patient specific results from non-CLIA certified laboratory cannot be reported to individuals or health care providers, but population-level aggregate results may be reported to public health agencies

84
FOR OFFICIAL USE ONLY – DO NOT DISTRIBUTE
DRAFT – PRE-DECISIONAL & DELIBERATIVE
Hub testing approaches vary by hub, but all will leverage PCR testing with <72h turnaround
West Midwest Northeast/South
Test type PCR, Antigen1
Nasal
PCR, Antigen1
Nasal, Saliva TBD
PCR, Antigen1
Nasal
Pooling approach
Not pooled 5–10 samples 5–24 samples
Turn around time targets
<48 hours for tests
24 hours (for neg. pools)
48 - 72 hours (for pos. pools)
24 hours (for neg. pools)
30 - 48 hours (for pos. pools)
1. Antigen used for select populations only (e.g., screening of symptomatic participants to minimize positive pools, if common carrier shipments are not possible)
-

85
FOR OFFICIAL USE ONLY – DO NOT DISTRIBUTE
DRAFT – PRE-DECISIONAL & DELIBERATIVE
Examples of enrolled sites from various states
U.S. VirginIslands
Puerto Rico
1
2
3
4
5
1 NevadaClark County Fire DeptBoys and Girls ClubNevada YMCA
2 Hawaii3 K-12 schoolsCorrectional facilitiesCongregate settings
3 Arkansas26 prisons via AR Dept of Corrections
4 Indiana70+ schools6 shelters
5 New YorkBuffalo School District
Anticipate greater number of school
enrollments in upcoming weeks as
more school decision makers return from
summer recess

86
FOR OFFICIAL USE ONLY – DO NOT DISTRIBUTE
DRAFT – PRE-DECISIONAL & DELIBERATIVE
Cumulative # tests, total 0 1.9M 8.8M 21.2M 35.5M
Hubs project testing to increase rapidly once schools begin starting in August
1,300
500
1,000
250
0
1,500
750
1,250
July
Projected weekly tests by hub (in thousands)
Aug Sept Oct
750
Nov
West NorthEastMidwest South
Enrollment and testing statistics (as of 8/6)
994Sites
enrolled
4.1kTests
completed

87
FOR OFFICIAL USE ONLY – DO NOT DISTRIBUTE
DRAFT – PRE-DECISIONAL & DELIBERATIVE
For more information, please reach out to the appropriate program manager
Alexandria, VAfor South and NE regions
U.S. VirginIslands
Puerto Rico
Columbus, Ohio
West Midwest
South
Valencia, California
Northeast
OPERATION ETGeneral Program Management
Matt Humbard (Program Manager)[email protected]
MIDWESTBattelle
Beverly Roberts (Program General Mgr)[email protected]
Testedandprotected.org
SOUTH AND NORTHEASTEurofins
Sean Plotner (Program Manager)[email protected]
www.operationET.com
WESTPerkin Elmer
John Hicks (Testing Program Leader)[email protected]
https://perkinelmer-appliedgenomics.com/home/sars-cov-2-testing-solutions/no-cost-covid-19-testing/
HHS Confidential Information – FOIA Exempt – Not to be Disseminated
INFORMATION NOT RELEASABLE TO THE PUBLIC UNLESS AUTHORIZED BY LAW: This information has not been publicly disclosed and may be a privileged, confidential, deliberative, and/or pre-decisional communication. It is for internal government use only and must not be disseminated, distributed, or copied to persons not authorized to receive the information. Unauthorized disclosure may result in prosecution to the full extent of the law.
Testing & Diagnostics Working Group: Increasing Community Access to Testing
NIH RADx Return to School Workshop
AUGUST 9TH 2021

89
FOIA EXEMPT - DO NOT DISTRIBUTE
DRAFT – PRE-DECISIONAL & DELIBERATIVE
Agenda
Overview of ICATT
School testing initiatives
School testing feedback and evaluation
Future outlook for school testing

90
FOIA EXEMPT - DO NOT DISTRIBUTE
DRAFT – PRE-DECISIONAL & DELIBERATIVE
Agenda
Overview of ICATT
School testing initiatives
School testing feedback and evaluation
Future outlook for school testing

91
FOIA EXEMPT - DO NOT DISTRIBUTE
DRAFT – PRE-DECISIONAL & DELIBERATIVEAs of 8/5/21
Increasing Community Access to Testing (ICATT) has four primary initiatives
1
Pharmacy partnerships
~15M tests
Offer no-cost testing to underserved and
vulnerable populations at pharmacies in all 50
states, DC, and PR
2
Surge site testing~1M tests
Rapidly stand-up testing sites in hot spots and priority
surveillance locations, in partnership with
state and local governments
3
Pop-up event testing~2K tests
Offer no-cost testing for events anticipating high volume of testing
Today's Focus
4
School screening programs~5K tests
Provide testing resources to safely
reopen K-12 schools, comm. colleges, HBCUs
& summer camps in underserved areas
Transition to Op ET for Fall '21 Testing

92
FOIA EXEMPT - DO NOT DISTRIBUTE
DRAFT – PRE-DECISIONAL & DELIBERATIVE
Agenda
Overview of ICATT
School testing initiatives
School testing feedback and evaluation
Future outlook for school testing

93
FOIA EXEMPT - DO NOT DISTRIBUTE
DRAFT – PRE-DECISIONAL & DELIBERATIVE
ICATT program in schools aims to safely re-open schools in underserved school districts by providing testing resources and operational support to jumpstart national school testing programs

94
FOIA EXEMPT - DO NOT DISTRIBUTE
DRAFT – PRE-DECISIONAL & DELIBERATIVEAs of 8/5/21
ICATT program in schools has supported the reopening of 150+ schools
Work with existing ICATT testing contractors to collect samples, transport and process tests, and provide follow-up testing options
Provide immediate school testing support to underserved school districts
Help states and school districts transition to longer-term solutions or national testing programs that meet school testing needs

95
FOIA EXEMPT - DO NOT DISTRIBUTE
DRAFT – PRE-DECISIONAL & DELIBERATIVEAs of 8/5/21
Four criteria guidelines inform ICATT program school district selection
Criteria Requirement
High Social Vulnerability
• Top 40% of the national Social Vulnerability Index (SVI) that identifies communities in need of support during a disaster
High Pandemic Vulnerability
• County burden follows a moderate-high Pandemic Vulnerability Index (PVI) with high infection, transmission and testing rates
Child Poverty • Beneficiary of the "Families with Food Stamp/SNAP benefits" provided by the National Center for Education Statistics (NCES)
Immediate Need for Testing
Support
• District requires support to open and remain open safely• District is prepared to implement school testing within 2-3 weeks
1
2
3
4

96
FOIA EXEMPT - DO NOT DISTRIBUTE
DRAFT – PRE-DECISIONAL & DELIBERATIVEAs of 8/5/21
ICATT in Schools began testing in April '21 and will continue through Sep '21 Currently supporting testing in 13 states in districts ranging from 1k-40k students & staff
Week of April 19
Testing began in first district (Sahuarita, AZ)
Began collecting submissions for additional school districts
Week of May 17
Testing in progress or began in 4 school districts
ICATT beginning evaluations in active school districts
Week of May 31
Target for addl. 12 selected schools to begin testing (rolling)1
ICATT continuing evaluations in active school districts
We are here
Week of July 1
Summer school testing to begin in 2 school districts
Schools paired with contractors; ICATT providing support
End of Sept.
Transition ICATT to ELC and Op ET testing programs
Provide assistance to underserved schools struggling with testing implementing
1. Possible opportunity for ICATT extension to continue testing initiatives

97
FOIA EXEMPT - DO NOT DISTRIBUTE
DRAFT – PRE-DECISIONAL & DELIBERATIVEAs of 8/3/21
Detail: ICATT supports 18 school districts with on-site summer school testing through pharmacy partners
CVS 3 - 18 740
eTrueNorth 5 1 54 3,512
Rite Aid 6 - 78 690
Walgreens 2 1 11 177
Total 16 2 161 5,119
Summer schoolsAssigned districts
Waitlisted districts
# of schools (excl. waitlist)
# of tests
1. Pending contractor selection or selecting self-administered exams (e.g., Ellume)
Status Update
• Districts continuedspring testing intothe summer term
• Testing began 7/28in Harford, MD at aspecial needs school
• ICATT to understandfall testing plansand transitionschools to Op ET
-

98
FOIA EXEMPT - DO NOT DISTRIBUTE
DRAFT – PRE-DECISIONAL & DELIBERATIVE
Agenda
Overview of ICATT
School testing initiatives
School testing feedback and evaluation
Future outlook for school testing

99
FOIA EXEMPT - DO NOT DISTRIBUTE
DRAFT – PRE-DECISIONAL & DELIBERATIVEAs of 8/5/21
ICATT team collected learnings & best practices from school testing programs
1
Optimize testing process and impact on school openings
2
Improve expansion of ongoing ICATT school
programs
3
Glean best practices to guide execution of
Operation ET
School survey stakeholder groups include:pharmacy partners, district staff, school staff & parents/guardians

100
FOIA EXEMPT - DO NOT DISTRIBUTE
DRAFT – PRE-DECISIONAL & DELIBERATIVEAs of 8/5/21
Recurring themes from Feedback on COVID-19 Testing in Schools validate initial objectives and can inform Operation ET or other future school testing programs
Schools struggle to generate
testing demandand increase consent rates
Initial 2+ week time investment
in planning is critical to
successful school testing program
Early and ongoing communication with school staff is important to
generate testing program support
District and school staff pleasantly
surprised by quick results and self-swab
testing process
Parents & guardians
support school testing but are misinformed
about program objectives
Source: Feedback on COVID-19 Testing in Schools (Qualtrics) Note: Survey completion is defined as both indicating background information and answering at least one evaluation content question – ICATT in Schools received 110 total submissions, but 26 did not complete background information and 12 did not complete at least one evaluation content question = 110-(26+12) = 72 survey responses

101
FOIA EXEMPT - DO NOT DISTRIBUTE
DRAFT – PRE-DECISIONAL & DELIBERATIVE
Agenda
Overview of ICATT
School testing initiatives
School testing feedback and evaluation
Future outlook for school testing

102
FOIA EXEMPT - DO NOT DISTRIBUTE
DRAFT – PRE-DECISIONAL & DELIBERATIVEAs of 8/5/21
Recent uptick in testing demand calls for further school testing support
14-Jun 28-Jun 12-Jul 26-Jul 9-Aug 23-Aug
0.5M
1M
Increasing ICATT Testing: June & July '21
1.5M
Total ICATT Testing #'s Illustrative1
forecast for Aug '21
• Increased school testing projections for back-to-school in fall '21
• School districts in AZ, CT, HI, MD, NJ, NY, OH, VA requesting additional ICATT support
• OTC and POC test sales rising across ICATT's pharmacy partners
• HBCU's and state universities request back-to school support
• Federal and state testing mandatesrequire regular testing
Source: Covid Responder 1. Projections based on WOW growth as ICATT testing is increasing significantly and expected to grow in coming weeks

Thank you!Questions?

RADx-UP Coordination and Data Collection Center (CDCC)August 2021

RADx-UP CDCC - Guiding Principles
• Communities are at the center of our work.
• Data sovereignty protections and sharing with communities and participants are essential in building trust and being trustworthy.
• Intentional support of study teams is critical to streamline results and troubleshoot.
• Broad dissemination of program activities, data, and best practices are key.
• Strategic partnerships will augment community benefits from the program.
• Impact will be broad and will inform national guidance, strategy, and response to COVID-19.

RADx-UP CDCCPrincipal Investigator Leadership: Michael Cohen-Wolkowiez, MD, PhD, Giselle Corbie-Smith, MD, MSc, Warren Kibbe, PhD, FACMI
Operations Director: Donna Parker
Program Director: Susan Knox
ADMINISTRATION AND COORDINATION CORE
Operational Lead: Karen Johnson
ENGAGEMENT IMPACT TEAMS
COVID-19 TESTING CORECore Leadership:
Chris Woods, MD, Thomas Denny, MSc, MPhil
Program Lead: Tim Veldman, PhD
Operational Lead: Barrie Harper
COMMUNITY ENGAGEMENT CORECore Leadership:
Al Richmond, Krista Perreira, PhD
Program Lead: Renee Leverty
Operational Leads: Crystal Cannon & Phil Horn
DATA SCIENCE AND BIOSTATISTICAL CORECore Leadership:
Keith Marsolo, PhD, Lisa Wruck, PhD
Program Lead: Bhargav Adagarla
Operational Lead: Laura Johnson
RADx-UP Awardees
SERVICES: Project Leadership, Communications, Evaluation
NIH Project Scientist: Fabienne Santel, MD, MPH
NIH Project Scientist: Nadra Tyus, DrPH, MPH
NIH Project Scientist: Partha Bhattacharyya, PhD
RADx-UP STEERING COMMITTEE,
RADx-UP DATA STEWARDSHIP
COMMITTEE, RADx-UP WORKING GROUPS & EXTERNAL ADVISORY
BOARD
NIH Program Officers: Dottie Castille, PhD
Beda Jean-Francois, PhD

CDCC Responsibilities
• Program administration
– Communications, committees, policies, strategy
• Community engagement
– Best practices, resources, working groups, community of practice, mini-grants, EITs
• COVID-19 testing technologies
– Technical support, repository of emerging technologies, pilot grants
• Data and biostatistics
– Data exchange, harmonization, dissemination, protection, linkages, stats
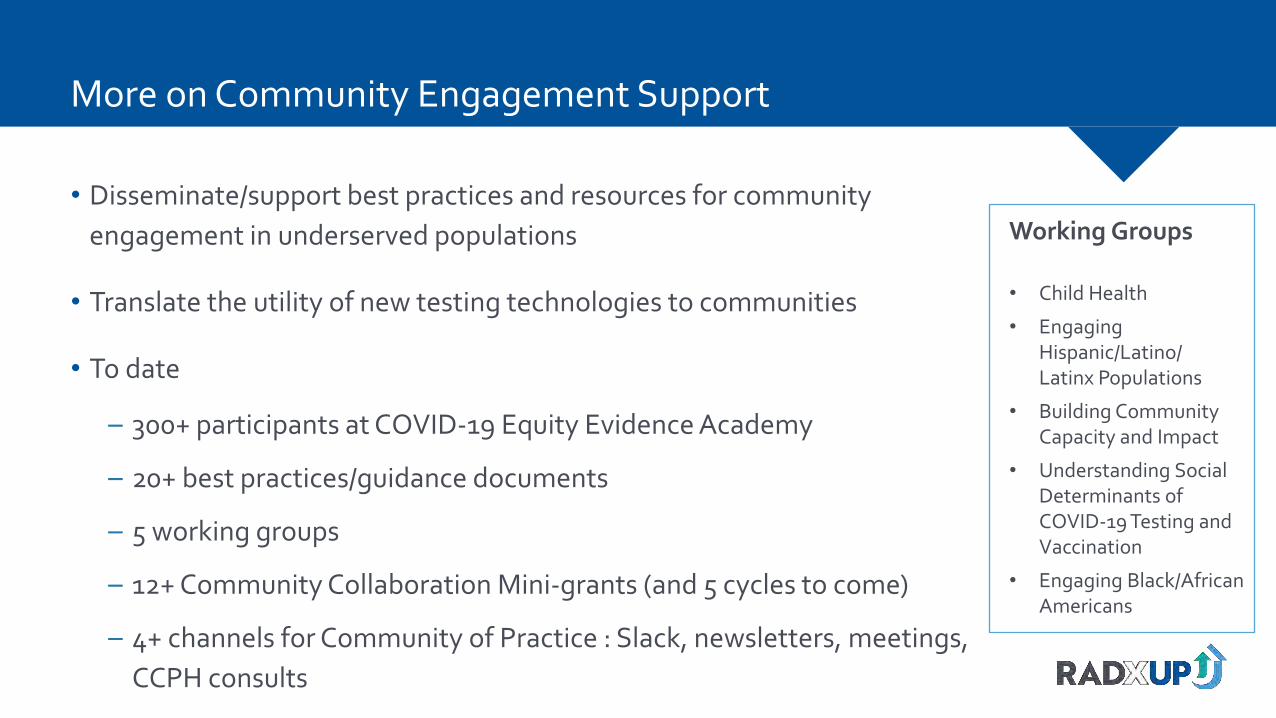
More on Community Engagement Support
• Disseminate/support best practices and resources for community engagement in underserved populations
• Translate the utility of new testing technologies to communities
• To date
– 300+ participants at COVID-19 Equity Evidence Academy
– 20+ best practices/guidance documents
– 5 working groups
– 12+ Community Collaboration Mini-grants (and 5 cycles to come)
– 4+ channels for Community of Practice : Slack, newsletters, meetings, CCPH consults
Working Groups
• Child Health
• Engaging Hispanic/Latino/Latinx Populations
• Building Community Capacity and Impact
• Understanding Social Determinants of COVID-19 Testing and Vaccination
• Engaging Black/African Americans
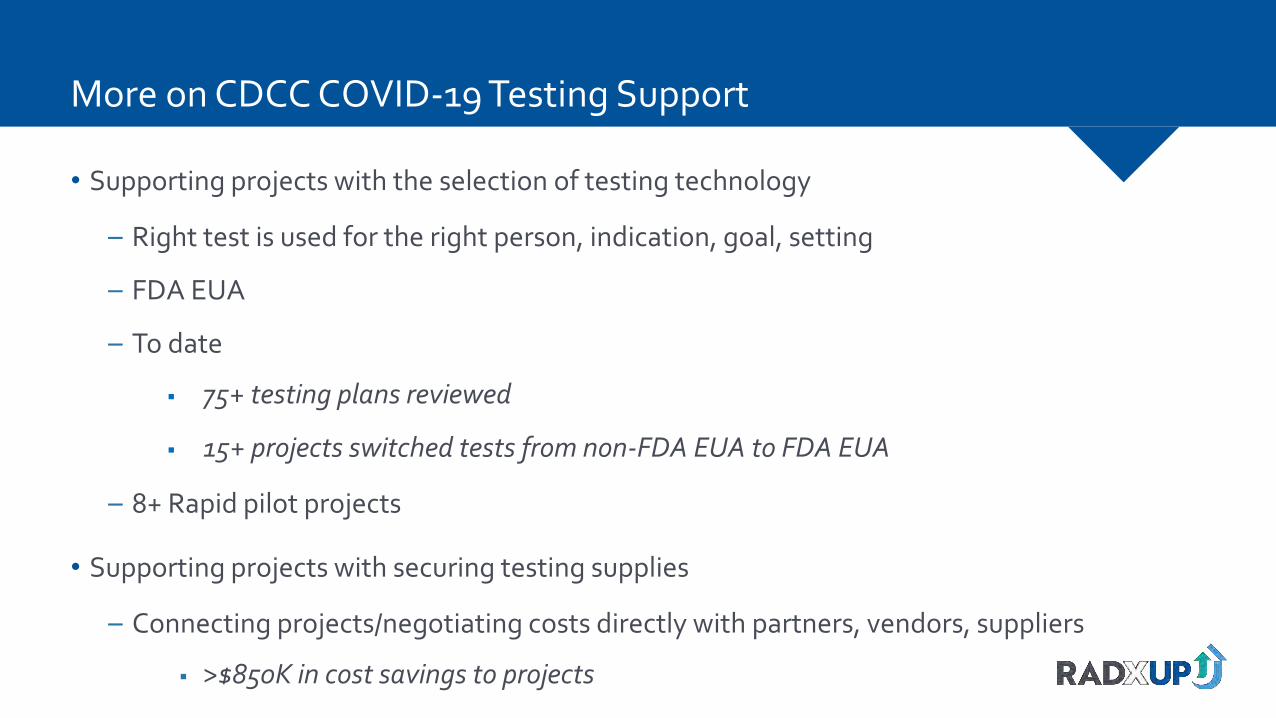
More on CDCC COVID-19 Testing Support
• Supporting projects with the selection of testing technology
– Right test is used for the right person, indication, goal, setting
– FDA EUA
– To date
75+ testing plans reviewed
15+ projects switched tests from non-FDA EUA to FDA EUA
– 8+ Rapid pilot projects
• Supporting projects with securing testing supplies
– Connecting projects/negotiating costs directly with partners, vendors, suppliers
>$850K in cost savings to projects

More on CDCC COVID-19 Testing Support
• Testing resources
– The FDA lists of authorized assays
– Testing Tips webpage for selection and use of FDA EUA assays
– The May 2021 Project-wide Meeting focused on testing; find materials on myRADx-UPhome.
• Discussions with projects via EITs

More on CDCC COVID-19 Data and Biostatistics Support
• Supporting projects with project-level data collection questions
• Cross-consortium data collection and harmonization
– NIH RADx-UP Common data elements (CDEs)
• Collecting different types of data
– NIH RADx-UP CDEs, electronic health records, qualitative data
• Linkages with external datasets
– Adds SDOH and increases impact
• Statistical consultations

Data Flow
DATA SOURCES DATA REPOSITORIES

What are the NIH RADx-UP Common Data Elements?
• Data items collected in the same format by all projects
• Developed by NIH and catalyzed by the CDCC
• RADx-UP (Phase I) projects contributed
– Limited, messy, imperfect, and during a pandemic
– 700+ → 60+
• Tiers
– Tier 1 = required
– Tier 2 = recommended
New NIH RADx-UP Tier 2 CDEs for pediatrics are in development

Why do we need the NIH RADx-UP Common Data Elements?
• Standardized data collection across community engaged projects
• Provides a path to understanding the nuances of health disparities between and within different communities
• Allows data linkages with external datasets (e.g. SDOH) to augment impact
– Zip code, county
– Address (census tract or census block)
– Name and contact information for future re-contact
• Increases the impact of the RADx-UP program

How does it work?
• CDCC disseminated the NIH RADx-UP CDEs to projects (English and Spanish)
– Also: data sharing language for the ICF and data use agreements
• CDCC created the codebook for the NIH RADx-UP CDEs (English and Spanish)
– Ready to upload into databases (e.g., REDCap)
• CDCC provided information and guidance regarding NIH RADx-UP CDEs
– Written, podcasts, meetings, videos (coming soon)
• Projects are collecting NIH RADx-UP CDEs and uploading data to CDCC
• CDCC will deposit data into the NIH RADx Data Hub

Examples of NIH RADx-UP Tier 1 CDE data

Examples of NIH RADx-UP Tier 1 CDE data

Summary
• The CDCC supports >100 projects in the RADx-UP program
• The CDCC is achieving its goals: CE, testing, and data collection
• The CDCC and projects are changing the paradigm of CE research
• Keeping communities at the center of what we do is key to our success
Thank you.
Please contact us with your questions and ideas:

12007/21/20
BREAK

12107/21/20121
Team Presentations
Chris Lindsey Ph.D.Eunice Kennedy Shriver National Institute of Child Health and Human
Development (NICHD)
Project SafeSchoolsRe-opening schools serving Native children and adolescents SAFELY
Return to School August Meeting
PIs: Drs. Allison Barlow, Laura Hammitt, Emily E. HarozOn behalf of our whole JHCAIH team and partners from the White Mountain
Apache and Navajo Nation
This research was, in part, funded by the National Institutes of Health (NIH) Agreement No. 1 OT2 HD107543-01. The views and conclusions contained in this document are those of the authors and should not be interpreted as representing the official policies, either expressed or implied, of the NIH.

Significance
1. Native Americans face the highest COVID related health disparities of any racial or ethnic group.
2. Most schools serving Native American youth were closed until March or April of 2021.
• Navajo Nation schools were closed to in-person learning for all of 2020-2021 academic year• Virtual learning particularly challenging• Opting into in-person learning has been variable• Most schools are re-opening for in-person learning for the 2021-2022 academic year
3. School attendance and attachment are protective for physical and mental health concerns.

Research Questions
1. What are the barriers and facilitators to school re-openings and COVID-19 testing from the perspective of multiple stakeholders involved in schools that serve Native American youth ages 4-16 years?
2. How acceptable and feasible are various COVID-19 testing strategies forschools? And what is their impact on in-person attendance rates,children’s learning, and quality of teaching from the perspective offamilies, teachers, administrators and staff?
3. What are the educational, social, emotional, physical and mental healthimpacts of returning to in-person learning for Native American youth ages 4-16 years?

Project Sites
• White Mountain Apache Tribe• Pilot project activities began in January
2021 with three schools• Expansion to all other schools
• Navajo Nation• Shiprock Area Schools• Tuba City Area Schools
~10,000 students & faculty<90% Free or reduced lunch

TestingScreening Tests Surveillance Testing
approaches
Rapid Antigen Tests At Schools
Rapid Antigen Tests at Home
Front End PCR Pooling
What tests? Abbot Binax Now Ellume Home Test Kits
Abbot Binax Now Ellume Home Test Kits
Concentric by Gingko
Frequency 2x per week 2x per week 1-2x per week
Sensitivity/Specificity (asymptomatic)
Binax: 70.2/99.61
Ellume: 91/962Binax: 70.2/99.61
Ellume: 91/96296/1003
Teachers & Staff Students Both
-

Design and analytic planLongitudinal observational cohort• Convergent mixed-methods design
• Qualitative guides informed by Theoretical Domains Framework to understand behavior change and implementation outcomes
• Surveys to understand testing implementation attitudes
• Mental health assessments• Secondary data analysis of school testing
data• Target sample sizes for primary data
collection• 500 caregivers• 120 youth (11-16)• 120 school employees

Results to date

Community & school engagement activities
• Community Advisory Boards (CABs) in each site
• Community and school engagement activities
• Local approvals• Three IRBs

Community & school engagement activities• An estimated 140 meetings held with community partners by our team
members since May 1st 2021.

Research approval processes
WMAT TCApproved:
5/5/21
JHU IRBApproved:
6/17/21
NNHSRBApproved:
7/20/21

School testing dataMay 1 – July 15
N = 540n = 289 school personnel
n = 217 students
Over 3000 tests administered
Figure 1. Testing dashboard for 2x weekly antigen testing approach
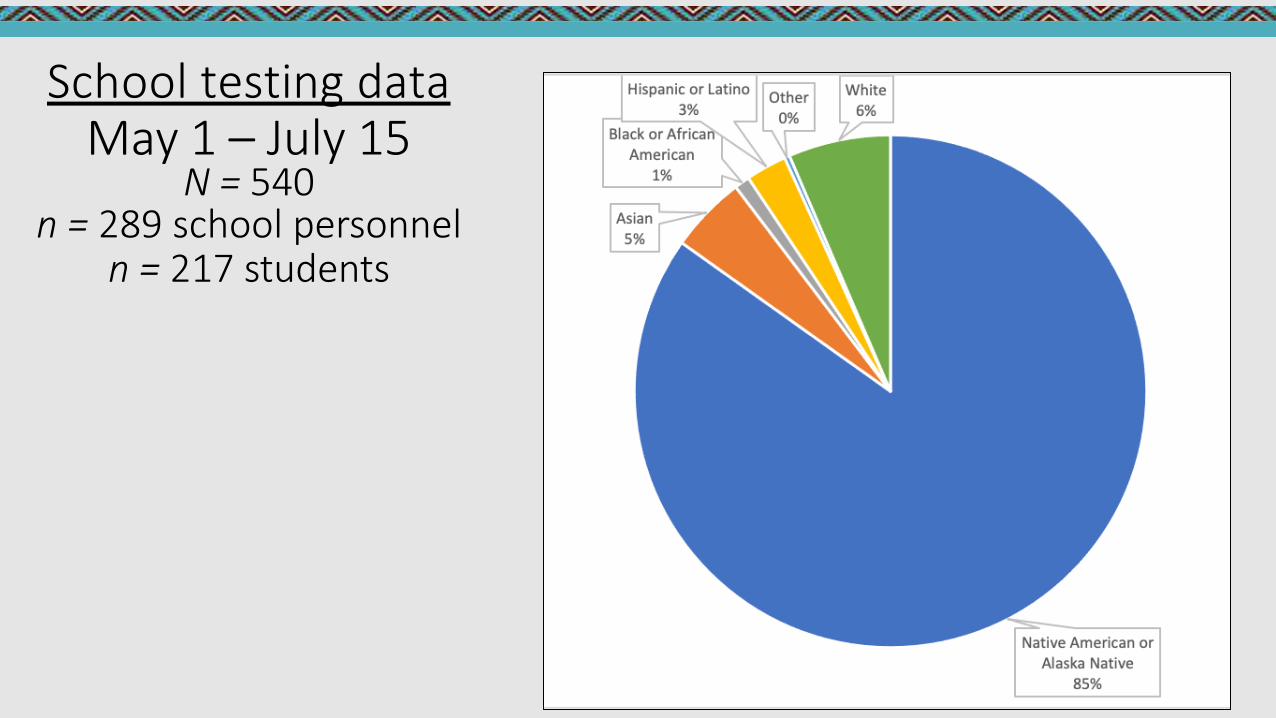
School testing dataMay 1 – July 15
N = 540n = 289 school personnel
n = 217 students

Testing UptakeMay 1 – July 15

Zero cases and low community transmission
DO NOT DISTRIBUTE

Reach of testing overallMay 1 – August 1
540 people tested out of our projected 1,300 people in year 1 through our partnerships with schools implementing COVID-19 testing
41%
• Overwhelming demand with schools interested and exceeding our projections for participation
• Exploring leveraging state funding

Move towards pooled PCR testing
TotalPools,Swabs,PoolSize,Turnaround Time,and People Testedby WeekWeek .".' Total Pools Total Swabs Average Swabsper Pool Average Turnaround Time inHours Approximate number of people tested
July 26, 2021 - August 01, 2021 2 31 15.5 32 31
June 21, 2021 - June 27, 2021 1 22 22 31 22
June 14, 2021 - June 20, 2021 2 30 15 29 30
June 07, 2021 - June 13, 2021 2 30 15 30 30

Research recruitment

Challenges & lessons learned
Increased funding, but a real need for implementation support
Testing uptake by parents is challenging at the beginning; address myths and beliefs head on and using multiple strategies
Partner research and practice to enhance reach and impact

Resources for schools serving Native American communities
https://caih.jhu.edu/schoolresources/

Project SafeSchoolsWorking together to make in-person learning safer for ALL.

ReSET: Restarting Safe Education and Testing for
Children with Medical ComplexityUniversity of Wisconsin-Madison
RADx-UP August Workshop - 8/9/2021

Research Objectives
Increase safe return to school for children with medical complexity (CMC) and school personnel through 3 complementary approaches:
Feasibility of home and school-based testing strategies
(Aim 1)
Consensus priorities for safe in-person
school (Aim 3)
Predictors of in-person school
(Aim 2)

Home and School Testing FeasibilityBinaxNOW Rapid Antigen Platform
In-Home Cohort• Recruited from UW Pediatric
Complex Care Program
• Parents test twice-weekly
School Cohort• Recruited from Waisman
Early Childhood Program• 30% have developmental
disabilities• ReSET staff test twice-weekly

Aim 1 – Adaptive Design

Recruitment and Enrollment

Monthly Enrollment and Surveillance Testing
0
50
100
150
200
250
300
350
400
450
0
5
10
15
20
25
30
35
40
45
50
May June July
# M
onth
ly T
ests
Per
form
ed
# En
rolle
d in
Sur
veill
ance
Coh
orts
Monthly tests performed In-home cohort In-school cohort

Demographics of Study CohortsTesting Non-testing
- In-Home In-School Kids In-School Staff SurveyEnrolled, n 44 13 of 57 (23%) 18 of 23 (78%) 1014Age, years
1-4 - 8 (62) - 2 (0.2)5-10 24 (55) 2 (15) - 393 (38.9)11-13 10 (23) - - 235 (23.3)14-17 4 (8) - - 379 (37.6)Not yet reported 6 (14) 3 (23) - -
GradePreK-5 25 (57) 13 (100) - 453 (44.6)6-8 11 (25) - - 244 (24.1)9-12 1 (2) - -
- - -317 (31.3)
Not yet reported 7 (16)Race/Ethnicity
White, non-Hispanic 26 (59) 8 (62) 11 (61) 776 (76.7)Black, non-Hispanic 2 (5) 1 (8) - 30 (3.0)Hispanic 5 (11) - - 86 (8.5)Multiracial 1(3) - - 46 (4.5)Other 5 (11) 3 (22) 2 (11) 55 (5.4)Not yet reported 5 (11) 1 (8) 5 (28) 19 (1.9)
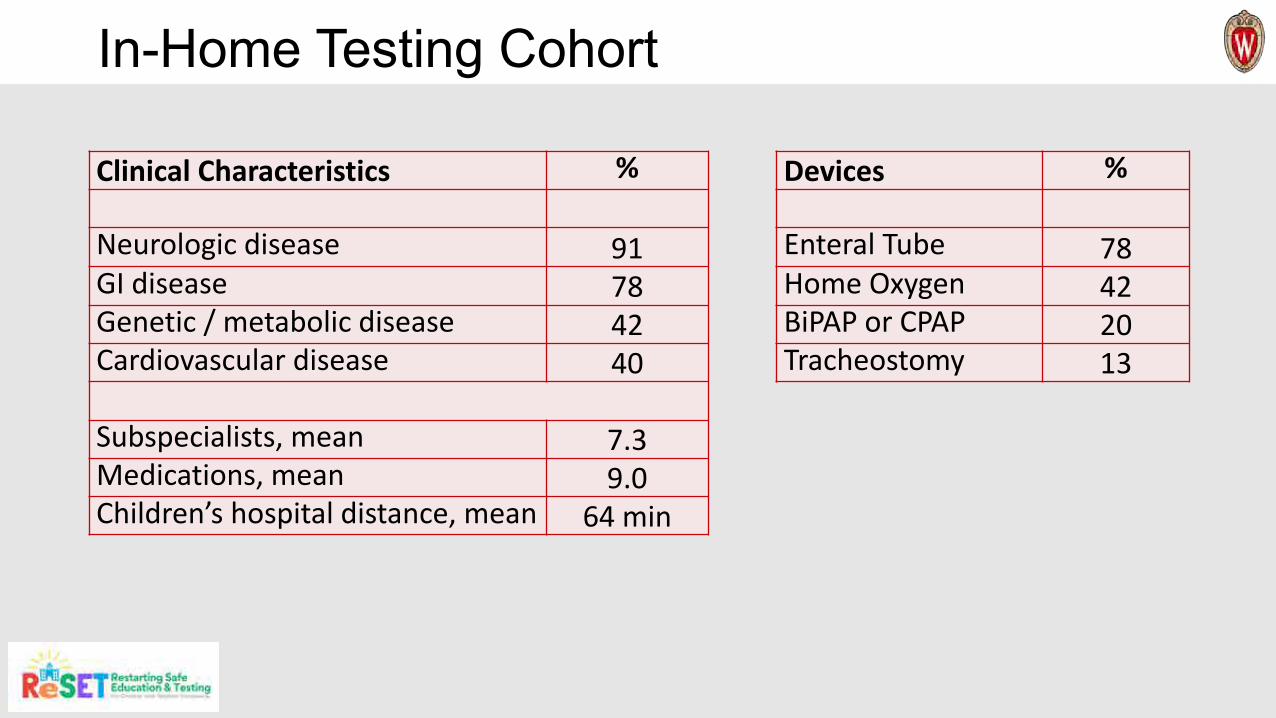
In-Home Testing Cohort
Clinical Characteristics %
Neurologic disease 91GI disease 78Genetic / metabolic disease 42Cardiovascular disease 40
Subspecialists, mean 7.3Medications, mean 9.0Children’s hospital distance, mean 64 min
Devices %
Enteral Tube 78Home Oxygen 42BiPAP or CPAP 20Tracheostomy 13
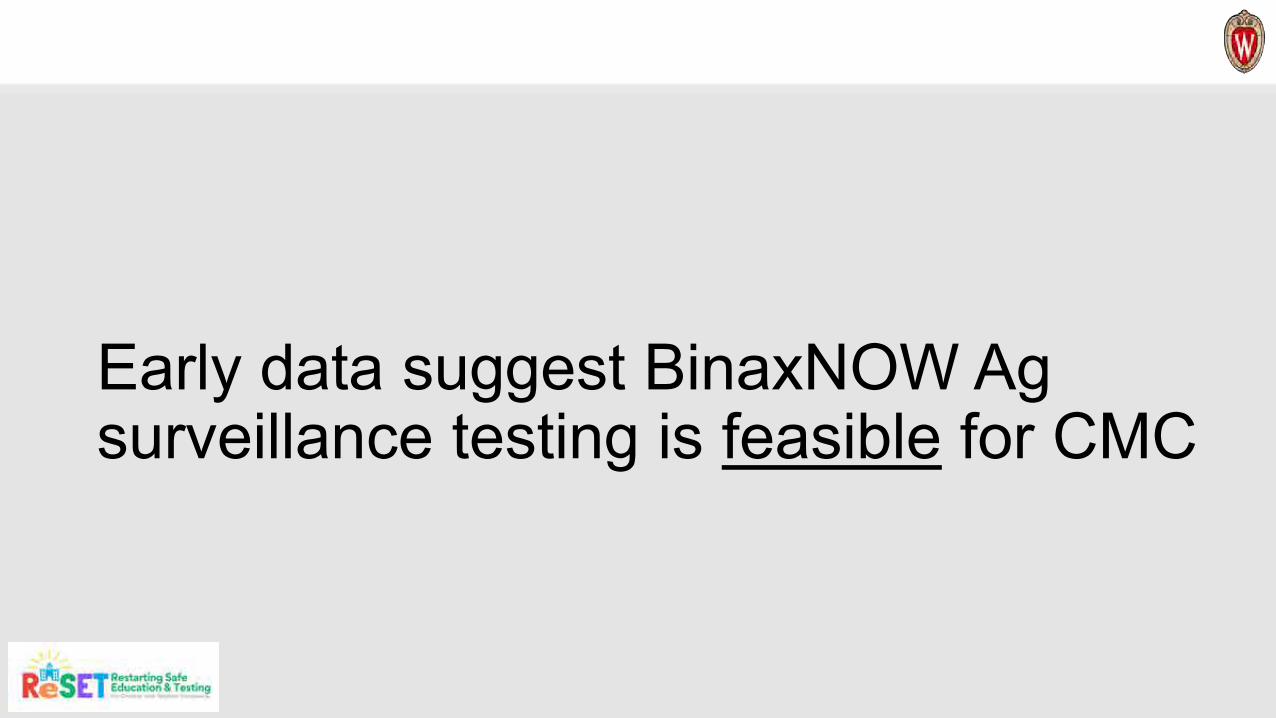
Early data suggest BinaxNOW Ag surveillance testing is feasible for CMC

Test FeasibilityIn-Home Cohort, n (%) In-School Cohort, n (%)
Total BinaxNOW Tests Conducted 505 536Surveillance (asymptomatic) 467 (92.5) 518 (96.6)Symptomatic 38 (7.5) 18 (3.4)
Weekly test log response rate 252 / 277 (93) N/ATests / subject / week, mean 1.9 1.6Test rate (actual / expected) 505 / 554 (91) 536 / 615 (87)Importance to continue testing 83% very or extremely N/A
Test ResultsIn-Home Cohort In-School Cohort
Positive BinaxNOW Tests 0 8Symptomatic Positive - 7Asymptomatic Positive - 1
Overall BinaxNOW positive rate NA 1.5%# PCR confirmed - 0# PCR negative - 8
False-positive rate NA 1.5%
-
-

In-Home Testing Challenges are Rare
No problem, 482
Minor Problem, 23
0%
10%
20%
30%
40%
50%
60%
70%
80%
90%
100%
Test Experiences (n=505)
Child would not cooperate 10Child too ill or hospitalized 5Other (e.g., away on vacation) 8

Many CMC were not at school at the end of last academic year

School Attendance for CMC at end of 2021
Virtual45%In-
Person55%
In-Home Testing Cohort
Virtual0%
In-Person100%
In-School Testing Cohort
Virtual21%
In-Person
79%
Non-testing (Survey) Cohort

Parent Perceived Risk for CMC Getting COVID at School
Likely35%
Unlikely65%
In-Home Testing Cohort
Likely0%
Unlikely100%
In-School Testing Cohort
Likely12%
Unlikely88%
Non-testing (Survey) Cohort

Demographics, testing, and vaccine perceptions may be weaker drivers of in-person school
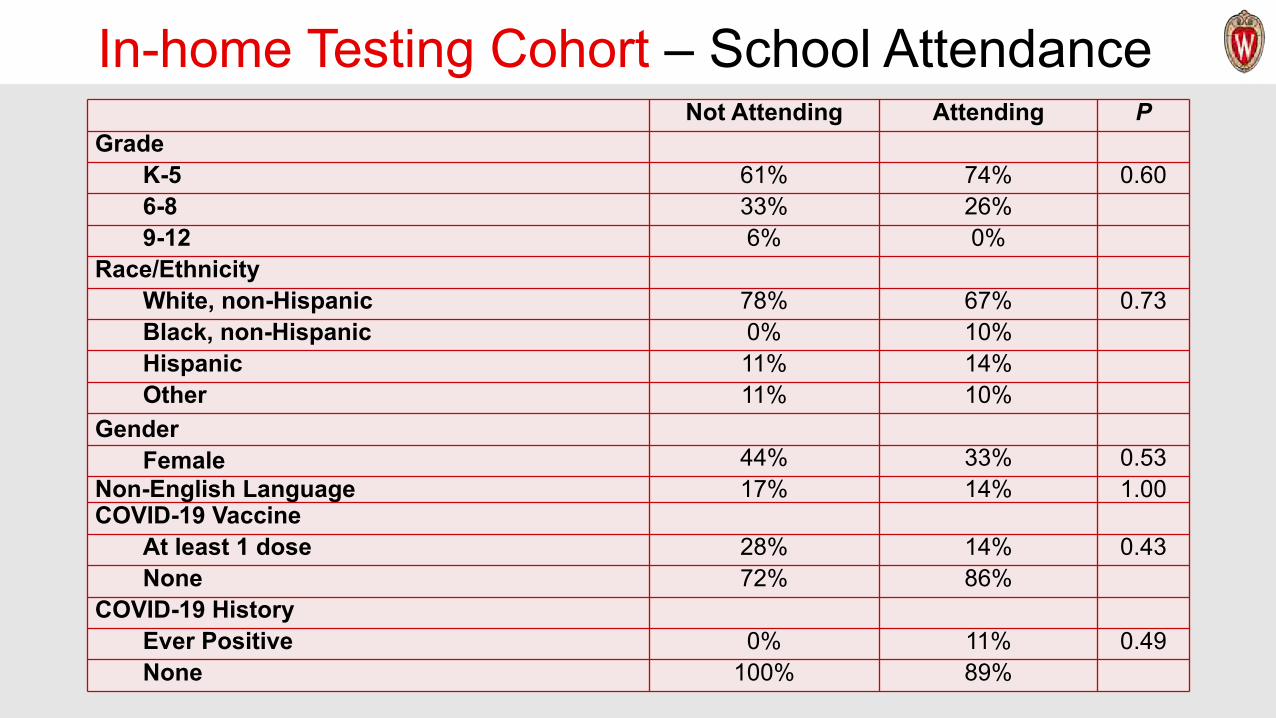
In-home Testing Cohort – School AttendanceNot Attending Attending P
GradeK-5 61% 74% 0.606-8 33% 26%9-12 6% 0%
Race/EthnicityWhite, non-Hispanic 78% 67% 0.73Black, non-Hispanic 0% 10%Hispanic 11% 14%Other 11% 10%
GenderFemale 44% 33% 0.53
Non-English Language 17% 14% 1.00COVID-19 Vaccine
At least 1 dose 28% 14% 0.43None 72% 86%
COVID-19 HistoryEver Positive 0% 11% 0.49None 100% 89%
-
-
-
-
-
-
-
-

Non-testing (Survey) Cohort – School AttendanceNot Attending Attending P
GradeK-5 40% 44% 0.0086-8 20% 26%9-12 40% 30%
Race/EthnicityWhite, non-Hispanic 80% 79% 0.45Black, non-Hispanic 5% 5%Hispanic 7% 10%Other 9% 6%
GenderFemale 52% 52% 0.15
Non-English Language 9% 9% 0.94COVID-19 Vaccine
At least 1 dose 45% 34% 0.007None 55% 66%
COVID-19 HistoryEver Positive 8% 14% 0.08None 92% 86%
- -
- -
--
--
--
--
- -
--

Demographics, testing, or vaccine perceptions may be weaker drivers of in-person school
CMC school attendance and confidence in school mitigation plans strongly related

In-home Testing Cohort – School Perceptions
0 10 20 30 40 50 60 70 80 90 100
ing
P=0.003P=0.001
P=0.01
P=0.03
P=0.01
P=0.005P=0.01P=0.01
P<0.001
P=0.01
Percent
No concern about amount of testing at schoolNo concern about other children following recsMost interacting with child are fully vaccinated
Child is able to wear a maskNo concern about how close people have to be to child
Attending school positively impacts classmatesAttending school positively impacts staff and teachers
No concern about number of people around childWant child to attend in-person
Attending school helps family keep jobsNo concern about PPE quantity
Teacher encouraged child attendanceNo concern school can take all precautions needed
School able to follow recommendationsAttending school positively impacts family
Therapy needs only met in-personIn-person better for child than virtual
Unlikely to get COVID-19 at schoolImportance of attendance to child’s health
Child and caregivers have access to needed PPETransportation to school is not difficult
School has adequate access to wash
Attending Not Attend

Non-testing (Survey) Cohort – School Perceptions
0 10 20 30 40 50 60 70 80 90 100
Most interacting with child are fully vaccinatedTherapy needs only met in-person
No concern about other children following recsAttending school helps family keep jobs
Teacher encouraged child attendanceAttending school positively impacts classmates
Attending school positively impacts staff and teachersNo concern about amount of testing at school
No concern about how close people have to be to childNo concern about number of people around child
Attending school positively impacts familyNo concern school can take all precautions needed
No concern about PPE quantityWant child to attend in-person
In-person better for child than virtualSchool able to follow recommendations
Importance of attendance to child’s healthChild is able to wear a mask
Unlikely to get COVID-19 at schoolSchool has adequate access to wash
Child and caregivers have access to needed PPETransportation to school is not difficult
Attending Not AttendingPercent
All p<0.01

Changing to In-Home Symptom Testing
Symptomatic Surveillance PDesire child to attend in-person 46% 55% 0.39
School able to follow recommendations to keep child safe 88% 31% 0.03School can take all precautions to stop COVID spread 88% 38% 0.03No concern about PPE quantity 88% 38% 0.03Most or all interacting with child are fully vaccinated 63% 6% 0.01
Two-thirds of families want to continue in-home surveillance testing
Less school mitigation confidence associated with continued surveillance testing
No associations with demographics, CMC COVID-19 vaccination status, or CMC history of COVID-19
-

To support CMC attending school
•Schools likely need to…
• Use recommended mitigation strategies• mask (PPE), vaccinate, distance, hygiene, etc
• Communicate mitigation plans to families
• Engage families• Teacher encouragement for CMC to attend assoc with
7x higher odds of in-person attendance (p=0.006)

Parents perception of schools
• Parents perceiving school not using mitigation strategies:• are less likely to have their child in school• also prefer more in-home (surveillance) testing
• Could providing in-home tests to families concerned with school safety address concern & boost attendance?

Statewide Consensus PrioritiesWI stakeholder consensus priorities for safe in-person school for CMC
Step 1Establish stakeholder and expert groups
Step 2Crowdsource ideas, rank criteria, and set minimum thresholds
Step 3Synthesize candidate priorities
Step 4Score and weight priorities
Step 5Disseminate

WWW.RESET4KIDS.ORGIN FIRST WEEK>1000 views>650 unique users in 4 countries>200 downloads
CURRENT RESOURCES• Top 10 consensus priorities • “1-pager”• Family FAQ guide• Healthcare provider template letter• Social Media content• More on the way
PRIORITY SUMMARY• Universal masks, vaccination, school testing• Respiratory protection plans for staff• Single use medical equipment• Safety plans within IEPs, flexible curriculum• Staff education on CMC, nurse available• Healthcare team partner, transportation plan

Challenges and Next Steps
Challenges• Low in-school testing enthusiasm
• Enroll direct to symptomatic testing• Offer in-home (symptomatic) testing
• This is what we hear parents want• Talking with additional schools• Talking with WI testing program
• Low (zero) case detection with asymptomatic testing
• Unknown impact of increases in other respiratory viruses
Next Steps
• Finish data collection and analyses
• Longitudinal analyses• Repeated surveys, trends• ∆ School perceptions
associated with ∆ from surveillance to symptom testing
• Further develop and promote resource inventory


RADx-UP Presentation Return to SchoolAugust 9, 2021

Presentation Outline1. ROSSEY Overview2. Aim 1: Key Stakeholder Interviews, Focus Groups & Child
Interviews Update and Preliminary Themes3. Aim 2: Testing Program (COVID-19 Testing + Health
Education with Comic Books)4. RADx-Up Return to School Diagnostic Testing Lessons and
Next Steps

Collaborators• University of Washington School of Public Health and School of
Medicine
• Fred Hutchinson Cancer Research Center and Center for CommunityHealth Promotion
• Yakima School District
• Community Advisory Board (CAB) Representing three school districts, Yakima Health District, and the
Farmworkers’ Clinic

Study AimsAim 1. Identify rural Latino community’s social, ethical, behavioral needs and resources for students to return to school and maintain onsite learning using qualitative assessments with school stakeholders, parents, and students.
Aim 2. Evaluate the effectiveness of a testing program (SARS-CoV-2 testing + risk communication) on student attendance using a cluster randomized controlled trial (RCT) with two intervention arms: current learning model (comparison) and testing program.
Aim 3. Assess implementation outcomes of the testing program with school stakeholders, parents, and children guided by the RE-AIM framework.

Map of Washington

Yakima Valley• Small agricultural communities (apples, pears, peaches, cherries,
grapes, and hops)• Census 2011: Lower Valley has a population of about 100,000
~65% of residents are of Hispanic/Latino Among these residents, 95% are Mexican-American

Aim 1• Key Stakeholder Interviews (n=20) Completed 19 interviews Reached saturation
• Parent Focus Group (n=4) 2 English (with 5 & 7 participants) 2 Spanish (with 6 & 8 participants)
• Child Interviews (n=20) 16 interviews completed, 3 scheduled, 1
pending
Identify the rural Latino community’s social, ethical, behavioral needs and resources for students to return to school and maintain onsite learning.

Theme 1: COVID-19 pandemic on social, economic, & mental health
• The COVID-19 pandemic impacted families’ social, economic, and mental health and required lifestyle adjustments to meet demands. “Elders pa[id] the price” - unable to attend social gatherings, leading to
further isolation. Struggling businesses and loss of employment.
• Children’s mental health issues Lack of social interaction; Difficulties of remote learning; Loss of family
members and/or teachers. • Fatigue with mask wearing among families even after vaccination. • “We’re looking forward to a brighter next step.”

Theme 2: Schools commitment to evolving needs of students
• Schools provided teachers and families with resources to adjust to the new learning mode secured laptops and hotspots for children created troubleshooting resources for parents helped teachers familiarize with technologyweekly meal pick up for students enhanced communication to increase sense of togetherness
• Created a safe environment for children to return to schoolmonitoring temperature providing extra masks hand sanitizers before entering schools and inside/outside each
classroom

Theme 2 cont.• Teachers noted many homes were not good learning environments lack of space for children to immerse in learning distraction in the home environment e.g. living room served many purposes
children being pulled in the middle of the classroom to finish chores parents’ limited technology literacy to help their children
• Concerns about widening learning gaps some teachers went above and beyond meeting with parents to
provide technical support to improve children’s participation
• Even in the presence of resources, we heard disparities in the impact of policies among communities experiencing SDH
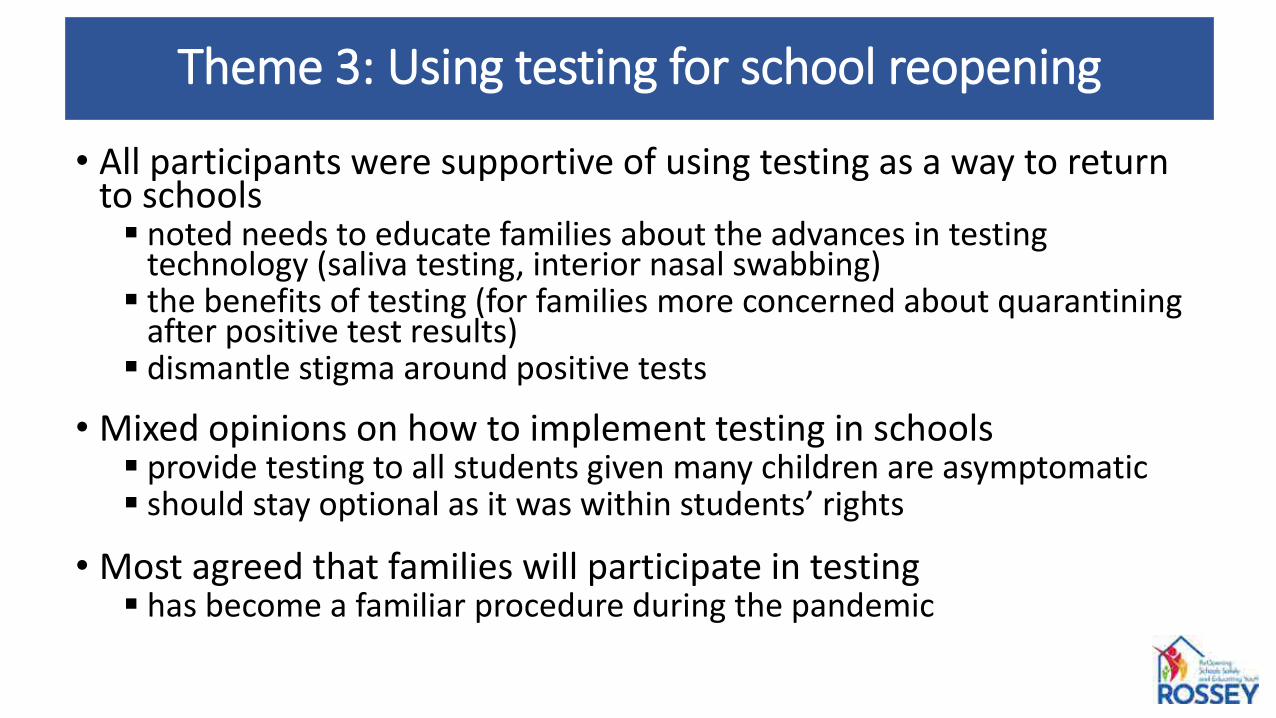
Theme 3: Using testing for school reopening
• All participants were supportive of using testing as a way to return to schools noted needs to educate families about the advances in testing
technology (saliva testing, interior nasal swabbing) the benefits of testing (for families more concerned about quarantining
after positive test results) dismantle stigma around positive tests
• Mixed opinions on how to implement testing in schools provide testing to all students given many children are asymptomatic should stay optional as it was within students’ rights
• Most agreed that families will participate in testing has become a familiar procedure during the pandemic

Theme 4: Vaccine concerns
• Lack of education about the benefits of testing and discommunication in community. negative perceptions from multiple sources (e.g., disproven scientific
paper on vaccine side effects from measles, “bad” experiences with side effects being magnified) long-term side effects vaccine causing sterilizationmistrust for government and science – microchips in the vaccine religiosity-related concerns – mRNA affecting the DNA that was created
by God, vaccine using fetal tissue, vaccine being the mark of the devil/Satan (Patent #666)

Child Interviews – Five main themes • Quarantine and social distancing are difficult and often stressful Took a toll on their “feelings and emotions”
• “A fear of what they put” in the vaccine Getting the vaccine will get the “government to control” “Vaccines will have magnets or chip” “Getting the vaccine will only make me more sicker”
• Fear of side effects from getting the vaccine J&J vaccine giving young adults heart problems and blood clots
• Family have a strong influence on them getting the vaccine• Main motivation for getting tested is “wanting the pandemic to
end”

Aim 2 – PilotAim 2 pilot study in May – June 2021 with one school then 4 additional during summer school to understand the implementation steps. and workflow• 70 interested participants• 46 total enrolled participants• Discovery Lab School (K-8)
participated as the spring pilot school 24 / 27 enrollments did not continue
after spring semester
• Extension of pilot to 4 summer school programs during a 6-week period (June 21-July 23)

COVID-19 positivity rate
• 27 (59%) participants preferred home collection
• 3 COVID-19 positive cases (one family household)
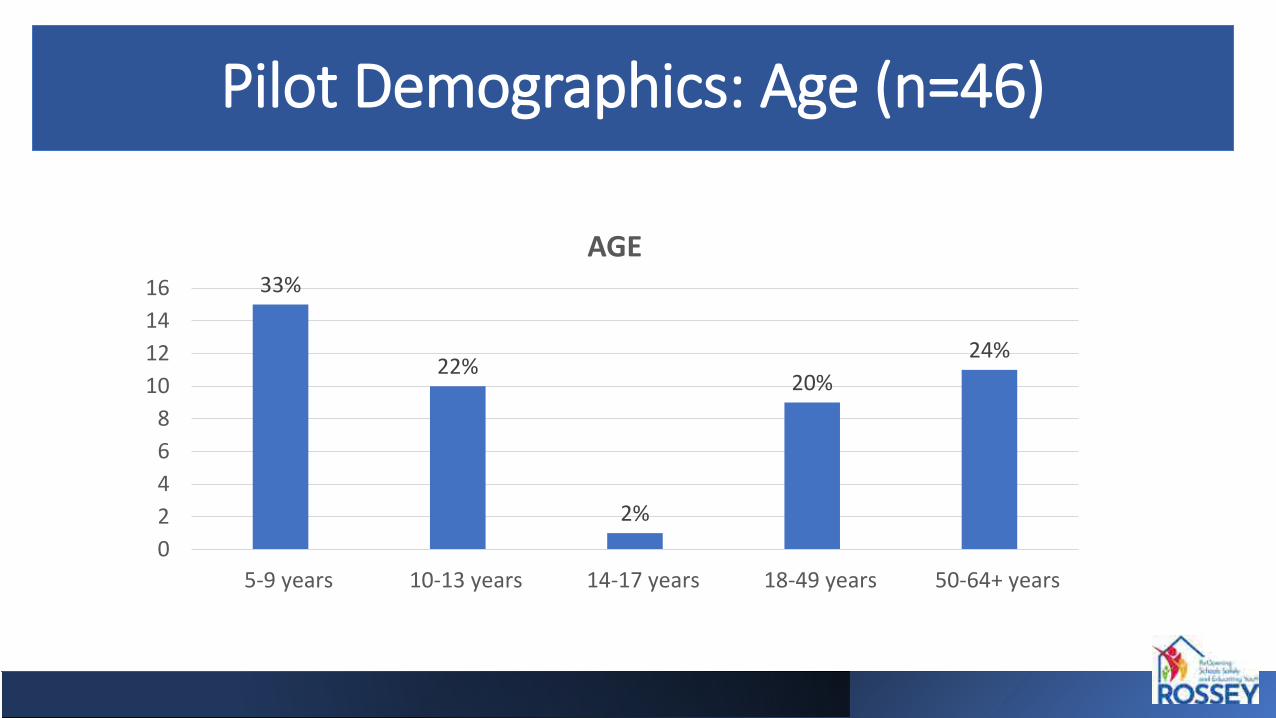
Pilot Demographics: Age (n=46)
AGE16 33%1412 24%
22%10 20%
8642 2%0
5-9 years 10-13 years 14-17 years 18-49 years 50-64+ years

ricanRace/Ethnicity (n=46)
39%
61%
Hispanic/Latino
ETHNICITY
Non-Hispanic/Latino
Hispanic/Latino
Non-Hispanic/Latino
4%
76%White
9%
4%7%
RACE
Black/African AmericanWhiteOtherMore than 1 racePrefers not to specify
Prefers not to specify
Other
More than 1 raceBlack/African Ame

Position and Grade Level
20%
20%54%
4% 2%
POSITION IN SCHOOLTeacher AdministratorStudent OtherPrefers not to specify
32%
47%
21%
GRADE LEVEL (STUDENTS ONLY)
K-2nd 3rd-5th 6th-8th

Enrollment Trends12
stn 10
llme
8
ornE f 6
r oe 4
mb
Nu 2
01 2 3 4 5 6 7 8 9 10 11
StaffStudents
May 10 Jul 17Spring Quarter Summer School
*Not including Role Not Specified (n=1)

Comic Book 1: Playdate during the pandemic
• Follows the main characters (siblings Hector, Mya, and Ava and their friend Aaron) and their experiences during the COVID-19 pandemic.
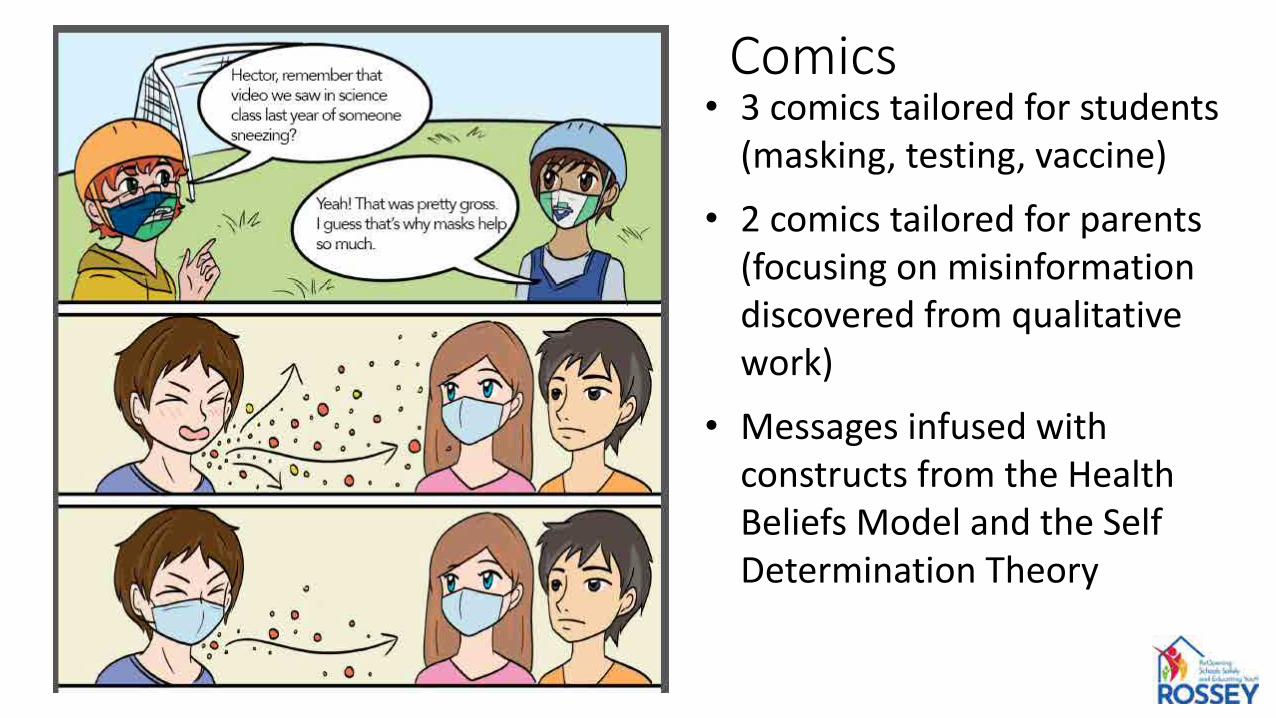
Comics • 3 comics tailored for students
(masking, testing, vaccine)
• 2 comics tailored for parents (focusing on misinformation discovered from qualitative work)
• Messages infused with constructs from the Health Beliefs Model and the Self Determination Theory

Key Take-aways From Pilot• Recruitment and enrollment have been more
challenging than anticipated
• Simplified consent forms and hands-on recruitment for Spanish speaking parents
• Logistics for multiple schools are manageable with trained staff
• Multiple recruitment strategies needed • CAB’s preference for parent-facing education tool
on video format (rather than comic book)

Next Steps• Full trial enrollment starts on 8/25/21 (start of school year)Goal of 900 children
• Address concerns for randomization in the trial design
• Will monitor testing fatigue during the full study period
• Strategies to address testing fatigue Coordinate with school testing activities to avoid overlap Education video to reframe the testing technology and burden of
testing

Questions
Thank you for your attentionQuestions?
¿Tienen Preguntas?

SARS-CoV-2 Screening and Diagnostic testing for return to K-12 schools
Kanecia Zimmerman, MD MPHMonday, August 9th, 2021

Agenda• Project Overview
– Project overview and scope
• Recruitment – Testing Initiative
• Major Outcomes to Date– Community Engagement and Education– Outcomes of testing program– Qualitative data
• Lessons Learned
• Next Steps

Two major problems to solve: With mitigation strategies in place (masking, hand hygiene, physical distancing), within school transmission is low and schools can safely reopen.
Even as schools are reopening:– Black and Latino students have been less likely to return in-person to school
compared to white students– Quarantine requirements after exposure have led to prolonged periods of time out
of schools (substantial individual and community risk:benefit)• Inherently worse among those with limited access/uptake of testing after
exposure• Access to testing has been more limited in underserved communities.

Overview: Project Scope and GoalsLong-term goals: to ensure the safe and equitable return of K-12 school children to US public schools, maximize access to in-person learning, and limit the spread of SARS-CoV-2 in Black and Latino communities.
– AIM 1: Assess the effectiveness of rapid, school-based SARS-CoV-2 screening testing in reducing within-school transmission and restoring trust among Black and Latino families.
– AIM 2: Assess uptake of school-based testing and time to safe school return after exposure.
– AIM 3: Identify the perceived benefits, concerns, and barriers to school-based SARS-CoV-2 testing and in-person learning among Black and Latino families.

Recruitment – Testing Initiative

EnrollmentEnrollment by Race/Ethnicity
0
20
40
60
80
100
120Enrollment Over Time
Hispanic Black White
10%
32%
50%
8%
Cumulative Enrollment
Hispanic
Black
White
Other
Enrollment by Cohort
020406080
100120140160
By Cohort
Screening Exposure
56%
44%
Cumulative Enrollment
Screening
Exposure

Durham Charter Schools EnrollmentEnrollment by race/ethnicity compared to school totals
0%10%20%30%40%50%60%70%80%90%
100%
Hispanic Black White Hispanic Black White Hispanic Black White Hispanic Black White Hispanic Black White
Carter Kestrel Heights CPCFS Voyager IDYL
Enrolled School
Enrollment by Race/Ethnicity
0%20%40%60%80%
100%
Carter KestrelHeights
CPCFS Voyager IDYL
hispanic black white
Cumulative Enrollment by Race/Ethnicity
10%
42%48%
Hispanic
Black
White

Iredell-Statesville Schools EnrollmentDemographics of participants at Iredell-Statesville Schools
0%20%40%60%80%
100%120%
Hisp
anic
Blac
k
Whi
te
Hisp
anic
Blac
k
Whi
te
Hisp
anic
Blac
k
Whi
te
Hisp
anic
Blac
k
Whi
te
Hisp
anic
Blac
k
Whi
te
Hisp
anic
Blac
k
Whi
te
Hisp
anic
Blac
k
Whi
te
Statesville Third Creek Elem Third Creek Middle NB Mills East Iredell Elem Cloverleaf Northview
Enrolled School
Enrollment by Race/Ethnicity
0%20%40%60%80%
100%120%
Statesville ThirdCreekElem
ThirdCreek
Middle
NB Mills EastIredellElem
Cloverleaf Northview
Hispanic Black White
Cumulative Enrollment by Race/Ethnicity
15%
62%
23%hispanicblackwhite

Major Outcomes to Date

Major Outcomes: Community engagement and education• Over 50 school board meetings to provide expertise and answer questions
~60% k-12 masked in NC~20% unmasked but monitoring and providing data
• Hundreds of faculty to school leadership calls• 10s of school/district-wide staff meetings• Dozens of meetings with community members• Extensive interaction with NCDHHS, DPI, General Assembly
– NC legislation to require access to in-person school (March 2020)
• Extensive educational resources:– Abcsciencecollaborative.org– Testing infographics/flowchart and decision tree– Vaccination videos– Lay summaries and reports– Media briefings on available data– "Year in Review"

School Testing: Testing ResultsKey takeaways and findings from the testing initiative
to date:
• None of the positive cases in the Durham Charter
Schools were identified through the screening testing
initiative; no effect on within-school transmission
• The proportion of positive tests after initiation of the
testing program dropped substantially, suggesting
that the RTS program increased total testing access
and that testing access was not biased by concerns for
test positivity.
Reported cases and secondary transmission in Durham Charter Schools prior to and during testing initiative
STUDENTS STAFFPrimary cases Secondary
Transmission Primary cases Secondary Transmission
Before testing
After testing*
Before testing
After testing*
Before testing
After testing*
Before testing
After testing*
SCHO
OL Carter 0 0 0 0 0 0 0 0
CPSFC 1 4 0 0 0 1 0 0IDYL 0 0 0 0 0 0 0 0
Kestrel 0 0 0 0 0 0 0 0Voyager 1 3 0 0 0 1 0 0
*.
Results of exposure testing after known COVID-19 exposure among students and staff in all ISS prior to and during the testing initiative
Before Testing Program
After Testing Program Totals
N (%) N (%)* N (%)Negative Test 21(42) 275 (91) 296 (84)Positive Test 29 (58) 27 (9) 56 (16)
Totals 50 302 352
*cases not identified through OTA surveillance testing program; they were reported from external sources
-
--

School Testing Results: Effect on Access Key takeaways and findings from the testing initiative to date
• The exposure testing program increased access to testing.
• The percentage of exposed students and staff tested after
the initiation of the testing program increased by 29
percentage points. Only 8% of exposed individuals were
tested prior to the testing program, whereas 37% of
exposed individuals were tested after.
• Access to testing increased in both schools with high
proportions of underserved populations as well as in
schools where the testing program was expanded.
Table 7. Exposure testing access in all Iredell Statesville Schools*
Before testing program
After testing program Total
N (%) N (%) N (%)
Not tested 567 (92) 524 (63) 1091 (76)
Tested 50 (8) 302 (37) 352 (24)Totals 617 826 1443
Table 9. Comparison of exposure testing access in pre-specified Iredell Statesville Schools** vs other Iredell Statesville Schools with expanded testing
Proportion tested before
Proportion tested after
Pre-specified Iredell Statesville Schools 0.09929078 0.285371703
Iredell Statesville Schools participating in expanded testing 0.077731 0.447433
*Pearson chi2(1) = 155.0863 Pr = 0.000**Pre-specified Iredell Statesville Schools include the seven (7) schools previously designated in the grant application to have high proportions of underserved populations
-
-

School Testing Results: Effect on Quarantine DurationKey takeaways and findings from the testing initiative to date
• Duration of quarantine decreased after initiation of
the testing program.
• This has a large impact on reducing the time missed
from school due to quarantine and with-in school
exposures.
Table 10. Days of quarantine in all ISS after in-school exposure*
Before testing program
After testing program Total
N (%) N (%) N (%)
Quarantine<10 days 136 (22) 409 (50) 545 (38)
Quarantine ≥10 days 481 (78) 417 (50) 898 (62)
Total 617 826 1443
Table 11. Days of quarantine in pre-specified ISS
Before testing program
After testing program Total
N (%) N (%) N (%)Quarantine<10 days 32 (23) 196 (47) 228 (41)Quarantine ≥10 days 109 (77) 221 (53) 330 (59)
Total 141 417 558
*Pearson chi2(1) = 113.4200 Pr = 0.000
-
-

Qualitative Investigation: Phase 1– Identify the preferences for and perceived outcomes of school-based SARS-CoV-2 testing
among parents and caregivers of Black and Latino/a/x students and school personnel– Describe factors influencing decisions to return to school among parents and caregivers of
Black and Latino/a/x students

Qualitative Investigation: School Personnel and Parent/Caregiver Perspectives
School Personnel Perspectives Parent/Caregiver Perspectives
Suggestions for School Based Testing:• Parental involvement and consent is needed • The framing/presentation of the testing program to the school
community is important for the acceptance • Communication of clear expectations is important for
acceptance• Communications with parents about school testing should be
science- and data-based• Teacher involvement is important in designing the testing
program to provide input on how best to minimize teacher burden and classroom disruptions
Possible benefits of School-Based Testing• Providing a safe school environment• Providing families with peace of mind• Reducing community spread
Concerns about School-Based Testing• Logistics of the testing procedures• Who is administering the test• How students’ privacy will be maintained• Accuracy of home-based test results• Some parents described experiences with school-based
stigma or discrimination due to race prior to the pandemic

Qualitative Investigation: Main FindingsSchool Personnel Perspectives Parent/Caregiver Perspectives
Suggestions for Return to In-School Learning Facilitators for Return to In-School Learning• •Schools need clear and consistent COVID-19 protocols Providing school-based testing influences some
parental/caregiver decisions • Healthcare professionals should make contact with affected families • School personnel should be notified of students’ test results
because of the exposure risk• Schools should develop plans for keeping students who test positive engaged during the quarantine period • Teachers should prepare take-home materials and care
packages for students who are diagnosed with COVID-19
Barriers for Return to In-School Learning• Decisions about returning to in-school learning were rarely
impacted by experiences with stigma or discrimination prior to the pandemic
• Concern about adherence to safety procedures by parents/caregivers, students, and schools
• The potential for exposure for children and their families

Qualitative Investigation: Dissemination and Program Outcomes
Dissemination of Findings
• Health and education stakeholders received a rapid analysis report that summarizes key points
• Community stakeholders received a rapid analysis report that summarizes key points
• Participants received a brief summary of the research findings, immediately prior to the release of the rapid analysis report
• Education stakeholders received a detailed report after the formal analyses using applied thematic analysis are complete
Outcomes
• Increased interest in participating in future qualitative rounds
• Opportunity to reimagine testing
• Meetings organized with state officials on potential ABC-NC Gov collaboration related to school testing
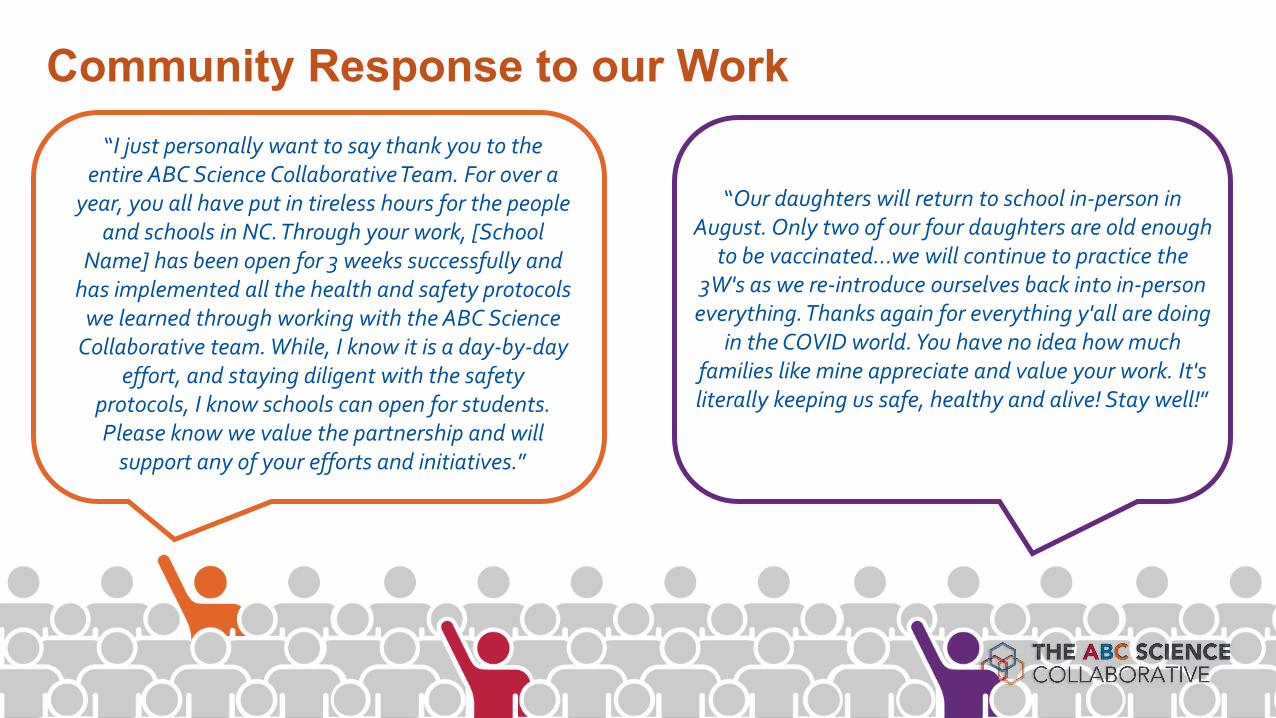
Community Response to our Work“I just personally want to say thank you to the
entire ABC Science Collaborative Team. For over a year, you all have put in tireless hours for the people
and schools in NC. Through your work, [School Name] has been open for 3 weeks successfully and
has implemented all the health and safety protocols we learned through working with the ABC Science
Collaborative team. While, I know it is a day-by-day effort, and staying diligent with the safety
protocols, I know schools can open for students. Please know we value the partnership and will
support any of your efforts and initiatives.”
“Our daughters will return to school in-person in August. Only two of our four daughters are old enough
to be vaccinated…we will continue to practice the 3W's as we re-introduce ourselves back into in-person
everything. Thanks again for everything y'all are doing in the COVID world. You have no idea how much
families like mine appreciate and value your work. It's literally keeping us safe, healthy and alive! Stay well!”

Lessons LearnedSchool Testing and Postulates for Variable Recruitment

School Testing Results: Key Takeaways• In schools where screening testing was conducted, we found:
– Enrollment was lower than expected– No positives– No secondary transmission in schools with mitigation strategies in place
• Offering testing after exposure is helpful – associated with increased testing uptake
• Able to make an impact on missed school days
• Dissemination and response to community requests are important– Can we reimagine our testing program in a way that is most useful for the community?
• Testing can be helpful in schools, but in this political climate, if our goal is safe return to in-person school, k-12 communities need:
– Access to the science in order to weight risks and benefits of COVID-19 mitigation efforts (ex. masking/testing protocol)
– Advocacy from those who understand what is happening on the ground.
*Pearson chi2(1) = 113.4200 Pr = 0.000

Postulates for variable recruitmentPostulate Solution
School leaders and parents may have different goals as it pertains to testing and COVID-19 in general; Families on the fence
may need evidence of benefit
• Continued dissemination of testing results
• Concentration on areas where clear evidence of benefit
• Re-imagine testing program based on feedback from qualitative aims.
COVID-19 fatigue/substantial politicization• Continued community engagement; boots on the ground to be able to relate to parents and
other community members; changing COVID-19 dynamic (delta variant)
Concerns about privacy • At home testing pilot
Hesitancy from school leaders to push testing initiative (end of the year
protocols)
• New school year, new variants, more children in schools may prompt school leaders to
encourage testing
• Important to note that school leaders are facing many obstacles
Parents who decided to return to school this spring may general represent a cohort
that is less interested in testing
• Introduce possibility of testing to new cohort of parents with children returning to school (qualitative study suggests parents who were remote may be interested)
New state resources (from federal funds) to support testing in schools
• So far, schools remain interested in Duke collaboration (relationship and benefit beyond testing)
• Look to collaborate with the state

Next Steps

Next Steps
• Dissemination of findings through manuscripts (Pediatrics supplement)
• Continued dissemination to the public (lay summaries)
• Use data from qualitative evaluation (and available scientific evidence) to revamp testing programs --> expansion of testing opportunities in some partner schools
• Expand reach – collaborations with additional districts
• Collaboration with NCDHHS on state/federally-sponsored testing program
• Qualitative program: phase 2


RADx-UP Return to School Phase I and II Workshop
August 9, 2021
School TLC Study
Support for Safe Return to In-Person School: COVID-19 Testing, Learning, and Consultation
Dana Keener Mast, PhD, ICF
Jennifer Goldman, MD, CMKC
Jennifer Schuster, MD, CMKC

Test Preference StudyAim: Determine preferred testing strategy among students and staff
We collected a nasal swab and saliva sample from 135 study participants and asked,
“Which test did you like better?”
135 study participants50% students 50% adult staff54% female32% Hispanic/Latino21% Black non-Hispanic34% White non-Hispanic13% Other race

Most participants preferred the nasal swab
Test preference varied by age group, with adults strongly preferring the nasal swab and elementary students split almost 50/50Saliva
test27%
Nasal swab73%
49%
66%
91%
51%
34%
9%
Elementary Students (n=39)
Middle/High Students (n=29)
Adult Staff (n=67)
Nasal swab Saliva test
Testing Preference Study 219

Hispanic/Latino participants slightly preferred the saliva test-this group included more
elementary students
47%
86%
89%
78%
53%
14%
11%
22%
Hispanic/Latino (n=43)
Black Non Hispanic (n=28)
White Non Hispanic (n=46)
Other (n=18)
Females had a stronger preference for the nasal swab than males
84%
61%
16%
39%
Female (n=73)
Male (n=59)
Testing Preference Study

Those who preferred the nasal swab… (n=99)
…liked the nasal swab better because
It was faster (60%)
It was easier (60%)
…did not like the saliva test as much because
It took too long (51%)
It was hard to do (49%)
It was gross (28%)
Testing Preference Study 221

Those who preferred the saliva test… (n=36)
…liked the saliva test better because
It was easier (39%)
Did not like the other one (22%)
It felt better (22%)
…did not like the nasal swab as much because
It was uncomfortable (44%)
It was painful (28%)
Testing Preference Study 222

Formative Needs Assessment
Aim: Identify attitudes, knowledge, and barriers that influence choice to enroll in testing and return to in-person learning
Parent Survey
n=261
40 questions
Topics:In-person schoolingCOVID-19 testing &
vaccinationSchool communications
Parent Interviews
n=21
30 minutes
Topics:In-person schoolingCOVID-19 testing &
vaccinationSchool communications
Staff Interviews
n=10
30 minutes
administrators, nurses, teachers, district staff
Topics: Needs, barriers, testing, school communications

Parents largely support COVID-19 testing in school
Do you like that your child’s school offers COVID-19 testing at
school?
Yes61%
Some31%
No8%
Do you believe COVID-19 testing helps keep students and staff
safe in school?
Yes62%
Some28%
No10%
Does COVID-19 testing at school make you feel more comfortable with your child going to school in
person?
Yes51%Some
34%
No15%
224
Even so, less than 4% of students enrolled in testing in phase 1
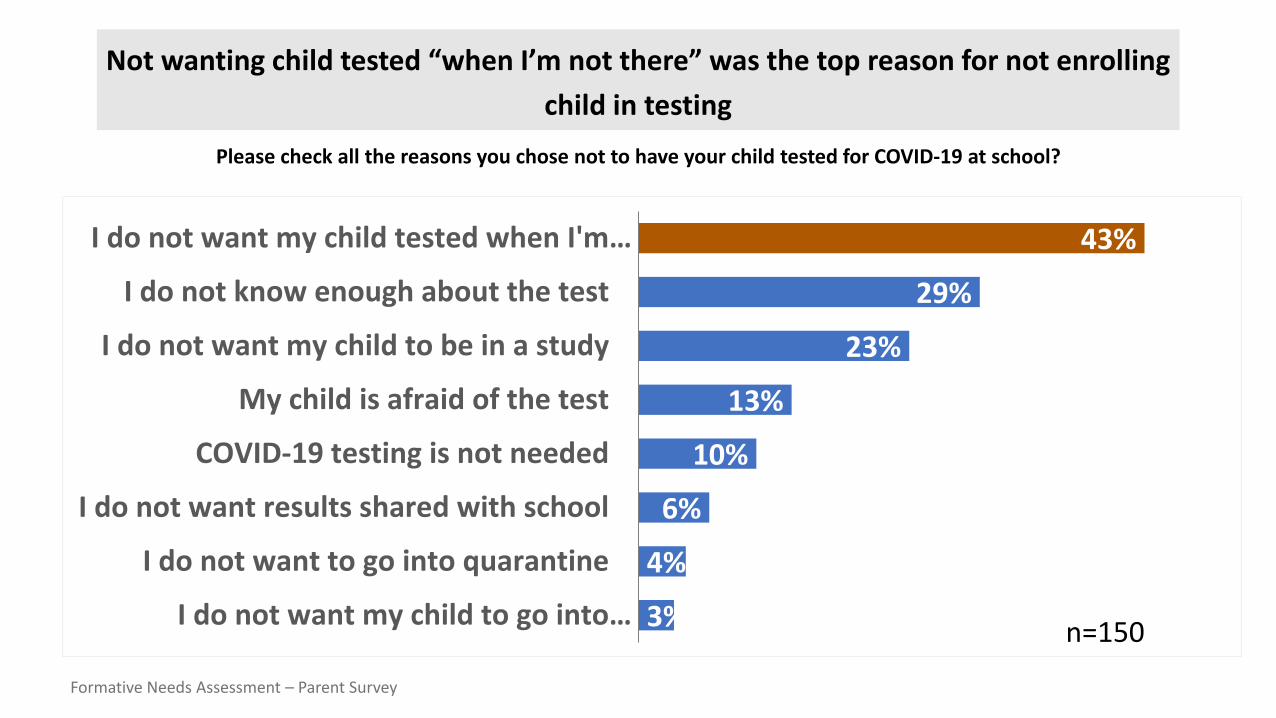
Not wanting child tested “when I’m not there” was the top reason for not enrolling child in testing
Please check all the reasons you chose not to have your child tested for COVID-19 at school?
43%
29%
23%
13%
10%
6%
4%
3%
I do not want my child tested when I'm…
I do not know enough about the test
I do not want my child to be in a study
My child is afraid of the test
COVID-19 testing is not needed
I do not want results shared with school
I do not want to go into quarantine
I do not want my child to go into… n=150
Formative Needs Assessment – Parent Survey
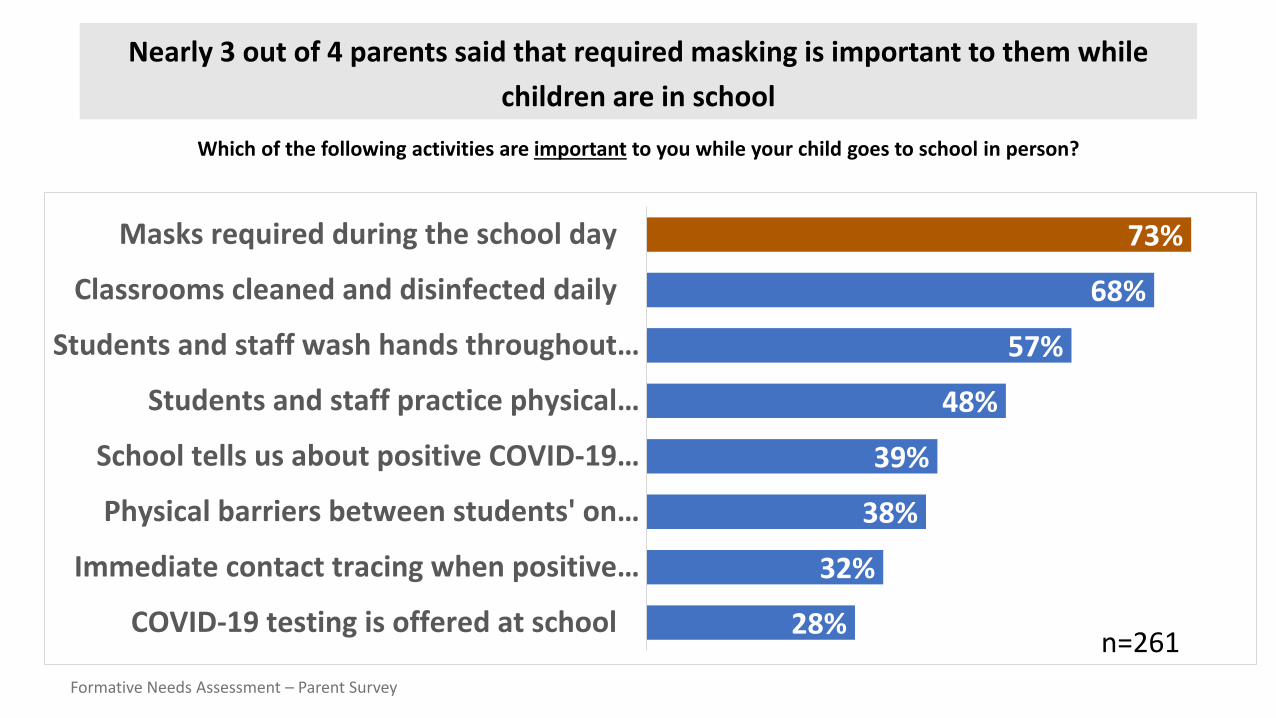
Nearly 3 out of 4 parents said that required masking is important to them while children are in school
Which of the following activities are important to you while your child goes to school in person?
73%
68%
57%
48%
39%
38%
32%
28%
Masks required during the school day
Classrooms cleaned and disinfected daily
Students and staff wash hands throughout…
Students and staff practice physical…
School tells us about positive COVID-19…
Physical barriers between students' on…
Immediate contact tracing when positive…
COVID-19 testing is offered at school
Formative Needs Assessment – Parent Survey
n=261
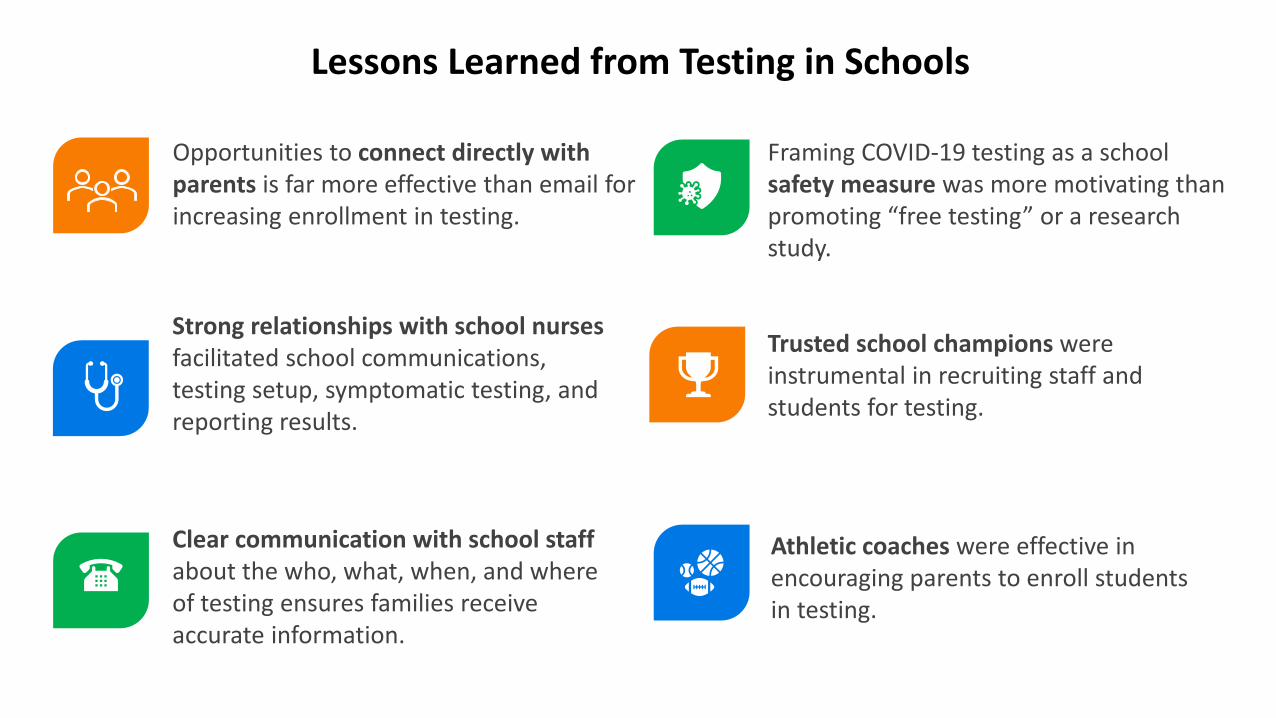
Lessons Learned from Testing in Schools
Opportunities to connect directly with parents is far more effective than email for increasing enrollment in testing.
Strong relationships with school nurses facilitated school communications, testing setup, symptomatic testing, and reporting results.
Clear communication with school staff about the who, what, when, and where of testing ensures families receive accurate information.
Framing COVID-19 testing as a school safety measure was more motivating than promoting “free testing” or a research study.
Trusted school champions were instrumental in recruiting staff and students for testing.
Athletic coaches were effective in encouraging parents to enroll students in testing.

School in Session Summer School in Session
Total Enrolled = 152 Total Tested = 140228

Strategies to Address Testing Fatigue
• We have not done repeat testing to date, but will begin weekly testing in the Fall
• Surge in Delta variant is renewing commitment to COVID-19 mitigation
• Messaging “Help us keep kids safe and in school”

Phase 2: Enhanced Intervention
COVID-19 Testing• Weekly screening• Symptomatic testing• Nasal swab
Medical Consultation• Monthly school walk-
throughs and consults• Bimonthly COVID-19
quick facts• Family forums
masking behavior
Tailored Communications
• Multicultural messaging• Microsite
communicationresources hub
• Social media buys• Targeting testing and

Phase 2: Comparative Outcomes Study
Aim: Determine how schools receiving enhanced intervention compare to schools receiving “testing as usual” on key metrics
Metrics
Absenteeism
Case counts
Vaccination rates
Parent satisfaction
Data Sources
Secondary district and school data
Repeated parent survey

07/21/20
Safe Return to School for Children with
Intellectual/Developmental Disabilities
Luther Kalb, PhD, MHSDirector of Informatics
Center for Autism and Related DisordersDepartment of Neuropsychology
Kennedy Krieger Institute
Assistant ProfessorDepartment of Mental Health
Johns Hopkins Bloomberg School of Public Health
Chair, National Research Consortium on MH-IDDCenter for START Services
University of New Hampshire
232

23307/21/20
Co-PIs
Christina A Gurnett, MD, PhD Ernest and Jane G. Stein Professor of Developmental NeurologyDirector of the Division of Pediatric and Developmental NeurologyCo-Director of the IDDRC Washington University in St Louis
Jason Newland, MD, M.Ed.Professor of PediatricsPediatric Infectious DiseasesWashington University, St. Louis

23407/21/20
Impact of COVID-19 on persons with IDD
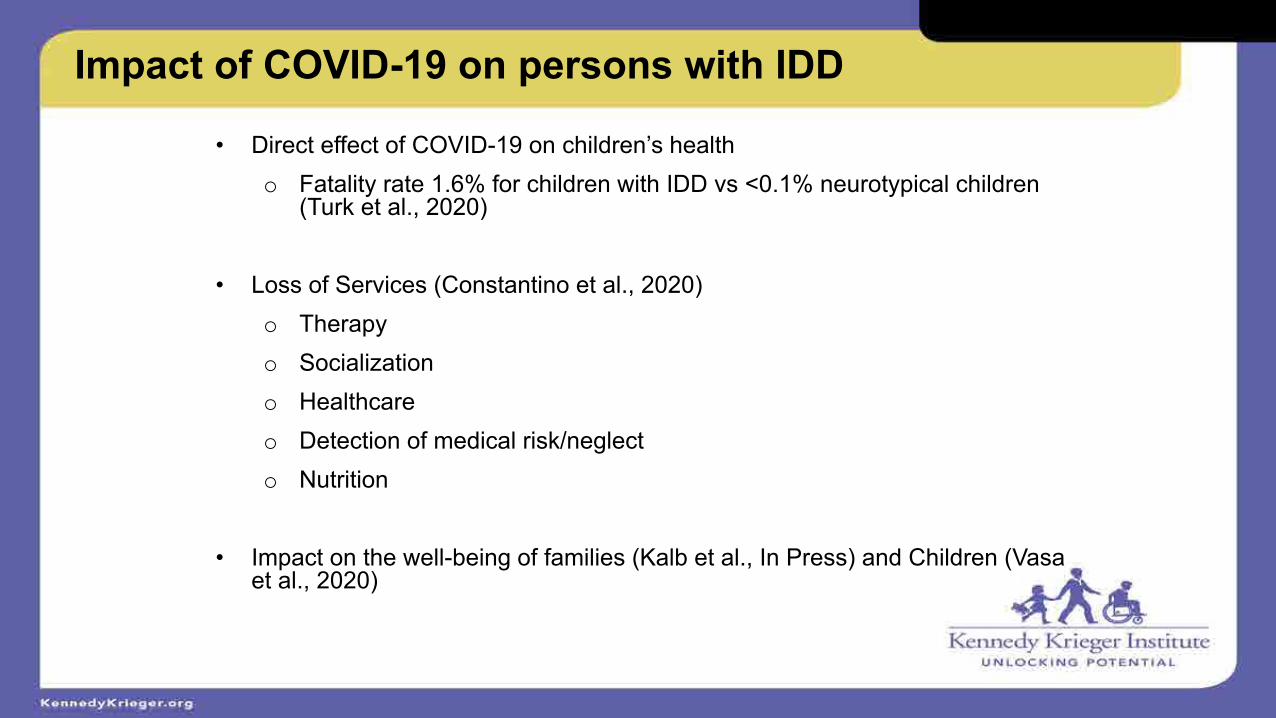
23507/21/20
Impact of COVID-19 on persons with IDD
• Direct effect of COVID-19 on children’s healtho Fatality rate 1.6% for children with IDD vs <0.1% neurotypical children
(Turk et al., 2020)
• Loss of Services (Constantino et al., 2020)o Therapyo Socializationo Healthcareo Detection of medical risk/neglecto Nutrition
• Impact on the well-being of families (Kalb et al., In Press) and Children (Vasa et al., 2020)

23607/21/20
COVID-related Challenges in IDD
• Wearing a face mask
• Social distancing
• Hand hygiene
• Difficulty reporting symptoms
• Potential for multiple exposures (aides, therapists, bus drivers)

23707/21/20
In Press
• Sherby, M., et al. for the COMPASS-T Study Group. SARS-CoV-2 Screening Testing in Schools for Children with Intellectual and Developmental Disabilities. Journal of Neurodevelopmental Disorders.

23807/21/20
Specific Aims
• To evaluate the impact of implementation strategies on the uptake of weekly SARS-CoV-2 testing in students with IDD and school staff through a blocked, randomized adaptive clinical trial.
• To assess perspectives among parents of students with disabilities who do not return to in-person instruction regarding the impact of COVID-19 and importance of SARS-CoV-2 testing and vaccine
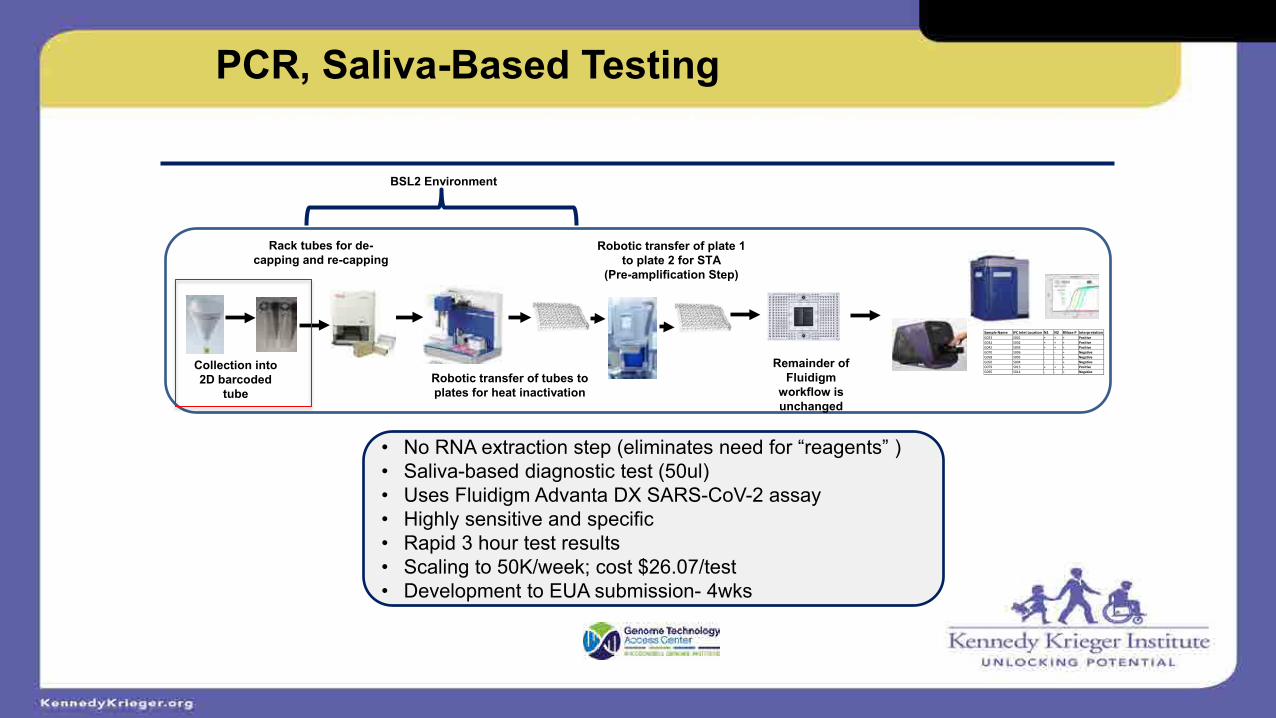
23907/21/20
PCR, Saliva-Based TestingSARS-CoV-2 diagnostic test developed at Washington University
BSL2 Environment
Collection into 2D barcoded
tube
Rack tubes for de-capping and re-capping
Robotic transfer of tubes to plates for heat inactivation
Remainder of Fluidigm
workflow is unchanged
Sample Name IFC Inlet Location N1 N2 RNase P InterpretationG023 S001 + + + PositiveG032 S002 + + + PositiveG042 S003 + + + PositiveG070 S006 - - + NegativeG058 S005 - - + NegativeG050 S004 - - + NegativeG079 S013 + + + PositiveG095 S014 - - + Negative
Robotic transfer of plate 1 to plate 2 for STA
(Pre-amplification Step)
• No RNA extraction step (eliminates need for “reagents” )• Saliva-based diagnostic test (50ul)• Uses Fluidigm Advanta DX SARS-CoV-2 assay• Highly sensitive and specific• Rapid 3 hour test results• Scaling to 50K/week; cost $26.07/test• Development to EUA submission- 4wks

24007/21/20
Setting (N=500 students and staff)
Fairmount Montgomery
LEAP High School

24107/21/20
Picture of testing staff
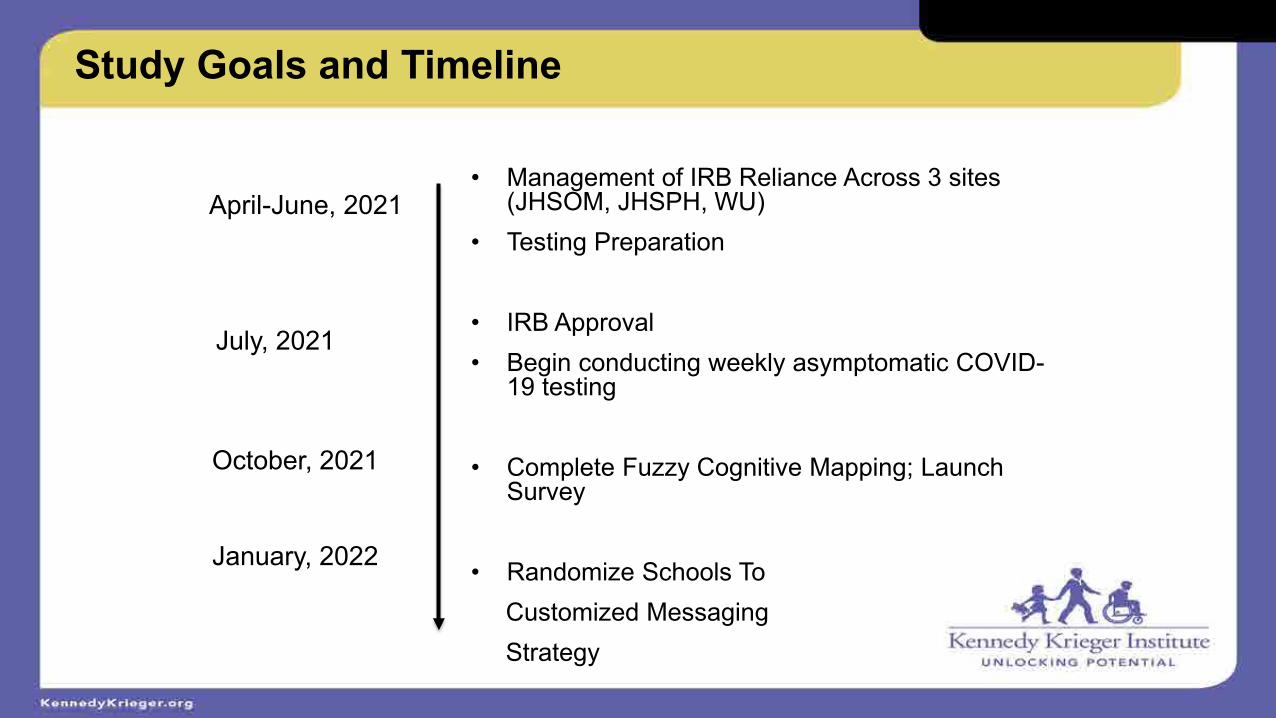
24207/21/20
Study Goals and Timeline
April-June, 2021
July, 2021
October, 2021
January, 2022
• Management of IRB Reliance Across 3 sites (JHSOM, JHSPH, WU)
• Testing Preparation
• IRB Approval• Begin conducting weekly asymptomatic COVID-
19 testing
• Complete Fuzzy Cognitive Mapping; Launch Survey
• Randomize Schools To Customized Messaging Strategy

24307/21/20
Outcomes
• Enrolled N=87 Staff, N=2 Students
• Completed N=347 Tests
• N=1 Positive Case

24407/21/20
Challenges
• Teacher survey examining COVID-19 preventive strategies
• June, 2021
• N=230 (63% MD/DC, 37% MO)
• Testing is not highrated
ly

24507/21/20
Challenges• Central IRBs should be taken into start-up consideration
• KKI Schools have just returned to in-school instruction
• Heavy staff turn over makes this “one more thing”; lack of incentive
• History of scientific misconduct at KKI (lead abatement study) and JHU (Henrietta Lacks)
• Lack of utility due to vaccines (and KKI requirements) as well as low regional positivity rate
• Parental concerns about managing positives tests among students as well as testing logistics

24607/21/20
Immediate Solutions
• Met with Missouri and Maryland Community Advisory Boards
• Rolling out an advertisement campaign in September to promote upcoming study incentive ($5 per test; $200-250 max)
• New Flyers, Phone and Email Scripts
• Reporting results in Bi-Weekly Newsletter (parents/staff)
• Present at Back-to-School Night and Staff Professional Development Days
• Increase Age of Student Enrollment (from 17 to 22)
Fll P Atil i KKI i
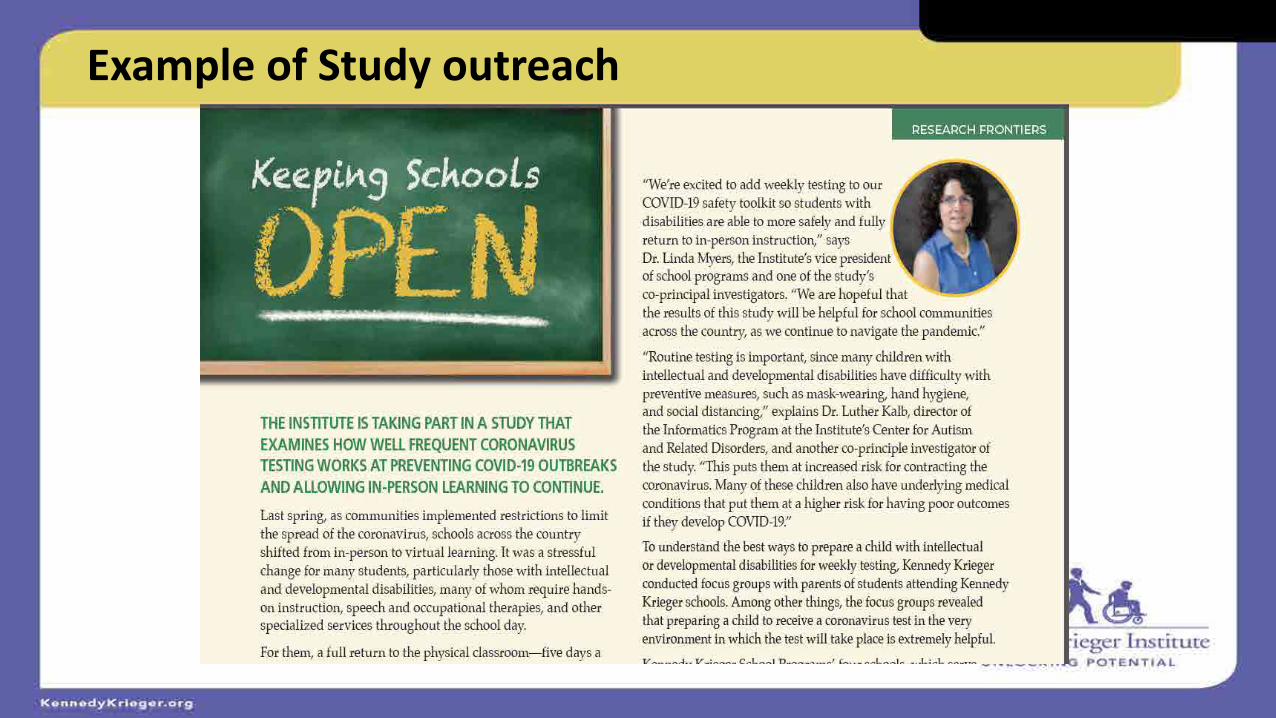
24707/21/20
Example of Study outreach

24807/21/20
Long Term Solutions
• Tik-Tok Video
• Stickers
• Novel Messaging Campaign in January
24907/21/20
Thank You

Acknowledgements
The COMPASS-T Study Team:
John N. Constantino, MD, Washington University School of Medicine, St. Louis, MO
Bradley L. Schlaggar, MD, PhD, Kennedy Krieger Institute, Baltimore, MD
Victor B. Brodskey, MD, Washington University School of Medicine, St. Louis, MO
Julie A. Neidich, MD, Washington University School of Medicine, St. Louis, MO
Albert M. Lai, PhD, Institute for Informatics, Washington University School of Medicine, St. Louis, MO
Brett B. Maricque, PhD, McDonnell Genome Institute, Washington University School of Medicine, St. Louis, MO
Luther G. Kalb, PhD, Kennedy Krieger Institute, Baltimore, MD
Linda S. Myers, EdD, Kennedy Krieger Institute, Baltimore, MD
George S. Gotto IV, PhD, Institute for Human Development, University of Missouri-Kansas City, Kansas City, MO
Stephanie A. Fritz, MD, MSCI, Washington University School of Medicine, St. Louis, MO
Esther Lu, PhD, Washington University School of Medicine, St. Louis, MO
Virginia R. McKay, PhD, Institute for Public Health, Brown School of Social Work, Washington University in St. Louis, St. Louis, MO
Stephanie M. Morris, MD, Washington University School of Medicine, St. Louis, MO
Byron J. Powell, PhD, Institute for Public Health, Brown School of Social Work, Washington University in St. Louis, St. Louis, MO
Nancy B. Mueller, MPH, Brown School Evaluation Center, Washington University in St. Louis, St. Louis, MO
James M. Dubois, PhD, Institute for Public Health, Brown School of Social Work, Washington University in St. Louis, St. Louis, MO
Joyce E. Balls-Berry, PhD, Institute of Clinical and Translational Sciences, Washington University School of Medicine, St. Louis, MO
Charlene A. Caburnay, PhD, MPH, Health Communication Research Laboratory, Brown School of Social Work, Washington University in St. Louis, St. Louis, MO
Bradley Schlaggar, MD, PhD – Kennedy Krieger Institute, Baltimore, MD
Maureen Van Stone, JD, MS – Kennedy Krieger Institute, Baltimore, MD

COV-IDD: Testing for COVID-19 in childrenwith intellectual and developmental disabilities
John Foxe, Martin Zand, Stephen DewhurstUniversity of Rochester Intellectual & Developmental Disabilities Research Center (UR-IDDRC)

URMC / Mary Cariola Center Partnership
Mary Cariola Center (MCC) serves moderate-to-severe IDD children (N=425) via a large professional support staff (N=450). 70% of MCC students live in poverty, and 33% are from under-represented minority backgrounds. 100% are on federal food assistance programs.

Five Major Goals:
1)Virological Testing: We will establish a nasal-swab FDA-approved testing regimen to monitor and identify disease outbreak in a school setting at ultra-high risk for COVID-19 transmission. We will rapidly identify infections and develop approaches for isolating and contact-tracing to stem virus spread.
2)Serological Testing: Serology will establish background immunity levels in students and staff, from infection or vaccination, following those who are antibody-positive longitudinally to quantify temporal decay of IgG and neutralizing antibody levels. We will determine whether protective immunity in children with IDD, a population with prevalent immunological dysfunction, wanes at accelerated rates compared to the population-at-large.
3)Modeling to Optimize Testing: We will use agent-based simulation models to guide testing strategies and interventions in this specialized population. Simulations will be conducted interactively and iteratively, to assist in planning and implementation of testing procedures.
4)Mobile Testing Unit: We will deploy a customized, disability-enabled, mobile testing unit to directly deliver rapid flexible testing wherever need arises.
5)Overcoming Testing & Vaccine Anxiety/Hesitancy: We will conduct focus groups to identify community concerns, myths and misconceptions about testing and vaccination, and create a multimodal educational campaign that addresses and mitigates these concerns.

The Mobile Testing Unit
We will staff, equip and deploy a customized, disability-enabled, mobile unit to bring testing directly to the MCC community for optimal testing flexibility. A new van has been procured and we are working with Marketing to design a wrap similar to the UR Vision Van.

Molecular Testing for SARS-CoV-w at the URMC Central Laboratories
UR Medicine Central Laboratory COVID-19 Testing Capacity and Modalities
Assay Platform ManufacturerCapacity
Tests/Day MethodFDA
Emergency Use Authorization
TaqPath COVID-19 High-
Throughput Combo Kit
Amplitude Solution
Thermo Fisher Scientific 3000-6000 RT-PCR YES
cobas SARS-CoV-2cobas 8800
System
Roche Molecular Systems
2000 RT-PCR YES
Xpert Xpress SARS-CoV-2
GeneXpert Infinity Cepheid 500 RT-PCR YES
RADx-UP samples will be primarily tested on the Thermo Fisher Scientific Amplitude system:• High-throughput with readily available testing reagents• Three targets (N gene, ORF1ab gene, S gene) for higher specificity and
lower risk for mutations affecting assay performance• Automated, 3.5 hour run time
The UR Medicine Central Laboratory has tested over 750,000respiratory specimens for SARS-CoV-2 sincethe beginning of the pandemic with an average TAT of 24 hours
Clinical serological testing will be performed on the Abbott Architect platform using the SARS-CoV-2 IgG assay
•Intended for the qualitative detection ofIgG against the SARS-CoV-2 nucleocapsidprotein
oHigh sensitivity (~97%) and specificity (~99%)
•Assay: SARS-CoV-2 IgG assay
•Platform: ARCHITECT System
•Manufacturer: Abbott Laboratories Inc
•Capacity: High-throughput (500-800 perday)
•Method: Chemiluminescent microparticleimmunoassay (CMIA)
•FDA Emergency Use Authorization

Scientific Questions
How does IgG antibody reactivity against SARS-CoV-2 change over time in teachers, staff, and IDD students?
What are the platforms of IgG cross-reactivity to circulating coronavirus strains?
What are the rates of asymptomatic transmission in vaccinated staff and IDD students?

Scientific Questions and General Deliverables
Questions:1. What testing patterns and frequency are needed to:
• Detect asymptomatic SARS-CoV-2• Minimize risk of transmission of SARS-CoV-2• Monitor classroom immunity
2. What changes in contact, immunity, and classroom structure maximize student and staff attendance?
• Class size• Contact patterns• Community prevalence of viral variants
Deliverables – Flexible models that could be adapted to different school staff and student configurations allowing “what if?” scenario modelling

Major Outcomes to Date
• IRB approved 3/31/21• Enrollment began 5/11/21• Testing began 5/21/21• Currently 147 participants enrolled - 124
Mary Cariola staff & 23 Mary Cariola students• 592 RT-PCR tests processed- 509 negative
SARS-CoV-2 & 83 awaiting results• 211 Finger-sticks collected on 116 unique
participants (89% staff and 11% students)• 108 Serological test results

Lessons Learned Regarding School Testing
We have experienced some issues in obtaining nasal swab specimens for PCR testing.
The issue arises mainly in the older students who are mostly able towalk, and move on their own. Distracting them to successfully collect nasal swabs has been challenging. Negative experiences from prior nasal swab specimen collection may also be a factor.
We have had better success at obtaining nasal swabs from Mary Cariola students who are younger and more “medically fragile”. They do not have the ability to stand up, push us away, dodge the nasal swab, etc.
Due to this discovery, the project team is considering the collection of saliva as an alternative to the nasal swab when that specimen is unobtainable. The Mary Cariola team has concurred that saliva collection for PCR testing could be more successful, since the kids often need help brushing their teeth and sometimes simply eating and drinking.

Postulates for Variable Recruitment
We’ve implemented a number of different approaches to engage with Mary Cariola’s parents and staff. Key lessons learned to date from the initiatives:
• Postcards sent in backpacks raise awareness but, with few exceptions, does not lead to action (i.e. calling about the study).
• Given the multiple competing priorities of their lives, many parents are not in a position to add one more task to their day (i.e. calling about study enrollment).
• The term research or study is a turn off to some parents so using that terminology early in the discussion may lead to a premature end to the conversation.
• Linking study outreach with existing events or activities is viable to both raise awareness and identify those interested in or potentially interested in enrolling. Individual outreach or conversations are important for many parents. For staff, engaging them through events (i.e. staff appreciation day) is a successful approach.
• Offering seasonal treats and T-shirts have a significant impact (i.e. ice cream trucks/ shaved ice trucks)

Representation for Recruitment for Mary Cariola Staff
Enrolled MCC Staff by Age
Entire MCC Staff by Age
Enrolled MCC Staff by Race
Entire MCC Staff by Race
Enrolled MCC Staff Gender
by
Entire MCC Staff by Gender

Representation for Recruitment for Mary Cariola Students
EnrolledMCCStudents by Age
EntireMCCStudents by Age
EnrolledMCCStudents by Race
EntireMCCStudents by Race
EnrolledMCCStudents by Gender
EntireMCCStudents by Gender

Testing Fatigue
No Known Issues to Date

Leveraging State Testing Resources
Developing Situation- Dr. Michael Mendoza from the Monroe County Health Department has informed the Mary Cariola team that it’s unlikely that there will be a COVID vaccine for children under 12 before the Fall.Given the Delta Variant, there’s a push for vaccination and mandated COVID testing in schools, which aligns well with our study as it offers free testing for participating Mary Cariola staff and students.

Overcoming Testing & Vaccine Hesitancy; Measuring Impact
1. Focus group interviews with priority populations
2. Targeted strategies to increase understanding of the COVID-19 vaccine
3. Effective communication tools/media(social/digital, web, PR, testimonials)
4. On-the-ground education (speakers’ bureau; “table talk”)
5. Graphic medicine (innovative visual media and art
Overcoming Vaccine Hesitancy

PROMIS: Patient-Reported Outcome Measurement Information System

UR Voice: Data Collection
Total, Mar 20213.28 million scores
280,496 unique patients
Start, Feb 2015
PROMISAdult
Domains2.5 million
scores (76%)
Physical Function
Pain Interference
Depression
PROMISPediatric /
Parent Proxy
Domains 242,917scores (7%)Non-PROMIS
556,285scores (17%)
PROMIS CATs
44seconds
Median time to complete assessment
4items
Median items answered perassessment
98.2%completed

Key Innovations
1. Highly Significant Population – kids with IDD
2. Longitudinal Serology – assess durability of immunity in kids with IDD
3. Mobile Testing Unit – to reach kids at home
4. Agent-Based Modelling – to derive high efficiency adaptive testing regimen.
5. Use of PROMIS – to measure impact rapidly (and scalably); opportunities for machine learning

Return to School Workshop
Safe Return to SchoolAssessing Testing Strategies in Middle & High Schools
August 9,2021

Project Goals
• Determine the best COVID-19 testing strategy to limit COVID-19 transmission in middle and high schools
• Provide easy access to free saliva-based testing to all of the school community (staff, students, household members)
• Staff and students in some middle and high schools will be offered weekly testing
• Partner with our community in listening sessions to better understand COVID-19 testing, vaccinations and in-person school


Testing Results
389 tests amongst 289 people
39 positive tests
Both screening and community drive up testing available

Cumulative Testing
Numbers (Drive up +
Surveillance)
Hispanic/Latino Not Hispanic/Latino Unknown/Not Reported
Female Male Non-Binary Female Male Female Male
Black or African American 0 1 1 115 75 1 2
White 1 2 0 38 24 0 0
-

Age Group BreakdownOverall Tests
6
81
60
226
16
People Tested
6
[VALUE]
56
149
3
Under 5 Five - Eleven Twelve - Seventeen Eighteen + Not Reported

Positivity Rate Including Weekly Screening
0.0
10.0
20.0
30.0
40.0
50.0
60.0
70.0
80.0
90.0
100.0
Posit
ivity
Rat
e (%
)
Positivity rate (with screening)
St. Louis County Positivity Rate
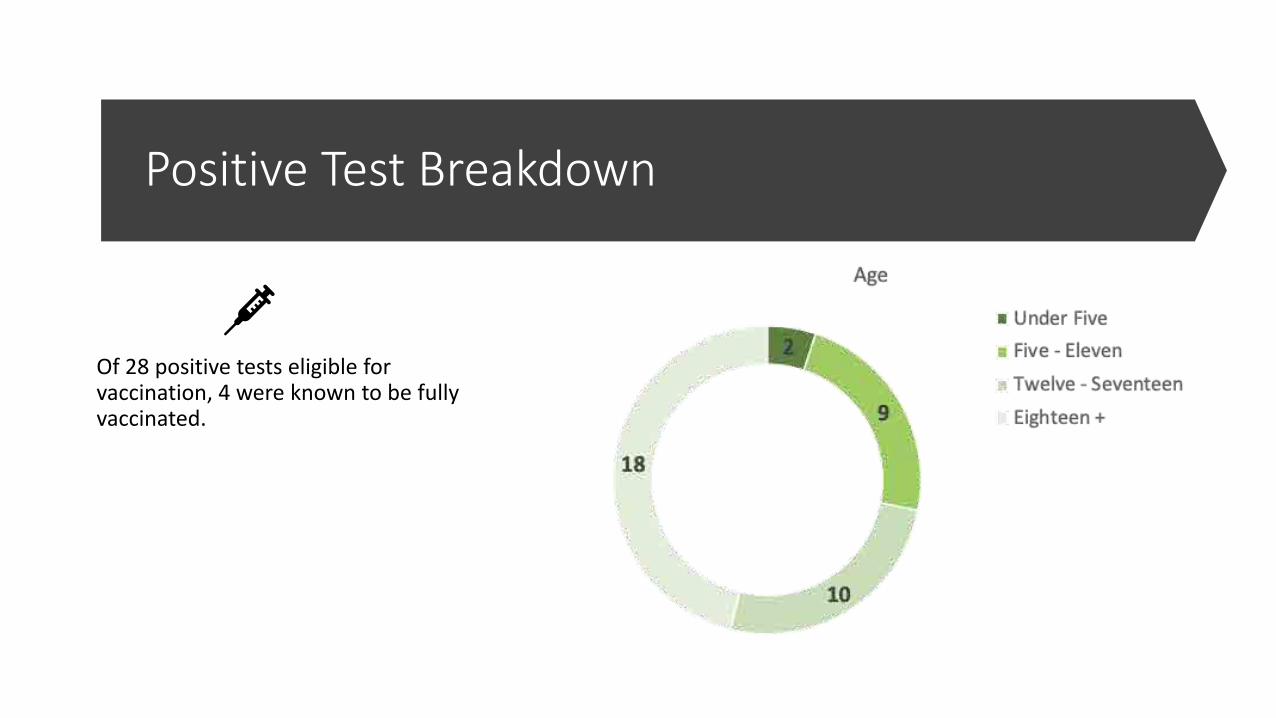
Positive Test Breakdown
Of 28 positive tests eligible for vaccination, 4 were known to be fully vaccinated.

Community Advisory Board
• CAB Composition• School district representatives• Community partners• Parents• Students
• Meets monthly• Stipends provided• Working to expand participation among
students and parents

Key Themes
• Lead with caring
• Go beyond testing and engage community
• Improved equity and systems change should be a priority
• Clarity, transparency, and simplicity is key in all aspects of communication
• Clarify what is meant by “safe”
• Visuals help
• Engaging students requires a unique approach

Qualitative Data Collection
• Administrator Interviews• Superintendents interviews
complete (n=5/5)• School Principals recruiting and
conducting interviews now (n=3/16)
• Listening Sessions
• Parents/caregivers• Staff/Teachers• Students (n=3)
• Recruiting now

Lessons Learned
• Relationships and trust are essential• Continuous improvement and
feedback to improve the process• Ask and learn from the community• Engaging CAB and Community
Partners in recruitment is essential• Participating in Back to School
events and Professional Learning Meetings increases engagement

Recruitment Challenges• Summer schedules can be obstacles• Difficulty in reaching students to become
interested in testing• Recruitment video being developed• T shirts supporting the project
• Lack of trust in testing• Continued testing awareness for the
drive-up testing• Social media being utilized in the districts• New website being developed

Next Steps• School district meetings• Back to school events • Conduct listening sessions• Expand Community Advisory Board
• More Students and Parents
• Coordinate with community partners to support participants
• Promote vaccination

Ordinary people with extraordinary vision can redeem the soul of America by getting in what I call good trouble.
John LewisJuly 17, 2020NY Times

Thank You