radiotherapy services in england 2012 · department of health cancer policy team 6 november 2012...
TRANSCRIPT

Radiotherapy Services in England 2012

Radiotherapy Services in England 2012
2
DH INFORMATION READER BOX
Policy Clinical EstatesHR / Workforce Commissioner Development IM & TManagement Provider Development FinancePlanning / Performance Improvement and Efficiency Social Care / Partnership Working
Document Purpose
Gateway Reference
Title
Author
Publication DateTarget Audience
Circulation List
Description
Cross Ref
Superseded Docs
Action Required
TimingContact Details
0
The report is aimed primarily at commissioners and service providers and sets out the up to date position on the state of radiotherapy services in England. It utilises the radiotherapy dataset to assess whether the NRAG metrics remain current, setting revised metrics where appropriate
N/A
Department of Health Cancer Policy Team
6 November 2012PCT Cluster CEs, NHS Trust CEs, SHA Cluster CEs, Foundation Trust CEs , Medical Directors, Directors of Nursing, PCT Cluster Chairs, NHS Trust Board Chairs, Special HA CEs, Directors of HR, Directors of Finance, Allied Health Professionals, GPs, Communications Leads, Emergency Care Leads, Directors of Children's SSs
#VALUE!
Improving Outcomes: A Strategy for Cancer
0
For information
0
18206
For Information
For Recipient's Use
Radiotherapy in England 2012
00
Tracy ParkerDepartment of Health Cancer Policy Team020 7972 6021

Radiotherapy Services in England 2012
3
Radiotherapy Services in England 2012 First published: 6 November 2012
Prepared by
This report has been prepared by the National Radiotherapy Implementation Group (NRIG). This group was established to advise the DH and Ministers on radiotherapy services in England and to oversee and provide national support to local services in implementing the recommendations of the National Radiotherapy Advisory Group (NRAG) report published in 2007. The group includes representatives of all relevant professional bodies, commissioners, service managers as well as lay representatives1.
Gateway ref: 18206
1 http://ncat.nhs.uk/radiotherapy#tab-overview

Radiotherapy Services in England 2012
4
This is a radiotherapy treatment plan for Head and Neck Cancer using Intensity Modulated Radiotherapy, showing the use of IMRT to spare both the spinal cord and the salivary glands from unnecessary radiation dose.

Radiotherapy Services in England 2012
5
Contents
Foreword ........................................................................................................................ 6 1. Executive summary ....................................................................................................... 7 2. Introduction .................................................................................................................. 12 3. The Standard of Care .................................................................................................. 14 Activity ........................................................................................................................... 16 Standard of Care ........................................................................................................... 18 Access to radiotherapy .................................................................................................. 24 Variation in fractionation ................................................................................................ 27 Specialist techniques ..................................................................................................... 31 4. Service Delivery ........................................................................................................... 34 Waiting times ................................................................................................................. 34 Productivity .................................................................................................................... 35 Opening hours ............................................................................................................... 37 Safety ............................................................................................................................ 38 Equipment ..................................................................................................................... 39 Workforce ...................................................................................................................... 41 5. Commissioning ............................................................................................................ 48 Strengthening commissioning ........................................................................................ 48 6. Research ...................................................................................................................... 50 Implications for the service from current research ......................................................... 51 7. Patients and the Public ............................................................................................... 52 Patient experience ......................................................................................................... 52 The national radiotherapy awareness initiative .............................................................. 52 Patient Information (treatment and choice) .................................................................... 53 8. Looking ahead to 2020 ................................................................................................ 54
Annexes Annex A – Radiotherapy terminology ............................................................................ 55 Annex B – Productivity Matrix ........................................................................................ 56 Annex C – Radiotherapy Master Table .......................................................................... 56

Radiotherapy Services in England 2012
6
Foreword In August 2011, we published our analysis of the first full year’s collection of the radiotherapy dataset. This year, we wanted to use the data to demonstrate what it really tells us about radiotherapy services across the country. We have also taken this opportunity to use the data to assess whether the metrics for radiotherapy services, established by the National Radiotherapy Advisory Group report in 2007, remain current. Radiotherapy remains a priority for the service as reflected in the NHS Operating Framework for 2011-12, recognising that, to improve outcomes from radiotherapy, commissioners should ensure that access rates and the use of advanced radiotherapy techniques, such as Intensity Modulated Radiotherapy, are appropriate for their populations. It is heartening that much progress has been made but this report shows that there is more to be done to ensure that the right access levels are reached and that the service has the capacity to deliver at those levels. It also identifies variation in doses of radiotherapy prescribed by clinicians around the country; local services now need to examine how much of this variation is clinically appropriate. Importantly, the report provides information that will enable services to see at a glance how they are progressing against a number of metrics. We encourage both providers and commissioners to use the information now available to compare themselves with other centres, to learn from the best and to continue to improve the contribution that radiotherapy can make, not only to saving lives, but across all of the NHS Outcome Framework Domains. Anna Soubry MP Parliamentary Under-Secretary of Health for Public Health
Radiotherapy in England 2012
7
1. Executive summary 1.1 The report is aimed primarily at commissioners and service providers and sets out the up
to date position on the state of radiotherapy services in England. It utilises the radiotherapy dataset to assess whether the National Radiotherapy Advisory Group (NRAG) report 2007, metrics remain current, setting revised metrics where appropriate.
1.2 The NRAG report made recommendations using the term "fractions", we are now using the term "attendances" (which is a more appropriate and accurate measure) and the revised numbers will be slightly lower because variations in the way that parts of the service had previously counted the numbers have now been corrected.
1.3 The key finding of the NRAG report was that an increase of 63% in activity in 2005 was required to achieve optimal treatment levels. It concluded that commissioners needed to commission more attendances for radiotherapy treatment for their populations and plan for further expansion and that access to treatment should be provided in a timely manner.
1.4 The gap in activity in 2005 was estimated from a Royal College of Radiologists (RCR) survey, which showed a total of 1.5m attendances delivered when 2.5m were required. The Radiotherapy Data Set (RTDS) now holds three years’ data. In 2010-11, activity was 1.7m, the equivalent of 33,000 attendances per million population (pmp). This means that there has been a 13% increase in activity over six years, a considerable improvement, but significant under-provision remains.
1.5 However, the population continues to grow and age with a consequence increase in cancer incidence that drives an increased demand for radiotherapy of 2.3% per year.
1.6 A new modelling tool, launched at the end of 2011, has examined best practice in radiotherapy prescribing and combined it with detailed local population data. It shows the requirement for 2010 as 48,000 attendances pmp. This suggests that a 45% increase in attendances is now required to close the gap in provision. However, the requirement will need to increase to 55,000 by 2016 to meet rising demand, a 67% increase.
1.7 The NRAG report recommended that the future technical standard for radical treatment would be four-dimensional adaptive radiotherapy (4D ART) to take account of tumour of volume in three dimensions and any changes occurring over time. At present, only 40 to 50% of machines used to deliver radiotherapy have 3D Image Guided Radiotherapy (IGRT). Intensity Modulated Radiotherapy (IMRT), used in conjunction with this more sophisticated IGRT, is fundamental to the delivery of 4D ART.
1.8 Although almost all machines are IMRT enabled, uptake has been slow. A recent survey has shown that, while 33% of all radical fractions should be delivered with IMRT (and 24% using inverse planned IMRT), only four centres are delivering at rates above 24% inverse planned IMRT and 42 centres are significantly below. This means that in most
Radiotherapy in England 2012
8
parts of the country, patients with some cancers do not receive the proven benefits of IMRT. New contracting mechanisms, providing financial incentives to providers are being used in 2012-13 and at is anticipated that IMRT activity will increase significantly across the year.
1.9 There appears to be significant variation in uptake of and access to, radical radiotherapy that is age dependent with fall off beyond the age of 69 years. Analysis of the data are required to examine how much of this is clinically understandable, because of stage of disease and co-morbidities and how much is not. The NHS Commissioning Board will want to ask the appropriate group to undertake such an analysis.
1.10 The radiotherapy dataset has identified unacceptable variation in radiotherapy dose-fractionation in some disease sites. Data are now available through the Cancer Commissioning Tool Kit (CCT) to enable services to assess against benchmark data and enable commissioners to both model radiotherapy demand more accurately and work with providers to minimise unacceptable variation in dose fractionation by ensuring that practice in local teams is evidence based.
1.11 Radiotherapy waiting times are within the required 31-day maximum waiting time for subsequent radiotherapy, with all providers now routinely achieving the 94% operational standard. Those patients covered by the one month (31 day) maximum waiting time between diagnosis and first definitive treatment who received radiotherapy as their first treatment also experienced similar waiting times. In comparison with waiting times in 2003, modelling has shown that this improvement saves around 2,500 lives annually. However, delays in other parts of the patient pathway can limit the ability to do complicated planning while maintaining the standard, thus putting an additional pressure on the radiotherapy workforce.
1.12 The National Audit Office (NAO) report in 2011 concluded that some machines were underutilised with wide variations in throughput. Currently, average attendance per machine is 7,333 attendances, which is in line with the NRAG recommendation.
1.13 The NRAG productivity metric focused solely on machine throughput. As radiotherapy involves a pathway of care, the productivity metric has been re-aligned to ensure that providers optimise processes across the entire radiotherapy service pathway. A radiotherapy productivity flowchart has been developed to allow assessment of the whole service rather than relying on individual metrics. Each clinical treatment pathway needs to be considered and equipment, processes and skills mix optimised to ensure high quality, safety and timely delivery at each step.
1.14 New and continually emerging technologies across the treatment pathway, such as automatic contouring tools, may offer opportunity to enable processes to be undertaken more effectively and must be evaluated and implemented to support local service productivity across the entire pathway. This is especially important as planning and treatment become more complex.

Radiotherapy in England 2012
9
1.15 It is important that radiotherapy capacity is in the right place and that patients do not have to travel too far for their treatment. With the opening of six additional satellite centres and stand-alone units, radiotherapy is now available on 58 sites, providing improved access and reducing travel times for many patients. This is a significant achievement and more new sites are planned.
1.16 Providers and commissioners need to understand variations in costs and the impact of the planned introduction of tariff anticipated for 2013-14. They are now able to use data available on the CCT to benchmark unit cost activity and make full assessments of the productivity of services to assist in early planning.
1.17 The NRAG report recommended that 306 linear accelerators (linacs) would be needed by 2011 to meet the anticipated demand. The number of machines has increased since the report with the RTDS showing that 265 were in clinical use in 2011-12. With a throughput indicator of an average of 7,300 attendances per machine (working a standard day), to meet the anticipated increase in demand to 2016, a further 147 machines will be required, bringing the total to 412, as cancer becomes commoner in an ageing population.
1.18 This potential need for additional new equipment and the workforce required to support it, represents a significant challenge over the coming years and needs to feed into Trust capital planning and workforce strategies as early as possible.
1.19 Of the 265 machines currently in use, 26 are now past their recommended replacement age and a further 59 will require replacement in the next 3 years. To support the delivery of optimal productivity, provider Trusts need to have equipment replacement plans in place. They should also be encouraged to maximise the opportunities presented by new procurement initiatives managed by the NHS Supply Chain.
1.20 There is now greater clarity, since NRAG, about the workforce required to deliver 4D adaptive radiotherapy. Staffing and training remain key issues. If workforce numbers are insufficient, the ability of some centres to meet both the waiting time and quality standards will be limited. The National Proton Beam Therapy service and plans for more stand-alone centres will create an additional pressure on existing services. A coordinated approach to workforce planning across the service is required.
1.21 Technology used in radiotherapy is continually evolving and directed, coordinated programmes are required to evaluate technology in clinical use. The establishment of the NCRI Clinical and Translational Radiotherapy Research Working Group (CTRad) should help make good use of funding and resources. There has been an increase in patients accrued to radiotherapy trials across the UK since the establishment of the Group.
1.22 The key challenge for providers in continuing to improve outcomes from radiotherapy services is to ensure that there is investment in new technology and the trained staff to use it. This should be combined with research on specialist techniques so that all

Radiotherapy in England 2012
10
appropriate patients receive the most modern radiotherapy appropriate for their disease. New commissioning arrangements present an opportunity to coordinate research and evaluation in a way not possible when commissioned locally.
1.23 For commissioners the key challenge going forward will be to maximise access and clinical outcomes while optimising the efficient use of resources.
1.24 In the short term, the work being undertaken to analyse variation in access to radiotherapy by age and to seek detailed feedback on patients experience and opening time preferences should be acted on as appropriate and the outcomes reported in future reports.
1.25 Annex C provides a radiotherapy master table which shows individual centres’ positions against a series of metrics.
Summary of key NRAG metrics, current position and revisions
1.26 The NRAG and current (Malthus) model both have an output in terms of attendances (called fractions in NRAG). This was also the measure used in the RCR 2005 audit recording workload in a single week. It has been renamed an attendance in RTDS. The following table shows the key NRAG metrics and, following analysis of the RTDS, confirms or revises the metric:
Table 1: NRAG metric review, summary
Area NRAG recommendation Revised metric Actual end 2011
Total activity (attendances):
2010 2,645,000 2,520,036 1,719,538 2016 2,865,000 3,006,843 2020 - 3,351,285
Activity per million population
(attendances): 2010 50,000 48,035 32, 981 2016 54,000 55,206 2020 Note 1 60,057 -
Access to IMRT
4D adaptive radiotherapy
33% of all radical fractions Estimate 8%
inverse planned
(to include 24% inverse planned) Note 2
Access to IGRT Metric to be developed
Waits, 94% within 31 days Metric remains valid
2010 98%

Radiotherapy in England 2012
11
Machine numbers: 2011 306 345 265 2016 323 412 -
2020 - 459 (6.8 p/m/p) -
Linac throughput in attendances (fractions)
2011 2016 7,300 (8,635) 7,300 7,300
7,600 (8,869) Note 4 Note 5
Replacement at 10 years all Metric remains valid 26 over 10 years
Machines capable of image guided 4D adaptive
All new machines Metric remains valid
Almost 100% IMRT capable
40 - 50% IGRT capable
Note 6
Workforce Utilised in all services Metric remains valid 5 centres with all 4
tiers 4 tier model Attrition (loss of students during radiography training)
Attrition a priority for commissioners and providers of education.
Metric remains valid
Impact of VERT being assessed
Table notes: 1. This is a national indicator, the Malthus modelling tool should be used to determine local activity
requirements. 2. This metric will change as the evidence accrues. 3. NRAG calculations were based on rising machine throughput, 368 is based on 7,300 attendances
throughput. 4. Averaged across all linacs in a department. 5. Metric should be used only as an indicator of capacity and is based on machines working a standard
day. 6. A new metric for % radiotherapy delivered using IGRT will be developed by the end of 2012.

Radiotherapy in England 2012
12
2. Introduction 2.1 This report is aimed at commissioners and service providers and will be of interest to
patients and their relatives. It is designed to set out the up-to-date position on the state of radiotherapy services in England, to show the changes that have taken place in the five years since the publication of the National Radiotherapy Advisory Group (NRAG) Report in 2007 and to identify what is still required to deliver this strategy.
2.2 The report focuses on the provision of external beam radiotherapy (EBRT) which is the main component of the service and is received by about 125,000 patients each year. It covers important technical and delivery changes to this service and refers to developments in other, rarer fields of radiotherapy.
2.3 Radiotherapy is continuously changing as the technology evolves and specialist techniques and research feed rapidly into regular practice. It therefore presents a challenge to both commissioners and providers in ensuring that services are up-to-date and sufficiently flexible to incorporate these developments as well as guaranteeing that patients have timely access to high-quality radiotherapy services.
2.4 Radiotherapy is a highly cost effective and clinically effective treatment. It accounts for just 5% of the national spend on cancer treatment and yet is the second most effective treatment for cancer (next to surgery). Of all patients cured of their cancer 40% will have received radiotherapy as part of their curative treatment; and 16% of all cures can be attributed entirely to their radiotherapy,
2.5 The Radiotherapy Data Set (RTDS) now holds three years of validated and robust data to support detailed analysis of radiotherapy provision in England. As these data continue to mature, a comprehensive picture of both provision and change over time is becoming clear. These data were not available when the NRAG report was first drafted and have been used in this report to assess the NRAG metrics and ensure they remain current. The data are also used to set the future direction.
2.6 The NHS is held to account for the outcomes it secures for patients. The specific contributions that RT makes in each domain will be referred to throughout this report. Radiotherapy services can contribute to improved outcomes in all five domains of the NHS Outcome Framework as illustrated below:
• Domain 1: Preventing people from dying prematurely Around 40% of people cured of their cancer receive radiotherapy as part of their curative treatment. Sixteen% are directly cured by their radiotherapy alone. Increasing the numbers of patients accessing radiotherapy will contribute to an increased cure rate, so it is crucial to ensure that all appropriate patients gain access to timely treatment.
• Domain 2: Enhancing quality of life for people with long-term conditions
Radiotherapy in England 2012
13
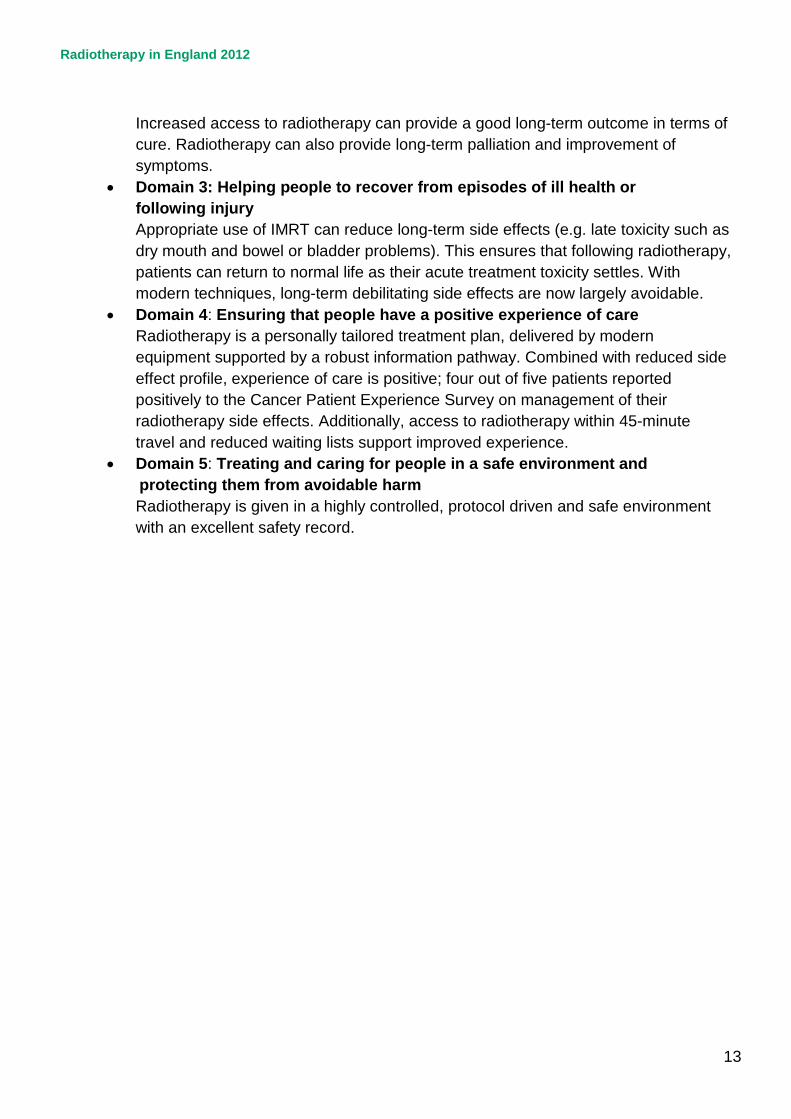
Increased access to radiotherapy can provide a good long-term outcome in terms of cure. Radiotherapy can also provide long-term palliation and improvement of symptoms.
• Domain 3: Helping people to recover from episodes of ill health or following injury Appropriate use of IMRT can reduce long-term side effects (e.g. late toxicity such as dry mouth and bowel or bladder problems). This ensures that following radiotherapy, patients can return to normal life as their acute treatment toxicity settles. With modern techniques, long-term debilitating side effects are now largely avoidable.
• Domain 4: Ensuring that people have a positive experience of care Radiotherapy is a personally tailored treatment plan, delivered by modern equipment supported by a robust information pathway. Combined with reduced side effect profile, experience of care is positive; four out of five patients reported positively to the Cancer Patient Experience Survey on management of their radiotherapy side effects. Additionally, access to radiotherapy within 45-minute travel and reduced waiting lists support improved experience.
• Domain 5: Treating and caring for people in a safe environment and protecting them from avoidable harm
Radiotherapy is given in a highly controlled, protocol driven and safe environment with an excellent safety record.

Radiotherapy in England 2012
14
3. The Standard of Care 3.1 This section addresses the service delivered in terms of overall activity, the standard of
care and the utilisation of specialist techniques. While radiotherapy treatment contributes significantly to improved outcomes in domain one, ensuring that the right standard of care is provided also contributes to improved outcomes in domains two and three. Having the right type of radiotherapy treatment can both reduce the side effects of treatment, helping patients to recover more quickly and enhance their quality of life by minimising any long- term effects of their treatment. The radiotherapy treatment pathway is complex; this is illustrated in the simplified pathway shown in the diagram below.
3.2 The NRAG report made a number of recommendations related to activity and service delivery using “fractions”. This is the same unit of measurement as that of the radiotherapy data set (RTDS) which defines an ‘attendance’ as a visit for one or more fractions of radiotherapy and is an objective, consistent measure, recording a single visit, even if multiple treatments to different parts of the body are involved. However, in the past, some departments have counted fractions to multiple body parts separately with the result that fractions were higher than attendances (approximately 0.85 to0.9 attendances per radiotherapy fraction). Attendances are used in RTDS, by NRAG and throughout this report. A series of attendances is termed an episode and one or more episodes may be combined to fulfil a single prescription.

Radiotherapy in England 2012
15
Illustration: simplified radiotherapy (RT) pathway. NB this simplified linear pathway does not show the cyclical nature of the treatment verification and planning steps associated with the use of IGRT/Adaptive RT/ In-vivo dosimetry interventions.
From MDT Decision to treat to “first treatment” the access targets are: • Patients should receive RT within 31 days of agreeing to treatment
JCCO Good practice guidance (1993) 2 • Patients needing radical RT should be treated within 28 days • Patients needing palliative RT should be treated within 14 days • Patients needing urgent RT should be treated within 48 hours.
2 http://www.rcr.ac.uk/docs/oncology/pdf/reducingdelaysincancertreatment.pdf

Radiotherapy in England 2012
16
Activity
3.4 At the time of the NRAG report, activity was identified from a survey conducted by the RCR. It was estimated that 1,500,000 attendances were being delivered annually. On that basis, it was predicted that 2,645,000 attendances should be delivered by 2011. RTDS now has detailed validated information on all radiotherapy activity in England from April 2009 to March 2012.
3.5 Of note from this table are:
• episodes increased 3.5% from 2009-10 to 2010-11 (1 year) and 7.5% from 2009-10 to 2011-12 (2 years)
• attendances increased 4.4% from 2009-10 to 2010-11 (1 year) and 8.9% from 2009-10 to 2011-12 (2 years)
• gender split is almost equal for attendances, with episodes 47%:53% female to male • intent is equal for episodes with expected 83% :17% radical to palliative
attendances • age split is constant throughout the 3 years (2009-10, to 2011-12)
• 0-19 years 1% • 20-49 years 13% • 50-69 years 48% • 70-79 years 27% • 80+ years 9%
• Main Tumour Groups are percentage of total activity • Breast 28% episodes 28% attendances • Lung 14% episodes 8% attendances • Urology 19% episodes 26% attendance
Over the interval shown, there has been increased activity, particularly attendances. This was the period over which waiting time standards were achieved and increased activity may in part be a reflection of this.

Radiotherapy in England 2012
17
Tabl
e 2
tota
l act
ivity
and
% o
n ye
ar in
crea
se 2
009/
10, 2
010/
11 a
nd 2
011/
12
Dat
a fro
m R
TDS
– s
ourc
e N
atC
anSA
T M
ay 2
012.
Radiotherapy in England 2012
18
3.6 Commissioners should ensure that their radiotherapy providers have robust plans to provide adequate capacity to meet local demand. Use should be made of the modelling tools available to identify appropriate levels of activity for local populations. Cancer is predominantly a disease of later life and, with an ageing population, the demand for radiotherapy is expected to continue to increase. Due to inevitable fluctuations in referrals for treatment, services need to plan for a 13% greater capacity than average demand to ensure that they are able to treat patients in a timely way and comply with waiting times standards.
Standard of Care
3.7 Radiotherapy is the use of ionising radiation to treat disease and is used for both radical (intended for cure) or palliative intent. It works by destroying the cancer cells in the treated area. Although normal cells can also be damaged by the radiotherapy, they can usually repair themselves. It is a continuous challenge to minimise the radiation dose to healthy tissue to avoid damage and minimise the risk of induction of additional cancers through secondary radiation effects.
3.8 The technology is continually improving. The increasing sophistication of computer planning systems and the ability to merge the output of a range of imaging modalities to identify the exact position of a tumour using CT, MRI and PET allows a dramatic improvement in accuracy and improved outcomes.
IMRT (intensity-modulated radiotherapy)
3.9 Current evidence is that between a third and half of all radical radiotherapy treatment should be delivered as IMRT to minimise the long-term side effects of treatment. Patients with pelvic tumours will benefit from reduced bowel and other pelvic toxicity. Head and Neck patients will benefit from reduced risk of permanent dryness of the mouth (xerostomia). Some patients with breast cancer will have less long-term breast pain and tenderness.
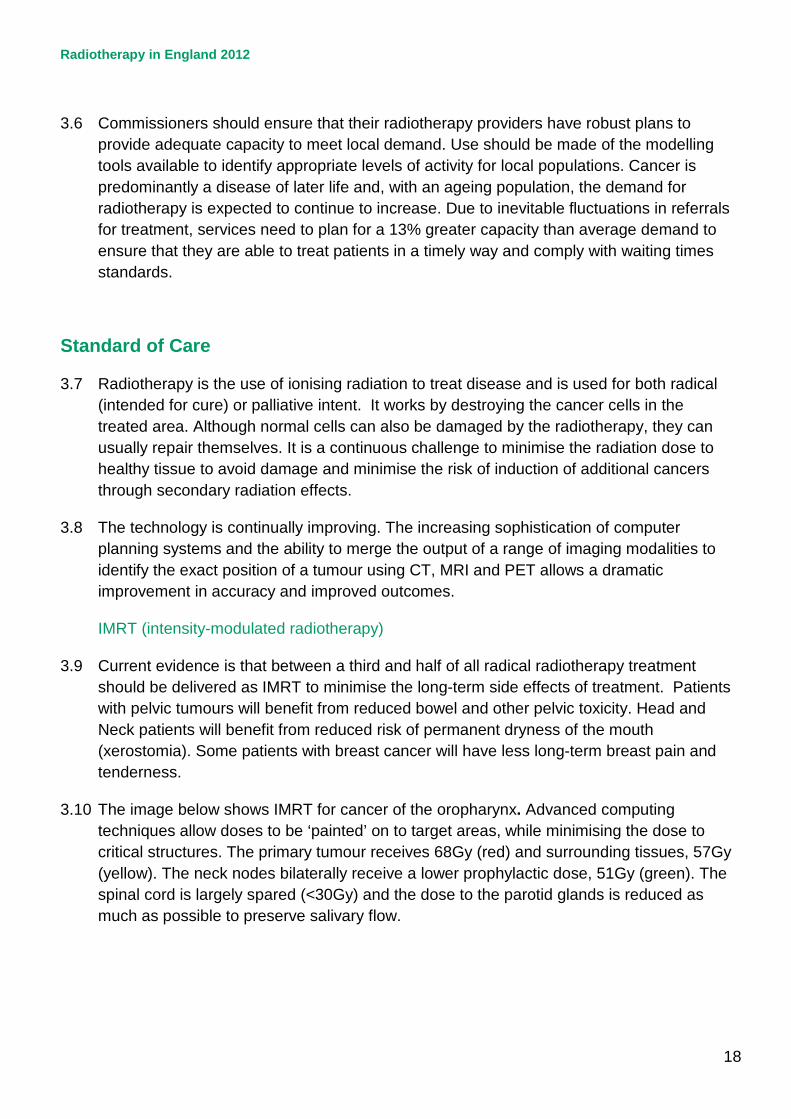
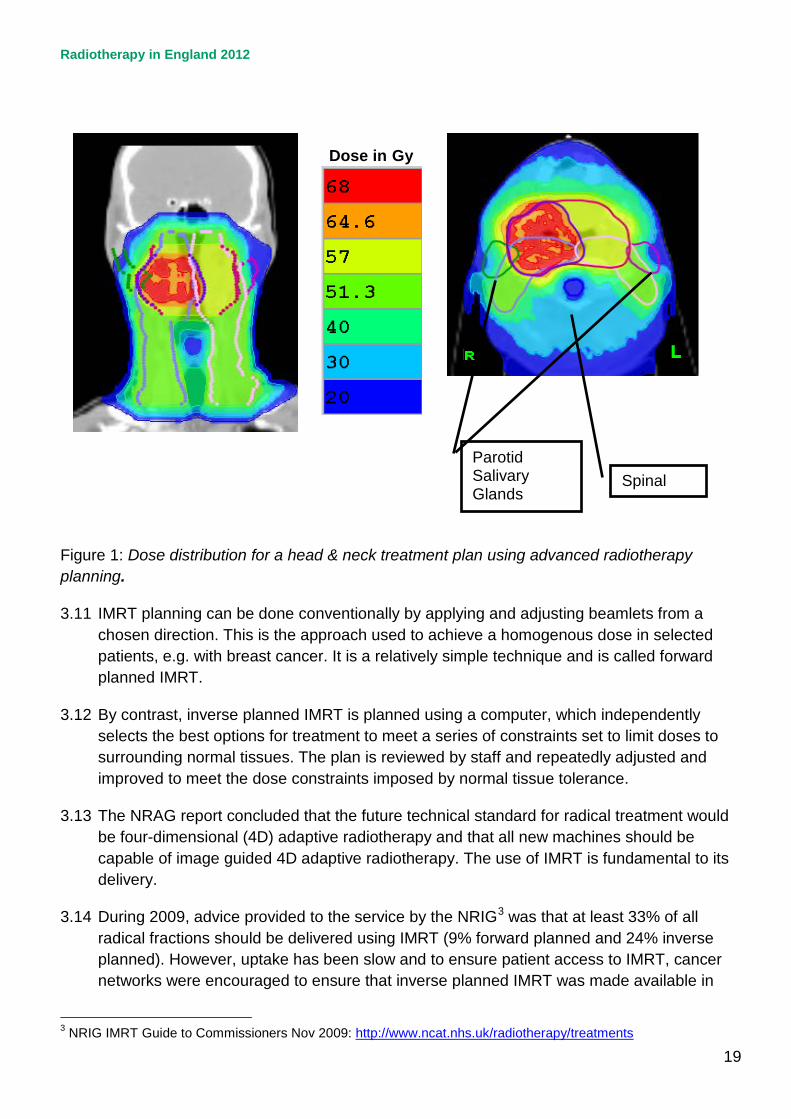
3.10 The image below shows IMRT for cancer of the oropharynx. Advanced computing techniques allow doses to be ‘painted’ on to target areas, while minimising the dose to critical structures. The primary tumour receives 68Gy (red) and surrounding tissues, 57Gy (yellow). The neck nodes bilaterally receive a lower prophylactic dose, 51Gy (green). The spinal cord is largely spared (<30Gy) and the dose to the parotid glands is reduced as much as possible to preserve salivary flow.
Radiotherapy in England 2012
19
Figure 1: Dose distribution for a head & neck treatment plan using advanced radiotherapy planning.
3.11 IMRT planning can be done conventionally by applying and adjusting beamlets from a chosen direction. This is the approach used to achieve a homogenous dose in selected patients, e.g. with breast cancer. It is a relatively simple technique and is called forward planned IMRT.
3.12 By contrast, inverse planned IMRT is planned using a computer, which independently selects the best options for treatment to meet a series of constraints set to limit doses to surrounding normal tissues. The plan is reviewed by staff and repeatedly adjusted and improved to meet the dose constraints imposed by normal tissue tolerance.
3.13 The NRAG report concluded that the future technical standard for radical treatment would be four-dimensional (4D) adaptive radiotherapy and that all new machines should be capable of image guided 4D adaptive radiotherapy. The use of IMRT is fundamental to its delivery.
3.14 During 2009, advice provided to the service by the NRIG3 was that at least 33% of all radical fractions should be delivered using IMRT (9% forward planned and 24% inverse planned). However, uptake has been slow and to ensure patient access to IMRT, cancer networks were encouraged to ensure that inverse planned IMRT was made available in
3 NRIG IMRT Guide to Commissioners Nov 2009: http://www.ncat.nhs.uk/radiotherapy/treatments
Dose in Gy
Spinal
Parotid Salivary Glands

Radiotherapy in England 2012
20
at least one centre by 2012. A survey undertaken in 2012 4 has shown that inverse planned IMRT is now offered in 48 of 50 English radiotherapy centres. Some centres have exceeded suggested activity levels but many are delivering IMRT at unacceptably low levels.
3.15 Nationally, 6.8% of episodes were delivered with inverse planned IMRT in 2011-12; Chart 1 shows this is expected to rise to 14% by the end of 2012-3.
3.16 Table 3 shows Trusts IMRT activity levels from the 2011-12 survey contrasted with 2011-12 RTDS data. The presentation focuses on inverse planned IMRT and shows that four centres had already achieved the recommendation of 24% of radical patients treated with IMRT. A further four had achieved 15% of patients. Thirty-four had lower levels of forward planned IMRT and eight had either not started or failed to provide data to the survey.
3.17 National teams are working with providers to identify barriers to increased activity and develop local actions plans to meet 24% inverse planned IMRT during 2013.
Chart 1: actual radical inverse planned IMRT showing the benchmark level.
4 Mayles WPM, Cooper T, Mackay R, Staffurth J, Williams M. Intensity-Modulated Radiotherapy Implementation in the UK. Clin Oncol. 2012; 24: 543-544.
NRIG Expected level –

Radiotherapy in England 2012
21
Table 3: Inverse planned IMRT 2011-12 by Provider
Inverse Planned IMRT
2011 National Survey data calculated by service leads RTDS data
Centre Code
Centre Name April - Sept 2011 actual
Full Year 2011/12 Estimate (assume same IMRT rates)
RTDS Actual 2011/12 Code X67.1 Notes 1 &2
IMRT as a % of all radical episodes. RTDS data >15 attendances Note 3
RNJ Barts 22 44 134 15.2% RD1 Bath 0 0 9 1.6% RRK Birmingham 46 92 15 0.7% RXH Brighton 6 12 9 0.8% RA7 Bristol 43 86 18 1.3% RGT Cambridge 280 560 452 25.5% RNL Carlisle 1 2 1 0.2% RTE Cheltenham 56 112 115* 9.1%* REN Clatterbridge 159 318 800 24.1% RDE Colchester 0 0 1 0.1% RKB Coventry Did not respond 0 0.0% RTG Derby 0 0 0 0.0% RH8 Exeter 1 2 8 1.0% RA2 Guildford 119 238 51 3.6%
RJ1 Guy’s & St Thomas’ 169 338 0 0.0%
RWA Hull 63 126 101 6.8% RYJ Imperial 94 188 31 2.6% RGQ Ipswich 65 130 126* 23%* RWF Kent 59 118 83 3.5% RR8 Leeds 128 256 375* 13.3%* RWE Leicester 32 64 56 5.4% RWD Lincoln 0 0 125* 13.1%* RBV Manchester 418 836 0 0.0% RTR Middlesbrough 59 118 5 0.4% RWH Mount Vernon 82 164 60 2.8% RTD Newcastle 87 174 125 5.9%

Radiotherapy in England 2012
22
Note 1- IMRT is growing rapidly and a difference between April and Sept 2011 actual and final RTDS full year is to be expected. Note 2 * is where inverse planned breast > 20% of total Note 3 * includes high % breast patients Key: Green = ≥ 24% inverse planned IMRT Yellow = 15<24% inverse planned IMRT
Amber = < 15% inverse planned IMRT Red = no inverse planned IMRT through both survey and RTDS
IGRT (image-guided radiotherapy)
3.18 The image below shows IMRT for cancer of the prostate. A 3D image of the patient’s pelvis has been acquired on the treatment couch and compared to the planning scan. In this image the bones have been matched but the prostate has moved forward because there is more gas in the rectum. This means that the patient’s position must be adjusted before treatment to ensure correct coverage of the prostate and avoidance of the normal tissues.
RAP North Middlesex 0 0 0 0.0%
RJE North Staffordshire 110 220 0 0.0%
RNS Northampton 45 90 99* 9.7%* RM1 Norwich 33 66 92 7.6% RX1 Nottingham 35 70 104 7.3% RTH Oxford Did not respond 18 1.2% RGN Peterborough 94 188 185* 43.6%* RK9 Plymouth 11 22 10 1.8% RD3 Poole Did not respond 0 0.0% RHU Portsmouth 0 0 2 0.2% RXN Preston 15 30 55 2.6% RF4 Queens, Romford 15 30 29 4.3% RHW Reading 12 24 14* 1.7%* RAL Royal Free RTDS data 11 4.2% RPY Royal Marsden 309 618 626 27.3% RHQ Sheffield 35 70 67* 3.2%* RXW Shrewsbury 25 50 40 5.9% RHM Southampton 0 0 0 0.0% RAJ Southend 67 134 142 18.7% RBA Taunton Did not respond 0 0.0% RA9 Torbay 0 0 6 1.4% REF Truro 0 0 0 0.0%
RRV University College 76 152 143 16.2%
RL4 Wolverhampton 48 96 82 6.9%
ENGLAND TOTAL 2919 5838 3319 6.8%

Radiotherapy in England 2012
23
Figure 2: CT imaging on the treatment machine (yellow) can be compared to the original planning scan (grey).
3.19 All patients should have a form of image guidance as part of their radiotherapy treatment episode. The frequency and complexity of the image guidance would be determined by the treatment intent, anatomical site and fractionation. A recent report5 provides guidance on the use of IGRT and site specific protocols. This document also sets out a national Strategy for the improvement and sustainability of the use of IGRT. Two therapeutic radiographers have been appointed to support local teams in 2012-2013 and provider organisations are encouraged to utilise the national support being offered. Physics support for QA has also been developed through three centres.
3.20 All modern linear accelerators have some IGRT capability, but few services in England are maximising the potential for IGRT in the routine clinical setting. The adoption of IGRT is fundamental to the NRIG recommendation of 4D adaptive radiotherapy as the technical standard and commissioners will want to ensure that IGRT is commissioned as the standard of care for all patients and is delivered to nationally agreed protocols.
5 www.ncat.nhs.uk/radiotherapy
Radiotherapy in England 2012
24
3.21 IGRT is a core component of modern radiotherapy services and requires a multi-professional team approach with opportunities for expanded professional development. It is the responsibility of each therapeutic radiographer, medical physicist, dosimetrist and clinical oncologist (and all clinical practitioners) to ensure that they maintain their skills as technology evolves. Post registration education and training is essential to support the development of skills as new technologies emerge. It is the responsibility of local providers to ensure that funding support is provided. Professional bodies should ensure that core curricula are matched to current and emerging service need at registration level.
3.22 The RTDS continues to evolve and the inclusion of data on the forms of imaging used in individual treatments will be considered as a priority. This will then enable local commissioners to assess progress in the expansion of its use.
Access to radiotherapy
3.23 Modelling of radiotherapy capacity and demand is essential in understanding and predicting current and future service needs and ensuring that national standards continue to be met. The Malthus modelling tool (www.camradiotherapy.org.uk/malthus) for radiotherapy demand has been developed using evidence-based radiotherapy decision trees based on UK clinical practice and local cancer incidence data. It calculates current radiotherapy demand requirements and can model forward to take account of changes in cancer incidence as the population ages.
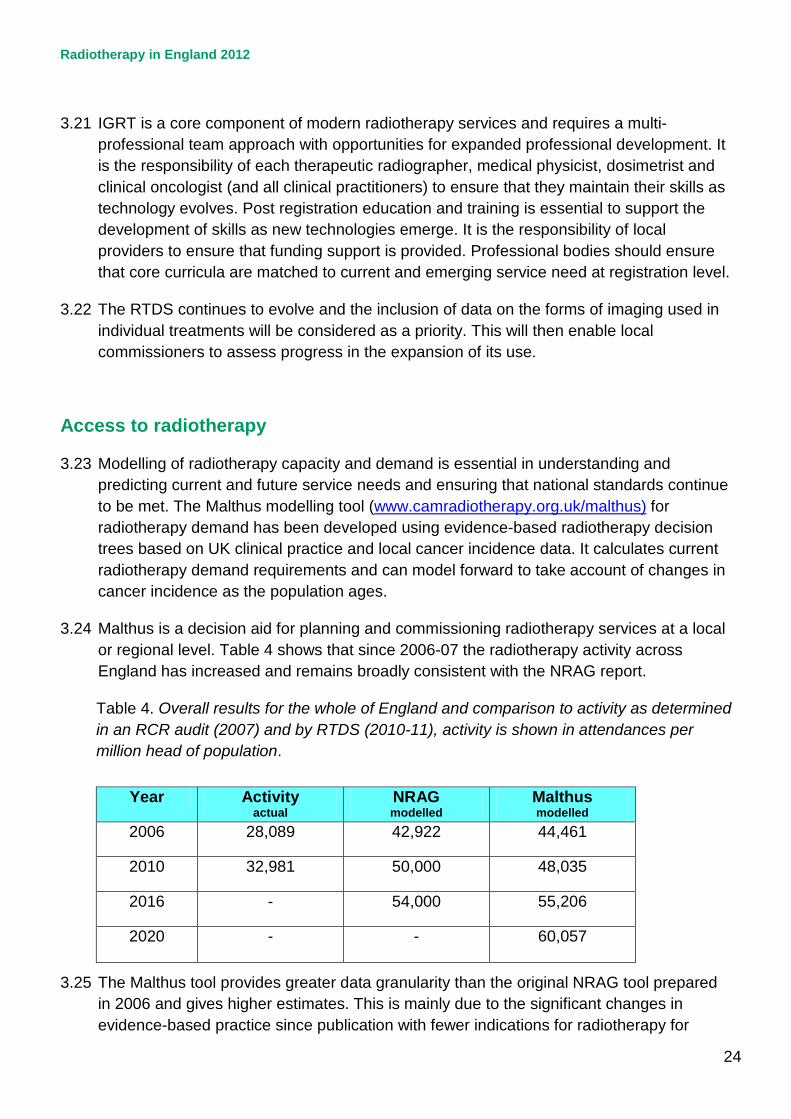
3.24 Malthus is a decision aid for planning and commissioning radiotherapy services at a local or regional level. Table 4 shows that since 2006-07 the radiotherapy activity across England has increased and remains broadly consistent with the NRAG report.
Table 4. Overall results for the whole of England and comparison to activity as determined in an RCR audit (2007) and by RTDS (2010-11), activity is shown in attendances per million head of population.
Year Activity
actual NRAG modelled
Malthus modelled
2006 28,089 42,922 44,461
2010 32,981 50,000 48,035
2016 - 54,000 55,206
2020 - - 60,057
3.25 The Malthus tool provides greater data granularity than the original NRAG tool prepared in 2006 and gives higher estimates. This is mainly due to the significant changes in evidence-based practice since publication with fewer indications for radiotherapy for
Radiotherapy in England 2012
25
some diagnoses and more for others. Thus, the estimate of the proportion of patients who should receive radiotherapy at some time in their illness remains at 50%. Much of the gap in provision that remains can be attributed to non-evidence based dose fractionation.
3.26 The uptake of radiotherapy treatment by patients is known to diminish with distance travelled by patients to reach a radiotherapy centre6. The NRAG report concluded that, ideally, patients would have no more than 45 minutes travel time to their treatment although, for some highly specialised services, patients may need to travel further.
3.27 In the last five years, six new radiotherapy centres (additional and satellite) have been established and more are planned, with at least another four centres already confirmed and under construction. However, commissioners and providers can provide hostel accommodation, dedicated parking and improved transport systems to support patients who need to travel. The additional cost to patients of travel during long courses of radiotherapy should be recognised; this can also be a challenge that may affect radiotherapy uptake. Removing obstacles to patient choice should increase the uptake of radiotherapy.
3.28 The professional bodies are reviewing their guidance on additional radiotherapy capacity; this is expected during the autumn 2012. The anticipated specialised commissioning of radiotherapy services will provide a platform for improved strategic planning of additional facilities. The location of new and planned radiotherapy centres is shown on the following map. The coloured areas relate to existing cancer network boundaries.
6 Travel time to hospital and treatment for breast, colon, rectum, lung, ovary and prostate cancer: Jones A.P. et al: European Journal Of Cancer 4 4 ( 2 0 0 8 ) 9 9 2 –9 9 9

Radiotherapy in England 2012
26
Figure 3: Radiotherapy centre locations
Radiotherapy in England 2012
27
Variation in access to radiotherapy with age
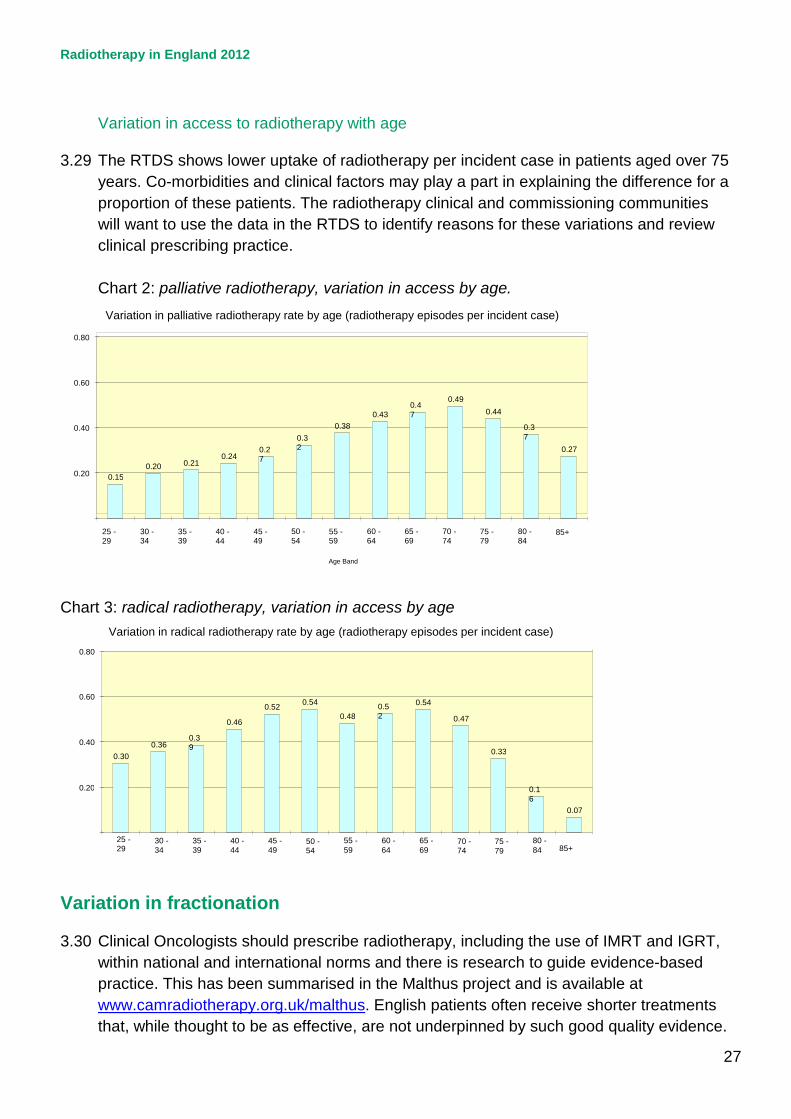
3.29 The RTDS shows lower uptake of radiotherapy per incident case in patients aged over 75 years. Co-morbidities and clinical factors may play a part in explaining the difference for a proportion of these patients. The radiotherapy clinical and commissioning communities will want to use the data in the RTDS to identify reasons for these variations and review clinical prescribing practice.
Chart 2: palliative radiotherapy, variation in access by age.
Chart 3: radical radiotherapy, variation in access by age
Variation in fractionation
3.30 Clinical Oncologists should prescribe radiotherapy, including the use of IMRT and IGRT, within national and international norms and there is research to guide evidence-based practice. This has been summarised in the Malthus project and is available at www.camradiotherapy.org.uk/malthus. English patients often receive shorter treatments that, while thought to be as effective, are not underpinned by such good quality evidence.
0.30 0.36 0.3
9 0.46
0.52 0.54 0.48 0.5
2 0.54
0.47
0.33
0.16
0.07
0.20
0.40
0.60
0.80
25 - 29 30 -
34 35 - 39 40 -
44 45 - 49 50 -
54 55 - 59 60 -
64 65 - 69 70 -
74 75 - 79 80 -
84 85+
Variation in radical radiotherapy rate by age (radiotherapy episodes per incident case)
0.15 0.20 0.21 0.24 0.2
7 0.32
0.38 0.43 0.4
7 0.49
0.44 0.37
0.27 0.20
0.40
0.60
0.80
25 - 29 30 -
34 35 - 39 40 -
44 45 - 49 50 -
54 55 - 59 60 -
64 65 - 69 70 -
74 75 - 79 80 -
84 85+
Age Band
Variation in palliative radiotherapy rate by age (radiotherapy episodes per incident case)
Radiotherapy in England 2012
28
Clinicians and commissioners should ensure that there is sufficient capacity to enable best practice prescribing within the waiting times standard. It is expected that the professional bodies will signpost the Malthus clinical decision trees to their members that will enable a comprehensive discussion between clinician and provider.
3.31 Radiotherapy is prescribed on the basis an individual assessment of each patient. Each
radiotherapy prescription is therefore unique to the individual’s clinical case needs. Some variation is therefore expected.
Prostate Cancer
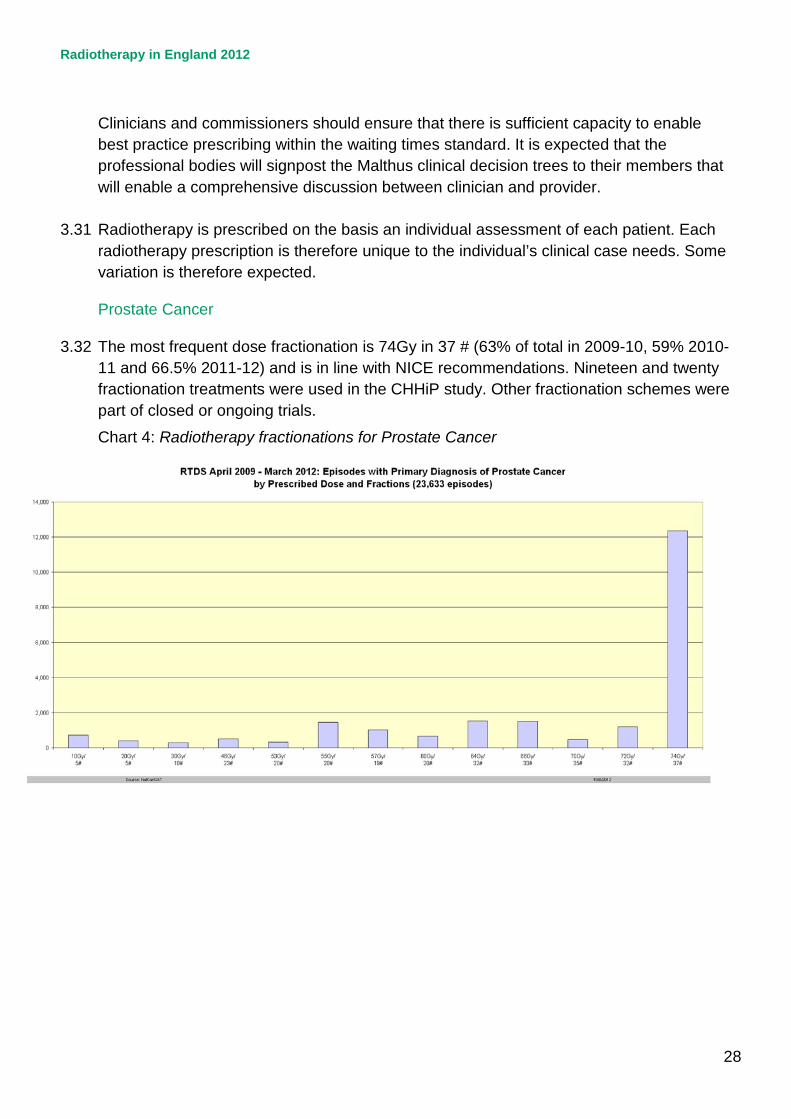
3.32 The most frequent dose fractionation is 74Gy in 37 # (63% of total in 2009-10, 59% 2010-11 and 66.5% 2011-12) and is in line with NICE recommendations. Nineteen and twenty fractionation treatments were used in the CHHiP study. Other fractionation schemes were part of closed or ongoing trials.
Chart 4: Radiotherapy fractionations for Prostate Cancer

Radiotherapy in England 2012
29
Breast Cancer
3.33 Data for breast cancer are shown in Chart 5. Change has been driven by participation in multi-centre clinical trials and there is remarkably little variation. The most frequent dose fractionation is 40Gy in 15 # (78% of total in 2009, increasing to 84% 2010 and 87% 2011) as used in the START trial. Twenty-five fraction regimens are only indicated for carcinoma in-situ and decreased from 11% of episodes in 2009 to 8% in 2011.
Chart 5: Radiotherapy fractionations for Breast Cancer
Lung Cancer
3.34 Lung cancer fractionation is much more diverse because the intent of treatment may be palliative or radical. A significant proportion of patients recieive short palliative regimens, all of which are supported by clincial trial evidence in different settings. Radical treatment is dominated by 20 fraction regimens which have a poor evidence base. Few patients receive treatment in 30 or more fractions which would be standard in most of Europe and North America for many indications. This should be addressed in the commissioning process through use of the evidence based decision trees in the Malthus model.
Radiotherapy in England 2012
30
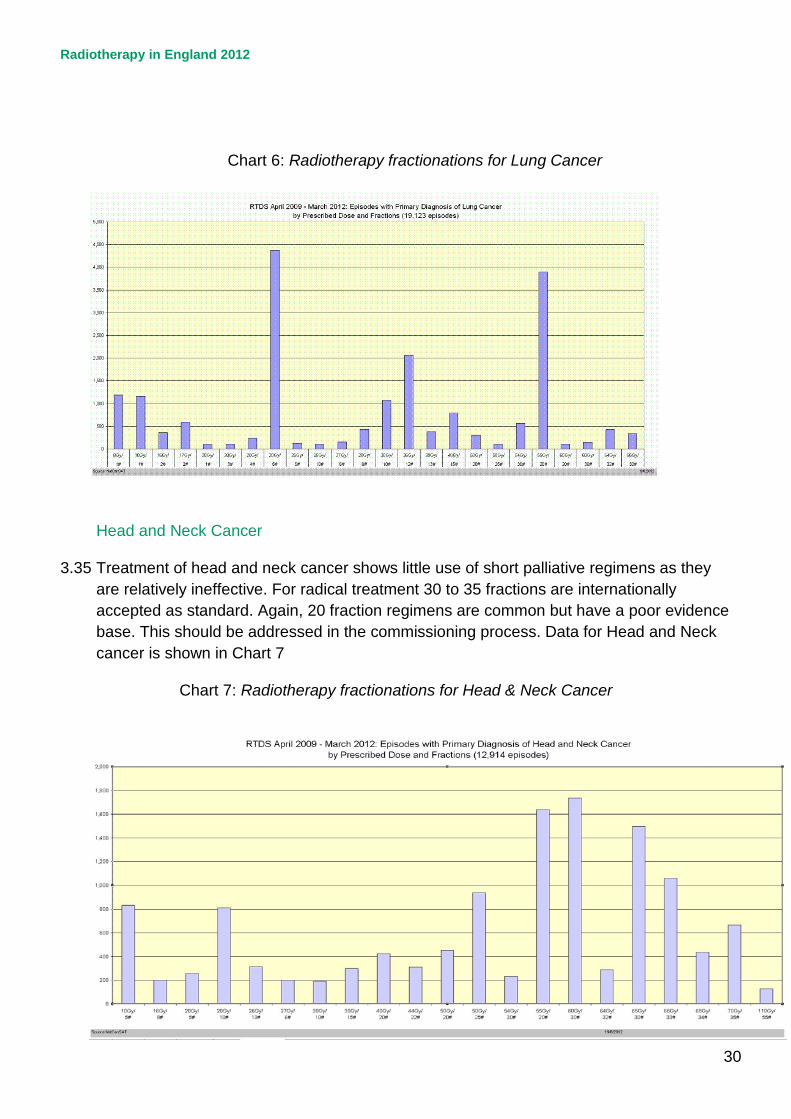
Chart 6: Radiotherapy fractionations for Lung Cancer
Head and Neck Cancer
3.35 Treatment of head and neck cancer shows little use of short palliative regimens as they are relatively ineffective. For radical treatment 30 to 35 fractions are internationally accepted as standard. Again, 20 fraction regimens are common but have a poor evidence base. This should be addressed in the commissioning process. Data for Head and Neck cancer is shown in Chart 7
Chart 7: Radiotherapy fractionations for Head & Neck Cancer
Radiotherapy in England 2012
31
Specialist techniques
Stereotactic Radiotherapy
3.35 In January 2010, NRIG approved a short-life working group to develop and agree national guidelines for commissioners and clinicians on the role and opportunities of Stereotactic Body Radiotherapy (SBRT) now known as Stereotactic Ablative Radiotherapy (SABR). The report, ‘Guidelines for Commissioners, Providers and Clinicians in England 20117’, was published in April 2011. SBRT is an established treatment for early-stage lung for patients unsuitable for surgery and may have a role in the management of a number of other cancers but in these areas, the evidence base is less developed. Its use in other indications must be directly linked to evidence of improved outcomes for patients and should only be delivered within clinical studies. More trials are needed to assess SABR against surgery and other modalities.
3.36 There is now interest in exploring extreme reductions in fractionation down to 3-5 fractions for small targets, such as solitary metastases or early lung or prostate cancer. It is essential that these questions are assessed in clinical trials because they have the potential to achieve equivalent or better outcomes in a much shorter treatment with improved patient experience. This would free significant radiotherapy capacity within services. National work will be undertaken with the RT research community and commissioners to develop a strategy for coordinated research and evaluation of this technique.
Image Guided Brachytherapy
3.37 Image-guided brachytherapy (IGBT) is the new gold standard for cervix cancer brachytherapy. The major advantage of the technique is the possibility to conform the dose to the anatomy of each patient to take into account tumour volume and topography and the position of organs at risk. Several studies have reported that IGBT using either computed tomography (CT) or magnetic resonance imaging (MRI) is associated with an improvement in local tumour control of around 20% with or without a concomitant reduction in serious late toxicity. The largest benefit is with MRI-based IGBT with the addition of interstitial needles for selected patients; one centre has reported local control rates of >90% for all tumours, regardless of tumour stage or size, while reducing serious late toxicity by 10% (to around 2%), a gain in therapeutic index that is almost unprecedented8.
3.38 In 2009, the Royal College of Radiologists (RCR) published a guidance document9 to facilitate the implementation of IGBT for cervix cancer in the UK. The document,
7 http://www.ncat.nhs.uk/radiotherapy/treatments 8 Clinical impact of MRI assisted dose volume adaptation and dose escalation in brachytherapy of locally advanced cervix cancer: Potter et al. Radiotherapy and Oncology 83 (2007) 148–155 9 http://www.rcr.ac.uk/publications.aspx?PageID=149&PublicationID=297

Radiotherapy in England 2012
32
Implementing image-guided brachytherapy for cervix cancer in the UK, reported that in 2008, only two of 45 centres (2%) were offering MRI-based IGBT for cervix cancer while another ten centres (22%) were offering CT-based IGBT. A repeat survey in 2011 showed that the number of UK centres offering MRI-based IGBT had increased to nine (20%) while the number offering CT-based IGBT had increased to 23 (51%).
3.39 While considerable progress with implementing IGBT for cervix cancer has been made in the UK over the past three years, most centres have implemented the CT-based technique, which has a smaller benefit than MRI-based IGBT. To ensure that patients receive optimum benefit from this technique, commissioners are advised to develop a strategy that ensures:
• all patients are offered IGBT (MRI or CT-based) from 2012
• all patients are offered MRI-based IGBT from 2015 and that
• all patients with tumours >5 cm should be offered MRI-based IGBT with intracavitary-interstitial capability.
If this standard of care cannot be delivered locally then patients should be offered referral to another centre where it is available. Commissioners should ensure that their patients receive the best treatment.
Molecular radiotherapy
3.40 Molecular radiotherapy (MRT) is the treatment of cancer with radiopharmaceuticals. A recent report from the British Institute of Radiology10 (BIR) argues that MRT has potential and is underutilised. There are treatment opportunities for neuroendocrine tumours, haematological malignancies, liver tumours and bone metastases. The treatment is generally minimally invasive, incurs few side effects and can achieve an impressive response. Commissioners will want to ensure that all appropriate patients receive this treatment and the relevant professional bodies should develop a structure and workforce plan to take forward the recommendations of the BIR report Molecular Radiotherapy in the UK: Current Status & Recommendations for Further Investigation, 2011.
Proton Beam Therapy
3.41 NRAG recommended that a business case should be developed for at least one modern proton treatment facility in England and, while that case was being developed, high priority patients should be sent overseas for treatment. This includes the treatment of children with a range of localised tumours and some adult patients with base of skull tumours and other rare indications that are particularly likely to benefit.
3.42 The National Specialised Commissioning Team began sending patients overseas for PBT from April 2008. Since then 160 patients have been treated overseas (107 of them
10 https://www.bir.org.uk/membersarea/shop/details.asp?id=26&Blue=True

Radiotherapy in England 2012
33
children). In 2011-12, 80 patients were treated overseas and the number is steadily increasing. From April 2013, PBT services will be commissioned by the NHS CB.
3.43 A strategic business case has been approved11 and there are now plans to develop a National Proton Beam Therapy Service in England delivered on two sites, the Christie and UCLH, from the end of 2017. The national service will treat up to 1500 patients annually.
11 http://www.specialisedservices.nhs.uk/info/proton-beam-therapy

Radiotherapy in England 2012
34
4. Service Delivery 4.1 The National Radiotherapy Advisory Group (NRAG) report made a number of specific
recommendations about the organisation of radiotherapy. How these services are delivered, makes an important contribution to improved outcomes in domains four and five of the NHS Outcomes Framework. Meeting waiting times standards, having the most up to date and reliable equipment supported by all the appropriate expert staff groups, ensuring patients are treated with dignity and respect will all contribute to patients’ positive experience of their care. Delivering a safe radiotherapy service is fundamental in protecting patients from avoidable harm.
Waiting times
4.2 Excessive waits in radiotherapy have historically been a long-standing issue. NRAG was established in 2003 after publication of evidence that 70% of patients waited longer than 28 days to start treatment.
4.3 It should be recognised that the 96% operational standard set by the Department of Health for the one month maximum waiting time between a patient being informed of their diagnosis (and agreeing a care plan) and commencing first definitive treatments, refers to all first definitive treatments (and is not modality specific). The subsequent radiotherapy standard measures radiotherapy modalities (teletherapy, chemoradiotherapy, brachytherapy and proton therapy) against a separate 94% operational standard. This second requirement was to be met for all patients treated after 31 December 2010. In the first period for which the Department published statistics (Q4 2010-11) for the 31 day wait for second or subsequent treatment where the treatment was radiotherapy this was achieved for 97.8% of patients, with only three providers not managing to meet this standard. By Q2 2011/12, all providers were meeting this standard.
4.4 Modelling the impact of addressing this demonstrates it saves at least 2,500 lives each year12. This is equivalent to one patient per week per radiotherapy centre and confirms the importance of maintaining the continued achievement of this standard.
Table 5: Data held by the DH Cancer Waits (Q3 11/12) shows the following:
Treatment Stage
Treatment Modality % Performance
First Treatment Brachytherapy
93.7%
First Treatment Teletherapy (Beam Radiation excluding Proton Therapy) and Chemoradiotherapy
98.3%
12 Ahmad and Burnett; BMJ: 2011

Radiotherapy in England 2012
35
Subsequent Brachytherapy 98.9% Subsequent Teletherapy (Beam Radiation excluding Proton
Therapy) and Chemoradiotherapy 98.6%
All Treatments Brachytherapy
97.9%
All Treatments Teletherapy (Beam Radiation excluding Proton Therapy) and Chemoradiotherapy
98.5%
Source: Department of Health, National Cancer Waiting Times Monitoring Data, Quarter 3 2011/12.
4.5 The national RTDS contains a record of all patients treated in England; this recording system is mainly automated direct from treatment machines. The data submitted to the Cancer Waiting Times database by Trusts has been compared with the RTDS to ensure both systems are reporting the same numbers. We have found apparent underreporting into the cancer waits database but further investigation of this is required.
Productivity
4.6 RTDS defines activity as attendances. In the era of the NRAG report some of the data submitted by departments counted fractions to multiple body parts separately (see para 3.2 above). For 2006, the NRAG report said each machine should average 8,000 fractions: this is equivalent to 6,800 to 7,200 attendances. It was estimated that this could rise to 8,300 fractions (7,000 to 7, 500 attendances) by 2010-11 and 8,700 (7,400 to 7,800) by 2016. Currently each linac delivers an average of 7,333 machine attendances per year; this is in line with the NRAG recommendation after taking into account the difference between fractions and attendances.
4.7 In the last five years, new developments have improved the quality of radiotherapy but often they reduce patient throughput, certainly during the implementation phase. IMRT was initially slower than conventional treatments and can now be delivered faster on newer machines. Similarly, the assessment of images prior to therapy required for IGRT can slow throughput while enhancing quality and solutions are being developed to overcome this. A throughput indicator of 7,300 attendances average across the department is in line with other countries.
4.8 The original NRAG metrics define maximum possible machine productivity in overloaded centres in danger of breaching waiting-time targets. Such a focus would preclude the use of superior, but initially more time-demanding, techniques.
4.9 Accordingly, benchmarking throughput is less useful as it may provide perverse incentives rather than supporting quality. Maintaining a modern set of machinery will speed treatment delivery and improve the use of staff time (one of the largest costs of the service).

Radiotherapy in England 2012
36
4.10 Individual benchmarking measures have therefore, been superseded by the development of the radiotherapy productivity flowchart see Annex B. This provides a mechanism for assessing the whole service rather than highlighting individual metrics. Network Radiotherapy Groups will want to use the productivity flowchart inform their agendas and developing improvement plans. The machine throughput metric is retained at 7,300 attendances as an indicator of capacity for machines working a standard day, five days per week.
4.11 National work has been undertaken with providers to understand the costs of radiotherapy and their relationship to activity. Two detailed analyses are available at Trust level (in peer groups) to both providers and commissioners via the NCAT website at http://www.ncat.nhs.uk/radiotherapy/tariff-hrg.
4.12 Work has also been undertaken to help providers understand variation in costs in preparation for the introduction of tariff. An analysis of cost profiles is included in the Cancer Commissioning Toolkit dividing overall costs by overall activity (both attendances and episodes) to create a general cost profile. This is a high-level approach but serves as a comparator. A better understanding of unit costs will enable services to undertake thorough assessments of whole service productivity and cost effectiveness. Detailed analysis of reference costs can be found on the NCAT website
4.13 Last year the National Audit Office (NAO) criticised radiotherapy services for not maximising the utilisation of radiotherapy equipment and said that services were not as productive as they could be. This assessment was based on fractions delivered per machine compared to the NRAG metric. While the number of attendances per machine has now increased, it is important that attendances per machine are not seen as the sole measure of productivity in the future.
4.14 The NAO report in 2011 used OECD data to show that the UK was 11th out of 20 countries in terms of machines per million head of population. At the time, the UK had 4.8 per million population (pmp) while, Switzerland, had over 16 pmp. Healthcare systems operating in these countries will vary, making comparisons difficult, but the dramatic changes in efficiency leading to the achievement of the waiting times standard could be interpreted as an indicator that machines in this country are, in fact, highly productive. This also raises questions about the sustainability of this improvement and the impact on the local workforce.
4.15 It is important to ensure that capacity is in the right place to optimise access. This may result in small centres having machines that are relatively underused. Productivity needs to be seen as a balance between the effective use of local resources and the right levels of access to the treatment in local populations.
4.16 Attendances per machine should be used as a measure of maximum activity rather than productivity as previously described. Measures of patient throughput per hour do not provide a quality benchmark but may be useful for providers managing a service. Network

Radiotherapy in England 2012
37
Radiotherapy Group work programmes will be informed by assessments against the productivity matrix. This should focus on assessment of the key indicators of radiotherapy provision
Opening hours
4.17 NRAG recommended that radiotherapy departments open at least 239 days per year, undertake some palliative radiotherapy on Saturdays and extend the working day beyond the traditional nine to five to improve the use of existing resources and efficiently utilise high value equipment.
4.18 However, the extension of opening hours has been limited. One reason for this could be the perception that some patients are less willing to attend for late evening, weekend or bank holiday appointments. There are challenges to operating extended hours and national work is being undertaken to both understand the hours that are currently being offered and to identify actual patient preferences.
4.19 A survey of patients’ opening hours preferences has been commissioned. It will provide data at regional level and help to identify any current barriers to provision of services outside normal hours. This will allow commissioners and providers to tailor services to local patient requirements and preferences. Data from this survey will be available during October 2012 and available on the National Cancer Action Team website.
4.20 It is essential that the service offered is of the same standard regardless of the day or time of day the treatment is delivered. To this end all staff groups and services normally available during the working week should also be available outside of the usual nine to five, Monday to Friday working week to deliver a quality service for patients outside normal hours. This includes systems and methods of access to pharmacy, nursing, oncologist/medical advice and support, portering, transport services, physicists, engineers, IT support, receptionist, secretaries, dietician, information and support team where appropriate and needed. To have all of these services available is a considerable, but not insurmountable, challenge. To restrict out of hours services to certain groups is a possible solution, but would limit choice for other groups of patients. Extended staffing across a variety of staff groups may be required to effectively extend hours and provide patient choice.
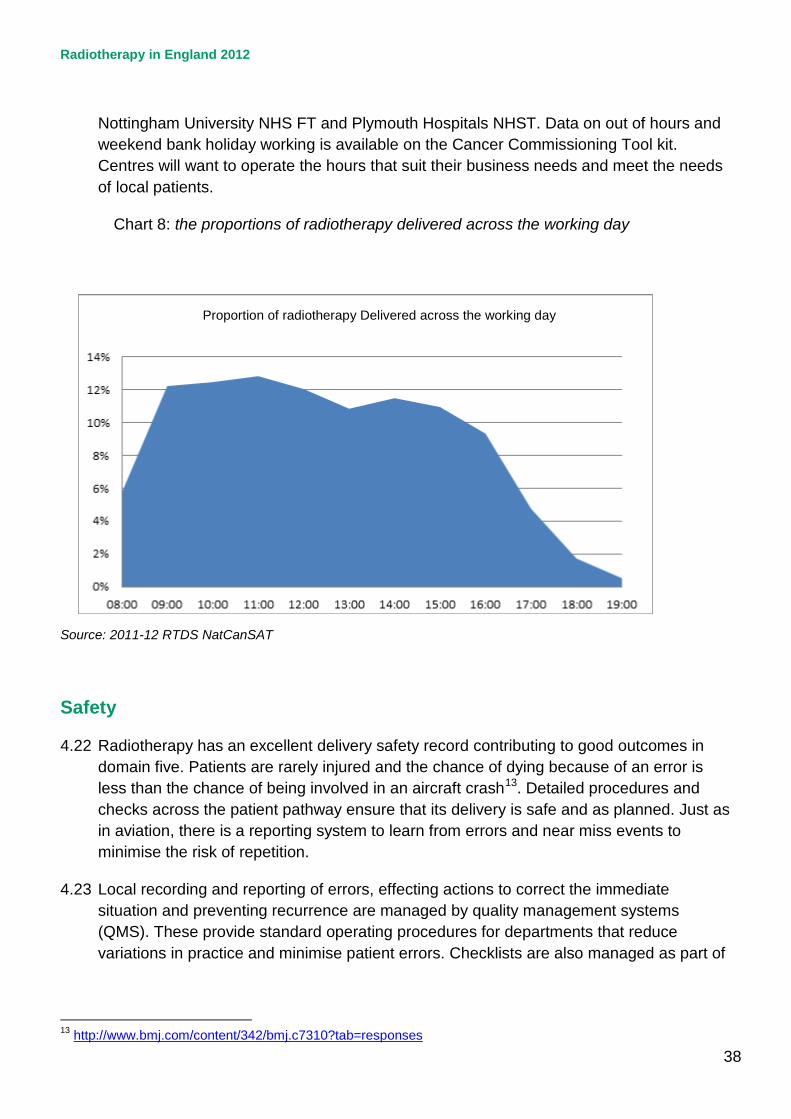
4.21 Some centres have sufficient capacity to manage patient requirements in normal working hours. However, an additional service between six pm and eight pm can accommodate around 10% of each day’s patients, as chart 7 demonstrates. Providers might want to meet expanding capacity requirements and offer greater choice to patients by extending the working day and offering treatment at weekends. Examples of centres making use of weekend and bank holiday working include Norfolk and Norwich University Hospital NHS Trust, Guy’s and St Thomas’ NHS FT, Lancashire Teaching Hospitals NHS FT,
Radiotherapy in England 2012
38
Nottingham University NHS FT and Plymouth Hospitals NHST. Data on out of hours and weekend bank holiday working is available on the Cancer Commissioning Tool kit. Centres will want to operate the hours that suit their business needs and meet the needs of local patients.
Chart 8: the proportions of radiotherapy delivered across the working day
Source: 2011-12 RTDS NatCanSAT
Safety
4.22 Radiotherapy has an excellent delivery safety record contributing to good outcomes in domain five. Patients are rarely injured and the chance of dying because of an error is less than the chance of being involved in an aircraft crash13. Detailed procedures and checks across the patient pathway ensure that its delivery is safe and as planned. Just as in aviation, there is a reporting system to learn from errors and near miss events to minimise the risk of repetition.
4.23 Local recording and reporting of errors, effecting actions to correct the immediate situation and preventing recurrence are managed by quality management systems (QMS). These provide standard operating procedures for departments that reduce variations in practice and minimise patient errors. Checklists are also managed as part of
13 http://www.bmj.com/content/342/bmj.c7310?tab=responses
Proportion of radiotherapy Delivered across the working day

Radiotherapy in England 2012
39
the QMS and as in surgery and aviation8,14 their introduction may further reduce errors in the radiotherapy process.
4.24 In 2008, the key professional bodies published a joint document Towards Safer Radiotherapy (TSRT)15. One of the recommendations was the establishment of a national voluntary reporting system. That is now provided by the National Reporting and Learning System (NRLS). The vast majority of incidents are low-level events that do not affect the outcome of patient care. However by including near misses within the analysis, a much larger dataset are produced which broadens the opportunities for learning.
4.25 The Health Protection Agency (HPA) undertake the routine analysis of reports submitted to the NRLS and regularly publishes learning from these analyses on their website16. The 2012 report shows a reduction in the number of higher level (Levels one to three) RTE reported and an increase in the number of lower level RTE (Levels four and five) as an increasing number of clinical departments subscribe to this system. Quarterly newsletters entitled ‘Safer Radiotherapy’4 provide regular updates on the analysis for professionals working in radiotherapy and include peer reviewed guidance on how to minimise commonly occurring errors.
4.26 Commissioners will want to ensure that this system is used to facilitate improvements in both learning and safety. In England, there remain 22% of centres (11 out of 50) who do not report to the NRLS using the trigger code TSRT9 described in the guidance document Implementing Towards Safer Radiotherapy ( 2010)17.
4.27 Healthcare organisations are required to notify the Care Quality Commission (CQC) of exposures to patients that are 'much greater than intended'. CQC inspectors investigate all notifications including a site visit where appropriate; they also conduct compliance inspections of radiotherapy departments. A breakdown of these notifications can be found in annual reports published on their website. Anonymised synopses of these events are shared with the HPA for inclusion in the national dataset for analysis and promulgation of learning to the community.
Equipment
4.28 NRAG recommended that to meet the actual requirement for radiotherapy and the anticipated increase in demand, there should be 306 radiotherapy treatment machines by 2011. However, capacity did not increase to meet all the anticipated demand. At the end of 2011, the RTDS showed that 265 machines were in regular clinical use (the actual number was higher but included machines in the process of being de-commissioned).
14 http://www.who.int/patientsafety/safesurgery/ss_checklist/en/ 15 http://www.rcr.ac.uk/publications.aspx?PageID=149&PublicationID=281 16 http://www.hpa.org.uk/Radiotherapy 17 http://www.hpa.org.uk/webc/HPAwebFile/HPAweb_C/1296688315335

Radiotherapy in England 2012
40
4.29 NRAG calculations of machine requirement were based on the total number of fractions required and expected throughput per machine. The requirement has been recalculated in the following table using the revised overall requirement and machine throughput based on attendances.
Table 6: The following table reworks the productivity indicator metric using the Malthus data and estimates new machine number requirement.
Year Malthus attend/ million
Population (millions)
Total demand (attends)
productivity attend/ linac
Linacs required
2006 44,461 50.78 2,257,746 7000 323 2010 48,035 52.46 2,520,036 7300 345 2016 55,206 54.47 3,006,843 7300 412 2020 60,057 55.80 3,351,285 7300 459
4.30 Linear accelerators should be replaced at ten years of age. Decisions to purchase linear accelerators are taken by local providers in consultation with commissioners. Providers are responsible for maintaining their stock of equipment in a manner that enables them to provide high quality care and improved outcomes for patients.
4.31 The service should provide timely treatment to modern standards. Replacement of linear
accelerators at ten years is important to ensure appropriate radiotherapy capability and the latest techniques. The draft service specification for specialised commissioning of radiotherapy identifies that commissioners may wish to divert activity from providers where this has been exceeded without agreement.
4.32 Chart 9 sets out the age profile of linear accelerators in England. The coloured area (red)
indicates the point at which a replacement plan should already be agreed given the installation and commissioning time required.
4.33 It shows that 26 of 266 linacs are now past their recommended replacement age and that
a further 59 will require replacement within the next three years.

Radiotherapy in England 2012
41
Chart 9: the age profile of Linear Accelerators in England
4.34 Trusts need to be active asset managers. In response to claims that Trusts face
competing demands on their budget, the NHS Supply Chain has established a fund that can be used to buy larger items of equipment, securing discounts and enabling Foundation Trusts to purchase using low interest rate loans.
Workforce
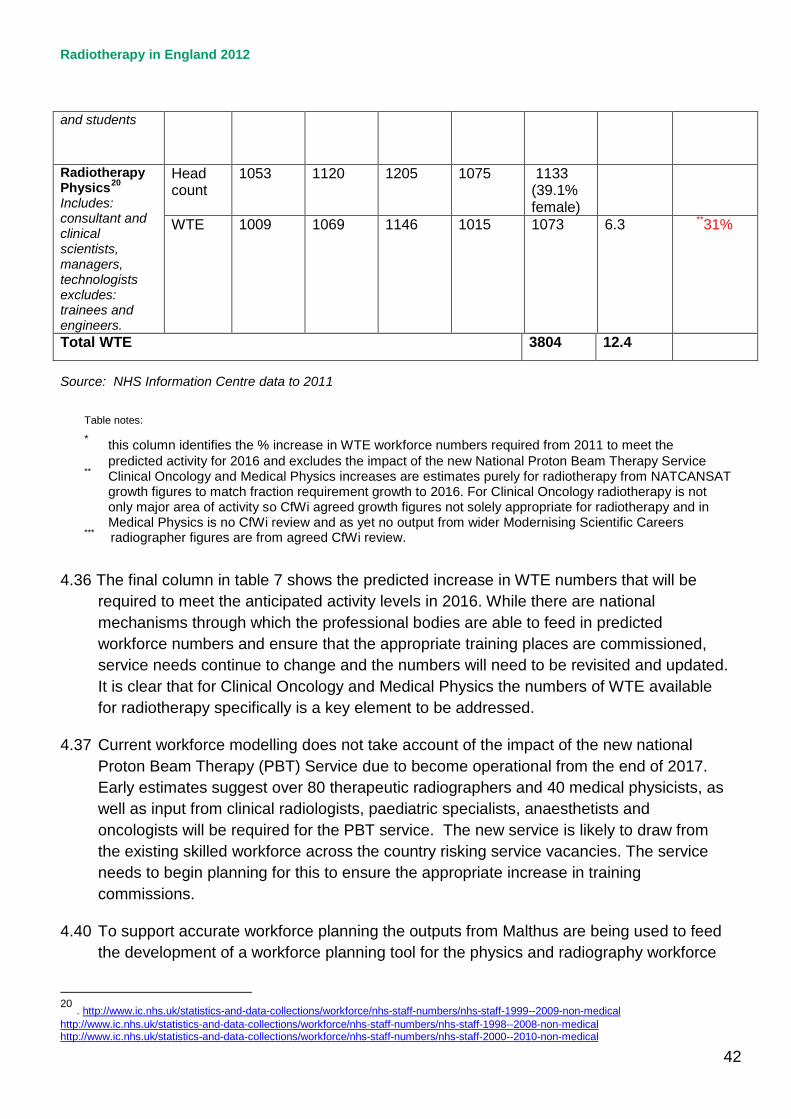
4.35 In 2011, there were approximately 3802 whole time equivalent (WTE) Radiography, Physics and Clinical oncology staff involved in delivering radiotherapy services. This is a 12.4% increase in the total workforce from 2007 with a 13% increase in activity in the same period. Table 7, below shows how the numbers have grown by staff group.
Table 7: Radiotherapy workforce
2007 2008 2009 2010 2011 % increase 2007 -2011
% increase needed 2011 to 2016*
Consultant Clinical Oncologists18
Head count
506 533 543 524 544
WTE
469 491 502 484 505 7.7 **16%
Therapeutic Radiographers19 excludes assistant practitioners
Head count
2132 2213 2338 2423 2482 (84.7% female)
WTE
1907 1980 2097 2177 2226 16.7 ***39%
18 http://www.ic.nhs.uk/statistics-and-data-collections/workforce/nhs-staff-numbers/nhs-staff-2001--2011-medical-and-dental 19 http://www.ic.nhs.uk/statistics-and-data-collections/workforce/nhs-staff-numbers/nhs-staff-2001--2011-non-medical http://www.ic.nhs.uk/statistics-and-data-collections/workforce/nhs-staff-numbers/nhs-staff-2000--2010-non-medical
Radiotherapy in England 2012
42
and students
Radiotherapy Physics20 Includes: consultant and clinical scientists, managers, technologists excludes: trainees and engineers.
Head count
1053 1120 1205 1075 1133 (39.1% female)
WTE
1009 1069 1146 1015 1073
6.3 **31%
Total WTE 3804 12.4
Source: NHS Information Centre data to 2011
Table notes:
* this column identifies the % increase in WTE workforce numbers required from 2011 to meet the predicted activity for 2016 and excludes the impact of the new National Proton Beam Therapy Service
** Clinical Oncology and Medical Physics increases are estimates purely for radiotherapy from NATCANSAT growth figures to match fraction requirement growth to 2016. For Clinical Oncology radiotherapy is not only major area of activity so CfWi agreed growth figures not solely appropriate for radiotherapy and in Medical Physics is no CfWi review and as yet no output from wider Modernising Scientific Careers
*** radiographer figures are from agreed CfWi review.
4.36 The final column in table 7 shows the predicted increase in WTE numbers that will be required to meet the anticipated activity levels in 2016. While there are national mechanisms through which the professional bodies are able to feed in predicted workforce numbers and ensure that the appropriate training places are commissioned, service needs continue to change and the numbers will need to be revisited and updated. It is clear that for Clinical Oncology and Medical Physics the numbers of WTE available for radiotherapy specifically is a key element to be addressed.
4.37 Current workforce modelling does not take account of the impact of the new national Proton Beam Therapy (PBT) Service due to become operational from the end of 2017. Early estimates suggest over 80 therapeutic radiographers and 40 medical physicists, as well as input from clinical radiologists, paediatric specialists, anaesthetists and oncologists will be required for the PBT service. The new service is likely to draw from the existing skilled workforce across the country risking service vacancies. The service needs to begin planning for this to ensure the appropriate increase in training commissions.
4.40 To support accurate workforce planning the outputs from Malthus are being used to feed the development of a workforce planning tool for the physics and radiography workforce
20 . http://www.ic.nhs.uk/statistics-and-data-collections/workforce/nhs-staff-numbers/nhs-staff-1999--2009-non-medical http://www.ic.nhs.uk/statistics-and-data-collections/workforce/nhs-staff-numbers/nhs-staff-1998--2008-non-medical http://www.ic.nhs.uk/statistics-and-data-collections/workforce/nhs-staff-numbers/nhs-staff-2000--2010-non-medical

Radiotherapy in England 2012
43
(the Workforce Integrated Planning Tool, WIPT). This will help identify the overall requirements for national training numbers for the physics and radiographic professional groups taking account of emerging changes to local skill mix as a result of new techniques and technologies.
4.41 In the future system, Health Education England (HEE) will have national oversight of healthcare workforce planning and development, including education and training, ensuring that the healthcare workforce has the right skills, behaviours and training and is available in the right numbers to support the delivery of excellent healthcare and health improvements.
4.42 The radiotherapy providers and professional bodies will need to ensure HEE and LETBs have the right information and data to enable the right numbers of radiotherapy workforce with the right skills are in place to deliver excellent services for patients as demand continues to grow.
4.43 The Centre for Workforce Intelligence (CfWI) will provide workforce planning and development advice and information to the NHS, public health and social care system and represents increased investment in ensuring the health, public health and social care workforce is well planned and better able to adapt to changing demand and circumstances.
4.44 All appropriate professional bodies will want to work with the CfWI and take a unified approach in reviewing both skills mix and each professions requirements in order to ensure the overall training numbers continue to match the service requirement as demand increases and new technologies and specialised treatments become available.
4.45 The activity gaps described in this report indicate an immediate need for growth in the workforce to meet the required service expansion. Each staff group faces particular challenges, with changes to skill mix and roles affecting the growth required within each professional group, these are described in the following paragraphs.
Clinical Oncologists
4.46 There is a planned increase in Clinical Oncologist numbers of 7.5% per annum through to 2016. It is essential that the full implications of increased complexity of radiotherapy planning should be factored into future discussions with CfWI. New techniques including IMRT and SABR demand additional clinical oncology input compared with conventional radiotherapy planning techniques (2hours compared to 30 minutes). At the same time, there are changes in technology that might enable both a more effective use of workforce and higher quality assurance, such as outlining tools, particularly for normal tissues and target volumes. It is important that the impact of all of these developments be evaluated alongside patient pathways to feed into national workforce planning mechanisms and enable the right investment in training provision to support local workforce development.

Radiotherapy in England 2012
44
4.47 The care pathways that include radiotherapy have become more complex and Clinical Oncologists have a key role in patient management throughout. The selection, assessment and consent of patients, as many have co-morbidities and combined modality therapy has become standard in many curative treatments, is time consuming. There is also a need to continue the increased recruitment of patients into Clinical Trials and evaluate outcomes, if radiotherapy is to be used optimally in patient management.
4.48 One of the challenges to the implementation of new technologies is Clinical Oncologists having appropriate time for radiotherapy planning and development in their job plans. In recent responses from centres to an NCAT request for action plans to overcome barriers to the implementation of these new technologies, 49% of centres identified Clinical Oncology staffing as a problem. The impact of tumour site specialisation with adequate team cover and the increasing proportion of part time consultants pose new challenges for workforce planning. Other competing areas of growth in Clinical Oncology practice, such as Acute Oncology, Stratified Medicine and Molecular Radiotherapy also need to be addressed. It is, however, essential that the number of WTE Clinical Oncologists is increased sufficiently to ensure the delivery of optimal radiotherapy nationally. Providers are encouraged to review job plans in line with the RCR guidance.
Therapeutic Radiographers
4.49 The vacancy rate against established therapeutic radiography posts has increased from 5% in 2010 to 8.4% in 2011 (Nov 2011 IPEM SCoR census). Therapeutic Radiography is recognised across Government as an occupation with shortages and remains on the Home Office sponsored Migration Advisory Committee Shortage Occupation List (Tier 2). The CfWi has stated that future radiographic workforce supply will meet the estimated demand, as defined by the profession, in 2016. This however does not include the radiographic workforce required for the Proton Beam Therapy Service.
4.50 The NRAG report recommended implementation of the four-tier career progression model for therapeutic radiographers to ensure that all workforce skills are utilised most effectively. Consultant and Advanced Radiography Practitioners are leading site-specific pathways of care, streamlining pathways for patients but only 14% of radiotherapy centres have these roles. Table 8, below, shows the proportion of centres implementing the new levels of practice.
Table 8: implementation of the 4-tier framework 4-tier framework (Career Progression Level)
% of radiotherapy centres with these roles *
Consultant Radiographer Practitioners
14%*
Advanced Practitioners 86% * (both site specific and technical lead roles) 60%*) of centres are planning to increase the number of advanced practitioners in post
Assistant Practitioners 61% * The average number of assistant practitioners per centre is 1.4, only 4% *(centres have an assistant practitioner allocated to every linac
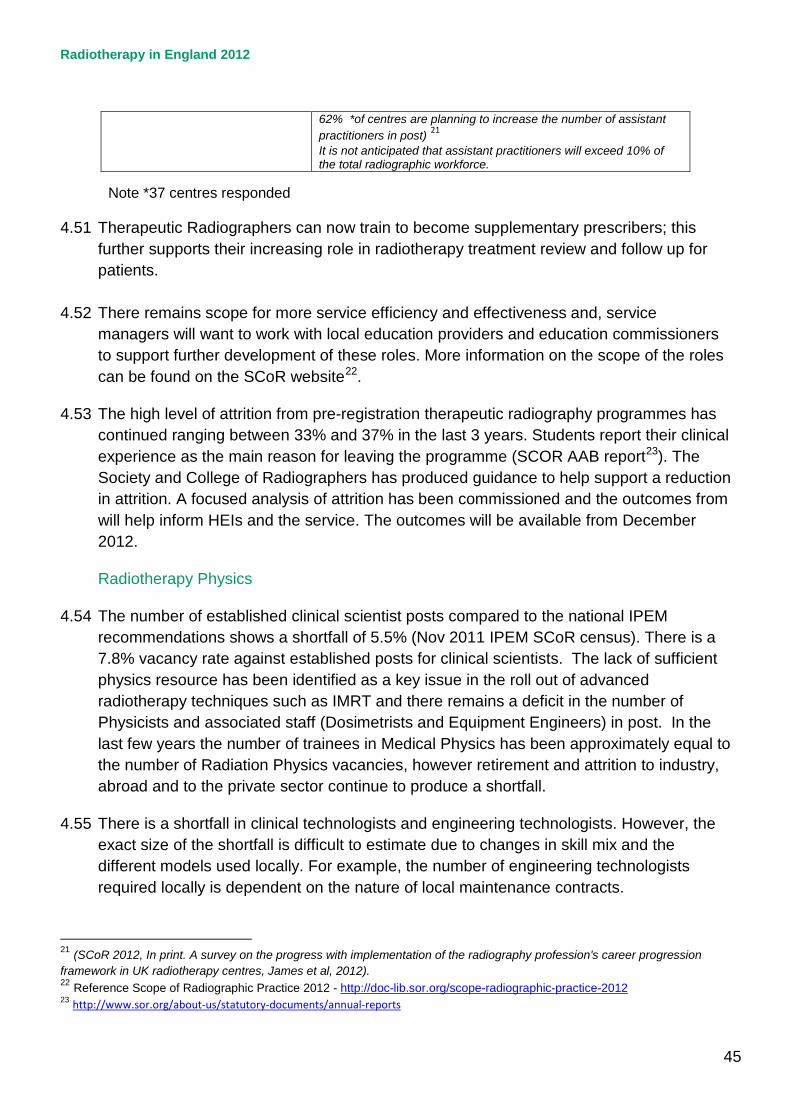
Radiotherapy in England 2012
45
62% *of centres are planning to increase the number of assistant practitioners in post) 21 It is not anticipated that assistant practitioners will exceed 10% of the total radiographic workforce.
Note *37 centres responded
4.51 Therapeutic Radiographers can now train to become supplementary prescribers; this further supports their increasing role in radiotherapy treatment review and follow up for patients.
4.52 There remains scope for more service efficiency and effectiveness and, service
managers will want to work with local education providers and education commissioners to support further development of these roles. More information on the scope of the roles can be found on the SCoR website22.
4.53 The high level of attrition from pre-registration therapeutic radiography programmes has continued ranging between 33% and 37% in the last 3 years. Students report their clinical experience as the main reason for leaving the programme (SCOR AAB report23). The Society and College of Radiographers has produced guidance to help support a reduction in attrition. A focused analysis of attrition has been commissioned and the outcomes from will help inform HEIs and the service. The outcomes will be available from December 2012.
Radiotherapy Physics
4.54 The number of established clinical scientist posts compared to the national IPEM recommendations shows a shortfall of 5.5% (Nov 2011 IPEM SCoR census). There is a 7.8% vacancy rate against established posts for clinical scientists. The lack of sufficient physics resource has been identified as a key issue in the roll out of advanced radiotherapy techniques such as IMRT and there remains a deficit in the number of Physicists and associated staff (Dosimetrists and Equipment Engineers) in post. In the last few years the number of trainees in Medical Physics has been approximately equal to the number of Radiation Physics vacancies, however retirement and attrition to industry, abroad and to the private sector continue to produce a shortfall.
4.55 There is a shortfall in clinical technologists and engineering technologists. However, the exact size of the shortfall is difficult to estimate due to changes in skill mix and the different models used locally. For example, the number of engineering technologists required locally is dependent on the nature of local maintenance contracts.
21 (SCoR 2012, In print. A survey on the progress with implementation of the radiography profession's career progression framework in UK radiotherapy centres, James et al, 2012). 22 Reference Scope of Radiographic Practice 2012 - http://doc-lib.sor.org/scope-radiographic-practice-2012 23 http://www.sor.org/about-us/statutory-documents/annual-reports

Radiotherapy in England 2012
46
4.56 Modernising Scientific Careers (MSC) has created a single, more consistent and patient focused training route and career structure for all Healthcare Practitioners and Scientists working in the NHS. The training programmes are in different stages of development with the academic components being delivered by Higher Education Institutes and supplemented by work based learning. This work based learning requires significant support from clinical scientists; at present, the impact of this on the clinical service is not fully understood, but is likely to have introduced a transitory affect. The development of a Higher Specialist Scientific Training programme in the radiotherapy physics specialty has the potential to provide a scientific workforce more able to meet the demands of a modern radiotherapy service.
4.57 The training commissioning of Healthcare Scientists working in radiotherapy physics is similarly in a state of transition. Future requirements will be developed via the Academy for Healthcare Science. Engagement with the emerging structure for training commissions will be essential to improve workforce planning in this area.
4.58 The development of a Radiotherapy Physics Practitioner training model supported by MSC (Modernising Scientific Careers) to test a new model for provision of additional Radiotherapy Physics workforce is due to complete in the autumn. The programme delivers a model for work based learning to support the implementation of new technologies. The programme has also delivered 11 practitioners as well as a toolkit to support wider roll-out. Local funding will be required to support wider roll out24.
4.59 The staffing levels in radiotherapy departments must undergo continued monitoring and assessment over the coming years and remains a risk to the continuation and further development of a modern radiotherapy service
Training support
4.60 All HEIs in England have access to a Virtual Learning tool (VERT) to support clinical education since 200825. A recent VERT survey (2011) identified variation in use including for clinical education, patient information and education of non- oncology staff. A wide variety of benefits were reported by regular users, but a large proportion reported infrequent use of VERT. Centres need to consider identifying a lead practitioner to help ensure that all potential benefits of VERT are maximized.
4.61 To support the implementation of new technologies a series of web-based e-learning resources have been developed by the professional bodies in partnership with DH E-
24
http://ncat.nhs.uk/sites/default/files/Development%20and%20Delivery%20of%20Dosimetry%20Early%20Implementation%20Programme%20V1%201%20Final.pdf
25 http://www.e-lfh.org.uk/projects/radiotherap-e/index.html

Radiotherapy in England 2012
47
Learning for Healthcare. Five modules offer multi-professional learning resources for the trained workforce involved in the delivery of radiotherapy, covering:
• IGBT Cervix • IGBT Prostate • IMRT, • IGRT aligned to the NRIG IGRT guidance (reference) • Stereotactic Ablative Radiotherapy (SABR) from November.
4.62 Support for IMRT has also been provided through a national programme providing training to 14 centres. National leads have been appointed to support the roll out of IGRT across Radiotherapy centres in England in line with the NRIG IGRT guidance (to May 2013).
4.63 There is an ongoing need for non-medical post registration and training to support the rapid development of higher-level skills to meet ongoing service developments.

Radiotherapy in England 2012
48
5. Commissioning 5.1 Addressing the needs of patients with cancer is high priority at both a national and local
level and reducing mortality rates continues to be a key priority for NHS commissioners. The National Radiotherapy Advisory Group (NRAG) set out the implementation framework for delivering a ‘World Class Radiotherapy Service’ in 2007 and the previous chapters have detailed the significant developments since its publication.
5.2 Fundamentally, radiotherapy remains a key component for the treatment of cancer and there continues to be an increasing demand for radiotherapy services due to the increase in cancer incidence and the complexity of treatments being delivered. It is essential, therefore, that commissioners have clearly defined plans in place which account for current and future demand for radiotherapy services
5.3 Improving Outcomes: A Strategy for Cancer, 2011, stated that access to radiotherapy is critical to improving outcomes and that there must be equitable access to high quality, safe, timely, protocol-driven quality-controlled services focused around patients’ needs.
5.4 The key commissioning priorities as a result of the above and aligning with the NHS Operating Framework are:
• to commission quality, effective and efficient radiotherapy services to meet population need that can maximise clinical outcomes based on the five domains of the NHS Outcomes Framework
• meeting the NHS quality and productivity challenge maximising use of resources and systems
• building a new system, including the National Commissioning Board, responsible for radiotherapy commissioning.
Strengthening commissioning
5.5 Estimating both current and future demand for radiotherapy services and the proportion of patients with cancer who will require radiotherapy is complex.
5.6 In the last five years, the national teams have worked closely with cancer networks, commissioners and radiotherapy service managers to develop tools, guidance and supporting documentation to help commissioners assess local needs, develop capacity plans, quality and monitoring metrics, the application of new technologies to facilitate and

Radiotherapy in England 2012
49
commission the appropriate radiotherapy services to meet population needs. Examples of these tools include:
• R-Port planning tool – this planning tool has enabled providers to model changes in activity and plans the impact on staff resources following the introduction of new techniques and service changes (www.rport.co.uk)
• radiotherapy service specification – offers a standardised approach to commissioning radiotherapy services
• National Radiotherapy Data Set (RTDS) – collects data centrally on every patient treated with radiotherapy
• radiotherapy data inclusion on the Cancer Commissioning Toolkit – provides a mechanism for benchmarking and monitoring delivery in order to make improvements
• IGRT, IMRT and SBRT guidance documents for commissioners and providers.
5.7 Simultaneously there has been a drive to improve the quality of radiotherapy through the introduction of more individualised and advanced technologies such as IMRT and IGRT (Intensity Modulated Radiotherapy and Image Guided Radiotherapy).
5.8 All the above have supported a commissioning shift that has resulted in a focused approach to the commissioning of radiotherapy services in line with the strategic direction set out in NRAG and which in turn has facilitated an increase in access to radiotherapy. A key commissioning intention is that this approach will lead to optimal radiotherapy utilisation resulting in improved clinical outcomes and reduced morbidity and mortality for cancer patients undergoing radiotherapy.
5.9 Historically, radiotherapy services have been excluded from payment by results and have been commissioned using locally agreed tariffs or via block contracts. This has created different contract types and a variety of currencies and prices. The DH PbR team, together with local teams have been working to improve data on activity and costs to enable a national radiotherapy tariff to be introduced.
5.10 Currencies for external beam radiotherapy have been mandated for 2012-13. The DH has also published non-mandated tariff prices.
5.11 Payment by Results Guidance for 2012-13 states that ‘commissioners and providers will want to work together to manage the impact and potential risk of introducing both contract currencies and local prices for external beam radiotherapy.
5.12 Having mandated the radiotherapy delivery currency for 2012, the DH team are expecting to recommend a mandated national tariff from April 2013.
Radiotherapy in England 2012
50
6. Research 6.1 Radiotherapy related research is a complex, multidisciplinary process integrating the
relevant basic science disciplines, imaging, biomarkers, advanced radiotherapy techniques and the integration of novel drugs. This requires centres of excellence with critical mass to lead the process as well as a network of active centres to recruit to clinical trials.
6.2 The Gray Institute for Radiation Oncology and Biology in Oxford was established as a
centre of excellence for preclinical research in 2006, to take a leading role in reinvigorating radiobiology research in the UK. Several centres across the UK are building up their critical mass in radiotherapy research (Glasgow, Leeds, Manchester, Belfast, Cambridge and Royal Marsden) which will contribute over time towards a sustainable high quality radiotherapy research environment in the UK.
6.3 The NCRI Clinical and Translational Radiotherapy Research Working Group (CTRad)
was established in November 2008 and launched fully in July 2009. Its creation was in direct response to the ten-point action plan set out in the 2008 NCRI Rapid Review of Radiotherapy and Associated Radiobiology, as agreed by the NCRI Board. CTRad consists of a 15-person Executive Group and four work-streams; the 82 members include clinical oncologists, radiographers, medical physicists, industry representatives, network managers, methodologists, basic scientists and consumers.
6.4 Coordinating radiotherapy research initiatives through CTRad avoids duplication of
research activity in different centres and helps to make good use of funding and resources. The formation and work of the group has begun to invigorate clinical and scientific researchers in radiotherapy and radiobiology and substantial progress has been made against the ten-point plan. The long-term goal of building internationally competitive radiotherapy-related research that integrates into an evolving world class NHS radiotherapy service can be achieved by continuing the momentum that CTRad has gathered.
6.5 The number of radiotherapy trials submitted and successfully funded has already
increased, with a 17% increase in patients accrued to radiotherapy trials across the UK between 2008-09 and 2009-10. The support from NIHR for the Radiotherapy Trials Quality Assurance (RTTQA) programme ensures that new techniques introduced through clinical trials are safe and consistent.
6.6 The Technology used in radiotherapy is continuously evolving, however, patient do not
always benefit as quickly as they might because of the lack of directed and coordinated programmes to evaluate the technology in clinical use. New commissioning

Radiotherapy in England 2012
51
arrangements, together with coordinated research programmes should address this delay.
Implications for the service from current research
Hypofractionation
6.7 There are opportunities for using reduced fractionation in both breast and prostate cancers, both of which are high volume sites, which place a high demand on radiotherapy services. Trials, both on-going and planned, are exploring these possibilities, examining hypofractionation, SABR and IORT; early results have been reported but it may be several years before any recommendations about implementation can be made.
Increased uptake of radiotherapy for ‘difficult’ sites
6.8 New techniques reduce morbidity from radiotherapy. This opens the opportunity for some current areas of unmet medical need to be met by advanced radiotherapy. Good examples of this are non-small cell lung cancer, locally advanced pancreas cancer, cholangiocarcinoma. This will lead to modest increase in radiotherapy demand if the trials prove clinical benefit.
Increased use of functional imaging
6.9 Functional imaging (especially PET and MRI scans) reveals the physiological characteristics of the tumour such as altered metabolism or hypoxia (low oxygen which increases radioresistance). This can be used to improve tumour delineation in radiotherapy planning, to stratify patients for modification of radiotherapy and to adapt radiotherapy in light of early assessment of response during treatment. If successful, this concept will lead to an increased requirement for functional imaging to support radiotherapy decision making in the future.
Combinations with New drugs
6.10 One of the great successes of the last 20 years has been the incorporation of conventional chemotherapy with radiotherapy, resulting in combination chemoradiation as the standard of care for nearly all sites treated with radical intent and about a 10% improvement in cure achieved as a result. Current research is examining whether the new drugs can achieve even greater benefits and there are encouraging indications that this will be the case. While this will lead to commissioning challenges to cover costs of these new agents, this will be at a smaller scale than for the current cancer drugs funding as when used in combination with radiotherapy, these agents are only used for a short period (up to six weeks).
Radiotherapy in England 2012
52
7. Patients and the Public
Patient experience
7.1 To improve outcomes in domain four, the service needs to understand how patients feel about their experience being treated with radiotherapy. The National Cancer Patient Experience Survey (CPES) asked only one question about radiotherapy services. This was not discriminating enough to allow radiotherapy providers to identify areas where services are meeting patient expectations and where they are falling short. A more detailed radiotherapy satisfaction survey has been commissioned which will allow services to understand where these challenges and opportunities for improvement lie.
7.2 Work on the survey has been led by lay representatives members of NRIG and includes
questions on: • consent • consultation • information received on both treatment and support services • external information sources • environment • communications • follow-up • support groups.
7.3 This work will be completed during 2012-13 and will be shared with providers and commissioners. Providers are encouraged to use the data in conjunction with their local satisfaction surveys to support local planning to improve patient satisfaction. This document has been mapped to the RCR Making your Radiotherapy Service More Patient Friendly to ensure a consistent approach.
The national radiotherapy awareness initiative
7.4 At the end of 2010, the NRAI was established to improve the awareness of radiotherapy services across the UK, as it was thought to have a low profile and was poorly understood by the general public. A national You Gov survey confirmed these impressions and an awareness campaign with 2011 as the ‘Year of Radiotherapy’ was created. A repeat survey carried out 12 months later indicated that there had been an improved perception of radiotherapy as an effective modern cancer treatment. The NRAI will continue to work to raise awareness through The Age of Radiotherapy.
Radiotherapy in England 2012
53
Patient Information (treatment and choice)
7.5 Patients can expect to be provided with good quality information setting out the type of radiotherapy that might be most appropriate for their disease, how that treatment is delivered, the possible side effects and the standards they might expect from the delivery service. They should also have clear information about late effects and their management. National work is ongoing to ensure that organisations providing patient literature make good quality up to date information on radiotherapy widely available.
7.6 Treatment options, some of which may not be available locally, should also be discussed to ensure informed choice26. Information on the types of radiotherapy and where it is available will be available on NHS Choices, Macmillan Cancer Support and CRUK websites. The detailed radiotherapy satisfaction survey will also identify the extent to which patients feel they are being provided with appropriate information.
26 General Medical Council. Consent: patients and doctors making decisions together. General Medical Council. London 2008].
Available at: http://www.gmc-uk.org/guidance/ethical_guidance/consent_guidance_index.asp

Radiotherapy in England 2012
54
8. Looking ahead to 2020 8.1 To continue to improve outcomes from radiotherapy to 2020, commissioners and
providers will need to deliver equitable access for patients, ensure that fractionation, including the use of IMRT (Intensity Modulated Radiotherapy) and IGRT (Image Guided Radiotherapy), is prescribed within national and international norms and that the quality of treatment is advanced.
8.2 To advance quality, it is anticipated that there will be more widespread use of image fusion and contrast for radiotherapy planning and an increased role for radiologists in volume definition to improve quality control of outlining and planning practice. It is also anticipated that quality control of the medical aspects of radiotherapy planning will become routine, using peer-to-peer review, benchmarking and other techniques.
8.3 By 2020, IMRT and IGRT will be available to all patients who will benefit as envisaged in the NRAG report, the first step in making 4D adaptive radiotherapy available. The evidence base must be kept under review to ensure that all patients in England benefit from the latest techniques.
8.4 The radiotherapy dataset will need to be developed to give reliable and timely feedback of benchmarking data not only on radiotherapy attendances, but also on quality measures such as the proportions of patients receiving IMRT and IGRT. These developments will pave the way for 4D adaptive radiotherapy, which presently remains a research technique.
8.5 Patient Reported Outcome Measures (PROMS) should be an area of consideration in future work programmes. Outcome data should be routinely collected for both tumour control and late toxicity.
8.6 New commissioning arrangements will enable all radiotherapy services to be commissioned to a standard service specification. The advent of tariff and greater clarity about activity and costs will help commissioners and providers to ensure more rapid implementation of new technologies and specialist techniques, while providing efficient services for patients.
8.7 Clinical trials are underway to assess key questions regarding hypofractionation. These, if proven, will have a key role in creating radiotherapy capacity and improved patient experience. Commissioners will want to work with providers to create an environment to encourage these key questions to be resolved quickly.
8.8 The professional bodies will want to compare waiting times standards with the clinical data available to review whether tumour specific standards are needed to ensure optimal therapy.
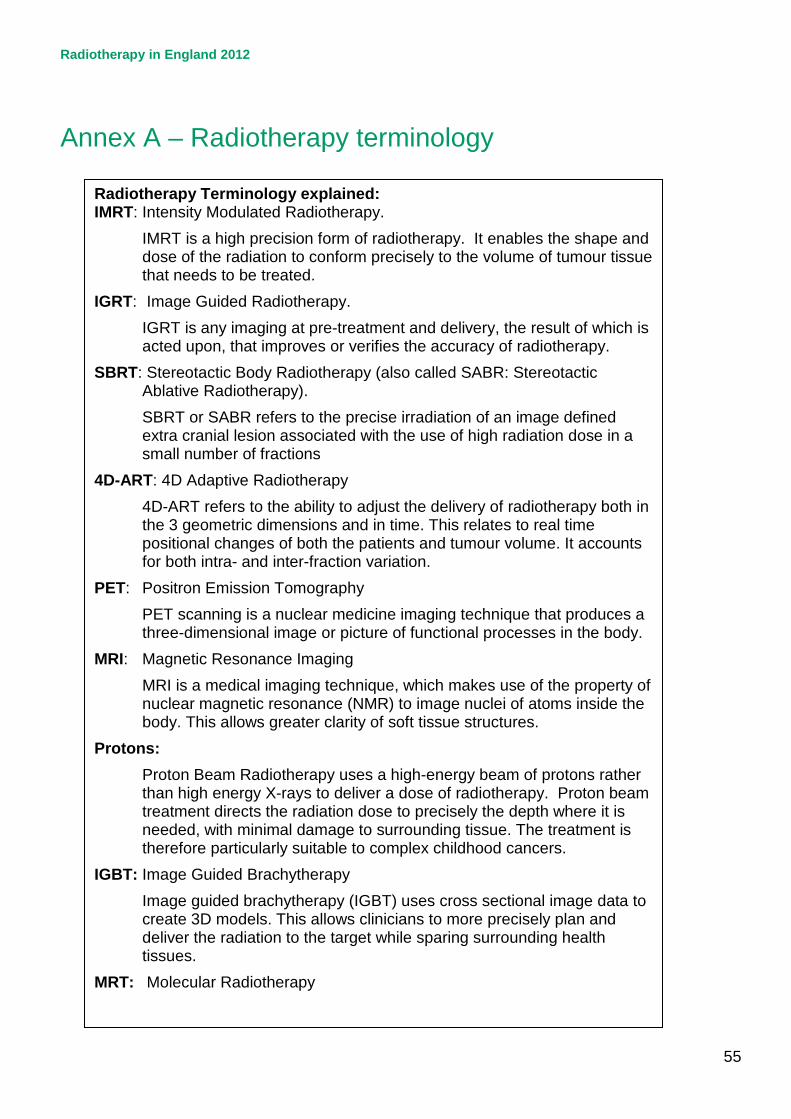
Radiotherapy in England 2012
55
Annex A – Radiotherapy terminology
Radiotherapy Terminology explained: IMRT: Intensity Modulated Radiotherapy.
IMRT is a high precision form of radiotherapy. It enables the shape and dose of the radiation to conform precisely to the volume of tumour tissue that needs to be treated.
IGRT: Image Guided Radiotherapy. IGRT is any imaging at pre-treatment and delivery, the result of which is acted upon, that improves or verifies the accuracy of radiotherapy.
SBRT: Stereotactic Body Radiotherapy (also called SABR: Stereotactic Ablative Radiotherapy). SBRT or SABR refers to the precise irradiation of an image defined extra cranial lesion associated with the use of high radiation dose in a small number of fractions
4D-ART: 4D Adaptive Radiotherapy 4D-ART refers to the ability to adjust the delivery of radiotherapy both in the 3 geometric dimensions and in time. This relates to real time positional changes of both the patients and tumour volume. It accounts for both intra- and inter-fraction variation.
PET: Positron Emission Tomography PET scanning is a nuclear medicine imaging technique that produces a three-dimensional image or picture of functional processes in the body.
MRI: Magnetic Resonance Imaging MRI is a medical imaging technique, which makes use of the property of nuclear magnetic resonance (NMR) to image nuclei of atoms inside the body. This allows greater clarity of soft tissue structures.
Protons: Proton Beam Radiotherapy uses a high-energy beam of protons rather than high energy X-rays to deliver a dose of radiotherapy. Proton beam treatment directs the radiation dose to precisely the depth where it is needed, with minimal damage to surrounding tissue. The treatment is therefore particularly suitable to complex childhood cancers.
IGBT: Image Guided Brachytherapy Image guided brachytherapy (IGBT) uses cross sectional image data to create 3D models. This allows clinicians to more precisely plan and deliver the radiation to the target while sparing surrounding health tissues.
MRT: Molecular Radiotherapy

Radiotherapy in England 2012
56
Annex B – Productivity Matrix

Radiotherapy in England 2012
57
Annex C – Radiotherapy Master Table
Safe
tyPa
tient
Ex
perie
nce
Serv
ice
Plan
ning
Com
ents
This
rela
tes t
o th
e qu
ality
of
data
at f
irst
subm
issi
on
Data
qua
lity
ta
ken
from
24
QA
test
s on
key
RT
DS d
ata
item
s
note
this
curre
ntly
re
flect
s qu
ality
of
IMRT
codi
ng to
RT
DS:
N
OT
IMRT
del
iver
y
IMRT
Sur
vey
Jan
2012
.
May
les a
nd C
oope
r Su
bseq
uent
ly P
ublis
hed
in
Clin
ical
Onc
olog
y
data
from
CQ
uIN
Sda
ta fr
om
CQuI
NS
Data
from
N
atio
nal
Repo
rting
and
Le
arni
ng
Syst
em u
sing
Tr
igge
r Cod
e TS
RT9
as in
To
war
ds S
afer
Ra
diot
hera
py
From
201
0 Ca
ncer
Pa
tient
Er
xper
ienc
e Su
rvey
Q1,
Q2,
Q3,
Q4
map
of n
umbe
rs
patie
nts i
n RT
DS to
nu
mbe
r in
CWTd
b -
Regi
stra
tion
by o
ne
mem
ber o
f the
cl
inic
al te
am, a
nd
ther
efor
e th
e ab
ility
to
com
pare
to
natio
nal f
ract
iona
tion
trees
.
Cons
ulta
nt;
Adva
nced
; Pr
actit
ione
r; As
sist
ant
Num
ber r
efle
cts
age
of o
ldes
t Li
nacs
. Whe
re
mor
e th
an o
ne
Lina
c fal
ls in
to th
is
cate
gory
- th
ese
have
all
been
sh
own
Data
Per
iod
RTDS
201
1/12
April
- Se
pt 2
011
p
ro
rata
FYE
2010
/11
2010
/11
2009
- 20
1220
1020
11/1
220
11Ju
l-12
2010
/11
2012
dat
a - R
TDS
Cent
re
Code
Cent
re N
ame
Perc
enta
ge o
f RT
DS D
ata
QA
pass
es o
n fir
st
subm
issi
on
Qua
lity
of R
TDS
data
item
s
IMRT
as a
% o
f all
radi
cal e
piso
des.
RT
DS d
ata
Self
Repo
rted
IMRT
via
Sur
vey.
Peer
Rev
iew
G
ener
ic R
T M
easu
res
(10-
3T-1
)
Peer
Rev
iew
Ex
tern
al B
eam
M
easu
res
(10-
3T-2
)
Repo
rting
to
NRL
S w
ith
trigg
er C
odes
Patie
nt
Satis
fact
ion
31 d
ay
subs
eque
nt w
aits
fo
r rad
ioth
erap
y
qual
ity o
f dat
a to
31
day
wai
ts
Use
of t
he M
alth
us
tool
Impl
emen
tatio
n of
4
Tier
Stru
ctur
eAg
e pr
ofile
of
Line
ar A
ccel
erat
ors
RA2
Guild
ford
92%
88%
3.6%
12.5
%66
%97
%20
11/1
280
.60%
7RA
7Br
isto
l 92
%90
%1.
3%4.
4%93
%10
0%20
11/1
277
.60%
10,1
2RA
9To
rbay
100%
93%
1.4%
0%63
%55
%75
.90%
10RA
JSo
uthe
nd10
0%10
0%18
.7%
20.0
%82
%83
%20
11/1
284
.70%
14RA
LRo
yal F
ree
100%
99%
4.2%
4.2%
66%
57%
2011
/12
78.4
0%7
RAP
Nor
th M
iddl
esex
100%
99%
0.0%
0.0%
52%
71%
2011
/12
85.1
0%10
,14
RBA
Taun
ton
58%
94%
0.0%
N/A
57%
88%
2011
/12
85.1
0%3
RBV
Man
ches
ter
67%
91%
0.0%
17.8
%70
% /
73%
94%
/ 94
%83
.30%
10,1
1,11
.11,
12RD
1Ba
th10
0%94
%1.
6%0%
76%
97%
2011
/12
80.4
0%10
RD3
Pool
e92
%91
%0.
0%N
/A64
%97
%85
.60%
9RD
ECo
lche
ster
83%
100%
0.1%
0%73
%78
%20
11/1
287
.50%
11,1
4RE
FTr
uro
92%
71%
0.0%
0%60
%87
%20
11/1
281
.30%
9RE
NCl
atte
rbrid
ge83
%99
%24
.1%
8.7%
90%
91%
2011
/12
86.2
0%10
,11,
11,1
2RF
4Q
ueen
s, R
omfo
rd92
%80
%4.
3%3.
3%83
%94
%20
11/1
285
.40%
6RG
NPe
terb
orou
gh80
%82
%43
.6%
42.7
%20
11/1
283
.10%
1RG
QIp
swic
h92
%99
%23
.0%
24.6
%62
%94
%20
11/1
283
.10%
7RG
TCa
mbr
idge
92%
89%
25.5
%25
.0%
62%
94%
2011
/12
80.1
0%10
RH8
Exet
er92
%98
%1.
0%0.
2%57
%94
%87
.60%
4RH
MSo
utha
mpt
on
92%
94%
0.0%
0%69
%84
%79
.30%
10RH
QSh
effie
ld92
%89
%3.
2%3.
2%90
%10
0%20
11/1
286
.70%
1010
RHU
Ports
mou
th
100%
90%
0.2%
0%83
%88
%20
11/1
275
.80%
3RH
WRe
adin
g92
%89
%1.
7%1.
9%97
%90
%20
11/1
281
.00%
9RJ
1Gu
y’s &
St T
hom
as’
100%
100%
0.0%
17.5
%59
% /
56%
93%
/ 90
%20
11/1
276
.60%
10,1
0,12
RJE
Nor
th S
taffo
rdsh
ire92
%97
%0.
0%21
.5%
55%
85%
2011
/12
86.3
0%Q
13
RK9
Plym
outh
92%
90%
1.8%
3.1%
50%
70%
2011
/12
90.2
0%15
RKB
Cove
ntry
100%
99%
0.0%
N/A
62%
52%
2011
/12
85.6
0%10
RL4
Wol
verh
ampt
on10
0%93
%6.
9%8.
3%63
%61
%20
11/1
275
.00%
7RM
1N
orw
ich
100%
98%
7.6%
4.7%
59%
70%
2011
/12
77.4
0%10
, 10,
10
RNJ
Barts
92%
97%
15.2
0%10
.9%
59%
94%
2011
/12
84.3
0%6
RNL
Carli
sle
92%
99%
0.2%
0.3%
80%
81%
2011
/12
90.2
0%Q
48
RNS
Nor
tham
pton
100%
99%
9.7%
6.8%
62%
100%
2011
/12
74.7
0%7
RPY
Roya
l Mar
sden
50
%10
0%27
.3%
43.6
%89
% /
89%
97%
/ 97
%20
11/1
283
.10%
10,2
0RR
8Le
eds
92%
90%
13.3
%7.
4%59
%85
%20
11/1
284
.70%
7RR
KBi
rmin
gham
92%
90%
0.7%
3.1%
76%
88%
2011
/12
73.8
0%10
, 11
RRV
Univ
ersi
ty C
olle
ge
100%
99%
16.2
%13
.9%
97%
91%
2011
/12
74.1
0%7
RTD
New
cast
le10
0%81
%5.
9%7.
5%76
%85
%20
11/1
283
.40%
10,1
2RT
ECh
elte
nham
100%
100%
9.1%
5.6%
53%
79%
80.1
0%11
,12
RTG
Derb
y 10
0%90
%0.
0%0%
48%
76%
2011
/12
80.9
0%8
RTH
Oxf
ord
92%
91%
1.2%
N/A
66%
79%
2011
/12
83.7
0%5
RTR
Mid
dles
boro
ugh
100%
100%
0.4%
5.6%
67%
88%
2010
/11
90.7
0%8
RWA
Hull
92%
97%
6.8%
8.0%
82%
88%
2011
/12
86.2
0%4
RWD
Linc
oln
100%
98%
13.1
%0%
52%
85%
86.8
0%Q
110
,11,
11
RWE
Leic
este
r 10
0%83
%5.
4%5.
4%62
%82
%84
.20%
6RW
FKe
nt10
0%87
%3.
5%4.
1%36
%80
%81
.30%
10RW
HM
ount
Ver
non
100%
87%
2.8%
5.6%
59%
74%
2011
/12
86.3
0%9
RX1
Not
tingh
am
100%
100%
7.3%
4.9%
59%
85%
2011
/12
80.9
0%8,
11
RXH
Brig
hton
100%
100%
0.8%
0.6%
73%
81%
2011
/12
79.7
0%Q
410
,10
RXN
Pres
ton
92%
98%
2.6%
0.8%
73%
97%
83.5
0%10
,11,
12RX
WSh
rew
sbur
y92
%99
%5.
9%5.
3%43
%73
%20
11/1
284
.70%
10RY
JIm
peria
l83
%89
%2.
6%13
.3%
65%
/ 65
%91
% /
91%
2011
/12
79.7
0%10
,11
N/A
= d
id n
ot re
spon
d to
surv
eyRe
d <
90%
Red
< 90
%Re
d 0%
Red
0%Re
d <
60%
Red
< 80
%Re
d <
80%
Red
≥ 2
Q <
94%
Red
≥ 10
% v
aria
nce
Red
= no
t reg
iste
red
Red
= <
4 tie
rsRe
d ≥
10 y
rs
Ambe
r 90
< 95
%Am
ber 9
0 <
95%
Ambe
r <15
%Am
ber <
15%
Ambe
r 60
< 68
%Am
ber 8
0 <
85%
Ambe
r 80
< 83
%Am
ber =
1Q
< 9
4%
Ambe
r = 5
<10%
Am
ber 8
< 1
0 yr
sGr
een
≥ 9
5%Gr
een
≥ 9
5%Ye
llow
15
< 24
%Ye
llow
15
< 24
%Gr
een
≥ 6
8%Gr
een
≥ 8
5%Gr
een
≥ 83
%Gr
een
= 0
Q <
94%
Gree
n =
< 5%
Gree
n =
regi
ster
ed.
Gree
n =
all f
our t
iers
.Gr
een
< 8y
rsdata to follow in next report
Qua
lity
Data
Qua
lity
Serv
ice
Prov
isio
nAc
cess

Radiotherapy in England 2012
58
© Crown copyright 2012 First published 6 November 2012 Published to Delphi, in electronic format only.