radiological issues for fukushima's revitalized future
TRANSCRIPT

Kyoto University Research Reactor Institute
Radiological Issues for Fukushima's
Revitalized Future
Institute of Environmental Radioactivity at Fukushima University
International Symposium on
Kyoto University Research Reactor Institute
KUR Research Program for Scientific Basis of Nuclear Safety
Proceedings

Proceeding of the International Symposium on Radiological Issues for Fukushima's Revitalized Future
Paruse Iizaka, Fukushima City, Japan, May 30–31(Sat.–Sun.), 2015
Edited by Tomoyuki Takahashi
Hajimu Yamana
Hirofumi Tsukada
Nobuhiro Sato
Maki Nakatani
KUR Research Program for Scientific Basis of Nuclear Safety
ⅰ
ISBN-978-4-9906815-3-1 (Book) C3053 ISBN-978-4-9906815-4-8 (CD) C3853 ISBN-978-4-9906815-5-5 (from Web) C3853 ¥ 0E © KUR Research Program for Scientific Basis of Nuclear Safety
Office of KUR Research Program for Scientific Basis of Nuclear Safety
Kyoto University Research Reactor Institute 2 Asashiro-nishi Kumatori-cho Sennan-gun Osaka 590-0494, JAPAN
E-mail: [email protected] Tel : +81-72-451-2432 Fax: +81-72-451-2639
ⅱ
Proceedings of the International Symposium on Radiological Issues for Fukushima's Revitalized Future
Paruse Iizaka, Fukushima City, Japan, May 30-31 (Sat.-Sun.), 2015
Host Organization Kyoto University Research Reactor Institute
Support Organizations Institute of Environmental Radioactivity at Fukushima University
Fukushima Prefectural Government Fukushima Prefectural Board of Education Fukushima City Government
Atomic Energy Society of Japan The Japan Society of Nuclear and Radiochemical Sciences The Japan Radiation Research Society The Japan Health Physics Society
Cooperative Organizations Iizaka Onsen Tourist Association Iizaka Onsen Ryokan Cooperative Association Fukushima City Kanko-Bussan (Tourism and Local Products) Association THE FUKUSHIMA MINYU SHIMBUN Fukushima-Minpo Co. Ltd.
ⅲ

Organizing Committee
Chairperson Vice Chairperson Vice Chairperson
Yuji Kawabata Takayuki Takahashi Sentaro Takahashi Jiro Inaba Shigeo Uchida Itsumasa Urabe Kimiaki Saito Kazuo Sakai Ken Nakajima Noriyuki Momoshima Hiromi Yamazawa Hajimu Yamana Minoru Yoneda Program Committee
Chairperson Vice Chairperson
Tomoyuki Takahashi Hirofumi Tsukada Takeshi Iimoto Masahiro OsakoNobuyuki Sugiura Takatoshi Hattori Nobuhiko Ban Satoshi Fukutani Hirokuni Yamanishi Hiroshi Yashima Sumi Yokoyama Satoshi Yoshida Conference Secretariat
Chairperson Vice Chairperson
Nobuhiro Sato Maki NakataniTakumi KubotaYuji Shibahara Hidehito Nakamura
ⅳ

Preface
The nuclear accident at the TEPCO’s Fukushima Daiichi Nuclear Power Plants in March 2011, which followed an earthquake and a tsunami, brought serious impacts on society. This accident inevitably emphasized the necessity of establishing new and comprehensive scientific research for promoting nuclear safety. Facing this situation, the Kyoto University Research Reactor Institute (KURRI) developed a new research program called the “KUR Research Program for Scientific Basis of Nuclear Safety” from 2012. In this program, it is planned to hold an annual series of international symposia along with identified research activities for promoting nuclear safety.
The title of the symposium of the first year was “Environmental monitoring and dose estimation of residents after the accident of TEPCO's Fukushima Daiichi Nuclear Power Stations”. We tried to collect a wide range of those data to obtain an accurate estimation of the radiation dose.
The purpose of the second year of the symposium was “Nuclear Back-end Issues and the Role of Nuclear Transmutation Technology”. As you are aware, the issues of the nuclear back-end is not limited to the technical or technological issues. But we are faced with the social difficulty of disposal after the accidents and the issues of the back-end is quite important. In this symposium, we had a lot of participants from abroad. We discussed about the current situation and the future prospective.
The third symposium with the little “Earth quake, Tsunami and Nuclear Risks After the accident of TEPCO‘s Fukushima Daiichi Nuclear Power Stations”. Today in Japan, the safety assessment of nuclear power plants ongoing regarding the earthquake and tsunami and massive natural disasters.
Finally, the fourth symposium titled “Radiological Issues for Fukushima’s Revitalized Future” was held with approximately 14 invited lectures and 80 scientific papers. Residents and Specialists gathered and talked with many issues to revitalize the future of Fukushima though presentations, science café, and panel discussions, with 668 participants in total. Almost all the presentations have been written as original scientific papers, peer reviewed by specialists of the relevant research fields, and included in the proceedings booklet. On behalf of all the participants of the symposium, I sincerely hope that this symposium and its proceedings will contribute to the faster recovery of people who have encountered damages from the accident and will promote further progress in the research on nuclear safety and the recovery of Fukushima.
Yuji Kawabata Director, Kyoto University Research Reactor Institute
Chair of the organizing committee
ⅴ

Contents
Part 1 Decontamination/radioactive waste Identify the place and the execution of the decontamination. Whole process from classification ~ transportation till disposal.
1 Cesium decontamination using a microbubble-treated aqueous solution of sodium metasilicate Yoshikatsu UEDA, Yomei TOKUDA, Hiroshi GOTO 1
2 Decontamination system of radiocesium contaminated water Kahori YOKOTA, Shio ARAI, Hideki OGAWA, Ritsuko NAKAMURA, Hirohisa YOSHIDA 6
3 Application of mass spectrometry for analysis of cesium and strontium in environmental samples obtained in Fukushima prefecture Yuji SHIBAHARA, Takumi KUBOTA, Satoshi FUKUTANI, Toshiyuki FUJII, Koichi TAKAMIYA, Tomoko OHTA, Tomoyuki SHIBATA, Masako YOSHIKAWA, Mitsuyuki KONNO, Satoshi MIZUNO, Hajimu YAMANA 11
4 Safe decontamination system for combustion of forestry wastes Hirohisa YOSHIDA, Hideki OGAWA, Kahori YOKOTA, Shigemitsu IGAI, Shio ARAI, Ritsuko NAKAMURA 14
Part 2 Environmental radiation/external exposure Prospects for the future, reduction, measurement estimation of the external exposure, and so on.
1 Integrating nuclide specific and dose rate based methods for airborne and ground based gamma spectrometry. David SANDERSON, Yukihisa SANADA, Alan CRESSWELL, Sheng XU, Simon MURPHY, Chika NAKANISHI., Tsutomu YAMADA 18
2 Bacterial microflora characteristics of plant samples from contaminated by radionuclides Chernobyl area Pavlina ZELENA, Julia SHEVCHENKO, Valentina BEREZHNA, Julia SHYLINA, Mykola GUSCHA, Olha MOLOZHAVA 24
3 Fields of View for Environmental Radioactivity Alex MALINS, Masahiko OKUMURA, Masahiko MACHIDA, Hiroshi TAKEMIYA, Kimiaki SAITO 28
4 Study on applicability of CdZnTe semiconductor detector to in situ environmental radioactivity measurement in high dose rate areas Munehiko KOWATARI, Takumi KUBOTA, Yuji SHIBAHARA, Toshiyuki FUJII, Koichi TAKAMIYA, Satoru MIZUNO, Hajimu YAMANA 35
5 Prediction of ambient dose equivalent rates for the next 30 years after the accident Sakae KINASE, Tomoyuki TAKAHASHI, Satoshi SATO, Hideaki YAMAMOTO, Kimiaki SAITO 40
ⅵ
Part 3 Environmental radioactivity/internal exposure Farm/marine products, food, food ingestion, resorption control, and so on.
1 Effect of nitrogen and potassium fertilization on radiocesium absorption in soybean Naoto NIHEI, Atsushi HIROSE, Keitaro TANOI, Tomoko M. NAKANISHI 44
2 Biological effect of soil sterilization on the Cesium-137-transfer to plants Tadatoshi KINOUCHI, Yuki HATTORI, Keiko FUJIWARA, Tomoyuki TAKAHASHI, Satoshi FUKUTANI, Sentaro TAKAHASHI 48
3 Radioactivity levels of vegetables, rice, fruits and drinking water in Minami-Souma City Kiyoshi SHIZUMA, Yushi SAKURAI 51
4 The amount of 137Cs deposition and transfer ratio of 137Cs to wild edible-wild-plants after the accident at TEPCO's Fukushima Daiichi Nuclear Power Station Yoshiyuki KIYONO, Akio AKAMA 57
5 Examination of Iodine-131 Concentrations in Food and Drink in the Early Phase after the Accident Masaki KAWAI, Nobuaki YOSHIZAWA, Sachiko HIRAKAWA, Kana MURAKAMI, Mari TAKIZAWA, Osamu SATO, Shunji TAKAGI, Hirokazu MIYATAKE, Tomoyuki TAKAHASHI, Gen SUZUKI 62
6 The distributions of radiocesium in seawaters and sediments collected off the Niida River estuary, Fukushima Prefecture Miho FUKUDA, Shinnosuke YAMAZAKI, Tatsuo AONO, Satoshi YOSHIDA, Takashi ISHIMARU, Jota KANDA 66
7 Review of the gastrointestinal absorption rates of cesium in human and animals from food products and soil particles Kayoko IWATA, Hiroshi YASHIMA, Yuko KINASHI, Tomoyuki TAKAHASHI, Sentaro TAKAHASHI 70
8 Transfer of radioactive cesium to earthworms after the Fukushima Daiichi nuclear power plant accident Sota TANAKA, Tomoyuki TAKAHASHI, Keiko FUJIWARA, Sentaro TAKAHASHI 74
Part 4 Others
1 Case Study of Radiation Education in Compulsory Education for Fukushima's Revitalized Future Hiroko MIYUKI 78
2 Derivation of apparent diffusion coefficient (Da) and distribution coefficient (KD) from evolution of depth distribution of radiocaesium in soil contaminated by the Fukushima NPP accident Haruo SATO 85
ⅶ

Part 1
Decontamination/radioactive waste

Cesium decontamination using a microbubble-treated aqueous solution of sodium metasilicate
Yoshikatsu Ueda*1), Yomei Tokuda2), Hiroshi Goto3)
1) Research Institute for Sustainable Humanosphere, Kyoto University, Gkasho, Uji, Kyoto, Japan, 611-00112) Institute for Chemical Research, Kyoto University, Gkasho, Uji, Kyoto, Japan, 611-00113) Kureha Trading Co. Ltd., 1-2-10, Horidome-sho, Nihonbashi, Chuo-ku, Tokyo, 103-0012
The remediation of materials contaminated with radioactive materials, such as 137Cs, is important. Here, we report the effectiveness of an aqueous Sodium Metasilicate prepared via a microbubble Crushing process (SMC) for the removal of radioactive 137Cs from granule conglomerates and nonwoven cloth. A 137Cs removal ratio of 78% was achieved for the nonwoven cloth sample, and multiple washings at low SMC concentrations were effective. In addition, the volume of the waste solution could be reduced by neutralizing the SMC and using gelation to remove the radioactive material. The decontamination achieved using this process was more efficient than that with sodium hydroxide, even for granule conglomerates.
Keywords: Microbubble, Sodium metasilicate, 137Cs
1. Introduction
The accident at the Fukushima Dai-ichi nuclear power plant in 2011 following the Great East Japan Earthquake resulted in the dispersal of radioactive Cs into the environment and the contamination of an extensive area of soil. Various decontamination methods have been developed and applied in Fukushima Prefecture1-5), but the optimal methods for the remediation of materials under specific contamination conditions still need to be developed. Radioactive Cs adsorbs on soil particles through ion exchange with potassium6,7). Our research focused on using aqueous sodium metasilicate as a novel detergent and possible decontamination agent. We examined the mechanism and principle underlying the change in the chemical reaction characteristics of aqueous sodium metasilicate after microbubble and ultrasonic treatments. Secause aqueous sodium metasilicate is not a surfactant, it has a low environmental load and does not exhibit foaming characteristics. It can be used with hard, soft, and sea waters, and its cleaning activity make it a “peeling detergent”, which differentiates it from
dissolving detergents, such as organic solvents. As a peeling detergent, aqueous sodium metasilicate is suitable for foaming, jet streaming, high pressure–ultrasonic wave, and spray cleaning. A microbubble crushing process8,9) can also be used to suppress precipitation during long-term storage10) (see Figure 1).
Coprecipitation can be used to decrease the volume
Figure 1 Photographs of aqueous sodium metasilicate irradiated by a green laser (Wavelength:532nm) after storage for one-half year. The metasilicate was dissolved in water (a) without crushing, and (b) with crushing. The black object in the lower right corner is the green laser. 1)
1

of the waste solution produced because sodium metasilicate forms a gel that traps Cs when neutralized with acid11). Coprecipitation followed by gel formation can be used to separate the 137Cs gel from the soil, yielding a decontaminated waste product.
2. Experimental
(a) Cleaning method Depending on the individual diameters and
buoyancies, microbubbles may only remain in water for several minutes. However, they can persist in an aqueous environment for longer times if an ultrasonic treatment is used to reduce their size 12). The ultrasonic pretreatment of aqueous sodium metasilicate to form SMC (Sodium Metasilicate prepared via a microbubble Crushing process) and to reduce the bubble size does not decrease the eduction rate of aqueous sodium metasilicate and offers the possibility of sustained cleansing. In this experiment, we conducted a cleaning test in a standing solution so that we could focus on the chemical cleansing effects resulting from the synergy between aqueous sodium metasilicate and microbubbles rather than on the physical cleansing effects 1,2).
Granule conglomerates and nonwoven cloths were the materials to be cleaned. The ~150-g granule conglomerate samples were collected from soil in a hot spot (∼500,000 Bq/kg) at the Fukushima Agricultural Technology Centre. These pieces of nonwoven polypropylene cloth were used in agricultural work at farms exposed to the fallout from the nuclear accident in Fukushima Prefecture. The cloths had an average weight of 2.65 g, and the average amount of 137Cs they contained exhibited approximately 1633 Bq/sample (616,226 Bq/kg) of radioactivity.
The granule conglomerate and nonwoven cloth samples were immersed in 100 mL of solutions containing a range of SMC concentrations for 20 h. Twelve granule conglomerate samples were prepared. These samples were divided into four groups of three samples each. One group was washed in sodium hydroxide, one was washed in normal sodium metasilicate, and the remaining two were washed in SMC solutions (10 and 100 wt%). The 28 cloth samples were divided into four groups of seven samples each. One group was washed in water, while the other three groups were washed in SMC solutions (1, 10, and 100
wt%). To determine the effects of multiple washings, samples were tested after 6 h of immersion before the second and third washes. After these immersion tests, the samples were dried at 40 °C for 40 h until they were free of moisture 3).
To reduce the volume of waste solution, hydrochloric acid (HCl) was added to neutralize the detergent solutions after washing, which resulted in gelation. The gel and clear supernatant were then separated by filtration, and the radiation intensity (counts per second, cps) of the gel and supernatant was measured. We attempted to remove 137Cs from the SMC solutions by neutralization. We prepared three samples of 10- and 100-wt% SMC solutions and then neutralized and filtered them. Subsequently, we measured the radiation intensity and compared the results of the two remediation methods.
(b) Radiation measurement The background radiation intensity of the nonwoven
cloth specimens was measured using the germanium semiconductor detector at the Radioisotope Research Center at Kyoto University. The main unit of the detector is made of high purity germanium (GMX-18200-S; EG&G Ortec), with a 102-cm3 germanium crystal and a relative efficiency of 22.3% (efficiency ratio of a 3" × 3" NaI (TI) (76 × 76 mm) crystal relative to that of the 137Cs 662 keV gamma ray). The entrance window is a 0.5-mm-thick beryllium plate, which allows the detection of X-rays with energies of at least 3 keV, as well as high energy gamma rays. The energy resolution was 0.54 keV for 55Fe 5.9-keV (Mn Kα) X-rays and 1.8 keV for 60Co 1.33 MeV gamma rays. A special container (100 mL) was used to analyze the nonwoven cloth specimens. The removal ratio was defined as the ratio of the radiation intensities from the sample before and after immersion, as shown in the following equation.
Removal ratio [%] =𝐴𝐴𝐴𝐴𝐴𝐴𝐴𝐴𝐴𝐴 𝑖𝑖𝑖𝑖𝑖𝑖𝐴𝐴𝐴𝐴𝑖𝑖𝑖𝑖𝑖𝑖𝑖𝑖 [𝑐𝑐𝑐𝑐𝑖𝑖]𝐵𝐵𝐴𝐴𝐴𝐴𝑖𝑖𝐴𝐴 𝑖𝑖𝑖𝑖𝑖𝑖𝐴𝐴𝐴𝐴𝑖𝑖𝑖𝑖𝑖𝑖𝑖𝑖 [𝑐𝑐𝑐𝑐𝑖𝑖]
× 100
3. Results
(a) Washing the granule conglomerate The removal ratios of 137Cs from the granule
conglomerate using SMC (10 and 100 wt%), sodium hydroxide, and aqueous sodium hydroxide (Figure 2) show that, while the decontamination efficiency of
2

SMC was low, it was still more than 10 times higher than that obtained using sodium hydroxide at the same pH. Furthermore, the higher efficiency of SMC compared with sodium metasilicate without the microbubble treatment confirms the effectiveness of SMC. One characteristic of SMC is that the concentration of dissolved oxygen does not increase after aeration. Hence, a large number of adsorption pits (sites) are likely present, similar to zeolites. Thus, the Cs ions present in water will be incorporated into the silicate. The dissolution of the granule conglomerate by the alkaline solutions also contributed to increasing the decontamination efficiency.
(b) Washing the nonwoven cloth The cleaning performance of SMC at various
concentrations is presented in Table I, which lists the average removal ratios for multiple washings with SMC concentrations of 1, 10, and 100 wt% compared with pure water 2).
As expected, almost no 137Cs was removed by washing with pure water, but significant decontamination occurred as soon as SMC was introduced. Because the nonwoven cloth samples were previously used in agricultural fields, they also contained traces of fertilizers and other organic materials. As mentioned previously, sodium metasilicate detergent is used for washing because it can
break down organic materials via saponification due to its alkaline nature. We anticipate that we will be able to increase the efficiency of this detergent using microbubbles and ultrasonic treatments. Organic components, such as sebum and oil, which are contaminated with 137Cs are likely to be eluted from the nonwoven cloth because of the alkalinity of SMC. The data in Table I also show that even when 1-wt% SMC is used, the removal ratio is 60% of that obtained with 100-wt% SMC after the first washing. This result demonstrates that a low concentration of detergent can be used for remediation.
In the case of multiple washings, the background radiation intensity decreased considerably after the third washing when a highly concentrated (10- or 100-wt%) SMC solution was used. Therefore, a 1-wt% SMC solution was used for further analyses. The removal ratios after each wash with the 1-wt% solution, which are listed in Table I, were 64% for the second wash and 71% for the third wash, indicating that even at a concentration of 1 wt%, significant decontamination of nonwoven cloth materials can be achieved after multiple washings. Although only a slight decrease in the removal ratios occurred compared with higher wt% SMC solutions, we believe that using 1-wt% SMC is an effective washing method, even for higher levels of contaminants because the need for further decontamination of materials in the Fukushima Prefecture still exists.
(c) Remediation of 137Cs by neutralizing SMC Methods to reduce the waste solution volume
obtained after using SMC were also investigated. We prepared three samples each of 10- and 100-wt% SMC waste solutions. The solutions were neutralized with HCl, and the gels were separated from the filtered solution. By measuring the radiation intensity and then normalizing the readings, we were able to compare the gels and filtered solutions (Figure 3). 137Cs was captured in the gel after coprecipitation 1,2). Hence, each tested concentration of SMC can effectively capture Cs.
Table 1 137Cs removal ratios of using purified water and SMC for the nonwoven cloth samples
Washing Pure water 1-wt% SMC 10-wt% SMC 100-wt% SMC First 0 44.5 59.5 77.5
Second 34.5 27.5 51.4
Third 20.6 -
*Pure water was used for the first washing, whereas 10- and 100-wt% SMCs were used for the second washing.
Figure 2 Average removal ratios of 137Cs from the granule conglomerate samples using 10- and 100-wt% SMC, NaOH, and sodium metasilicate.1)
Rem
oval
ratio
[%]
3

However, the 100-wt% SMC solution exhibited a behavior opposite that of the other solutions. This is because sodium metasilicate can leave its captured ions in water. Substantial additional experimentation is needed to determine the optimum conditions for capturing Cs in SMC gels. We are currently experimenting with using alcohol to neutralize the SMC and remove 137Cs from waste solutions.
4. ConclusionsWe have examined the cleaning performance of
SMC by comparing the radioactivity of waste solutions before and after washing contaminated granule conglomerates and nonwoven cloth samples. A study of the changes in the chemical characteristics of SMC was also undertaken. 137Cs particulates attached to a nonwoven cloth sample were removed effectively by SMC cleaning. After cleaning, the remaining dissolved aqueous sodium metasilicate from the SMC had a better treatment capacity (after neutralization) than standard aqueous solutions. Thus, the use of SMC should contribute significantly to the decontamination work currently being undertaken in urban and rural areas where decontamination cannot be performed by using water alone. We are currently attempting to measure the chemical structure of SMC using SPring-8. We will report the results of this new study in the near future.
Acknowledgments This work was financially supported by Kyoto
University, The Japan Association of National Universities, Japan Association for Chemical Innovation (JACI), ITOCHU Foundation, and the Collaborative Research Program of Institute for Chemical Research, Kyoto University (No. 2013- 63). We thank N. Nihei, S. Fujimura, T. Kobayashi, Y. Ono, M. Tosaki, and T. Minami for helpful discussions and experimental preparation. We appreciate the SMC samples (JPAL) provided by Kureha Trading Co. Ltd. The synchrotron radiation experiments were performed at the BL14B2 beamline of the SPring-8 facility with the approval of the Japan Synchrotron Radiation Research Institute (JASRI) (Proposal No. 2015A1662).
References 1) Y. Ueda, Y. Tokuda, H. Goro, Radiological
Issues for Fukushima’s Revitalized Future, Fukushima, Springer, in print.
2) Y. Ueda, Y. Tokuda, H. Goto, T. Kobayashi, andY. Ono, ECS Trans., 58(19), 35 (2014).
3) Y. Ueda, Y. Tokuda, H. Goto, T. Kobayashi, andY. Ono, J. Soc. Remed. Radioact. Contam. Environ., 1, 191 ( 2013).
0
10
20
30
40
50
60
70
80
90
100
10wt% SMC 10wt% SMC 10wt% SMC 100wt% SMC 100wt% SMC 100wt% SMC
filtration filtrated water
Figure 3 Remediation of 137Cs by neutralizing SMC (10 wt% and 100 wt%).1)
Rem
oval
ratio
[%]
4

4) Y. Ueda, Y. Tokuda, S. Fujimura, N. Nihei,and T. Oka, ECS Trans., 50(22), 1, (2013).
5) Y. Ueda, Y. Tokuda, S. Fujimura, N. Nihei,and T. Oka, Water Sci. Technol., 67, 996(2013).
6) I. Raskin and B. D. Ensley, Editors,Phytoremediation of Toxic Metals: UsingPlants to Clean Up the Environment, JohnWiley & Sons, New York (2000).
7) N. Willey, Editor, Phytoremediation: Methodsand Reviews, Humana Press, Totowa (2007).
8) A. Agarwal, W. J. Ng, and Y. Liu,Chemosphere, 84, 1175 (2011).
9) E. Stride, Philos. Trans. R. Soc. A, 366, 2103(2008).
10) J. Suwabe, Japanese Patent (Kokai), 2010-1451 (2010).
11) R. C. Merrill and R. W. Spencer, J. Phys.Colloid Chem., 54, 806 (1950).
12) M. Takahashi, T. Kawamura, Y. Yamamoto, H.Ohnari, S. Himuro, and H. Shakutsui, J. Phys.Chem. B, 107, 2171 (2003).
5

Decontamination system of radiocesium contaminated water.
Kahori YOKOTA1), Shio ARAI1), Hideki OGAWA1, 2), Ritsuko NAKAMURA1) *, Hirohisa YOSHIDA1)
1) Graduate School of Environmental Science, Tokyo Metropolitan University, 1-1, Minami-Osawa, Hachiouji, Tokyo192-0397 JAPAN
2) Fukushima Forestry Reactor Center, 1, Nishisimasaka, Asaka-machi, Koriyama, Fukushima 963-0112 JAPAN* [email protected]
The high performance filter absorbed radiocesium (134Cs and 137Cs) selectively and efficiently form low contaminated water was developed. Two types of filter with the hydrophobic and the hydrophilic surface wool fibers were used as the support substrate for Prussian Blue (PB). Two PB supported wool fibers (hydrophobic, PB-O and hydrophilic, PB-T) were used for the absorption filter for 134Cs and 137Cs. Three types of contaminated water (the combustion gas washed water: 600 L, 2 Bq/L, pH6, the woody sludge contained water: 700 L, 1.3 Bq/L, pH7 and the combustion ash extracted water: 1 L, 120 Bq/L, pH10) were used for the absorption experiments by PB-O and PB-T filters. The efficient absorption of 134Cs and 137Cs in the contaminated water was proceeded to decrease below 0.2 Bq/L by the filtration with 2 hrs and 2 min for large and small volume water, respectively. The decreased 134Cs and 137Cs in the contaminated water were absorbed in PB-O and PB-T filters. PB supported wool filters acted as the high performance filter for 134Cs and 137Cs in various conditioned water with different pH and dispersed materials.
Key Words: Water soluble radiocesium, Wool fiber filter dyed with Prussian Blue, Decontamination of water,
1. Introduction
Four years has passed after the Fukushima Daiichi Nuclear Power Plant (FDNP) accident, radioactive cesium, radiocesium (134Cs and 137Cs), major components of released radionuclear, are still observed widely in East Japan, including Tokyo [1]. The most of 134Cs and 137Cs absorbed in clay materials on the ground and barks of trees in the forest [2]. The transportation of 134Cs and 137Cs from soils to plants though plant root, bark and leaves was caused by ionic form of 134Cs and 137Cs. The leak of contaminated water induced by mainly rainfall occurred frequently in FDNP. The half of 134Cs and 137Cs in the contaminated water in FDNP was water soluble form [3], which influenced easily the biological system including fishes and plants. The decontamination proceeded in Fukushima was mainly the removal of soil and plants, these radioactive waste packed in rubber coated
polypropylene containers collected in each towns and villages. The reduction of volume of radioactive waste by the combustion is planned. Thermal and biological degradation of organic wastes induce the water soluble form of 134Cs and 137Cs. The absorption system for ionic 134Cs and 137Cs is required to proceed the recovery of decontaminated environment.
Prussian Blue (PB) has high ability of cesium absorber. Various types of 134Cs and 137Cs absorber based on PB supported on substrate have developed after FDNP accident, however the acceptable absorber was few [4-6]. We have developed PB dyed wool fibers, the synthesis of PB was carried out in the high energy surface layer on wool fibers [8, 9]. The obtained PB crystal with 10 – 20 nm crystallite size dispersed on wool fiber surface. In this study, the 134Cs and 137Cs absorption ability of two types of PB dyed wool fibers were investigated by the demonstration tests for the contaminated swage water.
6

2. Experimental
(1) Samples The synthesis of Prussian Blue (PB) was carried out
two step reactions in the high energy surface layer (about 100 nm thickness) of wool fibers. Two types of wool fibers with hydrophilic and hydrophobic surface were immersed in the aqueous solution of ferrocyanide (Na4[Fe(CN)6]・10H2O) under the acidic condition (pH 3.5) for 5 hrs at 30 oC [10]. After wiped off the excess ferrocyanide solution on fiber surface, the ferrocyanide doped wool fibers immersed in aqueous solution of ferrous sulfate and ammonium sulfate and heated up to 70 oC.
The PB crystallite size obtained by this method, evaluated by the Scherrer's equation using a wide angle X-ray diffraction profile, was 10 – 20 nm corresponding to the surface hydrophilicity. PB dyed fibers were washed by fresh water repeatedly, then dried at room temperature. Two types of PB supported wool fibers, hydrophilic: PB-O and hydrophilic: PB-T, were obtained.
The color fastness tests were performed by the method according to JIS L 0844, JIS L 0849, the grade 4 and 5 for the washing fastness and the rubbing fastness, respectively. These dates indicated that PB supported wool fibers had the same color fastness of textiles on the market. The extraction test of cyanogen from PB supported wool fibers was performed by the method according to JIS K 0102, the extraction amount of cyanogen was 0.1~0.2 mg/L, which was lower than the regulation value of the Water Pollution Prevention Act (1 mg/L) and Fukushima Prefecture regulation low of the Water Pollution (0.5 mg/L). These results indicated that PB scarcely seceded from wool fibers.
(2) Water decontamination system The developed water decontamination system was
shown in Fig. 1 (outside) and Fig 2 (schematic drawing of absorption filter system). The system consisted of two water tanks made of stainless steel (volume: 1,100 L, diameter: 1 m, height: 1.5 m), two water pumps and the control system as shown in Fig. 1. In the stainless steel water tank, the stainless steel mesh cages (diameter: 300 mm, height: 500 mm) were set on the frame, the water bag filter made of polyamid (mesh size: 2 µm, size: 250 mmφ x 400 mm) contained PB-O and PB-T filters (800 – 900 g) was put in each stainless mesh cage as shown in Fig. 2.One water pomp and four stainless steel mesh cages were
attributed of each water tank. 5 g of PB-O or PB-T fibers putting in poly(ethyleneterephthalate) small mesh bag were setting on PB-T or PB-O filters as necessary to evaluate the time dependence of absorption behaviors.
One water tank (the front side in Fig.1) was used for the first step filtration to eliminate the suspended subjects (wood powders, suspended soils and oily emulsions etc.) in contaminated water by rough bag filters. The other water tank used to decontaminate 134Cs and 137Cs from the contaminated water after the first step filtration. The inner pressure and flow rate in each laying pipes and the water level in tanks were electrically monitored and the water flow systems were controlled.
The contaminated water in water tank was pumped up by water pomp (Koshin Co. Ltd., Ponster PSK-532190) and poured on PB supported wool filters homogeneously through shower head as shown in Fig.2. The decontamination of 134Cs and 137Cs in water was
Fig.1 Out view of water contamination system made of two water tanks (black tanks) and control system.
Fig.2 Schematic view of filtration system
To water pomp
Stainless water tank
Bag filter and mesh cage
Shower head
PB supported wool filters
7

performed by the circulated flow for the fixed period through PB supported filter.
(3) Demonstration tests The demonstration tests for decontamination of water
were performed using three types of decontaminated water, such as the sludge treated water (700 L, 1.3 Bq/L, pH7), the combustion gas washed water (600 L, 2 Bq/L, pH6) and the combustion ash extracted water (1 L, 120 Bq/L, pH10).
Radioactivity of samples were measured by the Germanium semiconductor detector (SEG-EMS: SEIKO EG&G Inc., Japan) with 100 ml of U8 container at 10,000 - 40,000 sec of accumulation time to obtain 1 - 2 Bq/kg of the lower limit for the solid samples and with 2 L of marinelli vessel at 10,000 sec to obtain 0.2 Bq/L of the lower limit for the liquid samples. The radiation decay was compensated at March 1, 2012.
3. Results
(1) Sludge treated water (pH7) About 50 % of bed-logs used for mushroom
cultivation in Japan was supplied from Fukushima prefecture before FDNP accident. The inoculated bed-logs putting in forest before the accident was contaminated heterogeneously on upper side surface of bed-logs, the harvested mushrooms contained higher amount of 134Cs and 137Cs than the regulation value (100 Bq/kg). The bark and fallen leaves of broad leaved deciduous trees in November 2011 contained high amount of 134Cs and 137Cs. Although the 134Cs and 137Cs concentration of fallen leaves in November 2012 decreased, the contamination of bark was in the higher level. The decontamination of bark is necessary to use broad leaved deciduous trees, such as Konara and Mizunara for the mushroom cultivation.
We participated the decontamination trials for road and rubbles [11, 12] by the wet blasting in 2012. The wet blasting is the method to polish metal surface by the high pressure water jet containing grinding preparations such as alumina oxide particles. August 2012, we applied the wet blasting to eliminate 134Cs and 137Cs form barks of broad leaved deciduous trees, and obtained successive results [13]. 80 % of 134Cs and 137Cs in bark was eliminated by polishing 2 mm thickness of bark surface. The sludge treated water containing alumina oxide particles was also decontaminated by PB-O filter system.
Alumina oxide and the suspended small woody powder was filtered by the first filtration, and the sludge treated water (700 L, 1.3 Bq/L, pH7) was decontaminated by the second filtration using 800 g of PB-O filter for 2 hrs. The decontamination result was shown in Fig.3. After 2 hrs filtration, 134Cs and 137Cs concentration decreased below 0.2 Bq/L, and the decreased 134Cs and 137Cs absorbed on PB-O filter.
(2) Combustion gas washed water (pH6) The decontamination tests of forest wastes (Pine
needles: 10,000 - 30,000 Bq/kg, Cedar bark: 10,000 – 15,000 Bq/kg collected in Forestry Research Center in April 2011) were carried out at Fukushima Forestry Research Center in February and March 2012. The combustion gas of forestry wastes contained carbonic acid, the gas washed water showed slight acidity. The combustion gas was washed by water jet, the contaminated water contained oily suspended carbon particles.
After dipping up the suspended carbon particles from the combustion gas washed water, the contaminated water (600 L, 2 Bq/L, pH6) was filtrated by 800 g of PB-O (R) filter for 2 hrs. The decontamination results were shown in Fig.4. After the filtration, the 134Cs and 137Cs concentration in water decreased below 0.2 Bq/L. The amount of 134Cs and 137Cs in PB-O filter was slightly smaller than the decontaminated amount of 134Cs and 137Cs. During this experiment, 5 g of PB-O and PB-T filters were put on 800 g of PB-O (R) filter to evaluate the absorption ability of each filter. The decontamination ability of PB-T filter was three times higher than PB-O filter, due to the larger contact surface area of hydrophilic PB-T filter.
Fig.3 Decontamination results of sludge treated water (700 L, 1.3 Bq/L, pH7) for 2 hrs filtration.
0100200300400500600700800900
1000
Before After PB filterRa
dioa
ctiv
ity /
Bq
N.D
Filtercontamination
Watercontamination
8

As mentioned above, the mass balance of 134Cs and 137Cs collided before and after the filtration. The oily suspended carbon adhered on the surface of PB-O (R) filter and bag filter. The suspended carbon dipped up from the contaminated water contained 313,650 Bq/kg-DW of 134Cs and 137Cs. The difference 134Cs and 137Cs amount before and after the filtration was caused by the oily suspended carbon adhered on bag filter.
(3) Combustion ash extracted water (pH10) The combustion ash from forestry wastes consisted of
solid solution with calcium oxide containing various elements such as boron, silica, copper, magnesium and phosphor. 10 g of combustion ash was suspended and stirred in water to extract 134Cs and 137Cs overnight. The combustion ash extracted water (1 L, 120 Bq/L, pH10) was decontaminated by 5 g of PB-O and PB-T filters for 2 mins filtration. The decontamination results were shown in Fig. 5.
As described in the decontamination of combustion gas washed water, hydrophilic PB-T showed better
decontamination ability than hydrophilic PB-O. Under the same filtration condition, the decontamination ratio of PB-O and PB-T were 30 % and 90 %, respectively. Not only the hydrophilicity of wool fiber surface but also the PB crystallite size and its distribution on fiber surfaces affected the decontamination ability of PB supported wool filters.
4. ConclusionsThree types of contaminated water (below 120 Bq/L)
with different hydrogen ion concentration (pH) and various suspended substances were decontaminated by two types of PB supported wool filters. The decontamination proceeded selectively and efficiently below 0.2 Bq/L by simple filtration. The decreased 134Cs and 137Cs was trapped on PB-O and PB-T filters. This radiocesium absorption filter will contribute to the decontaminate activity in Fukushima prefecture.
References 1) H. Yoshida, “Pollution analysis of soil and plants by
nuclear power plant accident”, chemicalengineering, 250 (2012)
2) H. Ogawa, etc., “The early stage pollution ofJapanese cedar(Cryptomeria japonica) byradioactive nuclear from the accident of TokyoElectric Power Company Fukushima Dai-ichinuclear power plant” report of research in FukushimaPrefecture
3) Website of the TEPCO, “Survey on K drainage andfuturemeasures”(http://www.tepco.co.jp/nu/fukushima-np/handouts/2015/images/handouts_150325_04-j.pdf, accessed 28 July. 2015)
4) K. Saito, “Applications of adsorptive fibers fortreatment of water contaminated with radioactivesubstances of Fukushima Daiichi Nuclear PowerPlant, prepared by radiation-induced graftpolymerization”, The Society of Fiber Science andTechnology Japan, June 10-12, 2D08
5) D. Parajulu, A. Kitajima, etc., “Prussian BlueNanoparticles for the Enrichment of RadioactiveCesium in Solutions”, WM2013 Conference,February 24-28, 2013, Phoenix, Arizona USA,13275
6) K. Minami, T. Kawamoto, etc., “Processingmethods and system of the radioactive substance”,unexamined patent application 2014-066647-
7) T. Shiono, K. Fukunishi, etc., “Radiocesiumadsorption resistant fabric”, unexamined patentapplication 2013-61220
8) Patent application 2014-00239) K. Yokota, etc., “Prussian blue dyed wool and its
Fig.4 Decontamination results of combustion gas washed water (600 L, 2 Bq/L, pH6) for 2 hrs filtration.
02000400060008000
1000012000
Radi
oact
ivity
/ Bq
11082
36137N.D
10173
Fig.4 Decontamination results of combustion ash extracted water (1 L, 118 - 124 Bq/L, pH10) for 2 mins filtration.
020406080
100120140
Before After PB filter Before After PB filter
Radi
oact
ivity
/ Bq
PB-TPB-O
Watercontamination
Watercontamination
Filtercontamination
9

decontamination ability for radiocesium”, International Symposium on Fiber Science and Technology 2014, September 28 to October 1, PG3-01
10) Office for Administrative Support for AffectedPeople by Nuclear Disaster, “2011 fiscal year,summary of result, Decontamination technologydemonstration test buisiness”,(http://josen.env.go.jp/material/link/pdf/20120501_02.pdf, accessed 28 July. 2015)
11) S. Matsubara, etc., “Demonstration of wet blastingdecontamination technology”, Decommissioningtechnical report Environmental recovery technologydevelopment Special issue, 12 (2013)
12) K. Suzuki, etc., “Decontamination of Shiitake logsby wet blast”, The 63th Annual Meeting of the JapanWood Research Society, Morioka, 27-29 March2013, p82,
10

Application of mass spectrometry for analysis of cesium and strontium in environmental samples obtained in
Fukushima prefecture
Yuji SHIBAHARA*1, Takumi KUBOTA1, Satoshi FUKUTANI1, Toshiyuki FUJII1, Koichi TAKAMIYA1, Tomoko OHTA2, Tomoyuki SHIBATA3, Masako YOSHIKAWA3,
Mitsuyuki KONNO4, Satoshi MIZUNO4, Hajimu YAMANA1
1 Kyoto University Research Reactor Institute 2 Hokkaido University
3 Kyoto University Institute for Geothermal Sciences 4 Nuclear Power Safety Division, Fukushima Prefectural Government
For the assessment of Fukushima Dai-ichi Nuclear Power Plant accident, the applicability of the thermal ionization mass spectrometry (TIMS) which is a type of mass spectrometry was studied. This study was focused on the analysis of the isotopic ratios of cesium and strontium, among the fission products, nuclear fuels and materials released on this accident. The amount of radionuclide per unit weight of the environmental samples would be infinitesimal, because of the wide distribution of radionuclide in environment released on the accident. For the study of the recovery/analysis method of cesium and strontium, at first, the radioactive cesium and strontium were generated by the irradiation of natural uranium at Kyoto University Research Reactor (KUR). After this study, the applicability of this method to the environmental samples obtained in Fukushima prefecture was verified.
Keywords: accident of Fukushima Dai-ichi Nuclear Power Plant, strontium cesium chromatography, mass spectrometry, isotopic ratio
1. Introduction
For the evaluation of the external and internalexposures and to analyze the source of radioactive nuclides released at the accident of Fukushima Dai-ichi Nuclear Power Plant (FDNPP), our group has analyzed Cs, Sr, U and Pu by the measurement of the isotopic ratio. In general, the γ-ray measurement have been used for the analysis of radioactive Cs of 134Cs (T1/2 = 2.06 y) and 137Cs (T1/2 = 30.2 y). In addition to 134Cs and 137Cs, 135Cs (T1/2 = 2.3×10⁶ y) is also generated during the operation of reactor. This suggests that the analysis of three isotopes of 134Cs, 135Cs and 137Cs would bring the useful information for the more detail analysis of radioactive Cs such as the source of Cs1). Because of the half-life of 135Cs, however, the analysis of 135Cs is difficult by the radiation measurement. Though the β-ray measurement have been generally used for the analysis of 90Sr (T1/2 = 28.9 y), this method also has the issues such as the demand of long time measurement and the low energy resolution.
The mass spectrometry provides the isotopic compositions of elements, and has been used for the analysis of radioactive nuclides and actinides having the long half-life and showing the α/β-emitter property. However, there is little report relevant to the analysis of the accident of FDNPP by the mass spectrometry.
The purpose of the present study is to study the applicability of the mass spectrometry for the analysis of the radionuclides released at the accident of FDNPP. For the study of the recovery/analysis methods of Cs and Sr, at first, the radioactive Cs and Sr were generated by the irradiation of natural uranium at KUR. After this study, the applicability of these methods to the environmental samples obtained in Fukushima Prefecture was verified.
2. Experimental
(1) Irradiation of natural U at KUR After irradiation for 3 hours at the Kyoto University
Research Reactor with the neutron flux 5.5×10¹² n/s cm2 (2 days later), 10 mg of natural U was dissolved in conc. HNO3 and evaporated to dryness. From the calculation with ORIGEN-II code 2), the amounts of the major radionuclide of Cs and Sr were estimated as 7.4×10⁻¹¹ g (137Cs) and 4.5×10⁻¹¹ g (90Sr), respectively. The residue was dissolved in 8M HNO3/0.3 % H2O2 for the separation of the TRU elements such as U and Pu by the extraction chromatography with UTEVATM-resin3). After the extraction of U and Pu, Sr was recovered by using SR-resin5). And then, Cs was recovered by using ammonium phosphomolybdate (AMP)1) respectively. The solutions containing the recovered Cs and Sr were evaporated and dissolved in 1 M HNO3 for the preparation of the sample solution for mass spectrometry (20 μL for
11

Cs, and 10 μL for Sr, respectively). Isotopic compositions of Cs and Sr were measured with a TIMS (Triton-T1, Thermo Fisher Scientific). A 1 μL aliquot of each solution was loaded onto a rhenium filament with a TaO activator. The mass spectra of radioactive Cs and Sr were obtained with a secondary electron multiplier detector (SEM) because of the small total amounts of radionuclide loaded onto the filament (ca. 3.7×10⁻¹² g for 137Cs, and ca. 4.5×10⁻¹² g for 90Sr, respectively). For Sr, the standard reference material, SRM987, was also used for the analysis of stable Sr.
(2) Analysis of Cs and Sr recovered from
environmental samples obtained in Fukushima prefecture
The plant samples (moss, bark, grass etc) were obtained from the four sampling points in Fukushima prefecture (Fig,1) at Nov. 2012 and May 2013.
About 2.5 g of samples which were washed with pure water and dried was incinerated with a ring furnace at 873 K, and dissolved in 20 mL of concentrated HNO3 at 403 K and evaporated to dryness. After the dissolving of the residue in 20 mL of 8 M HNO3, Cs and Sr were recovered by the same manner above mentioned. Before the analysis of Cs isotope composition, the activity of radioactive Cs was measured by γ-ray measurement. For the analysis of Sr, the determination of 88Sr by ICP-QMS and that of 90Sr by the Cherenkov counting5) was carried out. For the mass spectrometry of Cs and Sr, 5000 Bq/mL for 137Cs in 1 M HNO3 and 50 ppm of 88Sr in 1 M HNO3 were prepared. As above mentioned, the mass spectra of radioactive Cs and Sr were obtained with a SEM, while that of stable Cs and Sr were obtained with Faraday cup detector, since the amounts of stable nuclide were much larger than those of radionuclide.
3. Results and Discussion
(1) Analysis of Cs and Sr from irradiated U Mass spectra of Cs and Sr recovered from irradiated U
are shown in Fig. 2. The mass spectrum of Cs (Fig.2(a)) shows three peaks
of 135Cs, 136Cs(T1/2 = 13.2 d) and 137Cs: 134Cs was not observed since the generated amount in this irradiation condition was very low. According to the amount estimated with ORIGEN-II code as above mentioned and the loading amount onto the filament, ca. 3.7×10⁻¹² g of 137Cs would be used for the observation of this mass spectrum: the isotopic ratio of 135Cs/137Cs was obtained as 0.9103±0.0008 (±2σ).
The mass spectra of Sr (Fig.2(b)) shows three peaks of 89Sr (T1/2=50.5d), 90Sr and 91Sr (T1/2=9.5h) in the case of the measurement of 2.6 days later. The peak of each isotope was declined with the time, the intensity of 91Sr and 89Sr became lower than the detection limit at the measurement of 31 and 574 days later. Same as the analysis of Cs, ca. 4.5×10⁻¹² g of 90Sr was used for the observation of these mass spectra: 89Sr/90Sr = 0.7949±0.0003 (±2σ) was obtained at the measurement of 2.6 days later.
In both case of Cs and Sr, the loading amount of the major nuclide of several pico-gram brought the enough peak intensity. The minor nuclides of 136Cs and 91Sr in Fig.2(a) and (b) were estimated at 5.5×10⁻¹⁴ g and 4.0×10⁻¹⁴ g, meaning that several femto-gram would be detectable.
(2) Analysis of Cs and Sr from environmental sample
In the analysis of Cs recovered from environmental sample obtained in four sampling area as shown in Fig. 1, the peak of 134Cs, which was not observed in the analysis of Cs recovered from irradiated U (Fig.2(a)), was observed1, 6)(Table 1). The activity ratios calculated from the isotopic ratio of 134Cs/137Cs were ranged from 1.000 to
Fig. 2 Mass spectra of Cs and Sr6). (a)Cs, (b)Sr. Mass spectra of stable Sr were obtained from measurement of SRM987.
Inte
nsity
(arb
)
Atomic mass [u]84 85 86 87 88 89 90 91
Inte
nsity
(arb
)
Atomic mass [u]134 135 136 137 138
x100
x10x10
2.6 days later
30.6 days later
573.9 days later
x10
(a)
(b)
Fig. 1 Sampling area and air radiation dose rate. Air radiation rose rate was made using published data from MEXT 4).
0.25μSv/h2.5μSv/h
6.0μSv/h
12μSv/h
0.6μSv/h
1F
ITT
OKM
FTBFTB35
12

1.055(corrected on 11 Mar 2011). This means that the origin of 134Cs and 137Cs observed in this study is the accident of FDNPP, since this range shows the agreement with the estimation results of the generated amount in FDNPP with ORIGEN-II code7). The isotopic ratio of 135Cs/137Cs, on the other hand, was ranged from 0.359 to 0.367 (corrected on 11 Mar 2011). This range also shows the agreement with the estimation results with ORIGEN-II code, and is lower than that of global fallout (~0.5 for Chernobyl accident, and ~2.7 for nuclear weapon testing3), corrected to Mar. 11, 2011), meaning that the isotopic ratio of 135Cs/137Cs will also be useful for the analysis of Cs: especially, this isotopic ratio would be useful in the case that the amount of 134Cs is under detection limit (such as after the disappearance of 134Cs and/or very low activity of Cs).
Table 1 Results of isotopic analysis of Cs Sample ID 134Cs/137Cs** 135Cs/137Cs*** OKM01* 1.040(3) 0.3669(2) OKM02 1.037(3) 0.3655(3)
FTB* 1.020(7) 0.3663(5) FTBR35* 1.000(12) 0.3586(8)
ITT* 1.055(5) 0.3662(6) *: Data were reproduced from ref 1)
**: Activity ratio (corrected on 11 Mar 2011) ***: Atomic ratio (corrected on 11 Mar 2011)
In the analysis of Sr recovered from environmental sample, the variation of the isotopic ratio of 87Sr/86Sr was observed, while 90Sr was under detection limit6). If this variation of the isotopic ratio of 87Sr/86Sr was brought by the accident of FDNPP, several 10 MBq/g of 90Sr must be contained in these samples. Our Cherenkov counting, however, showed that the amount of 90Sr was less than 1Bq/g4), suggesting that this might be caused by the isotopic fractionations in the biological processes along with the contamination of sample by the soil6).
4. Conclusions
For the study of the applicability of the massspectrometry of Cs and Sr released at the accident of FDNPP, Cs and Sr were recovered from the natural U irradiated at KUR. The recovery/analysis method discussed in this study showed that the several 10-14 g of nuclide would be detectable.
By the same method, Cs and Sr were recovered from the plant samples obtained from Fukushima prefecture. Radioactive Sr was under the detection limit, while radioactive Cs from FDNPP was detected. Since 135Cs was also detected by TIMS, by using the activity ratio of 134Cs/137Cs and the isotopic ratio of 135Cs/137Cs, the source of radioactive Cs would be evaluated apart from that of global fallout after 134Cs became below the detection limit.
References
13
1) Shibahara Y., Kubota T., Fujii T., Fukutani S., Ohta T.,Takamiya K., Okumura R., Mizuno S., Yamana H. (2014) J. Nucl. Sci. Technol. 51: 575-579.
2) Shibahara Y., Kubota T., Fujii T., Fukutani S., Ohta T.,Takamiya K., Okumura R., Mizuno S., Yamana H. (2015) J. Radioanal. Nucl. Chem., 303: 1421-1424.
3) Ludwig S. B., Renier J. P. Standard- and Extended-Burnup PWR and BWR Reactor Models for the ORIGEN2 Computer Code: Oak Ridge National Laboratory; 1989, ORNL/TM-11018.
4) http://www.mext.go.jp/b_menu/shingi/chousa/gijyutu/017/shiryo/__icsFiles/afieldfile/2011/09/02/1310688_1.pdf (accessed on Dec. 16, 2013).
5) Kubota T., Shibahara Y., Fujii T., Fukutani S., Ohta T.,Takamiya K., Okumura R., Mizuno S., Yamana H. (2015) J. Radioanal. Nucl. Chem. 303: 39-46.
6) Shibahara Y., Kubota T., Fukutani S., Fujii T.,Takamiya K., Ohta T., Shibata T., Yoshiwaka M., Konno M., Mizuno S., Yamana H., Application of mass spectrometry for analysis of cesium and strontium in environmental samples obtained in Fukushima prefecture-Analysis of Cesium Isotope Compositions in Environmental Samples by Thermal Ionization Mass Spectrometry-2, Radiological Issues for Fukushima's Revitalized Future, Springer, in press.
7) Nishihara K., Iwamoto H., Suyama K. (2012) JAEA-Data/Code 2012-018 [in Japanese]

Safe decontamination system for combustion of forestry wastes
Hirohisa YOSHIDA1) *, Hideki OGAWA1), 2), Kahori YOKOTA1), Shigemitsu IGAI1), Shio ARAI1), Ritsuko NAKAMURA1)
1) Graduate School of Environmental Science, Tokyo Metropolitan University, 1-1, Minami-Osawa, Hachiouji, Tokyo192-0397 JAPAN
2) Fukushima Forestry Reactor Center, 1, Nishisimasaka, Asaka-machi, Koriyama, Fukushima 963-0112 JAPAN*[email protected]
Thermal decomposition behavior of forestry wasters, cedar bark, leaves, wood and pain leaves were observe by TG/DTA-FTIR method. The mass balance including radioactive cesium (radiocesium hereafter) during the combustion of forestry wastes was evaluated by the laboratory scale combustion test. About 30 – 35 % of radiocesium in cedar bark transferred in combustion gas at the combustion above 500 oC. By washing the combustion gas with water, 98 % of radiocesium vaporized during the combustion was retrieved. A pilot scale decontamination system for the combustion of forestry wastes was developed and was tested. The decontamination system consisted of three parts, a combustion gas washing system, a combustion ash enclosing system and a contaminated water filtration system. Using our system, 95 % of radiocesium was retrieved.
Key Words: Forestry wastes, Combustion, Smoke extraction, Radiocesium,
1. Introduction
Before the Fukushima Daiichi Nuclear Power Plant (FDNP) accident, the biomass power generation has been one of the most effective utilization of forestry wastes, such as thinned wood, bark, leaves and twinges. Two major economic activities in Fukushima prefecture, i.e., agriculture and forestry work, have been damaged seriously by the FDNP accident. Four years after the FDNP accident, agriculture in Fukushima has come back the level close to that before the accident, but the forestry work is still in a confused situation 1-4). Fukushima prefecture started the forest maintenance by the periodic thinning on 2013. The regular periodic thinning lumbered 10 % of standing trees in the forest. For 1000 ha of forest, about 150,000 m3 of standing tree is lumbered, and 30,000 m3 of leaves and twigs are left in the forest, and 15,000 m3 of barks are reeved at lumbermills. Before the FDNP accident, barks and leaves have been reused for agriculture as a compost. After the FDNP accident, such reuse of forestry wastes has become difficult. Nevertheless, 3.4 x 10⁹ m3 of barks has been produced as
forestry waste by the periodic thinning each year, necessitating a proper method for the volume reduction of the waste.
Most of lumbermill has a small incinerator to burn the forestry wastes such as bark and wood chips. However, these incinerators have not been used after the FDNP accident, since the emission constraint act prohibits small incinerators equipped with poor emission gas treatment facilities to burn the forestry waste contaminated with radiocesium.
We have designed a decontamination system for combustion of forestry waste using small incinerators 5). In this study, the outline of the combustion gas washing system, the combustion results in the laboratory and the pilot scale tests were discussed.
2. Experiments
(1) Samples Samples used in this study were radiocesium
contaminated Japanese cedar bark, cedar leaves, cedar sapwood, cedar heartwood and pine needles collected at
14

Fukushima Forestry Research Center in autumn 2011. After drying at 60 oC for three days, samples were subjected to combustion. The water content of samples evaluated by the 60 oC drying was 28.6, 56.8, 61.8, 54.3 and 10% for Cedar bark, Cedar leaves, Cedar sapwood, heartwood and pine needle, respectively, based on the wet mass. (2) Measurements
Radioactivity of solid samples in 100 ml of U8 container, and water suspended samples in 2 L of marinelli vessel were measured by a germanium semiconductor detector (SEG-EMS: SEIKO EG&G Inc., Japan) at 10,000 - 40,000 sec of accumulation time to obtain 1 - 2 Bq/kg of the detection limit for solid samples and at 10,000 sec to obtain 0.2 Bq/L of the detection limit for liquid samples. The radioactive decay was compensated at March 1, 2012.
Thermogravimetry measurements of forestry wastes (Japanese cedar sapwood chip, cedar bark, cedar leaves and pine needles) were carried out by TG/DTA 7200 (Hitachi High-Tech Science Co., Japan) under air and nitrogen gas flow. About 3 mg of samples were heated at 20 K/min from room temperature to 900 oC. The exhaust gas analysis was carried out by Fourier transform Infrared spectroscopy, FTIR (JASCO FTIR-650, MCT detector) connected with TG/DTA, IR spectrum of exhaust gas was collected each 4 oC.
Morphological observation and elemental analysis of combustion ash were carried out by a transition electron microscope (JEOL JEM-3200 FS) equipped with the energy dispersed elemental analyzer. (3) Combustion tests Laboratory scale combustion tests of radiocesium
contaminated Japanese cedar bark (10g, 20,000 Bq/kg) were carried out using the combustion instrument made of glass. The combustion gas were washed by 2 L of trapped water. Pilot scale tests of forest waste were carried out at Fukushima Forestry Research Center in March 2012. Two time demonstration tests using 2.3 kg of pine needles, 3.6 kg of Japanese cedar bark and 0.4 kg of cedar sapwood were carried out by the combustion system described later.
3. Results and Discussions
(1) Laboratory scale tests TG/DTA results of Cedar bark under air (perfect
combustion condition) and nitrogen gas (imperfect combustion condition) atmospheres are shown in Fig.1. The mass loss occurred in three temperature ranges, below 200 oC, 200 – 400 oC and above 400 oC for both conditions. These mass decreases were caused by water evaporation, thermal decomposition of cellulose, hemicellulose and thermal decomposition of lignin, respectively by the exhaust gas analysis. Under air condition, the exothermic peaks were observed as two steps corresponding to thermal degradation behaviors of cellulose and hemicellulose in 200 – 400 oC and that of lignin above 400 oC from the exhaust gas analysis. The exothermic heat obtained by thermal decomposition of woody samples were evaluated by the exothermic enthalpy and the mass loss. Thermal decomposition enthalpy were 12.2 kJ/g for Cedar bark, 11.6 kJ/g for Cedar sapwood, 10.6 kJ/g for Cedar leaves and6.9 kJ/g for pine needles under the perfect combustion condition. The residues at 890 oC under the perfect and imperfect combustion conditions were 1.7 and 29 %, respectively.
0 5 10 15 20 25
Mas
s lo
ss /
%
Tem
/ oC
Time / s
Mas
s lo
ss /
%D
TA
200
400
600
800
Fig. 1 TG/DTA results of cedar bark under air (blue) and dry N2 atmosphere (red) conditions at 20 K/min
Table 1 Mass loss and radiocesium loss in the laboratory scale combustion tests Combustion temperature (oC) 300 350 400 450 500 800 900 Mass loss (%) 54 65 85 86 87 98 99 134Cs loss (%) 2 13 27 22 34 35 36 137Cs loss (%) 1 15 24 30 31 32 31
15

The mass loss and radiocesium loss under the perfect combustion condition at 300 – 900 oC were shown in Table 1. Mass loss showed a good agreement with TG/DTA result under air flow condition, which indicated the laboratory scale combustion test was done under the perfect combustion condition. The radiocesium loss was increased linearly with the combustion temperature below 450 oC, and was approximately 30 – 35 % above 500 oC. The radiocesium in combustion gas were washed and collected by water, and the amount of radiocesium retrieved was 98 % of the initial mass.
(2) Decontamination system The pilot scale combustion system equipped with the
decontamination of forestry waste was designed based on the result obtained by the laboratory scale combustion test. The decontamination system for combustion of forestry waste consisted of three parts, the combustion gas washing system, the combustion ash collecting system and the filtration system for the contaminated washed water. The out view of combustion gas washing system was shown in Fig.2. The design of this system was based on 800 – 900 oC of combustion temperature and 100 kWh of combustion heat. Water used for washing the combustion gas 550 L without cooling equipment. About 40 kg of Cedar bark can be combusted per 1 hour using this system. The combustion gas washing system shown in Fig.2 consisted of the furnace (A) connected with the smoke extraction apparatus by jet stream of water (C) through the smoke tube (B), water supplied from the water tank (D) by pump (E). The picture in Fig.2 indicates the scrubber where the combustion gas was washed by jet stream of high pressure water. The three
mouth connecter at the upper side of the scrubber was connected to the ash enclosure system and the filtration system for contaminated water.
(3) Demonstration combustion test Two combustion tests were carried out using the pilot
system for combustion of forestry waste. The first test used 2.3 kg of pine needles and 1 kg of cedar bark for 40 mins combustion, whereas the second test used 2.5 kg of bark and 0.4 kg of sapwood for 50 mins combustion. After the two combustion tests, water temperature in the water tank changed from 5 to 45 oC, and about 5 L of water was lost by evaporation, which indicated that the heat of the combustion gas was 2.9 kWh. The heat of combustion gas is useable to dry the forestry wastes before the combustion.
The radiocesium and mass balances of two demonstration combustion tests were shown in Fig.3. The radiocesium in combustion gas and in soot absorbed inside of flue and furnace were extracted by water, the mass of these radiocesium were shown in L instead of kg. The combustion ash obtained by two combustion tests
was 2.25 % of starting materials, which corresponded to the perfect combustion at 750 oC. The condense ratio of radiocesium by the combustion was 27.6 times against the initial concentration by the evaluation based on mass and radiocesium changes during the combustion.
The radiocesium in ash was 62 % of the initial amount of radiosecium in the wastes, 38 % of radiocesium was transferred to the combustion gas in a gaseous state. With the increase of combustion temperature, the amount of gaseous radiocesium was increased. Comparing to the
Fig.2 Out view of combustion gas wash system
A
D
B
C
E
Fig.3 Radiocesium mass balance during combustion tests.
Pine needle 50,600 Bq / 2.3 kg Cedar bark 48,300 Bq / 3.5 kg Cedar sapwood 20 Bq / 0.4 kg
Ash 61,600 Bq / 0.14 kg
Gaseous state 27,250 Bq / 545 L Solid state (soot) 435 Bq / 0.0015 kg 6,000 Bq / 100 L
Combustion gas
62 %
38 %
16

laboratory scale test, the highest combustion temperature during the demonstration test was estimated to be above 900 oC.
Using the decontamination system, 95 % of the initial amount of radiocesium in the forestry wastes (98,920 Bq) was retrieved as the combustion gas washing water (22,685 Bq) and the ash (61,600 Bq). The difference between the initial and the retrieved amounts remained in the furnace and the flue. The maintenances and monitoring of facilities in the volume reduction factory were necessary to keep the facilities in good working order and to guarantee the safety.
The gas washing water containing radiocesium (50 Bq/L) was decontaminated to below 0.2 Bq/L by the filtration using a Prussian Blue supported wool filter for 2 hours 6). (4) Combustion ash treatment
The combustion ash was subjected to the powder X-ray diffraction analysis and the transition electron microscopic (TEM) observation equipped with energy dispersion X-ray spectrometer analysis (EDX). The main component of ash was crystalline oxide containing various elements. EDX results suggested the presence of boron (0.187 keV, BKα), magnesium (1.25 keV, MgKα), silica (1.74 keV, SiKα), phosphor (2.01 keV, PKα), manganese (5.89 keV, MnKα), iron (6.38 keV, FeKα), copper (8.0 keV, CuKα), zinc (8.63 keV, ZnKα) and strontium (14.1 keV, SrKα) addition to calcium (3.69 keV, CaKα),. Mg, P, Mn, Zn and Ca were the base element of plants, and B, Si, Fe, Cu and Sr came from the soil contamination of plants.
TEM observation suggested that the ash had a needle like structure with 10 – 20 µm length and 0.5 – 1 µm width, which had the possibility of affecting the human health through the mechanisms similar to the exposure to asbestos. The combustion ash contained high amount of radiocesium (440,000 Bq/kg), and was collected automatically by vacuum suction and was packed in a plastic bag to reduce the risk of workers health.
3. Conclusions
The laboratory scale combustion tests of forestry wastes were carried out, and the combustion heat efficiency was determined. The radiocesium mass balance during the combustion test was evaluated. A 98 % of radiocesium vaporized during the combustion was successively collected by washing the combustion
gas with water. A 95 % of radiocesium was collected safely by the decontamination system developed.
References 1) T. Nakanishi, K. Tanoi (eds) Agricultural
Implications of the Fukushima Nuclear Accident,Springer Tokyo (2013).
2) H. Yoshida, “Contamination analysis ofradionuclide in soils and plants caused byFukushima Nuclear Power Plant accident”,Chemical Engineering, No.6, 250 – 257 (2012)
3) Y. Kikawada, M. Hirose, A. Tsukamoto, K. Nakamachi, T.Oi, T. Honda, H. Takahashi, K. Hirose, “Mobility ofradioactive cesium in soil originated from the FukushimaDaiichi nuclear disaster; application of extractionexperiments”, J. Radioanalytical & NuclearChem., 304(1), 27-31 (2015).
4) T. Yoshihara, H. Matsumura, S. Hashida, T.Nagaoka, “Radiocesium contaminations of 20 woodspecies and the corresponding gamma-ray dose ratesaround the canopies at 5 months after the Fukushimanuclear power plant accident”, J. Env. Radioactivity,115, 60-68 (2013).
5) Tokyo Metropolitan University, “Closedcombustion gas treated system”, Japanese patent2013-224831
6) K. Yokota, etc., “Prussian blue dyed wool and itsdecontamination ability for radiocesium”,International Symposium on Fiber Science andTechnology 2014, September 28 to October 1, PG3-01
.
17

Part 2
Environmental radiation/external exposure

Integrating nuclide specific and dose rate
based methods for airborne and ground based
gamma spectrometry.
David SANDERSON1)*
, Yukihisa SANADA2)
, Alan CRESSWELL1,3)
,
Sheng XU1)
, Simon MURPHY1)
, Chika NAKANISHI2)
, Tsutomu YAMADA2)
1) Scottish Universities Environmental Research Centre (SUERC), East Kilbride, SCOTLAND.
2) Japan Atomic Energy Agency (JAEA), 1, Kanayagawa, Fukushima-shi, Fukushima, JAPAN.
3) Institute of Environmental Radioactivity (IER), Fukushima University, 1 Kanayagawa, Fukushima-shi, Fukushima JAPAN
Results of joint airborne survey work conducted by SUERC and JAEA are presented, for areas to
the north and south of Fukushima Dai ichi using four different airborne survey systems, cross
calibrated at reference sites in Scotland and near Namie. Airborne measurements were made at
a series of different survey heights using three high volume NaI based spectrometers, and for the
first time using a high resolution system based on the Ortec IDM HPGe spectrometer. The JAEA
data sets were analysed using the same methods applied to national scale mapping in Japan since
the accident. The SUERC data sets were analysed using nuclide specific approaches validated in
the European ECCOMAGS project. The data presented on a digital terrain model show marked
correspondence with landscape features, which both suggest the initial deposition processes, and
indicate trajectories for future re-deposition by natural processes. All data sets are traceable to
each other, and to the ground based calibration site s. Nuclide specific inventories have been
defined, which can serve as a future reference to evaluate environ mental change.
Key Words: Airborne monitoring, Manned helicopter, Accident of Fukushima Daiichi NPS
1. Introduction: A multiscale problem
As recovery progresses more quantitative means to account
for radionuclide inventories in complex environments are
needed. This is a significant multi-scale problem.
Contamination ranges from national and regional (100-1000
km), through local (1-10 km), and site specific (1-100m)
spatial scales. Yet the physical, chemical and biological
behaviour of radionuclides is influenced by speciation and
processes determined at sub-microscopic scales.
Comprehensive knowledge on all scales is needed to predict
future behavior, and enhance the knowledge base for a
managed recovery. Moreover, since 2011, measurements
have been conducted by different institutions using diverse
methods. It is important to integrate and cross validate data
and methods to enhance confidence in the outcomes.
Here we present recent collaborative work between SUERC
and JAEA(1)
which aimed to (a) establish traceable ground to
air comparisons for airborne gamma spectrometry (AGS)
in Japan, and (b) assess nuclide specific AGS methods in
conjunction with methods based on dose rate apportionment.
2. Joint airborne surveys in November 2014
Airborne surveys were conducted in November 2014
with UK and Japanese systems. The survey areas are
shown in Figure 1. Areas 1 and 5 are mountainous and
forested and were surveyed at nominal heights of 150m
(500 feet) , 300m (1000 feet) and 450 m (1500 feet).
Figure 1: Map of survey areas for November 2014 joint
airborne survey. Image: Landsat ©Google 2015
18

For areas 1 and 5 each survey comprised 180 line km,
and took 80-100 minutes of flight time.
SUERC deployed two NaI(Tl) spectrometers, of 16 litre (the
“Rack” system) and 4 litre (the “Black Box” system) volume,
plus a system developed with the Ortec IDM-200V self-
cooled hyperpure Ge spectrometer (the “IDM” system), and
tested for the first time in the air during this project. These
systems were extensively tested in the UK prior to shipping
to Japan; the rack and black box systems being flight
calibrated at the ECCOMAGS sites in SW Scotland. In Japan
the SUERC spectrometers were bench tested in JAEA’s
laboratory at Fukushima University, and then installed in a
Bell 412 helicopter operated by Aero Asahi, and used for
national mapping in Japan. JAEA also conducted
measurements using Radiation Solutions 12 litre NaI(Tl)
spectrometers. The systems were powered independently
from the aircraft, and combination of GPS data and a digital
elevation model used for ground clearance estimation.
3. Data analysis approaches
SUERC data sets were analysed using nuclide specific
approaches validated in the European ECCOMAGS
project(2,3)
. For the NaI(Tl) data nuclide specific energy
regions were integrated, and standard approaches applied
based on background subtraction, matrix stripping (using
matrices derived from measured and simulated spectra for
each radionuclide or series to deconvolve interferences),
altitude standardization and conversion to nuclide specific
activities for 137
Cs and 134
Cs (in kBq m-2
) and naturally
occurring nuclides 40
K, 214
Bi, 208
Tl (in Bq kg-1). High
resolution data were calibrated using specific gamma ray
lines.
JAEA has conducted airborne surveys using manned aircraft
since 2011(4,5)
contributing extensively to the MEXT
programme of national surveys. Dose rate mapping methods
have been adopted in Japan using the “non-natural” dose rate
approach, with apportionment to 137
Cs and 134
Cs activity
estimates based on conversion between dose rate and activity
per unit area using coefficients from ICRU53(6)
, and
knowledge of mean isotope ratios.
3.1 Ground to air calibration at reference sites
Scotland (UK)
Reference sites provide traceability between soil samples,
in-situ, backpack, and airborne gamma measurements. The
SUERC spectrometers were flight tested at the ECCOMAGS
intercomparison sites in SW Scotland(2,3)
(Figure 2). Table 1
shows the airborne and ground based data on these sites, and
establishes international traceability to the work. For 137
Cs a
mean mass depth of 8.5 g cm-2 which matches the reference
depths for Inch Farm (IF) and Castle Kennedy(CK), where
radiocaesium was deposited by atmospheric processes,
reasonably well. At Wigton Merse the activity was deposited
Table 1: Results for the ECCOMAGS calibration sites measured in September 2014, together with reference values updated to
2014.
.Site Value 137Cs
Activity Mass depth
kBq m-2
g cm-2
40K Bq kg
-1
214Bi Bq kg
-1
208Tl Bq kg
-1 Dose rate µGy h
-1
WG Measured
(56 ± 1)
(8.5) 333 ± 5 18.6 ± 0.9 5.8 ± 0.1 0.053 ± 0.001
Reference
170 ± 10 26 383 ± 13 13.4 ± 0.4 7.5 ± 0.3
IF Measured 14.6 ± 0.5 8.5 358 ± 5 24.4 ± 1.1 7.8 ± 0.1 0.039 ± 0.001
Reference 16.9 ± 0.8 8.5 376 ± 14 23.8 ± 1.9 9.9 ± 0.6 0.054 ± 0.003
CK Measured 4.3 ± 0.2 8.5 207 ± 4 11.3 ± 0.7 4.2 ± 0.1 0.023 ± 0.001
Reference 4.8 ± 0.2 12.8 270 ± 13 14.4 ± 0.7 6.5 ± 0.5 0.033 ± 0.005
Inch Farm
WigtownMerse
CastleKennedy
Dumfries
Stranraer
Solway Firth
Dumfries and Galloway Region
0 10 20km
ECCOMAGS Exercise : Calibration Sites
Figure 2: Location of calibration sites in SW Scotland.
19

by tidal inundation of sediments contaminated by past marine
discharges from the Sellafield reprocessing site. It shows a.
pronounced subsurface maximum with mean mass depth of
26 g cm-2 (2014 value) resulting in a significantly different
Cs calibration factor, as previously observed2.
Fukushima (Japan)
A reference site was sampled near Namie in November 2014
ahead of the airborne work. 31 soil cores were collected on an
expanding hexagonal pattern designed to accommodate
spatial heterogeneity(7)
. They were subdivided into depth
intervals, dried and prepared for later laboratory analysis by
high resolution gamma spectrometry. Backpack mapping
1-100m scale, also showing the effects of ongoing
remediation, and self-cleaning of road surfaces. Dose rates
were measured at ground level by JAEA. Table 2 shows the
agreement between sample based and airborne results from
the site, establishing nuclide specific traceability between
ground sampling and airborne observations for the first time
in Japan.
4. Results
Figure 4 shows spectra and altitude corrected count rate data
for 137
Cs at different heights above the Namie calibration site
for the 16 litre (rack) system. As expected (eg the half depth
for 662 keV radiation in air is ~72 m) the spectra show
marked reductions peak intensities and relative increase in
scattered components with increasing height.
Altitudecorrected peak count rates show increasing
dispersion with height, reflecting these features, confirming
that measurement precision for nuclide specific mapping is
strongly dependent on ground clearance.
Full results for all survey areas are given in Sanderson et.al.
2015(1)
. Here we illustrate some of the data from area 5 (SW
of FDNPP). Average spectra for the three SUERC systems
for the 500ft survey of this area are shown in Figure 5. These
show the difference in relative efficiency between the
Figure 5: Average spectra recorded with the three
SUERC systems for the 500ft survey of Area 5.
Figure 3: Backpack survey of the Namie calibration site,
November 2014. Note the lower activity levels along roads,
and the higher activity levels in the SE quadrant, which had not
undergone active remediation at time of survey
Rack System (Summed Array)
Height (m)
0 100 200 300 400 500
137C
s a
ltitude c
orr
ecte
d c
ps
-1000
-500
0
500
1000
1500
37
2 ±
3 (
n=
65
)
38
5 ±
5 (
n=
70
)
35
4 ±
11
(n
=6
6)
30
7 ±
38
(n
=7
4)
Figure 4: Mean spectra (top) and altitude corrected count
rates (below) recorded at different heights above the Namie
calibration site, using the SUERC rack system.
20

Table 2: Results of measurements on the Namie reference site at different ground clearances. For 137
Cs and 134
Cs a mean mass
depth of 3 g cm-2 was applied..
systems, and also the much higher spectral resolution of the
HPGe detector allowing the quantification of line specific
count rates without the use of a stripping algorithm. The use
of the different discrete peaks for 137
Cs and 134
Cs in the HPGe
spectra allows for quantification of isotope ratio and mass
depth. Figure 6 compares dose rate and 137
Cs estimates for the
SUERC rack and JAEA 12 litre system, showing similar
deposition patterns, and inventories in TBq (Table 3).
Figure 7 compares high volume (16 litre) with low volume (4
litre) NaI systems with the Ge based IDM spectrometer in
Area 5. Positions and activity concentrations correspond well,
with 150 m (500 feet) ground clearance, and the data confirm
the first use of IDM systems for airborne mapping.
The data, on digital terrain models (Figure 8), identify wet
and dry deposition areas, and suggest future movement of
activity within valley catchments
5. Discussion
Collaborative work between JAEA and SUERC has
established traceability between airborne and ground based
measurements through measurements at calibration sites in
SW Scotland developed for an international intercomparison
exercise and the development of a calibration site near Namie.
Reference values have been defined from laboratory
measurement of samples, and a backpack survey used to
evaluate spatial variability. This has highlighted the
self-cleaning of road surfaces, and the effect of ongoing site
remediation within a dynamic environment. Initial
comparisons have been made between airborne measurements
with spectrometry systems utilizing spectral analysis methods
to directly quantify radionuclide activity concentrations, and
with dose rate apportionment methods. These approaches
reproduce the general features of the common survey areas,
and inventories, however nuclide specific approaches have
advantages in providing independent means of registering
Table 3: Inventories of 134
Cs and 137
Cs in each of the two survey areas determined from the different NaI(Tl)
systems at three different ground clearances.
Rack Inventory (TBq) Black Box Inventory (TBq) JAEA Inventory (TBq) 137
Cs 134Cs 137
Cs 134Cs 137
Cs 134Cs
Area 1 500ft 43.79 ± 0.03 14.74 ± 0.01 40.45 ± 0.03 12.39 ± 0.02 29.8 9.65
1000ft 41.13 ± 0.07 11.37 ± 0.02 30.67 ± 0.08 8.81 ± 0.03 32.6 10.5
1500ft 39.98 ± 0.25 10.99 ± 0.06 27.67 ± 0.26 7.24 ± 0.09 26.3 8.52
Area 5 500ft 39.77 ± 0.02 13.23 ± 0.01 39.74 ± 0.03 12.53 ± 0.01 30.4 9.84
1000ft 40.03 ± 0.05 11.33 ± 0.02 37.77 ± 0.05 5.67 ± 0.02 27.8 8.99
1500ft 44.72 ± 0.17 12.67 ± 0.05 30.83 ± 0.19 8.13 ± 0.07 25.9 8.37
System 137
Cs kBq m-2
134Cs kBq m
-2
40K Bq kg
-1
214Bi Bq kg
-1
208Tl Bq kg
-1 Dose rate µGy h
-1
Rack
500ft 73.3 ± 0.7 19.3 ± 0.5 258 ± 6 22.3 ± 2.0 7.0 ± 0.2 0.185 ± 0.001
750ft 75.8 ± 1.0 18.7 ± 0.6 243 ± 10 24.8 ± 2.9 6.5 ± 0.3 0.186 ± 0.001
1000ft 69.8 ± 2.2 19.6 ± 1.0 268 ± 12 20.6 ± 4.7 6.6 ± 0.4 0.182 ± 0.001
1500ft 60.5 ± 7.5 21.5 ± 2.2 278 ± 26 18.6 ± 11.7 8.1 ± 0.6 0.193 ± 0.002
Black box
500ft 74.9 ± 1.5 16.5 ± 0.7 219 ± 14 23.4 ± 2.2 6.5 ± 0.5 0.182 ± 0.003
750ft 80.3 ± 1.7 16.6 ± 1.0 235 ± 15 20.6 ± 3.8 6.5 ± 0.8 0.189 ± 0.002
1000ft 66.2 ± 3.1 17.5 ± 1.7 198 ± 20 25.6 ± 5.1 5.6 ± 1.1 0.176 ± 0.002
1500ft 60.9 ± 9.2 11.4 ± 3.3 220 ± 44 47.2 ± 8.4 3.1 ± 2.2 0.176 ± 0.004
JAEA (σ=3) 500ft 61.5 ±5.1 20.1 ±1.7 - - - 0.183 ± 0.015
Reference 66.6 ± 6.2 17.3 ± 1.6 298 ± 7 22.7 ± 0.8 10.0 ± 0.2 0.182 ± 0.009
21

Figure 6: Dose rate and 137
Cs distribution in area 5 measured with the SUERC rack system at 150m and 300m ground clearance,
and with the JAEA system at 300m
isotopic variations, and placing the radiocaesium and naturally
occurring nuclides in context. There is scope for further
analysis of the potential for applying nuclide specific methods
to the JAEA data sets and to earlier national surveys to build
4D models for the nuclide migration in these upland areas. The
use of landscape 3D drapes with the lowest altitude data sets
show remarkable correspondence to landscape features,
including enhanced signals in valley bottoms in area 1, and
topographically significant positioning of activities in area 5
which are suggestive both of the depositional processes and
likely trajectories for long term migration of activity. Again
there is scope for further application of these approaches to
visualization of the activity distributions and movements
within complex and dynamic environments in Fukushima. The
work was successful in establishing the ability of UK and
Japan teams to produce high quality airborne data sets using
diverse systems. It also verified, for the first time, the potential
of new IDM technology for AGS
Acknowledgements
The work was supported by JAEA and SUERC under a
bilateral research agreement. Support is also acknowledged
.
Figure 7: Comparison between the three SUERC systems at 150m for area 5.
Results for area 5 are shown here. Below compares dose rate
and 137Cs estimates for the SUERC rack and JAEA 12 litre
system, showing similar deposition patterns, and inventories in
TBq. エリア5におけるSUERCとJAEAの測定結果は、線量率及び分布のパターンにおいて同じ傾向を示した。
SUERC (150m) SUERC (300m) JAEA (300m)
μSv h-1
137CsBq m-2
Comparing high volume (16 litre) with low volume (4 litre) NaI
systems with the Ge based IDM spectrometer in Area 5. Positions
and activity concentrations correspond well, with 150 m (500 feet)
ground clearance, and the data confirm the first use of IDM systems
for airborne mapping.
16 l Rack 4 l Black Box Ge IDM system
150m高さから測定したSUERCの3種類の検出器の測定結果は、概ね同様の傾向を示した。IDMを航空機に搭載して測定したのは世界で初めてである。
22

Figure 8: 137
Cs activity distribution on 3D landscape models for area 1 (top) showing increased concentration in river valley
floors, and area 5 (bottom) showing deposition on mountains. Image: Landsat ©Google 2015
from the GB Sasakawa Foundation, the University of
Glasgow, and the UK FCO Prosperity Fund for visits to
Fukushima, to the Institute for Environmental Radioactivity
Fukushima University for support with sample preparation,
to Aero-Asahi and PDG helicopters for aircraft operations,
and to Seiko-EG&G for provision of the IDM system in
Japan.
References
1) Sanderson D.C.W., Cresswell A. J., Xu S., Murphy S.,
Sanada Y., Nakanishi C., Yamada T. “Joint SUERC/
JAEA Airborne Survey Measurements in Japan:
SUERC Instrumental Measurements in November
2014.” SUERC/JAEA report (2015).
2) Sanderson D. C. W., Cresswell A. J., Lang J. J. (Eds). “An
International Comparison of Airborne and Ground
Based Gamma Ray Spectrometry.” University of
Glasgow, UK (2003), ISBN: 0-85261-783-6.
3) Sanderson D.C.W., Cresswell A.J., Scott E.M., Lang J.J.
(2004). Demonstrating the European Capability for
Airborne Gamma Spectrometry: Results from the
ECCOMAGS Exercise. Radiation Protection
Dosimetry, 109, 119-125.
4) Yukihisa Sanada, Takeshi Sugita, Yukiyasu Nishizawa,
Atsuya Kondo, Tatsuo Torii, The aerial radiation
monitoring in Japan after the Fukushima Daiichi
nuclear power plant accident. Prog. Nuc. Sci. Tech.,
4, 76-80, 2014
5) Sanada, Y., Nishizawa, Y., Urabe, Y., Yamada, T.
Ishida, M., Sato, Y., Hirayama H., Takamura, Y.,
Nishihara, K., Imura, M., Tsuchida, K., Ishibashi, S.,
M., Yuuki, Y. and Torii, T., “Radiation monitoring
using manned helicopter around the Fukushima dai-ichi
nuclear power plant in the fiscal 2013”(Contract
Research), JAEA-Research 2014-014, 2014 (in
Japanese).
6) International Commission on Radiation Units and
Measurements. “Gamma-ray spectrometry in the
environment.” ICRU Report No. 53 (1994). ISBN
0-913394-52-1.
7) Tyler A.N., Sanderson D.C.W., Scott E.M., Allyson J.D.
(1996). Accounting for spatial variability and fields of
view in environmental gamma ray spectrometry. J.
Environ. Radioact. 33, 213-235.
View from S
Area 5, nominal 500ft survey
Area 1
Area 5
View from NNE
Area 1, nominal 500ft survey
23

Bacterial microflora characteristics of plant samples from contaminated by radionuclides Chernobyl area
Pavlina ZELENA 1), Julia SHEVCHENKO1)*, Valentina BEREZHNA2), Julia SHYLINA2), Mykola GUSCHA2), Olha MOLOZHAVA1),
1) ESC Institute of Biology, Taras Shevchenko National University of Kiev, 64/13, Volodymyrska Street, Kyiv 01601Ukraine
2) Institute of Cell Biology and Genetic Engineering NASU, 148, Zabolotnogo Street, Kyiv -143, 03680, Ukraine*[email protected]
Two serious nuclear accidents during the last quarter century (Chernobyl, 1986 and Fukushima, 2011) contaminated large agricultural areas with radioactivity. In radioactive areas all components of ecosystems, including microorganisms, exposed to ionizing radiation. The aim of this study was isolation and identification of dominant bacteria from plant samples, which were collected from the area of radioactive contamination and to compare it with bacteria isolated from plant collected in a non-radioactive area by their qualitative composition, physiological, biochemical and pathogenic characteristics. Bacteria were isolated from plant samples grown in a radioactive field located 5 km from the Chernobyl Nuclear Power Plant (CNPP). Physiological, biochemical and pathogenic properties were characterized from nine pure bacterial isolates. The common features of bacteria from radionuclide contaminated plant samples were increased synthesis of mucus and capsule creation. It was found that all selected isolates produce catalase, therefore, bacteria were resistant to oxidative stress. The increased pathogenicity of most bacteria isolated from the plant grown in radioactive Chernobyl area compare to the isolates from the plant without radioactive contamination was established from the phytopathogenic tests. Consequently, bacterial isolates from the plants grown in the radioactive environment tends to dominate enterobacteria similar to agents of opportunistic infections.
Key Words: Plant microflora, Chernobyl area, Pathogenicity
Introduction
Compared with macroorganisms, microorganisms demonstrate higher resistance to irradiation. There is a possibility that doses harmful for macroorganisms lead to stimulation of microorganisms’ activity. As a result, it will probably change the host-pathogen relationships.
In case of chronic irradiation, such changes of microflora are considered as a sensitive indicator of host' immunoreactivity modification. There are increases of biochemical activity, pathogenicity and resistance to adverse environmental factors in the irradiated organism’ microflora [1]. The growth of the immunosuppressive properties takes place in opportunistic microorganisms by dramatic rise of culture concentration and pathogen aggressiveness [2]. In the irradiated organism, saprophytes are capable of changing their properties by increasing biochemical activity, potential pathogenicity and antibiotic resistance.
It is known that the microbiota responds to the physiological state of the host, in particular, at the
body's stress levels [3]. On the other hand, in case of irradiation, stress factor affects the microflora directly and changes its properties.
Thus far, previous studies have demonstrated that the effect of chronic exposure of low intensity radiation leads to a change in plant resistance and aggressiveness of pathogenic fungi. In particular, the reduction of plant resistance to biotic stress was recorded in plants grown in clean soil from seeds formed in conditions of radioactive contamination, and plants grown from clean seed in the 30-kilometer zone of the Chernobyl Nuclear Power Plant (CNPP) [4]. Concerning phytopathogenic bacteria such data are not available.
The aim of this study was isolation and identification of dominant forms of bacteria from plant samples, which were collected from the area of radioactive contamination, and comparing with bacteria isolated from plant collected in a non-radioactive area by their qualitative composition, physiological, biochemical and pathogenic characteristics.
24

Materials and methods
Bacterial isolates were selected from plant samples collected on the radioactive field located 5 km from the CNPP, near the village Chystogalivka (20650±1050 Bq/kg for 137Cs and 5180±550 Bq/kg for 90Sr) and in a control field established directly in a non-radioactive area in the town of Chernobyl (1414±71 Bq/kg for 137Cs and 550±55 Bq/kg for 90Sr).
For bacteria isolation a small amount of dried plant material was homogenized in a mortar with sterile distilled water and applied on a surface of potato agar medium. A selection of pure cultures was performed according to the recommendations of Bergey's Manual [5]. Cytological examination of the obtained cultures was performed by Gram's method [6].
Biochemical studies of isolated bacteria were performed according to standard techniques [7] by differential tests (OF-test, MRVP-test, oxidase-test, catalase-test, NO2-test) and by microbial analyzer VITEC 2 compact (bioMérieux Inc., France).
The pathogenic properties of bacterial isolates were confirmed by using various plant test-systems: Arabidopsis thaliana, seedlings of maize and flax seeds.
Adult plants of A. thaliana ecotype Columbia (Сol-0 wt - wild type) were infected with bacterial suspension (48-hour culture, 109 cells/mL) by inoculation with a syringe [8]. Damaged leaves with various symptoms were accounted after three days. The degree of lesion was calculated by the point system (Fig. 1).
The corn seedlings MOC 182CV (hybrid culture) were infected with bacterial suspensions (in a final concentration 1.107 cells/mL) in water. Determination of growth parameters took place after three and nine days of incubation; examination of dry weight of roots and stems at nine day of incubation.
The bulked flax seeds (1.5 g) were infected with bacterial suspension (0.5 units of Macfarland). The energy of seeds germination was calculated after three days of growth.
Statistical analysis of the results was performed by the software package Microsoft Office Excel.
Results and Discussion
All of the nine characterized bacterial isolates were gram-negative, rod-shaped and contained capsule. Highly developed capsules were found in the bacteria isolated from the area of radioactive contamination. The most interesting finding was that bacterial isolates, collected in the territory contaminated with radionuclides demonstrated a high biochemical activity and broad range of biochemical characteristics.
OF-test. The oxidative-fermentative test is used to
determine if bacteria metabolize glucose by fermentation or aerobic respiration (oxidatively) [7]. It was found that k/15m, k/15b, k2j/2, k3j2/13 isolates are nonfermenting bacteria that metabolize glucose via oxidative metabolism (O). Facultative anaerobic metabolism (F) was typical for k2pr/1, k3j1/6, k3j3/11, k3pr1/9, k3j3/12 isolates (Table 1).
MRVP-test (methyl red and Voges-Proskauer tests) exploits for formic acid fermentation type determination. It has been demonstrated that bacteria of the genera Escherichia, Salmonella, Shigella exhibit mixed formic acid fermentation type and ferment sugars to lactic, acetic, succinic & formic acids, ethanol and CO2. Whereas bacteria of the genera Enterobacter, Serratia, Erwinia produce less acid, but more CO2, ethanol, acetone and 2,3-butanediol by butanol-formic acid fermentation type. The mixed type of formic acid fermentation was detected in isolate k3j1/6 and butanol type of fermentation was typical for k/15m, k/15b, k2pr/1, k2j/2, k3j1/6, k3j3/11, k3pr1/9, k3j3/12 isolates (Table 1).
Oxidase-test. It has been demonstrated that C-oxidase positive reaction inherent in bacteria Alcaligenes spp., Campilobacter spp., Bordetella pertusis, Brucella spp., Moraxella spp., Pseudomonas spp., etc. On the other hand, oxidase negative bacteria are Acinetobacter spp., Francisella tularensis, Flavimonas oryzihabitans, Stenotrophomonas maltophilla, representatives of the family Enterobacteriaceae, etc. [7]. Among the isolated bacteria the cytochrome oxidase was present in isolates k/15m and k3j2/13 (Table 1).
NO2-test. Anaerobic bacteria use nitrate NO2 as a terminal acceptor of electrons for anaerobic respiration. Among obtained bacteria, isolates k2pr/1, k3j1/6, k3j3/11, k3pr1/9, k3j3/12 are capable for nitrate respiration (Table 1).
Catalase-test. A number of studies proved that microorganisms that exist in presence of molecular oxygen express superoxide dismutase, peroxidase and catalase. It was found that bacterial isolates produce catalase and exhibit resistance to oxidative stress (Table 1).
Bacterial isolates k2j/2 and k3j3/12 showed positive reaction with Ellman's reagent, which specifically reacts with free SH-groups. By this test the intracellular concentration of low molecular weight thiols (glutathione, etc.), which involved in detoxification reactions of aldehydes was determined. It is believed that glutathione plays an important role in cell protection from oxidative stress, caused by the influence of reactive oxygen species.
Pathogenicity tests. Taken together, these results suggest that the majority of bacterial isolates from plant samples collected in the territory of radionuclide contamination exceeded the level of pathogenicity of bacteria isolated from plant samples collected in a non-radioactive area.
Bacterial isolates k2pr/1 and k2j/2, extracted
25

from the flax seeds, demonstrated the highest virulence and aggressiveness at all plant test-systems (flax, corn, Arabidopsis) (Fig. 1).
Bacterial isolates identification results. Most bacteria which were isolated from the area with radioactive contamination demonstrated characteristics of opportunistic microorganisms. The bacterial isolates from the flax seeds, which were grown in the absence of radioactive contamination, were identified as Pseudomonas fluorescens (k/15m) and gram-variable Bacillus spp. (k/15b). Isolated bacteria Bacillus spp. formed a well-developed capsule and was found in the samples from the zone of radioactive contamination as well. Selected isolates of P. fluorescens by biochemical characteristics were similar to Pseudomonas aeruginosa, but instead of pyocyanin synthesis, bacteria were producing green fluorescent pigment and did not grow at 42°C
The bacteria isolated from the flax seeds collected in the zone of radioactive contamination, were identified as Enterobacter spp. (k2pr/1) & Cupriavidus pauculus (k2j/2) and obtained a high level of pathogenicity. The genus Enterobacter refers to opportunistic bacteria which cause nosocomial angiogenic infections and infections of the respiratory and urinary tracts. Cupriavidus pauculus (Ralstonia solanacearum) is phytopathogenic bacteria, the causative agent of withering among crops and ornamental plants, altogether affects up to 200 plant species. In particular, it causes one of the most dangerous diseases of potato - brown rot. This bacterium is a quarantine organism in Ukraine, which included in the first list “The List of pests, plant diseases and weeds that are of quarantine significance in Ukraine". It is also included in the A2 list of quarantine organisms of EPPO (European and Mediterranean Plant Protection Organization).
From the evening-primrose inflorescences were isolated Pantoea sp. (k3j1/6), Pantoea agglomerans (k3j3/11, k3pr1/9, k3j3/12) and Acinetobacter baumannii (k3j2/13). It is known that Pantoea bacteria are isolated from various environments (soil, water, plants and seeds, animals, insects) and causes opportunistic infections in humans (wound infection, respiratory tract and conjunctiva inflammation, etc.) [9].
Acinetobacter baumannii, is one of the causative agents of nosocomial infection (causing 2-10% of Gram-negative infections in Europe and the US and 1% of all nosocomial infection), well adapted to the hospital environment and has high resistance to the most antimicrobial and antiseptic drugs [10]
Overall, these results confirm our earlier assumption that one of the negative consequences of the stressful impacts on ecosystems is accumulation in environment highly-developed microorganisms with increased aggressiveness [11]. In addition,
opportunistic pathogens similar to saprophytes and highly specialized pathogens possess a high adaptive capacity, better resistant to unfavorable environmental factors (biofilm formation, high biochemical activity, resistance to oxidative damages) and capable of finding new hosts. All this allows for the description of the situation in Chernobyl area as “unfavorable”. Therefore, the territories with radioactive contamination, including the Fukushima region, require opportunistic microorganisms monitoring and preventing its further spreading.
References 1) Vasilenko I., Vasilenko O. “Biological effects of
nuclear fission products”, BIONOM. 384p.(2011) (in Russian).
2) Lukyanova E., Antypkin Y., Chernyshov V.,Vykhovanets E. “Ionizing radiation and theimmune system in children”, Expert. 210p.(2003) (in Russian).
3) Oleskin A., Botvinko A., Cevkelova I. “Colonialorganization and intercellular communication inmicroorganisms”, Microbiology 69(3), pp309-327 (2000) (in Russian).
4) Grodzinsky D., Huscha M., Dmitriev A. et al.,“Radiobiological effects of chronic irradiationof plants in the areas affected by the Chernobyldisaster”, Nauc. dumka. 376p. (2008) (inUkrainian).
5) Holt J., Krieg N., Sneath P., Steil J. “Bergey'sManual of Systematic Bacteriology”, Mir. 432p.(1997) (in Russian).
6) Radchenko O., Stepura L., Dombrovskaja I et al.“Workshop on General Microbiology”,Phitocentr (2011) (in Ukrainian).
7) Radchenko O. “The physiological andbiochemical properties of microorganisms andmethods of their determination”, Kiev. 212p(2012) (in Ukrainian).
8) Klement Z., Rudolf K., Sands D. “Methods inphytobacteriology”, Budapest: Acad. sci. 568 p.(1990).
9) Medrano E., Bell A. “Role of Pantoeaagglomerans in opportunistic bacterial seed andboll rot of cotton (Gossypium hirsutum) grownin the field”, J. Appl .Microbiol. 102(1), pp134-143 (2007).
10) Horbych J., Karpov I, Krechikova O. “Infectionscaused by Acinetobacter baumannii: risk factors,diagnosis, treatment, prevention approaches”,Medicinskie novosti. 5, pp 31-39 (2011) (inRussian).
11) Shilina J., Huscha M., Dmitriev A. “The problemof modification of the pathogenicity ofmicroorganisms in anthropogenically modifiedecosystems”, Agroecological journal. 2, pp62-66 (2006) (in Ukrainian).
26

Table 1. Biochemical characteristics of isolated bacteria: P. fluorescens (k/15m), Bacillus spp. (k/15b), Enterobacter spp. (k2pr/1), C. pauculus (k2j/2), Pantoea spp. (k3j/6, k3j3/11, k3pr1/9, k3j3/12), A. baumannii (k3j2/13).
Biochemical characteristics Isolated bacteria k/15m k/15b k2pr/1 k2j/2 k3j1/6 k3j3/11 k3pr1/9 k3j2/13 k3j3/12
OF-test, glucose O O F O F F F O F MR-test - - - - + - - - - VP-test + - + + + + - - + Cytochrome oxidase + - - - - - - + - Nitrate reductase - - + - + + + - + Catalase + + + + + + + + + Ellman test - - - + - - - - + L-Arabitol - - - - - - - - - Cellobiose - - + - - - - - - H2S formation - - - - - - - - - D-Glucose + + + + + + + + + Beta-glucosidase - + - - - + + - + D-Maltose - + + + - + + - + D-Mannitol - + + - + + + - + D-Mannose + - + - + + + + + Beta-xylosidase - - + - - - - - - Lipase + - - - - - - - - Palatinose - - + - - - - - - D-Sorbitol - + + - - - - - - Saccharose/sucrose - + + - + + + - + D-Tagatose - + - - - - - - - D-Trehalose - + + - + + + - + Citrate (sodium) + - + + + + + + + Malonate + - + + + + + + + 5-Keto- D-gluconate - - - - - - - - - L-Lactate-alkalinization + + + + + + + + + Alfa-glucosidase - + - - - - - - - Succinate-alkalinization - - + + + + + + + Alfa-galactosidase - + + - - - - - - Ornithine-decarboxylase - - + - - - - - - Decarboxylase-base - - - - - - - + - L-Histidine-assimilation + - - + - - - + - Beta-glucuronidase - - - - - - - - - Glu-Gly-Arg-arylamidase - - - - - - - - -
27
Fig. 1. A. thaliana lesion on 3d day after isolates inoculation, which were collected from plant material in zone of radioactive contamination and in radionuclide-free area

Fields of View for Environmental Radioactivity
Alex MALINS1)*, Masahiko OKUMURA1), Masahiko MACHIDA1), Hiroshi TAKEMIYA1), Kimiaki SAITO2)
1) Center for Computational Science & e-Systems, JAEA, 178-4-4 Wakashiba, Kashiwa, Chiba 277-0871 JAPAN
2) Fukushima Environmental Safety Center, JAEA, 2-2-2 Uchisaiwai-cho, Chiyoda, Tokyo 100-8577 JAPAN *[email protected]
The gamma component of air radiation dose rates is a function of the amount and spread of radioactive nuclides in the environment. These radionuclides can be natural or anthropogenic in origin. The field of view describes the area of radionuclides on, or below, the ground that is responsible for determining the air dose rate, and hence correspondingly the external radiation exposure. This work describes Monte Carlo radiation transport calculations for the field of view under a variety of situations. Presented first are results for natural 40K and thorium and uranium series radionuclides distributed homogeneously within the ground. Results are then described for atmospheric radioactive caesium fallout, such as from the Fukushima Daiichi Nuclear Power Plant accident. Various stages of fallout evolution are considered through the depth distribution of 134Cs and 137Cs in soil. The fields of view for the natural radionuclides and radiocaesium are different. This can affect the responses of radiation monitors to these nuclides if the detector is partially shielded from the ground within its field of view. The field of view also sets the maximum reduction in air dose rates that can be achieved through local decontamination or remediation measures. This maximum efficiency can be determined quickly from the data presented here for the air dose rate versus the spatial extent of radioactive source on the ground.
Key Words: field of view, air dose rate, environmental radioactivity
1. Introduction
Humans are exposed to external gamma radiation from cosmic sources and from radioactivity in the environment on earth. Environmental gamma radiation sources can be natural or man-made in origin. Examples of the former include 40K, and thorium and uranium series radionuclides within the ground, and the latter include fallout from atomic weapons testing and civil nuclear accidents. The level of gamma radiation at a particular location can be quantified by measuring an external radiation dose rate. The radiation protection quantity ambient dose equivalent rate is commonly used for this purpose 1).
Gamma rays can travel hundreds of metres in air without undergoing interactions. The U. S. National Institute of Standards and Technology (NIST) lists a mass attenuation coefficient ( / ) for 1.0 MeV photons in dry air of 0.06358 cm2/g 2). For air with density 0.0012 g/cm3, this equates to a mean free path of 131 m between interactions. Therefore, gamma rays originating from a
wide area of land can contribute to the air dose rate. The field of view describes the size of the region
containing radioactivity whose radiation contributes significantly to the dose rate at a detection point. The field of view of environmental radionuclides, present on or below the ground, can thus be defined as the volume of earth from which a specified fraction of the total gamma radiation intensity contributing to an air dose rate originates from 3). Previous authors have characterized the field of view for 1 m air dose rates from natural and anthropogenic radionuclides distributed within soils. Techniques employed have included first principles calculations for photon fluxes 3) 4) and Monte Carlo simulations of dose rates 5) from increasing area sources on the ground. Others have characterized the angular dependence and the field of view of the air kerma 6) 7) 8).
This paper presents Monte Carlo calculations for the field of view for ambient dose equivalent rates from natural radionuclides distributed uniformly in the ground, and radioactive 134Cs and 137Cs fallout distributed
28

exponentially with depth. Two applications of the fields of view results are presented within: i) for interpreting differences between KURAMA survey results taken in cars and buses, and ii) for undertaking quick calculations for the effectiveness of land remediation methods.
2. Methods
All calculations were undertaken with the Monte Carloradiation transport code PHITS 9). The simulations modelled the infinite half-space geometry 10). This geometry consists of a plane which separates a lower region of soil (density 1.6 g/cm3) and an upper region consisting of air ( 0.0012 g/cm3). The elemental compositions of the soil and air materials followed ref. 11).
The natural potassium radioisotope 40K, the isotopes in three thorium and uranium radionuclide decay chains, and two radiocaesium isotopes common in nuclear accident fallout were considered as terrestrial gamma radiation sources. The source types, their depth distributions within the ground, and the references used for their x-ray and gamma radiation emission data are listed in Table 1.
The photon energy spectra inputted into the simulations for each of the source types are shown in Fig. 1. All photons with energy greater than 10 keV and emission probability greater than 0.1%, according to the references listed in Table 1, were included in the spectra. Photons were emitted isotropically from the source radionuclides.
The natural radionuclides were modelled with constant activity per unit soil mass at all depths. Caesium was modelled as exponentially distributed with soil depth,
, exp / , (1) where [Bq/kg] is the activity per unit soil mass at mass depth [g/cm2], , [Bq/kg] is the activity per unit mass at the ground surface, and [g/cm2] is the relaxation mass per unit area that quantifies the depth of fallout penetration into the ground. The mass depth is
d ′, (2)
where [cm] is the depth below the ground surface. For computational efficiency, the radiation source
volume was scaled to a line within the soil at the centre of the simulation space, and the Monte Carlo tally regions to circular planes at fixed height above the ground and with varying radii 14). This set-up enabled fast calculation of a field of view in terms of contributions from increasing radii cylindrical volumes of soil centred beneath the air dose rate location. Fig. 2 shows the real geometry achieved by this simulation method. The tally response function calculated was the ambient dose equivalent rate, ∗ 10 [µSv/h] 1). Two limitations of simulating the infinite half-space
Figure 1. Photon emission spectra per decay for the different source types. For sources that are a decay chain, the spectra include decay photons from daughter nuclides assumed to be in secular equilibrium and the intensity values shown are applicable per decay of the head isotope in the chain.
Table 1. Radiation sources and their distributions within soil simulated in this work.
Source Depth distrib. Emission data 40K Uniform ICRP 107 12) 232Th series Uniform ICRP 107 12) 235U series Uniform ICRP 107 12) 238U series Uniform ICRP 107 12) 134Cs Exponential NuDat2 13) 137Cs Exponential NuDat2 13)
29

geometry are as follows. First, as the model assumes perfectly flat land it does not account for the radiation shielding provided by any topographic features on the land, such as slopes and mountains, or shielding by vegetation and buildings. The effect of shielding is to decrease the field of view, so the results presented here can be considered as upper bounds for field of view in settings where shielding features are present.
The second limitation is that the model assumes a perfectly uniform distribution of the radionuclides across the land surface. This approximation may be overly simplistic if geological or soil conditions lead to different concentrations of natural radionuclides across an area. Or for anthropogenic radionuclides, atmospheric fallout and subsequent radionuclide absorption and redistribution may be quite heterogeneous, again depending on local conditions. These source distribution effects can widen or narrow the air dose rate field of view depending on a case-by-case basis. The reader should be aware that heterogeneous source distributions may be important in setting the field of view at some locations.
3. Results
The field of view from natural radionuclides distributed homogeneously within the ground and for 134Cs and 137Cs exponentially distributed with depth ( 1.0 g/cm2) are shown in Fig. 3. The graph shows the fraction of ∗ 10 at 1 m above the ground attributable to each of the sources within a radius [m] cylindrical volume of soil below the dose rate point. The data are plotted relative to the ambient dose equivalent rate from a 1000 m radius volume, which is a sufficiently large range for ∗ 10 to reach its asymptotic limit to three significant figures.
The length scale of the field of view is of comparable order of magnitude for all the nuclides. Around 60-80% of the radiation contributing to ∗ 10 originates from within 10 m around the dose rate point. Slowly increasing tails on the graphs mean that it takes 100 m for ∗ 10 to reach 90% of its infinite limit. Radiation contributing to the final 10% of ∗ 10 originates more than 100 m from the dose rate location.
To compare the fields of view of the natural radionuclides with radiocaesium, we consider the source radius contributing to 60% of ∗ 10 . The field of view is narrower for 40K, the 232Th series and the 238U series ( ≃ 4m) than for radiocaesium ( 8m). This is a consequence of the different distributions of the radionuclides within the ground, and because higher energy decay photons (Fig. 1) make the dominant contribution to ∗ 10 for 40K, the 232Th series and the 238U series than for 134Cs and 137Cs. The field of view for 60% of ∗ 10 is wider for the 235U series ( 5.5m) than for the other natural nuclides. This is because of the lower energy decay photons emitted by the 235U series (typically <500 keV} – Fig. 1). It should be noted that in the environment, the 235U series makes a minimal contribution to the total ambient dose equivalent rate from natural terrestrial sources 15). This is because of its low abundance in natural uranium (≃0.7% by mass).
The field of view for the air dose rate from natural terrestrial sources is unlikely to change significantly depending on the relative concentrations of 40K, the 232Th series and the 238U series radioisotopes in the ground. This is because the fields of view for each of these three components are similar (black, red and blue lines in Fig. 3).
Dose Rate Point
r [m]
Air
Soil
h [m]
Figure 2. The field of view for ∗ 10 was calculated in terms of the contribution from the decay of radionuclides within increasing radii volumes of ground beneath the dose rate point.
Figure 3. Comparing the field of view from natural radionuclides, 134Cs and 137Cs.
30

Fig. 4 shows the effect of fallout penetration into the soil on the field of view from 134Cs and 137Cs. The relaxation mass per unit area is shown for the range 0.1-20.0 g/cm2. is typically between 0.1-3.0 g/cm2 in the first year after fallout deposition, increasing to 1.0-7.0 g/cm2 after several years, and then in the range 2.0-20.0 g/cm2 for fallout deposited greater than 10 years previously 9). When considering the source radius contributing to 60% of ∗ 10 , the field of view narrows as fallout radiocaesium weathers deeper into the ground ( decreases from 13.5 m to 4.5 m when increases between 0.1-20.0 g/cm2, Fig. 4).
The effect of elevation above the ground on field of view for ∗ 10 from 134Cs and 137Cs is shown in Fig. 5. Elevating the dose rate point changes the relative distance between different areas of the ground and the dose rate point, and leads to more shielding of the radiation by air. The field of view always widens with increasing height of the dose rate point. It is narrow when the dose rate point is located close to the ground (less than 1 m for 60% of ∗ 10 when 0.01 m). It extends to over 100 m for
the highest elevations studied ( 100 m). In all cases the tail of the distributions mean that 134Cs
and 137Cs at large distances makes a significant contribution to the dose rate. Fallout more than 100 m from the dose rate point needs to be considered for ∗ 10 to reach its asymptotic limit at all dose rate
elevations above the ground. Figs. 3-5 show that the fields of view from 134Cs and
137Cs are almost identical. This is because the dominant photons contributing to ∗ 10 emitted by both isotopes have similar energies (600-800 keV – Fig. 1).
4. Example Applications
4.1 Interpreting KURAMA Car and Bus Survey Data
KURAMA and KURAMA-II are vehicle-borne radiation survey systems deployed on cars and buses within Fukushima Prefecture and across Japan to measure air dose rates 16) 17) 18) 19). They consist of a NaI/CsI scintillator to detect gamma rays, a GPS unit to determine measurement locations, a control computer, and a 3G network connection to transmit results.
In cars, the devices are mounted either above the rear right-side door or behind the headrest of the rear seat 16) 17). In public buses, the systems are placed above the engine bay at the rear of the bus 19). These geometries mean that the systems respond differently to radiation from 134Cs and 137Cs fallout, and to radiation from natural radionuclides when operated in different types of vehicle.
The difference is due to differences in the fields of view between the anthropogenic and the natural radionuclides, and the fact that the bus engine acts as a shield. The effect is depicted in Fig. 6(a). The narrower field of view from natural radionuclides than from 134Cs and 137Cs means that a greater portion of the field of view from natural radionuclides is shielded by the bus engine.
The effect bears out as a different response of the KURAMA systems when mounted in cars and buses between low dose rate areas, where radiation from natural terrestrial radionuclides dominates ( ≈ 0.05 µSv/h), and high dose rate areas (>0.25 µSv/h) with large amounts of 134Cs and 137Cs fallout. The graph in Fig. 6(b) shows how the ratio of the air dose rate within a car to the dose rate above a bus engine bay depends on the level of 134Cs and 137Cs fallout in the environment. The data in Fig. 6(b)
Figure 4. The field of view from 134Cs and 137Cs with varying .
Figure 5. The field of view from 134Cs and 137Cs at various heights above the ground.
31

were generated by PHITS simulations of car and bus geometries placed within the half-space geometry.
In the low dose rate regime, the ratio is high as the dose rate in the bus is lowered by the shielding of gamma rays from natural radionuclides by the bus engine. However, at high dose rates radiocaesium is dominant, and its wider field of view means that the shielding by the bus engine is less important. Thus, the ratio of the air dose rate in the car and the bus is smaller. This effect is also seen in real data from KURAMA operation on vehicles in Fukushima.
The ratio of the dose rates in the car and bus becomes less sensitive to the fallout levels as caesium migrates
deeper into the ground. This is because the field of view of radiocaesium narrows with deeper migration (Fig. 4) and becomes more comparable to the field of view from natural radionuclides. The shielding effect of the bus engine is therefore less important.
4.2 The Effectiveness of Land Remediation
Field of view graphs like Figs. 3-5 can be used to quickly evaluate the effectiveness of land remediation for reducing air dose rates. Fig. 7 demonstrates the technique.
The field of view results show that 68% of the ambient dose equivalent rate attributable to the radiocaesium fallout comes from 134Cs and 137Cs within a 10 m area around the dose rate point. If the land within this area were remediated perfectly, so that no 134Cs and 137Cs remained afterwards, the component of ∗ 10 attributable to radiocaesium would decrease by 68%
It is also possible to account for the effectiveness of the remediation through the decontamination factor (DF). DF is defined as the ratio of the caesium radioactivity in the land before and after remediation. DF values vary between different remediation methods. For DF 20 , 5% of the radioactivity will remain in the land after remediation, and hence the reduction in the 134Cs and 137Cs component of ∗ 10 would be 68% ∙ 100%
5% 64.6%. The field of view graphs thus allow quick calculations
for the order of magnitude of reduction in a dose rate that can be achieved by remediation. More accurate calculations for the effectiveness of remediation can be obtained using a specialist tool to model the land type, topography and local area of the remediation target. An example of such a tool is the calculation system for the
Bus engine
134Cs & 137Cs
40K232Th238U
KURAMAdetector
(a)
Figure 6. (a) The bus engine shields a greater portion of the field of view of natural radionuclides than for 134Cs and 137Cs. Shaded red and yellow volumes illustrate natural and 134/137Cs radionuclides in respective fields of view. (b) Ratio of ∗ 10 at the KURAMA position within a car to within a buses, as a function of environmental radiocaesium levels. Inset text on graph lists outdoor ∗ 10 values. 134Cs/137Cs activity ratio is 0.57, applicable on January 01, 2013.
Figure 7. Using the field of view to evaluate the effectiveness of remediation for reducing ∗ 10 .
32

estimation of decontamination effects (CDE) 20).
5. Conclusions
PHITS simulations were used to characterize the field of view from natural terrestrial radionuclides and anthropogenic cesium fallout in the environment. 134Cs and 137Cs fallout has a wider field of view than the natural radionuclides (excluding 235U series) due to different source positions and characteristic gamma ray energies. The field of view from 134Cs and 137Cs fallout narrows as the radiocaesium migrates deeper into the ground. The 134Cs and 137Cs field of view widens with height of the air dose rate location above the ground.
The differences in the field of view between natural radionuclides and of 134Cs and 137Cs can explain different KURAMA detector responses between low dose rate and high dose rate areas when operated above a bus engine bay. Field of view graphs can be used to make quick calculations for the reduction in air dose rates before and after land remediation.
Acknowledgements
We acknowledge fruitful discussions with M. Tanigaki, D. C. W. Sanderson and JAEA colleagues. Calculations were performed on JAEA's BX900 supercomputer.
References 1) ICRP Publ. 74. "Conversion Coefficients for use in
Radiological Protection against External Radiation", Ann. ICRP 26(3-4), 1 (1996).
2) J. H. Hubbell and S. M. Seltzer. "Tables of X-Ray Mass Attenuation Coefficients and Mass Energy-Absorption Coefficients from 1 keV to 20 MeV for Elements Z = 1 to 92 and 48 Additional Substances of Dosimetric Interest", NISTIR 5632 (2004). (http://www.nist.gov/pml/data/xraycoef/, accessed 26 May 2015)
3) J. D. Allyson. "Environmental γ-ray Spectrometry: Simulation of Absolute Calibration of In-Situ and Airborne Spectrometers for Natural and Anthropogenic Sources", Ph.D. thesis, The University of Glasgow (1994). (http://theses.gla.ac.uk/2028/1/1994allysonphd.pdf, accessed 26 May 2015)
4) A. N. Tyler et al. "Accounting for spatial variability and fields of view in environmental gamma ray spectroscopy", J. Environ. Radioactiv. 33, 213
(1996). 5) Y. Iwamoto et al. "Study on Soil Decontamination
and Dose Rate Reduction Effect", JAEA-Technology 2011-026 (2011).
6) K. Saito. “External Doses due to Terrestrial Gamma Rays on the Snow Cover”, Radiat. Prot. Dosim. 35(1), 31 (1991).
7) K. Saito and P. Jacob. "Gamma Ray Fields in the Air Due to Sources in the Ground", Radiat. Prot. Dosim. 58(1), 29 (1995).
8) K. Saito and P. Jacob. "Fundamental Data on Environmental Gamma-Ray Fields in the Air due to Sources in the Ground", JAERI-Data/Code 98-001 (1998).
9) T. Sato et al. "Particle and Heavy Ion Transport code System, PHITS, version 2.52", J. Nucl. Sci. Technol. 50(9), 913 (2013).
10) ICRU Publ. 53. "Gamma-Ray Spectrometry in the Environment" (1994).
11) K. F. Eckerman and J. C. Ryman. "External Exposure to Radionuclides in Air, Water, and Soil", EPA-402-R-93-081 Federal Guidance Report No. 12, U. S. Environmental Protection Agency (1993). (http://www.epa.gov/radiation/docs/federal/402-r-93-081.pdf, accessed 26 May 2015)
12) ICRP Publ. 107. "Nuclear Decay Data for Dosimetric Calculations", Ann. ICRP 38(3), 1 (2008).
13) NuDat2. "Software to search and plot nuclear structure and decay data interactively. Employs data from the Evaluated Nuclear Structure Data File (ENSDF)". (http://www.nndc.bnl.gov/nudat2/, accessed 13 May 2014)
14) Y. Namito et al. "Transformation of a system consisting of plane isotropic source and unit sphere detector into a system consisting of point isotropic source and plane detector in Monte Carlo radiation transport calculation", J. Nucl. Sci. Technol. 49(2), 167 (2012).
15) UNSCEAR. "Sources, Effects and Risks of Ionizing Radiation, 2000 Report, Volume I" (2000). (http://www.unscear.org/unscear/en/publications/2000_1.html, accessed 26 May 2015)
16) M. Tanigaki et al. "Development of a car-borne survey system, KURAMA", Nucl. Instrum. Methods Phys. Res. Sect. A 726, 162 (2013).
17) M. Andoh et al. "Measurement of air dose rates over a wide area around the Fukushima Dai-ichi Nuclear Power Plant through a series of car-borne surveys", J.
33

Environ. Radioactiv. 139, 266 (2014). 18) S. Tsuda et al. "Characteristics and verification of a
car-borne survey system for dose rates in air: KURAMA-II", J. Environ. Radioactiv. 139, 260 (2014).
19) M. Tanigaki et al. "Development of KURAMA-II and its operation in Fukushima", Nucl. Instrum. Methods Phys. Res. Sect. A 781, 57 (2015).
20) D. Satoh et al. "Development of a calculation system for the estimation of decontamination effects", J. Nucl. Sci. Technol. 51(5), 656 (2014).
34

Study on applicability of CdZnTe semiconductor detector to in situ environmental radioactivity
measurement in high dose rate areas
Munehiko KOWATARI 1)*, Takumi KUBOTA2), Yuji SHIBAHARA2), Toshiyuki FUJII2), Koichi TAKAMIYA2), Satoru MIZUNO3), Hajimu
YAMANA2)
1) Department of Radiation Protection, Nuclear Science Research Institute, Japan Atomic Energy Agency, 2-4Shirakata, Tokai, Naka, Ibaraki 319-1195, JAPAN
2) Research Reactor Institute, Kyoto University, Kumatori, Osaka 590-0494, JAPAN3) Nuclear Power Safety Division, Fukushima Prefectural Government, Fukushima, Fukushima 960-8670, JAPAN
There have still been difficulties for decontamination and remediation works in Fukushima regions. This article describes a series of investigation on characteristics of a small and light detector, CdZnTe semiconductor detector to apply for in situ environmental radioactivity measurement. Less sensitivity to gamma rays with greater than 1 MeV and low resolution of peak identification of pulse height spectra for the CZT detector turned out to be advantageous when measuring spectrometry in regions where higher dose equivalent rates are observed. A series of performance tests indicates that the CZT detector is the promising candidate for verification of the effect of decontamination even in regions whose dose equivalent rates exceed more than 40 micro Sv h-1.
Key Words:CdZnTe detector, in situ gamma ray environmental measurement, 137Cs, 134Cs,dose rate,
1. Introduction
Verification of the effect should be properly implemented after decontamination works. Decrease of dose equivalent rates may not be always proof as a successful decontamination in the areas. This is because dosimeters could not distinguish the energy and the direction of gamma rays coming from the environment. For determining surface deposition densities on soil, an in situ environmental radioactivity measurement using gamma ray spectrometers like Ge semiconductor detector is a quite powerful method1), 2), besides radioactivity measurement in laboratory with sampling. The in situ environmental radioactivity measurement also is a promising method to verify the effect of decontamination, because the method allows us to directly identify surface deposition densities of radioactive materials left on the surface of interest, obtaining and interpreting pulse height spectra. However, high dose equivalent rate due to gamma rays emitted from radioactive materials as contaminants largely affects proper spectrometry using highly sensitive Ge detectors. The authors investigated the applicability of a newly developed
CdZnTe semiconductor detector (CZT detector) to in situ
environmental radioactivity measurement in deeply contaminated region where high dose equivalent rate with more than few tenth micro Sv h-1 have been observed. Decontaminating radioactive materials as quick as possible is imperative for remediation and revival in these areas. There has been still difficulty in decontamination due to high dose equivalent rate in the atmosphere. Comparing Ge detectors generally used for in situ environmental radioactivity measurement, the CZT detector has less sensitivity to gamma rays and low resolution of pulse height spectrum. It is expected, however, that less sensitivity to gamma rays enhance the upper limit of dose equivalent rate available. In addition, the CZT detector is a USB-powered, small, light and easy-to-use detector assembly. The measurement operation is limited in high dose equivalent rate areas due to the limitation of exposure to workers. The characteristic of the CZT detector allows to shorten residence time in the region. A series of experiments and Monte Carlo calculations was
performed to evaluate specific features of the CZT detector for in situ environmental radioactivity measurement. A peak efficiency curve was evaluated to convert peak areas obtained in pulse height spectra into surface deposition density on soil for radioactive materials of
35

interest. Angular dependences of peak efficiency to incident gamma rays with various energies were also evaluated for accurate determination of surface deposition density. In this study, special attention was paid to 134Cs and 137Cs. This is because these contaminants have been still predominant in the areas and largely contributes to dose equivalent rate in the environment. Air kerma rates from obtained pulse height spectra were estimated as well. It would be more informative and helpful if surface deposition density on soil and air kerma rate at the measurement point were to be obtained at the same time from the same spectrum. This must enhance the characteristics of the CZT detector for rapid and easy in situ environmental radioactivity measurement and long term monitoring in deeply contaminated areas.
2. Materials and Methods
(1) CdZnTe semiconductor detector
A promising candidate CdZnTe semiconductor detector (CZT detector) was selected for a detector used in situ radioactivity measurement in high dose equivalent rate areas. Figure 1 shows the appearance of the CZT detector used in the study. The dimension of the CdZnTe semiconductor is 10 × 10 × 10 mm3. All electronics including ADC and amplifiers are assembled in the aluminum-made chassis depicted in the Figure 1. The CZT detector has a thin entrance window in front of the CdZnTe semiconductor and electronics for signal processing and DC supply is installed behind the semiconductor. Between the semiconductor and the electronics, an aluminum-made partition plate was set inside the chassis. The CZT detector has an excellent sensitivity to gamma / X rays with
energies below 100 keV, and usually used for diagnostic purposes in
the medical fields. However, the CZT detector does not have enough sensitivity to gamma rays with energies higher than 1 MeV which is asked to monitor in the guidelines regarding environmental measurement provided by the authorities. In the environment, there are potentially gamma ray emitters whose gamma ray energies exceed 1 MeV, such as 40K (1460 keV), 208Tl (2605 keV) and so on. Gamma rays from these natural radionuclides interfere identification of
anthropogenic radioactive materials like 134Cs and 137Cs in affected areas. Using the CZT for gamma ray spectrometry in the environment will exclude background components inherently due to its low sensitivity to gamma rays with energies greater than 1 MeV. Energy dependence of peak efficiency and angular dependence of
peak efficiency must be evaluated in order to determine surface deposition density on soil. Peak efficiency for incident gamma ray, N0/φ (cps (cm-2 s-1)-1), is obtained by dividing peak area of interest by gamma ray fluence rate at the measurement point. Checking radioactive sources, such as 152Eu, 60Co and 137Cs was used for measurement of peak areas and simulations were performed using the Monte Carlo code the EGS 4. The angular dependence of a net peak area was also measured by the same checking sources and calculated using the MCNP-4C Monte Carlo calculation code. The same geometry for the CZT detector was used in both EGS 4 and MCNP-4C code. Almost identical relative peak efficiencies with 0 degree were obtained from both Monte Carlo calculation codes, applying the same geometry.
(2) Estimation of air kerma rate from pulse height spectrum
Gamma ray spectrometry in the environment allows us to provide useful information, by interpreting obtained spectra. Besides calculation of identified peak areas for determination of surface deposition density on soil, air kerma rates at measurement points can be estimated from the same spectra. Evaluating dose rate in the atmosphere using the same pulse height spectra would enhance information on measurement points, help shorten staying time in higher-dose rate areas and facilitate a long term monitoring of heavily contaminated areas. In this study, by using the same spectra obtained by the CZT detector,
air kerma rates at measurement point were estimated by the G(E) function method3), besides estimation of air kerma rates by measured surface contamination densities on soil. The G(E) function method enables us to directly determine air kerma rates from the accumulated pulse height spectra, by applying the operator defined “G(E) function” to obtained pulse height spectra. The method is also taken advantage of direct determination of air kerma rates which the effect of scattered gamma ray components is included. The G(E) function for the CZT detector was derived from the calculated responses matrix of the CZT detector to mono-energetic gamma rays ranging from 50 keV to 3 MeV as well. The EGS4 was also used for the calculation. For estimating air kerma, the fluence-to-air-kerma conversion coefficient was taken from ICRP 74 4). Applying derived G(E) function to pulse height spectrum of the CZT detector obtained in the 137Cs calibration field in the Facility of Radiation Standards in Japan Atomic Energy Agency (JAEA), ambient dose equivalent rate in the 137Cs calibration
Figure 1 appearance of the CZT detector (Kromek GR1TM )
36

field was estimated and compared with reference value. The ambient dose equivalent rate obtained from the CZT detector was estimated to be 57.5 μSv h-1 and was in quite good agreement with reference value, 56.3 μSv h-1. For comparison, a preliminary field test was also conducted in open field in JAEA where little radioactive contaminants were left. The ambient dose equivalent rate was estimated to be 0.12 μSv h-1, from a measured spectrum obtained by the CZT detector. Comparing with the result obtained by the conventional NaI(Tl) scintillation survey-meter (0.1 μSv h-1), estimated ambient dose equivalent rate seems consistent.
3. Results and discussion
(1) Characteristics of CZT detector for in situ environmental measurement
Figure 2 shows measured and calculated peak areas per unit gamma ray fluence as a function of gamma ray energy. In the energy region around 100 keV, a calculated peak efficiency reaches up to almost 0.9. On the other hand, quite low efficiencies with energies greater than 1500 keV were obtained. Value for gamma ray with energy of 1460 keV is calculated to be around 0.02. This supports that the CZT detector has less sensitivity to energetic gamma ray from 40K and/or 208Tl. Value for gamma ray from 137Cs (662 keV) was obtained to be 0.06 and one-tenth of conventional Ge detector used for in situ environmental radioactivity measurement. Figure 3 shows the angular dependence of a relative net peak area for
full energy absorption to incident gamma rays with various eneries up to 1333 keV. In Figure 3, 0 degree corresponds to a direction of the detector axis and 90 degree is a horizontal direction to the ground. Values in the figure were normalized by those obtained at 90 degree. From the Monte Carlo calculations results by MCNP-4C, relatively high peak efficiencies were observed between 40 and 50 degrees for gamma rays with energies of 60 and 122 keV. On the other hand, almost identical peak efficiencies were obtained regardless of incident
angle for higher energy gamma rays greater than 365 keV. Measured results were also found to be within 20% of those obtained at 90 degree.
(2) Field test of in situ environmental radioactivity measurement using a CZT detector
Figure 4 shows the comparison of pulse height spectra obtained by the CZT detector and the conventional Ge detector. Both were obtained at the same plain and open field in JAEA and detectors were set at the height of 1 m so that the detector axes can be vertical to ground surface. As expected before, pulse height spectrum obtained by a CZT detector was ten times lower than those obtained by the Ge detector. This clearly reflects the differences of sensitivity to gamma rays. Peaks due to gamma rays due to 134Cs and 137Cs are clearly found in both spectra. However there is no identified peak around 1460 keV due to gamma rays from 40K in the spectrum by the CZT detector. This might be a crucial disadvantage for natural radionuclides measurement. In contrast, this low sensitivity leads to suppressed background levels when determining surface deposition densities on soil for 134Cs and 137Cs from identified peaks. In order to demonstrate the performance of in situ environmental
radioactivity measurement using the CZT detector, surface deposition
Figure 2 measured and calculated energy dependence of peak efficiency of the CZT detector
Figure 3 angular dependence of relative net peak area to gamma ray with various energies
Figure 4 comparison of pulse height spectra obtained by the CZT detector and the Ge detector measured in JAEA, Tokai
37
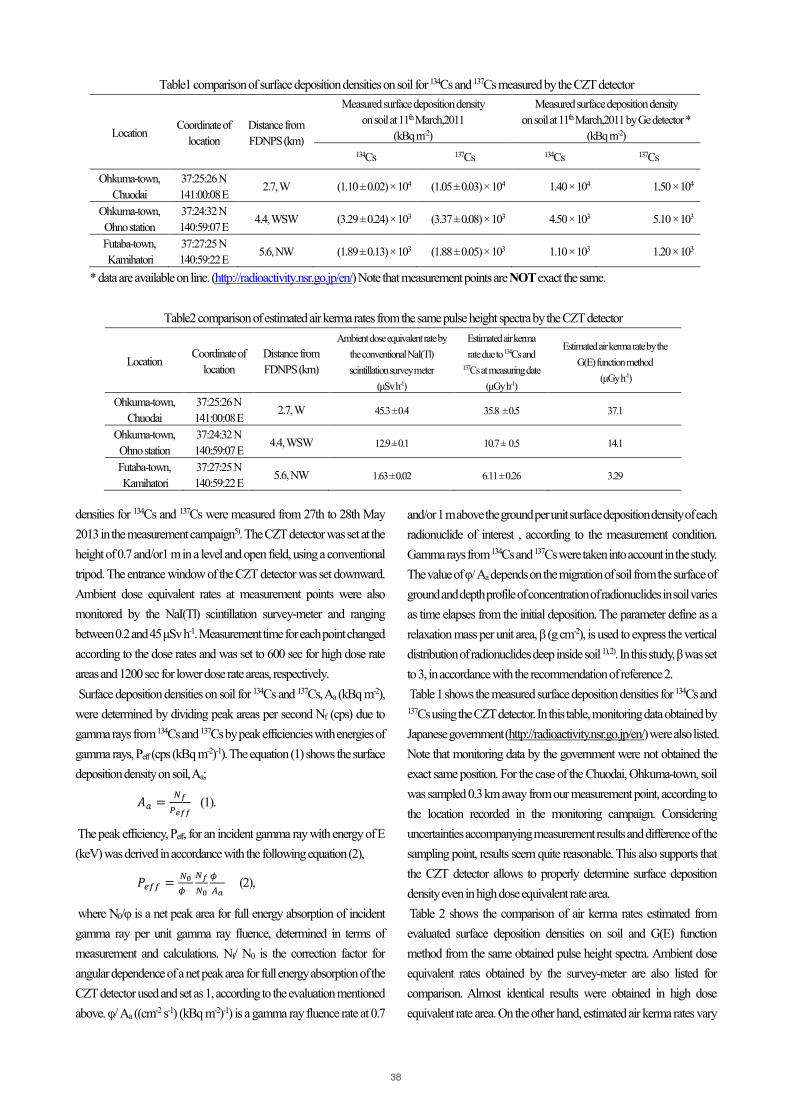
densities for 134Cs and 137Cs were measured from 27th to 28th May 2013 in the measurement campaign5). The CZT detector was set at the height of 0.7 and/or1 m in a level and open field, using a conventional tripod. The entrance window of the CZT detector was set downward. Ambient dose equivalent rates at measurement points were also monitored by the NaI(Tl) scintillation survey-meter and ranging between 0.2 and 45 μSv h-1. Measurement time for each point changed according to the dose rates and was set to 600 sec for high dose rate areas and 1200 sec for lower dose rate areas, respectively. Surface deposition densities on soil for 134Cs and 137Cs, Aa (kBq m-2), were determined by dividing peak areas per second Nf (cps) due to gamma rays from 134Cs and 137Cs by peak efficiencies with energies of gamma rays, Peff (cps (kBq m-2)-1). The equation (1) shows the surface deposition density on soil, Aa;
𝐴𝐴𝑎𝑎 = 𝑁𝑁𝑓𝑓𝑃𝑃𝑒𝑒𝑓𝑓𝑓𝑓
(1).
The peak efficiency, Peff, for an incident gamma ray with energy of E (keV) was derived in accordance with the following equation (2),
𝑃𝑃𝑒𝑒𝑒𝑒𝑒𝑒 = 𝑁𝑁0𝜙𝜙
𝑁𝑁𝑓𝑓𝑁𝑁0
𝜙𝜙𝐴𝐴𝑎𝑎
(2),
where N0/φ is a net peak area for full energy absorption of incident gamma ray per unit gamma ray fluence, determined in terms of measurement and calculations. Nf/ N0 is the correction factor for angular dependence of a net peak area for full energy absorption of the CZT detector used and set as 1, according to the evaluation mentioned above. φ/ Aa ((cm-2 s-1) (kBq m-2)-1) is a gamma ray fluence rate at 0.7
and/or 1 m above the ground per unit surface deposition density of each radionuclide of interest , according to the measurement condition. Gamma rays from 134Cs and 137Cs were taken into account in the study. The value of φ/ Aa depends on the migration of soil from the surface of ground and depth profile of concentration of radionuclides in soil varies as time elapses from the initial deposition. The parameter define as a relaxation mass per unit area, β (g cm-2), is used to express the vertical distribution of radionuclides deep inside soil 1), 2). In this study, β was set to 3, in accordance with the recommendation of reference 2. Table 1 shows the measured surface deposition densities for 134Cs and 137Cs using the CZT detector. In this table, monitoring data obtained by Japanese government (http://radioactivity.nsr.go.jp/en/) were also listed. Note that monitoring data by the government were not obtained the exact same position. For the case of the Chuodai, Ohkuma-town, soil was sampled 0.3 km away from our measurement point, according to the location recorded in the monitoring campaign. Considering uncertainties accompanying measurement results and difference of the sampling point, results seem quite reasonable. This also supports that the CZT detector allows to properly determine surface deposition density even in high dose equivalent rate area. Table 2 shows the comparison of air kerma rates estimated from evaluated surface deposition densities on soil and G(E) function method from the same obtained pulse height spectra. Ambient dose equivalent rates obtained by the survey-meter are also listed for comparison. Almost identical results were obtained in high dose equivalent rate area. On the other hand, estimated air kerma rates vary
Table1 comparison of surface deposition densities on soil for 134Cs and 137Cs measured by the CZT detector
Location Coordinate of
location Distance from FDNPS (km)
Measured surface deposition density on soil at 11th March,2011
(kBq m-2)
Measured surface deposition density on soil at 11th March,2011 by Ge detector *
(kBq m-2) 134Cs 137Cs 134Cs 137Cs
Ohkuma-town, Chuodai
37:25:26 N 141:00:08 E
2.7, W (1.10 ± 0.02) × 104 (1.05 ± 0.03) × 104 1.40 × 10⁴ 1.50 × 10⁴
Ohkuma-town, Ohno station
37:24:32 N 140:59:07 E
4.4, WSW (3.29 ± 0.24) × 103 (3.37 ± 0.08) × 103 4.50 × 10³ 5.10 × 10³
Futaba-town, Kamihatori
37:27:25 N 140:59:22 E
5.6, NW (1.89 ± 0.13) × 103 (1.88 ± 0.05) × 103 1.10 × 10³ 1.20 × 10³
* data are available on line. (http://radioactivity.nsr.go.jp/en/) Note that measurement points are NOT exact the same.
Table2 comparison of estimated air kerma rates from the same pulse height spectra by the CZT detector
Location Coordinate of
location Distance from FDNPS (km)
Ambient dose equivalent rate by the conventional NaI(Tl) scintillation survey meter
(μSv h-1)
Estimated air kerma rate due to 134Cs and
137Cs at measuring date (μGy h-1)
Estimated air kerma rate by the G(E) function method
(μGy h-1)
Ohkuma-town, Chuodai
37:25:26 N 141:00:08 E
2.7, W 45.3 ± 0.4 35.8 ± 0.5 37.1
Ohkuma-town, Ohno station
37:24:32 N 140:59:07 E
4.4, WSW 12.9 ± 0.1 10.7 ± 0.5 14.1
Futaba-town, Kamihatori
37:27:25 N 140:59:22 E
5.6, NW 1.63 ± 0.02 6.11 ± 0.26 3.29
38

with methods for results in low dose equivalent rate area. The overestimation of air kerma rate obtained by surface deposition densities on soil might be explained by low counting rates of peak areas. Low counting rates may lead to difficulty in identification of each peak and their higher counting errors. Results also imply that determination of the surface deposition density and the air kerma rate by the CZT detector should be applied only in relatively high dose equivalent rete areas.
4. Summary
A CdZnTe semiconductor detector (CZT detector) tuned out to be a promising candidate as a detector applied for in situ radioactivity measurement in high dose equivalent rate areas, throughout the investigation by means of a series of experiments and the Monte Carlo simulation techniques. Before the field tests in Fukushima areas, the energy dependence of peak efficiency and the angular dependence of peak efficiency for the CZT detector were measured using sealed radioactive sources in laboratory. Field tests were then carried out in JAEA and Fukushima areas. From pulse height spectra obtained by a field test, surface deposition densities on soil for 134Cs and 137Cs were evaluated and compared with those obtained by monitoring campaign organized by the Japanese government. Results of surface deposition densities on soil for 134Cs and 137Cs seemed reasonable, considering uncertainties accompanying measurement results and difference in the location. Using the same pulse height spectra, air kerma rates at measurement places were also estimated by G(E) method and from estimated surface deposition densities on soil. Results of estimated air kerma rates show that a reasonable air kerma rate would be obtained even in in regions whose dose equivalent rates exceed more than 40 μSv h-1. A series of performance tests also strongly supports the applicability of the CZT detector to in situ environmental radioactivity measurement for verification of the effect of decontamination works and an easy and effective long-term monitoring in deeply contaminated areas.
Acknowledgements
The authors thank all staff members of Hotel Matsushimaya Ryokan in Fukushima-city for their heart-warming hospitality and continuing support for our research project.
Funding
This research work was supported by the KUR Research Program for Scientific Basis of Nuclear Safety.
39
References 1) Beck, H. L., DeCampo, J. and Gogolak, C. In situ
Ge(Li) and NaI(Tl) gamma-ray spectrometry for the measurement of environmental radiation. USAEC Report HASL-258 (New York, NY: USAEC) (1972).
2) International Commission on Radiation Units andMeasurements. Gamma-ray spectrometry in the environment. ICRU Report 53 (Bethesda, MD: ICRU) (1994).
3) Moriuchi, S and Miyanaga, I., A Method of PulseHeight Weighting Using the Discrimination Bias Modulation. Health Phys. 12(10), 1481-1487 (1966).
4) International Commission on RadiologicalProtection (ICRP), Conversion coefficients for use in radiological protection against external radiation. ICRP Publication 74 Ann. ICRP 27(4), Pergamon Press, London and New York (1997).
5) Shibahara, Y., Kubota. T., Fujii. T., et al. Analysisof cesium isotope compositions in environmental samples by thermal ionization mass spectrometry - 1. A preliminary study for source analysis ofradioactive contamination in Fukushima prefecture. J. Nucl. Sci. Technol., 51 (5), 575-579 (2014).

Prediction of Ambient Dose Equivalent Rates for the Next 30 Years After the Accident
Sakae KINASE1)*, Tomoyuki TAKAHASHI2), Satoshi SATO1),Hideaki YAMAMOTO1), Kimiaki SAITO1)
1) Japan Atomic Energy Agency Tokai-mura, Naka-gun, Ibaraki2) Kyoto University Kumatori-cho, Osaka
To support recovery and rehabilitation in Fukushima, prediction models have been developed for ambient dose equivalent rate distribution within the 80 km-radius around the Fukushima Daiichi nuclear power plant. The prediction models that are based on bi-exponential functions characterized by ecological half-lives of radioactive caesium for land-use, enable Fukushima residents to obtain distribution maps of ambient dose equivalent rates for the next 30 years after the accident. Model parameters such as the ecological half-life of the short-term component and the fractional distribution of the short-term component were evaluated using ambient dose equivalent rates through car-borne surveys. The ecological half-lives for the short-term component and the fractional distributions of the short-term component in deciduous and evergreen forest areas were found to be different from those in other areas. In addition, it was found that distribution maps of ambient dose equivalent rates for the next 30 years after the accident, created by the prediction models would be useful for follow-up of the radiological situation since they provide information on the space variation of the ambient dose equivalent rates in inhabited areas.
Keywords: ambient dose equivalent rate, ecological half-life, prediction model
1. IntroductionIt is essential to establish a radiation monitoring system allowing
follow-up of the radiological situation in long-term contaminated areas1). To assess current levels of contamination and its space and time distribution, radiation monitoring such as car-borne, airborne, measurements using survey meters has been performed after the Fukushima accident in 20112). At the Japan Atomic Energy Agency (JAEA), to assess the evolution of the long-term exposure situation after the Fukushima accident, prediction models have been developed for ambient dose equivalent rate distribution within 80 km-radius around the Fukushima Daiichi nuclear power plant3) - 5). The prediction models were expressed using bi-exponential functions characterised by ecological half-lives -the time for half the radioactive caesium to disappear from the local environment due to natural removal phenomena and human activites- for land-use. In the present study, ecological half-lives of the short-term component and the
fractional distributions of the short-term component were re-evaluated using ambient dose equivalent rates through car-borne surveys. In addition, distribution maps of ambient dose equivalent rates for the next 30 years after the accident were created using the prediction models in conjunction with the updated model parameters within the 80 km-radius around the Fukushima Daiichi nuclear power plant.
2. Materials and methods(1) Radiation monitoring
Radiation measurements have been carrioud out using various mobile systems such as car-borne, airborne and simply walking on the ground after the Fukushima accident2). In particular, ambient dose equivalent rates over wide areas in northeastern Japan were measured through a series of car-borne surveys. Eight car-borne surveys were carried out by JAEA in collaboration with many organizations until the middle of 2014: The first survey (June 4-13, 2011), the second
40

survey (December 5-28, 2011), the third survey (March 13-30, 2012), the fourth survey (from August 20 to October 12, 2012), the fifth survey (from November 5 to December 10, 2012), the sixth survey (from June 11 to July 19, 2013), the seventh survey (from November 5 to December 12, 2013) and the eighth survey (from June 23 to August 8, 2014). The ambient dose equivalent rates obtained using the KURAMA II systems in moving car were converted to those outside the car6). Inside the evacuation order areas, seventeen car-borne surveys were also performed under the comprehensive monitoring plan7).
(2) Prediction models and model parameters According to previous studies on prediction models8)-11), the
change with time in the ambient dose equivalent rate contribution from radioactive caesium on grounds can be expressed using the following equation:
𝑌(𝑡) = 𝑌(0) �αshortexp � −ln2Tshort
∙ 𝑡�
+ (1 − αshort)exp �−ln2Tlong
∙ 𝑡��
∙ 𝑘exp(−λ134∙𝑡)+exp(−λ137∙𝑡)𝑘+1
+ 𝑌BG (1)
where Y(t) is the ambient dose equivalent rate at time t; Y(0) is the ambient dose equivalent rate at time zero; αshort is the fractional distribution of the short-term component; Tshort is the ecological half-life of the short-term component; Tlong is the ecological half-life of the long-term component, 92y; λ134 and λ137 are the physical decay constants of 134Cs and 137Cs, respectively; k is the ambient dose equivalent rate ratio of 134Cs to 137Cs at time zero, 2.7(as of March 15, 2011); YBG is background radiation.
The model parameters such as the ecological half-lives of the short-term component and the fractional distributions of the short-term component were evaluated using the changes with time in ambient dose equivalent rates through the car-borne surveys. They were obtained from the best curve fit when plotting the ambient dose equivalent rates over time. To identify key parameters in the prediction models, the model parameters were categorized according to land-use/land-cover. The categories were made using the precise land-use and land-cover map by the advanced land observing satellite “Daichi” (ALOS)12). Eight categories were classified: water, urban, paddy, crop, grass, deciduous forest, evergreen forest and bare surface in ALOS.
(3) Distribution maps of ambient dose equivalent rates Distribution maps of ambient dose equivalent rates within the 80
km-radius around the Fukushima Daiichi nuclear power plant were
created using the prediction models. The maps were made for the next 5, 10 and 30 years after the accident. To predict ambient dose equivalent rates within living areas, corrections were made to the initial ambient dose equivalent rates obtained using the mobile systems. That is, the ambient dose equivalent rates obtained using the mobile systems were corrected using the relationship of ambient dose equivalent rates between those on roads and those around roads so as to be consistent with those within living areas2). On the maps relative to the categories in ALOS, the ambient dose equivalent rates including the background radiations were indicated using image colors in 100m mesh units.
3. Results and discussion(1) Model parameters
Cumulative distribution functions of the ecological half-lives of the short-term component Tshort were obtained for both inside and outside the evacuation order areas. For inside the evacuation order areas consisting of the difficult to return, the restricted residence and the cancel preparation areas, the cumulative distribution functions of Tshort were plotted in Fig. 1 (a), based on whether or not the land-use area falls under deciduous and evergreen forest areas. On the other hand, the cumulative distribution functions of Tshort for outside the evacuation order areas were plotted for each land-use in Fig. 1 (b). From the figures it can be stated that the model parameters in deciduous and evergreen forest areas are different from those in other areas. In a similar fashion, cumulative distribution functions of the fractional distributions of the short-term component αshort for inside and outside the evacuation order areas were plotted in Figs. 2 (a) and (b), respectively. In view of the current situation that there are differences of human actitities among the areas, the model parameters for areas where human activities occur might change.
(2) Distribution maps of ambient dose equivalent rates Figures 3 (a)-(c) show the distribution maps of ambient dose
equivalent rates for the next 5, 10 and 30 years after the accident. These maps provide the radiological situation based on the prediction models in conjunction with the 50th percentile model parameters. The figures indicate the ambient dose equivalent rates over 0.2 μSv/h. It was found from a comparison with the results that the ambient dose equivalent rates decrease certainly. The ambient dose equivalent rates in 2015 might decrease to one fourth of those values by 2041. It is concluded that the distribution maps of ambient dose equivalent rates for the next 30 years after the accident would be essential information to support the implementation of all protection strategies after the Fukushima accident.
4. ConclusionsPrediction models for ambient dose equivalent rate within 80 km-
41

radius around the Fukushima Daiichi nuclear power plant have been developed using bi-exponential functions characterised by ecological half-lives. Model parameters were obtained for each land-use. The ecological half-lives of the short-term component and the fractional distributions of the short-term component would be changeable by human activities. In addition, distribution maps of ambient dose equivalent rates were created for the next 30 years after the accident. It was found that the distribution maps would be useful for follow-up of the radiological situation after the Fukushima accident. We plan in the near future to update the prediction models using bi-exponential functions.
ACKNOWLEDGEMENT This study was conducted in a government-commissioned
research project from the Nuclear Regulation Authority of Japan. The distribution maps of ambient dose equivalent rates for the next 5, 10, and 30 years after the accident can be created on knowledge that has been obtained in the project.
References
(a) inside the evacuation order areas.
(b) outside the evacuation order areas.
Figs. 1 Cumulative distribution functions of the ecological half-lives of the short-term component Tshort.
42
1) ICRP, Application of the commission’s recommendations to the protection of people living in long-term contaminated areas after a nuclear accident or a radiation emergency, ICRP Publication 111. Ann. ICRP 39(3) (2009).
2) Nuclear Regulation Authority, Monitoring information ofenvironmental radioactivity level, Online. Available: http://radioactivity.nsr.go.jp/ja/list/560/list-1.html (2015, August 6) (in Japanese).
3) Kinase, S, Takahashi, T., Sato, S., Sakamoto, R., Saito, K.,Development of prediction models for radioactive caesium distribution within the 80-km radius of the Fukushima Daiichi nuclear power plant, Radiat. Prot. Dosim., 160(4), 318-321 (2014).
Ecological half-life of radioactive caesium within the 80 km radius of the Fukushima Daiichi nuclear power plant, Online.Available: http://www.irpa2014europe.com/wpcontent/uploads/2014/07/IRPA2014_AbstractBook_22-07-14.pdf(2014, July 14) .
5) Kinase, S, Sato, S., Sakamoto, R., Yamamoto, H., Saito, K., Changes in ambient dose equivalent rates around roads at Kawamata after the Fukushima accident, Radiat. Prot. Dosim. doi:10.1093/rpd/ncv275.
6) Tanigaki, M., Okumura, R., Takamiya, K., Sato, N.,Yoshino, H. and Yamana, H. Development of a car-borne γ-ray survey system, KURAMA, Nucl. Instr. Meth. A, 726, 162-168 (2013).
7) Ministry of Economy, Trade and Industry, METI measuresand requests in response to the great east Japan earthquake, Online.Available: http://www.meti.go.jp/earthquake/nuclear/20140527_01. html
8) Gale, H. J., Humphreys, D. L. O., Fisher, E. M. R.,Weathering of caesium-137 in soil, Nature, 4916, 257-261 (1964).
9) Jacob, P., Meckbach, R., Muller, H. M., Meimberg, K.,Abnahme der abgelagerten kunstlichen radioaktvitat in stadtischer umgebung, GSF-Bericht 17/90 (1990).
10) Sprung, J. L., Rollstin, J. A., Helton, J. C., and Jow, H-N,Evaluation of Severe Accident Risks: Quantification of Major Inpu Parameters, MACCS Input, NUREG/CR-4551 SAND86-1309 Vol.2, Rev.1, Part 7, Sandia National Laboratories, Albuquerque (1990).
11) Andersson, K. G. and Roed, J., Estimation of doses received in a dry-cntaminated residential area in the Bryansk region, Russia, since the Chernobyl accident, J. Environ. Radioact., 85, 228-240 (2006).
12) Japan Aerospace Exploration Agency, Advanced land Available: observing satellite, Online.
http://www.eorc.jaxa.jp/ ALOS/en/index.htm (2013, July 31).
4) Kinase, S, Sato, S., Takahashi, T., Sakamoto, R., Saito, K.,
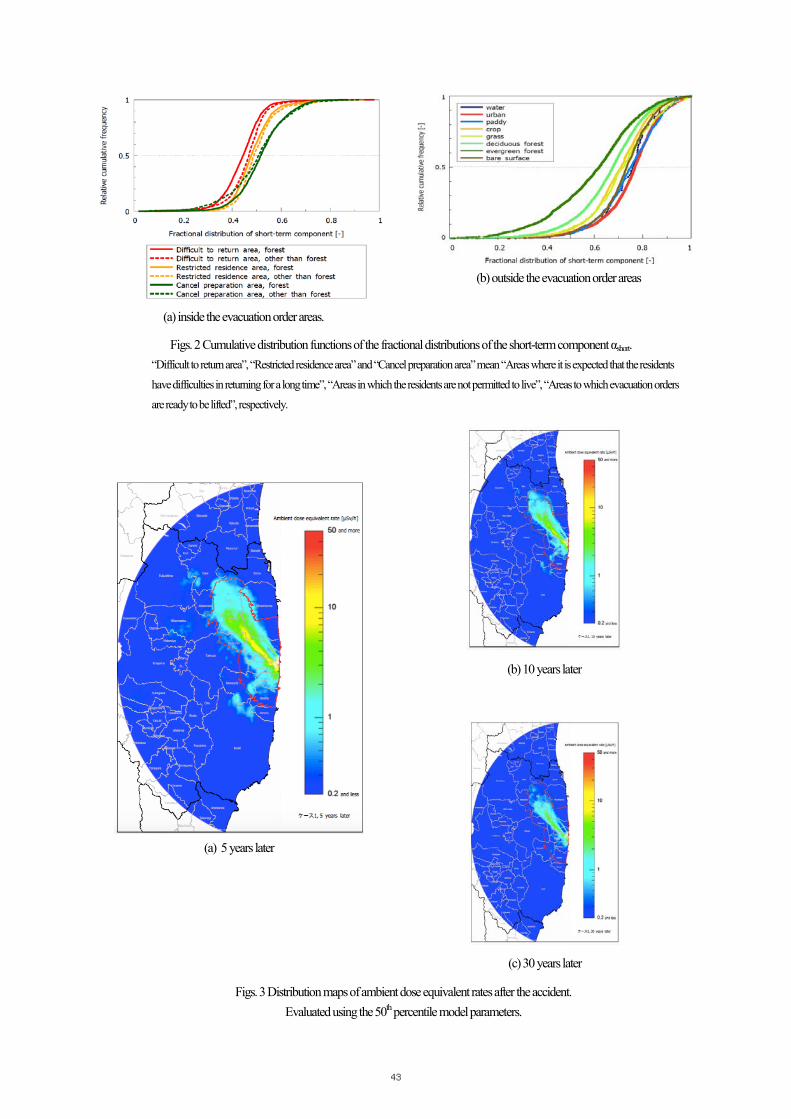
(b) outside the evacuation order areas
(a) inside the evacuation order areas.
(a) 5 years later
(c) 30 years later
(b) 10 years later
Figs. 3 Distribution maps of ambient dose equivalent rates after the accident. Evaluated using the 50th percentile model parameters.
Figs. 2 Cumulative distribution functions of the fractional distributions of the short-term component αshort. “Difficult to return area”, “Restricted residence area” and “Cancel preparation area” mean “Areas where it is expected that the residents
have difficulties in returning for a long time”, “Areas in which the residents are not permitted to live”, “Areas to which evacuation orders
are ready to be lifted”, respectively.
43

Part 3
Environmental radioactivity/internal exposure


Effect of nitrogen and potassium fertilization on radiocesium absorption in soybean
Naoto NIHEI1)*, Atsushi HIROSE1), Keitaro TANOI1), Tomoko M. NAKANISHI1)
1) Graduate School of Agricultural and Life Science, The University of Tokyo,1-1-1 Yayoi, Bunkyo-ku, Tokyo 113-8657 JAPAN
* anaoto@ mail.ecc.u-tokyo.ac.jp
Radioactive materials that were released during the nuclear accident contaminated the soil and agricultural products. It has become clear that potassium fertilization is effective for the reduction of radiocesium concentrations in agricultural crops. However, apart from reports about potassium, few reports have examined how nitrogen, which has a large effect on crop growth, contributes to the radiocesium absorption. Focusing on this point, we studied the effect of nitrogen and potassium fertilizer on the radiocesium absorption in soybean seedlings. The concentration of radiocesium in the seed of soybean was higher in nitrogen-fertilized plants than in plants grown without fertilizer. The radiocesium concentration in the aboveground biomass increased as the amount of nitrogen fertilization increased. But the concentrations of radiocesium were higher in potassium-fertilized plants at high-N than in plants without added nitrogen and potassium. Further study is required to clarify the factors that incur an increase in radiocesium concentration in response to nitrogen fertilization. Special care is required to start farming soybean on fallow fields evacuated after the accident or on fields where rice has been grown before, which tend to have higher available nitrogen than the regularly cultivated fields.
Key Words: Radiocesium, Soybean, Nitrogen, Ammonium, Potassium
1. IntroductionThe Tohoku Region Pacific Coast earthquake
occurred on March 11, 2011, causing the immediate accident at the Fukushima Daiichi power station operated by the Tokyo Electric Power Company. Radiocesium, the dominant nuclide released during the accident, reached the agricultural lands in Fukushima and its neighboring prefectures and contaminated the soil and agricultural products1,2. To guarantee the safety of food and handling of agricultural, livestock, forestry, and marine products, monitoring inspections were established3,4. The monitoring inspection results indicated that the ratio of soybean exceeding 100 Bqkg-1 was high compared with that for rice and wheat and that the decreasing tendency of the contaminated soybean was low compared with that for rice and wheat. To revitalize agriculture, Fukushima Prefecture has been trying to prevent radiocesium uptake by plants through increasing the exchangeable potassium
concentration in soil to grow rice, approximately 25 mg 100 g-1 (dry soil) or higher. This prevention method of radioactive cesium uptake was introduced because of recent clear results that potassium fertilization was effective for reducing the radiocesium concentration in agricultural crops5,6. On the other hand, some reports have suggested that nitrogen, showing a large effect on crop growth, promoted the radiocesium absorption7. However, only a few studies have examined how nitrogen contributed the radiocesium absorption in soybean plants as well as the relation to that of potassium. For the recovery and revitalization of agricultural industries, the mechanism to reduce radiocesium absorption in soybean plants is an important and urgent issue to study. Focusing on this point, we studied the effect of nitrogen and potassium fertilizers on the radiocesium absorption in soybean plants.
44

2. Materials and MethodsSoybean (Glycine max) was grown in Iitate Village,
Fukushima Prefecture (experiment 1). The radiocesium of the field was approximately 13 kBq kg-1 (15-cm depth), exchangeable potassium was 15.8 mg 100 g-1, and pH was 6.2. Nitrogen fertilizer in the form of ammonium nitrate was applied at three levels: 0, 50, and 100 kg ha-1 (hereafter non-N, low-N, and high-N, respectively). We sowed the seeds for experiment 2 on June 16, 2014 and collected the aboveground biomass on September 2, 2014. We cultured soybean in a greenhouse (experiment 1). For experiment 2, nitrogen fertilizer in the form of ammonium sulfate was applied at two levels: 0.4 and 1.3 g per 1 L pot (hereafter low-N and high-N, respectively). The radiocesium activity of the soil which was taken in Fukushima in August 2012 was approximately 30 kBq kg-1, exchangeable potassium was 13.4 mg 100 g-1 soil, and pH was 6.0. The plants were grown until maturity, and the seed was collected. Finally, we studied the effect of the nitrogen and potassium fertilization treatment on radiocesium absorption by the soybean seedling (experiment 3). Nitrogen was applied as ammonium nitrate, at three levels: 0, 0.01 and 0.05 g per treatment (hereafter non-N, low-N, and high-N, respectively) and potassium as potassium chloride at 0.03 g We cultured soybean in a vessel (6.5 cm × 6.5 cm × 6.5 cm) for 18 days in a biotron (28°C, 16 h light). We collected the aboveground biomass. We used soil sourced from the same batch in Experiment 2 and 3. The radiocesium activities were measured using a sodium iodide scintillation counter (Aloka AM-300). The concentration of potassium, calcium, and phosphate in the sample was measured after acid decomposition using inductively coupled plasma-optical emission spectrometry (ICP-OES, PerkinElmer, Optima 7300).
Figure 1. Appearance of the field test(experiment 1)
Figure 2. Appearance of the laboratory test (left; experiment 2, right; experiment 3)
3. Results and DiscussionFigure 1 and 2 showed the effects of nitrogen
fertilizer on radiocesium concentration and those of base cations in aboveground part of thesoybean. The radiocesium concentration in the aboveground part (experiment 1) or the seed (experiment 2) were higher when grown in high-N condition than those in non-N or low-N. The concentration of the other elements was not affected by the nitrogen treatments. Table 1 shows the influence of the nitrogen and potassium fertilization treatment on radiocesium concentration in the aboveground part (experiment 3). The highest concentration was shown when treated with ammonium sulfate at high-N. The radiocesium concentration in the seed and the aboveground part was increased as the amount of nitrogen fertilizer increased. We previously reported that the amount of radiocesium extracted from the soil, which is considered to be potentially available for plant absorption, was increased by ammonium-nitrogen fertilization8. It is reported that cesium ions are fixed to the clay mineral and, therefore, the radiocesium adsorbed to the soil particles was probably not available for plants to absorb. But the ionic radius of the ammonium ion is similar to that of the cesium ion10, radiocesium ion seemed to be exchanged by ammonium ion and released from the soil. It was found that the amount of radiocesium extracted by ammonium-fertilizer was increased the day after fertilization. Therefore, them the soybean was able to absorb radiocesium.
The concentration of radiocesium in the aboveground part was lower in potassium-fertilized plants than that under potassium deficient condition (Table 1). Potassium and cesium are alkaline metals, located at
45

the first group in the periodic table, and have similar behavior. Potassium probably competes with cesium during membrane transport, thereby blocking the transport of cesium from the soil to the roots and from the roots to the shoots5. However, the concentrations of radiocesium were higher in potassium-fertilized plants at high-N than those under deficient condition of nitrogen and potassium. It was suggested that when soybean plant is going to be grown again in the converted field or a fallow field, the uptake amount of radiocesium is liable to increase when available nitrogen is increased, and the potassium fertilization treatment might not be effective.
Soybean cultivation is the most important in Fukushima except for that of rice. To assist the recovery and revitalization of agricultural industries in Fukushima Prefecture, special care is required to select the appropriate kind of fertilizer as well as to start cultivating soybean on fields that have lower available nitrogen than the regular cultivated fields. It is important to clarify the mechanism of cesium availability in response to nitrogen fertilizers to cope with the cesium contamination in crops.
Fig. 1. Radiocesium and base cation concentration in aboveground part of the soybean plant after nitrogen fertilization treatment (Experiment 1). (a) radiocesium, (b) potassium, (c) calcium, (d) phosphate
Fig. 2. Radiocesium and base cation concentration in aboveground part of the soybean plant after nitrogen fertilization treatment (Experiment 2). (a) radiocesium, (b) potassium, (c) calcium, (d) phosphate
0
5
10
non-N Low-N High-N
mg/
100g
(d)
0 10 20 30
mg/
100g
(c)
0 10 20 30
mg/
100g
(b)
0 100 200 300 400
Bq/k
g
(a)
0
10
20
Low-N High-N
mg/
100g
(d)
0 1 2 3
mg/
100g
(c)
0
20
40 m
g/10
0g(b)
0.0E+00
1.0E+04
2.0E+04
Bq/k
g
(a)
46

Table 1. Radiocesium and base cation concentration in aboveground part of the soybean plant after nitrogen and potassium fertilization treatments (Experiment 3).
*p < 0.05, **p < 0.01 compared to the control (Dunnet's test).
4. AcknowledgmentThis work was supported in part by the research grant for Mission Research on Sustainable Humanosphere from the Research Institute for Sustainable Humanosphere (RISH), Kyoto University.
References 1) Yasunari T. J., Stohl A., Hayano R. S., Burkhart J.
F., Eckhardt S., and Yasunari T., Cesium-137deposition and contamination of Japanese soilsdue to the Fukushima nuclear accident. Proc. Natl.Acad. Sci. USA. 108, 19530(2011).
2) Zheng J., Tagami K., Bu W., Uchida S.,Watanabe Y., Kubota Y., Fuma S., and Ihara S.,135Cs/137Cs Isotopic Ratio as a New Tracer ofRadiocesium Released from the FukushimaNuclear Accident. Environ. Sci. Technol. 48,5433(2014).
3) Nihei N.,“Radioactivity in agricultural productsin Fukushima, Agricultural Implications of theFukushima Nuclear Accident, Ed, Tomoko M.Nakanishi ・ Keitaro Tanoi”, Springer, p.73-85,2013
4) Nihei N., Tanoi K. and Nakanishi T. M.,Inspections of radiocesium concentration levels in
rice from Fukushima Prefecture after the Fukushima Dai-ichi Nuclear Power Plant accident. Scientific Reports 5, Article number: 8653-8658(2015/3).
5) Zhu Y. G., Shaw G., Nisbet A.F., and WilkinsB.T., Effects of External Potassium Supply onCompartmentation and Flux Characteristics ofRadiocaesium in Intact Spring Wheat Roots.Annals of Botany 85, 293-298(2000).
6) Sanchez A.L., Wright S.M., Smolders E., NayorC., Stevens P. A., Kennedy V. H., Dodd B. A.,Singleton D. L., and Barnett C. L., High PlantUptake of Radiocesium from Organic Soils Dueto Cs Mobility and Low Soil K Content. Environ.Sci. Technol. 33, 2752-2757( 1999).
7) Evans E. J. and Dekker A.J., Effect of nitrogen oncesium 137 in soils and its uptake by oat plants.Can. J. Soil Sci., 49, 349-355(1969).
8) Nihei N., Hirose A., Mori M., Tanoi K, T. M.Nakanishi T. M., Effect of nitrogen fertilizationon radiocesium absorption in soybean.Radiilogical issues for Fukushima's RevitalizedFuture, Springer, In press (2015)
treatment Cs K Ca Na P
Dry weight
Height
Bq kg-1 mg g-1 mg g-1 mg g-1 mg g-1 g plant-1 cm
(Control) Non-N 440 21 3.3 0.09 2.0 1.6 28
Ammonium nitrate
Low-N 642 22 3.6 0.12 2.6 1.4 25
High-N 1077 ** 19 3.4 0.09 2.3 1.6 29
Ammonium Nitrate+ Potassium Chloride
Low-N 366 24 3.0 0.09 2.1 1.6 25
High-N 686 25 3.0 0.11 2.2 1.6 26
47
Biological Effect of Soil Sterilization on the Cesium-137-Transfer to Plants
* Tadatoshi KINOUCHI1, Yuki HATTORI1,2,3, Keiko FUJIWARA1, Tomoyuki TAKAHASHI1,3,Satoshi FUKUTANI1, and Sentaro TAKAHASHI1,3
1) Kyoto University Research Reactor Institute2) SEIKO EG&G
3) Kyoto University Graduate School of Agriculture*[email protected]
In order to examine how soil microbes affect the dynamics of Cesium-137 (137Cs) between plants and soils, different types of soils were collected at ume (Prunus mume, ‘a Japanese apricot’) orchards and paddy fields about 50-55 km northwest from Fukushima Daiichi Nuclear Power Plant. Those soils, which were sterilized with gamma ray irradiation (60 kGy) or autoclave (at 121℃ for 20 minutes), were applied to the cultivation of Radish cultivar (Raphanus sativus var. sativus). After harvesting, the concentration of 137Cs in radishes was measured by a germanium semiconductor detector. As a result, transfer coefficients of 137Cs to the radish cultivated in the sterilized soils were significantly higher than in those cultivated in the non-sterilized soils. 137Cs and NH4+ released from organic matters, including soil microbes, decomposed by sterilization would be the main source of an increased amount of 137Cs in the radish.
Keywords: Cesium, Transfer coefficient, Sterilization
1. Introduction
Cesium-137 (137Cs) is one of the most harmful radionuclides, which were released into the environment by the Fukushima Daiichi Nuclear Power Plant accident. Since 137Cs has half-life of 30.17 years and is immobilized in the surface soil for a long period of time, there are concerns about a negative influence on the natural environment and health. Many experimental data about the environmental behavior of 137Cs has been reported, and most especially, transfer coefficient (TC) is an important parameter to know the dynamics of 137Cs between plants and soils1) - 3). However, considering the agricultural ecosystem (agro-ecosystem) in a comprehensive way, the effect of soil microbes on the 137Cs transfer from soil to plants has not been studied in detail. Therefore, different types of soils from agricultural fields located near Fukushima Daiichi Nuclear Power Plant were collected and applied to the cultivation of radish cultivar (Raphanus sativus var. sativus) with or without sterilization for evaluation of TCs.
2. Materials and Methods
(1) Soil samples Surface soil samples (0-5 cm depth) were collected at different sites, from ume orchards and paddy fields, located about 50-55 km northwest from the Fukushima Daiichi Nuclear Power Plant. The ume (Prunus mume, ‘a Japanese apricot’) orchard soil consisted of clay loam and dry grass, and the paddy field soil was a considerably wet kuroboku soil with slight fraction of clay. The concentrations of 137Cs in the ume orchard and paddy field soils were 21,000 and 6,300 Bq/kg, respectively
(2) Sterilizating methods Autoclave sterilization and 60Co gamma ray irradiation were used for sterilization of soil samples. Collected soils were put in polycarbonate containers (72×72×100 mm) by 200 g wet-weight, and then autoclave sterilization at 121ºC for 20 minutes or 60 kGy
48

gamma ray irradiation. The succcesful sterilization was verified by colony formation assay.
(3) Cultivation experiment Radish cultivar (Raphanus sativus var. sativus) was used in this study. Seeds of radish were sterilized by a sterilizing solution (0.05% Tween 20 and 5% sodium hypochlorite), and then germinated on the sterilized filter paper. Single samples of germinated radish sprouts were transferred to, and cultivated in each aforementioned sample soil with and without sterilization, respectively, for 45 days at 22.0ºC and 60% humidity under long-day condition (16 hrs light/8 hrs dark). Each sample was applied to a Ge semiconductor detector for 137Cs measurement.
(4) Ammonium determination Ammonium in the sample soils was determined by a modified indophenol method5). Photometric standards were prepared from an aqueous solution of NH4Cl, and the absorbance was measured at 660 nm by a spectrophotometer.
(5) Transfer Coefficient (TC) TC is defined in this report as a ratio of the 137Cs concentration (Bq/kg dry weight) in plant to that in soil.
3. Results and Discussions
The concentrations of 137Cs and the TCs were shown in Fig. 1 and 2, respectively4). The concentrations of 137Cs in the radish (leaves and taproot) were increased by the sterilization. The absorbed 137Cs concentration (3,100±25 Bq/kg) in the radish (1.1 g of dry-weght), which was cultured in the autoclaved paddy field soil (200 g), was equivalent to 0.25% of the total concentration of 137Cs in the pod. The TC from the autoclaved soil of the ume orchard to the radish taproot was estimated to be 8.9 times higher than the TC from the non-sterilized soil of the ume orchard. The reason for the increase in the 137Cs-transfer from soil to radish by sterilization would be the increase in the concentrations of NH4+, originating from organic matters decomposed by sterilization. As has been reported, the increase in the NH4+ concentrations enhances the elution of Cs ions from the soil clay particles6) - 8). The decrease in the activity of nitrifying bacteria by sterilization would also cause the accumulation of NH4+ in the sterilized soil and the following the absorption of Cs ion by plants. Therefore, the changes of NH4+ concentration in the sample soils before/after sterilization were measured. As shown in Fig. 3, the NH4+ concentration in ume orchard soil extracts after sterilization was approximately two times higher than before sterilization. On the
other hand, the NH4+ concentration in the paddy field soil extracts after sterilization was 10 to 30% lower than before sterilization. Additionally, in order to examine whether denaturation of organic matter by sterilization affects on the release of 137Cs from the organic matters, we preliminarily measured the 137Cs concentrations extracted from the paddy field soil before/after sterilization by the treatment with hydrogen peroxide. As a result (data not shown), the 137Cs concentration after sterilization was 30% higher than the 137Cs concentration before sterilization. Therefore, it was suggested that denaturation of organic matters by sterilization did not affect on the release of 137Cs from the organic matter. At the present, it is difficult to state precisely what is the main effect on the increase in the plant available 137Cs. Regardless of the kind of the soils, TCs were higher in the soils treated with autoclave sterilization than the gamma ray irradiation. As indicated in other report, autoclave sterilization was more effective for the elution of NH4-N from the soils than other sterilization techniques such as gamma ray irradiation9). The high temperature and humidity by autoclave sterilization may cause a dynamic change of the soil structure, which leads to the release of not only NH4+ but also Cs+ from the soil.
4. References
1) M. SAIKI, Y. OHMOMO, S. UCHIDA, H. OBATA, M.CHINO, H. OKABAYASHI and S.YAMAZAKI, Transfer Factors of Radionuclides from Soils to Agricultural Products, Radioactive Waste Management Center, Tokyo, 1988 (in Japanese).
2) J. P. ABSALOM, S. D. YOUNG, N. M. J. CROUT, A.SANCHEZ, S. M. WRIGHT, E. SMOLDERS, A. F.NISBET and A. G. GILLETT, “Predicting the transfer ofradiocaesium from organic soils to plants using soilcharacteristics”, J. Environ. Radioactiv., 52, 31-43, 2001.
3) H. TSUKADA and H. HASEGAWA, “Soil-to-plant transfer of 137Cs and other essential and trace elements in cabbageplants”, J. Radioanal. Nucl. Chem, 252, 219-224, 2002.
4) Y. HATTORI, T. KINOUCHII, S. FUKUTANI, T. TAKAHASHI, K. FUJIWARA, K. IWATA, and S. TAKAHASHI, “The effect of soil sterilization on the 137Cs transfer from soil to radish (Raphanus sativus var. sativus)”, Jpn. J. Health Phys., 50, 2015 (in press).
5) E.D. Rhine, G.K. Sims, R.L. Mulvaney, and E.J. Pratt,“Improving the Berthelot reaction for determiningammonium in soil extracts and water”, Soil Sci. Soc. Am. J., 62, 473-480, 1988.
6) N. YAMAGUCHI, Y. TAKATA, K. HAYASHI, S.
49

ISHIKAWA, M. KURAMATA, S. EGUCHI, S. YOSHIKAWA, A. SAKAGUCHI, K. ASADA, R. WAGAI, T. MAKINO, I. AKAHANE and S. HIRADATE, “Behavior of radiocaesium in soil-agricultural plants systems and its controlling factor”, Bulletin of National Institute for Agro-Environmental Sciences, 31, 75-129, 2012 (in Japanese).
7) H. TSUKADA and A. TAKEDA, “Latest agriculturaltechnology-Soil fertilization vol.4”, Rural CultureAssociation Japan, Tokyo, pp. 1-6, 2011 (in Japanese).
8) B. DELVAUX, N. KRUYTS, E. MAES, and E. SMOLDERS; “Trace Elements in the Rhizosphere”, CRCPress, London, pp. 82, 2001.
9) C.F. ENO and H. POPENOE, “Gamma radiation compared with steam and methyl bromide as a soil sterilizing agent”, Soil Sci. Soc. Am. J, 28, 533-535, 1964.
Acknowledgements
This work was supported by the Fukushima Agricultural Technology Center, the Research Program for the Scientific Basis of Nuclear Safety, Kyoto University Research Reactor Institute, and the Grant-in-Aid for Scientific Research (KAKENHI) from the Japan Society for the Promotion of Science (No. 23570272 to T.K., and No. 24510031 to T.T.).
Fig. 1, Concentrations of 137Cs in the leaves, taproot and total radish. Y-axis indicates concentrartion of 137Cs (Bq/kg).
Fig. 2, Soil-to-radish transfer coefficient (TC) of 137Cs in the leaves, taproot and total radish.
Fig. 3, Concentrations of NH4+ in the sample soils before and after
sterilization. Y-axis indicates concentrartion of NH4
+ (ppm).
50

Radioactivity levels of vegetables, rice, fruits and drinking water in Minami-Souma City
Kiyoshi Shizuma 1)* and Yushi Sakurai2)
1) Graduate School of Engineering, Hiroshima University, 1-4-1 Kagamiyama, Higashi-Hiroshima 739-8527, Japan 2) NPO Corporation Furusato. 2-144-6 Takami-cho, Minami-Souma 975-0033, Japan
Radioactivity concentration of 137Cs, 134Cs and 40K in vegetables, rice, fruits cultivated in Minami-Souma City after the accident of Fukushima Daiichi Nuclear Power Plant were measured and transfer coefficients from soil-to-vegetables and soil-to-unhulled rice were determined. In 2014, 6 model farms were prepared and 15 kinds of vegetables were produced. The 137Cs and 40K concentration in soils of paddy field and unhulled rice were measured and the transfer coefficient was determined. Japanese persimmon and chestnut sampled from the same tree in 2013 and 2014, and 137Cs and 40K concentration were compared for two years. Radiocesium concentration in tap water and ground water were sampled in Minami-Souma City and the results were compared with the regulation limit. It was found that 137Cs concentration in vegetables and unhulled rice are much lower than the regulation limit (100 Bq/kg). Radioactivity concentration of 137Cs in chestnut was over the regulation limit at one sample, but those in Japanese persimmon and chestnut in 2014 were decreased about half of radioactivity level in 2013. It is noticed that radioactive 137Cs was detected both in tap water and ground water but concentration was much lower than the limit (10 Bq/L). Further continuous measurement is necessary to investigate the migration of 137Cs in the environment.
Key Words : Radiocesium in vegetable and rice, transfer factor, radiocesium in fruits, radiocesium in drinking water
1.Introduction Four years have passed from the Tokyo Electric Power
Company (TEPCO) reactor accident occurred on March 11, 2011. Due to this reactor accident, significant amount of radioactive fission products 1) were released in the environment. Short-lived radionuclides (≤ 30 d) such as 129mTe, 129Te, 131I, 132Te have decayed out within several months, however, long-lived radionuclides remain in the environment for long time and cause external and internal radiation doses 2) to residents who are living in the contaminated area.
Minami-Souma City is located at 10-40 km from the north of the Fukushima Dai-ichi Nuclear Power Plant (FDNPP) of TEPCO and the north-east and southern area of the city are highly contaminated 3). Radioactive contamination on agricultural products produced in their own town and drinking water are serious because radioactive contamination in various foods might causes the internal exposure. The purpose of this study is to make clear the radioactivity level in agricultural products and drinking water in Minami-Souma Cty. In 2014, we prepared 6 model vegetable farms and produced 15 kinds of vegetables. Radioactivity concentration in the soil and vegetables were measured and transfer factors of 137Cs from soil-to-plants as well as 40K were determined. Some fruits (Japanese persimmon and chestnut) were measured in 2013 and 2014 and the results were
compared with each other. The 137Cs concentration of soil in paddy field and unhulled rice were measured to obtain the transfer factor from soil-to-unhulled rice. Tap water and ground water were collected and 137Cs concentration were measured. The obtained data were informed to residents for understanding about the present radioactivity levels.
2.Materials and Methods2.1 Vegetable Locations of the model fields, each field is typically 10 m × 10 m, are shown in Fig.1. Typical farm (F1) is shown in Fig.2. The fields were cultivated well and 6-9 soil samples were taken from each field. Soil samples were oven-dried at 80 ℃ for 24 hours, and filtered through a 2-mm mesh sieve to remove stones and glasses. About 60 g of soil was packed into a the polystyrene container (U9 container, 4.8 cm dia.×3.0 cm height)
. Fig.1 Test farms F1-F6 in Minami-Souma City
51

Fig.2 Typical test farm F1. Gamma-rays were measured with a low-background Ge detector (Seiko EG&G, GEM-110225). The detection efficiency of the Ge detector was determined using nine nuclide mixed activity standard volume sources (MX-033, Japan Isotope Association). Radioactive concentration were determined for 137Cs, 134Cs and 40K. Produced vegetables are mini-tomatoes, potatoes, kidney beans, garlic, onions, eggplant, pimento, cucumber, chinese chives, mulukhiya, pumpkins, sweet potatos, chinese cabbages, Japanese radish and welsh onions. Some examples are shown in Fig.3. They were harvested from July to November. Vegetables were not dried, but fresh samples were cut into fine pieces, and packed in the U9 container for the gamma-ray measurement. Typical gamma-ray spectra of cucumber produced at F1 field are shown in Fig. 4.
Fig.3 Vegetables produced at test farm F5.
Fig.4 Gamma-ray spectrum of cucumber produced at test farm F1
2.2 Rice Since the monitoring of 137Cs concentration in rice produced in 2011 in Fukushima Prefecture exceeded the food safety limits, rice production were restricted 5) in Fukushima Prefecture.. Only rice produced at test paddy filed were permitted for monitoring. In the present work, measurement of radionuclides in soils of five paddy fields (P, Y, N, E, D) shown in Fig. 5 are conducted in August 2014. Rice was produced only at the paddy field D. Seven soil samples were taken around the rice stubbles and the unhulled rice were directly sampled from the head of the rice. An example of rice stubble and unhulled rice are shown in Fig. 6. Unhulled rice and soil samples were oven-dried at 80℃ for 24 hours. Soil samples were grind into powder under 2mm and about 40 g of soil was taken into a U9 container for gamma-ray measurement. The unhulled rice of about 22 g were pressed into the container for the measurement.
Fig.5 Paddy field in Minami-Souma City. Rice was produced only at the paddy field D.
Fig.6 Rice stubble and soil (left) and unhulled rice (right).
2.3 Japanese persimmon and chestnut Japanese persimmon and chestnut were sampled from
the same trees for two years 2013 and 2014. Locations of trees are shown in Fig.7 and examples of fruits are shown in Fig.8. Fresh of fruits were cut into a small pieces and pressed into a U9 container for gamma-ray measurement.
52

Fig.7 Locations of Japanese persimmon (P1-P3) and chestnut (C1-C3) in Minami-Souma City.
Fig.8 Typical Japanese persimmon and chestnut.
2.4 Tap water and ground water Tap water in Minami-Souma City are supplied from three
water purification plants (Ushigoe plant, Ohtani plant and Yagawara plant). Water sources of three plants are ground water. In addition to public tap water, a boring well is equipped privately to supply groundwater. Sampling locations of tap water (T1-T6) and ground water (G1-G11) are shown Fig. 9. Sample water were taken into a 1-L polystyrene bottle. One litter of water measured correctly with a mass-flask was dried up on a heat plate covered with a Teflon sheet kept at 100 ℃ for about 6 hours 6) The dried sheet was folded into a size of 15 mm dia.× 40 mm length for gamma-ray measurement with a well-type Ge detector.
3. Results and Discussion3.1 Vegetables
Radioactive concentration of 137Cs, 134Cs, 40K and the ratio 134Cs/137Cs in soil for six test farms are given in Table 1 Concentration of 137Cs in soil ranged in 791–1909 Bq/kg at July 2014. The ratio of 134Cs/137Cs was about 0.34. Concentration of 40K were ranged in 391-565 Bq/kg. Radioactive concentration of 137Cs and 40K in vegetables produced at six test farms are determined. It was hard to detect 134Cs in vegetable because of its
low.
Fig.9 Sampling locations of 6 tap water (T1-T6) and 11 ground water (G1-G11) in Minami-Souma City.
Table 1 Radioactive concentrations of 134Cs, 137Cs and 40K in soil of test farms F1-F6.
radioactivity. In the present work, the transfer factor was defined as follows,
( )( ) soilinweightdryBq/kgCs
plantinweightfreshBq/kgCsTF 137
137
−−
=
The TF 7, 8, 9) is normally defined as the ratio of radioactive concentration (Bq/kg) of the dry weight of plant to that of the dry weight of soil. In some cases, the radioactive concentration of the fresh weight is used 9). Fresh weight to dry weight ratios are also given in IAEA-TRS-472 8). Since the purpose of the present work is to know whether the radioactive concentration in plant is safe compared to the Japanese regulation limit of food, the radioactive concentration in fresh weight of plant was used. In the present vegetables, the ratio of dry weight to fresh weight were typically 5 %.
The TF of 40K was also determined in the same way as 137Cs. An example of TF for each vegetables produced at the test farm F1 is shown in Fig.10. The TFs of 137Cs for vegetables are about 0.001 and those of 40K are about 0.2. Average concentration of 137Cs and 40K and their TFs for test fields F1-F6 are given in Table 2. It is shown that the 137Cs concentration in fresh vegetables are ranged 1.2-2.8 Bq/kg, which is much lower than Japanese food regulation limit of 100 Bq/kg. The 40K concentration were 68-128 Bq/kg and TF were 0.166-0.287 which were much higher than
53

Fig.10 Transfer factor of 137Cs and 40K for fresh vegetables in the test field F1.
Table 2 Average concentration of 137Cs and 40K in vegetables and transfer factors
those of 137Cs in 0.0009-0.0018. Tsukada et al. 8) reported that stable potassium content in
soil and uptake of 137Cs and stable Cs show negative correlation. Tagami and Uchida 11) reported that the behavior of 137Cs and 40K are different in giant butterbur and field horsetail. In the present work, stable potassium amount in the soil were not measured, but 40K was easily detected from the gamma-ray measurement. The correlation of radioactive concentrations of 40K and 137Cs was investigated in this work. Correlation coefficients was +0.365, which indicates positive weak correlation between 137Cs and 40K concentrations. Among 15 kinds of vegetables, mulukhiyas and chinese chives are relatively high concentration of 137Cs as well as 40K compared with other vegetables,
3.2 Rice Radioactive concentration of 137Cs, 134Cs, 40K and the ratio
134Cs/137Cs for five paddy fields are given in Table 3. The 137Cs concentration are ranged in 824–1102 Bq/kg and the 40K concentration are in 394-666 Bq/kg at August 2014. Since rice was cultivated only at the paddy field D, the transfer factor of soil-to-plant for 137Cs and 40K were determined as given in Table 4. TF are 0.011±0.001 for 137Cs and 0.071±0.004 for 40K, respectively. The transfer factor of 137Cs from soil to polished rice was reported as 0.0016 by Tsukada et al.8) in 2005 and 0.003 by Komamura and Tsumura12) in 1994. The radioactive 137Cs of their TF were due to global fallout in 1950-1980 and also Chernobyl reactor accident in 1986. The transfer factor after the accident of
Table 3 Radioactive concentration of 137Cs, 134Cs and 40K in paddy field P-D.
Table 4 Transfer factor (TF) of 137Cs and 40K from soil-to-unhulled rice in the paddy field D in 2014.
FDNPP are reported as follows; Endo et al. 13) reported as 0.006- 0.013 for polished rice and 0.019-0.026 for unhulled rice (ear) in 2011. Fujimura et al.14) reported the TF from pot experiment as 0.011 in 2011 and 0.0061 in 2012 for brown rice. They also reported from their paddy field work as 0.0008-0.17 in 2011. Ohmori et al.15) reported as 0.0008-0.01in 2011. According to our experience, the 137Cs concentration in rice in husk decrease to half in unpolished rice, decrease to 1/4 in polished rice and finally decrease to 1/8 in washed rice. The present result of TF for 137Cs is in agreement with the recent reports.
3.3 Japanese persimmon and chestnut Radioactive concentration of 137Cs, 134Cs and 40K for
three Japanese persimmon and chestnut in 2013 are given in Table 5 and those values harvested in 2014 are given in Table 6. The results are also shown in Figs. 11 and 12. In the case of 2014, the 137Cs concentration were ranged in 3.3-33.4 Bq/kg in Japanese persimmon and 19-156 Bq/kg in chestnuts. In the case of chestnut, it is noticed the 137Cs concentrations exceeds the Japanese food regulation limit in the southern area (Odaka area) in the city. The 40K concentration was ranged in 32-79 Bq/kg for the persimmon Table 5 Radioactive concentrations of 137Cs, 134Cs and 40K in Japanese persimmons and chestnuts harvested in 2013.
Table 6 Radioactive concentrations of 137Cs, 134Cs and 40K in Japanese persimmons and chestnuts harvested in 2014.
and 134-242 Bq/kg for chestnut. No difference in the area of the city was observed in the case of 40K reflecting no relation to the
54

accident of FDNPP , The concentration of Japanese persimmon and chestnut in
2014 were decreased to about half of those in 2013 for the same trees, nevertheless the 137Cs concentration in soil around the route of the trees supposed to be almost constant. Such results are reported as ageing16) for agricultural products reflecting the chemical form of 137Cs compound changed to insolubility form and uptake from soil to plants decrease. Further survey of the 137Cs concentration in these fruits is needed to clear the uptake process.
Fig.11 Comparison of the 137Cs concentration in Japanese persimmon obtained in 2013 and 2014.
Fig.12 Comparison of the 137Cs concentration in chestnut obtained in 2013 and 2014.
3.4 Tap water and ground water The 137Cs concentration in tap water and ground water are
given in Table 7 and also shown in Figs. 13 and 14.
Table 7 Radioactive concentration of 137Cs in tap water and ground water in 2014.
The radioactive concentration of 137Cs in tap water were ranged in 4.4 -13.4 mBq/L and 0-27 mBq/L in ground water. It is noticed that the 137Cs concentration level both in tap water and ground water are about 1/400 of the Japanese drinking water regulation limit of 10 Bq/L. A background sample prepared from the tap water supplied to Hiroshima University was examined but 137Cs was not observed. The radioactive 137Cs was detected in ground water, however, 137Cs was not detected in the southern area, Nakaohta, yagawara, and Katakura in Minami-Souma City.
Ohta et al.17) reported a prediction of ground water contamination of 137Cs and 131I in the Kanto district after the FDNPP accident. Based on the estimated 137Cs migration rate of 0.6 mm/y, they predicted that contamination of ground water by 137Cs is not likely to occur in Kanto district. Since the soil layer of the Minami-Souma City is different from Kanto district, further migration model estimation and continuous monitoring of 137Cs concentration in ground water in this area are needed to clarify the ground water radioactive contamination of the ground water.
Fig.13 137Cs concentration in tap water for 6 samples and related water purifying plant.
Fig.14 137Cs concentration in tap water for 6 samples and related water purifying plant.
4. ConclusionSix model vegetable farms were prepared and 15 kinds of
vegetables were produced in Minami-Souma City in 2014. Radioactivity levels in the soil and fresh vegetables were measured and transfer factors of 137Cs and 40K from soil-to-plant
55

were determined. The transfer factor of the fresh vegetables were 0.0013 in average. Rice was produced in a paddy field and transfer factor of 137Cs and 40K from soil- to-unhulled rice were determined. The transfer factors were 0.015 and 0.071 for 137Cs and 40K, respectively. Japanese persimmon and chestnut were measured for the same tree in 2013 and 2014. It was observed the 137Cs concentration in these plants in 2014 were decreased from 2013 due to ageing effect. The 137Cs concentration in vegetable, rice and Japanese persimmon are much lower than the Japanese food regulation limit of 100 Bq/kg. Tap water of 6 samples and ground water of 7 samples were collected and the 137Cs concentration 0-27 mBq/L were observed. The 137Cs level in drinking water are much lower than the drinking water regulation limit of 10 Bq/L.
Acknowledgement We deeply appreciate Messrs. Mitsuyoshi Sato, Yuji Shiga,
Tsunekiyo Hanzawa, Masayuki Suzuki for kindly offering model farms. We also deeply appreciate Messrs. Minoru Yamada, Masayuki Suzuk, Kiyoshi Tateyama, Narufumi Sugi, Toshinori Monma, Nobuo Shiga for offering Japanese persimmon and chestnut. We also thank to Messrs. Yuji Shiga, Masayuki Suzuki, Matsuoka Kensetsu, Akiko Takahashi, MItsuyoshi Sato, Toyoaki Horiuchi, Kazuo Endo, Kazuo Monma, Masakazu Sugi for kindly offering water samples.
References 1)
6)
56
S. Endo, S. Kimura, T. Takatsuji, K. Nanasawa, T.Imanaka, K. Shizuma, Measurement of soil contamination by radionuclides due to Fukushima Daiichi Nuclear Power Plant accident and associated cumulative external dose estimation. J. Environ. Radioact. 111, 18-27 (2012)
2) N. Kamada, O. Saito, S. Endo, A. Kimura, K. Shizuma,Radiation doses among residents living in 37 km northwest of the Fukushima Dai-ichi Nuclear Power Plant. J. Environ. Radioact. 110, 84-89 (2012)
3) T. Kajimoto, S. Endo, T. Naganuma, K. Shizuma,Distribution of radioactivities 137Cs and 134Cs in river water and bottom sand for major rivers at Minami-Souma City in Fukushima. Proceedings of International Symposium on Environmental monitoring and dose estimation of residents after accident of TEPCO’s Fukushima Daiichi Nuclear Power Stations. pp. 96-100 (2013) (KURRI).
4) http://www.mhlw.go.jp/shinsai_jouhou/dl/leaflet_120329.pdf (in Japanese)
5) Limit with product of the rice in 2012, Nuclear regulatory agency, www.nsr.go.jp/archive/nsc/ad/pdf/20120405_1.pdf water by means of gamma-ray spectrometry.
K. Shizuma, S. Hamanaka, X. Q. Wen, K. Iwatani and H. Hasai, A method for measuring accurate radon concentration in water by means of gamma-ray spectrometry. Nuclear Instrum. Methods in Physical Research A410, 309-313 (1998)
7) C. Myttenaere, Absorpyion of radiocaesium by flooded rice: relative importance of foods and shoot base in the transfer radioactivity. Plant. Soil. 36 (1) , 215-218 (1972)
8) Tsukada, H. Hasegawa, H. HIsamatsu, S. Yamasaki, S. Transfer of 137Cs and stable Cs from paddy soil to polished rice in Aomori, Japan. J. Environ. Radioact. 59, 351-363 (2002a)
9) IAEA, Handbook of Parameter Values for the Predictionof Radionuclide Transfer in Temperate Environments. Technical Report Series (TRS) No.472, Appendix I. International Atomic Energy Agency, Vienna (2010).
10) M. Brambilla, P. Fortunati, F. Carini, Foliar and root uptake of 134Cs, 85Sr, and 65Zn in processing tomato plants (Lycopersicon esculentum Mill). J. Environ. Radioact. 60 351-363 (2002)
11) K. Tagami and S. Uchida, Effective half-lives of 137Cs ingiant butterbur and field horsetail, and the distribution differences of potassium and 137Cs in aboveground tissue parts. J. Environ. Radioact. 141, 138-145(2005).
12) M. Komamura and A. Tsumura, The Transfer Factors ofLong-lived Radionuclides from Soil to Polished Rice Measured by ICP-MS. RADIOISOTOPES 43, 1-8 (1994).
13) S. Endo, T. Kajimoto,K. Shizuma: Transfer coefficient soil to rice plant of 134Cs and 137Cs deposition due to Fukushima Daiichi Nuclear Power Plant accident. J. Environ. Radioact. 116 , 59-64(2012).
14) S. Fujimura, Y. Muramatsu, T. Ohno, M. Saito, Y. Suzuki, T. Kobayashi, K. Yoshioka, Y. Ueda, Accumulation of 137Cs by rice grown in four types of soil contaminated by the Fukushima Dai-ichi Nuclear Power Plant accident in 2011 and 2012. J. Environ. Radiat. 140 , 59-64 (2015).
15) Ohmori, Y., Inui, Y., Kajikawa, et al. Difference in cesium accumulation among rice cultivars grown in the paddy field in Fukushima Prefecture in 2011 and 2012. J. Plant Res. 127, 57-66 (2014).
16) H. Noordijk, K. E. van Bergeijk, J. Lembrechts, M. J. a Frissel, Impact of aging and weatherconditions on soil-to-plant transfer of radiocesium and radiostrontium. J. Environ. Radioact. 15, 277–286 (1992).
17) T. Ohta, Y. Mahara, T. Kubota, S. Fukutani, K. Fujiwara, K. Takamiya, H. Yoshinaga, H. Mizuochi, T. Igarashi, Prediction of groundwater contamination with 137Cs and 131I from the Fukushima nuclear accident in the Konto district. J. Environ. Radioact. 111, 38-41 (2012).

The amount of 137Cs deposition and transfer ratio of 137Cs to wild edible-wild-plants after the accident at TEPCO's Fukushima Daiichi Nuclear Power Station
Yoshiyuki Kiyono1)*, Akio Akama1)
1) Forestry and Forest Products Research Institute, 1 Matsunosato, Tsukuba, Ibaraki, Japan*[email protected]
Using the data published by the government, we determined the relationship between the amount of 137Cs deposition to the ground surface by the accident of Fukushima Daiichi Nuclear Power Station and 137Cs concentration in the edible portion of 12 wild edible-wild-plant species 2–3 years after the accident. The relationship was approximated by power equations. The equations were statistically significant for the 12 species combined and for each species except Laportea cuspidata. The relationships differed among species. For example, the 137Cs concentration was high in Eleutherococcus sciadophylloides, medium in Aralia elata, Pteridium aquilinu, and Aralia cordata, and low in Petasites japonicus (leaf) and Hosta sieboldiana to the same amount of 137Cs deposition. Using the equations as prediction models, 137Cs concentrations in the edible portion of each plant species and their transfer ratios (TRs) of 137Cs were calculated when the amount of deposition was 10, 60 and 300 kBq m-2, respectively. The 137Cs concentrations of 11 species increased and the figures of TR of 10 species reduced as the amount of deposition increased. However, the figures of TR of Eleutherococcus sciadophylloides appeared scarcely to change. This species probably has a mechanism of 137Cs absorption different from the other species and increased absorption in proportion to the amount of deposition with respect to the range of data.
Keyword: aggregated transfer factors (TFag) of 137Cs, Eleutherococcus sciadophylloides, TEPCO's Fukushima Daiichi Nuclear Power Station
1 Introduction
The accident at TEPCO's Fukushima Daiichi Nuclear Power Station (hereafter referred to as the FDNPS accident) was the serious radioactive contamination accident first occurred in the region where citizens gather a wide variety of edible wild plants. The radiocesium concentrations of plant body were nearly proportional to the air dose rates 1) and edible wild plants are no exception 2). Since case studies are insufficient, difference of contamination among plant species was little known. Local governments like prefecture have monitored radiocesium concentrations in agricultural crops and the considerable amount of data were published. We used the data in Fukushima Prefecture to analyze the relationships between the amount of 137Cs deposition to the ground surface and 137Cs concentration of the samples of wild edible-wild-
plant species after the FDNPS accident (Note that samples of cultivated edible-wild-plant species were not used in this study). This paper reports the outline of the results. This study was implemented using the fund of Foresry Agency and JSPS KAKENHI Grant Number 15K07496.
2 Materials and methods
(1) The amount of 137Cs deposition to the ground surface by the FDNPS accident
In most data of the local governments’ monitoring, the locality of wild edible-wild-plant sample was shown in the unit of city, town, or village. Therefore, the amount of 137Cs deposition to the ground surface by the FDNPS accident was
57

estimated by reading the maximum and minimum amount of deposition classes (Fig. 1) and averaging them for each unit in Fukushima Prefecture in the results of the airborne monitoring survey of 137Cs by Ministry of Education, Culture, Sports, Science and Technology and converted to those on November 16, 2012 3).
(2) Radioactive contamination of wild edible-wile-plants
No particular difference was found in between 2013 and 2014 about the radioactive contamination data of wild edible-wild-plants reported by Fukushima Prefecture and compiled by Forestry Agency (http://www.rinya.maff.go.jp/j/tokuyou/ kinoko/kensakekka/fukusimaken.html). We combined 2013–2014 data of 137Cs concentration of 12 plant species and 685 samples. When the concentration was less than the detection limit (2.3–9.4 Bq f-kg-1), we used the detection limit as the measured concentration. Number of samples of each species was between 16 and 121. Some of radiocesium might have derived from the past. The 137Cs in natural ecosystems derived from historical nuclear tests and the Chernobyl nuclear accident were neglected.
Fig. 1 The amount of 137Cs deposition to the ground surface by the accident at TEPCO's Fukushima Daiichi Nuclear Power Station Ministry of Education, Culture, Sports, Science and Technology and converted to those on November 16, 2012 (Ministry of Education, Culture, Sports, Science and Technology, 2013)
(3) Regression analysis
We used the 2008 version of the Ekuseru-Toukei software (Social Survey Research Information Co., Ltd., Tokyo, Japan) for approximating the relationships between the amount of 137Cs deposition to the ground surface and radiocesium contamination in the edible portion of wild edible-wild-plant species.
3 Results and discussion
(1) The radiocesium contamination in the edible portion of wild edible-wild-plant species
The relationship between the amount of 137Cs deposition to the ground surface and 137Cs concentration in the edible portion of 12 wild edible-wild-plant species after the FDNPS accident was approximated by power equations (Fig. 2). The equation was statistically significant in the dataset of total 12 species (P < 0.0001) and that for each species (P < 0.0344) except Laportea cuspidata (P = 0.5054), this species had a relatively narrow range of the amount of 137Cs deposition. The relations differed among species. The 137Cs concentration was high in Eleutherococcus sciadophylloides, medium in Aralia elata, Pteridium aquilinu, and Aralia cordata, and low in Petasites japonicus (leaf) and Hosta sieboldiana to the same amount of 137Cs deposition. The tendency of low 137Cs concentration of Petasites japonicus (leaf) was also reported in Kiyono & Akama 2) as Petasites japonicus (leaf) < Hydrangea petiolaris, Schizophragma hydrangeoides, Eleutherococcus sciadophylloides.
Since the values of concentration at the detection limit were used for some low contaminated samples in this study, predicted values by the equations in Fig. 2 may be larger than the true values for low contaminated samples.
(2) Transfer ratio (TR) of 137Cs
Using the equations in Fig. 2 as a prediction model, 137Cs concentrations of edible portion of each plant species were predicted (Table 1). The 137Cs concentrations of 11 species increased as the amount of deposition increased. Their ratio of 137Cs concentration in plant sample/the amount of 137Cs deposition to the ground surface was calculated as transfer ratio (TR) following the aggregated transfer factors (TFag) 4) of 137Cs when the amount of deposition was 10, 60 and 300 kBq m-2, respectively. The figures of TR of 10 species reduced as
58
137Cs deposition increased. The figures of TR of Eleutherococcus sciadophylloides was much greater than the other species and appeared scarcely to change. This species probably has a mechanism of 137Cs absorption different from the other species and increases absorption when the amount of deposition increased in between 10 and 300 kBq m-2.
Regarding a taxonomic group (Table 1), 3 species of Araliaceae including Eleutherococcus sciadophylloides had not signifcantly higher TRs than the other 9 species of the different families (P = 0.40, ttest was done using figures of 137Cs TR when 60 kBq m-2, the same shall apply hereinafter).
Between 9 species of Angiospermae and 3 species of Pteridophyta, no significant difference was found (P = 0.38). Butkus & Konstantinova 5) found that a fern, Dryopteris filix-mas was more contaminated than the grass species in the site contaminated by Chernobyl nuclear power plant accident (April, 1986). A fern, Osmundastrum cinnamomeum var. fokiense was found the most contaminated plant on a fresh weight basis in the FDNPS accident 2). However, as shown in Table 1, 3 fern species: Matteuccia struthiopteris, Pteridium aquilinum, and Osmunda japonica did not show significantly higher concentrations than the other species. Generalizing "fern has high concentration" is not correct. Life form is a kind of classification of living things based on their function and morphology etc. as a result of adaptation to the environment. Between 3 species of deciduous tree and 9 species of deciduous perennial herb, no significant difference was found (P = 0.39). However, life form is sometimes influential to radioactive contamination of edible-wild-plant. Edible-wild-plants with holdfasts (e.g., some lianas) are more highly contaminated for a given air dose 2).
Topography where the edible-wild-plant is growing is also influential to radioactive contamination of edible-wild-plant. Plants growing at a lowlying site (where surface water and groundwater flow, such as valley bottoms and small hollows) are at particularly high risk of dangerous contamination 2). Harvesting season may also be influential to radioactive contamination of edible-wild-plant. The 137Cs concentration of plant was high in young leaf in spring and reduced as the leaf biomass grew large 6, 7). Petasites japonicus (leaf) and Elatostema umbellatum are edible-wild-plant that mainly stem is edible. They are usually harvested after stems grow large and it may be a reason that the concentrations of them are low.
In this study, we showed the possibility of estimating the difference in 137Cs contamination among wild edible-wild-plant species using the monitoring results for special forest products based on radiocesium tests for food that were conducted by the governments. The relationship between the
amount of radiocesium deposition and concentration in plant is considered to change chronosequentially by various reasons such as radioactive decay, the movement of radiocesium in the ecosystem. By continuing the monitoring by the governments and appropriate methodology improvement, we will be able to detect the trend of the relation between the amount of radiocesium deposition and its concentration in plant body. However, the amount of 137Cs deposition per unit land area widely different even in the same municipality (Fig. 1). The accuracy of the present predicted values depends on uncertainties of the models that are based on the average amount of the maximum and minimum deposition classes in each municipality.
As shown in Fig. 2, 137Cs concentrations of Petasites japonicus (leaf) and Hosta sieboldiana were mostly far less than 100 Bq f-kg-1 even in the sites where the amount of deposition was large. Determining the range of amount of radiocesium deposition where the radiocesium concentration in plant body is below the standard level will be useful as an information for making a decision for lifting shipping restrictions of wild edible-wild plants. It should be done based on the data like in Fig. 2 and with considering 134Cs concentrations.
4 Challenges in the future
The locality of wild edible-wild-plant sample has so far been shown in the unit of municipality in most local governments’ monitoring. Collecting higher spatial resolution data, e.g., recording locality at the section of municipality level, or by latitude/longitude, will reduce uncertainty of the estimated amount of active cesium deposition models in Fig. 2 and improve accuracy of predicted values of radiocesium concentration. Challenges include improvement of methodology to monitor radioactive materials in plants; development of methodologies to predict radioactive material concentration; and development of simplified methodologies to lift shipping restrictions for wild edible-wild plants.
References 1) Forestry Agency, “About the results of survey on the
distribution of radioactive materials in forest (the secondreport)”. Press release, December 27, Forestry Agency,2011. http://www.rinya.maff.go.jp/j/press/hozen/111227_2.html (in Japanese)
2) Kiyono Y, Akama A, “Radioactive cesium contaminationof edible wild plants after the accident at the Fukushima
59

Daiichi Nuclear Power Plant”, Japanese Journal of Forest Environment, 55(2), 113–118, 2013
3) Ministry of Education, Culture, Sports, Science andTechnology, “About ①the measurement result of the6th aircraft monitoring and ② the measurement resultof aircraft monitoring out of range 80 km fromTEPCO's Fukushima Daiichi Nuclear Power Station”.1st March 2013. Press release http://radioactivity.nsr.go.jp/ja/contents/4000/3710/24/1305820_20110506.pdf (in Japanese)
4) Yamaguchi N, Takata Y, Hayashi K, Ishikawa S, Kuramata M, Eguchi S, Yoshikawa S, Sakaguchi A, Asada K, Wagei R, Makino T, Akahane I, Hiradate S, “Behavior of radiocesium in soil-plant systems and its controlling factor”, Bulletin of National Institute for Agro-
Environmental Sciences, 31 , 75–129, 2012 (in Japanese)
5) Butkus D, Konstantinova M, “Studies of 137Cs transfer insoil-fern system”, Journal of Environmental Engineering and Landscape Management, XIII(3), 97–102, 2005
6) Bunzl K, Kracke W, “Seasonal variation of soil-to-planttransfer of K and fallout 134, 137Cs in peatland vegetation”,Health Physics, 57(4), 593–600, 1989
7) Rantavaara A, Vetikko V, Raitio H, Aro L, “Seasonalvariation of the 137Cs level and its relationship with potassium and carbon levels in conifer needles”. Science of the Total Environment 441, 194–208, 2012
Fig. 2 Relationship between the amount of 137Cs deposition to the ground surface by the accident the accident at TEPCO's Fukushima Daiichi Nuclear Power Station and 137Cs concentration in the edible portion of 12 wild edible-wild-plant species 2–3 years after the accident.
60
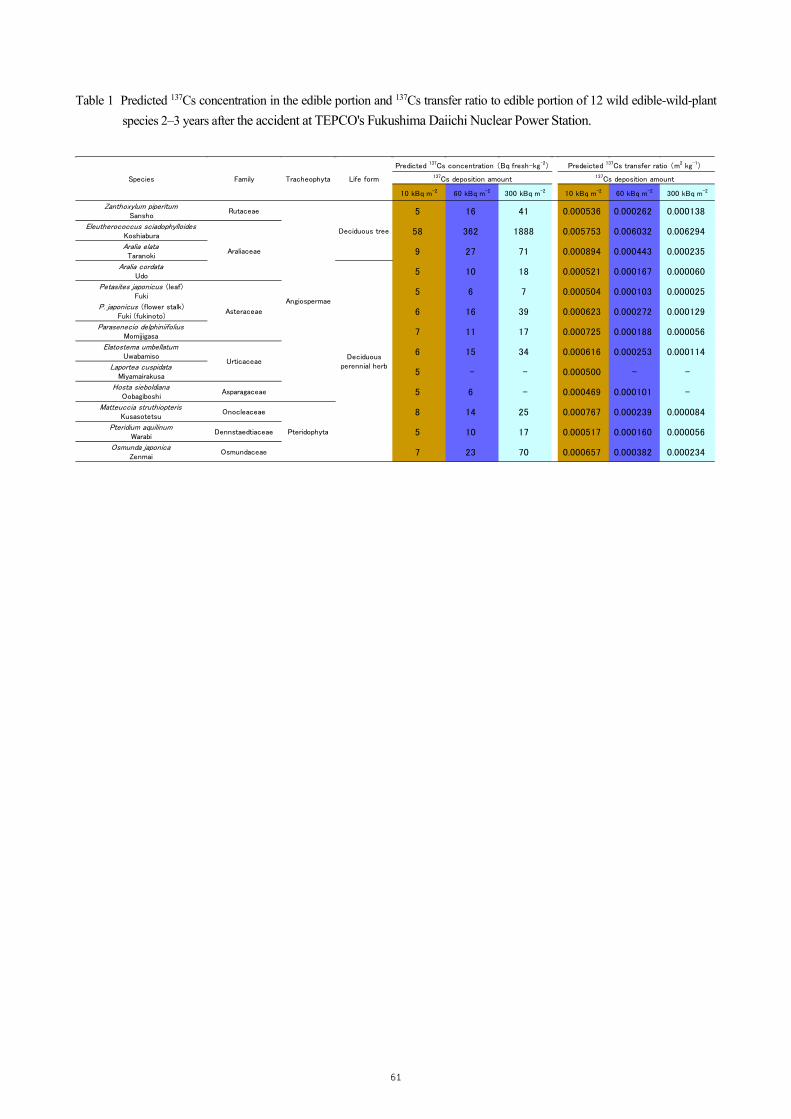
Table 1 Predicted 137Cs concentration in the edible portion and 137Cs transfer ratio to edible portion of 12 wild edible-wild-plant species 2–3 years after the accident at TEPCO's Fukushima Daiichi Nuclear Power Station.
Predicted 137Cs concentration (Bq fresh-kg-2) Predeicted 137Cs transfer ratio (m2 kg-1)
137Cs deposition amount 137Cs deposition amount
10 kBq m-2 60 kBq m-2 300 kBq m-2 10 kBq m-2 60 kBq m-2 300 kBq m-2
Zanthoxylum piperitumSansho
Rutaceae 5 16 41 0.000536 0.000262 0.000138
Eleutherococcus sciadophylloidesKoshiabura 58 362 1888 0.005753 0.006032 0.006294
Aralia elataTaranoki 9 27 71 0.000894 0.000443 0.000235
Aralia cordataUdo 5 10 18 0.000521 0.000167 0.000060
Petasites japonicus (leaf)Fuki 5 6 7 0.000504 0.000103 0.000025
P. japonicus (flower stalk)Fuki (fukinoto) 6 16 39 0.000623 0.000272 0.000129
Parasenecio delphiniifoliusMomijigasa 7 11 17 0.000725 0.000188 0.000056
Elatostema umbellatumUwabamiso 6 15 34 0.000616 0.000253 0.000114
Laportea cuspidataMiyamairakusa 5 - - 0.000500 - -
Hosta sieboldianaOobagiboshi
Asparagaceae 5 6 - 0.000469 0.000101 -
Matteuccia struthiopterisKusasotetsu
Onocleaceae 8 14 25 0.000767 0.000239 0.000084
Pteridium aquilinumWarabi
Dennstaedtiaceae 5 10 17 0.000517 0.000160 0.000056
Osmunda japonicaZenmai
Osmundaceae 7 23 70 0.000657 0.000382 0.000234
Pteridophyta
Species Family Tracheophyta Life form
Angiospermae
Deciduous tree
Araliaceae
Deciduousperennial herb
Asteraceae
Urticaceae
61

Examination of Iodine-131 Concentrations in Food and Drink in the Early Phase after the
Accident
Masaki Kawai1*, Nobuaki Yoshizawa1, Sachiko Hirakawa1, Kana Murakami1, Mari Takizawa1, Osamu Sato1, Shunji Takagi1, Hirokazu Miyatake1,
Tomoyuki Takahashi2, Gen Suzuki3
1) Mitsubishi Research Institute, Inc.: 2-10-3, Nagata-cho, Chiyoda-ku, Tokyo2) Kyoto University Research Reactor Institute: Asashironishi 2-chome, Kumatori-machi, Sennan-gun, Osaka
3) International University of Health and Welfare Clinic: 2600-6, Kitakanemaru, Otawara-city, Tochigi*[email protected]
Radioactivity concentrations in food and drink, represented herein by water and vegetables, have been monitored continuously since the Fukushima Daiichi Nuclear Power Plant accident occurred, with a focus on radioactive cesium. Radioiodine, on the other hand, was not measured systematically in the early phase after the accident. The values of radioactivity concentrations in food and drink are absent, though they are essential when estimating radiation levels resulting from internal exposure due to ingestion pathway. When the internal dose from ingestion in the evacuation areas is estimated, water is considered as the main ingestion pathway, and vegetables and milk are considered as not the main pathway, considering effects of food distribution suspension due to the evacuation. In this study, we estimated the absent values of radioactivity concentrations in water in the early phase after the accident, using measurement values of radioactivity concentration and iodine-131 deposition rate on the ground calculated from atmospheric dispersion simulation. We used a compartment model as an estimation method, and considered how drinking water would be affected by radioactive materials deposited into the water source. We estimated the values of transfer parameters in the compartment model based on the measurement values. As for vegetables, we derived a correlation expression between measurement values of radioactivity concentrations and iodine-131 deposition rate on the ground using atmospheric dispersion simulation. For our future work, we examine the internal dose from intake considering the situation of food and drink intake after the accident using the estimation method.
Keywords; radioactive concentrations in food, Iodine 131 and compartment models
1. IntroductionRadioactive materials were discharged into the atmosphere after the accident at Fukushima Daiichi Nuclear Power Plant of Tokyo Electric Power Company, resulted from the Great East Japan Earthquake which occurred on March 11, 2011. When trying to assess health risks to local residents, it is important to grasp how much radiation they were exposed to by radioactive substances. The reports from the following two international institutions are typical in the dose estimation systematically from the recent accident. World Health Organization (WHO,) with the aim of considering measures to reduce health effects of exposure to radiation through emergency response measures after the accident, conducted a temporary evaluation using information obtained at that time, and released a report in 20121). United Nations Scientific Committee on the Effects of Atomic Radiation (UNSCEAR), taking into consideration
information dating back two years after the accident, released a report in 2014. The report estimated more closely to the actual situation than that provided by WHO2). For this reason, we considered an estimation method to calculate the radiation dose of internal exposure due to intake of tap water, vegetables and milk, in order to grasp the internal dose from food and drink. In this study, the estimation mainly covered the evacuation areas, where estimating the dose was considered to be particularly important in the early phase after the accident. For reference, we used the results of WSPEEDI established by the Japan Atomic Energy Agency (JAEA), National R&D Corporation, in order to obtain deposition rate 3).
62

2. Estimation Method
(1) Estimation Method for Iodine-131 Concentration of Tap Water To estimate iodine-131 concentration of tap water, we used a compartment model where radionuclides contained in tap water are deemed to attenuate at a fixed rate to their concentration, and increase at every new depositions. In estimating iodine-131 concentration of tap water through the compartment model, changes in radioactivity concentration in tap water are represented by the rate of radionuclides newly deposited into water and effective attenuation of radionuclides contained in water.
CptC λ−=
dd (1)
Where C=iodine-131 concentration in drinking water (Bq/kg), p=rate of deposition into water (Bq/kg・s), and λ=effective attenuation coefficient (l/s). Formula (1) can be represented as follows, provided the rate of deposition into water is replaced by the rate of radionuclides deposition on the ground, which is calculated using atmospheric dispersion simulation and conversion coefficient.
( )'
'dd
app
CaptC
=
−=
λ (2)
Where p'=rate of iodine-131 deposition on the ground (Bq/m2・s), and a=conversion coefficient (m2/kg). Conversion coefficient and effective attenuation coefficient are determined using the least squares method and finding the best fit, substituting measurement values of iodine-131 concentration in tap water. Based on this estimation method, data necessary for estimating iodine-131 concentration in tap water are iodine-131 concentration values actually measured in tap water and the rate of deposition on the ground calculated from atmospheric dispersion simulation. As for measurement values of iodine-131 concentration, we collected data contained in publicly-available information, which was obtained at water purifying facilities or drinking spaces of running water at local municipal offices. In addition, tap water travels until it reaches each drinking space, starting from the source of tap water, then on to a purifying facility and a distribution facility. Radionuclides in the atmosphere are more likely to deposit into water at the source and at some parts of a water purifying facility, via these relay points. Water distributed through a water purifying facility to each household, on the other hand, seems less affected by radionuclides deposition, as most of the tap water piping goes under the ground or indoor. Taking into account all these conditions, the water source is deemed to be the place where radionuclides are deposited, when the rate of deposition on the ground is calculated from atmospheric dispersion simulation.
When the location of water source is not identified, a purifying facility is substituted. It is assumed that it takes twelve hours for tap water to be taken in after the deposition of radionuclides.
(2) Estimation Method for Iodine-131 Concentration of Vegetables As for iodine-131 concentration in vegetables, from both the rate of radionuclide deposition on the ground, calculated via atmospheric dispersion simulation, and measurement values of radioactive concentration, the following estimation method is considered.
FSA = (3) Where A=iodine-131 concentration in a vegetable (Bq/kg), F=conversion coefficient (m2/kg), and S=amount of accumulated deposition on the ground at the time of harvest (Bq/m2). Conversion coefficient necessary for estimating iodine-131 concentration in vegetables is determined based on measurement values, according to vegetable category (leaf and stem vegetables, mushroom vegetables, etc). As for leaf and stem vegetables, spinach, for which there is a wealth of measurement data, is utilized to obtain conversion coefficients. As for mushroom vegetables, shiitake mushroom, for which there is a wealth of measurement data, is used to obtain conversion coefficients. In addition, under the supposition that deposition effect due to rain can be excluded as it is protected by roof, for example, only dry deposition is taken into consideration, as far as indoor-grown vegetables (incl. mushrooms) are concerned.
(3) Estimation Method for Iodine-131 Concentration in Milk To estimate iodine-131 concentration in milk, a model is considered where intake ratios of outside feedstuffs and the other feedstuffs, and transfer coefficients of radionuclides deposited onto each feedstuff are taken into consideration. Radioactive transfer coefficient of each feedstuffs and ratios are estimated based on the measurement data. Fig.1 shows the concept of the model considered. Based on the model, iodine-131 concentration is estimated using the following formula.
𝐴𝐴 = {𝛼𝛼𝐹𝐹1 + (1 − 𝛼𝛼)𝐹𝐹2}𝑆𝑆 (4) 𝐹𝐹1 = 𝑇𝑇𝑓𝑓 × 𝑓𝑓1 ,𝐹𝐹2 = 𝑇𝑇𝑓𝑓 × 𝑓𝑓2 (5)
Where A=iodine-131 concentration in milk (Bq/kg), S=accumulated deposition amount on the ground (Bq/m2), 𝛼𝛼 =intake ratio of milk from cows fed with outside feedstuffs, f1=transfer coefficient of radionuclides onto outside feedstuffs (m2/kg), f2=transfer coefficient of radionuclides onto the other feedstuffs (m2/kg), F1=transfer coefficient from outdoor feedstuffs to milk (m2/kg), F2=transfer coefficient from the other feedstuffs to milk (m2/kg) and Tf =transfer coefficient from feedstuffs to milk.
3. Estimation Results
63

(1) Estimation Result of Iodine-131 Concentration in Tap Water The results of estimating iodine-131 concentration in tap water using a compartment model are shown. Fig.2 shows an estimation based on measured data of Kawamata Central Park in Kawamata Town, and Fig.3 shows an estimation based on measured data of Yamatama Water Purifying Facility in Iwaki City. Estimation results change according to rates of iodine-131 deposits on the ground calculated via atmospheric dispersion simulation, and measurement values of iodine-131 concentration in tap water.
(2) Estimation Result of Iodine-131Concentration in Vegetables The logarithmic graph below indicates actual values of iodine-131 concentration in vegetables (spinach and shiitake mushroom) and amounts of deposition on the ground from atmospheric dispersion simulation. Table.1 shows results of estimating conversion coefficients, obtained by following the model formula. The graph of spinach highlights three dots indicating a different tendency from the others.
(3) Estimation Result of Iodine-131 Concentration in Milk To estimate iodine-131 concentration in milk, we divided measurement data obtained from milk into three classes, and performed a fitting using as parameters, ‘the ratio of outside feedstuffs and other feedstuffs’, and ‘transfer coefficients of outside feedstuffs and the other feedstuffs’. As a result of parameter consideration, ratios of outside feedstuffs, measurement values, and amounts of ground deposition from atmospheric dispersion simulation are shown in Fig.6. In addition, transfer coefficients for each feedstuffs, with which fitting is performed, is shown in Table 2. The result of fitting indicates that the transfer coefficient of radionuclides from outdoor feedstuffs to milk is forty times that from the other feedstuffs to milk.
4. Consideration
Estimations of iodine-131 concentration in food find that it coincide in two measured points where the amounts of iodine-131 deposits were substantial and the values of iodine-131 concentration in tap water were actually measured. These results proved that iodine-131 concentration in tap water can be estimated using the rate of iodine-131 deposited onto the ground from atmospheric dispersion simulation. However, we must take into consideration that estimated values may change according to different distance, because deposition rate after the accident varies considerably, despite being merely several kilometers apart. In addition, the facility effect of a water purifying facility is factored into parameters such as conversion
coefficients in the model using measurement values, as some reports say that it can reduce the amount of iodine-131. As for vegetables and milk, conversion coefficients were determined from measurement data of iodine-131 concentrations. By using these conversion coefficients, and by using deposition rates calculated from atmospheric dispersion simulation, it is possible to estimate iodine-131 concentrations in vegetables and milk from any point. As for vegetables, the result showed that three points have a different tendency from the others. These points share similarities in that they are far from the nuclear power plant, from which we might as well consider setting different conversion coefficient according to distance. However, we have confirmed that the estimation will not be an underestimation, even though the determined conversion coefficient is used for estimation at the points which have a different tendency. As for milk, there is a problem that iodine-131 concentration in milk is largely different in the same area, but it can be explained by the estimation method of categorizing ‘animal feedstuffs’ into ‘outside feedstuffs’ and ‘the other feedstuffs’. However, as the ratio of each feedstuff is an assumption in this research, it should be noted that there is a large uncertainty in our estimation models.
5. Conclusions and Future Work
We confirmed that iodine-131 concentrations of drinking water, vegetables and milk can be estimated, even during the period or at the points without measurement data in the early phase after the accident. We have decided to consider internal dose from ingestion, taking into consideration the situation of food intake shortly after the accident. As for consideration of internal dose, we should use measurement data for the period with measuring. For the period without measurement data, we use estimated values, with giving priorities to actual data as much as possible, and try to reflect them in the results. Furthermore, we consider estimation uncertainty of models quantitatively and reduce uncertainty of internal dose from ingestion in the early phase after the accident. As for vegetables and milk, in particular, so as to reduce uncertainty of models, we need to collect measurement data and improve estimation models based on an actual situation. We limited our estimations to iodine-131, however, we also need to undertake the estimation for other radionuclides, including cesium, using the same model in the early phase after the accident. Cesium, different from iodine-131, has a longer half-life and the measurement data is usable during the period. For this reason, in case of cesium, we need to consider estimation methods for iodine-131 concentration and internal dose that are more based on actual data.
64
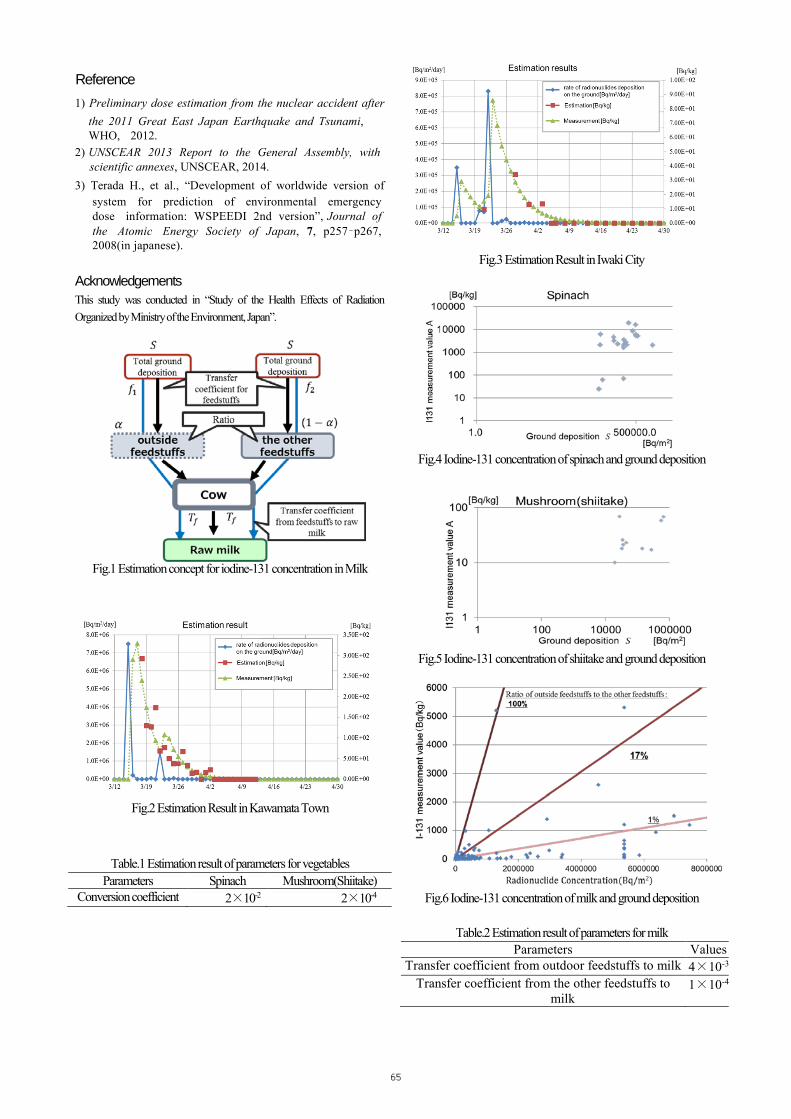
Reference
Fig.1 Estimation concept for iodine-131 concentration in Milk
Fig.2 Estimation Result in Kawamata Town
Table.1 Estimation result of parameters for vegetables Parameters Spinach Mushroom(Shiitake)
Conversion coefficient 2×10⁻² 2×10⁻⁴
Fig.3 Estimation Result in Iwaki City
Fig.4 Iodine-131 concentration of spinach and ground deposition
Fig.5 Iodine-131 concentration of shiitake and ground deposition
Fig.6 Iodine-131 concentration of milk and ground deposition
Table.2 Estimation result of parameters for milk Parameters Values
Transfer coefficient from outdoor feedstuffs to milk 4×10⁻³
Transfer coefficient from the other feedstuffs to milk
1×10⁻⁴
65
1) Preliminary dose estimation from the nuclear accident afterthe 2011 Great East Japan Earthquake and Tsunami, WHO, 2012.
2) UNSCEAR 2013 Report to the General Assembly, withscientific annexes, UNSCEAR, 2014.
3) Terada H., et al., “Development of worldwide version ofsystem for prediction of environmental emergency dose information: WSPEEDI 2nd version”, Journal of the Atomic Energy Society of Japan, 7, p257–p267, 2008(in japanese).
Acknowledgements This study was conducted in “Study of the Health Effects of Radiation Organized by Ministry of the Environment, Japan”.

The distributions of radiocesium in seawaters and sediments collected off the Niida River estuary, Fukushima Prefecture
Miho Fukuda1) *, Shinnosuke Yamazaki1), Tatsuo Aono1), Satoshi Yoshida1),
Takashi Ishimaru2) and Jota Kanda2)
1) Project for Environmental Dynamics and Radiation Effects, Fukushima Project Headquarters, National Institute ofRadiological Sciences, 4-9-1 Anagawa, Inage-ku, Chiba 263-8555, Japan
2) Department of Ocean Sciences, Tokyo University of Marine Science and Technology, 4-5-7 Konan, Minato-ku,Tokyo 108-8477, Japan
* Corresponding author:[email protected]
Lateral and vertical distribution of radiocesium, grain size and organic matter content off the Niida River estuary, Fukushima Prefecture were investigated in mid-October 2013. The dissolved 137Cs activities in surface water samples collected at NR1, NR3 and NR5 stations, which are located within 5.0-10 km from the Niida River estuary, were higher than those of other stations outside the 10 km zone. In bottom water samples, the activities had a small variation with distance from the estuary. The activities in surface water at most stations were higher than those in bottom water. There were a negative correlation between dissolved 137Cs activities and salinity in surface water. These results suggested that the dissolved radiocesium in seawater have been transported to north-south direction in surface layer along the continent. High fractions for coarse to very fine sand particles in the sediments were observed at NR1 and NR2 stations, which are located in a northern direction from the Niida River estuary. At NR4, there were high fractions for granule and very coarse sand particles. The grain size fraction became granular with increasing core depth. The 137Cs activities in sediments at NR1 were higher compared to those of other stations. It seems that lateral and vertical distributions of radiocesium in sediments were affected by the particle composition. It is necessary to get more station data because the vertical profiles of 137Cs activity were not especially similar to those of grain size and contents in sediments. Thus, it is necessary to continue the monitoring in the estuary area in order to elucidate the effects of the grain size and contents on cesium in the sediments found off the Fukushima Prefecture coast.
Keywords: off Niida River estuary, radiocesium, seawater, marine sediment, particle composition
1. Introduction
The Fukushima Dai-ichi Nuclear Power Station(FDNPS) accident in March 2011 resulted in large releases of artificial radionuclides including 134Cs and 137Cs (radiocesium, radio-Cs) into the environment. There are three input pathways of radionuclides to the marine environment: atmosphere deposition, direct discharge and river water input. As of January 2015, the 137Cs activities in seawater had decreased1) more than 10 times compared to these before the accident (in the early 2000s these activities were 1.0~2.0 mBq/L2)) within the 20 km zone from the power station. However, the activities in sediments have decreased more slowly than those in seawater and they have had large fluctuations with time. In contrast, sediments consist of particles of several grain sizes. In sediments, radio-Cs ions are strongly adsorbed onto clay minerals such as vermiculite and smectite3). Radio-Cs activities in riverine sediments tend to be high for finer grains because these have a large specific surface area4). It is necessary to consider the differences of grain size composition in sediments in order to compare the lateral and vertical distributions of radio-Cs in sediments.
It is insufficient to report just the transition process from a river to the ocean. In this study, the Niida River estuary was focused on, because the upstream portion of this river is located in the Iidate Village, which was an area of high radio-Cs deposition from the accident. The distributions and behaviors for radio-Cs were elucidated based on the results of the radio-Cs activity, grain size composition and organic matter contents in seawater and sediments.
2. Sample collection and preparation
Seawater and sediment core samples were collected in mid-October 2013 during the SY13-10 cruise of the Training Vessel (T/V) “Shinyo-maru”, which is owned by Tokyo University of Marine Science and Technology, (Fig. 1). The collection stations were located in a zone of 5.0-12 km from the Niida River estuary, Fukushima Prefecture. After transporting all the samples to our laboratory, we filtered the seawater samples through a 0.2 μm filter. Radio-Cs in the seawater samples was concentrated by an improved ammonium phosphomolybdate (AMP) method5). The radio-Cs activities were measured by gamma-ray
66

spectrometry using a high-purity Ge detector (GX-2019; Canberra), and the detection limits were ~1 mBq/kg. Collected sediment cores were cut into 1 cm thick slices and dried at 60 ℃ . Radio-Cs activities were measured with the same Ge detector as for the seawater samples. Then, the dried sediments were separated into four classes, based on grain sizes, using several mesh sizes: granules (grain size larger than 2 mm); very coarse to coarse sand particles (1-2 mm); coarse to very fine sand particles (0.063-1 mm); and silt to clay particles (smaller than 0.063 mm). The ignition losses of the sediment samples were also measured in order to estimate organic matter contents; for this, we used a high temperature microwave muffle furnace at 550 ℃ for the 2 hours. Radio-Cs activities in seawater and sediments were corrected to sampling date of October 16, 2013.
3. Weather conditions at the time of sampling
In mid-October 2013, the typhoon “Wipha” passedthrough the eastern part of the main Japanese island. At the Haranomachi weather station, the total amount of rainfall was more than 100 mm on October 16, 2013, which was the sampling date for this study6).
4. Results
The 134Cs /137Cs activity ratios in seawater andsediments corrected to March 11, 2011, ranged from 0.85 -1.2. Therefore, these samples have been influenced by the FDNPS accident. Here, we report the 137Cs activities.
(1) Dissolved radiocesium activity in seawater Dissolved 137Cs activities in seawater were 2.8-96 mBq/L (Fig. 2). In surface water, 137Cs activities at NR1, NR3 and NR5 stations, which are located within the 5.0-10 km zone from the Niida River estuary, were more than 40 mBq/L. These activities tended to be high for stations in the southern direction. 137Cs activities at NR2, NR4 and NR6 stations, outside the 10 km zone, were lower than 20 mBq/L. In bottom water samples, it is not unclear whether there were relationships between these activities and distance from the river estuary (Fig. 3). The 137Cs activities in surface water samples were higher than in bottom water samples (Fig. 2).
(2) Distributions according to grain size in sediments Fractions for the classes of granules, very coarse sand, coarse to very fine sand, silt to clay particles were: 0.0-35 %, 0.013-35 %, 38-99 %, and 0.0-29 %, respectively (Fig. 4). The fractions for coarse to very fine sand particles represented more than 70 % of the total particle amount for each sediment layer and the highest fractions were obtained at NR1 and NR2, which are located northward from the river estuary. In contrast, fractions for granules and very coarse sand particle at NR4, which is located in an area of the same latitude as the river estuary, were relatively high and the total fraction for these particles ranged from 20-62 %. Grain size fractions became granular with increasing core depth (Fig.4). Medium diameter (Md; mm) values at NR1, NR2 and NR4 were 0.14-0.15, 0.13-0.16 and 0.16-2.5,
respectively. The selections at NR1, NR2 and NR4 were 3.1-4.6, 1.9-6.2 and 2.4-5.0, respectively and is not good based on the classification proposed by Compton7).
(3) 137Cs activities in bulk sediments In bulk sediments, the only artificial radionuclides detected were radio-Cs. 137Cs activities in sediments were 4.3-838 Bq/kg-dry (Fig. 5). 137Cs activities at NR1 were higher than those of the other stations. There was a maximum layer at the 5 cm core depth at NR1. At NR2 and NR4 stations, vertical fluctuations of 137Cs activities were small.
(4) Organic matter contents in bulk sediments The ignition losses of organic matter contents were 0.93-8.8 % (Fig. 6). Organic matter contents for NR1 station sediment samples increased slightly with increasing core depth. These at the NR2 and NR4 stations showed only a small variation.
5. Discussion(1) Potential for controlling dissolved 137Cs activities in seawater
The 137Cs activities in seawater reported through 2012 were 8.5-99 mBq/kg in the Niida River estuary1) and our present values were within the range. In surface water, the salinity at NR1, NR3 and NR5 stations (32-33) were slightly lower than those at NR2, NR4 and NR6 stations (about 33). On the other hands, those values in bottom water were 33-34 and the differences between the stations had small compared to those in surface water. These results seems that fresh water originating from the Niida River has transported to north-south direction in surface layer along the continent. It seems that the distributions for 137Cs activity in surface water reflect influence of river input.
(2) Factors affecting distributions according to grain size in sediments The seabed north from the Niida River estuary mainly consist of sandy and rudaceous textures, while the seabed to the south consists of coarse textures8). For this study, the distributions we obtained according to grain sizes were similar to these trends. There were very different distributions according to grain sizes at each station since the distances at each station were 6.2-7.1 km. At the Haranomachi station, located in the Niida River, relatively coarser particles (grain size: 30-200 μm) were observed during the 2013 typhoon “Wipha” compared to particles observed in normal weather periods9). It seems that relatively coarse particles such as granules and very coarse sand particles were transported eastward from this river. However, it is unclear whether these results were a particularly effect of the rain event due to the typhoon or not.
(3) Factors affecting 137Cs activity variation in sediments In the estuary area, radio-Cs flux from rivers to the ocean in Fukushima Prefecture was 30-50 % of the annual radiocesium flux during heavy rain events in 201110). In
67

October 2013, 137Cs activities in sediments near the Niida River estuary were 3.0-44 Bq/kg-dry1), 11). At the NR2 and NR4 stations, 137Cs activities were within the range and those at the NR1 station were one order of magnitude higher. The fluctuations for 137Cs activity with core depth at the NR1 station were larger than those at NR2 and NR4 (Fig. 5). In the area near the FDNPS, fluctuations for 137Cs activity with core depth for coarse to very fine sand particles, and silt to clay particles were larger than those for granules and very coarse sand particles12). It seems that 137Cs activities at the NR1 station were large because the fraction for silt to clay particles was higher than at the other stations. However, vertical fluctuations for silt to clay particle contents were small. Therefore, it is unlikely that the 137Cs activity distributions in sediments only depend on the difference of Cs-adsorption according to grain size. In the future, we will get data from more stations, in particular, temporal data.
6. Conclusions and future plans
Lateral and vertical distribution of radiocesium, grainsize and organic matter contents were observed in October 2013 is seawater and sediment samples collected off the Niida River estuary, Fukushima Prefecture. Our main findings based on these observations are given below (1) The 137Cs activities in surface water at the NR1, NR3 and NR5 stations, which are located within the 5.0-10 km zone from the Niida River estuary, were higher than those of the stations outside the 10 km zone. In bottom water samples, the 137Cs activities had a small variation with a distance from the Niida River estuary. The vertical profiles of 137Cs activities in surface water at the stations, except for NR4, were higher than those in bottom water. (2) Fractions for coarse to very fine sand particles were highest at the NR1 and NR2 stations, which are located north from the Niida River estuary. In contrast, these for granules and very coarse sand particles at NR4 were the highest. Fractions according to grain size became more granular with increasing core depth. (3) The 137Cs activities at NR1, which had a high fraction for silt to clay, were the highest among the stations. There was a maximum layer near the 5 cm core depth at NR1. In contrast, the vertical changes of 137Ca activities at NR1 were small. Vertical profiles of 137Ca activity were not similar to the distributions according to grain size. (4) The ignition losses of organic matter contents at NR1 were slightly increased with increasing core depth. These vertical fluctuations at NR2 and NR4 stations were smaller than at NR2. (5) In this study, samples were collected after the typhoon “Wipha” had crossed Japan. It is unclear whether these results were particularly affected by rain events due to the typhoon or not. Thus, continuous monitoring in the estuary area is necessary in order to elucidate the effects of the grain size and organic matter contents on cesium in the sediments, because there are many rivers in Fukushima which flow into the sea, including 116 class B rivers and 339 class A rivers13).
Acknowledgement
We are grateful to Captain Hayashi and all crew members of the T/V “Shinyo-maru” for their on-board help during sample collection. This work was partially supported by Grants-in-Aid for Scientific Research on Innovative Areas, the Ministry of Education Culture, Sports, Science and Technology (MEXT), Japan (Nos. 24110004, 24110005) and Research and Development to Radiological Sciences in Fukushima Prefecture.
References
1) MEXT (Ministry of Education, Culture, Sports,Science and Technology) Available at http://radioacti- vity.nsr.go.jp/ja/list/428/list-1.html (2015).
2) P. P. Povinec, K. Hirose, T. Honda, T. Ito, E. M. Scott,O. Togawa, Spatial distribution of 3H, 90Sr, 137Cs and 239,240Pu in surface waters of the Pacific and Indian Oceans-GLOMARD database, Journal of Environ. Radioactiv, 76, 113-137: doi:10.16/j.jenvrad.2004.03.
022 (2004). 3) R. M. Cornell, “Adsorption of cesium on minerals: A
review” Journal of Radioanalytical and NuclearChemistry, 171(2), 483-500, doi: 10.1007/BF0221987
2 (1993). 4) Q. He, D. E. Walling, “Interpreting particle size effect
in the adsorption of 137Cs and unsupported 210Pb bymineral soils and sediments” Journal of Environ.Radioact, 20 (2), 117-137 (1996).
5) M. Aoyama, K. Hirose, “Radio metr icDeterminat ion o f anthropogenic radionuclides in seawater samples” Radioact. in the Environ. 11, 137–162 (2008).
6) Japan Meteorological Agency (JMA) data, 2013. Available online http://www.data.jma.go.jp/obd/stats/
etrn/. 7) R. R. Compton, Manual of field geology, Wiley New
York, (1962) p. 378.8) A. Mogi, Y. Iwabuchi, “Submarine topography and
sediments on the continental shelves along the coastsof Joban and Kashimanada” Geographical Review ofJapan series A, 34 (3), 39-58 (1961) (in Japanese withEnglish abstract).
9) JAEA reports, 2014. Abatable online http://radioactivi ty.nsr.go.jp/ja/list/504/list-1.html. 10) Nagao S, Kanamori, M, Ochiai S, Inoue M,
Yamamoto M. Migration behavior of 134Cs and 137Cs in the Niida river water in Fukushima Prefectre, Japan during 2011-2012. Journal of radional Nucl. Chem 2014; 10: doi:10.1007/s10967-014-3686-9.
11) Fukushima prefecture fisheries experimental stationdata, 2013. Available online https://www.pref.
fuku-shima.lg.jp/sec/37380a/suisanshikenjo20.html. 12) M. Fukuda, S. Yamzaki, T. Aono, S. Yoshida, S.
Naganuma, A. Kubo, K. Shimada, N. Takasawa, T. Hosaka, K. Sato, S. Yamaguchi, Y. Ito, T. Ishimaru, J. Kanda, “The distributions of radiocaesium according to grain sizes in sediments collected from the Fukushima coastal area in May 2014” to be published
68

in Proceedings of the 16th Workshop on Environmental Radioactivity, KEK proceedings. (accepted)
13) Fukushima prefecture, 2012 Available onlinehttp://www.pref.fukushima.lg.jp/uploaded/attachment/10205.pdf
Fig. 1 Sampling locations in the Niida River estuary.
Fig.2 Vertical profiles for137Cs activity in seawater.
Fig. 3 Relationships between 137Cs activities in seawater and distance from the Niida River estuary. Circles and triangles are 137Cs activities in surface and bottom water, respectively. The solid and dotted lines are regression curves of surface and bottom water, respectively.
Fig. 4 Fractions for each particle size group in sediment: granule (white), very coarse sand (light grey), coarse to very fine sand (dark grey) and silt to clay (black).
Fig. 5 Vertical profiles of 137Cs activities in sediment.
Fig. 6 Vertical profiles of organic matter contents in sediment.
69

Review of the gastrointestinal absorption rates
of cesium in human and animals from food
products and soil particles
Kayoko IWATA1)*
, Hiroshi YASHIMA2)
, Yuko KINASHI2)
,
Tomoyuki TAKAHASHI2)
, Sentaro TAKAHASHI1,2)
1)Graduate School of Agriculture, Kyoto University, Kitashirakawaoiwake-cho, Kyoto Sakyo-ku, Kyoto606-8502
JAPAN
2)Kyoto University Research Reactor Institute, 2, Asashiro-Nishi, Kumatori-cho, Sennan-gun, Osaka 590-0494 JAPAN
*iwata.kayoko.86x@st. kyoto-u.ac.jp
After the Fukushima Daiichi Nuclear Power Plant accident in 2011, public health concern s
have arisen about internal exposure to the radioactive nuclides from ingestion of contaminated
food products and soil. Internal exposure dose is estimated from the amount of ingested
radionuclides as committed effective dose by ingestion using the ICRP internal dosimetric
models. The models take account of various parameters such as gastrointestinal absorption rate
(f1). The ICRP recommended f1 value of 1 for cesium (Cs) in any kind of chemical forms.
However, previous studies have shown, for instance, Cs which strongly adsorbed to clay
minerals is difficult to be extracted; therefore, the absorption rate of Cs in gastrointestinal
tract varies depending on its existing form. Thus, more accurate f1 values for Cs in different
forms are important in order to estimate physiologically more realistic internal exposure dose.
In this study, we review previously published research on Cs absorption rates in human s and
animals from food products and soil part icles, and compare the f1 values among different
existing forms. The f1 value for Cs varies among different existing forms (studied samples
containing Cs). For example, f1 for humans has been reported to have a wide range of values
between 0.08 and 1.0. Nevertheless, the data for f1 are still limited. In order to estimate
internal exposure dose of Cs more accurately, it is important to accumulate data on f1 for
various samples and construct an f1 database for Cs.
Key Words: Cesium, Ingestion, Gastrointestinal absorption, Dose coefficient
1. Introduction
The Fukushima Daiichi Nuclear Power Plant accident
in 2011 led to a release of large amounts of radionuclides.
One of the major discharged radionuclides was
radiocesium. Since cesium-137(137
Cs) has a relatively
long physical half-life (T1/2 = 30.17 years), the
contamination in the environment is of both humans and
animal health concern. Ingestion of the contaminated
food products and soil particles causes internal exposure.
However, it is unfeasible to measure the internal
exposure doses (Sv) from radionuclides accurately.
Therefore, internal exposure dose is estimated from the
amount of ingested radionuclides (Bq) as committed
effective dose by calculation using dose coefficient for
internal exposure (Sv/Bq) recommended by the Internal
Commission on Radiological Protection (ICRP)1)
. The
dose coefficient for ingested 137
Cs, for instance, is 1.3 x
10-8
Sv/Bq1)
.The ingested amount of 137
Cs (Bq) is
converted to internal dose (Sv) by the dose coefficient.
The converted dose is expressed as the committed
effective dose (CED), which is the integration of dose
over 50 years for adults after the intake.
(1)ICRP models
The dose coefficient for each element is determined
based on multiple models. The models include intake
models, biokinetic models, and dosimetric models. The
intake models, such as of ingestion and inhalation,
describe the intake pathway and process. The biokinetic
70

models describe the distribution and retention of
elements in the body and specific organs. The dosimetric
models calculate the absorbed dose in each target organ
from the element in the source organ2)
.
The models take account of various parameters such
as gastrointestinal absorption rate (f1).The parameter f1 is
comprised in the gastrointestinal tract model of the
intake models. The ingested radioactive element is
assumed to be quickly absorbed at a rate of f1 from the
small intestinal tract to the blood after digestion in the
stomach. ICRP recommended The f1 for Cs
recommended by the ICRP is 1 in any chemical forms3)
.
Thus, for the ingestion of Cs, it is assumed to be
absorbed completely when it reaches the small intestinal
tract.
However, a previous experimental study has shown
that Cs which strongly adsorbs to soil particles is
difficult to be extracted4)
. The f1 of Cs could vary
depending on its existing form. The calculated CED is
likely close to the product of CED (when f1=1) and f1.
Therefore, the f1 may have significant influence on the
calculated CED result. Thus, more accurate f1 values Cs
in different existing forms are necessary in order to
estimate more physiologically realistic internal exposure
dose. In this study, we review the available experimental
data on f1 for Cs for humans and animals. Data for
animals are important because they can not only be used
for evaluation of the internal exposure dose and Cs
concentration of animals, but also are possibly used as a
reference for f1 range in different existing forms, which
human data is scarce. Furthermore, it may be utilizable
for use in the estimation of f1 values in human.
2. Review of f1 data for humans and animals
(1)Humans
The collected data were summarized in Table 1
(experimental studies) and Table 2 (a model study). Most
of these studies consisted of healthy volunteers who
ingested Cs in each of the studied existing form after the
Chernobyl accident.
The studies provided volunteers with beverage with
CsCl or cooked food products contaminated with
radioactive Cs. After consumption, their urine and fecal
samples were collected and measured. Some studies also
measured whole-body retention, using gamma-ray
detectors external to the body.
The model study by Giussani and Risica (2014) used
the experimental data obtained in the study operated by
Risica et al. 1992, 19975)-7)
. They modified adjustable
parameters, such as absorption rates for different food
products, and fit the model to the existing data.
(2)Animals
The collected data were summarized in Table 3. For
animals, absorption factor (A) is generally used. The
Table 2. Human gastrointestinal absorption rate (f1) of radiocesium estimated by model parameter fitting
Ingested forms Preparation No. of volunteers f1 (Mean) Reference
Meat Model calculation - 0.2-0.8 (0.66) Giussani and Risica 2014
Fish Model calculation - 0.2-0.9 (0.48) Giussani and Risica 2014
Pasta Model calculation - 0.9-1.0 Giussani and Risica 2014
Table 1. Human gastrointestinal absorption rate (f1) of radiocesium for various ingested forms
Ingested forms Preparation No. of volunteers f1 (Mean) Reference
CsCl Beverage 3 0.96-0.98 (0.97) Raaf et al. 2004
CsCl Beverage 4 0.87-0.90 (0.89) LeRoy et al. 1966
Silicate Gelatin capsule 5 0.73-0.84 (0.80) LeRoy et al. 1966
Fallout Gelatin capsule 3 0.29-0.36 (0.31) LeRoy et al. 1966
Fish (Perch) Fried 2 0.96, 0.97 (0.97) Raaf et al. 2004
Mushroom Fried 1 0.98 Raaf et al. 2004
Meat (Venison) Meal* 10 0.65-0.90 (0.78) Henrichs et al. 1989
Meat (Mutton) Meat pie 8 0.80-0.94 (0.89)* Talbot et al. 1993
Mushroom Fried 1 0.98 Raaf et al. 2004
Shellfish (Cockles) Boiled 6 0.08-0.43 (0.21) Hunt 1998
*Cooking method is unknown
71

reviewed animal experimental studies also consisted of
feeding Cs contaminated feed or materials to the
subjected animals and then collecting their urine and
fecal samples for analysis.
Salbu and Østby (1992) and Cooke et al. (1995)
performed extraction of Cs from the contaminated
materials, such as lichens and soils, using rumen liquid
and estimated A 8)-9)
.
3. Results and Discussion
The f1 values of Cs in humans are within a wide range
between 0.08 and 1.0. The f1 values estimated for meat
and fish in the model study were lower than other
experimental data. From the experimental results by
Hunt (1998) with shellfish, its f1 values show a very low
range compared to other food groups10)
. Low digestion
and absorption of Cs in the edible portion of shellfish or
sediment in the digestive tract of shellfish may have led
to the low f1 values. However, because there is limited
data on f1, further study and consideration of the
variation factors of f1 tendency are necessary.
The A of Cs in animals also shows a wide range. For
dissolved Cs forms, the A values were between 0.77 and
0.98 while the values for lichens had a wider range
between 0.17 and 0.72. It indicates that ionic Cs is
absorbed in the gastrointestinal tract more readily, but
the absorption rates of Cs in food products or other
contaminated materials depend on what the ingested
Table 3 Animal gastrointestinal absorption rate (A)* of radiocesium in various ingested forms
Ingested forms Studied animals No. of cases A (Mean) Reference
Solution Rat 4 (0.98) Moore and Comar 1962
Ionic Sheep 3 (0.86) Mayes et al. 1996
Ionic Sheep 6 (0.79) Mayes et al. 1996
Ionic Sheep 4 (0.77) Mayes et al. 1996
Ionic filters Sheep (lactating) 3 (0.84) Beresford et al. 1992
Grass Sheep 4 (0.82) Mayes et al. 1996
Grass hay Sheep 4 (0.68) Mayes et al. 1996
Grass+ herbage+ fungi Rumen liquid from sheep** 10 0.75-0.85 Salbu and Østby 1992
Grassy vegetation Sheep 4 (0.88) Beresford et al. 1992
Heather Sheep 2 (0.67) Beresford et al. 1992
Heather Sheep 2 (0.67) Beresford et al. 1992
Clover hay Sheep 3 (0.83) Mayes et al. 1996
Lichens Reindeer 4 0.52-0.72 Ahman et al. 1990
Lichen Rumen liquid from sheep** 1 0.32 Salbu andØstby 1992
Lichen (fallout) Reindeer 6 0.17 Skuterud et al. 2004
Lichen (CsCl-sprayed) Reindeer 8 0.65-0.67 Skuterud et al. 2004
Litter Rumen liquid from sheep** 8 (0.06) Salbu andØstby 1992
Fuel particle Rat 4 0.0075 Talbot et al. 1993
Bentonite Sheep 3 (0.56) Mayes et al. 1996
Silt Sheep 6 (0.095) Mayes et al. 1996
Ravenglass silt Sheep 4 (0.88) Beresford et al. 1992
Ravenglass silt Sheep (lactating) 3 (0.13) Beresford et al. 1992
Silica Sheep 4 (0.54) Mayes et al. 1996
Soil (Alluvial gley) Sheep 4 (0.19) Cooke et al. 1996
Soil (Lysimeter peat) Sheep 3 (0.03) Cooke et al. 1996
Soil (Alluvial gley) Rumen liquid** - (0.074) Cooke et al. 1995
Soil (Lysimeter peat) Rumen liquid** - (0.011) Cooke et al. 1995
Soil (Peaty ranker) Rumen liquid** - (0.13) Cooke et al. 1995
*Absorption coefficient for animals, which corresponds to human f1, **Data from extraction method
72

materials are and how they were contaminated. After the
Chernobyl accident, contamination of food animals
(ruminant like sheep and cattle) was one of the major
concerns in western countries. Experimental studies have
been conducted with those animals as subjects. However,
their digestive tract systems are quite different from that
of humans. Thus, more studies need to be done for
further improvement of the Cs intake model for humans.
4. Conclusion
This review study showed that the f1 and A values
have wide range among different existing forms and
individuals in both humans and animals. For some
existing forms, f1 values were quite smaller than 1.0,
which leads to an overestimation of CED. Therefore,
validation of as many parameters as possible is important
for a more representative estimation of f1 values for each
existing form. Currently, the data of f1 for food products
are still limited. In addition, it is difficult to obtain more
human experimental data at present. In order to estimate
internal exposure dose of Cs more accurately, it is
important to accumulate data on f1 for various samples
and construct a f1 database for Cs. Thus, more
experimental data of animals and model studies need to
be performed.
References
73
1) ICRP. “Age-dependent doses to the members of thepublic from intake of radionuclides-Part 5 compilation of ingestion and inhalation coefficients, ” ICRP Publication 72. ICRP (1995).
2) Kimura, M., Kinase, S. and Hato, S. “Development ofinternal dosimetry evaluation code for chronic exposure,”JAEA (2012).
3) ICRP. “Limits for intakes of radionuclides by workers,”ICRP Publication 30. ICRP (1979).
4) Ellickson, K.M., Schopfer, C.J. and Lioy, P.J. “Thebioaccessibility of low level radionuclides from twoSavannah River site soils,” Health Phys. 83(4), pp476-787 (2002).
5) Giussani, A. and Risica, S. “Considerations on the ICRPmodel predictions of the transfer of 137Cs from food to themilk and urine of lactating mothers,” J. Radiol. Prot. 34,pp N19-N30 (2014).
6) Risica, S., Campos Venuti. G., Rogani, A., Baronciani, D.and Petrone M. “Caesium contamination in human milkand transfer factor from diet,” Analyst. 117, pp 511-514(1992).
7) Risica, S., Rogani, A., Tancredi, F., Grisanti, A., Grisanti,G., Baronciani, D., Del Prete, A. and Zanini, R. “Caesium transfer to placenta, urine and human milk,” Proc. IAEA
Int. Conf. One Decade After Chernobyl: Summing up the Consequences of the Accident. IAEA-TECDOC-964 (Vienna: IAEA), pp 215-220 (1997).
8) Salbu, B. and Østby, G. “Availability of caesium isotopesin vegetation estimated from incubation and extractinexperiments,” Analyst. March. 117, pp 487-491 (1992).
9) Cooke, A.L., Green, N., Rimmer, D.L., Weekes, T.E.C.and Wilkins, B.T. “Development if an in-vitro method toassess the availability of soil-associated radionuclides foruptake by ruminants,” J. Environ. Radioactivity. 28(2), pp191-207 (1995).
10) Hunt, G.J. “Transfer across the human gut ofenvironmental plutonium, americium, cobalt, caesium and technetium: studies with cockles (Cerastoderma edule)from the Irish Sea,” J. Radiol. Prot. 18(2), pp 101-109(1998).
11) Rääf, C.L., Falk, R., Thornberg, C., Zakaria, M. andMattson, S. “Human metabolism of radiocaesiumrevisited,” Radiat. Prot. Dosim. 112(3), pp 395-404(2004).
12) LeRoy, G.V., Rust, J.H. and Hasterlik, J. “Theconsequences of ingestion by man of real and simulatedfallout,” Health Phys. 12, pp 449-473 (1966).
13) Henrichs, K., Paretzke, H.G., Voigt, G. and Berg, D.“Measurements of Cs absorption and retention in man,”Health Phys. 57(4), pp 571-578 (1989).
14) Talbot, R.J., Newton, D., Warner, A.J., Walters, B. andSherlock, J.C. “Human uptake of 137Cs in mutton,” HealthPhys. 64(6), pp 600-604 (1993).
15) Moore, W. Jr. and Comar, C.L. “Absorption of caesium137 from the gastro-intestinal tract of the rat,” Int. J. Rad.Biol. 5(3), pp 247-254 (1962).
16) Mayes, R.W., Beresford, N.A., Howard, B.J.,Vandecasteele, C.M. and Stakelum, G. “Use of the trueabsorption coefficient as a measure of bioavailability ofradiocaesium in ruminants,” Radiat. Environ. Biophys. 35,pp 101-109 (1996).
17) Beresford, N.A., Mayes, R.W., Howard, B.J., Eayres,H.F., Lamb, C.S., Barnett, C.L. and Segal, M.G. “Thebioavailability of different forms of radiocaesium fortransfer across the gut of ruminants,” Radiat. Prot. Dosim.41(2/4), pp 87-91 (1992).
18) Åhman, B., Forberg, S. and Åhman, G. “Zeolite andbentonite as caesium binders in reindeer feed,” Rangifer. 3,pp 73-82 (1990).
19) Skuterud, L., Pedersen, Ø., Staaland, H., Røed, K.H.,Salbu, B., Liken, A. and Hove, K. “Absorption, retentionand tissue distribution of radiocaesium in reindeer: effectsof diet and radiocaesium source,” Radiat. Environ.Biophys. 43, pp 293-301 (2004).
20) Talbot, R.J., Newton, D. and Segal, M.G.“Gastrointestinal absorption by rats of 137Cs and 90Sr fromU3O8 fuel particles: implications for radiation doses toman after a nuclear accident,” Radiat. Prot. Dosim. 50(1),pp 39-43 (1993).
21) Cooke, A.L., Green, N., Rimmer, D.L., Weekes, T.E.C.,Wilkins, B.T., Beresford, N.A. and Fenwick, J.D.“Absorption of radiocaesium by sheep after ingestion ofcontaminated soils,” Sci. Total. Environ. 192, pp 21-29(1996).

Transfer of radioactive cesium to earthworms
after the Fukushima Daiichi nuclear power
plant accident
Sota Tanaka1)
*, Tomoyuki Takahashi2)
, Keiko Fujiwara2)
, Sentaro Takahashi1)2)
1) Kyoto University Graduate School of Agriculture, Kitashirakawa Oiwake-cho, Sakyo-ku, Kyoto 606-8502, JAPAN
2) Kyoto University Research Reactor Institute, 2, Asashiro-Nishi, Kumatori-cho, Sennan-gun, Osaka 590-0494, JAPAN
The Tokyo Electric Power Company’s Fukushima Daiichi Nuclear Power Plant accident occurred on
March 11th
, 2011 and large amounts of radioactive materials were released into the environment. In
Fukushima, approximately 70% of the land is covered with forests. Therefore, the majority of radioactive
materials were deposited in those forests. These radioactive materials were moved by material circulation
in the ecosystem and were accumulated in high concentrations from the soil surface to the litter in the
forest. Earthworms and other soil organisms, which decompose organic matter such as litter in the
ecosystem, have an important role for the circulation of organic materials. Studying such organisms would
lead to understanding the environmental dynamics and ecological impacts of the released radioactive
materials. In this research, we measured the radioactive cesium concentration in earthworms that inhabit
the forest located about 40 km northwest from the FDNPP. As a result, 6.5 × 10³ Bq / kg-fresh of
cesium-137 were detected in these earthworms. The concentration ratio (CR) of the earthworm are 0.58 for
the soil, 0.10 for the litter. In addition, the distribution of the radioactive cesium in earthworms was
observed using an autoradiography.
Key Words: Earthworm, Fukushima Daiichi Nuclear Power Plant accident, Radiocesium,
Radioecology
1. Introduction
The Tokyo Electric Power Company’s Fukushima
Daiichi Nuclear Power Plant (FDNPP) accident
occurred on March 11th, 2011 and large amounts of
radioactive materials were released into the environment.
In Fukushima, approximately 70% of the land is covered
with forests. Therefore, the majority of radioactive
materials were deposited in those forests. These
radioactive materials were moved by material
circulation in the ecosystem and were accumulated in
high concentrations from the soil surface to the litter
layer in the forest1). Highly contaminated areas in the
northeast part of Fukushima are covered with mountain
forests. Therefore, the inflow of forest organic matter
with accumulated radioactive materials is one of the
factors that delay reconstruction activity such as
decontamination2). In order to understand the movement
of radioactive materials circulated by complex
interactions of organisms and environment, it is
appropriate to investigate the organisms that form the
dynamic ecosystem. Earthworms especially relate to the
vertical migration of radioactive materials in the soil and
provide a migration pathway as a food source for other
organisms.
Earthworms inhabit the highly contaminated soil surface
and thus they are exposed to higher radiation than other
terrestrial organisms3). Based on this, the population
decrease of soil invertebrates including earthworms,
which are exposed to a dose of approximately 30Gy in
the forest near the reactor from the Chernobyl nuclear
accident, had been reported4). The earthworm was
assigned as a reference animal for assessing the effects
of radiation on the environment by the ICRP5).
74

In this research, to elucidate the ecological impact of
the radioactive materials and the movement of
radioactive materials in the ecosystem, we collected
earthworms and samples of their environmental habitat
and then compared the radiocesium concentrations.
It was previously reported that radiocesium ingested by
the earthworm is excreted rapidly and is not
accumulated in high concentrations in specific organs6).
In order to examine the distribution of radioactive
materials in the earthworm under the natural
environment 3 years after the accident, we used
autoradiography.
2. Materials and Methods
(1) Sampling area
The sampling site is located about 40km northwest of
the FDNPP (Fig.1)7). The earthworms (Pheretima
group) were collected between the litter layer and soil
(Ao-layer) in the deciduous broad-leaved forest. The
collected earthworms brought to the laboratory with the
soil (Ao-layer: organic layer including the litter) in a
living state.
(2) Measurement methods for Cs-137
concentration
The radioactivity was measured using a high-purity
germanium detector (Model:
GC4020-7500SL-2002CSL) with a multi-channel
analyzer (MCA: DSA-10000, CANBERRA) and
analyzed by gamma spectrometry. The activities were
determined using a standard radiation volume
gamma-ray source (MX033U8PP; Japan Radioisotope
Association). The activity concentrations of Cs-137
were determined from 661.7 keV peak energies.
a) Earthworm
The earthworms (Pheretima group) were collected
between the litter layer and soil in the deciduous
broad-leaved forests in the sampling area. Seven
individuals were packed together in 100ml containers
(U-8) and were measured for 2.7×10⁴ seconds.
b) Soil and litter
Each sample was dried in an oven at 105°C. The soil
was screened with a 2 mm mesh and the litter was
crushed by a blender. These samples packed in 100ml
containers (U-8) and were detected with a Ge detector.
(3) Autoradiography (ARG)
An imaging plate (BAS-IP-MS2025E) was used for 8
days after contact with the plate, and then the IP was
read with a reader (Typhoon FLA7000).
3. Results and discussion
(1) Results on the Cs concentrations
The Cs-137 concentrations were 6.3×10⁴ Bq/kg-dry in the
litter, 6.5×10³ Bq/kg-wet in the erthworms, and 1.1×10⁴
Bq/kg-dry in the soil (Fig.2). The CR value of Cs for
earthworm by ICRP was reported to be 0.0488).
In order to indicate the transfer of Cs-137 from the
environmental samples to the earthworms, we calculated the
concentration ratio (CR) of Cs-137. The concentration ratio of
Cs-137 was calculated using the equation (1).
Fig.2 Concentrations of Cs-137 in earthworms and
environmental samples
Fig.1 sampling area
75

Concentration ratio =Concentration of 137Cs in earthworm (Bq/kg-fresh)
Concentration of 137Cs in environmental sample (Bq/kg-dry) ⋯ (1)
The concentration ratios from environment samples to
the earthworm shows 0.58 with soil and 0.10 with the
litter. To determine the concentration ratio (CR) of the
earthworm, we detected the CR of wet weight. However,
when converting the CR of dry weight under the same
conditions as the environment samples, the CR of
earthworm become 7 to 8 times higher than that of wet
weight. This CR value is lower than that of the litter CR
value which suggest that the main food resource of the
earthworm is litter. Thus the results show that high
biomagnification of cesium137 is not observed in the
earthworm.
(2)Result of autoradiography
The ARG result shows that radiocesium was highly
concentrated in the center line of earthworm body,
specifically in the digestive tract of the earthworm. This
suggests that the earthworm intake of cesium which is
attached to organic matter such as litter, remains in their
digestive tract through digestive process. Thus, there is
high possibility that most cesium exist in the digestive
tract of the earthworm.
This result suggests that the accumulation of
radiocesium to the muscle of earthworm rarely occurrs
under the natural environment 3 years after the accident.
It is estimated that the radiocesium ingested by the
earthworm is excreted rapidly and is not accumulated
in high concentrations in specific organs and the
muscle under the natural environment in Fukushima.
However, earthworms are annelids and thus their
digestive tract is located close to the other organs.
Hence there is a limit to showing the distribution of
radiocesium in each organ by ARG. In order to
elucidate the results in greater detail, we need to
quantify the cesium concentrations of the muscle and
organs separately by using a Ge detector.
4. Conclusion
The radiation effects on organisms depend on the
complex interactions among radiation dose, dose rate, its
temporal and spatial variations, and the radio-sensitivity
of different species. Earthworms inhabit highly
contaminated soil surfaces and consume the
contaminated litter layer as food. Therefore they are
highly exposed internally and externally even three
years after the accident.
In the Chernobyl nuclear accident, it was reported that
the net export of Cs-137 from the forest ecosystem was
less than 1%4). In addition, the radioactive cesium is
retained on the soil surface and the litter, and not
significantly move to the deep layer of soil9). Therefore,
it is predicted that the radiocesium will be retained in
high concentrations in the forest ecosystem of
Fukushima for a long period time. To elucidate the
ecological impact of the radioactive materials, it is
necessary to carry out long-term investigations for
earthworms, and to monitor the crowd density of
earthworms with relation to the levels of
contamination.
In order for reconstruction of contaminated areas,
which are approximately 70% covered with forests, the
dynamics of radioactive materials in the forest
ecosystem must be understood. It is necessary to use an
indicator organism which constitutes the interaction of
material circulation in the ecosystem. Earthworms play
a vital part in the materials circulation from the ground
to the soil as the decomposer of an ecosystem.
Therefore, the earthworm is suitable as an indicator
organism for understanding the dynamics of radioactive
materials in the ecosystem. By monitoring such
indicator organism, there is a possibility to predict the
dynamics of the radioactive materials to understand the
total contamination situation in the ecosystem. In this
research, we took the cesium concentration data of the
environmental samples and the earthworm, and the
data of cesium movement in the earthworm body.
These data can be useful for the dose assessment of
internal and external exposure on the earthworm in the
ecosystem in future. It is possible to predict the
long-term dynamics of cesium in the ecosystem by data
collection of the relationship between various
environmental organisms and the concentration values
of cesium making it possible to determine the
ecological impacts of radioactive materials. In the
76

future we will establish a prediction method by
monitoring the indicator organism. This will contribute
to the reconstruction of contaminated areas in
Fukushima.
References
1) Ministry of Agriculture, Forestry and Fisheries,‘Results
of the radioactive materials distribution in the forest’,
Web site of Forest Agency, March 29, 2013.
(http://www.rinya.maff.go.jp/j/press/kenho/130329.html)
(in Japanese)
2) Brumfiel G, Fuyuno I ‘ Fukushima's legacy of fear’,
Nature, 483, 138-140
3) Satoru ENDO et al., ‘Estimation of β-ray dose in air and
soil from Fukushima Daiichi Power Plant accident’,
Journal of Radiation Research, 55, 476-483, 2014.
4) IAEA, ‘Environmental Consequences of the Chernobyl
Accident and their Remediation: Twenty Years of
Experience’, Report of the Chernobyl Forum Expert
Group ‘Environment’ , Radiological Assessment Reports
Series, 2006.
5) ICRP, ‘A Framework for Assessing the Impact of
Ionising Radiation on Non-human Species’, ICRP
Publication 91, Ann. ICRP 33 (3), 2003.
6) K. Fujiwara et al., ‘Uptake and retention of
radio-caesium in earthwrms cultured in soil contaminated
by the Fukushima nuclear power plant accident’, Jornal
of Evironmental Radioactivity, 139, 135-139, 2015.
7) Extension Site of Distribution Map of Radiation Dose,
etc., / Digital Japan, ‘Air dose rate’, November 07, 2014.
(http://ramap.jmc.or.jp/map/map.html) (in Japanese)
8) ICRP, ‘Environmental Protection: Transfer Parameters
for Reference Animals and Plants’, Annals of the ICRP
Publication 114, Ann. ICRP 39(6), 2009
9) Takeshi Ohno., Y. Muramatsu., Y. Miura., K. Oda., N.
Inagawa., H. Ogawa., A. Yamazaki., C. Toyama., M.
Sato. ‘Depth profiles of radioactive cesium and iodine
released from the Fukushima Daiichi nuclear power plant
in different agricultural fields and forests’, Geochemical
Journal, Vol.46 pp.287-295, 2012.
77

Part 4
Others

Case Study of Radiation Education in Compulsory Education for Fukushima's Revitalized Future
Hiroko MIYUKI*1
1Graduate School of Energy Science, Kyoto University [email protected]
This study investigates effectiveness of radiation risk education to Elementary and Junior High school students (N=989) based on the classes-on-demand which delivered from April, 2014 to March, 2015. The classes are designed as (1)45min. for elementary students, (2)90 min. (two consecutive 45 min. classes) for upper elementary and junior high school. Common learning goal is to know radiation risk. Active learning is emphasized when designing the classes. World Café Miyuki version (M-Café: discussion method which based on chains of brainstormings that lead to discussion and presentation) has been strongly recommended as one of the learning activities in the radiation risk classes and performed in over 90 % of the classes delivered as the classes-on-demand. As change in the perceived reactions before and after the class, the participants larned basic knowledge of radation risk and had interest in learning more. Teaching radiation risk education as class on demand, not only the targeted students learned about radiation risk, but also observed teachers have learned the subject. Also, it is suggested that M-Café deepens and broadens children's idea of radiation risk.
Keywords: Radiation Risk Education, Classes on Demand, Compulsory Education, Active Learning, World Café Miyuki version (M-Café)
1. Introduction
Japan has a low self-sufficiency rate of the primary energy, and 2010 before the eastern Japan great earthquake, including atomic energy, it was 19.9%. In 2011, the year of the Fukushima Daiichi Nuclear Power Plant accident (the NPP accident), the nuclear power plants (NPP) suspended successively and the self-sufficiency rate fell to 11.1 %. In September, 2013, the 3rd and the 4th unit of Oi NPP of Kansai Electric Power were suspended thus the energy self-sufficiency rate dropped to 6% 1). After 2014, Japan’s self-sufficiency rate of the primary energy is thought to fall below less than 6% from all Japanese nuclear power plants' stopping2).
Problems caused by the NPP accident in 2011 is not only the decline of the energy self-sufficiency rate. Danger of nuclear power generation, radiation and radioactive waste management issue were brought to light. Concern grew about the risks of exposure to radiation and the safety of food and the environment. However, the current status of the radiation risk education in school education is not put into effect sufficiently yet when over 4 and a half years have passed after the NPP accident3). There are 4 main reasons for its cause: (1) After 1981, management of radioactive materials became very severe. Also the teaching hours of the science in school education were reduced. Moreover, teaching guidelines of radiation
went off from curriculum guidelines4). These caused "Radiation" became the inexperienced unknown territory learned by the school education for a teacher of elementary and junior high schools5). (2) Teachers in practice feel that “the radiation risk education” has high specialty, but they do not have time to learn as the new subject3). (3) There is no appropriate educational material which can be used easily6). (4) The concept of “risk” is difficult to understand6).
In order to make public about radiation and to make radiation education spread widely, the Ministry of Education, Culture, Sports, Science and Technology, Ministry of Economy, Trade and Industry Agency of Natural Resources and Energy, Universities, education facilities and research organizations published supplementary readers, booklets and various related materials about radiation and delivered to elementary and junior high schools throughout Japan. However almost no teacher training to those material is accomplished, and the teachers receiving the materials are responsible to implement the materials to make radiation risk education to practice, thus teaching radiation risk education in schools by classroom teachers stayed quite difficult. Further, some of the materials sent to schools are clearly made from atomic promotion point of view as well as an opposite point of view, anti-nuclear party. These issue were some of the cause which disturbs the spread of radiation education6).
On the other hand the meaning of the word “risk” is equivocal. The word “risk” is used variously in the public, and is both negative
78

and affirmative. It is important to understand the concept of risk. What is risk, how to understand the risk and the ways to avoid it or use it.
In keeping with these social issues, in order to satisfy pressing needs of radiation risk education, the radiation risk educational class on demand program was put into effect in 9 prefectures throughout Japan including Fukushima-ken from 2011 to 2015. In this paper, practice result of the class-on-demand in compulsory education delivered in 2014 are summarized and discussed.
2. Practical Studies
The author visited schools and delivered radiation risk classes to 4613 students started from September 2011 to March 2015 (Table 1). Actual period when the practical studies performed are :
(Fiscal Year starts from April, ends March of the following year) FY2011: June 2011 to February 2012; 9 months FY2012: October 2012 to March 2013; 6 months FY2013: October 2013 to March 2014; 6 months FT2014: April 2014 to March 2015; 12 months The above durations include application period. The visited schools are located in Hokkaido, Aomori pref.,
Yamagata pref., Fukushima pref., Chiba pref., Wakayama pref., Shiga pref., Osaka-fu, and Kyoto-fu as shown in Fig. 1.
(1) Contents of the lessons A panel of experts (such as radiation specialists, educators and
scientists) reviewed the topics to be taught on the subject of radiation. The panel was called by Japan Productivity Center, Information Center for Energy Environmental Education (the JPC, ICEEE).
Class-on-Demand in FY2011 is a government’s commissioned
project to the JPC, ICEEE entrusted by Ministry of Education, Culture, Sports, Science and Technology Japan (MEXT Japan).
The contents regarding the topics about the radiation risk and the teaching method as well as teaching materials are transferred to lecturers depending upon the students’ developmental stage.
The class duration is 45 minutes (1 frame) session or 90 minutes (2 consecutive frames) session and their learning goals are to know about radiation risk (Table 2 on next page).a) Concept of “risk”
Many technologists and scientists define risk as "the probability of something happening multiplied by the size of the resulting cost;" however, here, the risk is a state of uncertainty to which Hazard and Benefit are in trade-off relation7, 8, 9). During the sessions, risk is explained “Risk is not events that is only dangerous” “even if the events may concern danger, would you like to take chances?”
(2) Teaching Methodsa) The class designed as “Quiz Show”
The classes are designed as “quiz show” to get the participants attention and keep them enthusiastic. After explaining about the basic knowledge which becomes the aim of learning, the understanding confirmation tests called “quiz” are performed on each topic, and more explanations are added while seeing children’s reaction. Experiments were conducted to experience the knowledge they just have learned. Confirmation test of the class contents (all items which are taught as basic knowledge) was performed at the end of the class to check the short-term level of proficiency (Fig. 2 on next page) 10).b) Active learning and World café Miyuki version
It is widely known that Active learning, which is a process whereby students engage in activities such as discussion, problem solving, evaluation, cooperative-learning, problem-based learning, simulations and so on, has higher retention rate than passive learning
FY 2011 2012 2013 2014 totalSchools
visited25 13 8 21 67
grade
1st 0 10 5 22 37
2nd 0 10 4 22 36
3rd 5 11 5 26 47
4th 193 34 66 47 340
5th 317 229 117 45 708
6th 1323 455 320 587 2685
J.H. 128 130 96 240 594
H 29 29Teachers
PTA60 50 110
Univ. 27 27
Total 1966 939 613 1095 4613
participants
Table 1 Number of Participated Schools, Grades and Students(FY; from April to March, as of March 2015)
Fig.1 Location of the Schools (from Sept. 2011 to Mar. 2015)
79

which is a process whereby students are expected to "record and absorb knowledge” mainly by “seeing and hearing” 11, 12, 13).
World Café Miyuki version (M-Café) is designed, conceptualized and performed as active learning in order for all the students to continuously (1) think freely, (2) think about multiples of topics, (3) think enthusiastically, (4) think at own ability, (5) listen to other’s ideas and opinions, (6) think about various ideas and opinions,
(7) extracting issues and problems, (8) try to solve the problems, (9) summarize the ideas, (10) present the ideas during the class (Fig. 3).
When conducting M-Café, divide the class into small groups and ≦each group will have the same number of members (1 N ≦ 6).
Number of the groups in a class and numbers of members in each group can be adjusted according to the size of the class. Procedure of M-Café is as follows. For example, first, divide the class into small groups so that each group contain about the same number of members. On the table of each group, place large sheet (A1 or A0 size) of poster paper with various discussion topics. Students will write anything they can think of about the topic in 2 minutes, brainstorming. At the tone of 2 minutes, members of group 1 moves to the group 2 table, leaving the group 1 poster sheet behind on the
Fig. 2 Structure of the Radiation class
Table 2 Class duration, Grades, Target of study
Class
durationTarget Grade Topics/objectives Experiments Activities
Don't feel with five
senses
Wilson's
ChaberStory telling
Around us Experience
Dangerous but useful Demonstration
Protect against
Radiation
Visual aids,
Quiz
Don't feel with five
senses
Wilson's
ChaberDemonstration
Around us Experience
Dangerous but usefulVisual aids,
Quiz
Protect against
RadiationSurvey
It can be measured
Don't feel with five
senses
Wilson's
ChaberDemonstration
Around usRadiation
SurveyExperience
Protect against
Radiation
Visual aids,
Quiz
It can be measured Survey
Affect living things
Usefl
What is "Risk?"
Don't feel with five
senses
Wilson's
ChaberDemonstration
Around usRadiation
SurveyExperience
Protect against
RadiationBentonite
Visual aids,
Quiz
It can be measured Survey
Affect living things
Usefl
What is "Risk?"
High‐level radioactive
waste
Disposal method
Radioactivity,
radiation and
radioactive materials
Wilson's
ChaberDemonstration
Types of rays (α, β, γ,
X ray)
Radiation
SurveyExperience
Around us BentoniteVisual aids,
Quiz
Characteristic of the
radiationSurvey
Relation between the
radiation dose and
safety
World Café
Miyuki version
Radiation use
What is "Risk?"
High‐level radioactive
waste
Disposal method
World Café
Miyuki version
1st & 2nd
Elementary
3rd & 4th
Elementary
5th & 6th
Elementary
Upper
Elementary
Junior
High
45min
90min
100min
Fig. 3 World Café Miyuki Version
80

table of group 1. Grope 2 moves to group 3 table, group 3 to group 4 table and so on. Immediately after the groups moving to the new tables, students start writing their ideas and thoughts on the new group’s poster sheet, brainstorming. Since there will already be some ideas and thoughts written on the poster sheet, they have to think flexibly and consider carefully (Photo 1). Again at the tone of 2 minutes, students move to the next table till they come back to the original table where they started from. When they come back to the original table, students will read what’s written on the poster sheet and summarize ideas and draw conclusion. Students will have time to present their summarized conclusions and hypothesis in front of the class (Photo 2) . M-Cafe is student centered active learning method.
(3) Survey Method Right before and right after the class, 45 seconds of open-ended,
association test are given to 3rd graders and older students and the results are summarized and analyzed. Stimulus word for this survey is “radiation” and the students are asked to wright respond words or group of words. By counting the words (i.e., dangerous, deadly, etc) or the group of words (i.e., dangerous but useful, deadly if you get
expose a lot. etc). The quiz score during the class and the proficiency test right after the class are given to students to diagnose the level of short-term proficiency. (Figure 4)..
3. Analyses
Result of the classes-on-demand is analyzed by summarizing respond words as (1) counting the numbers of respond words or group of words, (2) selecting top ten words of the first impression words (words that are written first), (3) dividing the respond words or group of words into three categories (a) positive image, (b) negative image, (c) neither positive nor negative, facts and knowledge. The scores of the quiz given during class and the scores of the confirmation test given right after the class were compared and analyzed. The result of M Café is qualitatively evaluated according to how the students involved in the activity.
(1) The numbers of respond words, the numbers of letters used to form the group of words
The common features were seen by the respond words written before the class, after the class, and after the M-Café activity. Before the class, students wrote respond words to stimulus word “radiation” as single word such as “danger, scared, cancer and so on.” After the class, conditional words were seen with respond words such as “dangerous but useful, dangerous if you expose a lot, etc.” For after M-Café, responds words are no longer just group of words, they contain social issues and pointing out the problems such as “there are many ways to the nuclear waste management, but they are all difficult, how should we deal with the nuclear waste, etc.” Fig. 5 next page shows the comparision and change of the numbers of words and letters after the class and after the M-Café, setting the number of words and letters before the class as 100.
Photo. 1 Children working on the M-Café posters (Photograph by H. Miyuki, Mar., 2013)
Photo. 2 Children presenting their M-Café posters (Photograph by H. Miyuki, May, 2014)
Fig. 4 Survey page, Answer sheet for quiz and Check-up Test
81

(2) The first impression words In this study, the top ten of the first impression words of the
classes given in fy2014 are summarized. The open-ended association tests were given before and after the class to the student from the 3rd grade in elementary school to the 9th grade in junior high school. Because M-Café activitiy is designed for upper elementary and older students, for after M-Café survey was taken only by participated students who were the 5th graders and older (Table 3 ).
(3) Conceived change in impression The first impression respond words were summarized. The
words given before and after the class were categorized into three groups; (a) positive image, (b) negative image, (c) neither positive nor negative, facts and knowledge. Comparing before the class with after the class, the bar graphs in Fig. 6 show the increase in positive image, decrease in negative image and increase in facts and knowledges.
(4) Comprehension Level of Learning Objectives The class was designed as if we are in the quiz show. Each
question in the quiz show is aimed to a learning objective. Each question in the confirmation test after the class is also aimed to the learning objectives. Thus by summarizing the results of the both tests, it may leads to the students’ comprehension level of learning radiation risk. Fig. 7 shows averaged correct answer rate of the quiz during the class and the test after the class. In elementary schools, 10 classes out of 12, correct answer rate of the after class test has increased. The 2 classes’ correct answer rate has decreased; however, they were by 2% and 3%. On the other hand, in junior high school, 3 classes out of 7 have increased, 4 out of 7 have decreased.
(5) Discussion
Fig. 5 Change in the numbers of words and letters used in the survey taken after-class and after M-Café (Before-class = 100%, from Apr. 2014 to Mar. 2015)
Table 3 Top 10 First Impression Words (before and after the class, after the M-café)
Before Class After Class After M‐Café
1Danger,
Dangerous
Dangerous but
sometimes useful
There are many ways for
radioactive waste
management, and they are all
difficult and with a lot of
trouble
2 Scared
Too much exposure
may have bad effect
to living things
Many ways to dispose the
radioactive waste, but they all
are dangerous and cost a lot
of money
3Bad effect on
living things
Radioactivity
becomes weak
How should we dispose of the
waste?
4 Cannot seeEverywhere in the
world
It is dangerous to dispose of
the waste in the universe
(outer‐space)
5Nuclear Power
Plant
If you don't know
about it, it becomes
a danger. If you
know it, you will be
OK.
Isn't there any safe and less
costly way?
6 It penetrates May cause cancerIsn't there any idea not to
leak radiation?
7 get cancerCant feel with five
senses
Instead of disposing,
shouldn’t we expected to
manage?
8The disaster of
east Japan
It's in the food we
eat everyday
We could consider various
ways
9
Too much
exposure may
kill you
We can be
protected by it
I didn't think the radiation
was dangerous, but it is
actually dangerous
10 Useful α‐ray,β‐ray,
γ‐ray,X‐ray
If you don't understand the
risk of radiation, it becomes
dangerous. If you understand
it, it will be OK somehow
even though the radiation is
dangerous
82

a) The impression change by increase of the number of words The Fig. 5 shows that the numbers of words and letters have
increased by 24% in average compared before the class with after the class, it is inferred that adding to the original impression, positive and negative impression words as well as words that tells facts and knowledge have increased. The Fig.. 6 seems to show that the impression of the radiation became more positive after the class; however, it does not suggest that the impression of the radiation risk became something awful to something good by attending the radiation risk class. It is suggested that because the surveys were conducted right after the class, students tend to write the facts and knowledge related words which they have just learned. Also, it is widely known that impression received from the radiation class, even from the same word, differes in an individual depending on the participant’s original image to radiation before the class. In addition, more positive and negative images as well as facts are listed in the suevey, not only analyzing by the first impression words, further investigation such as analyzing all the listed words is necessary.
From Table 3, in spite of students age and experience of evacuation, after class compared with before class, students acknowledge more interest in radiation risk and have learned basic knowledge of radiation3). By learning radiation risk, it is presumed
that the students having “emotional fear of radiation” tend to have "feeling of efficacy (the confidence that radiation can be controlled and that danger can be evaded and the perspective from which advantage is obtained)" though they still believe radiation to be something we should be scared of 3, 14). The result suggests that the students in compulsory education have learned radiation risk in the school time when the respective schools were limited. b) Understanding of the learning contents
From Fig. 7, the students have learned and understood radiatin risk through class on demand by accuracy of average correct answer rate of 71% to 100%. 14 classes out of 19 classes scored higher in after class test which is given after experiments compared to during class quiz, it is inferred that the students became interested in radiation and learned and experienced through scientific experiments.
97% of students who participated answered “enjoyed the class”, on the other hand, students’ of 17% answered "it was difficult to understand," it is revealed that futher improvement and implementation of class on demand are nessecary which include to pace down the speed of carrying the class activity and making the purpose of experiments much clearer.
c)World Café Miyuki version Teachers and parents who have attended or observed the class
have commented that “it was against their imagination that many students volunteered to present the M-Café poster in front of the class.” “they were impressed with M-Café activity that almost all the students were enthusiastically thinking, giving ideas, extracting issues and trying to solve the problem given by classmates.” Moreover, “the quiz show was well planned and was easier to understand than the previously attended radiation seminars.” World Café Miyuki version enhanced students think deeper and broader about radiation risk issues. Moreover, the comments and the result of the class on demand suggest that even though the classes are designed for 45 min. to 90 min., not only students who attend the class on demand learned radiation risk, but also teachers and parents who observed the class have learned radiation risk.
Fig.6 3rd graders’ of elementary schools to Junior high students’ Perceived Changes on Nuclear Radiation before and after the radiation class
(from Apr. 2014 to Mar. 2015)
Fig. 7 The Correct Answer Ratio of the Check-up Test during the class and after the class
83

4. Conclusion
When future Japanese energy issues are considered, we must think critically, must gain the power of thinking and imagining of what kind of energy gives what kind of influence on environment and how the economy influence by, and how the energy and outcome of the energy use influence our everyday life. Not only must the benefit of the use of energy, but also hazards of the use of energy be considered. The citizens of the earth who makes those important decisions concerning energy are generation of present children. We must not only advance technology, but bring education into focus so that "children" becomes confident in making important decision "decision-making of the energy".
AcknowledgmentThis research based on FY2011; The government's commissioned projects to Japan productivity center, information center for Energy Environmental education by The Ministry of Education, Culture, Sports, Science and Technology FY2012; Kyoto University Golobal COE program Nov. 2013 to March 2014 and FY2014; Sumitomo Foundation 133076 Special thanks to the schools and the teachers and students who let me practice class on demand program of radiation risk education.
References 1) Energy White Paper 2015,Fiscal Year Heisei 26 Report,
Agency for Natural Resources and Energy,accessed Jul. 2015 http://www.enecho.meti.go.jp/about/whitepaper/2015pdf/
2) The energy self-sufficiency rate of Japan will be 6 % which is one-third before the great disaster, less self-sufficiency rate is expected as all the NPP stop. Sankei news,<2015http://www.sankei.com/life/news/140519/lif140519 0002- n1.html > accessed June 2015, ( In Japanese )
3) Hiroko Miyuki, Eiji Yamasue, Hideyuki Okumura, KeiichiIshihara, “Radiation Class given to 6th graders of JapaneseElementary Students and their Perceived Changes on NuclearRadiation after the classes analyzed with locality”,The 49th Environmental Engineering Research Forum Proceedings, Japan Society of Civil Engineers, pp. 205-207(2012)( In Japanese )
4) Minoru Eda, “Wishing the renaissance of the radiationeducation” Radiation Education Forum Newsletter, No.37,p.1,2007 ( In Japanese )
5) Hideki Ono, “Problem of nuclear power plant ‘radioactivity’education in elementary and secondary education and theconquest” The Japan Scientists’ Association e-magazine, No.16,2013 ( In Japanese )
6) Fukushima prefecture School Board,“Radiation EducationalPromotion Support Project” leader education workshop in fiscal year 2014, Study Conference “Issues of the RadiationEducational Promotion” subcommittee meeting group 2elementary school, group 3 junior high school,Koriyama-city, Fukushima 2014.6.18 ( In Japanese )
7) Naoki Yamano, “Rethinking of Risk Communication”,Journal of Atomic Energy Society of Japan, Vol. 57, 109-113, 2015.( In Japanese )
8) the International Organization for Standardization, Riskmanagement standard ISO31000:2009 2.1Risk “Riskmanagement-Principles and guidelines ISO31000:2009 2.1”
9) International Risk Governance Council, White Paper on RiskGovernance towards an Integrative Approach, p.19, 2005
10) Hiroko Miyuki “Our everyday life and radiation risk --- What is high level radioactive waste?” Lesson plans, Learning activities, Results of visiting lectures, Nuclear Waste ManagementOrganization of Japan <http://numo-eess.jp/class/2013/yachi.seibu.php> 2014. 3 ( In Japanese )
11) Ben Johnson, “How Do We Know When Students AreEngaged?”, Edutopia, Education Foundation, 2013, < http://www.edutopia.org/blog/student-engagement-definition-ben-johnson> , accessed Jul. 4, 2014
12) Hendrien Maat,“Working paper, The Active Teaching &Learning Method”, edukans, University of Amsterdam, Version 4, <http://www.edukans.org/images/International/The-Active-Teaching-Learning-Method-2014.pdf> accessed June 20, 2015
13) Dean A. McManus, "The Two Paradigms of Education and the Peer Review of Teaching", School of Oceanography and Center for Instructional Development and Research, University ofWashington, The National Association of Geoscience Teachers, Journal of Geoscience Education,Vol. 49, No. 6, Nov 2001, pp. 423-434.
14) Hiroko Miyuki, Hiroshi Tamiya, Shigeyuki Haga, Yuji Kodama, Naoki Yamano, Keiichi Ishihara “Radiation Risk Education inElementary schools --- results of Class-on-demand” the 51st Annual Meeting on Radioisotope and Radiation Research,Tokyo, 2014.7 ( In Japanese )
84
Derivation of Apparent Diffusion coefficient (Da) and Distribution Coefficient (KD) from Evolution
of Depth Distribution of Radiocaesium in Soil Contaminated by the Fukushima NPP accident
Haruo SATO 1)*
1) Graduate School of Natural Science and Technology, Okayama University, 3-1-1, Tsushima-naka, Kita-ku,Okayama-shi, Okayama 700-8530, Japan
The authors have investigated the depth distribution of radionuclides (RNs) in soil at 11 locations in the city of Nihonmatsu, the towns of Kawamata and Namie after about 3 months (1st investigation) and 1 year (2nd investigation) following the Fukushima NPP accident, and reported the Da-values of RNs (Cs-134, Cs-137, Te-129m and Ag-110m) obtained from depth distributions near the surface layer of soil and the KD-values of Cs-137 and I-131 on soil obtained by batch experiments so far. Many Da-values of radiocaesium (Cs-134, Cs-137) derived from the 1st investigation were of order 10-10 m2/s, and tended to be higher in soil of former farmland and organic soil than in mainly sandy soil. However, many Da-values derived from the 2nd investigation were approximately of order 10-11 m2/s. The KD-values of Cs-137 on soil were in the range 2,080~61,000 ml/g in both investigations. Considering the high KD-values, the Da-values should be theoretically 2 or 3 orders of magnitude lower than those obtained in both ivestigations, but large descrepancies were found between both parameters. The cause for the high Da-values is thought to be that the distributions include the effect of dispersion or permeation by advection near the surface layer of soil which is unsaturated following the deposition of RNs, i.e., these high Da-values were considered that depth distributions following the initial deposition were formed mainly by a dispersion process. This is evidenced by the depth distribution of water content. Based on this, it is considered that depth distributions in deeper part of the soil were formed by mainly diffusion process. Therefore, a theory to exclude the influence of early-time of dispersion or permeation by advection and derive Da for only the diffusion process was considered based on the evolution of the depth distributions in deeper part from the 1st to 2nd investigation. Furthermore, KD was calculated from the Da and compared to the measured data. The calculated results of Da were of order 10-14 m2/s, and those of KD were in the range of KD=104~105 ml/g, which were approximately consistent with the measured KD-values. However, no evolution of depth distribution was found for many data of sandy soil, which irreversibility was found in desorption experiments after sorption experiments. Model construction considered irreversible reaction in sorption is needed.
Keywords: Fukushima nuclear accident, radiocaesium, diffusion, distribution coefficient, soil
1. Introduction
The accident at the Tokyo Electric Power Company (TEPCO) Fukushima Dai-ichi Nuclear Power Plant (1F-NPP) occurred following the Great East Japan Earthquake on March 11, 2011, and led to the release of volatile radionuclides (RNs), which were deposited on the surrounding environment (soils,
forests, ponds, residential land, etc.) in the Fukushima and the surrounding prefectures. The inventory of RNs discharged by May 2011 is estimated to be approximately 900 PBq with this value converted to radioiodine (I-131) (500 PBq for I-131 and 10 PBq for Cs-137) 1). This amount is equivalent to approximately 1/6th of the 5,200 PBq discharged by the Chernobyl NPP accident which occurred in April 1986 2).
85

However, the 1F-NPP accident is evaluated as the worst level 7 on the International Nuclear Event Scale (INES). After the decay of short-lived I-131 (half-life T1/2=8.021d), radiocaesium (Cs-134 (T1/2=2.065y), Cs-137 (T1/2=30.07y)) 3) are now the main contributors to radiological dose rate.
This work was a research project related to distribution maps of radiation dose rate, which the Ministry of Education, Culture, Sports, Science and Technology (MEXT) has promoted as one countermeasure to the 1F-NPP accident, since March 2011. The authors have conducted two investigations on the depth distribution of RNs in soil at 11 locations in the city of Nihonmatsu and the towns of Kawamata and Namie, which are located between 20km and 60km north-west from 1F-NPP, in June 2011 after about 3 months (1st investigation) 4) and during February and March 2012 after about 1 year (2nd investigation) 5, 6) following the 1F-NPP accident, and reported those results so far 4-6).
The apparent diffusion coefficients (Da) of RNs were calculated based on the Fick’s 2nd law 7) from depth distributions near the surface layer of soil, and the distribution coefficients (KD) of Cs-137 and I-131 on soil were obtained by a batch method. Many Da-values of radiocaesium (Cs-134, Cs-137) were of order 10-10 m2/s in the 1st investigation and were approximately of order 10-11 m2/s in the 2nd investigation 6). The
KD-values of Cs-137 on soil were in the range 2,080~61,000 ml/g in both investigations. Considering the high KD-values, the Da-values should be theoretically 2 or 3 orders of magnitude lower than those obtained in both investigations, but large descrepancies were found between the KD-values and the Da-values. The cause for the high Da-values is thought to be that the distributions include the effect of dispersion or permeation by advection (water flow) near the surface layer of soil which is unsaturated, following the deposition of RNs. In short, these high calculated Da-values were considered that depth distributions following the initial deposition were formed mainly by a dispersion proess. It is also cleared from the fact that actually the Da-values obtained from the depth distributions of Te-129m of which species in the porewater is HTeO3
- and/or TeO32- 8) and Ag-110m of which species in the porewater is Ag+ were all similar levels as those of radiocaesium even though the KD-values on soil are significantly different between cation
(Cs+) and anion (I-) 4). This is also evidenced by the measured results of water content distribution in the direction of depth, where the degree of saturation changed from unsaturated to saturated condition in depth direction. This means that advection does not come to take place with increasing depth. Therefore, it is considered that depth distributions in deeper part were formed by mainly diffusion process.
Table 1. Overview of 2 times of investigations (1st and 2nd investigation)
86

Therefore, in this study, a theory to exclude the influence of early-time of dispersion or permeation by advection or permeation near the surface layer of soil which is unsaturated and derive Da for only the diffusion process was considered based on the evolution of the depth distributions in deeper part from the 1st to the 2nd investigation. Furthermore, KD was calculated from the Da and the consistency between both parameters and the validity of the theory were discussed by comparing to the measured data (KD).
2. Overview of the field investigations
Table 1 shows overview of twice of the field investigations (1st and 2nd investigation) and Figure 1 shows the investigation locations. Both investigations were conducted at 11 locations in the city of Nihonmatsu (1 location) and the towns of Kawamata (2 locations) and Namie (8 locations), where are located between 20km and 60km north-west from 1F-NPP.
Table 2 shows the calculated results (conventional analysis
method based on the Fick’s 2nd law 7)) of the Da-values of radiocaesium (Cs-134, cs-137) from depth distributions near the surface layer of soil versus the type of soil (sandy soil, organic soil, soil which is supposed to have been used as farmland (soil of former farmland)) obtained in both
investigations. Since details of each investigation are described in literatures 4) and 6), only the outline is described here. As shown in Table 2, many Da-values of radiocaesium were of order 10-10 m2/s in the 1st investigation and were approximately of order 10-11 m2/s in the 2nd investigation 6). The KD-values of Cs-137 on soil obtained by batch experiments were in the range 2,080~61,000 ml/g in both investigations.
As cleared comparing between the Da-values and the KD-values, both parameters are quantitatively inconsistent at all, i.e., quantitatively large descrepancies are found between both parameters. As described above, concretely, although the high KD-values of radiocaesium on soil were obtained from batch experiments, Da-values obtained from depth distributions near the surface of soil were 2 or 3 orders of magnitude higher than those expected from the KD-values. The cause for the high Da-values was thought to be due to that the depth distributions include the effect of dispersion or permeation by advection such as rain water following the deposition of radiocaesium on ground surface. Soil near surface layer is unsaturated by water
Figure 1. Investigation location.
87

vaporization from the surface layer excepting the case that water table is the same level as the ground surface such as topographically water catchment area. The degree of saturation near the surface layer of soil was approximately 50 % at many investigation locations from the measured results of water content distribution in the direction of depth, and increased with depth. As described above, the depth distributions of other RNs (Te-129m, Ag-110m) obtained at the same time in the 1st investigation were also approximately the same as those of radiocaesium at the same investigation location even though the KD-values between cation and anion are significantly different, and the calculated Da-values were also all similar levels.
Synthesizing these facts, it is considered that initial depth distributions near the surface layer of soil include the effect of dispersion or permeation by advection following the deposition of RNs on ground surface. Therefore, it is considered that the evolution of depth distribution in deeper part where advection does not occur reflects transport by mainly diffusion process.
3. Analyses of Da and KD based on the evolution ofdepth distributions
As described already, a theory to exclude the influence of early-time dispersion or permeation by advection and derive Da for only diffusion process was considered based on the evolution of depth distributions.
The diffusion equation 7) for one-dimensional non-steady state considering decay term is expressed as follows.
∂C∂t
=∂∂x�Da
∂C∂x� − λC (1)
Assuming that Da is independent of distance, Eq. (1) is arranged as follows.
∂C∂t
= Da∂2C∂x2
− λC (2)
Where, C is the radioactivity concentrations of radiocaesium in unit volume of the soil (Bq/cm3), t the time elapsed from the deposition of radiocaesium (s), x the distance in the depth direction of soil from the deposited surface (ground surface) (m), Da the apparent diffusion coefficient (m2/s), and λ the decay constant (1/s).
For one-dimensional non-steady state diffusion of a planar source consisting of a limited amount of substance such as radiocaesium in a cylinder of infinite length, the analytical solution of Eq. (2) is written as follows based on the following initial and boundary conditions.
Initial Condition C(t, x) = 0, t = 0, x ≥ 0
Table 2. The calculated results of the Da-values of radiocaesium from depth distributions near the surface layer of soil versus the type of soil obtained in both investigations (1st and 2nd investigation)
Cs-134 Cs-137 Cs-134 Cs-1371.70E-11 1.71E-11 3.38E-12 3.19E-12
4.43E-11 4.31E-11
Kanaori, Nihonmatsu C. 6.63E-11 6.78E-11 3.41E-11 3.51E-11
1.28E-10 1.32E-10
1.06E-10 1.12E-10
Teshichiro, Akogi, Namie T. 5.09E-10 5.09E-10
1.12E-10 1.14E-10
6.17E-11 6.10E-10
9.18E-11 9.28E-11
Ohshimizu, Yamakiya, Kawamata T. 1.04E-10 1.08E-10 4.75E-11 4.54E-11
Kozuka, Yamakiya, Kawamata T. 3.05E-10 3.31E-10
1.98E-10 2.01E-10
1.23E-10 1.78E-10
4.97E-11 5.33E-11 2.26E-11 2.05E-11
3.25E-10 2.54E+10
1.77E-11 1.86E-11
Shiobite, Akogi, Namie T. 7.49E-11 7.71E-11 4.03E-11 4.23E-11
1.92E-10 1.91E-10 1.51E-10 1.16E-10
4.03E-10 4.03E-10
Kurabeishi, Hiruzone, Namie T. Organic soil7.85E-11 8.17E-11
Soil of formerfarmland
(including flowergarden)
Mizuzakai, Tsushima, Namie T. 8.32E-11 1.01E-10
Matsukiyama, Shimotsushima,Namie T.
Kunigidaira, Akogi, Namie T.
Investigation location Soil type1st Investigation(after 3 months) 2nd Investigation(after 1 year)
Kozuka, Yamakiya, Kawamata T.
Sandy soilMatsukiyama, Shimotsushima,Namie T.
88
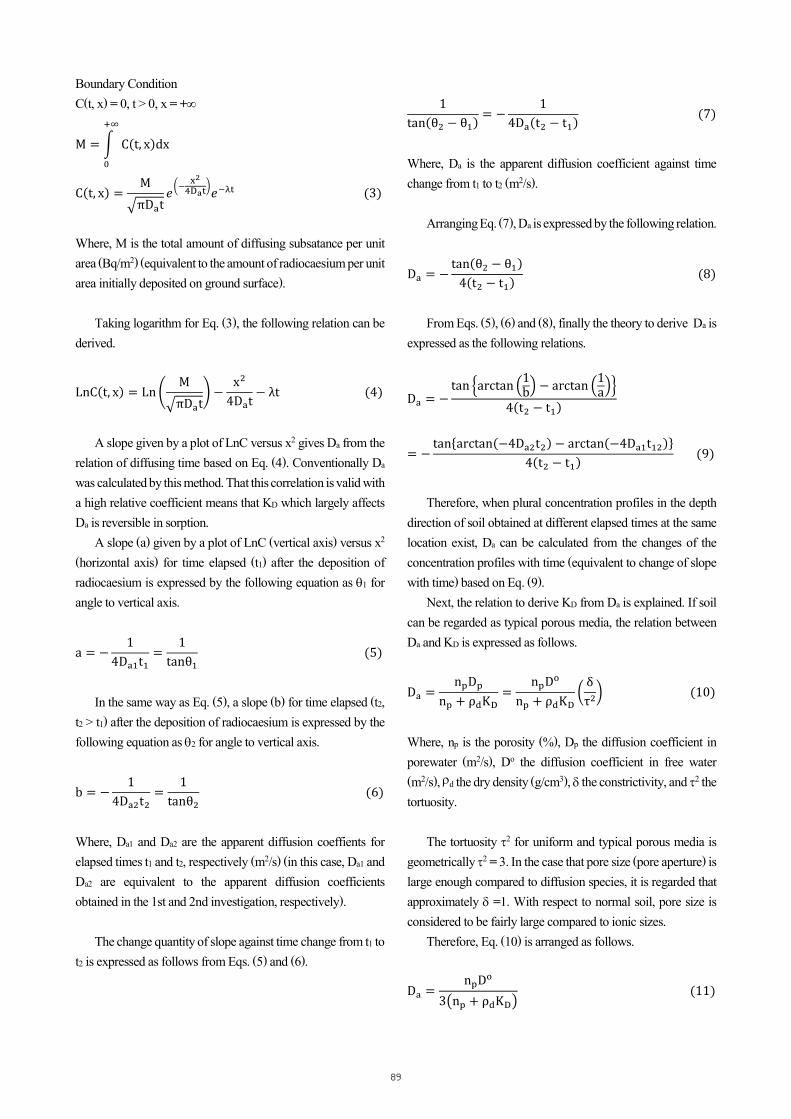
Boundary Condition C(t, x) = 0, t > 0, x = +∞
M = � C(t, x)dx+∞
0
C(t, x) =M
�πDat𝑒𝑒�−
x24Dat
�𝑒𝑒−λt (3)
Where, M is the total amount of diffusing subsatance per unit area (Bq/m2) (equivalent to the amount of radiocaesium per unit area initially deposited on ground surface).
Taking logarithm for Eq. (3), the following relation can be derived.
LnC(t, x) = Ln�M
�πDat� −
x2
4Dat− λt (4)
A slope given by a plot of LnC versus x2 gives Da from the relation of diffusing time based on Eq. (4). Conventionally Da was calculated by this method. That this correlation is valid with a high relative coefficient means that KD which largely affects Da is reversible in sorption.
A slope (a) given by a plot of LnC (vertical axis) versus x2 (horizontal axis) for time elapsed (t1) after the deposition of radiocaesium is expressed by the following equation as θ1 for angle to vertical axis.
a = −1
4Da1t1=
1tanθ1
(5)
In the same way as Eq. (5), a slope (b) for time elapsed (t2, t2 > t1) after the deposition of radiocaesium is expressed by the following equation as θ2 for angle to vertical axis.
b = −1
4Da2t2=
1tanθ2
(6)
Where, Da1 and Da2 are the apparent diffusion coeffients for elapsed times t1 and t2, respectively (m2/s) (in this case, Da1 and Da2 are equivalent to the apparent diffusion coefficients obtained in the 1st and 2nd investigation, respectively).
The change quantity of slope against time change from t1 to t2 is expressed as follows from Eqs. (5) and (6).
1tan(θ2 − θ1) = −
14Da(t2 − t1) (7)
Where, Da is the apparent diffusion coefficient against time change from t1 to t2 (m2/s).
Arranging Eq. (7), Da is expressed by the following relation.
Da = −tan(θ2 − θ1)
4(t2 − t1) (8)
From Eqs. (5), (6) and (8), finally the theory to derive Da is expressed as the following relations.
Da = −tan �arctan �1
b� − arctan �1a��
4(t2 − t1)
= −tan{arctan(−4Da2t2) − arctan(−4Da1t12)}
4(t2 − t1) (9)
Therefore, when plural concentration profiles in the depth direction of soil obtained at different elapsed times at the same location exist, Da can be calculated from the changes of the concentration profiles with time (equivalent to change of slope with time) based on Eq. (9).
Next, the relation to derive KD from Da is explained. If soil can be regarded as typical porous media, the relation between Da and KD is expressed as follows.
Da =npDp
np + ρdKD=
npDo
np + ρdKD�δτ2� (10)
Where, np is the porosity (%), Dp the diffusion coefficient in porewater (m2/s), Do the diffusion coefficient in free water (m2/s), ρd the dry density (g/cm3), δ the constrictivity, and τ2 the tortuosity.
The tortuosity τ2 for uniform and typical porous media is geometrically τ2 = 3. In the case that pore size (pore aperture) is large enough compared to diffusion species, it is regarded that approximately δ =1. With respect to normal soil, pore size is considered to be fairly large compared to ionic sizes.
Therefore, Eq. (10) is arranged as follows.
Da =npDo
3�np + ρdKD� (11)
89

From Eq. (11), KD can be calculated from the following relation.
KD =np(Do − 3Da)
3ρdDa (12)
By using solid density (solid particle density) instead of dry density of the medium (soil), Eq. (12) is finally arranged as follows.
KD =np(Do − 3Da)
3ρth�1 − np�Da (13)
Where, ρth is the solid (soil particle) density (g/cm3).
In this study, Da and KD were calculated based on Eqs. (9) and (13), respectively. In the analysis, the porosity and solid density of soil were based on the measured results of soil sampled at each investigation location, and the Do for Cs+ ions was used 2.1x10⁻⁹ m2/s (25°C) 9, 10).
Table 3 shows the calculated results of the Da and KD for Cs+ ions versus the type of soil, together with physical property of soil used in the analysis. Many Da-values were of order 10-14 m2/s, and the KD-values calculated from the Da-values were in the range KD = 104~105 ml/g, which were consistent with the KD-values measured by the batch method.
On the other hand, since no evolution of depth distribution was found for many data of sandy soil, those Da-values have not been able to be analysed. This is considered to be due to that the KD of radiocaesium on sandy soil was irreversible. Actually the KD-values on organic soil and clayey soil were approximately reversible in desorption experiments after
sorption experiments on sandy soil, organic soil and clayey soil, but the KD on sandy soil was irreversible 6). Model construction considered irreversible reaction in sorption is needed.
4. Conclusions
Since there were found large discrepancies between the KD-values obtained by batch experiments and the Da-values of radiocaesium obtained from depth distributions near the surface layer of soil and the main cause was considered to be due to the effect of dispersion or permeation by advection near the surface layer of soil, Da was calculated from the evolution of depth distribution in deeper part and further KD was calculated from the relation with Da.
The calculated results of Da based on the evolution of depth distribution were of order 10-14 m2/s and the KD-values calculated from the Da-values were in the range of 104~105 ml/g, which were approximately consistent with the KD-values measured by the batch method. This is consistent with the fact that the movement of radiocaesium in the depth direction of soil is very slow and much percentage of radiocaesium still distributes near the surface layer of soil.
On the other hand, since no evolution of depth distribution was found for many data of sandy soil, those Da-values have not been able to be analysed. This is considered to be due to irreversible reaction in sorption, and is consistent with the results of desorption experiments after sorption experiments. Model construction considered irreversible reaction in sorption is needed.
References 1) The National Diet of Japan Fukushima Nuclear Accident
Table 3. The calculated results of the Da and KD for Cs+ ions based on the evolution of depth distribution versus the type of soil
Porosity(%)
Dry density
(Mg/m3)
Solid density
(Mg/m3)Cs-134 Cs-137 Cs-134 Cs-137
Kanaori, Nihonmatsu C. Sandy soil 50.9 1.159 2.719 2.76E-14 2.74E-14 9.66E+03 9.74E+03
1.99E-14 1.96E-14 1.98E+04 2.00E+04
4.53E-14 4.64E-14 8.66E+03 8.46E+03
Ohshimizu, Yamakiya,Kawamata T.
44.9 1.378 2.729 1.56E-14 1.37E-14 1.34E+04 1.53E+04
6.69E-15 8.37E-15 9.63E+04 7.70E+04
1.76E-14 1.06E-14 3.66E+04 6.08E+04
Matsukiyama,Shimotsushima, Namie T.
70.2 0.724 2.619 2.93E-14 2.06E-14 2.15E+04 3.05E+04
Shiobite, Akogi, Namie T. 59.3 1.053 2.604 2.37E-14 2.35E-14 1.65E+04 1.67E+04
Kunugidaira, Akogi, Namie T. 48.4 1.062 2.631 1.23E-14 1.06E-14 2.04E+04 2.35E+04
Soil of formerfarmland
(including flowergarden)
Mizuzakai, Tsushima, NamieT.
69.8 0.728 2.511
Investigation location Soil type
Physical property of soil Da(m2/s) KD(ml/g)
Kurabeishi, Hiruzone, NamieT.
Organic soil 59.0 0.969 2.566
90

Independent Investigation Commission (NAIIC) Reports (July 5, 2012), “http://warp.da.ndl.go.jp/info:ndljp/pid/ 385637/naiic.go.jp/en/report/”, accessed July 21, 2014.
2) Kato, H., Onda, Y. and Teramage, M., “Depth Distributionof 137Cs, 134Cs, and 131I in Soil Profile after FukushimaDaiichi Nuclear Power Plant Accident,” J. Environ.Radioact. (in press).
3) Japan Radioisotope Association, “Radioisotope PocketData Book,” 9th edition, Maruzen, Tokyo, 2000 (inJapanese).
4) Sato, H., Niizato, T., Amano, K., Tanaka, S. and Aoki, K.,“Investigation and Research on Depth Distribution in Soilof Radionuclides Released by the TEPCO Fukushima Dai-ichi Nuclear Power Plant Accident,” Mater. Res. Soc. Symp. Proc., Boston, U.S.A., Nov. 25-30, 2012, Vol.1518,pp.277-282, 2013.
5) Sato, H., Niizato, T., Tanaka, S., Abe, H. and Aoki, K.,“Evolution of Depth Distribution of Radionuclides in SoilContaminated by the Fukushima Dai-ichi Nuclear PowerPlant Accident,” Asia Oceania Geosciences Soc. (AOGS2014), Sapporo, Japan, July 28-August 1, 2014, Abstracts,IG23-A024, 2014.
6) Sato, H., “Evolution of Depth Distribution of Radiocaesium in Soil Discharged in the Fukushima Environment:Diffusion-Sorption Property of Radiocaesium in Soil,”Mini Symposium on Earthquake, Fault, Clay and Water:For Understanding Earthquake and Fault, Okayama Univ.,March 17, 2015, handout document (in Japanese).
7) Crank, J., “The Mathematics of Diffusion,” OxfordUniversity Press, Oxford, 1975.
8) D. G. Brookins, “Eh-pH Diagrams for Geochemistry,”Springer-Verlag, Berlin Heidelberg, 1988.
9) Li, Yuan-H. and Gregory, S., “Diffusion of Ions in SeaWater and in Deep-sea Sediments,” Geochim. etCosmochim. Acta, Vol.38, pp.703-714, 1973.
10) Marcus, Y., “Ion Properties,” Marcel Dekker. Inc., NewYork, 1997.
91