radio science september 2017 - ursi.orgursi.org/content/rsb/rsb_362_2017_09.pdf · the radio...
TRANSCRIPT

UNIONRADIO-SCIENTIFIQUE
INTERNATIONALE
INTERNATIONALUNION OF
RADIO SCIENCE
ISSN
102
4-45
30
URSI, c/o Ghent University (INTEC)St.-Pietersnieuwstraat 41, B-9000 Gent (Belgium)
Vol. 2017, No. 362September 2017R
adio
Sci
ence
Bul
letin
Makoto AndoPresident
Willem BaanVice President
Ondrej SantolikVice President
Ari SihvolaVice President
George UslenghiVice President
Paul CannonPast President
Peter Van DaeleSecretary General

2 The Radio Science Bulletin No 362 (September 2017)
ContentsRadio Science Bulletin Staff ....................................................................................... 3URSI Offi cers and Secretariat.................................................................................... 6Editor’s Comments ..................................................................................................... 8Preface to the Special Section on “Radio Astronomy: A Continuous
Demand for Breakthrough Technology” ............................................................. 10Remembering Gianni Tofani: Preparing Radio Technologies for
Large Radio-Astronomy Projects ........................................................................ 11Remembering G. Tofani: Numerical Analysis of Radio-Astronomy Devices ...... 13Seventy Years of Radio Telescope Design and Construction ................................. 15The Precision Array for Probing the Epoch of Reionization (PAPER):
A Modern Scientifi c Adventure ............................................................................ 39Sub-Millimeter Heterodyne Focal-Plane Arrays for High-Resolution
Astronomical Spectroscopy .................................................................................. 53Coexistence Between Communications and Radar Systems: A Survey ............... 74Opening Speeches from the XXXIInd URSI GASS ............................................... 83In Memoriam: Larissa Vietzorreck ......................................................................... 88In Memoriam: Thomas B. A. Senior ....................................................................... 89Call for papers FEM 2018 ........................................................................................ 91Et Cetera .................................................................................................................... 92A Remarkable Photo ................................................................................................. 93Ethically Speaking .................................................................................................... 94Call for papers - European School of Antennas 2018 ............................................ 96Solution Box ............................................................................................................... 97Telecommunications Health and Safety ................................................................ 102Women in Radio Science ........................................................................................ 104Call for Papers ICEAA - IEEE APWC ................................................................. 106Early Career Representative Column ................................................................... 107Report on Microwave and Radio Electronics Week 2017 ................................... 110URSI Conference Calendar .....................................................................................111Information for Authors ......................................................................................... 112Become An Individual Member of URSI .............................................................. 113
The International Union of Radio Science (URSI) is a foundation Union (1919) of the International Council of Scientifi c Unions as direct and immediate successor of the Commission Internationale de Télégraphie Sans Fil which dates from 1914.Unless marked otherwise, all material in this issue is under copyright © 2017 by Radio Science Press, Belgium, acting as agent and trustee for the International Union of Radio Science (URSI). All rights reserved. Radio science researchers and instructors are permitted to copy, for non-commercial use without fee and with credit to the source, material covered by such (URSI) copyright. Permission to use author-copyrighted material must be obtained from the authors concerned.The articles published in the Radio Science Bulletin refl ect the authors’ opinions and are published as presented. Their inclusion in this publication does not necessarily constitute endorsement by the publisher. Neither URSI, nor Radio Science Press, nor its contributors accept liability for errors or consequential damages.

The Radio Science Bulletin No 362 (September 2017) 3
Radio Science Bulletin Staff Editor
W. R. StoneStoneware Limited840 Armada TerraceSan Diego, CA 92106, USATel: +1-619 222 1915, Fax: +1-619 222 1606E-mail: [email protected]
Editor-in-Chief
P. Van DaeleURSI SecretariatGhent University - INTECTechnologiepark - Zwijnaarde 15B-9052 GentBELGIUMTel: +32 9-264 33 20, Fax: +32 9-264 42 88E-mail: [email protected]
Production Editor
I. LievensURSI Secretariat / Ghent University - INTECTechnologiepark - Zwijnaarde 15B-9052 Gent, BELGIUMTel: +32 9-264.33.20, Fax: +32 9-264.42.88E-mail: [email protected], [email protected]
Senior Associate Editors
A. Pellinen-WannbergDepartment of PhysicsUmea UniversityBOX 812SE-90187 Umea, SWEDENTel: +46 90 786 74 92, Fax: +46 90 786 66 76E-mail: [email protected]
O. SantolikInstitute of Atmospheric PhysicsAcademy of Sciences of the Czech RepublicBocni II1401, 141 31 Prague 4, CZECH REPUBLICTel: +420 267 103 083, Fax +420 272 762 528E-mail [email protected], [email protected]
Associate Editors, Commissions
Nuno Borges CarvalhoInstituto de TelecomunicaçoesUniversidade de Aveiro, Campus Universitario3810-193 Aveiro, PortugalTel: +351 234377900, Fax: +351 234377901E-mail: [email protected]
Pedro Miguel CruzRua Sao Sebastiaon34 Hab 334520-250 Santa Maria da Feira, Aveiro, PORTUGALTel: +351 225898410E-mail: [email protected]
Tian Hong LohNational Physical LaboratoryHampton RoadTeddington TW11 0LW, United KingdomTel: +44 020 8943 6508E-mail: [email protected]
Nosherwan ShoaibSchool of Electrical Engineering and Computer Science (SEECS)National University of Sciences and Technology (NUST)NUST Campus H-12, Islamabad, PakistanTel: 051 90852561E-mail: [email protected]
Commission A
4 The Radio Science Bulletin No 362 (September 2017)
Commission B
Yves LouetCS 47601, SUPELECAvenue de BoulaieF-35576 Cesson-Sévigné, FranceTel: +33 2 99 84 45 34, Fax: +33 2 99 84 45 99E-mail: [email protected]
Naoki ShinoharaRISHKyoto UniversityUji 611-0011, JapanTel: +81 774 38 3807 Fax: +81 774 31 8463E-mail: [email protected]
Commission C
Commission D
Virginie DeniauIFSTTAR20. rue Elisée Reclus BP 70317 F-59666 Villeneuve d’Ascq Cedex, FranceTel: +33 03 20438991E-mail: [email protected]
Commission E
Haonan ChenEarth System Research lab, Physical Sciences DivisionNOAA325 Broadway, Boulder, CO 80305, USATel: +1 303 497 4616E-mail: [email protected]
Tullio TanziTélécom ParisTech - LabSoC, c/o EURECOMCampus SophiaTech Les Templiers450 route des Chappes 06410 Biot, FRANCETel: +33 0 4 93008411, Fax: 33 0 493008200E-mail: [email protected]
Commission G
Giorgiana De FranceschiDept. Arenonomy, Istituto Nazionale di Geofi sica eVulcanologyVia di Vigna, Murata 60500 143 Roma, ItalyTel: +39 06 51860307, Fax: +39 06 51860397E-mail: [email protected]
Commission H
Jyrki ManninenSodankylä Geophysical ObservatoryTähteläntie 62FIN-99600 Sodanskylä, FinlandTel: +358 16 619824, Fax +358 16 619875E-mail: [email protected]
Jacob W. BaarsMax Planck Institute for Radio AstronomyAuf dem Hügel 6953121 Bonn, GermanyTel: +49 228 525303E-mail: [email protected]
Andrea MichelDepartment of Information EngineeringUniversità di PisaPisa, ItalyE-mail: [email protected]
John VolakisCollege of Engineering and ComputingFlorida International University10555 W. Flagler Street, EC2477Miami, FL 33174, USATel: +1 305 348 2807E-mail: jvolakis@fi u.edu
Commission F
Commission J
Commission K
Kensuke SasakiApplied EM Research InstituteNICTKoganei, Tokyo, JapanE-mail: [email protected]

The Radio Science Bulletin No 362 (September 2017) 5
Associate Editors, Columns
G. TrichopoulosElectrical, Computer & Energy Engineering ISTB4 555DArizona State University781 E Terrace Road, Tempe, AZ, 85287 USATel: +1 (614) 364-2090E-mail: [email protected]
Book Reviews
Historical Papers
J. D. MathewsCommunications and Space Sciences Lab (CSSL)The Pennsylvania State University323A, EE EastUniversity Park, PA 16802-2707, USATel: +1(814) 777-5875, Fax: +1 814 863 8457E-mail: [email protected]
Et Cetera
T. AkgülDept. of Electronics and Communications EngineeringTelecommunications DivisionIstanbul Technical University80626 Maslak Istanbul, TURKEYTel: +90 212 285 3605, Fax: +90 212 285 3565E-mail: [email protected].
Solution Box
Telecommunications Health & Safety
J. C. LinUniversity of Illinois at Chicago851 South Morgan Street, M/C 154Chicago, IL 60607-7053 USATel: +1 312 413 1052, Fax: +1 312 996 6465E-mail: [email protected]
Ö. ErgülDepartment of Electrical and Electronics EngineeringMiddle East Technical UniversityTR-06800, Ankara, TurkeyE-mail: [email protected]
Historical Column
G. PelosiDepartment of Information EngineeringUniversity of FlorenceVia di S. Marta, 3, 50139 Florence, ItalyE-mail: giuseppe.pelosi@unifi .it
Women in Radio Science
A. Pellinen-WannbergDepartment of Physics and Swedish Institute of Space PhysicsUmeå UniversityS-90187 Umeå, Sweden Tel: +46 90 786 7492E-mail: [email protected]
Early Career Representative Column
S. J. WijnholdsNetherlands Institute for Radio AstronomyOude Hoogeveensedijk 47991 PD Dwingeloo, The NetherlandsE-mail: [email protected]
Ethically Speaking
R. L. HauptColorado School of MinesBrown Building 2491510 Illinois Street, Golden, CO 80401 USATel: +1 (303) 273 3721E-mail: [email protected]
A. J. ShockleyE-mail: [email protected]
Education Column
Madhu ChandraMicrowave Engineering and Electromagnetic TheoryTechnische Universität ChemnitzReichenhainerstrasse 7009126 GermanyE-mail: [email protected]

6 The Radio Science Bulletin No 362 (September 2017)
URSI Offi cers and SecretariatCurrent Offi cers triennium 2017-2020
Past President
P. S. CannonGisbert Kapp Building
University of BirminghamEdgbaston , Birmingham, B15 2TT,
UNITED KINGDOMTel: +44 (0) 7990 564772Fax: +44 (0)121 414 4323
E-mail: [email protected]
Secretary General
P. Van DaeleURSI Secretariat
Ghent University - INTECTechnologiepark - Zwijnaarde 15
B-9052 GentBELGIUM
Tel: +32 9-264 33 20Fax: +32 9-264 42 88
E-mail: [email protected]
Vice President
W. BaanAstron
Asserweg 459411 LP Beilen
THE NETHERLANDSTel: +31 521-595 773/100
Fax: +31 521-595 101E-mail: [email protected]
Vice President
A. SihvolaElectronic Science Department
Aalto UniversitySchool of Electrical Engineering
PO Box 13000FI-00076 AALTO
FINLANDTel: +358 50 5871286
E-mail: [email protected]
President
M. AndoDept. of Electrical & Electronic Eng.Graduate School of Science and Eng.
Tokyo Institute of TechnologyS3-19, 2-12-1 O-okayama, Meguro
Tokyo 152-8552, JAPANTel: +81 3 5734-2563Fax: +81 3 5734-2901
E-mail: [email protected]
Vice President
O. SantolikInstitute of Atmospheric Physics
Electrical Eng. DeptAcademy of Sciences of the Czech Republic
Bocni II, 1401141 31 Prague 4, CZECH REPUBLIC
Tel: +420 267 103 083Fax: 420 272 762 528
E-mail: [email protected], [email protected]
Vice President
P. L. E. UslenghiDept. of ECE (MC 154)
University of Illinois at Chicago 851 S. Morgan Street
Chicago, IL 60607-7053USA
Tel: +1 312 996-6059Fax: +1 312 996 8664
E-mail: [email protected]

The Radio Science Bulletin No 362 (September 2017) 7
URSI Secretariat
AssistantSecretary General
Publications
W. R. Stone840 Armada Terrace
San Diego, CA 92106USA
Tel: +1-619 222 1915Fax: +1-619 222 1606
E-mail: [email protected]
AssistantSecretary General
AP-RASC
K. KobayashiDept. of Electr and Commun. Eng,
Chuo University1-13-27 Kasuga, Bunkyo-ku
Tokyo, 112-8551, JAPANTel: +81 3 3817 1846/69
Fax: +81 3 3817 1847E-mail: [email protected]
Executive Secretary
I. HeleuURSI Secretariat
Ghent University - INTECTechnologiepark - Zwijnaarde 15
B-9052 GentBELGIUM
Tel. +32 9-264.33.20Fax +32 9-264.42.88E-mail [email protected]
AdministrativeSecretary
I. LievensURSI Secretariat
Ghent University - INTECTechnologiepark - Zwijnaarde 15
B-9052 GentBELGIUM
Tel: +32 9-264.33.20Fax: +32 9-264.42.88
E-mail: [email protected]
Secretary General
P. Van DaeleURSI Secretariat
Ghent University - INTECTechnologiepark - Zwijnaarde 15
B-9052 GentBELGIUM
Tel: +32 9-264 33 20Fax: +32 9-264 42 88
E-mail: [email protected]

8 The Radio Science Bulletin No 362 (September 2017)
Editor’s Comments
W. Ross StoneStoneware Limited840 Armada TerraceSan Diego, CA 92106, USATel: +1-619 222 1915, Fax: +1-619 222 1606E-mail: [email protected]
Special Section on “Radio Astronomy: A Continuous Demand for Breakthrough
Technology”
Our special section traces the history and reviews the current status of key areas of radio science technology in radio astronomy. Our guest Editors, P. Bolli, N. D’Amico, and R. Nesti, have brought us three invited papers in this issue. The fi rst, by J. W. M. Baars and H. J. Kärcher, reviews the history and current status of the basic design and construction of radio telescopes. This is a very comprehensive work. It also provides fascinating insights into why design and construction decisions were made, and their eff ects on observing capabilities. R. F. Bradley has provided an in-depth look at the PAPER array. This story spans more than a decade, describing the motivation, design, implementation, and results from the development of an array to search for the electromagnetic emissions produced by the universe during the time from when it was a few million years old until about 650 million years later: the Epoch of Reionization. In addition to the scientifi c and historical information in the paper, there were important lessons learned regarding how to design, develop, and deploy large radio-telescope arrays. It is a fascinating story. The third paper in this issue’s special section is by P. F. Goldsmith, who reviews the status of sub-millimeter heterodyne focal-plane arrays for high-resolution spectroscopy. This is a very comprehensive review, with an excellent explanation of how such arrays work and what motivates the major factors driving the design decisions associated with them.
The special section is dedicated to the memory of Gianni Tofani. The guest Editors have provided a nice preface, and A. van Ardenne and G. Pelosi have each provided remembrances of Gianni Tofani. The second part of the special section will appear in the March issue of the Radio Science Bulletin.
Our Contributed Paper
The tremendous growth in wireless communications has led to a nearly insatiable demand for spectrum. That has led to the need for spectrum sharing. The requirement for radar and wireless communications systems to share spectrum in the 5 GHz band in the US is one example. Methods for doing this are considered in detail in the paper by Mina Labib, Vuk Marojevic, Anthony Martone, Jeff rey Reed, and Amir Zaghloul. They fi rst introduce the general background of spectrum sharing. They then review the regulations related to spectrum sharing and radar systems. This is followed by an overview of the two main tasks associated with spectrum sharing: spectrum awareness and dynamic spectrum access. Detailed approaches are then presented, including cognitive communications systems, cognitive radar, waveform shaping, waveform design, and joint cognition. This paper provides a very nice introduction to of the major issues associated with and an overview of the major solution approaches for spectrum sharing between communications systems and radar.
Our Other Contributions
This issue contains the texts of the speeches given by URSI President Paul Cannon and URSI Secretary General Paul Lagasse at the opening ceremony of the URSI XXXIInd General Assembly and Scientifi c Symposium (GASS) in Montreal, Canada, August 20, 2017. They contain important information about URSI, including the names of the offi cers elected for the new triennium.
Stefan Wijnholds’ Early Career Representatives column has two reports. The fi rst summarizes the Young Scientist Awards for the Montreal GASS. The second, by Sembiam Rengarajan, gives the winners of the Student Paper Competition at the GASS.

The Radio Science Bulletin No 362 (September 2017) 9
In their Ethically Speaking column, Randy Haupt and Amy Shockley look at the practice of selling bridges. They off er some thoughts on how to identify potential scams.
Özgür Ergül’s Solution Box considers an optimization problem involving a nanowire transmission line with a coupler. The example solution, provided by Aşkın Altınoklu and Özgür Ergül, may not be optimum from several standpoints. Other solutions are sought.
In his Telecommunications Health and Safety column, Jim Lin looks at the “sonic health attacks” that have allegedly been made on diplomats in Havana. He suggests that the reported eff ects could have been caused by acoustic eff ects resulting from exposure to high-intensity microwave fi elds. There are some interesting possibilities.
In her Women in Radio Science column, Asta Pellinen Wannberg brings us the story of Iwona Stanislawska, the outgoing Chair of URSI Commission G, and a professor and the Director the Space Research Centre of the Polish Academy of Sciences. She provides an interesting perspective on her career in radio science.
Attend AT-RASC 2018!
As this goes to “press,” you should just have time to submit a paper to the URSI fl agship meeting, the 2nd Atlantic Radio Science Conference (AT-RASC) 2018. This will be held May 28-June 1, 2018, at the ExpoMeloneras Convention Centre, Gran Canaria, Spain. Papers may be either in the form of an Extended Abstract (minimum 250 words, maximum one page) or a Summary Paper (minimum two pages, maximum four pages). All 10 URSI Commissions will be represented, and it should be an outstanding meeting. Of course, the location is delightful. Submission information, as well as information on registration and hotel reservations, can be found at www.at-rasc.org.

10 The Radio Science Bulletin No 362 (September 2017)
Preface to the Special Section on“Radio Astronomy: A Continuous
Demand for Breakthrough Technology”
Radio astronomy is a relatively young science: about an average human lifetime has passed since Karl
Jansky’s measurement campaign took place at Holmdel, New Jersey, in the early 1930s, now celebrated as the birth date of radio astronomy. Most people working in the fi eld today can claim to have personally known the pioneers in their countries. In the case of Italy, one such pioneer was Gianni Tofani, who passed away in February 2015. He fully devoted his professional life to scientifi c and technological research in astrophysics, mainly from the wonderful Arcetri hill of his beloved city, Florence. Furthermore, his management style was highly respected, bringing him to hold leadership positions such as the Director of the Institute of Radio Astronomy.
Among his memberships in different scientific councils, Gianni was also President of the Italian section of URSI. It is here, in a special section of this journal, that we celebrate his memory and acknowledge his contributions to the fi eld. The Editors of this special section have worked closely with Gianni over the past twenty years, and have appreciated his professional and human qualities. It has been easy and satisfying to receive an enthusiastic “Yes” when calling for a contribution to this section from worldwide authors, not only top quality researchers in their respective fi elds, but also, mainly, very good friends. The Editors wish to kindly thank them all for their valuable contributions, which show complementary perspectives of technological advances in radio astronomy.
Due to the high number of papers constituting this special section, it will be divided over two issues of the Radio Science Bulletin. The fi rst part, published in this issue, opens with two remembrances of Gianni Tofani from distinguished authors, A. van Ardenne (ASTRON,
P. Bolli1, N. D’Amico2,3, and R. Nesti1
1Italian National Institute for AstrophysicsOsservatorio Astrofi sico di Arcetri
Firenze, ItalyE-mail: [email protected]
2Italian National Institute for AstrophysicsOsservatorio Astronomico di Cagliari
Cagliari, ItalyE-mail: [email protected]
The Netherlands) and G. Pelosi (University of Florence, Italy). Several diff erent technological topics applied to radio astronomical research are then authoritatively encompassed and reviewed: from mechanical engineering to digital and analog electronics, from very-low-frequency receiving systems to sub-millimeter wavelength spectroscopic cameras, from metrology to signal-processing techniques. However, there is a common thread among all of these: developing advanced technology for improving our knowledge of the universe. This was exactly what Gianni Tofani pursued throughout his professional life.
In this issue, we have the following papers:
• J. W. M. Baars (MPIfR, Germany) and H. J. Kärcher (MT Mechatronics, Germany), “Seventy Years of Radio Telescope Design and Construction”
• R. F. Bradley (NRAO, USA), “The Precision Array for Probing the Epoch of Reionization (PAPER): A Modern Scientifi c Adventure”
• P. F. Goldsmith (JPL, USA), “Sub-Millimeter Heterodyne Focal-Plane Arrays for High-Resolution Astronomical Spectroscopy”
The second part of this special section, to appear in the March 2018 issue of the Radio Science Bulletin, will contain contributions on the Sardinia Radio Telescope, the Square Kilometre Array, and the Atacama Large Millimeter Array, respectively from N. D’Amico (INAF, Italy), P. Diamond and R. Braun (SKA Organization, UK), and L. Testi (ESO, Germany).

The Radio Science Bulletin No 362 (September 2017) 11
Remembering Gianni Tofani:Preparing Radio Technologies forLarge Radio-Astronomy Projects
Arnold van Ardenne
Netherlands Institute for Radio Astronomy (ASTRON)Dwingeloo, The NetherlandsE-mail: [email protected]
Figure 1. Gianni Tofani (Italian Regional Television News).
In this short contribution to commemorate Gianni Tofani’s (Figure 1) insightful roles for progressing radio
technologies for radio astronomy, I wish to mention only a few occasions that illustrate this.
In the seventies and early eighties, we mostly met on the occasions to push VLBI (very-long-baseline interferometry) techniques in Europe, e.g., through membership in the Receiver Working Group. At the time, this group was very active in “harmonizing” the disparate
receiving systems around Europe, for example, with respect to frequency bands, polarization, frequency-conversion schemes, time-dissemination and phase-coherent aspects, RF systems, and, ultimately, digitization and recording techniques, in particular in collaboration with Haystack/MIT and the NRAO.
I have no specifi c recollection of his contribution here. However, this most complicated fi eld became defi nitely even more challenging in Quasat times [1], as around

12 The Radio Science Bulletin No 362 (September 2017)
that time, we started to meet more frequently. This was particularly true in the context of the fairly complicated feed [2] that we proposed to use for that planned orbiting radio telescope, and for which Gianni showed interest in for ground-based applications. one example was the radio telescope in Noto, in Sicily, which gave much credit to Gianni’s close involvement.
Those times coincided when ASTRON (then NFRA) became closely involved in (sub)mm radio astronomy technologies for what later became the James Clark Maxwell Telescope (JCMT) technologies and developments, which struck Gianni’s interests, as well. Later, in the mid-nineties, this became even clearer, with his interest in advancing European ideas for a Large Millimetre Array (LSA) of radio telescopes, led by a number of European institutes [3] in which Gianni was an active participant.
As history knows, the LSA – together with the US activities on a millimeter-wavelength array then called MMA – merged into what has now become the extremely successful ALMA Observatory, in which Japan also became a partner.
In early 2000, the international activities toward the Square Kilometre Array (SKA), then in its earliest stages, became well organized. At that time, activities in Europe were coordinated through the European SKA Consortium (ESKAC), of which Gianni was an early member, spokesperson, and supporter for such structural organization in Europe. He clearly wished for the solid participation of Italy in this international endeavor. It was therefore only natural that he became an early supporter of the largest EC-supported R&D program for radio astronomy toward the SKA, called SKADS [4], which ran from 2005-2010. Together with other Italian astronomers and engineers, his
early engagement resulted in Italy becoming a founding member of the present SKA Organization in Manchester [5].
Surely, his modest, pleasant, and quietly convincing nature lead this way, always at the forefront on new developments for the advancement of radio astronomy.
References
1. H. Ames et al., “Quasat: Technical Aspects of the Pro-posed Mission,” ESA Spec. Publ., ESA SP-213, 1984, pp. 27-99.
2. D. Savini, G. Figlia, A. V. Ardenne, and K. van’t Klooster, “A Triple Frequency Feed for the QUASAT Antenna,” 1988 IEEE International Symposium on Antennas and Propagation Digest, June 6-10, 1988, Syracuse, NY, pp. 342-345.
3. A. van Ardenne et al., “Correlator Developments for (sub)Millimeter Telescopes,” in P. Shaver (ed.), Proceedings of the ESO-IRAM-NFRA-Onsala Workshop on Science with Large Millimetre Arrays, (Garching, Germany, December 11-13, 1995,) Berlin, Springer-Verlag, ISBN 3-540-61582-2, 1996, pp. 395-401.
4. A. van Ardenne, “SKADS; Scope and Overview of Ac-tivities and Results,” in S.A. Torchinsky, et al. (eds.), Proceedings of Wide Field Astronomy & Technology for the Square Kilometre Array (Chateau Limelette, Belgium, November 4-6, 2009), Proceedings of Science, ISBN 978-90-805434-5-4, 2010, pp. 9-14.
5. http://skatelescope.org/

The Radio Science Bulletin No 362 (September 2017) 13
Remembering Gianni Tofani: Numerical Analysis of Radio-Astronomy Devices
Giuseppe Pelosi
Department of Information EngineeringUniversity of Florence
Via S. Marta 3, I-50139 Florence , ItalyE-mail: giuseppe.pelosi@unifi .it
I fi rst met Gianni Tofani about twenty years ago, in 1995, and since then an intense scientifi c collaboration activity
and an important friendship began. Having an engineering degree earned in Pisa, he always favored the collaboration between Italian radio astronomy and engineering. Since then, Gianni held a series of monographic seminars within my course on “Antenna Systems” at the School of Engineering of the University of Florence (Figure 1). This led to numerous theses at both the masters and doctoral levels in the fi eld of radio astronomy.
As is well known, in the design of a radio telescope, the coupling between the antenna – generally, a radiation-collecting surface – and the front-end receiver system is particularly important. Optics design, misalignment, the surface accuracy of refl ectors, or absorption losses in passive components are very critical in the effi ciency budget of a
radio telescope, the total costs of which are of the order of millions of Euros.
For some years, design methods through complex electromagnetic analysis have become consolidated tools for the realization of radiation-collector systems in the focal area of variously structured antennas. In the front-end receiver systems, commonly used in the chain of a radio telescope, microwave passive components require a complex design and optimization to minimize insertion losses, and to improve the matching response and polarization purity over the frequency band.
The development of the aforementioned electromagnetic-analysis methods is one of the main technological activities of the Arcetri Astrophysical
Figure 1. Students of the “Antenna Systems” course at the University of Florence, School of Engineering, during a visit guided by Gianni Tofani (second from the left), at the Medicina radio telescope (Bologna, Italy) in the 1996-9 7 academic year.

14 The Radio Science Bulletin No 362 (September 2017)
Observatory. This knowledge has been possible thanks also to the twenty years of collaboration (Figure 2) – strongly s ought by Gianni Tofani – with the Department of Information Engineering of the University of Florence, and in particular with the Research Laboratory “RF, Microwave and Electromagnetism.”
This research thread has created many scientifi c projects over the years for studying, optimizing, and realizing the various electromagnetic devices that constitute the antenna system for radio-astronomy applications, starting from feed horns up to microwave passive
Figure 2. Collaboration between the University of Florence and the Arcetri Astrophysical Observatory resulted in this hexagonal array of seven horn antennas for the Q-band (33-50 GHz) receiver of the Sardinia Radio Telescope.
devices. On these topics, the aforementioned laboratory, together with the Arcetri Astrophysical Observatory, actively participated in the research and development of electromagnetic technologies in radio-frequency bands. This happened through both various national projects, coordinated by INAF, such as the Sardinia Radio Telescope (SRT), and through major international projects, coordinated by ad hoc consortia such as the Atacama L arge Millimeter Array (ALMA) and the Square Kilometre Array (SKA) projects, or by space agencies, such as the Planck satellite of the European Space Agency (ESA).

The Radio Science Bulletin No 362 (September 2017) 15
Seventy Years of Radio TelescopeDesign and Construction
Jacob W. M. Baars1 and Hans J. Kärcher2
1Max-Planck-Institut für RadioastronomieBonn, Germany
E-mail: [email protected]
2MT MechatronicsMainz, Germany
E-mail: [email protected]
Abstract
Radio radiation from the Milky Way was serendipitously discovered by Jansky in 1932. Reber used a home-built parabolic refl ector to map the “radio sky” around 1940. Radio astronomy quickly developed after 1945, and the fi rst large refl ectors appeared in 1956-1961, operating at wavelengths of 20 cm and longer. A trend to shorter wavelengths and larger refl ectors pushed structural design to include precision in addition to stiff ness. A breakthrough was achieved in the mid-sixties by the concept of homologous deformation, and the use of advanced fi nite-element-analysis programs. The largest fully steerable radio refl ectors of 100 m diameter can be used to a wavelength of less than 1 cm, while the most-precise refl ectors of 10 m to 15 m diameter operate at 0.3 mm (1 THz).
We review the development of the design methods over time by example of selected radio telescopes where new design or material choices were made. These are the early telescopes in Jodrell Bank, Dwingeloo, and Parkes. The introduction of the homology principle, with its application to the Eff elsberg telescope, opened the door to highly precise, large telescopes for mm-wavelengths. These culminated in the MRT (Millimeter Radio Telescope, Spain), LMT (Large Millimeter Telescope, Mexico) and ALMA (Atacama Large Millimeter Array, Chile). We conclude with a discussion of the design features of the Sardinia Radio Telescope (SRT).
1. Introduction
Astronomy is an observational science. The astronomer uses a telescope to collect the electromagnetic
radiation that reaches the Earth from the “sky.” In analyzing the received signal, he or she draws conclusions as to the physical circumstances of the celestial “transmitter,” a star, galaxy, planet, or cloud of gas or dust. Diff erently from the experimental physicist, the astronomer cannot perform an experiment by infl uencing the processes in the object. For
centuries, astronomy was limited to the use of the one-octave-wide spectral range of visible light at wavelengths from 380 to 700 nanometers.
By chance, K. G. Jansky [1], while working on short-wave communication at the Bell Telephone Laboratories, in 1932 discovered strong noise-like radiation at 20 MHz from the direction of the center of our Galaxy. This added the radio regime to the available spectral domain for astronomical research. Initially, only one person, an engineer and radio ham by the name of Grote Reber, followed up with constructing a 9.6 m-diameter parabolic refl ector in his backyard, and systematically recording “cosmic static.” With diffi culty, he managed to publish his observations in the Astrophysical Journal [2], where it drew attention from several “real” astronomers and radar engineers. After the War, the latter turned their radar antennas into receiving systems for the study of cosmic radiation, in particular in England, Australia, and the USA. By the end of the 1940s, these activities were called radio astronomy, exercised by radio astronomers.
The observations were mainly performed at meter wavelengths with dipole arrays. The prediction by van de Hulst in 1944 [3] of a detectable spectral line of neutral atomic hydrogen at a wavelength of 21 cm pointed to the need for a refl ector antenna of suffi cient area and surface precision. In Europe, these were available in the form of the 7.5 m-diameter “Würzburg Riese” radar antennas, left behind by the German occupation. They were used in the Netherlands, England, and Scandinavia, and also in the USA. The Dutch antenna confi rmed the neutral hydrogen line a few weeks after its initial detection [4, 5]. Several groups made daily observations of the sun. In Cambridge, England, two refl ectors were connected as an interferometer to establish accurate celestial positions of the new “radio sources.” In relation to optical telescopes, radio telescopes suff er from an abysmally poor angular resolution. An optical telescope of only 10 cm diameter provides an angular resolution of about one arcsecond, while the Würzburg antenna at 21 cm had a beamwidth

16 The Radio Science Bulletin No 362 (September 2017)
of almost two degrees, which was a factor of 7000 poorer resolution. It also became clear that there were only a very few strong radio sources that can be properly studied by the existing instruments.
As a result, in the early fi fties, several proposals were
advanced for the construction of large paraboloidal refl ector antennas. The existing groups also put strong eff orts into the improvement of the sensitivity of the receivers. The choice of the paraboloid was obvious: it was a frequency-independent device with a single focal point, where the receiver could be located.
While selecting a large refl ector was a simple matter, designing and constructing one was altogether another matter. The refl ector needed to be directed to any point of the sky, and moreover, needed to be able to follow that point on its diurnal path. The refl ector would thus have to be placed on a two-axis mount that provided precisely controlled angular movement about the axes. In addition, the parabolic shape of the refl ector should be maintained with varying tilting angle to an accuracy of a small part of the observing wavelength. The important hydrogen line at 21 cm wavelength determined the minimum operational wavelength of the early large telescopes, requiring a surface precision of 1 cm rms error. The obvious candidates for designing a refl ector radio telescope were people working on bridges, cranes, railroads, and airplanes. They could design large, stable structures, and handle survival requirements, such as storm loads. However, designing a large structure that moves in elevation angle and simultaneously rotates in azimuth, all the while maintaining refl ector precision and pointing direction, forced them to think “outside the box.”
The design features of the early radio telescopes have variously been applied and improved over time. Original design ideas have been introduced, and new materials have been incorporated in the development of ever-larger and more-precise instruments. In the following sections, we briefl y summarize these developments by describing major radio telescopes built over the last 60 years.
2. The Early Radio Telescopes
The success of the detection of the hydrogen line inspired Jan Oort, at the Leiden Observatory, to propose a telescope of 25 m diameter. A young engineer, Ben Hooghoudt, worked with the company Werkspoor on the design. The telescope came into operation in Dwingeloo, the Netherlands, in 1956, and was for some time the largest fully steerable radio telescope in the world [6]. In Manchester, England, Bernard Lovell teamed up with a well-known bridge builder, Henry Charles Husband, to realize a gigantic refl ector of 250-ft (76-m) diameter, which started work in 1957 [7]. Somewhat later, in Australia, Edward (Taff y) Bowen of CSIRO worked with Barnes Wallis, who had designed bombers for the Royal Air Force, on a 210-ft (64-m) telescope. Freeman Fox carried out the detailed design, and construction was fi nished in 1961 [8].
Quite diff erent solutions for the support of the refl ector by the mount were presented for the fi rst large refl ectors. The Jodrell Bank refl ector is a closed, welded steel surface, and part of the load-bearing structure that is connected to the elevation bearings by a stiff outer hoop (Figure 1a). In the zenith position, this leads to a large central sag, as illustrated in Figure 1a. At intermediate elevation angles, an astigmatic deformation occurs. The “bicycle wheel” in the center does not carry loads, but stabilizes the structure against wind.
The Dwingeloo refl ector is supported by a truss frame and connected to the elevation bearings about midway between center and rim (Figure 1c). This arrangement is optimal for the distribution of gravitational deformation and has been used for most large telescopes. The refl ector surface is composed of triangular panels with a wire mesh of steel. These two telescopes have a wheel-on-track azimuth movement that has been selected for most telescopes from about 40 m diameter upwards.
Figure 1. The (a) Jodrell Bank, (b) Parkes and (c) Dwingeloo telescopes (top to bottom), with their major deformation patterns illustrated above each telescope. The support scheme of the Dwingeloo telescope mini-mizes the overall sag.

The Radio Science Bulletin No 362 (September 2017) 17
The designers of the Parkes telescope took a completely diff erent approach. A truss frame, resembling an aircraft hull, connected at the center to a stiff hub, supports the refl ector. The deformation behavior is sketched in Figure 1b. Here, the maximum sag is at the refl ector’s rim, and a coma-type deformation occurs at intermediate elevation angles. The hub is connected to a compact elevation-azimuth mount placed on top of a concrete tower (Figure 1b). It reminds one of a cannon turret. This is often called a turning head mount. The refl ector surface is a mesh over most of the area, with a small inner part of closed metal.
The early radio telescopes were essentially designed to provide suffi cient stiff ness against gravitational deformation as a function of elevation angle. The infl uence of moderate wind and possible temperature gradients on the refl ector’s precision and the pointing behavior could essentially be ignored for the envisaged wavelengths of observation.
All three antennas have undergone significant
improvements over the years that upgraded their performance, in particular towards operation at shorter wavelengths. Jodrell Bank and Parkes are in full scientifi c use, while the Dwingeloo telescope is run by radio hams and astronomy amateurs, including an extensive program of outreach and education (camras.nl).
In the USA, several universities acquired telescopes between 15 m and 27 m in diameter in the later 1950s. The National Radio Astronomy Observatory was established in 1956, and operated a 26 m paraboloid since 1959; this was followed by a 92 m transit paraboloid in 1962 [9], and a high-precision 43 m telescope in 1965 [10], all located in Green Bank, West Virginia. Most of these telescopes had equatorial (polar) mounts, as did all optical telescopes at the time. Even the large 140-ft (43 m) telescope used a polar mount, which led to numerous problems in fabrication that could, at great cost and delay, be resolved. It is interesting to note that through state-of-art receivers and high-level operations support, this telescope became one of the most productive radio telescopes. An important factor here was the availability at short cm wavelengths, where it was preeminent for several years. A detailed story of the early NRAO telescopes was presented by Lockman et al. [11].
3. Homology Design and Its Derivatives
In the mid-sixties, astronomers were asking for larger refl ectors that would perform well at short cm wavelengths. Eff orts to use exiting telescopes in that wavelength region – in particular, early experience with the NRAO 140-ft telescope – showed serious performance defi ciencies that would need to be addressed in next-generation telescopes. On the one hand, gravitational deformation as a function of elevation angle limited the optimal use of the telescope to a rather small angular range around the angle where the surface had been adjusted to its specifi ed parabolic shape. Large-scale distortions, such as coma and astigmatism, caused signifi cant loss of effi ciency and reliability of observation. In addition, it became clear that variations and gradients in temperature of the support structure caused signifi cant refl ector deformation and additional pointing errors of the mount structure.
3.1 Summary of the Homology Principle
In a landmark paper, entitled “Design of Large Steerable Antennas,” [12] Sebastian von Hoerner at the NRAO studied these limitations, and presented a new design method to signifi cantly ameliorate their eff ects. He fi rst derived the “basic natural limits” of a traditional telescope design, gravitational, thermal, and stress, and plotted these in a diagram of diameter as a function of the shortest operational wavelength, as shown in Figure 2. It was clear that the existing telescopes, indicated by the numbered dots, stayed well below the limits.
Von Hoerner then introduced a new structural-design method to overcome the gravitational limit, for which he coined the name principle of homologous deformation, briefl y called homology. The idea is as simple as it is brilliant: let the structure deform under gravitational load but in such a way that the surface retains a parabolic shape for all elevation angles, while allowing a change in focal length and axis direction. The price to pay is the adjustment of the detector to the changing position of the focal point.
Figure 2. The natural limits to telescope size as a function of wavelength, with the values for a number of actual tel-escopes. All are more or less below the gravitational limit. The mm-telescope (no. 1) will be thermally limited during daytime (von Hoerner, 1967, [12]).

18 The Radio Science Bulletin No 362 (September 2017)
A fi rst goal was to create a refl ector-support structure that would exhibit equal softness. As illustrated in Figure 3, this can be achieved by additional structural layers that smooth the deformation behavior of the surface.
To decouple the refl ector structure from the “hard points” at the elevation bearings, which normally causes a strong “print-through” into the support structure, Von Hoerner used a basic octahedron between the refl ector backup structure and the elevation bearings (Figure 4). This is called an elevation cradle. It transfers the loads of the refl ector to the elevation bearings without causing print-through. The backup structure is connected to the cradle only at the lower central pivot by a conical circular set of struts that resemble an “inverted umbrella.” The top cone of the octahedron functions as the quadripod support for the secondary refl ector (or primary focus equipment) and penetrates the refl ector structure without any contact, thereby avoiding the “point loads” on the structure and their unavoidable local deformation.
3.2 Eff elsberg 100-m Telescope
The homology principle was applied in the design of the Eff elsberg 100-m telescope. For equal weights, the minimum wavelength of a homologous telescope can be more than an order-of-magnitude smaller than with a classical design based on stiff ness. It is interesting to recollect here that once homology became known among telescope users, several older telescopes showed partially homologous behavior, which could be exploited by adjusting the detector to the “best focus” location depending on the elevation angle.
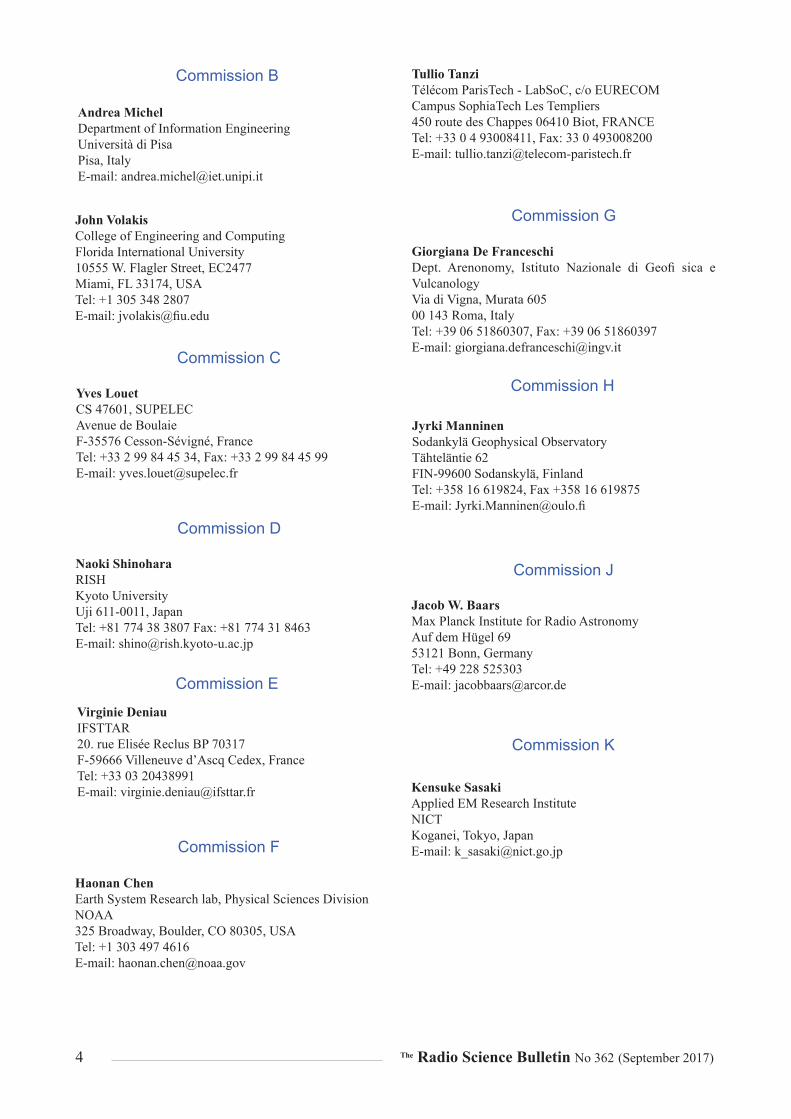
The consortium of Krupp and MAN designed the Eff elsberg telescope in the late sixties. The sketch in Figure 5 shows the rigorous separation of the three major telescope sections: refl ector with umbrella cone, octahedron elevation cradle with quadripod, and the wheel-on-track alidade. The picture in Figure 5 shows the highly symmetrical confi guration of the refl ector. It allowed the fi nite-element computer analysis of the structure despite the still-limited computer power at the time.
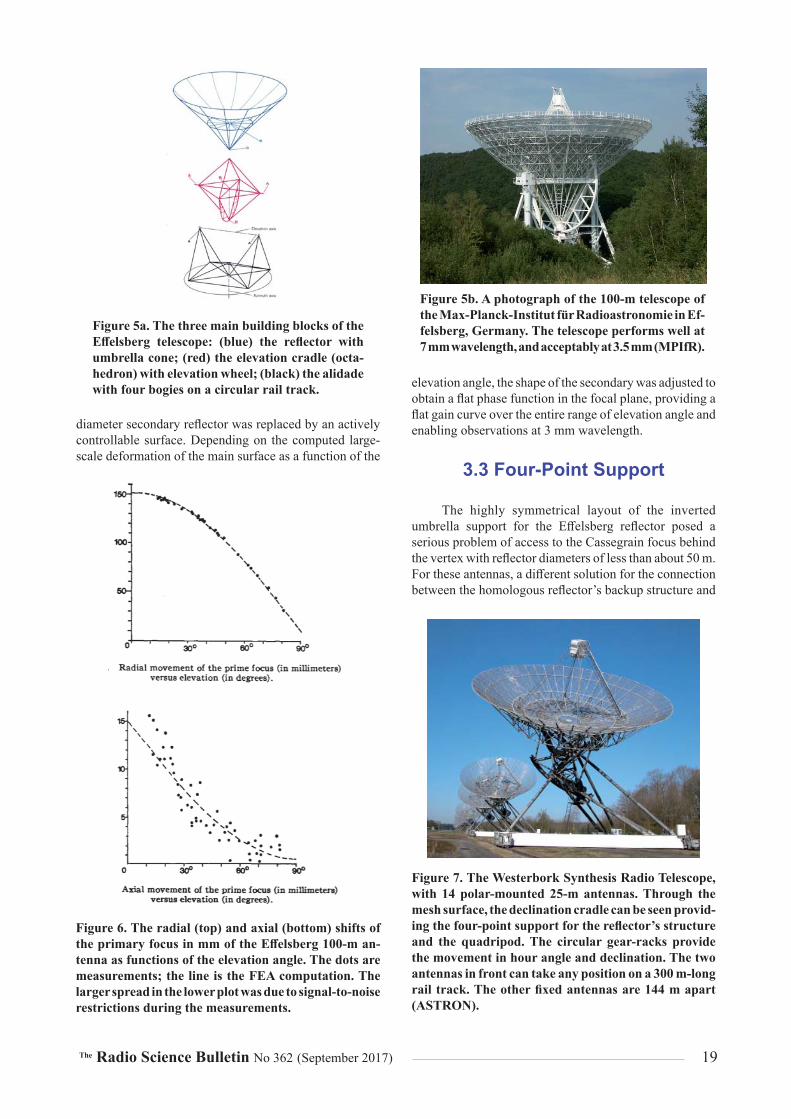
The basic ideas of von Hoerner were fully adopted, but the analysis and detailed design were done in house with available methods. The result was a telescope that surpassed its design specifi cations with a remarkably small total weight of 3150 tons, less than the Jodrell Bank 76 m telescope, and useable at a shortest wavelength of 7 mm. To illustrate the homologous behavior, in Figure 6 we show the position of the primary focus with respect to the structural prediction as a function of elevation angle [13].
Later, when comprehensive fi nite-element analysis programs became available, the design was run with these programs. The results showed deformation behavior very close to the original computations. In 2006, the 7.5 m
Figure 3. How an “equal softness” surface support is realized. The usual way (top) shows hard and soft points in the surface layer that lead to peaks and valleys in the surface, as depicted in the middle curve. By adding a few layers of trusses (bottom), the deformations are distributed, and the diff erences in defor-mations in the top layer become small [12].
Figure 4b. The refl ector backup structure, in solid lines, connected to the bottom of the cradle (dashed lines) by a number of struts (only three shown in solid lines), which form the “inverted umbrella” support.
Figure 4a. Von Hoerner’s original sketch of the octahedron concept for the elevation cradle.
The Radio Science Bulletin No 362 (September 2017) 19
diameter secondary refl ector was replaced by an actively controllable surface. Depending on the computed large-scale deformation of the main surface as a function of the
elevation angle, the shape of the secondary was adjusted to obtain a fl at phase function in the focal plane, providing a fl at gain curve over the entire range of elevation angle and enabling observations at 3 mm wavelength.
3.3 Four-Point Support
The highly symmetrical layout of the inverted umbrella support for the Eff elsberg refl ector posed a serious problem of access to the Cassegrain focus behind the vertex with refl ector diameters of less than about 50 m. For these antennas, a diff erent solution for the connection between the homologous refl ector’s backup structure and
Figure 5b. A photograph of the 100-m telescope of the Max-Planck-Institut für Radioastronomie in Ef-felsberg, Germany. The telescope performs well at 7 mm wavelength, and acceptably at 3.5 mm (MPIfR).
Figure 5a. The three main building blocks of the Eff elsberg telescope: (blue) the refl ector with umbrella cone; (red) the elevation cradle (octa-hedron) with elevation wheel; (black) the alidade with four bogies on a circular rail track.
Figure 6. The radial (top) and axial (bottom) shifts of the primary focus in mm of the Eff elsberg 100-m an-tenna as functions of the elevation angle. The dots are measurements; the line is the FEA computation. The larger spread in the lower plot was due to signal-to-noise restrictions during the measurements.
Figure 7. The Westerbork Synthesis Radio Telescope, with 14 polar-mounted 25-m antennas. Through the mesh surface, the declination cradle can be seen provid-ing the four-point support for the refl ector’s structure and the quadripod. The circular gear-racks provide the movement in hour angle and declination. The two antennas in front can take any position on a 300 m-long rail track. The other fi xed antennas are 144 m apart (ASTRON).

20 The Radio Science Bulletin No 362 (September 2017)
the elevation bearings needed to be found. A good solution was the application of a “cradle” that supported the BUS at four points, instead of at two, directly at the elevation bearings. The 25-m diameter polar-mounted antennas of the Westerbork Synthesis Radio Telescope (Figure 7), designed by Ben Hooghoudt, were the fi rst to apply this solution in the mid-sixties [14]. This decreased the gravitational refl ector deformation by an order of magnitude.
A further development was achieved by Hans Kärcher in the 32-m Merlin telescope in Cambridge (UK), by the introduction of a ring girder between the backup structure and the elevation bearings (Figure 8). The ring girder was equivalent to the “elevation cradle,” and also carried the elevation-gear rim for the elevation drives. The four
connecting points were arranged at the 45° symmetry lines. Shown in the small picture is this connection with fl exures between the backup structure and the ring girder.
The principle of the layout and the calculated gravitational deformation of the refl ector in zenith position are shown in Figure 9. Although the lower plot showed some print-through of the four support points, the overall deformation was an order-of-magnitude smaller than in the case of a two-point support directly at the elevation bearings, as shown in the upper plot. Clearly, the four-point support behaved in a reasonably homologous fashion, and it has been adapted for several telescopes with a diameter in the range of 15 m to 50 m. We shall meet variations of the four-point support in later sections.
Figure 8. The 32-m Merlin telescope of the Jodrell Bank Observatory in Cambridge, UK. The reflector backup structure is connected to the ring girder at four positions 45° from the elevation bear-ings by fl exures, visible in the middle of the detail picture (two nodes to the left of the red painted area) (H. Kärcher).
Figure 9b. The layout of the four-point ring-girder support of the refl ector and the calculated gravitational deformation pattern in the zenith position, showing the decrease of deformation by an order of magnitude, to 467 μm.
Figure 9a. The layout of the two-point support on the elevation bearings and the calculated gravitational deformation pattern in the zenith position, amounting to 4117 μm rms.

The Radio Science Bulletin No 362 (September 2017) 21
3.4 The Green Bank Telescope (GBT)
Since its inception in 1957, the US National Radio Astronomy Observatory (NRAO) has taken up a number of projects to expand the available frequency range to observers. We mentioned above the 140-ft polar-mounted telescope that allowed observations at 2 cm wavelength. To off set the delay of the 140-ft in the early sixties, NRAO built a “quick and dirty” telescope in the form of a transit instrument of 300 ft (92 m) diameter. The telescope was restricted to a movement in elevation, and used the rotation of the Earth for the other coordinate. The telescope was designed and built in about one and one-half years, and started operation in September 1962 [9]. Its planned lifetime was fi ve years. After a highly productive life of 26 years, material fatigue in an essential gusset plate caused the telescope to collapse on the evening of November 15, 1988. Its loss opened the way for the 100-m GBT (Green Bank Telescope).
Again, NRAO decided to develop uncharted territory by proposing a telescope of 100 m diameter in an off set geometry (Figure 10). Here, the refl ector is a section of a paraboloid that lies outside the optical axis. The focal equipment, or the secondary refl ector in a dual-refl ector arrangement, together with its supporting structure, could be placed without causing any blocking of the main refl ector. The most common prime-focus off set antenna is the ubiquitous personal satellite dish for the direct reception of satellite-borne TV transmissions. Such an optical arrangement exhibits superior electromagnetic performance in the form of higher aperture effi ciency and a “clean” beam with low sidelobe structure. This was indeed the primary argument for the choice of the off set geometry, in that it would provide highly reliable observations of very weak and extended regions of radiation, both in our own Galaxy and external systems.
A goal of 0.4 mm rms precision of the refl ector was set, to be competitive with the Eff elsberg 100 m telescope. However, the off set antenna, with its highly asymmetrical geometry, had signifi cant consequences for the structural design. In the design phase, it was realized that an active control of the surface and pointing of the telescope would be necessary. The project included a large eff ort in the realization of such a system. The construction of the telescope was started in 1991, and the telescope came into operation in 2002 [15]. We limit ourselves here to a few comments in the area of structural design, in particular in comparison to the Eff elsberg telescope.
As in Eff elsberg, the tipping structure of the Green Bank Telescope consists of a refl ector backup structure and an elevation cradle. The topology of the backup truss is adapted to the shape of the surface panels. The elevation cradle carries the backup structure itself: the large arm for the support of the subrefl ector, and the gear rim for the elevation drive. The connection between the backup structure and the elevation cradle was concentrated to dedicated interface points in diameters about half of the overall refl ector diameter, which resulted in a rather homologous deformation behavior. In contrast to the Eff elsberg antenna (Figure 5), the alidade is designed as a very fi ligree truss system (Figure 10), thereby avoiding large box beams as used in Eff elsberg. The total weight of the Green Bank Telescope is more than twice that of Eff elsberg, which is partly due to the off set layout of the optics, but also to the diff erent structural design, an approach probably driven by manufacturing and transportation aspects.
4. Millimeter-Wavelength Telescopes
4.1 Introduction
By the mid-sixties, the observations at short cm-wavelengths had shown the importance of extending the frequency range towards higher frequencies. This required the development of refl ectors of very high precision, less than 100 μm for a wavelength of 2 mm. Simultaneously, it would be necessary to develop receivers for these frequencies. These would be based on Schottky diodes, which were in an early stage of development for frequencies of about 100 GHz.
As was the case with the 140-ft telescope, NRAO took the initiative to open this region for observation by building a dedicated mm-telescope of 11 m (36 ft) diameter, with a planned surface precision of 50 μm. The Earth’s troposphere – in particular, water vapor – strongly absorbs radiation at millimeter wavelengths. For this reason, mm-telescopes must be located at high and dry sites, with a predominantly clear sky. For this reason, the telescope was located at 2000 m altitude on Kitt Peak observatory, near Tucson (Figure 11). The refl ector is a single piece
Figure 10. The Green Bank Telescope is an off set pa-raboloid of 100 m diameter. The refl ector is actively adjusted to the correct shape by motorized adjusters on the basis of computed gravitational deformation. An overall surface error of 0.4 mm has been achieved (NSF/AUI/NRAO).

22 The Radio Science Bulletin No 362 (September 2017)
of aluminum, welded from a number of sheets and then machined in the paraboloidal shape on a large milling machine. The focal ratio is 0.8, unusually large for a radio refl ector. The achieved surface precision is 100 μm, a factor two larger than specifi ed. Particularly troublesome was the large thermal deformation between the aluminum dish and the steel backup structure. Good performance could only be obtained at night, in a state of thermal equilibrium. As the picture shows, the antenna was placed in an astrodome that was open towards the sky during observation.
Despite its shortcomings, the antenna was the largest
available for wavelengths near 3 mm. It enabled the detection, in 1970, of the spectral line of interstellar carbon monoxide (CO) at 2.6 mm wavelength [16]. This caused a veritable run for observing time in the successful search for other molecules. By the mid-seventies, some 30 molecules had been identifi ed by their mm-spectra. It was obvious that
observations at mm-wavelengths were becoming highly signifi cant for the development of astrophysics. Gordon told the story of this telescope in [17].
At the time, several proposals for a large mm-wavelength telescope were made in Japan, Germany, France, England, and the USA, ranging in size from 15 meters to 45 meters, with some suitable for wavelengths as short as 0.6 mm. To meet the performance requirements, it was necessary to improve on existing designs on essentially all fronts of antenna technology.
The major requirements could be summarized by two numbers:
1. Refl ector surface precision not worse than about a twentieth of the shortest wavelength: hence, less than 100 μm rms;
2. Pointing and tracking precision of one-tenth of the beamwidth: of the order of one arcsecond.
These requirements had to be maintained under all operational conditions, including solar heating during the day, strong radiative cooling towards the clear sky at night, and generally relatively strong winds at the high mountain site.
This required signifi cant improvement and new development in the hardware realization of the new instruments. For optimum – and normally, also most economic – performance of the telescope, the major contributions to the overall surface precision should roughly contribute equally. There are four major sources of error. If we assume that their contributions to the overall total precision can be added in a root-sum-squared fashion, it follows that each of them should not be larger than half the overall precision requirement. The four major factors are:
1. The individual panels composing the refl ector surface. They need a fabrication precision of a few percent of the shortest wavelength. Table 1 summarizes the diff erent types of panels and their accuracy.
Figure 11. The 36-ft (11 m) millimeter radio telescope of NRAO in its astrodome at an altitude of 2000 m at Kitt Peak Observatory near Tucson, Arizona. Operation started in 1968 (NSF/AUI/NRAO).
Type ExampleMaximum
Size [m]
TypicalHeight [mm]
TypicalWeight [kg/m2]
Precision[μm rms]
Aluminum cassette Eff elsberg 2.5 200 20 >80Aluminum or CFRP sandwich
MRTHHT 1.2 50 10 25
6
Machined aluminum ALMA(NA) 0.8 50 10 <10
Electroformed nickel ALMA(EU) 1.2 30 10 <10
Table 1. Typical design parameters of the most usual panel types (2016).

The Radio Science Bulletin No 362 (September 2017) 23
2. The alignment of the panels to the desired refl ector profi le. In the early years, this was accomplished with geodetic methods, such as a theodolite and measuring tape. Photogrammetry has also been used [18], and has seen a recent revival with the newest digital cameras. In 1976, the method of radio holography was introduced [19], whereby a measurement of the antenna’s radiation pattern (in amplitude and phase) provided the aperture fi eld distribution after Fourier transformation. Deviations from constant phase in the aperture fi eld are projected on the surface to deliver refl ector profi le deviations from the true paraboloid [20].
3. Gravitational deformation of the refl ector’s backup structure with elevation angle. Here, the designer meets the biggest challenge. The goal will normally be to realize homology as best as possible. As we have already seen above, practical requirements outside the direct structural design often pose certain limitations. In this review, we concentrate on these aspects of telescope design.
4. The infl uence of temperature variations and wind forces. With the growing size of the telescope and the simultaneous decrease of the shortest wavelength, the deformations caused by temperature variations in an open antenna structure became as signifi cant as the remaining gravitational eff ects.
Temperature diff erences in the refl ector structure decrease the surface precision, while diff erences in the support structure and mount – for instance, by one-sided solar illumination – cause pointing deviations that can easily be larger than the beamwidth [21].
Experiences at short wavelengths with the NRAO 140-ft and the Eff elsberg telescopes had shown that the pointing accuracy and stability were as important as the refl ector’s surface precision. A 30-m diameter refl ector has a half-power beamwidth (HPBW) of about 10 arcseconds at 1 mm wavelength. This requires a pointing precision of 1 arcsecond under operational circumstances. The designers thus had to give equal attention to the deformation of the refl ector and to pointing deviations and fl uctuations, all due to gravity, temperature diff erences, and wind. These were highlighted in the performance requirements for the Millimeter Radio Telescope (MRT), and were considered during the fi rst conceptual design ideas for the 30-m millimeter telescope that was realized by the Max-Planck-Institut für Radioastronomie in Germany around 1980. The telescope was designed and constructed by a consortium of the companies Krupp and MAN, the same companies that had collaborated in the Eff elsberg telescope project. Once operational, this instrument was handed over to the French-German Institute for Radio Astronomy in the Millimeter range (IRAM). The telescope is located at 2850 m altitude in southern Spain (Figure 12). We now describe its salient features.
4.2 The 30-m Millimeter Radio Telescope (MRT) of IRAM
As we already pointed out, the highly symmetrical umbrella support of the Eff elsberg telescope is not feasible for smaller antennas because of the diffi cult access to the vertex area of the refl ector. The solution for the interface from the backup structure to the elevation bearings for the MRT is sketched in Figure 14, with a comparison to the Eff elsberg situation. In Eff elsberg, the elevation cradle (in green lines) protruded into the umbrella cone of the backup structure (in blue lines) without contact except at the cone pivots. In the MRT, the cone pivot was split into
Figure 12. The 30-m millimeter radio telescope (MRT) of IRAM at 2850 m altitude in the Sierra Nevada of southern Spain. Completely wrapped in thermal insula-tion and with active control of the temperature of the structure, it operates down to a wavelength of 0.8 mm (J. Baars, IRAM).
Figure 13. The Eff elsberg umbrella (left) was changed in the MRT to a yoke, the corners of which function as the pivots for the box extension (blue) to a 14 m diameter plate for the support of the refl ector backup structure (right).

24 The Radio Science Bulletin No 362 (September 2017)
four points at the outer corners of the yoke-type elevation cradle (right sketch), which left a free volume of space between the yoke (= ballast) arms. The deformation behavior of the MRT refl ector is therefore equivalent to that of a four-point support.
From the four pivot points, the elevation structure was extended to a circular disc of 14 m diameter. The truss-frame backup structure of the refl ector was supported at 20 points on the circumference of the disk, and a good homologous behavior was achieved [22]. Between the ballast arms there is space for a cabin with receiving equipment that is accessible during observations. As is visible in Figure 13, the ballast is somewhat off set from the symmetry line of the yoke arms. Through this feature, the unavoidable astigmatic deformation of a four-point support could be signifi cantly reduced.
We noted earlier that one should not connect the quadripod for the support of the secondary refl ector to the backup structure. This turned out to be impossible for the MRT, and the backup structure was adapted near the four corners to accommodate the quadripod. It is interesting to mention that the fi nite-element analysis of the combined
backup structure and quadripod included the minimization of systematic pointing variation of the telescope as function of elevation angle. The pointing deviation between zenith and horizon is 80 arcseconds in the primary focus, and only 20 arcseconds in the Cassegrain focus. While this is a stable entity that can be calibrated, it decreases the time-variable wind pointing error by a similar fraction.
The structure is illustrated in Figure 14. We see the extra diagonals in the backup structure to accommodate the loads of the quadripod.
The rotation in azimuth was realized by a turning-head solution with a large slewing bearing of 5 m diameter on top of the concrete pedestal. This led to a compact overall layout of the telescope that leant itself to the application of thermal insulation.
After the gravitational deformations had been reduced to the required values, it became clear that thermal eff ects needed to be controlled to avoid deformation beyond the specifi cations. Computations showed that a uniformity of temperature of the major structural sections of about 1 K was required. This turned out to be very challenging.
Figure 14. Rear and side views of the structural arrangement of the MRT.
Figure 15b. One of the fi ve ventilators that cause a circulating air movement with controlled tempera-ture through the backup structure. This structure is covered on the outside by a cladding of thermal insulation panels, visible in the upper picture.
Figure 15a. Thermal insulation and a temperature controlled fl uid are applied to control the tempera-ture of the quadripod legs.

The Radio Science Bulletin No 362 (September 2017) 25
Active control of the temperature and its homogeneity through the structure would clearly be unavoidable beyond whatever passive insulation one could install. As a result, a cladding of thermal insulation to smooth variations in ambient temperature and asymmetric solar illumination covers the entire telescope, apart from the surface, of course. The temperature of the refl ector backup structure is kept at the temperature of the massive and slowly varying yoke structure by an actively temperature-controlled air-circulation system. The quadripod for the support of the secondary refl ector was also temperature controlled. The pictures in Figure 15 give an impression of the air-circulation system and the insulation of the quadripod. The overall system realizes a uniform temperature through the telescope structure of about 1 K, and enables daytime observations under solar illumination with unimpaired performance.
The telescope at its high site is exposed to occasional strong snowfall and icing conditions. To avoid settling of ice on the antenna, the thermal insulation panels as well as the refl ector surface can be heated from behind. Figure 16 presents an illustration of the performance of the thermal control system in varying conditions over a period of about three weeks in January 1987 [23]. Shown are the
temperatures of the outside air (A), the heavy and compact yoke (Y) of the mount, the refl ector backup structure (B), and the quadripod (Q) support of the secondary refl ector. In the fi rst eight days, we noted a close equality (to about 1 K) of the temperature of the three telescope sections, with a slow variation from day to day. The ambient temperature showed its diurnal variation and a slope towards a lower average value. Note that the telescope did not try to follow the ambient: rather, it kept the diff erent sections at the same temperature. Of course, this avoided diff erential expansion within and between the sections. Halfway through day eight, the weather situation required the heating of the cladding – here, called “de-icing” – to be switched on. The bad weather continued until day 17. The leakage of the de-icing system into the structure inside disturbed the thermal control system beyond its capacity. It was actually switched off , and we saw a considerable heating of the backup and quadripod, but not in equal amounts, and a slow decrease of the yoke temperature. Once the de-icing was switched off and the control was system restarted, the telescope returned, in about a half day, to the usual uniformity and slow overall temperature variation that was mainly determined by the increase of the average daily ambient value.
Figure 16. A plot of the temperatures over a full month of the ambient air (A), the yoke (Y), the backup structure (B), and the quadripod (Q). The left and right parts showed normal, satisfactory operation. In the center was a period of bad weather, during which the de-icing system was switched on and the control system was switched off . Note that the heating system kept the telescope just about above freezing.
Figure 17. The error components of the MRT as functions of the elevation angle. The contributions from the panels (27 μm), the surface setting (30 μm), and thermal eff ects (10 μm) were constant. Wind deformation was computed from wind-tunnel measurements, while the gravitational deformation, shown in green, assumed a setting of the surface at 50° elevation. The “total” was the RSS average. The unrigged curve is the natural gravita-tional deformation.

26 The Radio Science Bulletin No 362 (September 2017)
Deformations of the refl ector from wind forces are signifi cantly less than the residual gravitational deformation and do not need to be corrected. Of more concern is the pointing fl uctuation under wind. Here, the eff ects are minimized by an advanced servo-control system and corrections to the telescope axis direction measured by tilt meters.
To realize the goal of better than 100 μm surface precision, in addition to the structural and thermal performance, a method of measuring and setting the refl ector surface to a higher precision was needed. The surface consists of about 200 surface-panel units, attached to the backup structure by adjustment screws that can be set with an accuracy of about 5 μm. After assembly, the position of the surface panels needed to be measured and set as well as possible to the prescribed paraboloid. At the start of the project, no measurement method with an accuracy of 50 μm was available. An in-house project using a modulated-laser distance-measurement device was started. However, as we mentioned in the introduction to the MRT description, the method of radio holography looked very promising, provided we could arrange for a strong signal source at a suffi ciently short wavelength (of the order of 1 cm) and at a very large distance. Right at that time, an extremely strong maser source of water vapor at 22 GHz appeared in the Orion region. It was decided to also develop equipment and software to apply radio holography for the fi nal setting of the refl ector’s surface. This was achieved in 1985 to a measurement accuracy of about 40 μm [24] and a refl ector precision of 85 μm. Over time, the measurements have become more accurate, and control of the antenna has improved to a current surface quality of about 60 μm. The overall performance of the MRT refl ector is summarized in Figure 17. The MRT is the most-productive telescope at short mm-wavelengths.
4.3 The 50-m Large Millimeter Telescope (LMT) in Mexico
Ten years after the start of the routine operation of the MRT, in 1985, the Mexican Instituto Nacional de Astrofísica, Óptica y Electrónica (INAOE) in the province of Puebla, and the Astronomy Department of the University of Massachusetts (UMass) in Amherst, presented a plan for the construction of a mm-telescope of 50 m diameter for operation to a shortest wavelength of 1 mm. Cerro la Negra, at 4600 m altitude in central Mexico, was selected as the site. The technical requirements for an instrument of this size and precision went considerably beyond those of the MRT, although a number of its design features could be transferred to the LMT. This was not too surprising, because the design of the LMT originated with the MAN Company that participated in the design and construction of the MRT.
There were two major diff erences with respect to the MRT:
1. The turning head mount was exchanged for a “wheel-on-track” confi guration for the azimuth movement. Inside the alidade, a concrete tower allows the position of an elevated pintle bearing that takes the lateral loads from the wind. This provides a signifi cant improvement in performance under strong winds over the standard wheel-on-track confi guration, such as, for instance the Eff elsberg telescope.
2. With a diameter of 50 m and the goal of a surface precision of 70 μm, even a fully homologous refl ector could not be economically realized. The surface panel frames were therefore connected to the backup structure by motorized adjusters to obtain the required
Figure 18a. A cross-section drawing of the Large Millimeter Telescope (LMT).
Figure 18b. A picture of the Large Millimeter Telescope (LMT) at 4600 m altitude on the Cerro la Negra in central Mexico (LMT).

The Radio Science Bulletin No 362 (September 2017) 27
surface shape, with varying elevation angles based on fi nite-element computation or actual deformation measurements.
Of course, special measures had to be taken in the areas of thermal deformation and position control under wind, possibly well beyond the solutions installed on the MRT.
The telescope design followed the exposed concept, similar to that of the MRT. The backup structure and elevation cradle of the LMT were based on the same four-point concept as the MRT. The interface points of the ballast arms to the backup structure can be seen in the photo, sticking out from the cladding of the backup structure. The alidade of the LMT followed the wheel-on-track principle, because a suffi ciently large slewing bearing, necessary for the size of the telescope, was not available at the time.
The telescope is protected on the outside by an insulated cladding and ventilators help to homogenize the temperature fi eld inside the backup structure. However, there is no active temperature control as in the MRT. The cladding covers all structural components, including the refl ector backup structure, the ballast arms and alidade, and also encloses a large two-story receiver cabin, with easy
access via a staircase and elevator (visible on the right of the drawing and in the picture of Figure 18).
The refl ector truss system is connected only in the 45° symmetry plane to the four endpoints of the ballast girders (Figure 19). A virtual ring girder inside the backup truss system, indicated in the fi gures by a light green shadowing, achieved the structural connection between the left and right ballast arm. It replaced the physical ring girder in the MERLIN design concept, respectively the “yoke disk” of the MRT de-sign. The ring girder functionality was achieved by the diagonals in both the upper and lower chords of ring 2 and 3 of the truss system, closing the truss topology of these rings also in regard to torsional loads.
The gravity deformations show some remaining
print-through of the ballast arms. The rms deformation is about 300 μm in zenith position and about 400 μm in horizon position. This is some 10 times more than allowed for in the specifi ed overall refl ector precision of 70 μm rms. As noted, the design approach to the LMT was based from the beginning on the use of an active surface. The refl ector panels are equipped with actuators for the open-loop correction of the gravity deformations via look-up tables obtained from the fi nite-element analysis. The active
Figure 19. The design concept of the LMT refl ector backup struc-ture and its connection to the elevation structure at the corners of the ballast girders.
Figure 20. A comparison of the computed pointing errors of the LMTQ in elevation (PE) and cross elevation (PEX) for a 10 m/s wind speed. The dashed lines show the er-rors without active control, and the full lines show the errors with fl exible body control (FBC).

28 The Radio Science Bulletin No 362 (September 2017)
surface can also be used for correction of temperature-induced deformations. These are based on temperature measurements of the backup structure and a thermal deformation model for the calculation of the corrections. The active correction of wind-induced deformations would be much more complicated. However, the LMT backup structure is so stiff that the wind-induced deformations are just within the limits of the overall specifi cation.
A more serious requirement is the stability of pointing under the infl uence of wind. The blind pointing specifi cation of the LMT was of the order of 1 arcsecond under operational wind conditions of up to 12 m/s. Finite-element calculations, aided by results from wind-tunnel test data of the MRT, showed that the pointing errors would be up to 6 arcseconds. These data are shown in Figure 20 as dashed lines for the pointing error in elevation (PE) and cross-elevation (PEX) as functions of the attack angle (AZ) of the wind, and for three values of the elevation angle of the refl ector.
The remedy is again the application of active compensation: this time, not at the surface, but at the drives of the main axes. Inclinometers were placed on the alidade in the vicinity of the elevation bearings. They measure the wind-induced deformations of the alidade, and these data are used for the calculation of the pointing variations and related corrections via the main-axes’ drives. The full lines
in Figure 20 show the simulated improvement obtained compared to the uncorrected error shown in dashed lines. Similarly feeding the data of a set of temperature sensors throughout the alidade and elevation structure to the fi nite element model yields a thermal-deformation pattern from which pointing corrections can be derived. These correction methods are called fl exible body compensation (FBC). They are used in some form in most of the recent radio telescopes, such as, for instance, ALMA. Kä rcher [25] presented the theoretical background, while Greve et al. [26] discussed results of fl exible body compensation at the MRT.
Finally, we address the refl ector surface. The precision of the LMT panels has to be in the range of 25 μm rms to fi t into the overall surface-error budget of 70 μm rms. The available manufacturing processes limit the size of the panels of this surface accuracy to less than 1 m (Table 1). Similarly to the MRT, the LMT therefore used a sub-frame concept for the refl ector surface that decouples the sizing of the panels from the spacing of the truss system for the backup structure. The spacing of the backup truss was chosen from the beginning to be about 5 m, between which the sub-frames had to span (Figure 21). The internal sag of a 5 m large sub-frame would be in the range of 300 μm (Figure 21a),
Figure 21b. A sketch of the same subframe as in Fig-ure 21a, but isostatically supported at 8 points. The overall sag of the surface was still 300 μm, but the deviations of the theoretical surface were only of the order of 5 μm rms.
Figure 21a. A sketch of a 5 m wide “stiff ” subframe and the sag of the surface (dashed line) by 300 μm.
Figure 22a. A rendering of the fi nite-element model of the panel segment with panel, base plate, and isostatic support frame.
Figure 22b. A rear view of a panel unit installed in the backup structure of the LMT. The segments of about 5 m size are supported at their corners on the backup structure by motorized adjusters.

The Radio Science Bulletin No 362 (September 2017) 29
which was far above the overall accuracy requirement. The sub-frames were therefore following the isostatic support principle used for the mirrors of optical telescopes. The isostatic features achieved that the internal deformations of the subframes were inside the requirements, whereas the overall sag was still in the same range as the “simple” frames (Figure 21b). Finite-element analysis showed that the precision under gravity load could be improved by an order of magnitude.
Figure 22 shows a rendering of the fi nite-element model of the fi nal design, and a view of the frame in the main truss structure. The isostatic subframes make the overall refl ector system much more complex, and are only necessary for telescopes with accuracy requirements below 100 μm rms.
The construction of the LMT is expected to be completed by the end of 2017. The project has suff ered long delays for a number of reasons, such as problems in the fabrication of surface panels and subrefl ector, management errors, and cost overruns. In June 2011, the refl ector surface up to 32 m diameter had been installed and adjusted by holography, and the basic axis-control system was operational. A successful “fi rst light” observation was made at 3.3 mm wavelength. Over the last three years, time has been devoted to observations at 3 mm and 1.3 mm, including successful participation in a few millimeter-VLBI observations.
In the meantime, the panels for the outer two rings have been delivered, and the installation is close to being completed. If the original specifi cation can be met, the LMT/GTM will be a formidable addition to the available worldwide capacity for observations at short millimeter wavelengths.
5. Sub-Millimeter-Wavelength Telescopes
5.1 Introduction
The richness of the “sky” at wavelengths from 1.2 mm to 7 mm, opened by the new mm-telescopes, inspired astronomers to propose telescopes useable up to about 1 THz (0.3 mm wavelength). At the highest and driest places on Earth, notably Hawaii, Northern Chile and the South Pole, the reduced atmospheric absorption allows observations at 1 THz under good weather conditions. These sub-millimeter telescopes need a surface precision of 20 μm, and a pointing quality of better than 1 arcsec. Preliminary studies in the mid-eighties indicated that the size of the refl ector would be limited to 10-15 m in order to be economically viable. While at this relatively small size, gravitational deformation appeared to be controllable to values around 10 μm rms, the greatest problem arose
in the reduction of thermal deformations. With standard materials like steel and aluminum, temperature gradients would need to be limited to a few tenths of a degree Celsius.
The fi rst dedicated sub-mm telescope was designed and built by Robert Leighton at Caltech in the early eighties [27]. It had a diameter of 10.4 m, with an aluminum honeycomb refl ector and a backup structure from steel. All members of the backup structure were rods of equal thickness and precise length. The structure was homologous, and the uniformity of the backup structure signifi cantly reduced the eff ects of temperature change. Some active control of the surface was realized by diff erential heating of the 15 cm-long panel support rods. Located at 4150 m altitude on Mauna Kea, Hawaii (Figure 23a) since 1986, it was used at frequencies up to 800 GHz, until it was decommissioned in 2015. Four identical antennas of somewhat lower precision constituted the Caltech mm-array in Owens Valley, California [28].
Also on Mauna Kea and at about the same time, the British-Dutch-Canadian James Clerk Maxwell Telescope (JCMT) came into operation (Figure 23b). Like the Caltech
Figure 23. Two sub-millimeter telescopes at 4000 m altitude on Mauna Kea, Hawaii. (a) The Caltech telescope, with a diameter of 10.4 m, operating at a shortest wavelength of 350 μm (S. Golwala, Caltech). (b) The JCMT with a diameter of 15 m, normally protected by a transparent skin covering the enclosure opening. Observations are made at wavelengths between 0.4 mm and 1.4 mm (Phil-lips, JCMT, Hawaii).

30 The Radio Science Bulletin No 362 (September 2017)
telescope, a protective co-rotating dome surrounds the JCMT. However, in this case a fabric skin that keeps the wind out and lets the mm-radiation through normally covers the opening. The refl ector has a diameter of 15 m. Aluminum honeycomb panels are supported by a steel backup structure through motorized adjusters. A detailed study was made of the thermal aspects [29], but control of thermal eff ects was diffi cult, in reality. The skin needed to be closed under most circumstances, and operation was limited to nighttime, enabling observations up to 700 GHz. The East Asian Observatory now operates the telescope.
5.2 The Sub-Millimeter Heinrich Hertz Telescope (SMT/HHT)
Clearly, the ever-changing thermal environment of the telescope posed the most serious limitation on achieving the required precision for operation in the sub-mm wavelength range. One really needed a structural material with an order-of-magnitude smaller thermal expansion, and strength comparable to steel or aluminum. A solution was off ered
by the composite carbon-fi ber-reinforced plastic (CFRP) material that was already widely in use for space-born applications. By the mid-eighties, its widening application in commercial products lowered the price to a level where one could envisage its application in radio-telescope structures. Carbon-fi ber-reinforced plastic had already been used for the surface panels of millimeter telescopes such as the 45-m telescope in Nobeyama [30], Japan, and the 15-m antennas of the IRAM interferometer in France [31].
The MPIfR, together with German industry, started a project for a sub-mm telescope that would have a backup structure of carbon-fi ber-reinforced plastic supporting carbon-fi ber-reinforced plastic panels. This essentially removed thermal eff ects from the list of major concerns. In collaboration with Steward Observatory of the University of Arizona in Tucson, a sub-millimeter telescope (SMT) of 10 m diameter was realized at 3200 m altitude in southern Arizona. It was baptized the Heinrich Hertz Telescope (HHT), but this name has been replaced by the original acronym SMT, since the Steward Observatory is the sole operator.
The upper part of the HHT is shown in Figure 24. The backup structure is a truss frame of carbon-fi ber-reinforced plastic rods and invar steel nodes. The surface consists of 60 panels consists of a composite of carbon-fi ber-reinforced plastic sheets epoxied to an aluminum honeycomb core. The specifi ed and achieved performance of the HHT are summarized in Table 2. Using holography with a satellite-signal source, the surface could be set to an overall precision of 12 μm rms. This was the best ever reached in the late nineties, and has only recently been repeated for the ALMA antenna of 12 m diameter.
The enclosure is a barn, the roof panels and front doors of which are opened during operation. They provide a reasonable decrease in wind eff ects on the pointing.
Observations of planets, located near the sun, showed the high quality and stability of the surface and pointing, even when the sun was illuminating part of the refl ector [32]. Several new technical methods and solutions were introduced and developed in this project, which paved the way for later sub-millimeter telescopes, such as ALMA, to be described next.
Figure 24. The HHT sub-millimeter telescope in the opened enclosure at 3200 m altitude on Mt. Graham, Arizona. The truss frame backup structure (black) consists of carbon-fi ber-reinforced plastic struts connected to invar steel nodes. The connection to the steel elevation structure (white) is made by 20 fl ex-ures of steel. These eff ectively absorb the diff erence in thermal expansion between backup and mount without introducing deformation into the backup structure (J. Baars, SMT Observatory).
Error component Specifi cation AchievedHomology imperfection, assembly 7 <3Space-frame residual deformation 7 <6Panel fabrication 7 6Panel residual deformation 7 <5rss of structural/fabrication error 14 10Refl ector setting allowance 10 7Overall rss error (μm) 17 12
Table 2. The specifi ed and achieved performance (in μm)for the Heinrich Hertz Telescope (HHT).

The Radio Science Bulletin No 362 (September 2017) 31
5.3 Atacama Large (Sub-) Millimeter Array (ALMA)
Despite the short wavelength, but restricted by the relatively small refl ector size, the best angular resolution of mm-telescopes remained of the order of 10 arcseconds. To achieve better than one-arcsecond resolution, interferometers for the mm-domain were realized in the years 1985 to 1995 in France (IRAM), Japan (Nobeyama), and the USA (OVRO, Caltech and BIMA, Berkeley, Illinois/Maryland). These arrays consisted of three to 10 antennas of 6 m to 15 m diameter, with baselines up to 500 m. In the mid-1990s, proposals for much larger and more-sensitive arrays were being independently developed in the USA, Japan, and Europe. The concepts entailed up to 50 antennas of 8 m to 15 m diameter, to be spread over up to ten kilometers of baseline. All three groups identifi ed the altiplano at 5000 m altitude near the 6000 m high Chajnantor Mountain in the northern Atacama Desert of Chile as the best site for the array. The atmospheric quality of this site would enable
observations in all atmospheric windows up to 1 THz, and the fl at terrain allowed for the envisaged baselines of more than 10 km. The three proposals diff ered quite substantially in the layout of the array, based on diff erent priorities of astrophysical research.
From 1997 onwards, plans were discussed to combine the three separate array proposals into one large, global Millimeter Array, actually working in the sub-millimeter domain up to 1 THz. In 2002, this led to the formation of ALMA, the Atacama Large Millimeter Array, with major partners North America (USA and Canada) and Europe (many countries, coordinated by ESO), each contributing 50 percent of the basic instrument, and East Asia (Japan, Taiwan, and Korea) as a third partner, with a smaller contribution for so-called enhancements. It was by far the largest project in astronomy, undertaken in a global collaboration to build an instrument of truly magnifi cent performance: at least an order-of-magnitude better in sensitivity, angular resolution, and spectral coverage than any existing millimeter telescope.
Figure 25. (a) The European ALMA antenna, delivered by consortium AEM. (b) The US antenna, produced by Vertex. In both, the carbon-fi ber-reinforced plastic refl ector backup structure is shielded against solar radiation by outside cladding. Steel parts of the yoke and base are covered with thermal insulation. The refl ector diameter is 12 m and the surface precision is about 20 μm rms (ALMA-ESO/NOAJ/NRAO).
Refl ector diameter 12 mRefl ector accuracy* 25 μm – goal 20 μmAbsolute pointing 2” over all skyOff set pointing 0.6” over 2° radius (w.r.t. calibrator source)Fast pointing switching 1.5° move in 1.5 s, settle to 3” peak errorPath length stability 15/20 μm ( non repeatable/repeatable)
Operating conditions: temperature: –20 °C to +20 °C, 0.6 /1.8ambT °C in 10/30 minutes full solar loading, including solar observation average wind velocity: < 6/9 m/s for day/night, respectively*includes main and subrefl ector, fabrication, gravity, wind and thermal deformation
Table 3. The specifi cations of the ALMA antennas under operational conditions.

32 The Radio Science Bulletin No 362 (September 2017)
ALMA consists of the basic synthesis array of 50 antennas of 12 m diameter, equipped with a cryogenically cooled system containing 10 separate receiver cartridges covering the frequency region from 30 GHz to 950 GHz (excluding the atmospheric absorption bands). The enhancement consists of a set of four 12-m antennas plus a compact array of a dozen 7-m antennas for the measurement of the total intensity of extended objects and coverage of the shortest baselines below the minimum separation between the 12-m antennas needed to avoid collision and excessive shadowing [33]. The array occupies a large, remarkably fl at area at about 5000 m altitude in the Atacama Desert in northern Chile. The extremely dry atmosphere above the site allows sensitive observations up to about 1 THz. The specifi cations of the antennas were consequently tailored to this goal, as illustrated in Table 3.
Dedicated single sub-mm telescopes have normally been protected against the major influences of the environment by an enclosure. The telescope itself thus could be optimized for operation under the relatively benign operational conditions, without the need to accommodate survival loads. In the case of the multi-element ALMA telescope, a protective dome was out of the question. The main reason was that the antennas would be moved between stations over distances of more than 10 km. A dome-protected and transportable antenna was not economically viable. As a result, the ALMA antenna design had to not only obey the stringent performance specifi cations, but the structure also had to be able to withstand rather extreme survival loads without damage.
The ALMA project started with the acquisition of two prototype antennas of 12 m diameter. Vertex designed and delivered one to NRAO, and a consortium of Alcatel/EIE/MAN delivered another to ESO. Both antennas, placed side by side, were subjected to an intensive test program [34]. Both antennas were acceptable in view of the specifi cations. In a protracted bidding process, it transpired that each partner would acquire 25 antennas. Vertex delivered to NRAO/AUI, and ESO acquired 25 antennas from the Consortium Thales/Alenia Space – European Industrial Engineering (EIE) – MT Mechatronics, which we denote by AEM. Each company manufactured to their own design. A picture of both antenna types is shown in Figure 25.
The layouts of the two designs are sketched in Figure 26. The foundation ring and the yoke-shaped alidade of the European (AEM) antenna are made of steel, covered by a layer of thermal insulation. The entire structure rotating about the elevation axis (the elevation cradle with incorporated receiver cabin, refl ector backup structure, and quadripod) were realized in carbon-fi ber-reinforced plastic. Special attention was given to the isostatic decoupling between the two major sections, made of diff erent materials. We give some details of this feature below. The AEM antenna employs symmetrically arranged direct-driving torque motors, thereby avoiding any backlash and reaction forces on the bearing. The quadripod is a single, straight, carbon-fi ber-reinforced plastic tube that attaches at the rim of the refl ector. This avoids spherical-wave aperture blocking. The refl ector consists of 120 panels of about one square meter in area, arranged in fi ve concentric rings. They are made of electroformed nickel front and back skins, with an aluminum honeycomb sandwich core, developed and manufactured by the company Media Lario, in Italy.
The Vertex antenna also has its foundation ring and alidade made in steel, covered by thermal insulation. The receiver cabin and elevation structure are also of steel. A transition cone of invar steel makes the connection to the
Figure 26. A color-coded comparison between the AEM/EIE and Vertex antennas: Grey = carbon fi ber composite; green = INVAR; blue = steel; red = drives/magnets.
Figure 27. An illustration of the astigmatism of the Vertex antenna under the temperature diff erence between the yoke-type alidade and the receiver cabin, annex refl ector backup structure.

The Radio Science Bulletin No 362 (September 2017) 33
carbon-fi ber-reinforced plastic refl ector backup structure through a set of fl exures, similar to the solution for the HHT, as described above. The backup structure is a composite of carbon-fi ber-reinforced plastic skins, bonded to an aluminum core. The drive system is a conventional geared drive, with standard servomotors at high rated speed that is reduced to antenna speed by a planetary gear train. The Vertex quadripod shows a complicated curved truss system with the aim of minimizing spherical blocking. The total geometrical blocking of the two antennas (4%) is actually essentially the same. The Vertex antenna employs 264 refl ector panels arranged in eight rings. They are machined aluminum panels with a size of about a half square meter, the relatively small size being dictated by the maximum range of the high-precision milling machine.
The arrangement of circular blades between the backup structure and the elevation cradle is often used for structures made of materials with diff erent thermal elongation coeffi cients. The infl uence of a uniform expansion or shrinking of the backup structure is compensated for by the fl exibility of the blades. However, the decoupling by the blades is not total: other types of disturbances in the elevation cradle can still protrude to the refl ector and distort its shape.
After commissioning, the US antennas showed a
degradation of the refl ector accuracy above the specifi ed values near the end of the operational temperature range. This could be explained with reference to Figure 27. A temperature diff erence between the yoke-type alidade and the receiver cabin activates axial reaction forces in the elevation bearings that distorts the cabin walls. These distortions have no circular symmetry as the distortions by uniform temperature diff erences for which the circular blades are designed, but can protrude through the Invar structure to the backup structure and result in the indicated
astigmatic deformation. The remedy would be an active removal of temperature diff erences between the receiver cabin and the yoke alidade.
Because of the exposed location of the antennas at the high site, the infl uence of wind on the pointing stability is of special concern. The requirement is less than one arcsecond fl uctuation in a 9 m/s wind with added gusts. A novel approach to this problem was realized by EIE in the European antenna by isostatic decoupling of the elevation and alidade sections (Figure 28). The horizontal wind forces are not directly transferred to axial forces in the elevation bearings, as normally done in other antennas and also in the US ALMA antennas. They are transferred to the alidade in the center of the yoke by lateral rollers in the vicinity of the torque motors (Figure 28, lower right). The elevation bearings are completely decoupled from axial loads by diaphragms between their housings and the yoke arms
Figure 28. The isostatic decoupling between the elevation and azimuth structures of the EIE antennas.
Figure 29. About one-third of the ALMA array at 5000 m altitude on the Llano de Chajnantor in the Atacama Desert of northern Chile. The main instru-ment consists of 50 antennas of 12 m diameter and is supplemented by the Atacama Compact Array (ACA) of 12 antennas of 7 m diameter (in the right background of the picture), plus four more 12 m antennas (ALMA-ESO/NAOJ/NRAO, C. Padilla).

34 The Radio Science Bulletin No 362 (September 2017)
(Figure 28, upper-right sketch). As a consequence, this concept has the tilting moment of the wind forces taken by additional reaction forces at the elevation bearings in the up and downward directions (Figure 28, left sketch). We do not know other antennas with such a system. It appears to work as intended, and does not show the insuffi ciencies inherent to the circular-blade approach of the US antennas.
In the fall of 2014, all 66 antennas of ALMA, equipped with the extensive receiver system, had arrived at the operations site at 5000 m altitude on the Llano de Chajnantor (Figure 29). Observations with the partially completed array started in 2008. The performance of the antennas was summarized by Mangum [35] for the North American antennas from Vertex, and by Laing [36] for the European antennas from AEM. In the sub-millimeter region, ALMA eclipses anything available at present, whereby the atmospheric quality at the high site adds signifi cantly to the operational effi ciency. The antennas perform almost entirely to specifi cation.
ALMA is currently in its fi fth observing cycle with an essentially complete operational system. Observations have produced stunning results (almaobservatory.org). The instrument is more than an order of magnitude more powerful than existing millimeter telescopes, both in sensitivity and angular resolution. Baselines up to 15 km have been used, providing angular resolutions of 0.02 arcsecond, better than the Hubble Space Telescope.
6. Sardinia Radio Telescope (SRT)
The history and the scientifi c goals of the Sardinia Radio Telescope are described in this Special Section of the Radio Science Bulletin by N. D’Amico, and a general description with results of commissioning was presented by Bolli et al. [36]. Here, we limit ourselves to a discussion of some technical aspects of the telescope’s design.
The Sardinia Radio Telescope, shown in Figure 30, was specifi ed for frequencies up to 100 GHz, and with a goal for the surface accuracy of 150 μm rms. It is equipped with a large suite of primary and secondary receivers. The prime focus receivers are arranged on a rocking bridge in front of the Gregorian secondary, and the Gregorian focus receivers are hosted in a large receiver cabin in the apex area of the main refl ector. The receiver exchange is remotely controlled without human interaction on the telescope.
The design concept of the telescope (Figure 31) was developed in a preliminary design phase by US engineers. The “kinked” alidade somewhat resembles the design of NASA/JPL deep-space antennas, and the elevation cradle somewhat resembles the “Eff elsberg umbrella” (Figure 5). In the detailed design phase, executed by MT Mechatronics, some strength and deformation issues of the preliminary design were identifi ed, and they provided some exemplary
Figure 30. The 64-m diameter Sardinia Radio Tel-escope (SRT) (INAF).
Figure 31. The structural design of the 64 m Sardinia Radio Telescope SRT, as developed in the preliminary design phase.

The Radio Science Bulletin No 362 (September 2017) 35
insight into the relevance of homology for large radio refl ectors.
The fi nite-element calculation of the refl ector’s deformations of the preliminary design showed a huge astigmatic deformation pattern in the zenith position (Figure 32, left), which indicated defi ciencies in homology, despite the introduction of the “umbrella” concept. They are caused by the ineffi cient separation of the elevation cradle and backup structure, which we explain below.
The astigmatism was completely eliminated by changes in the load transfer, separating the elevation cradle from the umbrella struts by “fl exures.” The rms value of the remaining deformations (Figure 32, right) is nearly a factor of four better than that of the preliminary design, and the remaining deformations are dominated by the print-through of the quadripod legs. A further improvement of the homology would need the separation of the quadripod from the backup structure, as in the Eff elsberg design, but this was not followed up in this case. The remaining
deformations can be compensated for by adjustments of the panels of the active surface.
Details of the preliminary design (Figure 33) showed that four of the eight interface points of the backup structure were interconnected by so-called V-beams (colored pink in the fi gure), which attract the forces and transfer the loads on the elevation bearings to only four of the eight umbrella points. This causes the astigmatic component in the deformation pattern.
This astigmatic eff ect was remedied by the introduction of “fl exures” instead of the very rigid V-beams (Figure 34, left). The fl exures prevent the print-through of the loads of the elevation bearings to the backup structure by their lateral fl exibility. In the horizontal position (Figure 34, right), the off set between the location of the elevation axis and the plane of the eight interface points, where the weights of the backup structure are transferred to the umbrella cone, are compensated for by additional “transfer struts.” Details of this rather complex structural layout can be identifi ed in the “as built” picture in Figure 35.
Figure 32. Gravity deformations in the zenith position before (left) and after (right) optimization of the structural concept of the elevation cradle. Note the improvement of almost a factor of four.
Figure 33. Load paths in the elevation cradle of the SRT with a non-homologous design.

36 The Radio Science Bulletin No 362 (September 2017)
The diagram in Figure 36 illustrates the advantages of homologous design in regard to overall refl ector accuracy. It assumes the perfect adjustment of the refl ector surface at an elevation position of 45°. The gravity deformations of the preliminary design (red line, “given”) are in the two end positions signifi cantly above 1 mm. Increasing the stiff ness of some of the struts by enlarging their wall thickness (blue line) did not help. This actually increased the astigmatic deformations and the related rms values. Only the homologous design (black line) in the end positions reached values below 1 mm.
One could argue that all the eff orts would not be
necessary because they could be compensated for by the active surface. However, this is not fully true, because the missing homology increases the required stroke of the surface actuators, and thereby also decreases their positioning accuracy.
Without going into detail, another disadvantage of the non-homologous design is the concentration of stress in the elevation-bearing area, and the related fatigue problems for the structure. These are among the most critical areas of the design of radio-telescope structures. We note that these fatigue-relevant stresses are also reduced by the “equal softness” approach of homology.
7. Conclusion
Among the natural sciences, astronomy holds the unique position of a strictly observational activity. Contrary to the experimental physicist, the astronomer cannot interfere with the conditions of the object under study. He or she is limited to receiving and analyzing the electromagnetic radiation from the object that enters the telescope. The experimental astronomer is thus a telescope and detector builder: a task for mechanical, optical, and electronic engineers. Based on existing knowledge and his or her own ideas, the “pure” astronomer provides performance specifi cations for a new telescope, such as the diameter of the mirror and the defi nition of the detector.
In optical astronomy, many telescopes of the 20th century were conceived and realized under the direction of the originating astronomers, and these telescopes were named after them during their lifetime. The most famous example is the Hale telescope of 5 m diameter on Mt. Palomar, in California. More recently, large telescopes were designed and built by a large group of astronomers and engineers, and the name of a major donor may be given to the instrument: for instance, the twin Keck telescopes of 10 m diameter on Mauna Kea, Hawaii.
Figure 34. Load paths in the el-evation cradle of the SRT with the parallel fl exures (pink) and transfer struts (blue), leading to homologous behavior.
Figure 35. The details of the load transfer to the eleva-tion bearings at the SRT. Note the identifi cation of the essential structural parts in the picture.
Figure 36. The infl uence of the homologous design on the amount of gravity deformations a function of elevation.

The Radio Science Bulletin No 362 (September 2017) 37
The emergence of radio astronomy happened along a completely diff erent course. It was essentially an activity by radio and radar engineers, and it took a considerable time until the established optical astronomy community took a serious interest. A notable exception in the early years was astronomer Jan Oort, at Leiden Observatory in the Netherlands, who aimed at deriving the structure of our Galaxy by the observation of the 21 cm spectral line of neutral hydrogen. There are very few radio telescopes that were named after their originators during their lifetime. Only the British radio astronomers Bernard Lovell and Martin Ryle were bestowed with this honor. Jansky had to wait until 2010, when NRAO rechristened the improved VLA to be the Jansky Very Large Array (JVLA).
Once radio astronomy had demonstrated itself as a valuable branch of astronomy, radio observatories were established. Normally, there was a good mixture of astronomers and engineers at those establishments to foster progress in the fi eld. However, in the mid-1960s, the structural engineers encountered the limits of practical and fi nancial possibilities to realistically respond to the requirements of larger refl ectors with simultaneously higher surface precision. It is quite interesting to note that a solution to their conundrum was presented by an astronomer/mathematician: the method of homologous structural design, conceived by Sebastian von Hoerner [12] showed the way to achieving superior structural performance with much less weight and, hence, cost. The basics of homology, aided by advanced fi nite-element analysis programs, have enabled the construction of large and highly precise radio telescopes, as illustrated in the foregoing sections.
In this paper, we have presented in broad terms the history of the development of single-refl ector radio telescopes by short descriptions of some major examples. A more complete story, together with explanations of the mechanical and structural details of the design of accurate refl ector telescopes, has been presented by us in our book, Radio Telescope Refl ectors – Historical Development of Design and Construction [37], published late in 2017.
We dedicate this paper to the memory of our colleague and friend, Gianni Toff ani. He was an astronomer with whom the engineers could have fruitful and engaging discussions. He understood enough of engineering to communicate with engineers and, in the process, to explain to them the astronomical goals and the instrumental requirements for reaching them. In this role, he was instrumental in the successful completion of the beautiful Sardinia Radio Telescope, the third largest in Europe.
8. References
1. K. G. Jansky, “Electrical Disturbances Apparently of Extraterrestrial Origin,” Proc. IRE, 21, 1933, pp. 1387-1398.
2. G. Reber, “Cosmic Static,” Astrophys.J., 91, 1940, pp. 621-624.
3. H. C. van de Hulst, “Radiogolven uit het wereldruim,” Nederlands Tijdchrift voor Natuurkunde, 11, 1945, pp. 210-221.
4. H. I. Ewen and E. M. Purcell, “Radiation from Galactic Hydrogen at 1420 Mc/s,” Nature, 168, 1951, p. 356.
5. C. A. Muller and J. H. Oort, “The Interstellar Hydrogen Line at 1420 Mc/s and an Estimate of Galactic Rotation, Nature, 168, 1951, pp. 357-358.
6. H. C. van de Hulst et al., “De radiosterrenwacht te Dwingeloo,” de Ingenieur, 69, 3, 1957, pp. 1-20 (in Dutch).
7. A. C. B. Lovell, “The Jodrell Bank Radio Telescope,” Nature, 180, 1957, pp. 60-62.
8. E. G. N. Bowen and H. C. Minnett, “The Australian 210-ft Radio Telescope,” Journal Brit. IRE, 23, 1962, pp. 49-53.
9. J. W. Findlay, “The 300-Foot Radio Telescope at Green Bank, Sky and Telescope, 25, February 1963, p. 68.
10. M. M. Small, “The New 140-Foot Radio Telescope,” Sky and Telescope, 30, November 1965, p. 267.
11. F. J. Lockman, F. D. Ghigo, and D. S. Balse, “But it Was Fun – The First Forty Years of Radio Astronomy at Green Bank,” NRAO Publication, 2007.
12. S. von Hoerner, “Design of Large Steerable Antennas,” Astron. J., 72, 1967, pp. 35-47.
13. O. Hachenberg, B. H. Grahl, and R. Wielebinski, “The 100-Meter Radio Telescope at Eff elsberg, Proc. IEEE, 61, 1973, pp. 1288-1295.
14. J. W. M. Baars and B. G. Hooghoudt, “The Synthesis Radio Telescope at Westerbork. General Layout and Mechanical Aspects,” Astron. Astrophys., 31, 1974, pp. 323-331.
15. R. M. Prestage, K. T. Constantikes, T. R. Hunter, L. J. King, R. J. Lacasse, F. J. Lockman, and R. D. Norrod, “The Green Bank Telescope,” Proc. IEEE, 97, 2009, pp. 1382-1390.
16. R. W. Wilson, K. B. Jeff erts, and A. A. Penzias, “Carbon Monoxide in the Orion Nebula,” Astrophys. J. Let., 161, 1970, p. L43.
17. M. A. Gordon, Recollections of Tucson Operations, The mm-Wave Observatory of NRAO, Berlin, Springer, 2005.
38 The Radio Science Bulletin No 362 (September 2017)
18. J. W. Findlay, “Operating Experience at the National Radio Astronomy Observatory,” in “Large Steerable Radio Antennas,” Annals NY Acad. Sci., 116, 1964, pp. 25-40.
19. J. C. Bennett, A. P. Anderson, P. A. McInnes, and A. J. T. Whitaker, “Microwave Holographic Metrology of Large Refl ector Antennas,” IEEE Trans. Antennas Propag., AP-24, 1976, pp. 295-303.
20. J. W. M. Baars, R. Lucas, J. G. Mangum, and J. A. Lopez-Perez, “Near-Field Radio Holography of Large Refl ector Antennas,” IEEE Antennas and Propagation Magazine, 49, 5, 2007, pp. 24-41.
21. A. Greve and M. Bremer, Thermal Design and Thermal
Behaviour of Radio Telescopes and Their Enclosures, ASSL 364, Heidelberg, Springer, 2010.
22. P. Brandt and H. Gatzlaff , “Design of the 30-meter Millimeter-Wavelength Radio Telescope,” Technische Mitteilungen Krupp, Forschungsberichte, 39, 1981, pp. 111-124 (in German).
23. D. Morris, J. W. M. Baars, H. Hein, H. Steppe, C. Thum, and R. Wohlleben, “Radio-Holographic Refl ector Meas-urement of the 30-m Millimeter Radio Telescope at 22 GHz with a Cosmic Signal Source,” Astron. Astrophys., 203, 1988, pp. 399-406.
24. H. J. Kärcher, “Enhanced Pointing of Telescopes by Smart Structure Concepts Based on Modal Observers,” Proc. SPIE, 3668, 1999, pp. 998-1009.
25. A. Greve, M. Bremer, J. Peñalver, P. Raffi n, and D. Morris, “Improvement of the IRAM 30-m Telescope from Temperature Measurements and Finite Element Calculations,” IEEE Trans. Ant. Propag., AP-53, 2005, pp. 851.
26. R. B. Leighton, “A 10-meter Telescope for Millimeter and Sub-Millimeter Astronomy,” Tech. Rep. California Institute of Technology, May 1978.
27. D. Woody, D. Vail, and W. Schaal, “Design Parameters and Measured Performance of the Leighton 10.4-m-Diameter Radio Telescopes,” Proc. IEEE, 82, 1994, pp. 673-686.
28. J. D. Bregman and J. L. Casse, “A Simulation of the Thermal Behaviour of the UK-NL mm Wave Telescope,” Int. J. Infrared and mm Waves, 6, 1985, pp. 25.
29. K. Akabane, “A Large Millimeter Wave Antenna,” Int. J. Infrared & mm Waves, 4, 1983, pp. 793-808.
31. S. Guilloteau et 16 alii, “The IRAM Interferometer on Plateau de Bure,” Astron. Astrophys., 262, 1992, pp. 624-633.
31. J. W. M. Baars, R. N. Martin, J. G. Mangum, J.P. Mc-Mullin, and W. L. Peters, “The Heinrich Hertz Telescope and the Submillimeter Telescope Observatory,” Publ. Astron. Soc. Pacifi c, 111, 1999, pp. 627-646.
32. A. Wootten and A. R. Thompson, The Atacama Large Millimeter/Submillimeter Array, Proc. IEEE, 97, 2009, pp. 1463-1471.
33. J. G. Mangum, J. W. M. Baars, A. Greve, R. Lucas, R. C. Snel, P. Wallace, and M. Holdaway, “Evaluation of the ALMA Prototype Antennas,” Publ. Astron. Soc. Pacifi c, 118, 2006, pp. 1257-1301.
34. J. G. Mangum, “The Performance of the North American ALMA Antennas, 36th ESA Workshop on Antennas, 2015.
35. R. A. Laing, “The Performance of the European ALMA Antennas,” 36th ESA Workshop on Antennas, 2015.
36. P. Bolli et 37 alii, “Sardinia Radio Telescope: General Description, Technical Commissioning and First Light,” Journal of Astronomical Instrumentation, 4, 3 & 4, 2015, 1550008 (20 pp.).
37. J. W. M. Baars and H. J. Kärcher, Radio Telescope Refl ectors – Historical Development of Design and Construction, Astrophysics and Space Science Library 447, Berlin, Springer, 2017.

The Radio Science Bulletin No 362 (September 2017) 39
The Precision Array for Probing theEpoch of Reionization (PAPER):A Modern Scientifi c Adventure
Richard F. Bradley
National Radio Astronomy ObservatoryCentral Development Laboratory
1180 Boxwood Estate RoadCharlottesville, VA 22903 USA
Tel: +1 (434) 296-0291E-mail: [email protected]
1. The Humble Beginnings
I’ll meet you in your lab tomorrow, and we can get started!” These words, spoken by the late Don Backer, marked the
humble beginnings of our scientifi c adventure. He was in Charlottesville, Virginia, to deliver the 2003 Karl G. Jansky Lecture. This is an annual event sponsored by Associated Universities Inc. (AUI) and the National Radio Astronomy Observatory (NRAO) that honors a distinguished scientist in the fi eld of astronomy. His lecture, titled “Massive Black Holes, Gravity Waves, and Pulsars,” illustrated Don’s desire for being at the forefront of scientifi c research. Don and I both attended the AUI Board of Trustees Dinner, held in Charlottesville the day after the lecture, and we briefl y spoke about getting together to discus how we might join forces to develop an experiment capable of detecting the hydrogen signature imprinted onto the fabric of the early universe by the fi rst stars and galaxies. I couldn’t wait to get started, and eagerly anticipated our meeting. However, to understand why this meeting was so important for the project, I must momentarily digress to outline the perspectives that we each brought to the laboratory on that day.
A couple of years earlier, I was approached by Tony Beasley, then a staff scientist at the NRAO and now Observatory Director, to discuss an experiment. This was to directly measure the radiation from highly-redshifted neutral hydrogen that occurred during a time in the evolution of the universe that we know very little about. We know something about the universe when it was only a few million years old, from careful measurements made by the Cosmic Background Explorer (COBE), Wilkinson Microwave Anisotropy Probe (WMAP), and the Planck mission. We know a bit about galaxies that were present 650 million years later from studying the emissions of their very energetic nuclei using ground-based radio telescopes, and images from the Hubble Space Telescope. However,
we know virtually nothing about what happened between these epochs.
After the Big Bang, we generally know that the universe expanded and cooled to the point that hydrogen, helium, and trace amounts of lithium began to form. Through gravitational forces, these elements evolved into dense hot clumps: hot enough within their cores to ignite thermonuclear reactions, marking the beginning of the Cosmic Dawn era. X-ray and ultraviolet radiation from these fi rst stars heated and ionized the neutral hydrogen surrounding them, until they either collapsed to form black holes or exploded, injecting heavier elements into the mix. The amount of neutral hydrogen dwindled in the process, yielding to the universe we know today where the hydrogen is almost completely ionized, marking the end of the Epoch of Reionization era.
Theories abound as to the astrophysics that played a role during this time to shape the spatial distribution of neutral hydrogen (HI), which radiates energy by way of the ground-state transition, the so-called 21-cm spin-fl ip radiation, and ionized hydrogen (HII), which radiates continuum thermal emission (bremsstrahlung) in the microwave and millimeter-wave bands with very narrow recombination lines at low frequencies [1]. If the 21-cm radiation could somehow be measured as a function of redshift or radio frequency, we could tease out the astrophysical model that best fi t the dynamical behavior of the hydrogen during this time. Tony directed my attention to a 1999 article in Astronomy and Astrophysics by Shaver et al. [2], who described such an experiment. For those readers interested in the science, please see the article in Scientifi c American by Abraham Loeb [3].
The nature of this radiation posed an incredible challenge for detection. The rest frequency was 1420 MHz (21-cm wavelength), but the fact that it had originated

40 The Radio Science Bulletin No 362 (September 2017)
early in the formation of the expanding universe resulted in lengthening the wavelength, i.e., Doppler-shifting this frequency downward into the 50 MHz to 200 MHz band. The astrophysics aff ecting the radiation stretched over a long interval of time, resulting in very broad spectral features that were distinct from the thermal continuum and narrow recombination lines. Measurements over this entire band were needed. The spatial structures from the Reionization process were on angular degree scales. However, the signal was extremely weak, about fi ve orders of magnitude below that of the foreground radiation in this band, dominated by synchrotron processes [4]. Unfortunately, none of the radio telescopes available at the time met the requirements necessary to detect this radiation, due to limitations in frequency coverage, limited instantaneous bandwidth, or a small fi eld of view.
Tony knew that I was interested in developing forefront scientifi c instrumentation that pushed the limits of conventional approaches. I had been working with NRAO Staff Scientist Rick Fisher to pioneer an L-band phased-array feed for the 140-foot telescope, and with Cecilia Barnbaum, a postdoc at NRAO at the time, on a new, novel interference-canceling receiver, in an attempt to observe hydrogenated buckminsterfullerene (HC60) at 94 MHz [5]. I was also working with Leslie Rosenberg (MIT) on an instrument to detect the hypothetical particle known as the Axion [6]. While I had dabbled in signal processing and many other technologies associated with radio-astronomy instrumentation over the years, I specialized in radio-frequency systems and antennas. I was fortunate to have learned from true experts in the fi elds, such as Marian Pospieszalski on low-noise amplifi ers, S. Srikanth on electromagnetics, Anthony Kerr and Sandy Weinreb on microwave electronics, Bob Mauzy on RF circuits, and Bob Mattauch on RF semiconductor-device
fabrication. The Epoch of Reionization (EoR) experiment, as it was called, had piqued my curiosity, and so I began to sketch up a conceptual design.
The idea put forth by Shaver et al. is known as the global experiment, an approach to measuring the spatially integrated signal from the neutral hydrogen. A single antenna could theoretically be used for this weak signal measurement, and the challenge was to separate the hydrogen signal from the plethora of strong signals entering the antenna along with it. The redshifted hydrogen of EoR placed the signal in the 70 MHz to 240 MHz band. While the mitigation of anthropomorphic radio-frequency interference would be an important issue, the radiation from our galaxy would be the most signifi cant contributor to measurement error. With no spatial resolution of any signifi cance, we would depend completely upon the spectral response to identify the hydrogen signature. The instrument had to be designed so as not to introduce spectral features at the part-per-million level that could distort the hydrogen signal, or, worse, be mistaken for it. Extreme calibration of systematic errors was essential.
The antenna would be most critical in maintaining good spectral purity. Since collecting area and high spatial resolution were not dominant issues at the time, fi lled-aperture antennas, such as the paraboloid, were eliminated as candidates. This was because the rather large physical size of the feed would cause signifi cant aperture blockage and spillover that could introduce undesired frequency-dependent spectral structure. While log-periodic antennas came to mind, the signifi cant phase wrapping that occurs with such designs concerned me as a possible source of spectral distortion. I began searching for a dipole-like antenna that could cover the band with an impedance match better than 10 dB, a beam pattern that was a weak function
Figure 1. The original sleeved dipole prototype, used to evaluate its electromagnetic properties.

The Radio Science Bulletin No 362 (September 2017) 41
of frequency, and could provide dual polarization with over 50 dB of isolation. The sleeved dipole [7] was a reasonable fi t. It is a dual-resonant structure that provides greater bandwidth than the fat-dipole approach, but it couldn’t cover the entire 100 MHz to 300 MHz band, so we settled on two versions that overlapped in frequency coverage to allow cross calibration. The basic dual-polarization version, with planar disks in place of the cylindrical sleeve, had been used as low-frequency feeds on dish antennas, and so it was good candidate. During the summer of 2002, REU student intern Michelle Casey assisted in the development of the antennas. She used CST Microwave Studio to model the structures, and a prototype was constructed and evaluated. Since our budget for this project was paper thin, this antenna was literally cut from cardboard, and covered with aluminum foil and copper tape! A photograph of this early antenna is shown in Figure 1.
Encouraged by the results from these tests, Tony
Beasley and I began discussing possible locations for this experiment, even considering Antarctica at one point, since some funding might have been available. However, Tony left Charlottesville for Socorro, New Mexico, and drifted away from the project. Fortunately, I had attended an URSI meeting that summer, and ran into Don Backer there. He told me about his ideas for a global experiment, but he had not had time to follow through with any hardware. I told him about the work we had done in Charlottesville on the antenna design. We were both intrigued, and quickly came to the conclusion that we should work together on such an experiment. He would be in Charlottesville in October for the Jansky Lecture, and so we thought it would be a good time to kickoff our new collaboration.
I fi rst met Don back in the early 1980s, when I worked as a receiver engineer at the NRAO Green Bank facility. Don would regularly visit to use the 140-ft radio telescope
to detect and characterize pulsars, rapidly rotating neutron stars that emit radio pulses. Don was the fi rst to discover millisecond-period pulsars, and was a world leader in the fi eld. Detecting such pulsars required intimate knowledge of signal processing, and Don would always arrive in Green Bank with the latest hardware incarnation from Dan Werthimer’s lab at Berkeley, along with a graduate student working closely with him on the details. Don and I would talk about instrumentation during our shared times in the observatory’s cafeteria. He was sharp, witty, and fi lled with energy: he seemed to easily keep up with the rapidly evolving world of digital signal processing. He was keenly aware of its power as a tool for enabling future discoveries in radio astronomy, and that it was imperative to eff ectively understand and apply it. Don made an impression on me back then, and we stayed in touch over the intervening years. Needless to say, I was thrilled to have this opportunity to work with Don on the EoR project!
Don stopped by my laboratory early that October morning in 2003. Don was eager to see my work on antennas. I showed him the prototypes, and we discussed the refl ection-coeffi cient measurements, along with the modeled beam patterns. The theory of EoR had been refi ned a bit since the initial paper by Shaver et al.: the redshift range had narrowed to the extent that it could be covered by a single sleeved dipole (120 MHz to 180 MHz). We were also becoming more aware of the challenge that galactic foreground removal would present, and decided that we should make use of spatial information. The patchy structure of radiating and non-radiating hydrogen on a degree scale expected from the EoR could be resolved by a modest array having a maximum baseline of under 300 m. Don mentioned that we could make use of digital-correlator technology being developed at Berkeley for the Allen Telescope Array.
Figure 2. The original low-noise active balun used in the early EoR array deployed in Green Bank. The balun was vertically mounted in the mast of the antenna. Signals entered the balun from the top set of connectors, which were attached to the antenna. The two linear polarizations exited the balun at the bottom.
Figure 3. The antenna used in the original EoR Green Bank array. N. Biswas is shown working underneath the antenna, connecting the 50 ohm Heliax cable and power to the balun, with the author (keeling) provid-ing instructions. Dan Boyd (standing) was preparing fasteners.

42 The Radio Science Bulletin No 362 (September 2017)
There were several very important decisions made that day, which would prove valuable throughout the project. The key factor was a basic realization that we honestly didn’t know how to conduct this experiment. We respected the complexity of the measurement, and decided to adopt an agile, learn-as-you-go approach to the instrument design. At the onset, we felt the beam pattern and refl ection coeffi cient of the antenna should be smoothly varying functions of frequency. Since we didn’t know what array confi guration would be optimum for EoR measurement, we decided to make the elements portable. We would build dual-polarized elements, each equipped with a low-noise receiver, ensuring sky-dominated noise. We also felt that we needed to simultaneously digitally sample and process the entire bandwidth to eliminate bandpass distortions, spurious emissions, and cross-calibration issues that might result from superheterodyning RF subbands to an intermediate frequency (IF) for processing. We closed our meeting that day with a plan to build a tiny, four-element linear array in Green Bank within the next few months. Lessons learned from this experience would fold into the next iteration of this array. This exercise would allow us to begin studying how to image the sky over a wide fi eld of view, subtract the strong foreground sources, and examine the residual for an interesting spectral-frequency distribution.
2. Early Work in Gre en Bank
During the winter months leading up to the Green Bank deployment, I refi ned the antenna design. I fabricated four of them, together with eight-foot-square wooden platforms covered with galvanized, welded-steel mesh, as ground refl ectors. The low-noise amplifi er proved to be the most-challenging component to design. A noise temperature of under 150 K with a gain of 20 dB was easy to achieve over the 120 MHz to 180 MHz band. However, it also had to be both mechanically and electrostatically rugged, have a very high dynamic range to accept RFI without any gain compression, have two channels isolated by over 50 dB, have a small phase temperature coeffi cient, and fi t into a two-inch-diameter cylinder located under the feed point of the antenna. After experimenting with several designs, I settled on a common-base amplifi er using a silicon bipolar-junction transistor and a low-loss, transformer-feedback circuit. A pair of these amplifi ers was used, one for each arm of the dipole, along with a 180° hybrid junction to form an active balun. University of Virginia graduate student Chaitali Parashare designed and evaluated the RF electronics, while my technician, Dan Boyd, worked out the packaging details so that it would all fi t into the small cylinder. A photograph of our initial low-noise, dual-polarization balun is shown in Figure 2.
In the summer of 2004, we deployed our fi rst array in Green Bank, and used it to detect fringes. The site was located near the 85-1 Tatel radio telescope, the fi rst ever telescope deployed by the NRAO. The old control room for 85-1 was our makeshift operations center. We surveyed an
east-west line about 500 ft in length. University of Virginia graduate student N. Biswas, REU student Sarah Jaeggi, and I positioned the four elements in a minimum-redundancy confi guration [8] (see Figure 3). Don brought along his four-port correlator, cobbled together from ATA hardware, along with a bright, young, enthusiastic graduate student named Aaron Parsons to assist him.
We experimented with this system throughout 2005.
With fringes in hand and the knowledge that the system was functionally operational, we decided to double the size of the array. We submitted a proposal to NSF for some funds to off set the cost of this expansion. We were delighted to receive a grant for about $155,000 in 2006, which allowed Don to bring Aaron onto the project full time, welcome new University of Virginia graduate student N. Gugliucci to the project, and pay for the additional equipment. Don surveyed a rectangular-grid confi guration at the site, and we began building the additional antennas, ground screens, and baluns. However, we realized that our current site was narrow in the north-south direction, and we really wanted to place our antennas on a circle to provide much better uv coverage for imaging.
We scouted around Green Bank for a more suitable site, and found Galford Meadow, at the southern tip of the Observatory. Site Director Phil Jewell gave us permission to use this location for our eight-element array. In 2006, we funded the construction of a small hut, built by the Green Bank Works Area, along with the installation of power and a fi ber-optic Internet cable. We ran a series of tests on various high-quality, low-cost 75-ohm coaxial cables and F-type connectors that were used in the cable and satellite-television industries. We fi nally settled on polyester-coated, twin RG-6 with an extra wire that we could use to supply power, and weatherproof compression-type connectors. The receivers, consisting of amplifi ers and a fi lter, were miniaturized onto printed-circuit boards, and mounted into a small card cage. We upgraded the correlator to a confi guration based on the IBOB/BEE2 boards, developed by the Berkeley CASPER group. A photograph of the early design is shown in Figure 4.
Figure 4. The IBOB/BEE2 correlator “basket” used in the eight-element Green Bank array at Galford Meadow.
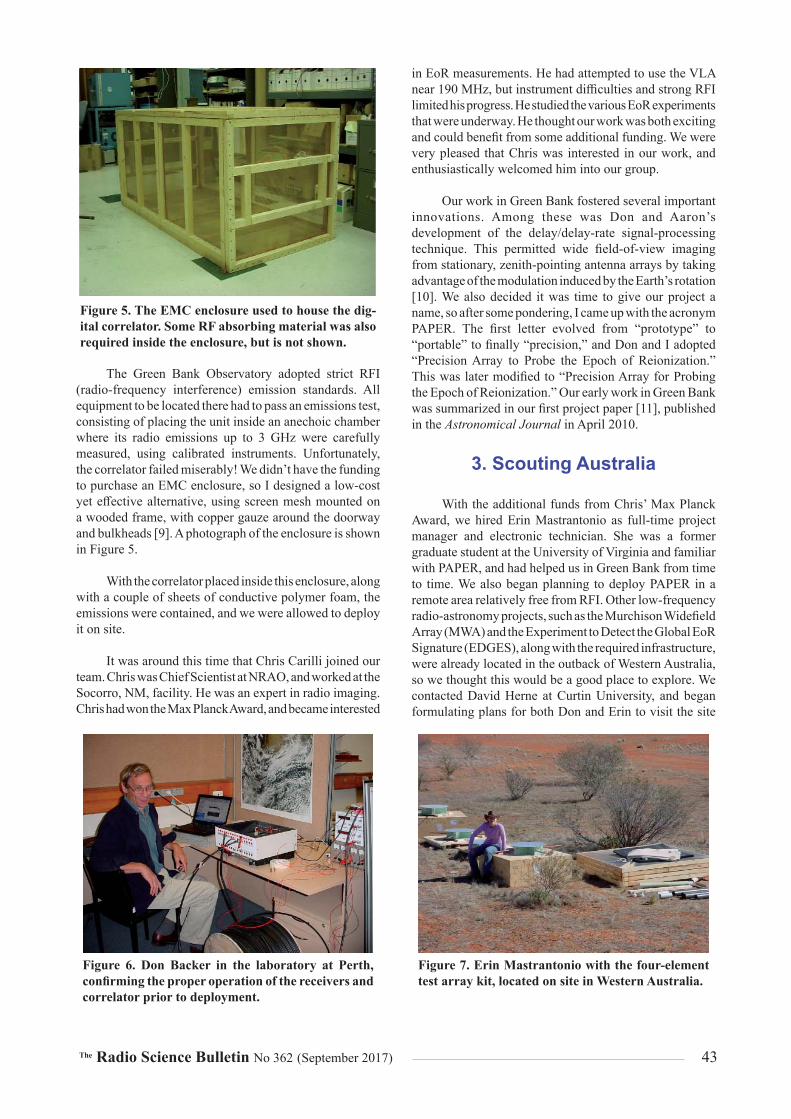
The Radio Science Bulletin No 362 (September 2017) 43
The Green Bank Observatory adopted strict RFI (radio-frequency interference) emission standards. All equipment to be located there had to pass an emissions test, consisting of placing the unit inside an anechoic chamber where its radio emissions up to 3 GHz were carefully measured, using calibrated instruments. Unfortunately, the correlator failed miserably! We didn’t have the funding to purchase an EMC enclosure, so I designed a low-cost yet eff ective alternative, using screen mesh mounted on a wooded frame, with copper gauze around the doorway and bulkheads [9]. A photograph of the enclosure is shown in Figure 5.
With the correlator placed inside this enclosure, along with a couple of sheets of conductive polymer foam, the emissions were contained, and we were allowed to deploy it on site.
It was around this time that Chris Carilli joined our team. Chris was Chief Scientist at NRAO, and worked at the Socorro, NM, facility. He was an expert in radio imaging. Chris had won the Max Planck Award, and became interested
in EoR measurements. He had attempted to use the VLA near 190 MHz, but instrument diffi culties and strong RFI limited his progress. He studied the various EoR experiments that were underway. He thought our work was both exciting and could benefi t from some additional funding. We were very pleased that Chris was interested in our work, and enthusiastically welcomed him into our group.
Our work in Green Bank fostered several important innovations. Among these was Don and Aaron’s development of the delay/delay-rate signal-processing technique. This permitted wide fi eld-of-view imaging from stationary, zenith-pointing antenna arrays by taking advantage of the modulation induced by the Earth’s rotation [10]. We also decided it was time to give our project a name, so after some pondering, I came up with the acronym PAPER. The fi rst letter evolved from “prototype” to “portable” to fi nally “precision,” and Don and I adopted “Precision Array to Probe the Epoch of Reionization.” This was later modifi ed to “Precision Array for Probing the Epoch of Reionization.” Our early work in Green Bank was summarized in our fi rst project paper [11], published in the Astronomical Journal in April 2010.
3. Scouting Australia
With the ad ditional funds from Chris’ Max Planck Award, we hired Erin Mastrantonio as full-time project manager and electronic technician. She was a former graduate student at the University of Virginia and familiar with PAPER, and had helped us in Green Bank from time to time. We also began planning to deploy PAPER in a remote area relatively free from RFI. Other low-frequency radio-astronomy projects, such as the Murchison Widefi eld Array (MWA) and the Experiment to Detect the Global EoR Signature (EDGES), along with the required infrastructure, were already located in the outback of Western Australia, so we thought this would be a good place to explore. We contacted David Herne at Curtin University, and began formulating plans for both Don and Erin to visit the site
Figure 5. The EMC enclosure used to house the dig-ital correlator. Some RF absorbing material was also required inside the enclosure, but is not shown.
Figure 6. Don Backer in the laboratory at Perth, confi rming the proper operation of the receivers and correlator prior to deployment.
Figure 7. Erin Mastrantonio with the four-element test array kit, located on site in Western Australia.

44 The Radio Science Bulletin No 362 (September 2017)
in July 2007, to deploy a four-element test array. Don assembled a small correlator at Berkeley. The antennas and electronic components were fabricated in Charlottesville, and shipped to Australia in kit form ahead of the visit. The ground platforms were fabricated by David in Australia. Don evaluated the receivers and correlator in the labs at the Curtin Institute for Radio Astronomy in Perth, prior to deployment (see Figure 6). Don, Erin, and David loaded the equipment onto a truck and headed for the Outback. The components arrived in good condition, and after a few days of assembly, the array was deployed and operational (see Figure 7).
The test array was quite successful in that it
helped us understand the nature of working in a very remote environment, and the importance of having local collaborators. The RFI environment was exceptionally good. Data from this expedition were combined with the Green Bank data to produce the fi rst all-sky map at 150 MHz [11]. When Don and Erin returned to the US, we began making plans for a sixteen-element array, to be deployed at the site.
As it turned out, we never followed through with these plans, but instead deployed our PAPER array in the Karoo region of South Africa. This dramatic change, which appeared to happen overnight, generated rumors and controversy throughout the community. In reality, this decision was made in an eff ort to assist the MWA project. A few months after the Australia trip, I served on an NSF panel charged with the task of reviewing the MWA project. It was evident that the group needed additional time to focus on solving a number of important technical problems, and I felt that deploying PAPER at the same location during this critical time could become a major distraction for the MWA team. I voiced my concerns to Don, and he agreed. We discussed various alternatives, including delaying our deployment by six months. In considering other possible sites, we decided to ask Jason Manley about South Africa, since he was already assisting us with the development of the correlator. Jason discussed this with Bernie Fanaroff and Justin Jonas within SKA SA, and the idea received an
enthusiastic response. It was a diffi cult decision, but we decided to deploy our sixteen-element array in South Africa, and a memorandum of agreement was signed. However, we are extremely grateful to everyone in Australia who welcomed and assisted us during that time.
4. Imaging the Sky at Green Bank and The Karoo
One of the lessons learned from our early work in Green Bank and during the scouting trip to Australia was the need for more collecting area per element. In response, I redesigned the antenna to include side fl aps, refl ectors inclined outward at 45° to the base ground platform. This dual-polarization trough refl ector (shown in Figure 8) increased the collecting area from about 2.3 to fi ve square meters, without introducing any sidelobes of signifi cance.
The base platform was made from galvanized steel
mesh attached to a steel frame. It was important that the side refl ectors did not make electrical contact with the base, since asymmetrical currents at the corners would introduce sidelobes and lower the forward gain. Hence, standard 2 in diameter PVC pipe was used to support the fl aps. The low-noise balun was also redesigned onto circuit boards, using surface-mount components to ease construction.
Erin Mastrantonio crafted mechanical drawings of the new trough refl ector. Eight were fabricated by the Green Bank shop, and were used as prototypes to replace the original antennas at Galford Meadow. These proved successful. After slight mechanical modifi cations to the design to improve assembly, a contract for twenty-four units was given to a small fabrication business in Ohio. Upon receipt of the refl ectors in 2009, eight were deployed in Green Bank, and the remaining sixteen were packed into a sea-faring cargo container, along with the antenna parts bound for The Karoo. A small scouting team, consisting of Don, Aaron, and James Aguirre (University of Pennsylvania), who had recently joined the PAPER group, his student Danny Jacobs, and Jason Manley, visited the South African site in 2009. There, they deployed several of the antennas to evaluate the RFI environment, which turned out to be very similar to the Australian site. We began making plans for campaign-style deployment activities there.
We received an additional $2M in funding from the NSF in 2008, allowing us to fabricate more instrumentation and bring more students onto the project. Additional elements were added to the Green Bank array in 2009, pushing the total there to thirty-two. We reconfi gured the elements into a randomized, minimum-redundancy array that provided much better uv coverage. This array, which was critical for instrument evaluation, was used to test the new 32-channel correlator design, based on the ROACH platform, that would be deployed in South Africa. Chaitali and I also improved the receiver packaging, replacing the card-cage-style approach with one of placing each receiver into its own EMC module, as shown in Figure 9.
Figure 8. The trough refl ector used in project PA-PER, shown located at the Galford Meadow site in Green Bank.

The Radio Science Bulletin No 362 (September 2017) 45
Unfortunately, Dan Boyd, who had helped us with the RF instrumentation over the year, was in a very serious automobile accident in 2008, preventing him from assisting us for several months. Pat Klima, who had over twenty-fi ve years of experience in industrial electronics, was hired to assist us with the fabrication, testing, and shipping of the remaining components. Pat learned quickly, and was extremely organized and effi cient. As a result, we were able to maintain our 2010 deployment schedule.
PAPER-32 was successfully deployed in South Africa during May 2010. I unfortunately could not participate in the campaign due to personal reasons. Erin had decided to leave the project for other opportunities. Thanks in part to Pat’s careful preparation of the components into kits designed for ease of assembly, a team led by Don Backer and assisted by students in South Africa were able to effi ciently assemble and deploy the 32-element array. Figure 10 shows the South African students assisting with antenna assembly.
The quality of the data from the PAPER-32 in South Africa surpassed our expectations, and served as a catalyst for further developments by the PAPER team. The imaging work culminated in a full-sky map made from data taken at both sites. This marked the fi rst time such a map was produced from the ground using essentially the same instrument. The result is shown in Figure 11.
We were beginning to worry about the accuracy of
the image-subtraction technique for EoR detection. A new approach might have been needed to somehow separate the strong foreground signal from that of the weak hydrogen radiation. Don and Aaron were just beginning to ponder the value of power-spectrum analysis, with imaging only being used for basic instrument calibration and verifi cation purposes. Don had taken on a new graduate student, Jonnie Pober, and we began planning for a bit of preliminary work in Green Bank to study various array confi gurations that might enhance the signal-to-noise of the power-spectrum measurement over a range of spatial frequencies.
Figure 9. The new receiver enclosures shown here reduced coupling among the boards, and greatly at-tenuated digital noise from the correlator.
Figure 10. South African students from the Uni-versity of Kwa-Zulu-Natal are shown assisting in the assembly of the PAPER antennas.
Figure 11. This is a 130 MHz to 180 MHz map in galactic coordinates covering 4 steradians. This map was created using data from 32 antenna deployments in Green Bank and South Africa, observed with minimum-redundancy antenna confi gurations. The color scale refl ects 10log Jy beam , ranging from 1.5 (red) to –0.5 (blue). The brightest sources were removed using the delay/delay-rate signal-processing technique. Noisy regions were due to a reduced primary beam response in those directions.

46 The Radio Science Bulletin No 362 (September 2017)
On Sunday, July 25, 2010, I received a call from Don to discuss his visit later in the week, to introduce Jonnie Pober to the Green Bank array, and to begin exploring new array confi gurations. At the beginning of the call, Don seemed somewhat lethargic, and he mentioned that he was feeling a bit under the weather. In true Don fashion, we stayed focused on discussing PAPER activities throughout the 45-minute call. I didn’t give it another thought until I read Dan Werthimer’s e-mail the next morning announcing Don’s passing. I remember a numbness befalling me, and how I couldn’t believe what I had read. I was deeply saddened. Don was a true leader in the fi eld. The radio-astronomy community had lost a dear friend. His relentless energy, his deep passion for science, and his honest, caring style were admired and are greatly missed. Above all, he would have insisted that we forge ahead with our EoR experiments...and that we did, in his honor.
5. The Transition t o Power-Spectrum Measurements
The process of signal detection centers on exploiting the diff erences in character between the desired signal and the multitude of undesired signals that are also acquired by the instrument. This diff erence is enhanced through various observing and signal-processing techniques that are designed to increase the signal-to-noise (SNR) ratio of the desired signal. While the images produced by PAPER-32 were quite striking, the limited dynamic range had raised concerns about the eff ectiveness of the source-subtraction technique to improve the SNR of the EoR signal. Attempts to subtract strong point sources, such as Cas A and Cyg A, and extended sources, such as the galactic synchrotron, from the composite image were incomplete. This produced an undesired residual noise power in the frequency spectrum that limited the sensitivity for EoR signal detection. Basically, we were seriously under-sampling the spatial domain. The lost information, which was preventing subtraction to the level necessary for EoR detection, would be quite diffi cult to recover. Adding more baselines, increasing the baseline length, increasing the size of each element, etc., would certainly improve matters, but the extent necessary to achieve EoR detection would greatly exceed our limited resources. Using source subtraction in the imaging domain to remove foreground radiation to the level necessary for EoR detection by PAPER was in jeopardy.
Prior to Don’s passing, he and Aaron were pondering the characteristics of the signals received from the EoR along with others present in the sky measurement. They recognized that the power spectral density of the foreground signals was a smoothly varying function of frequency in the EoR band. In the delay-transform domain, the power from the foregrounds was confi ned to delays less than that set by the baseline extents of the interferometer instrument. On the other hand, the hydrogen signal is, after all, a spectral line with a patchy spatial distribution, and can spill power
into longer delays. Hence, fi ltering could be applied to the delay domain to separate the signals, but at the expense of an even weaker EoR signal [12].
This new power-spectrum analysis approach was evaluated using data from the PAPER-32 imaging arrays. However, could the SNR be improved by changing the array confi guration? After some investigation [13], Aaron settled on a rectangular grid array that improved the SNR by the basic application of Moivre’s equation, providing many independent samples over a limited range of spatial frequencies. This maximum-redundancy array, for which it has become known, was fi rst tried in Green Bank, where 21 elements of the 32-element imaging array were reconfi gured into a 7 × 3 rectangular array, as shown in Figure 12. The other elements remained unchanged, and were used for cross-calibration between the imaging and power-spectrum arrays. The results were as expected, and plans were made to incorporate maximum redundancy into the South African array. Data from PAPER-32 were used to place new limits on the EoR spectrum that were consistent with X-ray-heated IGM (intergalactic medium) at 7.7z [14].
The remaining funds from our second NSF grant allowed us to double the size of our South African array to 64 elements in June of 2011. All of the elements and electronic components needed for the upgrade were fabricated and shipped to The Karoo ahead of our arrival. Pat Klima, N. Gugliucci, and I joined many other members of the PAPER team, William Walbrugh of SKASA, and South African students on this successful campaign. After a few months of data for this confi guration, another group from the PAPER team reconfi gured the elements into a maximum-redundant array. Data were acquired from this array well into 2012. Details of PAPER-64 were published [15], along with a further refi nement of the EoR spectrum limits, which remained consistent with X-ray heating. These data have yielded the best upper limits on EoR cosmology of any instrument to date.
Figure 12. Our maximum-redundancy test array located in Green Bank. An element of the imaging array is shown in the foreground.
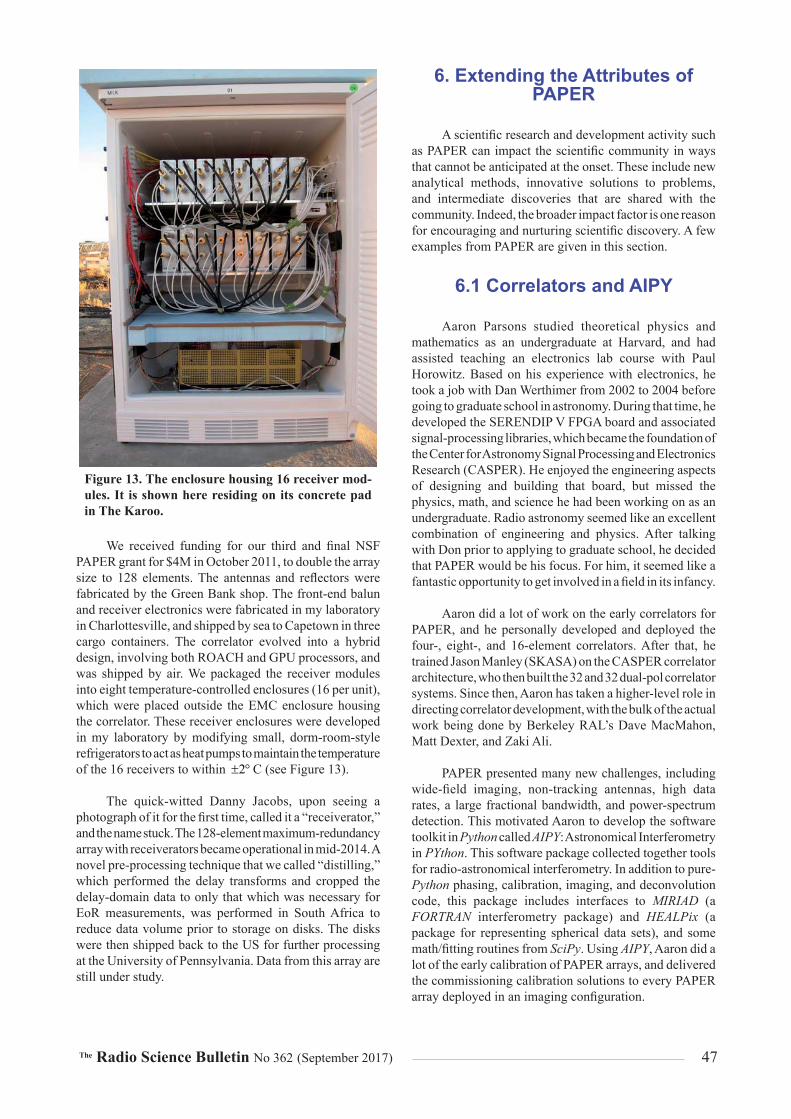
The Radio Science Bulletin No 362 (September 2017) 47
We received funding for our third and fi nal NSF PAPER grant for $4M in October 2011, to double the array size to 128 elements. The antennas and refl ectors were fabricated by the Green Bank shop. The front-end balun and receiver electronics were fabricated in my laboratory in Charlottesville, and shipped by sea to Capetown in three cargo containers. The correlator evolved into a hybrid design, involving both ROACH and GPU processors, and was shipped by air. We packaged the receiver modules into eight temperature-controlled enclosures (16 per unit), which were placed outside the EMC enclosure housing the correlator. These receiver enclosures were developed in my laboratory by modifying small, dorm-room-style refrigerators to act as heat pumps to maintain the temperature of the 16 receivers to within 2 C (see Figure 13).
The quick-witted Danny Jacobs, upon seeing a
photograph of it for the fi rst time, called it a “receiverator,” and the name stuck. The 128-element maximum-redundancy array with receiverators became operational in mid-2014. A novel pre-processing technique that we called “distilling,” which performed the delay transforms and cropped the delay-domain data to only that which was necessary for EoR measurements, was performed in South Africa to reduce data volume prior to storage on disks. The disks were then shipped back to the US for further processing at the University of Pennsylvania. Data from this array are still under study.
6. Extending the Attribut es of PAPER
A scientifi c research and development activity such as PAPER can impact the scientifi c community in ways that cannot be anticipated at the onset. These include new analytical methods, innovative solutions to problems, and intermediate discoveries that are shared with the community. Indeed, the broader impact factor is one reason for encouraging and nurturing scientifi c discovery. A few examples from PAPER are given in this section.
6.1 Correlators and AIPY
Aaron Parsons studied theoretical physics and mathematics as an undergraduate at Harvard, and had assisted teaching an electronics lab course with Paul Horowitz. Based on his experience with electronics, he took a job with Dan Werthimer from 2002 to 2004 before going to graduate school in astronomy. During that time, he developed the SERENDIP V FPGA board and associated signal-processing libraries, which became the foundation of the Center for Astronomy Signal Processing and Electronics Research (CASPER). He enjoyed the engineering aspects of designing and building that board, but missed the physics, math, and science he had been working on as an undergraduate. Radio astronomy seemed like an excellent combination of engineering and physics. After talking with Don prior to applying to graduate school, he decided that PAPER would be his focus. For him, it seemed like a fantastic opportunity to get involved in a fi eld in its infancy.
Aaron did a lot of work on the early correlators for PAPER, and he personally developed and deployed the four-, eight-, and 16-element correlators. After that, he trained Jason Manley (SKASA) on the CASPER correlator architecture, who then built the 32 and 32 dual-pol correlator systems. Since then, Aaron has taken a higher-level role in directing correlator development, with the bulk of the actual work being done by Berkeley RAL’s Dave MacMahon, Matt Dexter, and Zaki Ali.
PAPER presented many new challenges, including wide-fi eld imaging, non-tracking antennas, high data rates, a large fractional bandwidth, and power-spectrum detection. This motivated Aaron to develop the software toolkit in Python called AIPY: Astronomical Interferometry in PYthon. This software package collected together tools for radio-astronomical interferometry. In addition to pure-Python phasing, calibration, imaging, and deconvolution code, this package includes interfaces to MIRIAD (a FORTRAN interferometry package) and HEALPix (a package for representing spherical data sets), and some math/fi tting routines from SciPy. Using AIPY, Aaron did a lot of the early calibration of PAPER arrays, and delivered the commissioning calibration solutions to every PAPER array deployed in an imaging confi guration.
Figure 13. The enclosure housing 16 receiver mod-ules. It is shown here residing on its concrete pad in The Karoo.

48 The Radio Science Bulletin No 362 (September 2017)
6.2 Wide-Field Imaging
Th e imaging confi guration of PAPER has served an important role in understanding the instrument’s systematics, developing wide-fi eld imaging techniques, and learning to eff ectively apply calibration. Chris Carilli was involved in pushing the limits of wide-fi eld imaging by analyzing PAPER data with the AIPS and CASA imaging platforms. Chris worked with graduate student Abhirup Datta, who investigated source-subtraction requirements for EoR detection [17].
More recently, Chris analyzed data from the 64-element PAPER array in South Africa to study confusion-limited imaging. These data were taken on July 4, 2011, with all of the antennas distributed randomly in a circular region with a maximum baseline of 300 m. Jonnie Pober used AIPY to fl ag the data, provide initial amplitude and phase calibration, and phase-to-zenith for ten-minute blocks. These data were then converted to FITS format and transferred to AIPS, where Chris performed his analysis working with graduate student Irina Stefan on imaging Centaurus A [18], an example of which is shown in Figure 14.
The synthesized beam has a FWHM of approximately
18 arcminiutes with a peak sidelobe of 0.22 . After imaging in blocks with eight channels from 140 MHz to 180 MHz, the cubes were folded into a single channel with straight averaging. Figure 15 shows an image of 50 minutes of data, taken when the galactic plane was either very low in the primary beam or had set. The peak on the image was 65 Jy per beam for J2214-170. The rms on surface brightness fl uctuations at the edges of the fi eld was about 90 mJ per beam, while that in the fi eld center was about 1.5 Jy per beam.
According to Chris, the most curious aspect of
Figure 15, as compared to higher-frequency, higher-
resolution interferometric imaging with, e.g., the VLA, was that the apparent noise in the center of the fi eld was much higher than at the edges. This behavior was prior to primary beam correction, i.e., just the Fourier transform of the visibilities. Typical VLA images at higher frequency and resolution will show a fl at noise characteristic across the fi eld, prior to primary beam correction. This noise characteristic was clearly due to confusion: the fi eld is full of radio sources. Interested readers can fi nd more information online at www.reionization.org, HERA Memo No. 1.
6.3 Source Catalog
In 2008, Danny Ja cobs was a fi fth-year graduate student at Montana State University. He was working with Ron Hellings on a gravity-wave paper, and mentioned that he was interested in radio astronomy. Ron called the one radio astronomer he knew, Don Backer. Don called Danny, and a couple of months later, he and his wife were moving from Bozeman to Philadelphia. Danny joined PAPER in December 2008 as James Aguirre’s fi rst grad student at UPenn.
Danny signifi cantly contributed to the sensitivity and confi guration analysis for PAPER, and to the fi eld work and commissioning activities. He also took the initiative to address issues that were important yet neglected. For example, when the interferometric calibration was a challenge due to antenna positions being treated as free parameters, Danny borrowed an old precision GPS system from the SETI group through Don’s connections, learned to use it in Green Bank, mailed it to himself in South Africa, and then used it there to remove the positions as an independent calibration parameter! Danny commissioned a number of the PAPER arrays, in both hemispheres, and wrote several papers on fl ux calibration [19] and power spectra [20]. For most of this time, he was also the main PAPER observer, trying to make sure the telescope stayed operational. Danny’s early work on the PAPER instruments culminated in a source catalog [21] with associated accuracy [22].
Figure 14. An image of the galactic center taken at 121 MHz with PAPER-64.
Figure 15. A PAPER-64 image from 50 minutes of data averaged from 140 MHz to 180 MHz of a high galactic fi eld region.

The Radio Science Bulletin No 362 (September 2017) 49
6.4 Beam Pattern Measurements
Knowin g the antenna’s beam response down to 30 dB below that at boresight was critical to calibrating the total fl ux received by the instrument. While the antenna shown in Figure 8 was developed using CST Microwave Studio, a modern electromagnetic modeling package, questions remained as to the eff ects of the ground under the antenna. We needed a measurement to confi rm the modeling results, even if only at one frequency. Antenna test ranges that worked well in this frequency band were not readily available. The use of strong radio sources was an option, but the dynamic range and sky coverage were limiting issues. A new method was n
From our early work in Green Bank, we noticed a cluster of satellite signals near 137.5 MHz. These downlink signals were from the ORBCOMM constellation, a set of over thirty low-Earth-orbiting (LEO) satellites for low-speed data communications to remote locations [23]. A special receiver and data-acquisition system were developed to measure the total power of the downlink signals with the in situ antenna under test, and to compare this power with that received by a well-calibrated reference dipole located nearby. The initial beam map of the PAPER antenna using this technique is shown in Figure 16. A cut through the beam obtained from the ORBCOMM system compared with CST modeling is shown in Figure 17. Note that the measured pattern was narrower than the modeled pattern, which was due to the extended Earth ground not included in the model.
This work was continued by my graduate student,
Paul Ries (University of Virginia), who improved the user interface and performed more careful measurements on the PAPER antennas. Jackie Hewitt’s graduate student, Abraham Neben (MIT), used this system to measure the beam pattern of the MWA antenna tile [24] and the new HERA antenna [25]. This concept was extended by Danny
Jacobs (now at ASU) using a drone aircraft in project ECHO [26].
6.5 Sensitivity Conce rns
While a back-of-the-envelope-style analysis was suffi cient early in the PAPER project, switching to the power-spectrum measurement required a reevaluation of the system’s sensitivity to the EoR signal. Aaron Parsons and his graduate student, Jonnie Pober, showed [13] that the PAPER-128 array would, at best, yield a one-to-two-sigma detection. This work fed directly into the development of HERA.
There was concern early on that cross-polarization leakage from polarized foreground sources could reduce the sensitivity to the EoR signal. James Aguirre (University of Pennsylvania) and his graduate student, David Moore, fi rst studied this eff ect, and concluded that this leakage could be substantial, and could interfere with foreground subtraction. They concluded that the antenna had to exhibit a good axial ratio to mitigate this eff ect [27].
There was concern that the sensitivity might be reduced by ionospheric eff ects. My graduate student, N. Gugliucci (University of Virginia), and I studied this phenomenon. We determined that foreground source positional changes due to the diurnal and seasonal variations in the electron content of the ionosphere did not signifi cantly contribute to the power-spectrum measurements made at frequencies above 100 MHz.
Finally, since the front-end electronics of the PAPER array were exposed to outdoor ambient temperatures, a way was needed to correct temperature-induced gain eff ects. My graduate student, Chaitali Parashare, and I carefully studied the changes in the receiver’s S parameters and noise temperature through modeling and laboratory measurements [28]. She also measured changes in the characteristics of
Figure 16. The fi rst raw beam pattern acquired using ORBCOMM downlink signals. Individual satel-lite passes were clearly visible. A blind spot occurred toward the north due to the orbital inclinations.

50 The Radio Science Bulletin No 362 (September 2017)
the coaxial cable between the antennas and central hut, and correlated these with solar IR radiation. She developed the gain-o-meter, a PAPER antenna element placed in the center of the array, where resistors were used in place of the antenna terminals at the input ports of the low-noise amplifi er. The temperatures of the resistors were monitored, along with the measured noise power. This measurement was used to track changes in the gain of the gain-o-meter, which, in turn, was applied to the other elements of the array under the assumption that they all behaved similarly in the open fi eld.
7. Building the Foun dation for HERA
In January 2009, Don Backer had sent me a rough outline of a document that he was preparing for submission to the call for papers for the US National Research Council’s Astro2010: Astronomy and Astrophysics Decadal Survey. In it, Don proposed a more-holistic view of EoR science: a pathway, if you will, through various phases, from early discovery, through astrophysical characterization, and fi nally to imaging of the Stromgren Spheres, the name given to the ionized regions surrounding the fi rst stars. He named this pathway HERA: the Hydrogen Epoch of Reionization Arrays. This white paper was a watershed event for bringing together the various US groups active in EoR science under a common theme.
The white paper took shape throughout 2009. Details of PAPER, MWA, EDGES, and other experiments were included as part of the discovery phase in HERA. We acknowledged that as the complexity of our instruments grew, we had to combine resources and work together as a team. This was a radical idea at the time, given that we were competing for the discovery. However, in true Don Backer style, he managed to bring the groups together, and, largely through the eff orts of Don and James Aguirre with input from the groups, a well-written document about HERA was submitted to Astro2010. It nicely described the
work in progress, the notion of a larger instrument required for characterization, and fi nally merging EoR science into the design of the low-frequency Square Kilometre Array (SKA) for imaging.
The fi rst meeting of the PAPER and MWA groups was held in April 2010 at MIT, hosted by Jackie Hewitt. This meeting was based largely on developing the ideas put forth in the white paper. Our focus was on the next generation, a characterization-phase instrument along the HERA road map, HERA II. We didn’t quite know how to defi ne this instrument, given that we were still wandering around in the discovery phase, but we knew that more collecting area and power-spectrum analysis would be the common theme. The meeting broke the ice among the groups, and we began thinking about our next step.
The recommendations of the National Research Council in their report New Worlds, New Horizons in Astronomy and Astrophysics, published in 2011 [16], included HERA as part of the Mid-Scale Instrumentation Program. We were quite pleased with this acknowledgment, but were saddened that Don wasn’t with us to enjoy the moment. However, we now had a mandate to move HERA forward, and so we began planning the next phase. The HERA Coordination Committee was formed in September 2011, and included three representatives from the two projects: Parsons, Carilli, and Bradley from PAPER, and Morales, Hewitt, and Bowman from the MWA. I volunteered to chair the committee. We met bi-weekly for over six months, and the eff ort culminated in an instrument concept proposed by Aaron that included over 350 14-m-diameter paraboloid antennas arranged in a close-packed hexagonal pattern. A proposal to the NSF Mid-Scale Instrumentation Program was submitted in 2013, and partial funding was received in 2014 for instrument-development activities. HERA (the instrument) is underway, but that is the subject of a future article! In addition, other instruments, such as the European Low-Frequency Array (LOFAR), are also being used for EoR detection: the competition remains formidable.
Figure 17. A comparison of the calibrated beam pattern (H-plane cut) obtained from the ORBCOMM measurements with that from CST modeling. Note that the measured pattern was narrower than the model pattern, due to eff ects of the extended Earth ground not included in the model.
The Radio Science Bulletin No 362 (September 2017) 51
8. Lessons Learned f rom PAPER
What have we learned from traveling along the PAPER pathway? In my opinion, the most important lesson is not to be overambitious in designing instrumentation when a research fi eld is very young. Grand hardware deployed in the fi eld doesn’t imply a functioning, well-calibrated instrument that will achieve the accuracy demanded by a given scientifi c measurement. Instead, a “learn as you go” approach is more valuable, compounding a body of knowledge acquired through a progressive series of carefully designed, small-scale experiments that foster technological innovation and instill methodological confi dence while maintaining fl exibility in critical areas where the requirements are less well-defi ned. When designing new instruments, it is advantageous to identify and embrace gaps in our collective knowledge, and not be trapped into accepting conjecture that is often cloaked as wisdom.
The second major lesson is understanding the importance of deploying an engineering array at a relatively nearby site that has an excellent infrastructure prior to deploying the instrument in a remote location. Green Bank was ideally suited for developing PAPER, since this site was also located in the National Radio Quiet Zone. Every major component of PAPER was prototyped and evaluated in Green Bank, including measurements of self-generated electromagnetic emissions and studies of array confi gurations. This saved an enormous amount of time and money throughout the development process.
Indeed, of ultimate importance is the body of knowledge gained by successfully navigating the seemingly endless hurdles one fi nds while meandering along the pathway to discovery. Alas, PAPER didn’t detect the EoR signal. However, it has indeed served a noble purpose by providing a foundation upon which our scientifi c adventure continues, through the advent of HERA.
9. Dedication and Ac knowledgments
This paper is dedicated to the late Don Backer, who had tirelessly championed reionization science, our PAPER instrument, and the HERA collaboration. I thank the US National Science Foundation for their continued fi nancial support. I also thank the Green Bank Observatory for hosting the PAPER engineering arrays, and SKA South Africa for hosting PAPER-128 and HERA. Finally, I thank A. Hopko at ORBCOMM for his helpful advice. The National Radio Astronomy Observatory is a facility of the National Science Foundation, operated under cooperative agreement by Associated Universities, Inc.
10. References
1. K. Kellermann and G. Verschuur, “Galactic and Extra-galactic Radio Astronomy,” Galactic and Extragalactic Radio Astronomy, 1988.
2. P. Shaver, R. Windhorst, A. Madau, and A. de Bruyn, “Can the Reionization Epoch be Detected as a Global Signature in the Cosmic Background?” Astron. & Astro., 345, 2, 1999, pp. 380-390.
3. A. Loeb, “The Dark Ages of the Universe,” Scientifi c American, 295, 5, 2006, pp. 46-53.
4. A. G. Pacholczyk, Radio Astrophysics, San Francisco, Freeman, 1970.
5. C. Barnbaum and R. Bradley, “A New Approach to Interference Excision in Radio Astronomy: Real Time Adaptive Cancellation,” Astronomical Journal, 115, 1998, pp. 2598-2614.
6. R. Bradley, J. Clarke, D. Kinion, L. Rosenberg, K. van Bibber, S. Matsuki, M. Muck, and P. Sikivie, “Micro-wave-Cavity Searches for Dark-Matter Axions,” Reviews of Modern Physics, 75, 2003, pp. 777-817.
7. W. Stutzman and G. A. Thiele, Antenna Theory and Design, New York, John Wiley, 1981.
8. R. N. Bracewell, Two-Dimensional Imaging, Englewood Cliff s, NJ, Prentice Hall, 1995.
9. R. Bradley, “Low Cost Screened Enclosure for Eff ective Control of Undesired Radio Frequency Emissions,” NRAO Electronics Division Internal Report, Vol. 317, 2006.
10. A. R. Parsons and D. C. Backer, “Calibration of Low-Frequency, Wide-Field Radio Interferometers Using Delay/Delay-Rate Filtering,” The Astronomical Journal, 138, 1, 2009, p. 219.
11. A. R. Parsons, D. C. Backer, G. S. Foster, M. C. Wright, R. F. Bradley, N. E. Gugliucci, C. R. Parashare, E. E. Benoit, J. E. Aguirre, D. C. Jacobs, et al., “The Preci-sion Array for Probing the Epoch of Reionization: Eight Station Results,” The Astronomical Journal, 139, 4, 2010, p. 1468.
12. A. R. Parsons, J. C. Pober, J. E. Aguirre, C. L. Carilli, D. C. Jacobs, and D. F. Moore, “A Per-Baseline, Delay-Spectrum Technique for Accessing the 21 cm Cosmic Reionization Signature,” The Astrophysical Journal, 756, 2, 2012, p. 165.

52 The Radio Science Bulletin No 362 (September 2017)
13. A. Parsons, J. Pober, M. McQuinn, D. Jacobs, and J. Aguirre, “A Sensitivity and Array-Confi guration Study for Measuring the Power Spectrum of 21 cm Emission from Reionization,” The Astrophysical Journal, 753, 1, 2012, p. 81.
14. A. R. Parsons, A. Liu, J. E. Aguirre, Z. S. Ali, R. F. Bradley, C. L. Carilli, D. R. DeBoer, M. R. Dexter, N. E. Gugliucci, D. C. Jacobs, et al., “New Limits on 21 cm Epoch of Reionization from PAPER-32 Consistent with an X-Ray Heated Intergalactic Medium at z = 7.7,” The Astrophysical Journal, 788, 2, 2014, p. 106.
15. Z. S. Ali, A. R. Parsons, H. Zheng, J. C. Pober, A. Liu, J. E. Aguirre, R. F. Bradley, G. Bernardi, C. L. Carilli, C. Cheng, et al., “PAPER-64 Constraints on Reionization: The 21 cm Power Spectrum at z = 8.4,” The Astrophysi-cal Journal, 809, 1, 2015, p. 61.
16. S. S. Board, et al., New Worlds, New Horizons in As-tronomy and Astrophysics, Washington, DC, National Academies Press, 2011.
17. A. Datta, J. Bowman, and C. Carilli, “Bright Source Subtraction Requirements for Redshifted 21 cm Meas-urements,” The Astrophysical Journal, 724, 1, 2010, p. 526.
18. I. I. Stefan, C. L. Carilli, D. A. Green, Z. Ali, J. E. Aguirre, R. F. Bradley, D. DeBoer, M. Dexter, N. E. Gugliucci, D. Harris, et al., “Imaging on PAPER: Centaurus a at 148 MHz,” Monthly Notices of the Royal Astronomical Society, 2013, p. stt548.
19. D. C. Jacobs, A. R. Parsons, J. E. Aguirre, Z. Ali, J. Bowman, R. F. Bradley, C. L. Carilli, D. R. DeBoer, M. R. Dexter, N. E. Gugliucci, et al., “A Flux Scale for Southern Hemisphere 21 cm Epoch of reionization experiments,” The Astrophysical Journal, 776, 2, 2013, p. 108.
20. M. Kolopanis, D. Jacobs, P. Collaboration et al., “Multi-Redshift Limits on the 21 cm Power Spectrum from PAPER 64: X-Rays in the Early Universe,” American Astronomical Society Meeting Abstracts, 228, 2016.
21. D. C. Jacobs, J. E. Aguirre, A. R. Parsons, J. C. Pober, R. F. Bradley, C. L. Carilli, N. E. Gugliucci, J. R. Manley, C. van der Merwe, D. F. Moore, et al., “New 145 MHz Source Measurements by PAPER in the Southern Sky,” The Astrophysical Journal Letters, 734, 2, 2011, p. L34.
22. D. C. Jacobs, J. Bowman, and J. E. Aguirre, “The Precision and Accuracy of Early Epoch of Reionization Foreground Models: Comparing MWA and PAPER 32-Antenna Source Catalogs,” The Astrophysical Jour-nal, 769, 1, 2013, p. 5.
23. G. Dorsey, Silicon Sky, New York, Basic Books, 2007.
24. A. Neben, R. Bradley, J. N. Hewitt, G. Bernardi, J. Bowman, F. Briggs, R. Cappallo, A. Deshpande, R. Goeke, L. Greenhill et al., “Measuring Phased-Array Antenna Beam Patterns with High Dynamic Range for the Murchison Widefi eld Array Using 137 MHz Orbcomm Satellites,” Radio Science, 50, 7, 2015, pp. 614-629.
25. A. R. Neben, R. F. Bradley, J. N. Hewitt, D. R. DeBoer, A. R. Parsons, J. E. Aguirre, Z. S. Ali, C. Cheng, A. Ewall-Wice, N. Patra et al., “The Hydrogen Epoch of Reionization Array Dish. I. Beam Pattern Measurements and Science Implications,” The Astrophysical Journal, 826, 2, 2016, p. 199.
26. D. C. Jacobs, J. Burba, J. D. Bowman, A. R. Neben, B. Stinnett, L. Turner, K. Johnson, M. Busch, J. Allison, M. Leatham et al., “First Demonstration of ECHO: An External Calibrator for Hydrogen Observatories,” Publications of the Astronomical Society of the Pacifi c, 129, 973, 2017, p. 035002.
27. D. F. Moore, J. E. Aguirre, A. R. Parsons, D. C. Jacobs, and J. C. Pober, “The Eff ects of Polarized Foregrounds on 21 cm Epoch of Reionization Power Spectrum Measure-ments,” The Astrophysical Journal, 769, 2, 2013, p. 154.
28. C. R. Parashare, A Temperature-Based Gain Calibra-tion Technique for Precision Radiometry, University of Virginia, 2011.

The Radio Science Bulletin No 362 (September 2017) 53
Sub-Millimeter HeterodyneFocal-Plane Arrays for High-Resolution
Astronomical SpectroscopyPaul F. Goldsmith
Jet Propulsion LaboratoryCalifornia Institute of Technology
Pasadena CA 91109 USAE-mail: [email protected]
1. Introduction
Spectral lines are vital tools for astronomy, particularly for studying the interstellar medium, which is widely distributed throughout the volume of our Milky Way and of other galaxies. Broadband emissions, including synchrotron, free-free, and thermal dust emissions give astronomers important information. However, they do not give information about the motions of, for example, interstellar clouds, the fi lamentary structures found within them, star-forming dense cores, and photon-dominated regions energized by massive young stars. For study of the interstellar medium, spectral lines at sub-millimeter wavelengths are particularly important, for two reasons. First, they off er the unique ability to observe a variety of important molecules, atoms, and ions, which are the most important gas coolants (fi ne-structure lines of ionized and neutral carbon, neutral oxygen), probes of physical conditions (high-J transitions of CO, HF, fi ne-structure lines of ionized nitrogen), and of obvious biogenic importance (
2H O ). In addition, high-resolution observations of spectral lines off er the unique ability to disentangle the complex motions within these regions and, in some cases, to determine their arrangement along the line of sight. To accomplish this, spectral resolution high enough to resolve the spectral lines of interest is required. We can measure the resolution of the spectrometer in terms of its resolution, R f f , where f is the rest frequency of the line, and f is the frequency resolution of the spectrometer. More-active sources can be advantageously studied with 53 10R , while more quiescent sources require R as high as 710 .
At optical and infrared wavelengths, such resolutions can be achieved by diff raction gratings and Fabry-Perot interferometers. At sub-millimeter (or far-infrared) wavelengths, such approaches are signifi cantly limited by diff ractions, and they have not been able to reach such high resolution. Heterodyne systems – for which frequency resolution is generally not a limitation, except to the extent that there is a trade-off against signal-to-noise ratio (SNR)
once the lines are resolved – have provided velocity-resolved spectroscopic information that in the past decade has transformed our understanding of the interstellar medium. The interstellar medium is extended over angular scales of many degrees, but has structure on scales as fi ne as have been accessible. To gain a complete picture of its structure thus requires extensive spectral-line images. Building up such a three-dimensional (two angular and one frequency) image one spectrum at a time is obviously time consuming. The development of arrays of heterodyne receivers has been driven by the need to make more-eff ective use of valuable observing time. Such a heterodyne focal-plane array (HPFA), employed in the focal plane of a large telescope, can increase the data rate by a factor equal to the number of elements in the array, and off ers additional benefi ts in terms of calibration and data uniformity.
This paper offers a review of sub-millimeter heterodyne focal-plane arrays, and a selection of some of the recent results that have been obtained. Progress has been so rapid that it cannot be complete, but I hope it will illustrate some of the most important developments. Complementary information can be found in two earlier reviews [1, 2] that also cover longer-wavelength systems, and discuss some topics in more detail than possible here. I omit discussion of system aspects that are essentially the same for heterodyne focal-plane arrays as for single-element receivers, such as calibration. I will indicate some future technological areas that are currently being developed to improve the capability of future heterodyne focal-plane arrays.
2. Coherent Arrays and Focal-Plane Field Sampling
The heterodyne receivers that are being considered here are coherent systems, meaning that they have an output the phase of which is linearly related to that of the input electric fi eld (whether or not we utilize the phase information). This is in contrast to an incoherent system, which has an output proportional to the power input. A

54 The Radio Science Bulletin No 362 (September 2017)
coherent receiver system, whether a heterodyne (mixer) system or an amplifi er-based system, relies on a signal-processing device that is on the order of or smaller than the wavelength of the input signal. To effi ciently transfer energy to the device from the input electric-fi eld distribution produced by the telescope requires transforming the telescope focal-plane distribution, which is much larger than a wavelength in extent, to the much smaller signal-processing device. The latter is generally constructed in a single-mode propagation system, such as rectangular waveguide or microstrip, so that the transformer can also be thought of as a free-space-to-guided-wave transition.
A sub-millimeter transformer can be a feed horn, as widely used at cm and mm wavelengths, or a more optically-inspired transformer, consisting of an antenna combined with a lens. The wide range of wavelengths at which these ideas have been developed has resulted in those coming from shorter wavelengths using the term telescope, while those familiar with longer wavelengths generally refer to the generally parabolic radiation collector as an antenna. I shall use the terms interchangeably in this paper. I will also take the liberty of referring to some review articles on quasioptics and Gaussian beam propagation in which extensive reference lists to original research articles can be found.
We can analyze the coupling in one of two ways. The fi rst is to calculate the electric-fi eld distribution in the telescope focal plane produced by a source. For a point source producing a plane wave in the aperture of the telescope, this distribution is the Airy pattern [3, 4]. The coupling of this electric-fi eld distribution to the fi eld distribution of the feed horn or transformer yields the coupling. Of course, we can vary the parameters of the transformer to optimize the coupling for a given telescope operating at a given wavelength. However, it is often more eff ective to take advantage of the reciprocity theorem [5, 6], and to consider the signal-processing device as radiating a signal that is processed by the transformer to produce an electric-fi eld distribution in the telescope’s focal plane. From this distribution, we calculate the electric-fi eld distribution in the aperture of the telescope, and from this we calculate the coupling to a plane wave. We can also calculate the far-fi eld radiation pattern of the antenna, which enables understanding of how it will operate when observing an extended source. These issues have been analyzed in some detail in a variety of books and articles [6-8].
2.1 Fundamental Gaussian-Beam-Mode Modeling
While precise calculations do require knowledge of the detailed electric-fi eld distribution in a transformer such as a feed horn, it is a fortunate simplifi cation that many of the most important types of transformers can be accurately modeled in terms of having a fundamental-mode Gaussian electric-fi eld distribution. This was examined in
detail initially for corrugated feed horns, which are widely used at centimeter and millimeter wavelengths [9, 10]. However, other types of feed horns, including diagonal [11] and smooth-walled spline-profi le feed horns, widely used at sub-millimeter wavelengths, can be treated in a similar fashion with good results, as well [12-15].
The fundamental Gaussian-beam mode has an electric-fi eld distribution perpendicular to the axis of propagation given by
20 expE r E r w , (1)
where r is the distance from the axis of propagation, w is the beam’s radius, and the electric fi eld can have any polarization state. The fi eld distribution can be normalized to the total power in the Gaussian beam, which is preserved as long as there is no truncation. The minimum beam radius is called the beam’s waist radius, or simply the waist radius, and is denoted 0w . The beam’s waist radius is located at the beam’s waist, and increases in well-known fashion [16, 17] as a function of z, the distance from the waist:
0.52
0 1 cw z w z z , (2)
where cz is the confocal distance, given by
20cz w . (3)
In the far fi eld ( cz z ), the beam’s radius grows linearly with z. From Equation (2), we fi nd
0w z z w , cz z . (4)
2.2 Minimum Element Separation
To avoid truncation, an aperture located at position z should have a diameter 4D w z . From Equation (1), we see that 2r w z gives an electric fi eld equal to 0.018 of the on-axis value, corresponding to a relative power density equal to 43.35 10 , or 34.7 dB. This is suffi ciently small to ensure that the fundamental Gaussian-beam mode can propagate essentially unperturbed. A very important constraint on coherent focal-plane-array systems is that high-quality transformers have 03D w . The numerical factor here comes from least-squares fi tting the fundamental mode to the actual fi eld distribution, as described in [18]. Such transducers cannot be packed together with spacing signifi cantly less than this.

The Radio Science Bulletin No 362 (September 2017) 55
The required value of the beam’s waist radius is determined by the required illumination of the telescope’s aperture. We can think of almost any telescope design as being equivalent to a focusing element (e.g., an antenna’s main refl ector) of diameter MD and eff ective focal length
Ef [6-8]. The focusing element is in the far fi eld of the illuminating Gaussian beam’s waist, which itself is near the focal point of the telescope. The relative power density at the telescope’s edge is given by
2exp 2 2Edge M EP D w f . (5)
The edge taper, ET , is the logarithm of the inverse of EdgePand more commonly one employs
10[dB] 10logE ET T
21010log exp 2 2M ED w f . (6)
Using this with Equation (3) gives us the convenient relationship [18]
0.50 0.216 [dB]E E Mw T f D . (7)
The choice of the optimum value of the edge taper depends on a variety of factors, including whether you want to maximize the aperture effi ciency or reduce the spillover, as well as the size of any central blockage. The value chosen, together with the telescope’s focal ratio, E Mf D , and the wavelength then determine the required radius of the beam waist (in one particular case, the size of the feed horn). The maximum aperture effi ciency for an unblocked circular
aperture is 0.815, which occurs for 2 1.12M ED w f or 10.9ET dB [5]. This gives us the characteristic value for the beam’s waist radius,
0 0.71 E Mw f D , (8)
which in turn demands a minimum feed-element spacing that is three times this value, 2.14EL E MX f D . The minimum spacing of elements of an array in the telescope’s focal plane is thus not 0.5 E Mf D as favored for some types of incoherent arrays, nor the dimensionally-derived E Mf D , but over twice the latter value.
An unblocked circular antenna with a 10.9 dB edge taper has a FWHM beamwidth of 1.17FWHM MD [19]. For a large focal ratio, the size in the focal plane corresponding to the FHWM beamwidth is just Ef times the angular size, or 1.17FWHM EX f D . Comparing this with the spacing of the feed elements given above gives us
1.83EL FWHMX X . (9)
The minimum transformer/array element spacing of any coherent system that effi ciently illuminates the antenna corresponds to an angular spacing on the sky equal to almost twice the FWHM antenna beamwidth. Taking Equation (9) as a lower limit, and allowing for some gap between elements (for, e.g., feed-horn walls or lens mounting), the eff ective constraint is
2EL FWHM . (10)
The pattern of the beams of any such array on the sky will thus leave a large fraction of solid angle unsampled, and the beam spacing on the sky is at least twice the FWHM beamwidth, as is shown in Figure 1. This obviously has a
Figure 1. (left) A schematic of trans-former apertures (e.g., feed horns) in a square confi guration in the telescope focal plane. (right) The corresponding far-fi eld beam pat-terns. The fi lled circles represent the FWHM beam size, which is ap-proximately twice the full width to half maximum beam width, as given by Equation (10).

56 The Radio Science Bulletin No 362 (September 2017)
large impact on the observing strategy required to obtain fully-sampled images with coherent focal-plane-array systems.
2.3 Heterodyne Focal-Plane-Array Geometry
In sub-millimeter heterodyne focal-plane arrays implemented to date, only two geometries have been employed, and these are the same geometries as have been used at longer wavelengths. They are a square grid and a hexagonal grid of array elements. While the minimum elements and beam spacing are the same, the fi lling factor is higher for the hexagonal grid: the focal-plane area fi lling factors with no gaps for these are 0.079 for the square array and 0.091 for the hexagonal array. The hexagonal grid array thus has a slightly higher density of beams on the sky, and is more effi cient for small sources (of a size between that of the beam and the footprint of the array). The square-grid array off ers advantages in terms of ease of assembly of components into a modest number of array elements in a row, from which a two-dimensional array can be assembled. The seven-element CHAMP+ [20] and upGREAT [21, 22] are hexagonal-grid arrays, while the 16-element HARP [23] and 64-element SuperCam arrays [24,25] are square-grid arrays.
Until very recently, the numbers of elements in heterodyne focal-plane arrays have been so small that there was really no issue with the ability to effi ciently couple energy from the telescope to an element in the array: telescope aberrations resulting in non-ideal electric-fi eld distributions in the focal plane (or distorted far-fi eld patterns, thinking reciprocally as introduced above) were not a serious issue. However, with increased capabilities, the number of pixels has increased, and telescope-imposed constraints have to be considered. One of the most straightforward is the limitation on the overall diameter of the beam that will fi t through the telescope’s optics. This is exacerbated by the relatively large focal ratio employed at Nasmyth or other focal positions that avoid motion in elevation. The limit can be the tertiary or a subsequent element, or the clear diameter through the elevation bearings. The secondary focal ratio,
13.8E Mf D , together with limited elevation-bearing clearance on the Heinrich Hertz sub-millimeter telescope, required the addition of signifi cant re-imaging optics for SuperCam operating at 345 GHz [24].
The Nasmyth focal ratio for SOFIA is 19.7, and 49141Ef mm [26], corresponding to a plate scale of
0.24 mm per arcsecond. At a wavelength of 0.158 mm (the fi ne-structure line frequency of C+), an optimal feed will have a waist radius equal to 2.2 mm, and an element diameter of 6.6 mm. Allowing for a somewhat larger spacing, the diagonal size of a 10 × 10 element array is the maximum that can fi t through the Nasmyth tube of diameter 114 mm. Direct illumination of the SOFIA telescope would lead to prohibitively long feed horns with
excessive loss. The solution is to re-image the telescope’s focal plane to allow physically smaller waist and feed-horn sizes and beam spacings.
This is really part of a bigger issue, which is that as the wavelength decreases, so does the aperture size of the transducers (coupling devices) in the array, and thus the area available per pixel. While the actual size of the active mixer (superconductor-insulator-superconductor, HEB) or amplifi er (MMIC) employed is extremely small – and to some degree, diminishes in proportion to the wavelength – the size of the connectors and bolts to hold pieces together cannot readily be reduced past a certain point. There thus has to be a change in the approach employed at some wavelength, which essentially involves a larger number of array elements in a single housing, possibly with IF amplifi ers to avoid connectors. This does lead to concerns about device yield and reliability, testing, and replacement of individual components, all of which have to be addressed at a systems level for future large-format sub-millimeter heterodyne focal-plane arrays.
2.4 Free-Space-to-Guided-Wave Transformer Elements for HPFAs
The transformers (free-space-to-guided-wave transitions) used in arrays are generally just the same designs as used in a single-element receiver. The challenge is to pack them together as closely to the minimum spacing as possible. At the same time, system issues arise, including actual fabrication and assembly procedures, and servicing the signal-processing elements. The upGREAT array, operating on NASA’s SOFIA observatory, uses seven individual mixers in a hexagon-plus-central-element confi guration [22]. Each element employs an electroformed smooth-walled spline feed horn. With the chosen telescope illumination, the spacing of beams on the sky is 2.2 FWHM beamwidths [21]. While millimeter- and longer-wavelength arrays have generally employed individual feed horns (possibly modifi ed to allow closer-than-standard spacing [27]), the smaller size characteristic of sub-millimeter arrays has led designers to integrate transformers into groups. In the case of the SuperCam 345 GHz array, eight elements, each with a diagonal horn, are machined as a unit, and eight such linear arrays are assembled to form the fi nal 64-element array [24]. In order to minimize cost and simplify assembly and alignment, direct machining of multiple feed horns in a single block is attractive, particular when combined with multi-fl are angle horns, which can be very effi cient [12-15]. One such realization for 1.3 mm operation with 37 elements was described in [28].
This approach is increasingly attractive as the wavelength decreases, although machining tolerances become a concern even while the overall physical dimensions of an array with a given number of elements decreases. Recent work at JPL resulted in a 16-element array for 1.9 THz employing hot-electron bolometer mixers

The Radio Science Bulletin No 362 (September 2017) 57
and drilled profi led feed horns. The element spacing was 2.5 mm and the feed-horn diameter was 2.0 mm. There did not appear to be any problem from the point of view of fabrication in reducing the spacing-wall thickness to 0.1mm, which would reduce the spacing to 2.1 mm. As seen in Figure 2, direct drilling into a copper block combined good thermal properties with simplicity in fabrication [29, 30]. A circular-to-rectangular waveguide transition was machined for each element, and the back side of the block was machined to accept the hot-electron bolometer mixers, fabricated on small silicon substrates. The 16-element unit was completed by a back plate that also functioned as a back-short for each waveguide.
Free-space-to-guided-wave transformers, incorporating a planar antenna combined with a lens of approximately hemispherical shape, have been extensively used in single-element sub-millimeter heterodyne systems [31]. Recent work has taken up this approach, and currently-available powerful electromagnetic modeling allows optimization, with results at 545 GHz showing good agreement with theory [32]. This approach is extendable to focal-plane arrays with modern silicon fabrication techniques, allowing impressive accuracy [33]. The packing effi ciency (the ratio of the lens diameter to the waist radius and the lens center-to-center separation) of such an approach should be reasonably high, although this aspect of performance has not yet been emphasized.
2.5 HFPA Confi guration and Imaging
As discussed earlier, the minimum beam spacing on the sky of a reasonable telescope feed by an array with essentially close-packed elements is twice the FWHM beamwidth. Most of the sources being observed using sub-millimeter spectral lines are extended beyond the footprint of the array on the sky, and a spectral-line image from a heterodyne focal-plane array should ideally have pixels separated by the Nyquist-sampling interval( 2PIXEL D for a telescope of diameter D) in both dimensions. To achieve this, motion of the array beams on the sky is necessary. This can be implemented by scanning the entire telescope or, to a limited extent, by the motion of an optical element between the telescope’s primary and the receiver. Half-beam sampling ( 2FWHM ), somewhat coarser than Nyquist sampling, is often a compromise to reduce the required observing time.
Figure 2. A 16-element 1.9 THz mixer array with smooth-walled spline feed horns in a square grid confi guration. The block, including circular-to-rectan-gular waveguide transitions and pockets to hold the hot-electron-bolometer mixers, was directly machined from copper (photograph courtesy of J. Kawamura, JPL; see [29]).
Figure 3. The rotation of a square array by 14.5 to achieve half-FWHM beamwidth spacing per-pendicular to the scan direction. The illustration is for the 16-elment HARP array on the JCMT [23], but is applicable to any square array with
16 elements.

58 The Radio Science Bulletin No 362 (September 2017)
With a fi lled (6+1) hexagonal array, choosing the scanning direction to be at an angle of 19.1° relative to the hexagon’s vertices results in the seven beams being equally spaced perpendicular to the scan direction. The beam spacing perpendicular to the scan direction is very close to one-third of the beam spacing on the sky, and approximately two-thirds of the FWHM beam size. This has been utilized for some time by arrays having this geometry [18, 20]. The resulting image is still under-sampled in the direction perpendicular to the scan direction, which can be remedied by a second scan off set by one beamwidth, giving approximately Nyquist sampling perpendicular to the scan direction. The outputs from each element have to be integrated for some fi nite period, enlarging the beam size somewhat along the scan direction, but samples can still be taken at suffi ciently short intervals that the resulting image is properly sampled.
For a nine-element square array, rotation by 14.04° relative to the scan direction produces equally spaced beams with one-third or 2 3FWHM spacing [34]. (The rotation angle is given as 14.48° in this reference). For a 16-element square array, rotation by 14.48° relative to the scan direction results in a spacing of beams perpendicular to the scan direction of one-quarter of the beam spacing, or close to 2FWHM , which is extremely helpful in making well-sampled maps [23]. The confi guration for a 16-element square array is illustrated in Figure 3. This general approach to scanning can be advantageously applied to square arrays with 16 or more pixels, giving Nyquist sampling perpendicular to the scan direction with a single scan for 25elementN , leading to highly effi cient imaging.
Figure 4 shows six of the seven 2 THz mixers of the upGREAT array utilizing a fi lled hexagon (6+1) confi guration [21, 22]. This system has been extremely successful in producing high-spectral-resolution spectra
and images at 1.46 THz, 1.9 THz, and 4.75 THz, the frequencies of the fi ne-structure lines of the key constituents of the interstellar medium N+, C+, and O0, respectively. The hexagonal geometry does not appear to be particularly valuable for larger arrays, which are easier to fabricate in a Cartesian geometry, and for which alignment issues may be much simplifi ed. For almost any array confi guration, a scanning strategy can be developed that minimizes the beam separation perpendicular to the scan direction. An important practical consideration is that diff erent elements may well have diff erent sensitivities, and having a one-to-one correspondence between a pixel in the image and an element in the array may not be optimum.
An on-the-fl y mapping strategy that has each pixel on the sky observed by multiple elements of the array may result in more uniform noise and better calibration, even though more independent scans are required than the minimum-beam-separation approach. Scanning parallel to an array axis results in a high redundancy in the sense of a given map pixel being observed by multiple array elements. The integration time per element per pixel must be reduced, since for each pixel, data from multiple elements will be combined. A more-rapid scan speed is thus required. For very large maps, there is in the end no advantage in time between scanning with a “special” angle to get the best possible sampling with a single scan, and repeating the map made with gaps between the strips on the sky with small off sets to achieve the desired sampling. For fast sampling with many-element arrays and spectrometers with many channels, the data rate may become a problem, however.
3. Mixer Elements for HFPAs
Early sub-millimeter receivers employed Schottky diode mixers, and at least one focal-plane array (operating in the 3 mm wavelength range [35]) used this type of down-converter. By the time that people were seriously considering heterodyne focal-plane arrays, these had been supplanted by two more-sensitive technologies, the superconductor-insulator-superconductor (SIS) mixer and the hot-electron bolometer (HEB) mixer. Each of these has had a wealth of articles describing advances in the state of the art. Including even a representative sample of these is outside the scope of this article focusing on focal-plane arrays. Moreover, each of the articles cited here about a particular array includes a discussion of the mixer employed. I will thus give only a very brief overview of general characteristics, together with a limited selection of references.
Unless special eff orts are made, mixers respond to two frequency bands that are off set from the frequency of the local oscillator by an amount equal to the frequency of the IF amplifi er. The band with frequency greater than that of the local oscillator is called the upper sideband (USB), and that with frequency lower than the local oscillator is referred to as the lower sideband (LSB). Without such eff orts (e.g., phasing circuits in RF and IF, which are well-
Figure 4. Six of the seven 2 THz mixers in a fi lled hexagon (6+1) confi guration, on mounting structure used in the upGREAT LFA array. The central seventh element was independently mounted. The beams from the smooth-walled spline-profi le feed horns were brought together in a centrally-mounted arrangement of parabolic mirrors (from [21]).

The Radio Science Bulletin No 362 (September 2017) 59
known from millimeter-wave experience, or appropriate setting of waveguide back-short at a large distance from the nonlinear element to diff erentiate between two sidebands), we have a double-sideband mixer. A mixer can be designed to down-convert only a single sideband (single-sideband or SSB mixer), or, using the phasing approach, can have separate outputs for the upper and lower sidebands (2SB mixer). If the mixer is sensitive to both sidebands, a single sideband can still be selected by the optics preceding the mixer, as discussed in Section 4.3.
3.1 SIS Mixers
The principles behind the operation of superconductor-insulator-superconductor mixers and limits on their performance were discussed thoroughly in early articles that clear established the potential for these devices to off er near-quantum-noise-limited performance [36, 37, and references therein]. The I-V characteristic of the tunnel junction has an extremely strong nonlinearity, and the presence of radiation induces photon-assisted tunneling steps onto the dc I-V curve. In principle, the result is that each incident photon can generate a carrier fl owing through the junction, which leads to the possibility of quantum-noise-limited performance. Initial development of superconductor-insulator-superconductor mixers occurred at millimeter wavelengths (e.g., frequency 100 GHz), since lower frequencies had transistor amplifi ers, parametric amplifi ers, and masers off ering performance often limited by other factors, such as atmospheric and ground pickup.
The astronomical interest in millimeter wavelengths had been growing at a rapid pace since the 1970’s, driven to a large degree by the discovery of a stupendous variety of molecules in interstellar clouds. The state of the art for low-noise receivers was soon almost entirely defi ned by superconductor-insulator-superconductor mixers at
frequencies up to many hundred GHz, developed for use on a variety of ground-based radio telescopes [37-39]. The Atacama Large Millimeter/Submillimeter Array (ALMA), which until now has relied almost entirely on superconductor-insulator-superconductor receivers [40], provided additional major impetus for development of superconductor-insulator-superconductor receivers up to 1000 GHz. The Herschel Space Observatory off ered complete freedom from atmospheric absorption, which is a major impediment to low-noise systems even from mountain sites. The Heterodyne Instrument for the Far-Infrared (HIFI) employs dual-polarization superconductor-insulator-superconductor receivers in fi ve bands, extending from 480 GHz to 1250 GHz [41], with the upper frequency limit set by the bandgap of the Nb/Nb-alloy junction employed.
Incorpora t ing superconductor- insu la tor-superconductor mixers into focal-plane arrays at millimeter and sub-millimeter wavelengths has been demonstrated in a variety of confi gurations over a wide range of frequencies (e.g., [20, 22, 24, 42, 43]). Challenges arise from the number of lines required for controlling the mixer bias, the current of the magnet (required to suppress Josephson tunneling of Cooper pairs), and the IF output. These have been overcome for arrays up to 64 pixels [24, 25], which achieved just over 2 FWHM spacing on the sky, despite the number and variety of connections to each element required. Figure 5 gives two views of an eight-element column of this array, with the upper view including the electromagnets used for Josephson-current suppression. The aperture size of the diagonal horns employed was suffi cient to allow only nominal gaps between the corners of feed horns in adjacent columns, giving close-to-minimum spacing of the beams on the sky. This challenge becomes greater at shorter wavelengths, where the transformer or feed-horn size for a given focal ratio decreases, demanding closer packing of the array elements to achieve the minimum 2 FWHM beam spacing on the sky.
Figure 5. A view of one eight-element column of SuperCam elements. The upper view shows the electromagnets used to suppress the Josephson cur-rent in the superconductor-insulator-superconductor mixers, and the diagonal feed horns. The spacing of adjacent columns was just greater than the diagonal dimension of the feed horns, and was greater than the size of the electromagnets, allowing nearly minimum 2FWHM beam spacing on the sky (from [24]).

60 The Radio Science Bulletin No 362 (September 2017)
3.2 HEB Mixers
In a material for which the electrons are only weakly coupled to the lattice, radiation can be absorbed by the electron gas, which achieves a well-defi ned temperature higher than that of the lattice temperature. Such a hot electron gas can function as a bolometer with a very short time constant. Such a device is appropriately called a hot-electron bolometer. If a locally produced signal of appropriate magnitude is introduced along with a signal at a diff erent frequency, the nonlinear response of the electrons results in mixing action, with an IF signal at the diff erence of the two signals being produced. This was the basis for the hot-electron bolometer mixer, employing bulk InSb cooled to 4K, designed for astronomical observations in the 90 GHz to 140 GHz range [44]. This type of hot-electron bolometer mixer was used for observations at 230 GHz [45] and 490 GHz [46], illustrating the independence of the eff ect on input frequency. The coupling between the electrons and lattice for this material and confi guration limited the IF bandwidth to 2 MHz, making it necessary to tune the local oscillator even for spectral-line observations. The rapid development of low-noise cooled Schottky barrier diode mixers with multi-octave IF bandwidths and modest LO power requirements (e.g., [47]) left limited scope for the use of the InSb hot-electron bolometer mixer technology in astronomy.
Interest in hot-electron bolometer mixers revived almost 20 years after the work on InSb, with the realization that the superconductor NbN, biased near the resistive state, exhibits hot-electron eff ects [48], and in that if fabricated in the form of microbridges, the response time can be made rapid enough to have GHz IF bandwidths. The response time is determined by electron-phonon coupling and rapid phonon escape (denoted “phonon-cooled” [49]), or by rapid diff usion of the hot electrons to a heat sink formed at the ends of the microbridge (denoted “diff usion-cooled” [50]). This device has many attractive features [51], and was rapidly adopted for systems at frequencies above those where superconductor-insulator-superconductor mixers could operate. Some examples of relatively early systems spanning 692 GHz to 5250 GHz were given in [52-55].
Continued development of hot-electron bolometer mixers has resulted in noise temperatures in the range 800 K to 1000 K (DSB) at all sub-millimeter wavelengths (see above references and [56]). The geometry of the small-area microbridge between two much larger conductors is amenable to connection to either microstrip for coupling to waveguide and from there to feed horns [53, 54, 57], or to planar antennas [55, 56]. The noise temperatures corresponded to 20 times the quantum limit at 1000 GHz, and 4 times at 5000 GHz. There is thus still room for considerable improvement, especially at longer sub-millimeter wavelengths.
The local oscillator power absorbed by the hot-electron bolometer itself is typically 100 nW to 300 nW,
but the LO power incident on the mixer itself needs to be up to an order of magnitude greater [53, 57], so that 1W per element is required for an array. A modest number of array elements can be pumped by frequency-multiplied sources at frequencies up to 3 THz at the present time, and by quantum-cascade lasers at higher frequencies (discussed further in Section 4).
The electron gas relaxation time limits the IF bandwidth, so that while bandwidths up to 4 GHz have been reported, the receiver noise temperature can easily be a factor of two higher at the upper limit of the IF than it is below 1IFf GHz [55]. The restricted instantaneous bandwidth of hot-electron bolometer mixers is one impetus behind the search for new materials that might off er faster relaxation times and thus greater IF bandwidth. One such material is magnesium diboride ( 2MgB ) [58, 59]. While the stronger rapid electron-phonon interaction should allow signifi cantly increased IF bandwidths, reported results still showed very signifi cant increases in noise temperature when comparing IF frequencies of a few GHz to the vicinity of 10 GHz [60, 61]. Another virtue of 2MgB is its relatively high superconducting-transition temperature,
39cT K [61], which in principle can allow operation at signifi cantly higher physical temperatures compared to, e.g., NbN. A possible issue, especially for arrays, is that the local oscillator power required will be larger than for devices having lower cT .
Incorporation of hot-electron bolometer mixers into arrays is relatively straightforward, but there are some challenges. There are no magnets required to suppress Josephson currents as for superconductor-insulator-superconductor mixers, but cabling is still a challenge. One extra demand of hot-electron bolometer mixers is that they are relatively sensitive to LO power, unlike Schottky or superconductor-insulator-superconductor mixers that operate well as long as the LO power is above a certain threshold. Measurements of mixers designed for Herschel showed that a change of 50% in the local oscillator power from its optimum value increased the mixer noise by a factor of two [62]. This indicates that (1) the LO power level must be carefully controlled to ensure receiver stability, and (2) device fabrication and other variations mean that individual hot-electron bolometer mixer elements may require diff erent LO power levels for optimum operation. The former applies for both single-element systems and arrays, while the second is signifi cant only for arrays.
3.3 Possibilities for the Future
Superconductor-insulator-superconductor mixers are the favored down-converter element for HPFAs at longer sub-millimeter wavelengths, but are currently limited to 1100 GHz by the superconducting bandgap. There is ongoing work to extend superconductor-insulator-superconductor technology to higher frequencies, where some of their advantages – notably, low noise (compared

The Radio Science Bulletin No 362 (September 2017) 61
to the quantum limit) and high instantaneous bandwidth – will be important. These may outweigh the system complexity engendered by having to employ a magnetic fi eld to suppress the Josephson current in the devices. hot-electron bolometer mixers do not approach the quantum noise limit as closely as do superconductor-insulator-superconductor mixers, but their lower local-oscillator power requirement becomes particularly important if broadly tunable frequency-multiplied sources are employed, as contrasted to much higher power but diffi cult-to-tune quantum-cascade lasers. Finally, monolithic microwave integrated circuit (MMIC) amplifi ers, which have achieved noise temperatures only a few times the quantum noise limit at 100 GHz [63, 64] are already being used in focal-plane arrays in this frequency range [27, 65]. InP high-electron-mobility transistor (HEMT) MMIC amplifi ers are rapidly moving upwards in frequency, and have respectable but far from quantum-limited noise temperatures well into the sub-millimeter-wave region [66, 67]. These devices have several signifi cant advantages from a systems engineering standpoint, especially for space missions. These include (1) the ability to work over a wide temperature range ( 15K to 300 K); (2) the noise temperature decreases and the gain increases with decreasing physical temperature, but without any hard requirement; (3) very large instantaneous bandwidth can be achieved, allowing simultaneous observation of multiple spectral lines; (4) the absence of sideband gain-ratio issues, which are a challenge for mixers or increase system complexity. How far their upper frequency limit will extend and how low a noise they can achieve will determine to what degree they can supplant mixers as the fi rst element in sub-millimeter heterodyne focal-plane array receivers.
4. Array Optics and Local Oscillator Generation,
Distribution, and InjectionSub-millimeter arrays quite naturally make extensive
use of free-space propagation, as loss in waveguide and other guided-wave media is excessively large for all the required functions to be implemented in such transmission media. As discussed in Section 2, the transverse dimensions of optical elements when measured in wavelengths dictate that diff raction will play a signifi cant role, so that quasioptical propagation will determine beam growth and dictate the required size of diff erent types of components (e.g., [8]). The articles describing the various sub-millimeter heterodyne focal-plane arrays that have been designed and built are the best source of information about adopted practices, and often themselves give references to more-basic articles. The actual active devices, whether mixers or amplifi ers, are far, far smaller than a wavelength, so the optical system must couple to them via a free-space-to-guided-wave transformer, as discussed in Section 2.4.
The most important functions provided by the optical system include re-imaging of the array beams and local-oscillator injection. Optical single-sideband fi ltering and image rotation are employed in some systems, as discussed in the following sections.
4.1 Re-Imaging
Re-imaging the focal plane is required if the focal ratio of the telescope is not compatible with the capabilities
Figure 6. A schematic of the re-imaging optics used in the upGREAT receiver. The focusing elements (off -axis mirrors) are denoted by vertical black lines, labeled by their focal lengths and inter-element distances in mm. The combinations of pairs of focal lengths defi ne the two Gaussian-beam telescopes, denoted GT 1 and GT 2 (from [21]).

62 The Radio Science Bulletin No 362 (September 2017)
of the transformers or feed horns coupling energy to the individual elements of the focal-plane array. For example, the SOFIA telescope’s focal ratio is 19.6E Mf D . For a 13 dB edge taper as used in the upGREAT system, from Equation (7), at the 158 m wavelength of the ionized-carbon fi ne-structure line, then the beam’s waist radius
0 2.4w mm, and the nominal feed-horn diameter would be 7.2 mm. Such a horn would be diffi cult to construct, as it would need to either be extremely long, or to have a phase-correcting lens at its aperture. Instead, a quasioptical re-imaging system is far preferable. A schematic of the system described in detail for upGREAT from [21] is shown in Figure 6. In the fi gure, “GT” stands for Gaussian-beam telescope. This is a pair of focusing elements separated by the sum of their focal lengths, which off ers frequency-independent transformation of the beam’s waist radius. The fi rst Gaussian-beam telescope transforms the waist of each beam in the telescope’s focal plane to that required for the LO diplexer, and the second transforms the beams’ waist radii to couple properly to the feed horns of the array.
Focusing elements can be either lenses or mirrors. Lenses have some advantages in terms of mechanical layout, but require surface treatment to control refl ection loss. While mirrors are essentially free of absorptive loss, which is a factor for lenses, other considerations make the choice less than obvious. Off -axis optical elements produce cross polarization and beam distortion, which can be appreciable for large off -axis angles and divergent beams. The use of this type of focusing element thus does put constraints on the overall system layout [18]. Some materials, notably sapphire, have impressively low loss at cryogenic temperatures, and the application of dielectric-fi lm antirefl ection coatings has been shown to be eff ective and reliable.
A variety of other considerations must be taken into account for optical design for sub-millimeter arrays. The diameter of a focusing element in a system propagating a single fundamental Gaussian-beam mode must be chosen to be at least four times the beam radius, w, at that element. This is in order to avoid beam truncation, which not only loses power from spillover, but results in higher-order modes due to the beam profi le being less purely Gaussian. For an array, we have a number of well-separated beam waists in the telescope’s focal plane, and in the plane in which the feed horns or other free-space-to-guided-wave transformers are located. In between, the beams signifi cantly overlap, and the overall size of the array beams can be much less than the sum of the individual beams. This is seen nicely in Figure 6, where at the intermediate beam waist of each Gaussian beam telescope, the beams are almost entirely overlapping. These are the locations at which to put components of limited transverse dimensions, such as a Dewar window.
4.2 Local Oscillator Generation, Distribution, and Injection
The generation, distribution, and injection of the local oscillator (LO) into the mixer elements of a heterodyne focal-plane array can be entirely separate tasks, or they can be highly interrelated. Starting with the generation of the local oscillator, we have sources that oscillate themselves at the frequency of interest. As local oscillators, optically pumped lasers have largely been abandoned, due to their bulk and power consumption, and diff erence-frequency generation does not produce an adequate power level. The only widely-used photonic local-oscillator source – the niche for which, at the present time, is at shorter sub-millimeter wavelengths – is the quantum cascade laser (QCL) (see [68, 69] and references therein). These lasers depend on a cavity fabricated in the semiconductor material to set the frequency of oscillation, which gives good spectral purity. The quantum cascade laser’s frequency can be somewhat tuned using the bias voltage and temperature. For astronomical spectroscopy, they can be frequency-locked [70] or phase-locked [71], but the frequency stability of the free-running quantum cascade laser may be suffi cient that this complexity can be avoided.
Quantum cascade lasers have relatively high power (0.1 mW to 1 mW), which obviously makes pumping the elements of an array relatively straightforward by power division. Early quantum cascade lasers were handicapped for use as local oscillators due to highly non-Gaussian beam patterns and low coupling effi ciency, but this has been improved [72]. At the present time, these devices must be operated at cryogenic (10 K to 77 K) temperatures, at which 1 W of power is dissipated. A complete sub-millimeter radiometer employing a quantum cascade laser was described in [73]. This quantum cascade laser included 21 lasers fabricated together, having frequencies spaced by 7.5 GHz, giving an overall tuning range of over 100 GHz around 4700 GHz.
The second widely-used approach for sub-millimeter local oscillators is frequency multiplication of a low-frequency oscillator. The fundamental oscillator can be at almost any frequency but is typically at 10 GHz to 40 GHz. Multiplication is by a cascade of multiplier stages, usually frequency doublers and frequency triplers. This approach was extensively used for the local-oscillator system of the Herschel HIFI instrument [41]. Cascaded multiplier chains are generally modestly tunable over a fractional bandwidth of 10% , but which is generally less than that of the mixers they are pumping. Since the total effi ciency of the chain is quite low, the total RF power and the dc power dissipation can be an issue, especially for arrays. The effi ciency generally decreases with increasing frequency, due to the increased number of cascaded multiplier stages required.

The Radio Science Bulletin No 362 (September 2017) 63
The performance of frequency-multiplier local-oscillator chains that have been reported include power outputs of 1.5 mW at 850 GHz to 900 GHz [74], 35 W at 1500 GHz [75], and 20 W at 1880 to 1940 GHz [76]. These numbers were all for multiplier-chain physical temperatures of 120 K, which did produce a 25% improvement in output power compared to ambient-temperature operation. These numbers should not even be taken as the current state-of-the art, as major increases in effi ciency and output power are being made at the present time. However, the relatively limited output power relative to the requirements of hot-electron bolometer mixers at shorter sub-millimeter wavelengths indicates that only a limited number of elements can be pumped by a single frequency-multiplied local-oscillator source.
A commonly used component at microwave and millimeter wavelengths is the balanced mixer, in which two mixers are used together with appropriate phase shifts from hybrid power junctions to allow the local oscillator and signal from separate input ports to both couple to the mixers. This is generally referred to as a balanced mixer, inasmuch as the use of a pair of mixers, if properly balanced, can cancel out noise that may be present on the local oscillator. This has been successfully used at a frequency of 2.7 THz [77], giving noise performance comparable to that of the individual mixers. However, balanced mixers have not been used in any sub-millimeter array with published results. This is likely due to the increased complexity of high-precision waveguide machining, having two mixers, and the increased size resulting not only from two mixers and an RF hybrid, but from the necessarily relatively large IF hybrid, as well. However, with a nominal insertion loss of only 3 dB for the local oscillator, they do become increasingly attractive when local-oscillator power is limited.
For array systems at the present time, we thus have to consider how the local oscillator is divided among the array elements, and how it is injected into the individual mixers. Some diff erent schemes for realizing this are shown in Figure 7. Figures 7a-7c illustrate diff erent variations on parallel power division. In Figure 7a, we start from a fundamental source – most likely, a quantum cascade laser – and divide it among the array elements. The division can be carried out by waveguide power division, by quasioptical beamsplitters [8, 23], by a Fourier grating [78, 79], or by a collimating Fourier grating [80].
The power division is followed by coupling into the individual mixers of the array. This task is most commonly carried out either by a dielectric beamsplitter, or by an interferometer. The beamsplitter approach is very simple and broadband. However, it typically utilizes a 10 dB beamsplitter, meaning that only 10% of the available local oscillator power is used, while the rest is wasted (and must be absorbed in a beam dump). A direct consequence of the splitter is that 10% of the signal is wasted as well, which is generally judged to be an acceptable loss. The interferometer approach is most commonly based on a dual-beam interferometer [8, 18, 81]. This approach uses signal and local oscillator power much more effi ciently, but at the price of much greater mechanical complexity (the system must in general be tunable) and optical constraints (each type of interferometer requires a minimum beam-waist radius to have low loss), as well as some limitation on the IF bandwidth, due to the characteristic response of the interferometer. For many-element focal-plane arrays, the diffi culty of having the interferometer be properly tuned for all beams is an additional challenge, but one that should be possible to overcome by careful optical design.
Figure 7. A schematic of diff erent approaches for dividing the local oscillator among diff erent elements of the HPFA. (a) A fun-damental local oscillator (e.g., a quantum cascade laser) divided among diff erent ele-ments. The division can be carried out by quasioptical power-dividing grids or by a Fourier grating. The diagonal dashed lines represent the injection paths, which could be quasioptical dielectric beam splitters, interferometers, or (in principle) waveguide couplers. (b) The same approach but with a lower frequency source, multiplied by a factor N before division and coupling to the array mixers. (c) An approach in which the frequency multiplication is in part before power division, and in part after. (d) Series power division, in which a certain fraction of the local oscillator power is coupled from the main line to the individual mixers, in succession.

64 The Radio Science Bulletin No 362 (September 2017)
Figure 7b shows the same approach, but with a frequency-multiplied source, which is not diff erent in any fundamental way from Figure 7a. A waveguide power divider is followed a frequency-multiplied source [24]. With this confi guration, a single dielectric beamsplitter could serve as the local-oscillator coupling element for all 64 mixers.
Figure 7c illustrates a variation in which there are active frequency multipliers both before and after the power division. All of the multiplier stages are in waveguide, as is the power division. The frequency at which the power division occurs is a tradeoff based on what power amplifi ers are available at what frequencies. This approach has the advantage that the fi nal multiplier stage has to deliver power suffi cient to pump a single mixer, as compared to, e.g., Figure 7b, were all of the array mixers must be pumped by a single multiplier. It has a second major advantage in that the power output of each element of the local-oscillator array can be independently adjusted. This is particularly valuable for pumping hot-electron bolometer mixers, which as noted above are relatively demanding in terms of local-oscillator power in order to obtain optimum noise performance. The negative aspects of this approach are the large number of active components required, and the resulting total power dissipation. The various frequency-multiplication stages can be distributed between ambient temperature and cryogenic locations as dictated by constraints on cooling capacity. The fi nal stage(s) could even be integrated with the individual mixers in the heterodyne focal-plane arrays.
Figure 7d illustrates a rather diff erent approach, in which each in a series of couplers takes a certain fraction of the power fl owing down the main line, and couples it to a mixer. This can be done using either waveguide [35] or quasioptical [23] propagation. If the coupling values are all the same, the mixers will systematically get diff erent amounts of local-oscillator power. However, if the coupling values can be selected, the power made available to each mixer can be relatively uniform, and the overall effi ciency of use of the local-oscillator power can be signifi cantly higher than in the parallel power division confi gurations shown in Figures 7a through 7c.
4.3 Single-Sideband Filtering
Mixers made from a single nonlinear element (Schottky, superconductor-insulator-superconductor, or hot-electron bolometer) are typically sensitive to input frequencies both higher and lower than the local-oscillator frequency, within the two bands defi ned by the bandwidth of the IF system. These systems are thus referred to as double-sideband or DSB mixers. As discussed at the start of Section 3, a pair of such mixers can be combined, using two 90° hybrid junctions – one at RF and one at IF – and one RF in-phase power divider, to make a single sideband or SSB (also referred to as a sideband-separating or 2SB) mixer. In such devices, there are generally two IF output
ports, one for the upper and one for the lower sideband [40, 82, 83]. This is in principle a great advantage for spectroscopy, as spectral lines may well be present in both sidebands. Having them separately available for analysis avoids overlaps and blending, as well as improving the situation for input noise-like signals common to both sidebands (e.g., atmospheric or telescope emission), which is folded from both RF sidebands into the single IF output by a double-sideband mixer, but kept separate by a single-sideband mixer.
The ratio of the response in the two sidebands is referred to as the sideband-gain ratio or the image-rejection ratio. It often does not signifi cantly exceed 10 dB in real sub-millimeter mixers, likely due to manufacturing imperfections in the waveguide circuitry employed. In some situations it may be possible to correct for this by replacing the IF quadrature hybrid by a digital version that can have programmed phase shifts based on maximizing the sideband-gain ratio [84]. Since even spectral-line systems are generally calibrated using a blackbody source, this sideband-gain ratio is not readily measured. It can be determined by laboratory measurements with spectral-line sources, which can be quite tedious when large RF and IF bandwidths are involved. Astronomical observations of spectral-line-rich sources off er an important additional calibration tool [85]. This is especially important for space missions, where hands-on calibration cannot be used to verify post-launch operation including the sideband-gain ratio.
All of the above considerations apply to heterodyne focal-plane arrays as well, but to date, arrays have not utilized the single-sideband/2SB mixers discussed above. Rather, the same dual-beam quasioptical interferometers used for local-oscillator injection discussed above have been employed. The HERA array is a lone standout among the arrays included in Table 1, in that it achieves single-sideband operation by having the mixer back-short positioned to tune only a single sideband and, to a level of 10 dB, suppress response in the opposite sideband [34]. Rather, the approach most widely adopted to achieve single-sideband operation is to employ double-sideband mixers and to select a single by means of a tunable quasioptical fi lter, e.g., [23].
4.4 Image Rotation
Inasmuch as almost every sub-millimeter telescope employs an azimuth-elevation mount, the image of a given fi eld being tracked rotates as a function of time. For a single on-axis element, this produces only a rotation of the plane of polarization to which the array is sensitive, if linear polarization is employed. For an array, the direction of the beam corresponding to each element of the array changes with time. This can simply be ignored if large-scale relatively rapid mapping is the mode of observation. While the directions of the scan will change, the computer software can be written to compensate for this to ensure

The Radio Science Bulletin No 362 (September 2017) 65
that the images of individual “scan blocks” properly fi t together. However, for longer integrations on a particular fi eld, it is necessary to hold the rotation angle of the array fi xed relative to the sky.
Some of the techniques that have been developed to achieve this are included in Table 1. A straightforward approach is to mechanically rotate the receiver. This may be undesirable or impractical, in which case the use of an optical “K mirror” is quite commonly used. In this confi guration, the array of input beams goes through a series of refl ections from a mirror on the axis of propagation of the array beams, but inclined to it. The beams then refl ect from a second mirror off of the original axis, and with its normal perpendicular to the original axis of propagation. Finally, the beams refl ect from a third inclined mirror that is on the beam axis. The inclinations of the two on-axis mirrors and the distance to the second mirror are arranged so that at the output of the K mirror, the array beams are traveling in their original direction and along their original axis of propagation. However, rotation of the off -axis mirror by angle around the axis of propagation results in rotation of the array’s pixels relative to their original orientation by angle 2 .
A K mirror is employed in almost half of the heterodyne focal-plane-array systems included in Table 1, and it is generally not a problematic aspect of the overall system. There is obviously some loss due to the three surface refl ections (dependent on frequency [8]). The K mirror itself requires a rotary stage with a clear bore diameter at least as large as the combined cross section of all of the beams as they have propagated from their waists through the K mirror assembly. The axis of the K mirror must be accurately aligned with that of the incident array beams to avoid beam wander as the K mirror assembly is rotated.
4.5 Other
The optical system in sub-millimeter heterodyne focal-plane arrays necessarily links together a variety of components to carry out functions including those mentioned above. Since most of them are not diff erent from those in single-element systems, we will not further discuss them here. One exception is the fact that for a heterodyne focal-plane-array system with independently fabricated and mounted pixels, it is necessary to verify the correct positioning and alignment of beams in the focal plane of the telescope to which the instrument will be mounted. At frequencies above 1000 GHz, this is not currently a measurement that is straightforward to make with, e.g., a near-fi eld scanning system. This has led to development of special systems for this purpose: [86] describes one such system that has been eff ectively used with the upGREAT system on SOFIA.
5. IF Amplifi ers and Other Cryogenic Considerations
Any mixer used for sub-millimeter astronomy will be cooled, most commonly to 15 K or 4 K. Along with the
Notes to Table 1
SIS Superconductor-insulator-superconductor HEB Hot-electron bolometerWC Waveguide couplerFG Fourier gratingMPI Martin-Puplett interferometerML Meander lineCFG Collimating Fourier gratingDBS Dielectric slab beam splitterWPD Waveguide power dividerWG Wire grid beam splitterK K-mirrorRX Receiver rotatedBT Image rejection by back-short tuningMZI Mach-Zender interferometer
ArrayName
Frequency (GHz) elementN
MixerType
LOInjection
ImageRot.
SSBFilter Telescope Ref Comments
HERA 220-260 9 SIS WC K BT IRAM 30 m [32]
CHAMP 460-490 16 SIS FG+MPI MPI CSO 10 m [91] Also other telescopes
Pole STAR 810 4 SIS ML+MPI AST/RO
1.7 m[92][93]
SMART 490/810 8/8 SIS CFG+MPI K KOSMA 3 m [94] Dual band;
NANTEN 4 mDesert STAR 345 7 SIS CFG+DBS HHT 10 m [95]
[96]
CHAMP+ 670/860 7/7 SIS CFG+MPI RX MPI APEX 12 m [20] Dual Band
SuperCam 345 64 SIS WPD+DBS HHT 10 m [24] [25]
Also APEX 12 m
HARP 345 16 SIS ML+DBS K MZI JCMT 15 m
[23][97]
upGREAT 2000/4700 14/7 HEB CFG+WG K SOFIA 2.5 m
[21] [22] Dual Band
Table 1. Sub-millimeter heterodyne arra ys used for astronomical observations.

66 The Radio Science Bulletin No 362 (September 2017)
down-converter stage, the fi rst gain stage, the IF amplifi er, is critical in determining the noise of the entire system. Of course, the exception is if the fi rst stage is an amplifi er, in which case down-conversion and further amplifi cation are of diminished importance, due to the gain of the preceding stages.
When the fi rst stage is a mixer, locating at least the fi rst few stages of IF gain in close physical proximity to the mixer has the advantages of eliminating transmission-line loss and allowing larger IF bandwidths in light of possible impedance mismatch between the mixer IF output port and the IF amplifi er input. This is particularly important as the RF frequency increases and the IF bandwidth required simply to accommodate the line width in a source such as the galactic center, with a Doppler width in excess of 300 km/s, reaches 5 GHz for an input frequency of 4700 GHz (corresponding to the important 63 m fi ne-structure line of atomic oxygen). Integrating the IF amplifi er with the mixer is an excellent approach. This was done for superconductor-insulator-superconductor mixers and MMIC amplifi ers having 32dB gain in each of the elements of the SuperCam array [24]. One limitation that is not signifi cant for single-element sub-millimeter receivers, but can be a problem for arrays with many elements, is dc power dissipation. The MMIC amplifi ers described in [24] dissipated 6 mW each, which was acceptable in that system.
Current developments in SiGe amplifi er technology indicate that much lower dc power dissipation should be achievable. An amplifi er having a noise temperature of
5 K and a gain 27 dB over the 1.8 GH to 3.6 GHz frequency range at a 15 K physical temperature dissipated only 290 W [87]. This is enabling technology for large sub-millimeter heterodyne focal-plane arrays. However, the challenges that remain include (1) achieving even broader bandwidths, preferably extending close to dc to maximally utilize the available IF bandwidth of hot-electron-bolometer mixers (discussed in Section 3.3); and (2) shrinking the footprint of the amplifi ers to conform with the closer spacing required at shorter sub-millimeter wavelengths. 1.9 THz 16-element mixer array shown in Figure 2 (see [29]) had an element spacing of only 2.5 mm. However, a spacing of 5 mm is a plausible compromise, as feed horns with the aperture diameter match to a reasonably sized beam, while allowing more space for the mixers as well as for the IF amplifi ers if integrated with the mixers.
The IF output from each array element has to be connected to subsequent amplifi er and processing stages at ambient temperature. If there has been some gain before the
300 K temperature gap needs to be crossed, low-thermal-conductance IF cables can be employed. Their additional loss at the IF frequency will have negligible impact on the overall system noise temperature. Other strategies include having additional gain at diff erent temperatures, where the thermal load through the IF cables can be absorbed and not reach the mixers at the lowest temperature in the system, where the heat lift is the smallest. Having the very low-
power fi rst IF amplifi er gain stage (or stages) integrated with the mixer simplifi es the situation, but the thermal design of sub-millimeter heterodyne focal-plane arrays is nonetheless challenging.
6. “Backend” Spectrometers
In going from a single-element receiver to an array, the task of spectral elements is essentially multiplied by the number of elements in the array, although some aspects of the computing hardware may not be increased by a factor as large as elementN . All of the sub-millimeter heterodyne focal-plane arrays that have been used for astronomical observations have included an “array spectral processor:” a set of digital spectrometers that provides the required frequency resolution. The rapid progress in digital-signal-processing technology means that this part of the overall system is no longer the huge problem that it once was. A variety of approaches has been used in the spectrometers described in the references given in Table 1, including custom integrated circuits and, recently, fi eld-programmable gate arrays (FPGAs). Depending to a degree on the environment in which they will be used, the 14 to 100 (or more, for currently-envisioned systems) spectrometers, each with the multi-GHz bandwidth required for sub-millimeter spectroscopy, do present some challenges.
While not part of the spectrometer system per se, an important issue for large systems is the signal transport from the receiver front end to the spectrometers. The traditional design for radio observatories has had the electronics located in a separate room, which can be in the base of the telescope, or in a separate building that can be close by or at some distance. In any case, sending the data over coaxial cables has been largely replaced by fi ber-optic transmission systems. Even these are not inexpensive, and the fi ber-optic cables themselves are costly. Their fl exing due to telescope motion has been found to degrade the quality of spectral baselines. A promising technique is to digitize the output of each element right as part of the receiver itself, and to transmit information to the spectrometer (be it located near or far from the receiver) digitally.
The above suggests that the spectrometer system should be located as close to the receiver front end as possible. This is done in the upGREAT system on SOFIA [24, 25], for which the digital spectrometers are mounted in a rack that moves with the telescope, as does the receiver. This has proven to provide much better performance compared to what was achieved when the spectrometers were connected with fl exible cables to the receiver, a deleterious eff ect that has been identifi ed on other telescopes, as well.
The ability to locate the spectrometer system close to the receiver depends on its physical volume not being too large. Even with current FPGA technology, this is a challenge when considering arrays of 100 elements. The problem of packing many FPGA-based spectrometers

The Radio Science Bulletin No 362 (September 2017) 67
close together is exacerbated by the challenge of dissipating the heat generated. A Virtex-7 FPGA-based 2048-channel FFT spectrometer dissipates at least 10 W of power. This is acceptable for ground-based systems, but packing such systems together in a rack is already problematic for aircraft operation, due to the lower air density on e.g. SOFIA. It would obviously be even more of a challenge for a space-based sub-millimeter instrument, where the total power dissipation of 1 kW for a 100-element array could be a show-stopper, in addition to the eff ort required to keep the circuitry from overheating.
One solution to this is to employ custom CMOS ASIC chips. These can be designed to include the digitizer, spectral processor, memory, and output interface circuitry. A major advantage is that the power consumption is far lower, since there are no transistors used to control the confi guration of the processor itself. Of course, the price paid is that the system cannot be reconfi gured: the functionality must be as desired in order to be of any use at all, and there is substantial up-front cost in this approach. A CMOS ASIC chip, off ering comparable or superior performance to the FPGA-based system discussed above, could be implemented requiring less than 1 W of dc power [88-90]. This would allow a very compact unit to be placed close to the receiver, or even to be part of it, largely eliminating interface costs and off ering superior performance from the rigid connection that would be enabled.
7. Sub-millimeter Heterodyne Focal-Plane Arrays Employed for
Astronomical Observations
The title of this section is meant to indicate that we restrict ourselves to sub-millimeter heterodyne focal-plane arrays used on telescopes for astronomical observations. We extend the defi nition of sub-millimeter to include the 1.3 mm wavelength system described in [34]. In Table 1, we have compiled some of the key properties of the diff erent heterodyne focal-plane arrays. Additional information on mm-wavelength heterodyne focal-plane arrays can be found in [1]. The variety of techniques used for the diff erent functions indicates that there is no one best solution or standard design philosophy. The seven- and 14-element arrays were in hexagonal format, while the nine- and 2n
-element arrays had a square format.
The frequency range is not given for all arrays, as this was sometimes evolving or determined only by available local-oscillator sources. The Dual Band arrays, as suggested by the name, can operate simultaneously in two diff erent, quite distinct frequency bands. Information about the telescopes where the arrays were/are employed can be found in the articles referenced.
Figure 8. Images of the integrated intensity of the J 3 2 transition of 13CO and 18C O in Orion [103], made with the 16-element HARP array [21]. The color bar on the right side of each image gives the integrated intensity in units of K-km/s. The two transitions were simultaneously observed with a velocity resolution of 0.05 km/s. The N-S extent of the images was 45 arcminutes, while the eff ective angular resolution was 17.3 arcseconds.

68 The Radio Science Bulletin No 362 (September 2017)
8. Summary, Conclusions, and Future Prospects
The fi rst spectral line detected using a heterodyne system was the 345 GHz (870 m) J 3 2 transition of CO, observed in emission from Orion in 1977 [98] – unless you stretch the wavelength range to include the 230 GHz (1.3 mm) J 2 1 transition fi rst detected in interstellar space in 1973 [45]. Both of these early observations were made using InSb hot-electron-bolometer mixers [44]. These observations did confi rm two critical points: (1) The emission from CO and other species is spatially extended on a scale of many arcminutes to degrees on the sky; (2) There is signifi cant spectral structure in the line profi les that requires velocity resolution of a few km/s or higher ( 510R ).
These two characteristics clearly established the need for sub-millimeter heterodyne focal-plane arrays to discern the structure of giant molecular clouds (a newly discovered phase of the interstellar medium), to determine their size, mass, and density, and to unravel their connection with star formation. Within a few years, the InSb mixers were superseded by Schottky barrier diode mixers that very rapidly were extended to operation throughout the sub-millimeter range, working from 200 GHz to 350 GHz [99], to 690 GHz [ 100], to 810 GHz [101], to 1900 GHz [102], and to 2500 GHz [103]. However, as discussed above, for the high sensitivity demanded by astronomical observations, Schottky barrier diodes (ambient temperature and cryogenically cooled) have in turn been replaced by superconductor-insulator-superconductor and hot-electron-bolometer mixers that while far more demanding in terms of operating temperature, are signifi cantly more sensitive.
It was 20 years after the first heterodyne spectral-line detection that the fi rst reference to a sub-millimeter heterodyne focal-plane array included in Table 1 appeared: the CHAMP array is therein described as “under development.” During the intervening years, there have been great technological developments in all aspects of sub-millimeter receiver design, with extensive use of quasioptical components, superconductor-insulator-superconductor mixers, frequency-multiplied local oscillators, and a digital spectrometer system. All of this made the progression from single-element receivers to arrays practical, although they have remained complex engineering challenges.
To give one example of the results, Figure 8 includes images of the J 3 2 transition of the carbon monoxide isotopologues 13CO and 18C O in Orion [104], made with the HARP array [23]. These lines are far weaker than the same transition of the common isotopologues 12CO , but tell us much more about the actual column density of material in the region, as well as giving a picture of the cloud’s kinematics: information that is obscured by the high optical
depth of 12CO . The (simultaneous) observation of these two lines (enabled by the digital backend spectrometer) required 34.2 hours of telescope time. The high sensitivity of the HARP elements suggests that with a single-element system, the time required would have been 16 times greater, or almost 550 hours. This illustrates both the impact of a heterodyne focal-plane array, and the obvious drive to construct even large arrays to enable high-angular-resolution velocity-resolved spectral imaging of large areas of the sky.
What can we expect in the next 20 years? The rapid evolution of sub-millimeter technology warns against excessive prognostication, but at least the following trends are clear:
1. A critical consideration for heterodyne focal-plane arrays is that the gain in time to map a given region decreases in proportion to the number of elements, but increases as the system temperature squared. Designers must thus increasingly look to minimize the quantity 2
sys elementT N . System designs will thus have to consider all factors that aff ect this quantity when choosing and optimizing their design.
2. The maturity of superconductor-insulator-superconductor and hot-electron-bolometer technology means that designing the circuits and fabricating the mixer elements for large heterodyne focal-plane arrays should be straightforward, and that yields should be relatively high.
3. The development of frequency-multiplied sources, complemented by the availability of quantum cascade lasers at the shorter sub-millimeter wavelength, means that providing the local oscillator for large arrays will be possible, but the optimum way to do this is not yet clear.
4. The development of lower-power IF amplifi ers suggests that improved performance will be achieved in arrays by integrating at least the fi rst few stages of IF gain with the mixers.
5. The ongoing development of digital signal processing capability will continue to reduce the cost of the spectrometer system. Tighter integration of the spectrometer and the receiver would improve performance and reduce costs, but this depends on the availability of lower-power processing, possibly by taking advantage of CMOS ASIC systems.
Some things that are not so clear are:
1. Will new materials, such as 2MgB MgB2 for sub-millimeter hot-electron-bolometer mixers, enable operation at higher temperatures, thus easing the cryogenic design for large arrays, as well as increasing the instantaneous bandwidth?
The Radio Science Bulletin No 362 (September 2017) 69
2. Will MMIC amplifi ers become competitive with superconductor-insulator-superconductor mixers at frequencies above 100 GHz, bringing some of the impressive results that have been demonstrated at longer wavelengths?
3. Will the impetus continue to develop sub-millimeter heterodyne focal-plane arrays for operation above the Earth’s atmosphere, where system noise temperature improvements are directly refl ected in gains in system sensitivity, and where “`blocked” spectral lines can be studied?
4. Telescope time is expensive, and if the scientifi c interest in spectral-line imaging continues, large HPFAs are fi nancially justifi ed. One can hope that there will continue to be airplane, balloon, and space-borne observatories on which such arrays can be used, and that the development and deployment of such arrays on these platforms is in every way justifi ed.
Watching the ongoing development of heterodyne focal-plane arrays in the years ahead will be exciting from the point of view of technological developments, as well as providing exciting and beautiful new scientifi c results.
9. Acknowledgements
I am very pleased to have this chance to acknowledge the support and encouragement I received over many years from my very good friend and colleague, Gianni Tofani. Gianni was invariably enthusiastic about astronomical discoveries, new observational facilities, and new technology. He worked for years to get the Sardinia Radio Telescope built, and served with me on the Advisory Committee in the early years of the Large Millimeter Telescope in Mexico. He gave a great deal to a variety of people and projects, but was himself very modest about his contributions. Gianni was my sponsor and gracious host during two sabbatical visits to Florence. He enjoyed so much in life with his wife, Annamaria, that it remains painful to think that he is no longer with us. I am happy to recognize the assistance received from my colleagues at JPL and elsewhere, including Jonathan Kawamura, Jose Siles, Adrian Tang, Urs Graf, Chris Groppi, and Richard Hills. These generous experts all shared their work and ideas, and answered many questions. Richard Hills was particularly generous in his careful reading of this contribution, and making many suggestions that improved it. This work was carried out at the Jet Propulsion Laboratory, which is operated for NASA by the California Institute of Technology.
10. References
1. C. E. Groppi and J. H. Kawamura, “Coherent Detector Arrays for Terahertz Astrophysics Applications,” IEEE Transactions on Terahertz Science and Technology, 1, September 2011, pp. 85-96.
2. U. U. Graf, C. E. Honingh, K. Jacobs, and J. Stutzki, “Terahertz Heterodyne Array Receivers for Astronomy,” Journal Infrared Millimeterwave and Terahertz Waves, 36, 2015, pp. 896-921.
3. M. Born and E. Wolf, Principles of Optics, Oxford, Pergamon, 1959, p. 395.
4. E. Hecht and A. Zajac, Optics, Reading, Addison-Wesley, 1979, p. 350.
5. J. D. Kraus, Antennas, Second Edition, New York, McGraw-Hill, 1988, p. 410.
6. P. F. Goldsmith, “Radio Telescopes and Measurements at Radio Wavelengths,” in Single-Dish Radio Astronomy: Techniques and Applications, ASP Conference Series, Vol. 278, 2002.
7. J. W. Lamb, “Quasioptical Coupling of Gaussian Beam Systems to Large Cassegrain Antennas,” International Journal of Infrared and Millimeter Waves, 7, 10, 1986, pp. 1511-1536.
8. P. F. Goldsmith, Quasioptical Systems, New York, IEEE Press/Chapman & Hall, 1998, Chapter 6.
9. R. J. Wylde, “Millimetre Wave Gaussian Beam-Mode Optics and Corrugated Feed Horns,” Microwaves Optics and Antennas, 131, August 1984, pp. 258-282.
10. A. Gonzalez, K. Kaneko, T. Kojima, S. Asayama, and Y. Uzawa, “Terahertz Corrugated Horns (1.25-1.57 GHz): Design, Gaussian Modeling, and Measurements,” IEEE Transactions on Terahertz Science and Technology,” 7, January 2017, pp. 42-52.
11. J. F. Johansson and N. D. Whyborn, “The Diagonal Horn as a Sub-Millimeter Wave Antenna,” IEEE Transactions on Antennas and Propagation, AP-40, May 1982, pp. 795-800.
12. C. Granet, G. L. James, R. Bolton, and G. Moorey, “A Smooth-Walled Spline-Profi le Horn as an Alternative to the Corrugated Horn for Wide Band Millimeter-Wave Applications,” IEEE Transactions on Antennas and Propagation, 52, March 2004, pp. 848-854.
13. L. Zeng, C. L. Bennett, D. T. Chuss, and E. J. Wollack, “A Low Cross-Polarization Smooth-Walled Horn with Improved Bandwidth,” IEEE Transactions on Antennas and Propagation, 58, April 2010, pp. 1383-1387.
14. N. Chahat, T. J. Reck, C. Jung-Kubiak, T. Nugyen, et al., “1.9-THz Multifl are Angle Horn Optimization for Space Instrumentation,” IEEE Transactions on Terahertz Sci-ence and Technology,” 5, November 2015, pp. 914-920.
70 The Radio Science Bulletin No 362 (September 2017)
15. L. Chen, C. E. Tong, and P. K. Grimes, “Experimental Verifi cation of the Fundamental Gaussian Beam Proper-ties of Smooth-Walled Feedhorns, “IEEE Transactions on Terahertz Science and Technology,” 6, January 2016, pp. 163-168.
16. H. Kogelnik and T. Li, “Laser Beams and Resona-tors,” Proceedings of the IEEE,” 54, October 1966, pp. 1312-1329.
17. A. E. Siegman, Lasers, Mill Valley, University Science Books, 1986, Chapter 17.
18. P. F. Goldsmith, “Quasi-Optical Techniques at Millim-eter and Submillimeter Wavelengths,” in Infrared and Millimeter Waves, 6, New York, Academic Press, 1982.
19. P. F. Goldsmith, “Radiation Patterns of Circular Aper-tures with Gaussian Illumination,” International Journal of Infrared and Millimeter Waves, 8, 7, 1987, pp. 771-782.
20. C. Kasemann, R. Güsten, S. Heyminck, B. Klein, et al., “CHAMP+: A Powerful Array Receiver for APEX,” Millimeter and Submillimeter Detectors and Instrumen-tation for Astronomy III, Proceedings of SPIE, 6275, 2006, pp. 62750N-1-62750N-12.
21. C. Risacher, R. Güsten, J. Stutzki, H.-W. Hübers, et al., “First Supra-THz Heterodyne Array Receivers for Astronomy with the SOFIA Observatory,” IEEE Trans-actions on Terahertz Science and Technology, 6, March 2016, pp. 199-211.
22. C. Risacher, R. Güsten, Jürgen Stutzki, H.-W. Hübers, et al., “The upGREAT 1.9 THz Multi-Pixel High Resolution Spectrometer for the SOFIA Observatory,” Astronomy and Astrophysics, 9, 595, 2016, A34.
23. J. V. Buckle, R. E. Hills, H. Smith, W. R. F. Dent, et al., “HARP/ACIS: A Submillimetre Spectral Imaging System on the James Clerk Maxwell Telescope,” Monthly Notices of the Royal Astronomical Society, 399, 2009, pp. 1026-1043.
24. C. Groppi, C. Walker, C. Kulesa, D. Golish, et al., “SuperCam: a 64 Pixel Heterodyne Imaging Spec-trometer,” Millimeter and Submillimeter Detectors and Instrumentation for Astronomy IV, Proceedings of SPIE, 7020, 2008, pp. 702011-1-702011-8.
25. C. Groppi, C. Walker, C. Kulesa, D. Golish, et al., “Test and Integration Results from SuperCam: a 64-Pixel Ar-ray Receiver for the 350 GHz Atmospheric Window,” Millimeter, Submillimeter, and Far-Infrared Detectors and Instrumentation for Astronomy V, Proceedings of SPIE, 7741, 2010, pp. 77410X-1-77410X-12.
26. A. Krabbe, “The SOFIA Telescope,” Airborne Telescope Systems, Proceedings of SPIE, 4014, 2000, pp. 276-281.
27. N. R. Erickson, R. M. Grosslein, R. B. Erickson, and S. Weinreb, “A Cryogenic Focal Plane Array for 85-115 GHz Using MMIC Preamplifi ers,” IEEE Transactions on Microwave Theory and Techniques, 47, December 1999, pp. 2212-2219.
28. J. Leech, B. K. Tan, G. Yassin, P. Kittara, and S. Wang-suya, Experimental Investigation of a Low-Cost, High Performance Focal-Plane Horn Array,” IEEE Transac-tions on Terahertz Science and Technology, 2, January 2012, pp. 61-70.
29. J. Kawamura, J. Kloosterman, J. Siles, F. Boussaha, et al., “Development of a 16-pixel Monolithic 1.9 THz Waveguide Superconducting Hot-Electron Bolometer Mixer,” ISSTT Conference, Cologne, Germany, 2017.
30. J. Kawamura, private communication.
31. G. Rebeiz, “Millimeter-Wave and Terahertz Integrated Circuit Antennas,” IEEE Proceedings, 80, December 1992, pp. 1748-1770.
32. N. Llombart, G. Chattopadhyay, A. Skalare, and I. Mehdi, “ Novel Terahertz Antenna Based on a Silicon Lens Fed by a Leaky Wave Enhanced Waveguide,” IEEE Transactions on Antennas and Propagation, 59, June 2011, pp. 2160-2168.
33. N. Llombart, C. Lee, M. Alonso-delPino, G. Chattopad-hyay, et al., “Silicon Micromachined Lens Antenna for THz Integrated Heterodyne Arrays,” IEEE Transactions on Terahertz Science and Technology, 3, September 2013, pp. 515-523.
34. K.-F. Schuster, C. Boucher, W. Brunswig, M. Carter, et al., “A 230 GHz Heterodyne Receiver Array for the IRAM 30 m Telescope,” Astronomy and Astrophysics, 423, 2004, pp. 1171-1177.
35. N. R. Erickson, P. Goldsmith, G. Novak, R. Grosslein, et al., “A 15 Element Focal Plane Array for 100 GHz.” IEEE Transactions on Microwave Theory and Tech-niques, 40, January 1992, pp. 1-11.
36. J. R. Tucker and M. J. Feldman, “Quantum Detection at Millimeter Wavelengths,” Reviews of Modern Physics, 57, October 1985, pp. 1055-1113.
37. R. Blundell, R. E. Miller, and K.H. Gundlach, “Under-standing Noise in SIS Receivers,” International Journal of Infrared and Millimeter Waves, 13, 1992, pp. 3-14.
38. C. E. Honingh, S. Haas, D. Hottgenroth, K. Jacobs, and J. Stutzki, “Low Noise Broadband Fixed Tuned SIS Waveguide Mixers at 660 GHz and 800 GHz,” IEEE Transactions on Applied Superconductivity, 7, June 1997, pp. 2582-2586.

The Radio Science Bulletin No 362 (September 2017) 71
39. J. W. Kooi, R. A. Chamberlin, R. Monje, A. Kovács, et al., “Performance of the Caltech Submillimeter Observatory Dual-Color 180-720 GHz Balanced SIS Receivers,” IEEE Transactions on Terahertz Science and Technology, 4, March 2014, pp. 149-164.
40. A. R. Kerr, S.-K. Pan, S. M. X. Claude, P. Dindo, et al.,” Development of the ALMA Band-3 and Band-6 Sideband-Separating SIS Mixers,” IEEE Transactions on Terahertz Science and Technology, 4, March 2014, pp. 201-212.
41. Th. de Graauw, F. P. Helmich, T. G. Phillips, J. Stutzki, et al., “The Herschel-Heterodyne Instrument for the Far-Infrared (HIFI),” Astronomy and Astrophysics, 518, 210, pp. 39-45.
42. K. Sunada, C. Yamaguchi, N. Nakai, K. Sorai, et al. “BEARS – SIS 25-Beam Array Receiver System for the NRO 45-m Telescope,” Proceedings of SPIE, 4015, 2000, pp. 237-246.
43. K.-F. Schuster, C. Boucher, W. Brunswig, M. Carter, et al., “A 230 GHz Heterodyne Receiver Array for the IRAM 30 m Telescope,” Astronomy and Astrophysics, 423, 2004, pp. 1171-1177.
44. T. G. Phillips and K. B. Jeff erts, “A Low Temperature Bolometer Heterodyne Receiver for Millimeter Wave Astronomy,” Rev. Sci. Instruments, 44, August 1973, pp. 1009-1014.
45. T. G. Phillips, K. B. Jeff erts, and P. G. Wannier, “Ob-servation of the J = 2 to J = 1 Transition of Interstellar CO at 1.3 Millimeters,” The Astrophysical Journal, 186, November 1973, pp. L19-L22.
46. T. G. Phillips, P. J. Huggins, T. B. H. Kuiper, and R. E. Miller, “Detection of the 610 Micron (492 GHz) Line of Interstellar Atomic Carbon,” The Astrophysical Journal, 238, June 1980, pp. L103-L106.
47. C. R. Predmore, A. V. Räisänen, N. R. Ericson, P. F. Goldsmith, and J. L. R. Marrero, “A Broad-Band Ultra-Low-Noise Schottky Diode Mixer Receiver from 80 to 115 GHz,” IEEE Transactions on Microwave Theory and Techniques, MTT-32, May 1984, pp. 498-507.
48. G. N. Gol’tsman, A. D. Semenov, Y. P. Gousev, M. A. Zorin, et al., “Sensitive Picosecond NbN Detector for Radiation from Millimetre Wavelengths to Visible Light,” Superconducting Science and Technology, 4, 1991, pp. 453-456.
49. E. M. Gershenzon, G. N. Gol’tsman, I. G. Gogidze, Y. P. Gusev, et al., “Millimeter and Submillimeter Range Mixer Based on Electronic Heating of Superconducting Films in the Resistive State,” Soviet Physics – Super-conductivity, 3, 1991, pp. 1582-1590.
50. D. E. Prober, “Superconducting Terahertz Mixer Using a Transition-Edge Microbolometer,” Applied Physics Letters, 62, April 1993, pp. 2119-2121.
51. H. Ekström, B. S. Karasik, E. L. Kollberg, and K. S. Yngvesson, “Conversion Gain and Noise of Niobium Superconducting Hot-Electron-Mixers,” IEEE Transac-tions of Microwave Theory and Techniques, 43, April 1995, pp. 938-947.
52. A. D. Semenov, H.-W. Hübers, J. Schubert, G. N. Gol’tsman, et al., “Design and Performance of the Lattice-Cooled Hot-Electron Terahertz Mixer,” Journal of Applied Physics, 88, December 2000, pp. 6758-6767.
53. J. Kawamura, R. Blundell, C.-Y. Tong, D. C. Papa, T. R. Hunter, et al., “Superconductive Hot-Electron-Bolometer Mixer Receiver for 800-GHz Operation,” IEEE Transac-tions on Microwave Theory and Techniques, 48, April 2000, pp. 683-689.
54. L. Jiang, S. Shiba, K. Shimbo, N. Sakai, et al.,” De-velopment of THz Waveguide NbTiN HEB Mixers,” IEEE Transactions on Applied Superconductivity, 19, June 2009, pp. 301-304.
55. W. Zhang, P. Khosropanah, J. R. Gao, B. Banasai, et al., “ Noise Temperature and Beam Pattern of an NbN Hot Electron Bolometer Mixer at 5.25 THz,” Journal of Applied Physics, 108, 2010, pp. 093102-1093102-7.
56. J.L. Kloosterman, D.J. Hayton, Y. Ren, T. Y. Kao, et al., “Hot Electron Bolometer Heterodyne Receiver With a 4.7-THz Quantum Cascade Laser as a Local Oscillator,” Applied Physics Letters, 102, 2013, pp. 011123-1-011123-4.
57. D. Büchel, P. Pütz, K. Jacobs, M. Schultz, et al., “4.7-THz Superconducting Hot Electron Bolometer Waveguide Mixer,” IEEE Transactions on Terahertz Science and Technology, 5, March 2015, p. 207-214.
58. S. Cherednichenko, V. Drakinskiy, K. Ueda, and M Naito, “Terahertz Mixing in MgB2 Microbolometers,” Applied Physics Letters, 90, 2007, pp. 023507-1-023507-3.
59. S. Bevilacqua, S. Cherednichenko, V. Drakinskiy, J. Stake, et al., “Low Noise MgB2 Terahertz Hot-Electron Bolometer Mixers,” Applied Physics Letters, 100, 2012, pp. 033504-1-033504-3.
60. SE. Novoselov and S. Cherednichenko, “Low Noise Terahertz MgB2 Hot-Electron Bolometer Mixers With an 11 GHz Bandwidth,” Applied Physics Letters, 110, 2017, pp. 032601-1-032601-5.
61. D. Cunnane, J. H. Kawamura, M. A. Wolak, N. Ach-arya, et al., “Optimization of Parameters of MgB2 Hot-Electron Bolometers,” IEEE Transactions on Applied Superconductivity, 27, June 2017, p. 2300405.

72 The Radio Science Bulletin No 362 (September 2017)
62. S. Cherednichenko, V. Drakinskiy, T. Berg, P. Khos-ropanah, and E. Kollberg, “Hot-Electron Bolometer Terahertz Mixers for the Herschel Space Observatory,” Review of Scientifi c Instruments, 79, 2008, pp. 034501-1-034501-10.
63. D. Cuadrado-Calle, D. George, G.A., Fuller, K. Cleary, et al., “Broadband MMIC LNAs for ALMA Band 2+3 with Noise Temperature Below 28 K,” IEEE Transac-tions on Microwave Theory and Techniques, 65, May 2017, pp. 1589-1597.
64. P. Kangaslahti, P., K. Cleary, J. Kooi, L. Samoska, et al., “Sub-20-K Noise Temperature LNA for 67-90 Frequency Band,” Proceedings of the IEEE International Microwave Symposium, Honolulu, HI, June, 2017, pp. 1-4.
65. M. Sieth, K. Devaraj, P. Voll, S. Church, et al., “Argus: A 16-Pixel Millimeter-Wave Spectrometer for the Green Bank Telescope,” Proceedings of SPIE, 9153, 2014, pp. 91530P-1-91530P-12.
66. K. M. K. H. Leong, X Mei, W. Yoshida, P.-H. Liu, et al., “A 0.85 THz Low Noise Amplifi er Using InP HEMT Transistors,” IEEE Microwave and Wireless Components Letters, 25, June 2015, pp. 397-309.
67. X. Mei, W. Yoshida, M. Langer, J. Lee, et al., “First Demonstration of Amplifi cation at 1 THz Using 25-nm InP High Electron Mobility Transistor Process,” IEEE Electron Device Letters, 36, April 2015, pp. 327-329.
68. B. S. Williams, “Terahertz Quantum-Cascade Lasers,” Nature Photonics, 1, September 2007, pp. 517-525.
69. C. Ling, T. Liu, and Q. J. Wang, “Recent Developments of Terahertz Quantum Cascade Lasers,” IEEE Journal of Selected Topics in Quantum Electronics, 23, July/August 2017, pp. 1200118.
70. Y. Ren, D. N. Hovenier, M. Cui, D. J. Hayton, et al., “Frequency locking of a Single-Mode 3.5-THz Quantum Cascade Lasers Using a Gas Cell,” Applied Physics Letters, 100, 2012, 041111.
71. D. Rabanus, U. U. Graf, M. Philipp, O. Ricken, et al., “Phase Locking of a 1.5 Terahertz Quantum Cascade Laser and Use as a Local Oscillator in a Heterodyne HEB Receiver,” Optics Express 17, 2 February 2009, 1159; P. Khosropanah, A. Baryshev, W. Zhang, W. Jellema, et al., “Phase Locking of a 2.7 THz Quantum Cascade Laser to a Microwave Reference,” Optics Letters, 34, October 1, 2009, pp. 2958-2960.
72. H.-W. Hübers, S. G. Pavlov, G. Semenov, R. Köhler, et al. “Terahertz Quantum Cascade Laser as Local Os-cillator in a Heterodyne Receiver,” Optics Express, 13, 2005, pp. 5890-5896.
73. J. Kloosterman, D. J. Hayton, Y. Ren, T. Y. Kao, et al., “Hot Electron Bolometer Heterodyne Receiver with a 4.7 THz Quantum Cascade Laser as a Local Oscillator,” Applied Physics Letters, 102, 2013, 011123.
74. A. Maestrini, J. S. Ward, J. J. Gill, C. Lee, et al., “A Frequency-Multiplied Source with More than 1 mW of Power Across the 840-900 GHz Band,” IEEE Transac-tions on Microwave Theory and Techniques, 58, July 2010, pp. 1925-1932.
75. G. Chattopadhyay, E. Schlecht, J. S. Ward, J. J. Gill, et al., “An All-Solid-State Broad-Band Frequency Multiplier Chain at 1500 GHz,” IEEE Transactions on Microwave Theory and Techniques, 52, May 2004, pp. 1538-1547.
76. J. V. Siles, R. H. Lin, C. Lee, E. Schlecht, et al., “De-velopment of High-Power Multi-Pixel LO Sources at 1.47 THz and 1.9 THz for Astrophysics: Present and Future,” Proceedings of 26th International Symposium on Space Terahertz Technology, March 2015, T1-3.
77. F. Boussaha, J. Kawamura, J. Stern, and C. Jung-Kubiak, “2.7 THz Balanced Waveguide HEB Mixer,” IEEE Transactions on Terahertz Science and Technology, 4, September 2014, pp. 545-551.
78. U. U. Graf and S. Heyminck, “Fourier Gratings as Submillimeter Beam Splitters,” IEEE Transactions on Antennas and Propagation, 49, April 2001, pp. 542-546.
79. B. Mirzaei, J. R. G. Silva, Y. C. Luo, X. X. Liu, et al. “Effi ciency of Multi-Beam Fourier Phase Gratings at 1.4 THz,” Optics Express, 25, 20 March 2017, pp. 6581-6588.
80. S. Heyminck and U. U. Graf, “Array-Receiver LO Unit Using Collimating Fourier-Gratings,” Proceedings 12th International Symposium on Space Terahertz Technol-ogy,” 2001, pp. 563-570.
81. M. Kotiranta, C. Lenz, T. Klein, V. Krozer, and H. J. Wunsch, “Characterization of Imperfections in a Martin-Puplett Interferometer Using Ray Tracing,” Journal of Infrared Millimeter, and Terahertz Waves, 33, 2012, pp. 1138-1148.
82. S. Claude, “Sideband-Separating SIS Mixer for ALMA Band 7, 275-370 GHz,” Proceedings 14th International Symposium on Space Terahertz Technology, 2003, pp. 41-51.
83. F. P. Mena, J. W. Kooi, A. M. Baryshev, C. F. J. Lodewijk, et al. “Design and Performance of a 600-720 GHz Sideband Separating Receiver Using AlOx and AlN SIS Junctions,” IEEE Transactions on Microwave Theory and Techniques, 59, January 2011, pp. 166-177.
The Radio Science Bulletin No 362 (September 2017) 73
84. R. Rodríguez, R. Finger, F. P. Mena, N. Reyes, et al., “A Sideband-Separating Receiver with a Calibrated Digital IF-Hybrid Spectrometer for the Millimeter Band,” Publications of the Astronomical Society of the Pacifi c, 125, April 2014, pp. 380-385.
85. D. Kester, R. Higgins, and D. Teyssier, “Derivation of Sideband Gain Ratio for Herschel/HIFI,” Astronomy and Astrophysics, 599, 2017, pp. A115-1 – A115-13.
86. U. U. Graf. “A Compact Beam Measurement Setup,” Journal Infrared Millimeter and Terahertz Waves, 37, 2016, pp. 770-775.
87. S. Montazeri, W.-T. Wong, A. H. Coskun, and J. C. Bardin, “Ultra-Low-Power Cryogenic SiGe Low-Noise Amplifi ers: Theory and Demonstration, IEEE Transac-tions on Microwave Theory and Techniques, 64, January 2016, pp. 178-187.
88. A. Hsiao, A. Tang, Y. Kim, B. Drouin, et al., “A 2.2 GS/s 188 mW Spectrometer Processor in 65nm CMOS for Supporting THz Planetary Instruments,” Proc. 2015 IEEE Custom Integrated Circuits Conference.
89. A. Amara, F. Amiel, and T. Ea, “FPGA vs. ASIC for Low Power Applications,” Microelectronics Journal, 27, pp. 669-677.
90. A. Tang, private communication
91. R. Güsten, G. Ediss, F. Gueth, K. Gundlach, et al., “CHAMP – The Carbon Heterodyne Array of the MPIfR,” Proceedings of SPIE, 3357, March 1998, pp. 167-177.
92. C. Groppi, C. Walker, A. Hungerford, C. Kulesa, et al., “Pole STAR: An 810 GHz Array Receiver for AST/RO,” ASP Conference Proceedings, 217, 2000, pp. 48-49.
93. C. Walker, C. Groppi, D. Golish, C. Kulesa, et al., “PoleStar: An 810 GHz Array Receiver for AST/RO,” Proceedings 12th International Symposium on Space Terahertz Technology, 2001, pp. 540-551.
94. U. U. Graf, S. Heyminck, E. A. Michael, S. Stanko, et al., “SMART: The KOSMA Sub-Millimeter Array Receiver for Two Frequencies,” Proc. 13th International Symposium on Space Terahertz Technology, March 2002, pp. 143-151.
95. C. E. Groppi, C. K. Walker, C. Kulesa, D. Golish, et al., “Desert STAR: A 7 Pixel 345 GHz Heterodyne Array Receiver for the Heinrich Hertz Telescope,” Proceedings of SPIE, 4855, 2003, pp. 330-337.
96. C. E. Groppi, C. K. Walker, C. Kulesa, D. Golish, et al., “First Results from Desert STAR: A 7 Pixel 345 GHz Heterodyne Array Receiver for the Heinrich Hertz Tel-escope,” Proceedings of SPIE, 5498, 2004, pp. 290-298.
97. 97. H. Smith, J. Buckle, R. Hills, G. Bell, et al. “HARP: a Submillimetre Heterodyne Array Receiver Operating on the James Clerk Maxwell Telescope,” Proc. of SPIE, 7020, 2008, pp. 70200Z-1 - 70200Z-15.
98. T. G. Phillips, P. J. Huggins, G. Neugebauer, and M. W. Werner, “Detection of Submillimeter (870 m) CO Emission from the Orion Molecular Cloud,” The Astro-physical Journal, 217, November 1 1977, pp. L161-L164.
99. N. R. Ericson, “A 200-350 GHz Heterodyne Receiver,” IEEE Transactions on Microwave Theory and Tech-niques, MTT-29, June 1981, pp. 557-561.
100. P. F. Goldsmith, N. R. Ericson, H. R. Fetterman, B. J. Clifton, et al., “Detection of the J = 6-5 Transition of Carbon Monoxide,” The Astrophysical Journal, 243, January 15 1981, pp. L79-L82.
101. D. T. Jaff e, A. I. Harris, M. Silber, R. Genzel, and A. L. Betz, “ Detection of the 370 Micron 3P2-
3P1 Fine-Structure line of [CI],” The Astrophysical Journal, 290, 1985 March 15, pp. L59-L62.
102. R. T. Boreiko, A. L. Betz, and J. Zmuidzinas, “Het-erodyne Spectroscopy of the 158 Micron C II Line in M42,” The Astrophysical Journal, 325, 1988 February 15, pp. L47-L51.
103. A. L. Betz and R. T. Boreiko, “Reversed Far-Infrared Line Emission from OH in Orion,” The Astrophysical Journal, 346, 1989 November 15, pp. L101-L104.
104. J. V. Buckle, C. J. Davis, J. Di Francesco, S. F. Graves, et al., “The JCMT Legacy Survey of the Gould Belt: Mapping 13CO and C18O in Orion A,” Monthly Notices of the Royal Astronomical Society, 422, 2012, 521-541.

74 The Radio Science Bulletin No 362 (September 2017)
Coexistence Between Communications and Radar Systems: A Survey
Mina Labib1, Vuk Marojevic1, Anthony F. Martone2, Jeff rey H. Reed1, and Amir I. Zaghloul1,2
1Virginia Tech, Blacksburg, VA, USAE-mail: [email protected]
2US Army Research Laboratory, Adelphi, MD, USAE-mail: [email protected]
Abstract
Data-traffi c demand in cellular networks has been growing tremendously, and has led to creating congested RF environments. Accordingly, innovative approaches for spectrum sharing have been proposed and implemented to accommodate several systems within the same frequency band. Spectrum sharing between radar and communications systems is one of the important research and development areas. In this paper, we present the fundamental spectrum-sharing concepts and technologies. We then provide an updated and comprehensive survey of spectrum-sharing techniques that have been developed to enable some wireless communications systems to coexist with radars in the same band.
1. Int roduction
Billions of people rely on wireless infrastructures for communication and connectivity, to the extent that
wireless communications have become a necessary part of human life. Data-traffi c demand in cellular and wireless local-area networks has been growing tremendously, and has led to creating a congested radio-frequency (RF) environment. Spectrum regulators adopted the fi xed spectrum-allocation policy, where bands were allocated to specifi c users or services. Since actual use of spectrum is way below its capacity, on average, this leads to ineffi cient use of spectrum. Several studies have shown that apart from the spectrum used for wireless communications, a large portion of the spectrum is quite lowly utilized [1]. Consequently, the concept of spectrum sharing has recently gained lots of interest, in order to help improve spectrum utilization. Spectrum sharing implies that two or more users (using diff erent technologies) can share the spectrum and use it as needed and as available, without creating harmful interference to one another.
Spectrum sharing is becoming possible because of advances in cognitive radio technology, as well as more-fl exible spectrum regulations and incentives to share resources. Considering the United States, for example, in June 2010, a Presidential Memorandum, “Unleashing the Wireless Broadband Revolution,” was issued. The memorandum directed the National Telecommunications and Information Administration (NTIA) to collaborate with the Federal Communications Commission (FCC) to make a total of 500 MHz of spectrum available over the following 10 years for usage by wireless broadband systems, either on an exclusive-license basis or on a shared-access basis [2].
In June 2013, another Presidential Memorandum, “Expanding America’s Leadership in Wireless Innovation,” was issued. This urged identifying opportunities to share the spectrum that is currently allocated for exclusive use by federal agencies. This memorandum explicitly requested investigation of the possibility of either relinquishing or sharing the spectrum of the 1695-1710 MHz band, the 1755-1850 MHz band, and the 5350-5470 MHz and 5850-5925 MHz bands [3]. Consequently, the Department of Defense (DoD) issued a “Call To Action,” wherein one of the objectives was to accelerate the fi elding of technologies that enable spectrum sharing and improve access opportunities. One of the goals was to sharpen responsiveness to ongoing spectrum regulatory and policy changes [4].
In January 2015, the FCC completed an auction to license the 1695-1710 MHz, 1755-1780 MHz, and 2155-2180 MHz frequency bands to wireless operators. These bands are collectively called the AWS-3 (Advanced Wireless Service 3) band. Most of the federal systems will relocate to new bands, while a few systems will remain and share the spectrum with the wireless operators to which it is awarded. The auction generated more than 42 billion dollars in net profi ts. In March 2015, the DoD Chief Information Offi cer issued a brief to the DoD UAS (Unmanned Aerial Systems) summit where he indicated that spectrum access

The Radio Science Bulletin No 362 (September 2017) 75
is being challenged by emerging commercial market needs, and the DoD is taking deliberate actions to advocate spectrum-sharing techniques [5]. In April 2015, the National Telecommunications and Information Administration announced a 12-month plan to cooperate with FCC and other stakeholders to study and develop sharing options that accommodate new applications and devices with the reserved 195 MHz of the 5 GHz band. Currently, this 195 MHz (5350-5470 MHz and 5850-5925 MHz) is mainly used by radar systems, and the major user of these bands is the DoD. The DoD uses this for diff erent radar systems, which are mainly range and tracking radars, tactical anti-air warfare radar systems, navigation radars, and weather radars [6].
Radar systems are the main consumers of the frequency bands that are currently being considered for sharing in the US, such as the 5150-5925 MHz, which is called the Unlicensed National Information Infrastructure (U-NII) band, and the 3550-3700 MHz band, which is called the Citizen Broadband Radio Service (CBRS) band. Accordingly, spectrum sharing between communications and radar systems has become one of the important research and development areas. When a radar system shares the spectrum with a communications system, the interference caused to the radar can impede its correct functioning. This is because radars are not designed to coexist with communications. Communications systems are also not designed to operate with radars. Nevertheless, communications systems are easier to modify than legacy radars, because of the much shorter development and deployment cycles.
The authors in [7] provided an overview of some of the techniques that have been proposed for sharing the spectrum between radar and wireless communications systems. In this paper, we present the fundamental spectrum-sharing concepts and technologies. We then provide an updated and more-comprehensive survey of spectrum-sharing techniques that have been developed to enable some of the wireless communications systems to coexist within the same band as radar systems. The rest of the paper is organized as follows. Section 2 provides an analysis of the diff erent radar systems that exist within the shared spectrum. Section 3 provides a general overview of the spectrum-sharing techniques. Section 4 presents our survey of the proposed spectrum-sharing mechanisms for radar and communications systems. We provide our conclusions in Section 5.
2. The Shared Spectrum: Radar Systems and Regulations
There are several frequency bands that are utilized by radar systems. They are currently considered for spectrum sharing in the US, such as Unlicensed National Information Infrastructure and the Citizen Broadband Radio Service bands. In order to emphasize the need for developing
spectrum-sharing techniques for the coexistence between communications and radar systems, this section presents the diff erent radar types within these two bands, as well as the current regulations governing these bands.
For the Citizen Broadband Radio Service band, the frequency range 3550-3650 MHz is allocated on a primary basis for federal use of both the Radiolocation Service (RLS) and the Aeronautical Radionavigation Service (ARNS) (ground-based). The Radiolocation Service radar is used by the military for the purpose of radiolocation, whereas the Aeronautical Radionavigation Service radar is used for the safe operation of military aircraft [8]. The authors in [9] analyzed the regulations governing this band.
For the 5 GHz band, there are several radar systems operating within this band: • Radiolocation service for federal operation: The
frequency range 5250-5950 MHz is allocated to radiolocation services for federal operation on a primary basis. The frequency range 5470-5650 MHz is allocated to radiolocation services for non-federal operation on a primary basis, as well. These types of radars perform a variety of functions, such as [10]:
– Tracking space launch vehicles during the developmental and operational testing phases,
– Sea and air surveillance, – Environmental measurements, – National defense.
• Space Research Services: Band Unlicensed National Information Infrastructure-2A and the frequency segment 5470-5570 MHz are both allocated on a primary basis to space research services for federal operation, and on a secondary basis to the space research services for non-federal operation.
• Aeronautical Radio Navigation Radars: These radars use the frequency range 5350-5460 MHz (Unlicensed National Information Infrastructure-2B). These types of radars are used for:
– Airborne weather avoidance, – Windshear detection, – Safety service for fl ights.
• Maritime Radio Navigation Radars: The frequency range 5350-5460 MHz is allocated on a primary basis to the maritime radio navigation radars for both federal and non-federal operations. These types of radars are used for the safety of ships.
• Terminal Doppler Weather Radars (TDWR): The Federal Aviation Administration (FAA) uses the frequency range 5600-5650 MHz for Terminal Doppler Weather Radars to improve the safety of operations at several major airports (45 airports), as these radars provide

76 The Radio Science Bulletin No 362 (September 2017)
Figure 1. The 5 GHz regulations in the United States.
quantitative measurements for identifying weather hazards.
Furthermore, the DoD uses the 5 GHz frequency band for diff erent military radar systems. The DoD radars can either operate on a fi xed frequency, or can employ frequency-hopping techniques. In the past, these radars have operated on or near military installations. However, in support of homeland security, these radars may need to be deployed in urban areas, where Unlicensed National Information Infrastructure devices (commercial and industrial) will be heavily used, as is the case for today’s 5 GHz Wi-Fi systems [6]. The interference issue between radar systems and the Unlicensed National Information Infrastructure devices thus needs to be addressed. These radar systems are used by diff erent DoD agencies: the US Army, the US Navy and US Coast Guard, and the US Air Force. The major DoD radar systems operating within the 5 GHz band can be summarized as follows [6]:
• Range and Tracking Radars: These radars operate
in 5400-5900MHz frequency band. During the development and testing phases of non-cooperative targets (such as rockets and missiles), these radars are used to provide accurate tracking data of these targets, and to maintain range safety.
• Weather Radars: These radars are used to determine the structure of weather hazards by analyzing the locations and the motions of several types of precipitations (i.e., rain, snow, hail, etc.).
• Shipboard Navigation Radars: These radars operate in the 5450-5825 MHz frequency range. The main function of this radar type is detecting anti-ship missiles and low-fl ying aircraft. These radars are also used for navigation and for general surface-search tasks.
• Airborne Sense and Avoid Radars: The US Air Force has been developing these types of radars to comply with the safety concerns of the FAA for Unmanned Aerial Vehicle (UAV) operations. The purpose of this radar is to avoid collision of the UAV by detecting and tracking other nearby aircraft. The 5350-5460 MHZ frequency range is the range that is currently considered for these radars, whereas the frequency range 5150-5250 MHz is being considered as an alternative.
The 5 GHz band falls under the FCC Part-15 regulations. The current spectrum regulations for the 5 GHz band in the US are depicted in Figure 1 [11], which identifi es the maximum transmit power level allowed for devices in each subband.
Any device operating in the Unlicensed National
Information Infrastructure-2A or the Unlicensed National Information Infrastructure-2C bands must employ transmit power control (TPS) and dynamic frequency selection (DFS). Dynamic frequency selection is a mechanism that is specifi cally designed to avoid causing interference to non-IMT (International Mobile Telecommunications) systems, such as radars. The dynamic frequency-selection requirements in the United States can be summarized as follows:
• Sensing bandwidth: The device must sense radar signals in 100% of its occupied bandwidth.
• Channel availability checking time: The device must
check the channel for sixty seconds before using it.
• In-service monitoring: The device must continuously monitor the channel during operation, and must vacate the channel within ten seconds (called the channel move time) once the radar system starts transmitting. During these ten seconds, the device is only allowed 200 ms for normal transmission.
• Detection threshold: This is the received power levels
when averaged over one microsecond, referenced to a 0 dBi antenna. Specifi cally:
– 62 dBm for devices with maximum EIRP (eff ective isotropic radiated power) less than 200 mW (23 dBm), and an EIRP spectral density of less than 10 dBm/MHz (10 mW/MHz)
– 64 dBm for devices that do not meet the above requirement for relaxed sensing detection.
• Detecting radar: once the radar has been detected, the operating channel must be vacated. The device must not utilize the channel for thirty minutes, which is called the non-occupancy period.
The FCC has identifi ed six diff erent radar waveforms that need to be used for testing the Unlicensed National

The Radio Science Bulletin No 362 (September 2017) 77
Radar Type
Pulse Width(μs)
Pulse Repetition Interval
(μs)
Number of Pulses
Number of Bursts
Minimum Detection
ProbabilityComments
1 1 1428 18 N/A 60% Short pulse radar 2 1-5 150-230 23-29 N/A 60% Short pulse radar 3 6-10 200-500 16-18 N/A 60% Short pulse radar 4 11-20 200-500 12-16 N/A 60% Short pulse radar
5 50-100 1000-2000 1-3 8-20 80% Long pulse radar, with chirp width 5-20 MHz
Table 1. Radar test waveforms for a dynamic frequency-selection algorithm.
Figure 2. Common spectrum-awareness techniques.
Information Infrastructure devices that operate in this band. Table 1 provides the fi ve test waveforms as defi ned by the FCC [6]. The sixth waveform is for frequency-hoping radar, with a pulse width of 1 μs, a pulse repetition interval of 333 μs, nine pulses per frequency hop, a hoping-sequence length of 300 ms, and a hoping rate of 333 Hz. The minimum detection probability of this test is 70%. For all of these test waveforms, the minimum number of trials to ensure that the device passes the test is 30 trials.
3. Spectrum-Sharing Overview
Dynamic spectrum sharing i nvolves two main tasks: spectrum awareness and dynamic spectrum access (DSA).
3.1 Spectrum Awareness
Spectrum awareness refers to the w ay users capture information about the RF environment in order to be aware about other users using the spectrum. Figure 2 illustrates the common spectrum-awareness techniques.
Signal sensing refers to tuning to the band of interest, and receiving and processing I/Q samples to assess if there are detectable signals in the spectrum. This can be subdivided into two types: cooperative detection and transmitter detection. Cooperative detection refers to the case where there are several sensors that are geographically spread and share the spectrum measurements. If the information collected from diff erent sensors is processed at a central unit, then it is called centralized detection. If the information collected from diff erent sensors is shared among them, but each device makes its own decision, then it is called distributed detection [6]. For transmitter detection, the following techniques have been proposed [1]:
• Energy Detection (ED): This compares the energy
received in a given band with a predefi ned threshold. This algorithm does not require knowing the nature of the transmitted signal, but it does not perform well under low SNR (signal-to-noise-ratio) conditions.
• Matched Filter: This correlates the received signal with the known signal. This algorithm requires knowing the characteristics of the transmitted signal, and performs well in low-SNR conditions.
• Cyclostationary Feature Detection: This correlates the received modulated signals with either sine-wave carriers, pulse trains, or cyclic prefi xes. That is in turn based on knowing certain features of the received signal. The signal detection is performed by analyzing the spectral correlation function.
• Covariance-based detection (CBD): The detection is performed by comparing the correlations between the received signal and the non-zero lags with the correlations between the received signal and the zero lag.
• Sensing using MIMO (multiple-input multiple-output) systems: when the device is equipped with multiple antennas, it can use eigenvalue-based detection (EBD) for spectrum sensing.
For spectrum sensing, it is important that the devices initially monitor the channel, and periodically monitor it, as well. Some of the important parameters for spectrum-sensing algorithms are the detection threshold level, how often and how long the channel needs to be monitored.
Another method for spectrum awareness is using a geo-location database. This is useful for systems with fi xed locations, as in the case of fi xed radar systems (such as terminal Doppler weather radar systems). In this method, the device is equipped with a Global Positioning System (GPS), and it has access to a database that contains the locations of systems that have the right to use the spectrum

78 The Radio Science Bulletin No 362 (September 2017)
in diff erent geographical areas [6]. In beacon-spectrum-sharing approaches, the device that wishes to access the spectrum as a secondary user must have the ability to receive certain control signals sent by the incumbent system during the period that spectrum sharing is allowed. The device should not start transmitting without receiving this beacon signal, and it should stop once it stops receiving it [6].
3.2 Dynamic Spectrum Access
There are two main models for dynamic spectrum access: opportunistic spectrum access (OSA) and concurrent spectrum access (CSA). For opportunistic spectrum access, one of the users has priority access to the spectrum. This type of user is called the primary user (PU). Any other user sharing the spectrum with the primary user is called secondary user (SU). The secondary user cannot access the spectrum as long as the primary user is using it. The secondary user will use spectrum sensing or will query a database to determine the times that the primary user is not using the channel, in order to opportunistically access it. A good example for such an approach is the dynamic-frequency-selection algorithm mandated in the Unlicensed National Information Infrastructure-2A and Unlicensed National Information Infrastructure-2C bands. For concurrent spectrum access, diff erent users are allowed to share the spectrum together as long as it is done in a fair manner, and as long as the interference generated at each receiver is below a certain threshold. In the next sections, we will examine the spectrum-sharing techniques proposed for the coexistence between communications and radar systems.
4. Spectrum Sharing Between Communications and Radar
Syste ms
DARPA (the US Defense Advanced Research Projects Agency) has launched the SSPARC (Shared Spectrum Access for Radar and Communications) program to promote research and development for spectrum sharing between communications and radar systems [12]. In order to develop an eff ective spectrum-sharing algorithm, it is important to fi rst analyze the eff ect that each system has on the other.
For analyzing the eff ect of communications systems on radar performance, the authors in [13] provided a mathematical model for the interference generated from a cellular system on radars in the 3.5 GHz band. They proved that the interference generated from cellular systems in a correlated shadow-fading channel had a log-normal distribution. They provided the bounds on the radar’s probability of detection under cellular interference when there was no constraint on the transmitted power level of the cellular system. The paper showed that such interference can considerably degrade the performance of a radar system in terms of accurate detection of targets. The work in [14] used simulations to show that communications system
interference can signifi cantly degrade radar performance. The authors in [15] confi rmed the same conclusion after examining the impact of in-band OFDM interference on radars. In [16], the authors performed system-level analysis for the coexistence between a time-division long-term-evolution (TD-LTE) system and a radar system in the 2300 MHz to 2400 MHz band, and studied the eff ects on each other under diff erent isolation distances and frequency spaci For analyzing the eff ects of radar on communications system performance, the authors in [17] provided an analytical model to study the eff ect of an unaltered radar signal on the bit-error rate of a communications system. The authors in [18] analyzed the bit-error rate of TD-LTE in the 2300 MHz to 2400 MHz frequency band with the presence of radar-signal interference. In [19], a system-level analysis was performed for quantifying the impact of ship-borne radar on an outdoor LTE base station (eNodeB) in the 3.5 GHz band. The results showed that a radar signal can decrease the SINR (signal-to-interference-plus-noise ratio) at the LTE eNodeB, but the SINR level improved in between radar pulses. The results also showed that the exclusion zones set by the National Telecommunications and Information Administration to protect the performance of commercial communications systems when sharing the spectrum at 3.5 GHz were too conservative. The same conclusion was confi rmed in [20], where a fi eld experiment was performed in St. Inigoes, Maryland, for the coexistence between a TD-LTE system and a land-based AN/SPN-43C radar in the 3.5 GHz band.
These research contributions illustrated that when a radar system shares the spectrum with a communications system, it is more vulnerable to interference because of the radar system’s sensitivity. Furthermore, LTE systems in particular deploy several interference-management mechanisms to reduce the eff ect of interference on the performance. For the downlink, the eNodeB can deploy a frequency-selective scheduler (FSS), which uses the channel-quality indicator (CQI) reporting from the UE, and can perform frequency-domain scheduling and avoid assigning physical resource blocks (PRBs) that have excessive interference or fading to that UE. Moreover, LTE can deploy interference shaping to minimize the inter-cell interference, where a low-loaded eNodeB does not rapidly change its frequency-domain allocations in order to improve the quality of the channel-quality indicator reporting for the UEs served by a neighboring high-loaded eNodeB [21]. For the uplink, LTE uses both open-loop and closed-loop power control with interference awareness, where the eNodeB takes into account the neighboring cells when adjusting the uplink power transmission for the UEs, thus reducing the inter-cell interference and improving the overall uplink data rates [22].
Several research campaigns have investigated developing spectrum-sharing techniques for coexistence between radar and communications systems. As shown in [7], the approaches for radar and communications systems can be broadly classifi ed into three broad categories:

The Radio Science Bulletin No 362 (September 2017) 79
• Cognit ive communicat ions system: These communications systems are aware of the RF environment, and can dynamically adapt to avoid harmful interference to radar systems.
• Cognitive radars: The radar is cognitive and responsible for not aff ecting the performance of the communications system.
• Joint cognition: Both the radar and the communications system collaborate to avoid creating harmful interference to each other.
4.1 Cognitive Commu nications Systems
The term cognitive radio refers to a system that has the ability to sense the surrounding RF environment, to make short-term predictions, to learn how to operate in a given environment, and to dynamically adjust its transmitting parameters. These capabilities are used by a communications system that acts as a secondary user when sharing the spectrum with radar systems. The fi rst example of this category is the dynamic frequency selection (DSF) mandated by the FCC for devices operating in the 5 GHz band. A very important aspect of dynamic frequency selection is spectrum sensing. Accordingly, several research eff orts have been undertaken to improve the sensing capabilities of communications systems, such as employing cooperative sensing using multiple sensors [23, 24]. The authors in [25] investigated using a radio environment map (REM) to enhance spectrum awareness for communications systems sharing the frequency band with radars. In [26], the authors explored using multiple transmitting antennas at the communications-system side for sharing the spectrum with radars in the 5 GHz band, while still employing dynamic frequency selection and adhering to the regulatory constraints of the maximum transmitted power.
The authors in [27] introduced a spectrum-sharing algorithm to address the coexistence issue between an OFDM communications system and a rotating radar. One of the main requirements for this algorithm is that the base station, which is the secondary user, needs to be able to communicate with its mobile terminals over a diff erent frequency band in addition to that shared with the radar system. Another constraint is that the base station must not generate harmful interference to the radar system, determined by the maximum interference-to-noise-ratio threshold at the radar. In other words, the detection capabilities of the radar must not be compromised. The basic concept is that the communications system can utilize the period when the antenna beam of the rotating radar is not within the range of the communications system’s transmission. They showed that communications systems can achieve a signifi cant increase in the downlink throughput if they can tolerate the interruptions due to radar rotations.
The authors in [28] investigated and validated the feasibility of adjacent-channel coexistence of an LTE system and an air-traffi c-control radar (with a rotating main beam) in the L band through system-level simulation.
The authors in [29] investigated the coexistence between WiMax (Worldwide Interoperability for Microwave Access) networks and nearby ground-based radar systems that operated in an adjacent frequency channel within the S band. They proposed four diff erent interference-mitigation techniques for WiMax, using either spatial, spectral, temporal, or system-level modifi cation domains.
4.2 Cognitive Radar
The concept of cognitive radar was fi rst introduced in [30]. Cognitive-radar techniques have shown the ability to improve the overall performance of the radar [31]. With cognitive techniques and with MIMO technology, radar systems can become more resilient by implementing interference-mitigation algorithms. When the radar acts as the secondary user, it will need to perform spectrum sensing, as shown in [32] and [33]. The approaches for spectrum sharing while using cognitive radars can be categorized into two sub-categories: waveform shaping and waveform design.
4.2.1 Waveform Shaping
When a radar employs a MIMO system, it becomes capable of reshaping the radar’s waveform. In [34], a novel algorithm was proposed for a coherent MIMO radar that can minimize the interference generated by signals from communications systems coming from any direction: the main lobe or the directions of the sidelobes. In this approach, the radar transmits and receives coherent orthogonal phase-coded waveforms from each of the antenna elements. The work in [35] provided the mathematical proof for this approach, and the conditions for the MIMO radar’s main-lobe interference cancellation. The authors in [36] provided a practical pre-coding approach for the coexistence between MIMO radar and multiple communications-transmitter-receiver pairs, where the radar transmitter applied a zero-forcing pre-coder that eliminated the interference at the communications-system’s side. This approach required perfect knowledge of the interference-channel matrix at the radar’s side. They therefore proposed a channel-estimation algorithm that required the multiple communications transmitters to coordinate in transmitting training symbols. In [37], the authors proposed an algorithm for spectrum sharing between a MIMO radar and a communications system by projecting the radar’s waveform into the null space of the interference-channel matrix between the two systems. The authors in [38] extended that work from one communications system into multiple communications systems, and provided a new projection algorithm for this case. The authors in [39] extended the work in [37] for a

80 The Radio Science Bulletin No 362 (September 2017)
maritime MIMO radar, where they considered the variations in the channel due to the motion of the ship.
4.2.2 Waveform Design
S ince cognitive radars have the ability to modify their transmitted waveform based on the preceding returns, the authors in [40] investigated a radar waveform design for the coexistence with a friendly communications system. They proposed using an SNR-based water-fi lling technique that minimized the interference at the communications system. In [41], the authors proposed information-theoretic waveform design for MIMO radars in the frequency domain to reduce the amount of interference produced to a coexisting communications system. The authors in [42] designed a fi nite-alphabet binary-phase-shift-keying (BPSK) waveform for stationary and moving maritime MIMO radars in a way that did not generate interference to the communications systems operating in the same band. In [43], the authors introduced a mutual-information- (MI) based criterion for OFDM radar waveform optimization in a joint radar and multiple-base-station setup.
4.3 Joint Cognition
In recent years, joint radar and communications system spectrum-sharing techniques have gained a lot of interest, because of the potential to enhance the spectrum-sharing performance due to the additional degrees of freedom. In [44], the authors introduced the concept of bandwidth sharing between multimodal radar and a communications system. A multimodal radar has the ability to vary its bandwidth (and, accordingly, its resolution) based on its current needs. This allows the communications system to utilize the remaining bandwidth. The priority for the radar was determined using fuzzy logic, and the priority for the communications system was assumed. The authors in [45] pointed out the challenge of this approach, given the congestion of the RF spectrum. They hence developed novel spectrum-sharing techniques for adaptable radars, where using multi-objective optimization the radar selected the optimal sub-band in a highly congested frequency band to both maximize the SINR and minimize the range-resolution cell size. The authors in [46] proposed to design the OFDM waveform for both a multimodal radar and a communications system by assigning OFDM sub-carriers based on maximizing the radar’s detection performance and the communications system’s channel capacity. The authors in [47] proposed a joint design and operation between a radar and a communications system based on transmitting and receiving optimization procedures to maximize forward-channel SNR while simultaneously minimizing co-channel interference. The authors in [48] presented an algorithm for the co-design of a MIMO radar and a MIMO communications system for spectrum sharing based on a cooperative approach to mitigate mutual interference. The work in [49] extended this cooperative approach for a
radar system operating in the presence of clutter. The work in [50] further extended it for a scenario where all radar targets fall in diff erent range bins.
5. Conclusion
Spe ctrum sharing between radar and communications systems is one of the important solutions proposed to help with the RF congestion problem. The impact this technology may have is proportional to the amount of spectrum aff ected, and radar systems consume a huge amount of spectrum while operating. In this paper, we have presented diff erent radar systems within the 5 GHz band along with the spectrum regulations in this band. We have presented the basic concepts of spectrum sharing, and have performed an updated survey of the spectrum-sharing contributions for the coexistence between communications and radar systems. We conclude that spectrum sharing between radar and communications systems is defi nitely feasible, but a lot of research is still required in order to ensure that the radar’s performance will not be aff ected while improving the spectrum effi ciency for communications.
6. References
1. Y. C. Liang, K. C. Chen, G. Li, and P. Mahonen, “Cog-nitive Radio Networking and Communications: An Overview,” IEEE Transactions on Vehicular Technology, 60, 7, September 2011, pp. 3386-3407.
2. Offi ce of the Press Secretary, “Presidential Memorandum: Unleashing The Wireless Broadband Revolution,” The White House, Press Release, June 2010, available: https://www.whitehouse.gov/the-press-office/presidential-memorandum-unleashing-wireless-broadband-revolu-tion.
3. Offi ce of the Press Secretary, “Presidential Memoran-dum: expanding America’s Leadership in Wireless Innovation,” The White House, Press Release, June 2013, available: https://www.whitehouse.gov/the-press-office/2013/06/14/presidential-memorandum-expanding-americas-leadership-wireless-innovations.
4. Deputy Secretary of Defense, “Electromagnetic Spectrum Strategy,” Department of Defense, A Call to Action, September 2013.
5. F. D. Moorefi eld, DoD Chief Information Offi cer, “As-sured Dynamic Spectrum Access, Evolving toward Revolutionary Change: DoD Prospective,” Department of Defense, Brief to DoD UAS Summit, March 2015.
6. Rebecca Blank and Lawrence E. Strickling, “Evaluation of the 5350-5470 MHz and 5850-5925 MHz Bands Pursuant to Section 6406(b) of The Middle Class Tax Relief and Job Creation Act of 2012,” Department of Commerce, Technical Report, January 2013.

The Radio Science Bulletin No 362 (September 2017) 81
7. H. T. Hayvaci and B. Tavli, “Spectrum Sharing in Radar and Wireless Communication Systems: A Review,” In-ternational Conference on Electromagnetics in Advanced Applications (ICEAA), August 2014, pp. 810-813.
8. FCC, “Amendment of the Commission’s Rules with Regard to Commercial Operations in the 3550-3650 MHz Band,” Federal Communications Commission, Report and Order and Second Further Notice of Proposed Rulemaking, April 2015.
9. M. M. Sohul, M. Yao, T. Yang, and J. H. Reed, “Spec-trum Access System for the Citizen Broadband Radio Service,” IEEE Communications Magazine, 53, 7, July 2015, pp. 18-25.
10. ITU, “Characteristics of and Protection Criteria for Sharing Studies for Radiolocation (except Ground Based Meteorological Radars) and Aeronautical Radionaviga-tion Radars Operating in the Frequency Bands between 5 250 and 5 850 MHz,” International Telecommunication Union, Recommendation ITU-R M.1638-1, M-Series, January 2015.
11. FCC, “Revision of Part 15 of the Commission’s Rules to Permit Unlicensed National Information Infrastructure (U-NII) Devices in the 5 GHz Band,” Federal Communi-cations Commission, First Report and Order, April 2014.
12. Joseph B. Evans, “Shared Spectrum Access for Radar and Communications (SSPARC),” DARPA, Press Release, available: http://www.darpa.mil/program/shared-spectrum-access-for-radar-and-communications.
13. A. Khawar, A. Abdelhadi, and T. C. Clancy, “A Mathematical Analysis of Cellular Interference on the Performance of S-Band Military Radar Systems,” IEEE Wireless Telecommunications Symposium (WTS), April 2014, pp. 1-8.
14. M. R. Bell, N. Devroye, D. Erricolo, T. Koduri, S. Rao, and D. Tuninetti, “Results on Spectrum Sharing Between a Radar and a Communications System,” International Conference on Electromagnetics in Advanced Applica-tions (ICEAA), August 2014, pp. 826-829.
15. B. D. Cordill, S. A. Seguin, and L. Cohen, “Electro-magnetic Interference to Radar Receivers due to In-Band OFDM Communications Systems,” IEEE International Symposium on Electromagnetic Compatibility, August 2013, pp. 72-75.
16. W. Liu, J. Fang, H. Tan, B. Huang, and W. Wang, “Coexistence Studies for TD-LTE with Radar System in the Band 2300-2400 MHz,” International Conference on Communications, Circuits and Systems (ICCCAS), July 2010, pp. 49-53.
17. N. Nartasilpa, D. Tuninetti, N. Devroye, and D. Erricolo, “Let’s Share CommRad: Eff ect of Radar Interference on an Uncoded Data Communication system,” IEEE Radar Conference (RadarCon), May 2016, pp. 1-5.
18. J. Han, B. Wang, W. Wang, Y. Zhang, and W. Xia, “Analysis for the BER of LTE System with the Inter-ference from Radar,” IET International Conference on Communication Technology and Application (ICCTA 2011), October 2011, pp. 452-456.
19. M. Ghorbanzadeh, E. Visotsky, P. Moorut, W. Yang, and C. Clancy, “Radar In-Band and Out-Of-Band Interference into LTE Macro and Small Cell Uplinks in the 3.5 GHz Band,” IEEE Wireless Communications and Network-ing Conference (WCNC), March 2015, pp. 1829-1834.
20. J. H. Reed, A. W. Clegg, A. V. Padaki, T. Yang, R. Nealy, C. Dietrich, C. R. Anderson, and D. M. Mearns, “On the Co-Existence of TD-LTE and Radar over 3.5 GHz Band: An Experimental Study,” IEEE Wireless Communications Letters, 5, 4, August 2016, pp. 368-371.
21. R. Agrawal, A. Bedekar, H. Holma, S. Kalyanasunda-ram, K. Pedersen, and B. Soret, “Small Cell Interference Management,” in H. Holma, A. Toskala, J. Reunanen (eds.), LTE Small Cell Optimization: 3GPP Evolution to Release 13, West Sussex, United Kingdom, John Wiley & Sons Ltd, pp. 91-120, 2016.
22. Nokia Solution and Networks, “Smart Scheduler,” 2015.
23. L. S. Wang, J. P. Mcgeehan, C. Williams, and A. Doufexi, “Application of Cooperative Sensing in Radar-Communications Coexistence,” IET Communications, 2, 6, July 2008, pp. 856-868.
24. L. Wang, A. Doufexi, C. Williams, and J. McGeehan, “Cognitive Node Selection and Assignment Algorithms for Weighted Cooperative Sensing in Radar Systems,” IEEE Wireless Communications and Networking Con-ference, April 2009, pp. 1-6.
25. F. Paisana, Z. Khan, J. Lehtomäki, L. A. DaSilva, and R. Vuohtoniemi, “Exploring Radio Environment Map Architectures for Spectrum Sharing in the Radar Bands,” 23rd International Conference on Telecommunications (ICT), May 2016, pp. 1-6.
26. J. Um, J. Park, and S. Park, “Multi-Antenna-Based Transmission Strategy in 5 GHz Unlicensed Band,” Eighth International Conference on Ubiquitous and Future Networks (ICUFN), July 2016, pp. 651-655.
27. R. Saruthirathanaworakun, J. Peha, and L. Correia, “Opportunistic Sharing between Rotating Radar and Cellular,” IEEE Journal on Selected Areas in Com-munications, 30, 10, November 2012, pp. 1900-1910.
82 The Radio Science Bulletin No 362 (September 2017)
28. H. Wang, J. Johnson, C. Baker, L. Ye, and C. Zhang, “On Spectrum Sharing between Communications and Air Traffi c Control Radar Systems,” IEEE Radar Conference (RadarCon), May 2015, pp. 1545-1550.
29. A. Lackpour, M. Luddy, and J. Winters, “Overview of Interference Mitigation Techniques Between WiMAX Networks and Ground Based Radar,” Annual Wireless and Optical Communications Conference (WOCC), April 2011, pp. 1-5.
30. S. Haykin, “Cognitive Radar: A Way of the Future,” IEEE Signal Processing Magazine, 23, 1, January 2006, pp. 30-40.
31. A. Martone, “Cognitive Radar Demystifi ed,” URSI Radio Science Bulletin, 350, September 2014, pp. 10-22.
32. M. T. Mushtaq, F. A. Butt, and A. Malik, “An Overview of Spectrum Sensing in Cognitive Radar Systems,” IEEE Microwaves, Radar and Remote Sensing Symposium (MRRS), September 2014, pp. 115-118.
33. P. Stinco, M. S. Greco, and F. Gini, “Spectrum Sensing and Sharing for Cognitive Radars,” IET Radar and Sonar Navigation, 10, 3, March 2016, pp. 595-602.
34. H. Deng and B. Himed, “Interference Mitigation Processing for Spectrum-Sharing Between Radar and Wireless Communications Systems,” IEEE Transactions on Aerospace and Electronic Systems, 49, 3, July 2013, pp. 1911-1919.
35. Z. Geng, H. Deng, and B. Himed, “Adaptive Radar Beamforming for Interference Mitigation in Radar-Wireless Spectrum Sharing,” IEEE Signal Processing Letters, 22, 4, April 2015, pp. 484-488.
36. A. Babaei, W. H. Tranter, and T. Bose, “A Practical Pre-coding Approach for Radar/Communications Spectrum Sharing,” International Conference on Cognitive Radio Oriented Wireless Networks, July 2013, pp. 13-18.
37. S. Sodagari, A. Khawar, T. Clancy, and R. McGwier, “A Projection Based Approach for Radar and Telecom-munication Systems Coexistence,” IEEE GLOBECOM ‘12, December 2012, pp. 5010-538. A. Khawar, A. Abdel-Hadi, and T. C. Clancy, “Spectrum Sharing Between S-Band Radar and LTE Cellular System: A Spatial Approach,” IEEE International Symposium on Dynamic Spectrum Access Networks (DYSPAN), April 2014, pp. 7-14.
39. A. Khawar, A. Abdelhadi, and T. C. Clancy, “On the Impact of Time-Varying Interference-Channel on the Spatial Approach of Spectrum Sharing Between S-band Radar and Communication System,” IEEE Military Communications Conference (MILCOM), October 2014, pp. 807-812.
40. K. D. Shepherd and R. A. Romero, “Radar Waveform Design in Active Communications Channel,” Asilomar Conference on Signals, Systems and Computers, No-vember 2013, pp. 1515-1519.
41. S. Amuru, R. Buehrer, R. Tandon, and S. Sodagari, “MIMO Radar Waveform Design to Support Spectrum Sharing,” IEEE Military Communications Conference (MILCOM), November 2013, pp. 1535-1540.
42. A. Khawar, A. Abdel-Hadi, and T. Clancy, “MIMO Radar Waveform Design for Coexistence with Cellular Systems,” IEEE International Symposium on Dynamic Spectrum Access Networks (DYSPAN), April 2014, pp. 20-26.
43. M. Bica, K. W. Huang, V. Koivunen, and U. Mitra, “Mutual Information Based Radar Waveform Design for Joint Radar and Cellular Communication Systems,” IEEE International Conference on Acoustics, Speech and Signal Processing (ICASSP), March 2016, pp. 3671-3675.
44. S. Bhat, R. Narayanan, and M. Rangaswamy, “Band-width Sharing and Scheduling for Multimodal Radar with Communications and Tracking,” IEEE 7th Sensor Array and Multichannel Signal Processing Workshop (SAM), June 2012, pp. 233-236.
45. A. Martone, K. Sherbondy, K. Ranney, and T. Dogaru, “Passive Sensing for Adaptable Radar Bandwidth,” IEEE Radar Conference (RadarCon), May 2015, pp. 0280-0285.
46. S. Gogineni, M. Rangaswamy, and A. Nehorai, “Multi-Modal OFDM Waveform Design,” IEEE Radar Confer-ence (RadarCon), April 2013, pp. 1-5.
47. J. R. Guerci, R. M. Guerci, A. Lackpour, and D. Moskow-itz, “Joint Design and Operation of Shared Spectrum Access for Radar and Communications,” IEEE Radar Conference (RadarCon), May 2015, pp. 0761-0766.
48. B. Li, A. P. Petropulu, and W. Trappe, “Optimum Co-Design for Spectrum Sharing between Matrix Comple-tion Based MIMO Radars and a MIMO Communication System,” IEEE Transactions on Signal Processing, 64, 17, September 2016, pp. 4562-4575.
49. B. Li and A. Petropulu, “MIMO Radar and Commu-nication Spectrum Sharing with Clutter Mitigation,” IEEE Radar Conference (RadarCon), May 2016, pp. 1-6.
50. B. Li, H. Kumar, and A. P. Petropulu, “A Joint Design Approach for Spectrum Sharing Between Radar and Communication Systems,” IEEE International Con-ference on Acoustics, Speech and Signal Processing (ICASSP), March 2016, pp. 3306-3310.

The Radio Science Bulletin No 362 (September 2017) 83
Opening Speeches from theXXXIInd URSI General Assembly
and Scientifi c SymposiumFrom the President of URSI:
Paul S. CannonWelcome
Honored guests, Mesdames et Messieurs, Ladies and Gentlemen, Award Laureates: It is wonderful being
back again in Canada for this General Assembly.
I want to start by thanking the Canadian National Committee, chaired by Frank Prato, and the LOC, led by Fabrice Labeau, for the fantastic job that they have done in putting this meeting together. I would also especially like to thank the international team of Yihua Yan, the Scientifi c Program Coordinator, Prof. Peter Van Daele, Assistant Secretary General, and Dr. Ross Stone, Assistant Secretary General for the GASS. My special thanks go to Ross, for his diligence and attention to detail. This GASS has only been made possible by the many hours that he has worked.
I also want to thank the Commission Chairs and Vice Chairs for putting together the program with their conveners, and of course you, the authors, for attending. I hope that you learn, contribute, and of course have a very enjoyable time.
Other Organizations
Many of you will know that URSI is represented in other organizations. Similarly, those organizations nominate their members to join with us here at our URSI General Assembly and, in this context, I welcome:
• Harvey Liszt from IUCAF• Lucilla Alfonsi from SCAR• Ahmed Kishk from IEEE AP-S• Jean-Pierre Saint-Maurice from COSPAR• Cyril Mangenot from EurAAP.
In addition, we are honored to have with us Gordon McBean, who is the President of the International Union of Science (ICSU). URSI is a member of ICSU and, through it, is linked to the national academies throughout the world. If you remember nothing else about ICSU, please remember that it is ICSU that works to defend your right to speak as a scientist. Amongst others, ICSU requires as conditions for national membership freedom of movement, expression, and communication. These are the foundation stones of global science, rights that must be defended. Gordon
joined us this afternoon at the Council meeting, and will say a few words in a moment.
Shortly, we will move onto awarding our URSI prizes and medals. It is my very pleasant duty to recognize Mr. Balthasar van der Pol, the grandson and namesake of Prof. Balthasar van der Pol, after whom the gold medal is named. We are also honored to have with us Prof. Sunanda Basu, who has endowed the Santimay Basu prize in memory of her husband. Sunanda is this week attending her 15th consecutive URSI General Assembly.
Triennial Review
Much has changed in the last three years, and now I want to briefl y review those changes and initiatives.
1. During the last General Assembly, in Beijing, Commissions elected Early Career Representatives for the fi rst time, and they have met several times during the triennium. This new initiative, which recognizes the contribution made by those in the early stages of their careers, has been a great success. They have helped the Board in a number of ways, and I hope many of you attended their tutorials this morning. At the Commission Business Meetings here in Montreal, a further ECR will be elected, so that we reach a steady state of two ECRs per Commission.
2. This triennium, the Commission budgets have been enhanced by 25%, with a recommendation to increase this still further through a variable element to the budget that rewards the active Commissions.
3. We have run three fl agship meetings, AT-RASC in Gran Canaria, AP-RASC in Seoul, and the General Assembly here in Montreal. Both AT-RASC and AP-RASC were hugely successful, and I am sure this General Assembly will be, as well.
4. The extra work of running three meetings has necessitated an increase in the size of the Secretariat to now include Assistant Secretary Generals for each of the three meetings.
5. Annual meetings have signifi cantly increased the workload of the Commission offi cers. Consequently, at this General Assembly we are asking each Commission to initiate a Technical Advisory Committee to support the Commission offi cers.

84 The Radio Science Bulletin No 362 (September 2017)
6. The German Member Committee has graciously sponsored a Gold Medal to honor the work of Prof. Karl Rawer. It is distinguished from other senior awards by being for lifetime achievements.
7. We have introduced a President’s Prize that recognizes service to URSI over a long period.
8. Memoranda of Understanding have been signed with the IEEE Antennas and Propagation Society (AP-S), the European Association on Antennas and Propagation (EurAAP), the American Geophysical Union (AGU), and with IEEE Publications.
9. Radio Science, an URSI logo journal, is now available through IEEE Xplore as well as AGU. We believe that being available through both engineering and science platforms will enhance the impact factor of this journal.
10. The Radio Science Bulletin, together with back issues, is now also available through IEEE Xplore.
11. RSB has transitioned during this triennium into a magazine format.
12. In response to requests from both Council and the Commissions for more fl exible meeting contribution formats, we have introduced two standards. One is the conventional URSI extended abstract, but now there is a further option of submitting a summary paper of two to four pages.
13. The URSI Web site remains an important communications resource for URSI and has consequently been revised this triennium.
14. We now have a Twitter account, and for the fi rst time, a conference app.
15. And fi nally: URSI Individual Membership has been introduced. Individual URSI membership seeks the creation of a community of radio scientists and engineers. I strongly encourage you to apply through the URSI Web site as soon as possible. From January 2018, diff erential registration fees will apply to all URSI fl agship meetings, with Individual Members given preferential rates. Moreover, some of our MOU partners will also provide preferential registration to URSI Individual Members at their meetings. So, apply while you remember.
In Memoriam
It is now my sad duty to record the passing of distinguished colleagues during this triennium. Would you please join me in standing and remembering our illustrious predecessors?
Members of the Board and Secretariat
• Paul Delogne, Editor of the Radio Science Bulletin, President of the Belgian URSI Committee, and Assistant Secretary General of URSI.
• Richard (“Dick”) L. Dowden from New Zealand, Commission G and H pioneer exploring the electromagnetic spectrum from ULF to HF, and an URSI Vice President.
• Andrzej W. Wernik, leader of ionospheric and space research in Poland. He was Chair of Commission G, an Associate Editor of Radio Science, and Vice President and Treasurer of URSI.
Member Committee Chairs and Secretaries
• Thomas Damboldt, past Secretary of the German Member Committee.
• Michael Sexton, past Chair of the Irish Member Committee.
• Blagovest Shishkov, past Chair of the Bulgarian Member Committee.
• Martti Tiuri, past Chair of the Finnish Member Committee, and organizer of the 1978 GA in Helsinki.
• Gianni Tofani, Past President of the Italian Member Committee.
Commission Chairs and Offi cers
• Elio Bava from Italy and past Chair of Commission A.
• Stefan Ström from Sweden and a past Chair of Commission B.
Offi cial Members of the Commissions
• Esteban Bajaja, Argentinean offi cial member of Commission J.
• Yury V. Chugunov, Russian offi cial member of Commission H.
• Stéphane Claude, Canadian official member of Commission J.
• Richard Davis, UK offi cial member of Commission J.

The Radio Science Bulletin No 362 (September 2017) 85
• Ira Kohlberg, US offi cial member of Commissions B and E.
Finally, I ask you to remember:
Abdul Kalam, Indian space scientist, rocket engineer, and humanitarian, President of India from 2002-2005, and honored speaker at the 2005 URSI General Assembly in New Delhi.
I would now like to briefl y talk about
The Future
Science, and the engineering developments that fl ow from it, have made remarkable progress in the 19th, 20th, and 21st centuries, and they have driven economic development, the reduction in poverty, globalization, increased longevity, and much more. Indeed, they have driven just about everything including the regrettable as well as the good.
Much of science and engineering follows a reductionist approach that focuses on ever-reducing scales. But, while URSI supports the reductionist approach of single-discipline science, it also supports a holistic, multi-disciplinary, cross-Commission approach. URSI thus provides an opportunity to initiate and develop new interface disciplines. Given that these interface disciplines are often the source of new, exciting, and transformational ideas and technologies, URSI has a great opportunity to continue as a leading science and engineering union.
But can we do better at this? I believe that we can,
and I believe that URSI should have an increased emphasis on interdisciplinary and transdisciplinary workshops, where there are time and space to discuss details. Now that we have annual meetings, there really should be time to do this, and I call on the Commissions to consider this workshop proposal at their business meetings. Surely, this interdisciplinarity is the distinguishing feature of URSI, and it is one that we should celebrate.
It is not though the more-mature scientists that will achieve these transformational breakthroughs, but the younger among us. URSI has recognized this, and in this triennium, it has invested ~ €25K per fl agship meeting supporting the travel and subsistence of Young Scientist attendance at our meetings. This is again something that we should celebrate and extend.
Whether the Young Scientists stay with URSI or move onto supporting other organizations and unions will be dependent on how well URSI encourages the new science and technology of tomorrow. Encouraging the further globalization of science through the Young Scientists is, to some extent, reward in itself, but I would not be human if I did not seek to place URSI at the center of modern radio science, and this means that URSI has to
evolve further. For all Commissions, it is important that they be the fertile ground in which new science can grow. So please attend your Commission business meetings and contribute as much as you can.
For URSI to blossom, we also need to strengthen URSI within the Member Committees (countries) and to make URSI more useful to our Individual Members. As a fi rst step to growing our Member Committee activities and profi le, the Board has set up a standing committee. This will be responsible for developing strategies and initiatives to develop and strengthen current Member Committees and to adopt new Member Committees. Council discussed this during their meeting this morning, it will be discussed on Tuesday at the Member Committee Meeting, and again on Saturday at the fi nal Council meeting.
Closing
I hope that you all enjoy your week here and I look forward to meeting as many of you as possible.
From the Secretary General of URSI: Paul Lagasse
Distinguished guests, Mesdames et messieurs, Ladies and Gentlemen,
It is the traditional duty of the Secretary General to present a concise report of the scientifi c activities, the fi nances, and the general administrative situation of our Union. However, on this occasion it will be diff erent, for reasons I will explain immediately.
In the past triennium our President, Prof. Paul Cannon, has worked extremely hard to implement a number of important changes to the way URSI functions. In his speech a few moments ago, he gave an overview of the achievements of the past triennium. The amount of work this has required was immense. Establishing yearly URSI fl agship conferences, for example, has been a tremendous eff ort. There is no need for me to repeat the overview given by Paul Cannon, but I would like to emphasize that URSI owes him a debt of gratitude for his tireless eff orts.
There is second reason why my speech will be diff erent from previous GASS. It was 24 years ago, at the General Assembly in Kyoto in 1993, that I was for the fi rst time elected as Secretary General of URSI. 24 years is a long time, so I decided that this would be my last General Assembly as Secretary General. Therefore, if you would allow me, I would like to spend some time refl ecting on those past years and on the future of URSI.
First of all, let me emphasize that serving URSI for such a long period was a privilege, especially because it gave

86 The Radio Science Bulletin No 362 (September 2017)
me the opportunity to meet and work closely in subsequent URSI Boards and Commissions with distinguished scientists but also wonderful persons. Collaborating closely with so many scientists from all over the world was a most intellectually enriching and rewarding experience, the memories of which I will always cherish.
Including my service as Assistant Secretary General, I can look back at the evolution of URSI over almost 30 years. If I had to summarize it in a few words, I would say “from pigeonholes to Twitter.” The younger persons in the audience will know that URSI is now on Twitter, but might wonder whether URSI was ever involved in the raising of pigeons. I am referring simply to a time when not everybody was continuously connected to the Internet. So, at the GASS we had well over a thousand pigeonholes, in which paper messages were distributed by hand. The equivalent of “send all” was a serious burden on the secretaries, but at least the recipients were spared the current information overload. I could tell many more such anecdotes that would amaze the younger part of the audience, but let me move on to some policy considerations about URSI by trying to refl ect on following facts. In the past 30 years, wireless and mobile communications, radio sensing, and in general the applications of radio science, have gained a tremendous societal and economical importance. For example, living without a mobile phone has become unthinkable for billions of people on the planet, and the direct and indirect economic impact of wireless communications is immense. Although the subsequent Boards worked hard, URSI however over those past 30 years has not grown accordingly. Why is that, and more importantly, can we learn from it something that could be useful in the future?
To start with, we have to remember that URSI is a “Scientifi c Union,” and therefore devoted to science, and that it is a union of member territories and not of individuals. This makes us fundamentally diff erent from professional associations such as IEEE, and has a big impact on the management and decision-making process. Making the recently introduced URSI individual membership work in conjunction with the current statutory structure of URSI will be an interesting challenge for the next triennium. So, become a member and help us succeed in making URSI a truly international community of scientists.
The focus on science means that although industry spends heavily on research and development programs in our fi eld, the majority of the URSI community still comes from universities or government laboratories. University life has however also changed a lot over the years. I will not go back to the nineteen thirties, when university researchers would travel in a leisurely way by ship from Europe to the General Assembly in Australia during a couple of weeks, spend a couple of weeks at the General Assembly, and travel back by ship. Nevertheless, it is my impression that over the past 30 years, changes in university life have had an impact on the functioning of URSI. University researchers are under pressure to perform according to
some metrics such as number and impact of publications. My conclusion is that fi rst we have to fi nd ways in which engaging in URSI is relevant for and aligned with the academic career, so that there is a win-win for the scientist and for URSI. It is therefore important that URSI should provide an opportunity and a service to researchers in the broad fi eld of radio science that is useful for their work and their career. In the past years, we have worked hard to make URSI more attractive, especially to young university researchers and students, with actions such as support for student paper competitions and our Young Scientist program. Hopefully, our yearly URSI fl agship meetings will prove to be successful at providing a useful forum for the open, multidisciplinary exchange of ideas and scientifi c results in our fi eld. Our century-old GASS model, which provides us with the opportunity to meet and interact with colleagues working in the 10 URSI Commission fi elds, is therefore something we should keep and build on as a defi ning feature of URSI conferences. The introduction of “Early Career Representatives” has proven successful at providing input that will enable our Union to better cater for the needs of the young in as many countries and territories as we can reach. Involving young researchers in URSI is our best long-term investment for the future development of URSI. For the future of URSI, it is important that those actions should be further expanded and reinforced.
As URSI engages in more activities, the factor of workload must also be taken into account. Devoting time to an organization such as URSI – for example, by helping to organize URSI fl agship meetings – is in most universities nowadays no longer counted as a relevant factor for tenure or promotion. This means that a sizable amount of the organizational workload will have to be carried out by scientists at liberty to allocate their time as they wish or by professional help. Both have implications: the fi rst regarding the continuity of the work; the second has fi nancial consequences. Organizing a yearly fl agship meeting with AT-RASC and AP-RASC has more than doubled the workload for the Secretariat compared to the situation with one GASS per three years. In the past triennium, thanks to the unselfi sh help of an increased number of Assistant Secretary Generals, we were able to carry the load without hiring extra help. Without George Uslenghi for AT-RASC, Kazuya Kobayashi for AP-RASC, and Ross Stone for the GASS, it would not have been possible. Although relying on volunteers is common in many organizations, it represents a vulnerability in a complex multinational organization such as URSI if it is carried to a too-large extent.
From a fi nancial point of view, URSI is luckily in good shape. Thanks to the fact that for the past two decades the Secretariat has been in a constant cost-cutting mode, we have substantial fi nancial reserves. This is necessary, since on the income side we are faced with overall slowly diminishing contributions from the Member Committees. The past triennium was a particular challenge, because launching AT-RASC and supporting AP-RASC represented a sizable fi nancial risk, especially since in the

The Radio Science Bulletin No 362 (September 2017) 87
past triennium the budget allocated to the Commissions was also increased. On top of that, in order to enhance the visibility and impact of URSI, our Web site was completely updated. Looking at the actual (market) value of the URSI assets, it appears that we managed to take this hurdle with only a minimal reduction in our ample reserves. As future fl agship conferences hopefully will positively contribute to the budget, the future Boards will therefore be able to develop new initiatives that will enhance our service to the radio science community in general, and to our younger colleagues in particular.
Permettez moi maintenant de vous énumérer brièvement quelques des changements et des initiatives prises au cours de la période triennale passée. La réalisation la plus importante a été l’organisation de conférences annuelles notamment AT-RASC aux iles Canarie et AP-RASC à Seoul. Le fait de faciliter les contacts et les échanges scientifi ques à un rythme annuel au lieu de triennal a été jugé essentiel pour dynamiser la communauté URSI dans une période ou l’évolution scientifi que devient de plus en plus rapide. Dans ce même cadre nous avons instauré la possibilité pour des scientifi ques de devenir membre de URSI à titre individuel tout en gardant la structure statutaire de Comités membres. Il est important de noter que nous avons réussi à réaliser ceci tout en limitant fortement l’impact budgétaire pour URSI.
Au cours de la dernière assemblée générale à Beijing, les commissions ont élu pour la première fois des Early Career Representatives ou ECR qui ont pour mission de conseiller le bureau et les Commissions de URSI sur des actions portant à rendre URSI plus intéressant et utile au chercheurs dans les premiers stades de leur carrière scientifi que. Par exemple, les ECR ont apporte une aide précieuse au renouveau du site Web de URSI. Les contributions des ECR ont aussi été très utiles pour guider l’évolution de la publication URSI, le Radio Science Bulletin. Grace au eff orts du rédacteur en chef Ross Stone, le Radio Science Bulletin est maintenant disponible dans la banque de données IEEE Xplore ce qui augmente fortement la dissémination de nos publications. On peut espérer que ceci mènera dans l’avenir à l’obtention d’un facteur d’impact.
L’augmentation du budget des Commissions a permis que dans le cadre de ces conférences annuelles URSI, le programme supportant des jeunes scientifi ques soit considérablement renforcé. C’est une action cruciale pour URSI dont l’avenir dépendra de l’intérêt qu’on pourra susciter auprès des jeunes doctorants et chercheurs.
A ce point je voudrais annoncer le résultat de l’élection de ce matin pour le bureau qui sera en fonction le prochain triennat.
Regarding the new Board, it is my pleasure to announce the results of the elections that were held this morning:
President: Prof. Makoto Ando
Vice Presidents:• Prof. Willem Baan• Prof. Ondrej Santolik• Prof. Ari Sihvola• Prof. Piergiorgio L. E. Uslenghi
Secretary General: Prof. Peter Van Daele
First, I would like to thank now the Canadian Local Organizing Committee, the National Research Council of Canada, and the Professional Conference Organizer for a tremendous job in making this complex conference with 10 Commission, Council, and Board meetings possible. Special thanks are due to Fabrice Labeau, who together with Yihua Yan, the Scientifi c Program Coordinator, Peter van Daele, and Ross Stone took care of the scientifi c program.
It is obviously completely impossible for me to thank nominally all the persons with whom I had the pleasure and privilege to work with during my 24-year tenure as Secretary General. However, I owe a special debt of gratitude to all the URSI Presidents with whom I had the pleasure to collaborate closely with: Pierre Bauer, Tom Senior, Hiroshi Matsumoto, Kristian Schlegel, Francois Lefeuvre, Gert Brussaard, Phil Wilkinson, and Paul Cannon. I will always remember with pleasure the intense and rewarding discussions I had with each of them about how to improve the functioning of URSI, next to the more relaxing moments of friendship.
I would like to especially express my most sincere thanks to the long standing members of the Secretariat, Peter Van Daele, Ross Stone, Inge Heleu, and Inge Lievens. Without the help of this wonderful team, none of what we achieved for URSI would have been possible. It is their dedication to URSI that keeps the Secretariat of our union functioning smoothly.
I am confi dent that Peter Van Daele will prove to be an excellent Secretary General. His long experience as Assistant Secretary General, coupled to his commitment for URSI, will enable him to successfully tackle the challenge of further improving the functioning of URSI.
Finally, my sincere thanks to the whole URSI community for a wonderful 24 years!
I wish you all a most fruitful, rewarding and pleasant GASS in this magnifi cent city of Montreal. Thank you.

88 The Radio Science Bulletin No 362 (September 2017)
In Memoriam:Larissa Vietzorreck
Dr.-Ing. Larissa Vietzorreck, the President of the German
URSI Member committee, passed away on October 26, 2017, in Munich, at the age of only 52, after a long battle against cancer. With her, we lost not only a very engaged colleague, but also a dear friend. We will deeply miss her.
Larissa Vietzorreck was born on April 30, 1965, in Düsseldorf, Germany. She received her master’s degree in Electrical Engineering (Dipl.-Ing.) from the Ruhr-Universität Bochum, Germany, in 1992. From 1992 to 1997, she was a Research Assistant in the Department of Electrical Engineering of the FernUniversität in Hagen, where she worked under the guidance of Prof. Reinhold Pregla toward her doctoral degree. In 1998, she was invited by Prof. Peter Russer to join his Chair of High-Frequency Engineering at the Technical University of Munich, Germany, as a senior researcher.
On the suggestion of Prof. Robert Weigel, she was appointed Guest Professor at the University of Erlangen-Nuremberg in the summer of 2013.
Her research work comprised design and numerical modeling of planar microwave components and microelectromechanical systems (MEMS). Together with the University of Perugia, Alenia Space Italy, and ITC-Irst Trento, MEMS-based ohmic and capacitive switches and switchable circuits were developed. Other collaborations existed with the University of Nis, IMT Bukarest, XLIM Limoges, METU Ankara, IMEC, and Bosch, etc.
She was a highly esteemed scientist and member of the electromagnetics and microwave communities, and volunteered for the IEEE, for URSI, and for EuMA. In 1999, she was conference secretary of the European Microwave Conference in Munich. She was a member of the Technical Program Committee of the European Microwave Conference, the MEMSWAVE Symposium, and other conferences. Recently, she was a member of the Board of Directors and work-package leader in the EU-funded
European Network of Excellence AMICOM. In 2005, she organized a workshop on Design and Modeling Methods for RF MEMS, in conjunction with the DTIP in Montreux, with participation of the NoE Dfmm-Patent. She has authored or co-authored more than 125 articles in journals and conference proceedings.
Since 2001, she was registrar for graduate studies at the Faculty of Electrical Engineering and Information Technology. She furthermore organized an annual one-week workshop for 10-13-year-old girls in the framework of the TUM program, “Girls Make Techniques.”
During her scientifi c career, she was closely related to the
German URSI. Already as a young scientist, she presented her fi rst talk in the 1990s at the German Kleinheubacher Tagung, in the legendary castle of Kl einheubach. Later on, she became the scientifi c chair of the Kleinheubacher Tagung, and in 2013, she was elected as the Vice President of the German URSI. She immediately became a key person of the German URSI board, and organized the fi rst German URSI prize: the Karl-Rawer Gold Medal. As the leader of the German URSI delegation at the URSI GASS 2017 in Montreal, she presented Karl-Rawer Gold Medal to the fi rst laureate, Prof. Bilitza. In 2016, Larissa Vietzorreck was elected by the German URSI member committee as the 2017 President of the German URSI. She guided her Kleinheubacher Tagung and the meeting of German URSI members in late September 2017.
However, the life of Larissa Vietzorreck was not only determined by science and electrical engineering. She loved to be on travel all over the world, but her proper passion was singing in a choir. Over the years, she was strongly engaged in several classical choirs, the Arcis-Vocalists and ensemble CHRISMOS, and others.
Eckard Bogenfeld, Thomas Eibert, Wolfgang Mathis, Peter Russer, Robert Weigel
E-mail: [email protected]

The Radio Science Bulletin No 362 (September 2017) 89
In Memoriam:Thomas B. A. Senior
Thomas B. A. Senior, Professor
Emeritus of Electrical Eng inee r ing and Computer Science and a member of the Radiation Laboratory of the University of Michigan, peacefully passed away November 24, 2017, at the age of 89. Prof. Senior was a devoted member of the Electrical and Computer Engineering Department at the University of Michigan for 41 years as an active faculty member, and another 19 as an emeritus faculty. He was known for his fundamental contributions to electromagnetic and acoustic scattering, for his signifi cant service and leadership to his department and professional community, and for his excellence as an educator.
Born on June 26, 1928, in Yorkshire, England, Prof. Senior received his MSc and PhD in Applied Mathematics respectively from Manchester and Cambridge Universities in 1950 and 1954. He joined the University of Michigan in 1957 as a researcher at the famed Willow Run Laboratories. He was specifi cally recruited by Kip Siegel for his experience in detecting V2 missiles, fi rst launched in WWII.
An applied mathematician and researcher of over 50 years, Thomas B. A. Senior performed pioneering work in radar cross section (RCS) control, a measurement of how detectable on object is by radar. Prof. Senior’s research turned to the detection of stealth aircraft in the 1960s. Working in the days before computers, he created many of the analytical tools needed to predict how radar cross section reduction can be accomplished using shaping and radar-absorbing materials. His research directly impacted the design of stealth aircraft in the US. During the 1970s, Senior and his group were the fi rst to recognize how large wind turbines can cause interference with electromagnetic systems, such as televisions. He developed procedures that are now part of all environmental assessments of wind turbines.
During his career, Prof. Senior authored or coauthored three books. The fi rst, Electromagnetic and Acoustic Scattering by Simple Shapes, was a foundational work that emerged from Willow Run research on the radar
detection of aircraft and missiles. The other two were Mathematical Methods in Electrical E n g i n e e r i n g a n d A p p r o x i m a t e Boundary Conditions in Electromagnetics. He also authored more than 250 refereed journal articles. He chaired more than 20 PhD committees. He received numerous awards, including the
IEEE Antennas and Propagation Society Distinguished Achievement Award, the URSI van der Pol Gold Medal, and the IEEE Electromagnetics Award, which is the highest technical fi eld award given in this area.
However, research was only part of the legacy of Prof. Senior. His contributions to his department and profession, and his devotion to his students, were equally remarkable. Prof. Senior served as Acting Chair for the EECS Department in 1987; Associate Chair for Academic Aff airs from 1988 to 1998; Associate Chair of the former Electrical Science and Engineering Division from 1984 to 1998; and as Director of the Radiation Laboratory (RADLAB) from 1974 to 1987, and Associate Director from 1962-94. He also served in a variety of leadership roles in the International Union for Radio Science (URSI), including as President from 1996-1999 and Past President from 1999-2002.
Prof. Senior was reserved but very personable. A former PhD student of his (Ivan LaHaie) wrote the following about him:
Personally, Tom was the consummate English gentleman. His genteel and considered approach to interactions with his students often belied the true caring and kindness he felt for them. As a student of Tom’s in the late ‘70s, I always approached our meetings with a great deal of forethought and (unnecessary) trepidation. One particular instance, which I have shared many times, took place in the summer of 1979, when, in the middle of my thesis research, I was off ered the opportunity to travel Europe for eight weeks as the audio engineer for a local jazz-rock band. I knew this would require Prof. Senior’s permission, since I was

90 The Radio Science Bulletin No 362 (September 2017)
on an university-funded research assistantship at time. Fearing the worst, I sheepishly entered his offi ce and found him as I frequently did: puffi ng on his pipe (you could smoke on campus in those days), pen in hand, and a series of neatly written equations on the paper in front him. After making my request in a subdued voice, he looked up at me, set his pipe in the ashtray, and said simply “Have a good time.” In a single sentence, he had rendered all my preparation to justify my request mute! I realized from that exchange that Tom appreciated the value of life outside the realm of academia and research, and I am grateful to this day for the opportunity he so graciously gave me. It is a lesson I have taken to heart and have strived to share with those that I have had the fortune to mentor.
Prof. Senior was an icon at the Radiation Laboratory of the University of Michigan and in the electromagnetics community at large. He was an excellent teacher, mentor, and a scholar par excellence. He will be deeply missed.
Prof. Senior is survived by his four children and their
spouses: Margaret and Kevin Thorpe, David and Tawnya Senior, Hazel and Dave Redman, and Peter Senior; and six grandchildren.
Kamal SarabandiDirector of the Radiation Laboratory
The University of Michigan, Ann Arbor E-mail: [email protected]

The Radio Science Bulletin No 362 (September 2017) 91

92 The Radio Science Bulletin No 362 (September 2017)
Et Cetera
Tayfun AkgülIstanbul Technical UniversityDept. of Electronics and Communications EngineeringTelecommunications Division80626 Maslak Istanbul, TurkeyTel: +90 212 285 3605; Fax: +90 212 285 3565E-mail: [email protected].

The Radio Science Bulletin No 362 (September 2017) 93
This photo was taken at the October 1927 Solvay Conference on Quantum Mechanics, held in Brussels, Belgium. It is remarkable because of the number of notable scientists present. (l-r) (back row) Auguste Piccard, Émile Henriot, Paul Ehrenfest, Édouard Herzen, Théophile de Donder, Erwin Schrödinger, Jules-Émile Verschaff elt, Wolfgang Pauli, Werner Heisenberg, Ralph Howard Fowler, Léon Brillouin; (middle row) Peter Debye, Martin Knudsen, William Lawrence Bragg, Hendrik Anthony Kramers, Paul Dirac, Arthur Compton, Louis de Broglie, Max Born, Niels Bohr; (front row) Irving Langmuir, Max Planck, Marie Skłodowska Curie, Hendrik Lorentz, Albert Einstein, Paul Langevin, Charles-Eugène Guye, Charles Thomson Rees Wilson, Owen Willans Richardson. Photograph by Benjamin Couprie, Institut International de Physique Solvay, Brussels, Belgium (Wikipedia, public domain; thanks to Werner Wiesbeck for bringing this to the attention of the Editor).
A Remarkable Photo

94 The Radio Science Bulletin No 362 (September 2017)
Ethically Speaking
Randy L. HauptColorado School of MinesBrown Building 2491510 Illinois Street, Golden, CO 80401 USATel: +1 (303) 273 3721E-mail: [email protected]
Amy J. ShockleyE-mail: [email protected]
Would You Like to Buy a Bridge?Randy L. Haupt and Amy J. Shockley
My wife and I recently visited Italy, and hired a tour guide to drive us to a couple of UNESCO sites.
The guide liked to talk. He was eager to tell us all about the “history” of the region, giving many “facts” about Italy, and also added some “scientifi c” insight into diets, geography, etc. Not long after he started spouting off these diverse facts, I realized that he was making it all up. Some things I knew were wrong from personal experience, while with others, he contradicted himself during his incessant talking. We investigated further by reading the signs and brochures that we passed as he guided us through the sites, confi rming that everything he was saying was wrong. Interesting. Amazing. I have no doubt that he would have passed a lie-detector test.
When George C. Parker was a young man, he started selling famous New York landmarks, like the Metropolitan Museum of Art, the Statue of Liberty, and Grant’s Tomb, to exploitable tourists and immigrants from Europe [1-3]. When the Brooklyn Bridge was completed in 1883, it became George’s most profi table commodity. Upon spotting a gullible newcomer, he started a conversation that eventually led to an off er to sell the bridge. He encouraged his victim to set up a tollbooth and profi t off of the toll money. Parker would explain that he was a bridge-builder, but was not interested in the lucrative business of collecting tolls. He off ered to sell the bridge at a bargain price that ranged from $50 to $50,000, depending on the gullibility and wealth of the individual he was coaxing. Selling the bridge was pure profi t, so $50 was still a good deal for
him. He even off ered fi nancing if the person did not have the cash for an outright purchase. Some “buyers” paid him monthly installments, before realizing their folly. Police frequently had to prevent the “buyers” from erecting tool booths on the bridge.
Parker sold the Brooklyn Bridge twice a week for many years. He even off ered boat and ferry operators a small reward for referring cash-carrying foreign passengers. Parker placed professional looking “For Sale” signs at key locations around the bridge in order to add to the illusion. George sold the bridge for over 30 years, and was arrested for fraud three times. In 1928, he was put in prison for the rest of his life, where he died in 1936.
I have encountered several bridge salesmen in my time, and occasionally, I have been taken. There are even people like Parker in our profession who would like to sell you a bridge or an antenna. If you tend to be gullible, there are ways to work on identifying bridge salesman. Reader’s Digest published a list of ten way to decrease your gullibility [4]:
1. Develop a healthy dose of skepticism.
2. Sharpen your critical thinking skills and develop more common sense.
3. Learn from your mistakes.

The Radio Science Bulletin No 362 (September 2017) 95
4. Pay attention to the body language of the seller.
5. Be aware when you are most gullible.
6. Keep track of every time you fall for a prank.
7. Look out for off ers that are too good to be true.
8. Trust your instincts.
9. Do not rush.
10. Be wary of smooth talkers and pushy people.
Gullible people tend to be very nice. They look for the best in others, and give people the benefi t of the doubt. While these are generally good traits, they can expose you to great misfortune if you encounter someone with the lying abilities of Parker or my Italian tour guide. If you practice the ten steps above, you can improve your ability
to detect swindlers, similarly to how my wife and I were able to detect the fi bbing of our seemingly knowledgeable guide. I challenge you to practice these skills, and see if you can spot those “bridge sellers” among us. Of course, if you really do want to buy a bridge, I have one to sell you in San Francisco for a good price (the one in Brooklyn just sold). Just send your cash off er to my address above.
1. https://catchthemifyoucan.wordpress.com/2015/06/30/george-c-parker-the-man-who-sold-the-brooklyn-bridge/
2. www.nytimes.com/2005/11/27/nyregion/thecity/for-you-half-price.html
3. www.neatorama.com/2007/07/02/legendary-landmark-
scams/ 4. www.rd.com/advice/relationships/gullible-people/
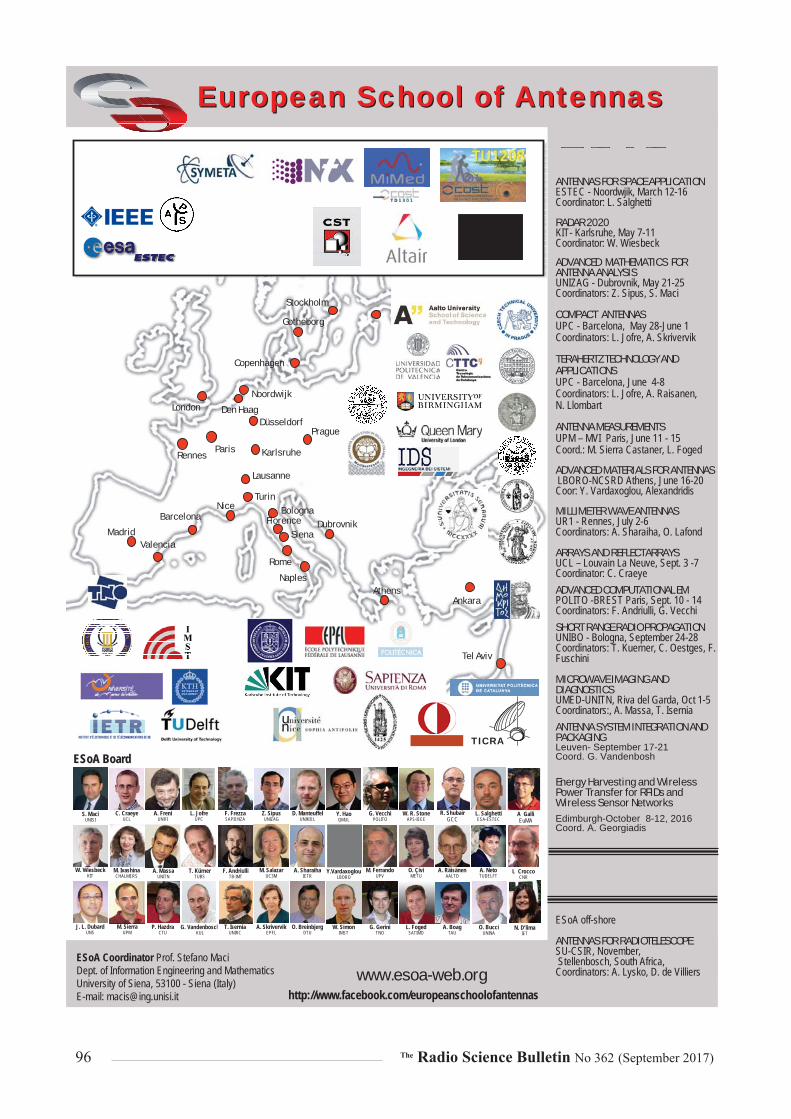
96 The Radio Science Bulletin No 362 (September 2017)
ESoA Coordinator Prof. Stefano MaciDept. of Information Engineering and MathematicsUniversity of Siena, 53100 - Siena (Italy)E-mail: [email protected]
www.esoa-web.org
TICRA
EuropeanEuropean School of School of AntennasAntennas
http://www.facebook.com/europeanschoolofantennas
Madrid
Den Haag
Karlsruhe
Lausanne
Barcelona
Valencia
ParisRennes
Rome
Naples
Siena
Stockholm
Noordwijk
Düsseldorf
Copenhagen
Gotheborg
Prague
Nice
Dubrovnik
Turin
London
Tel Aviv
Ankara
ANTENNAS FOR SPACE APPLICATIONESTEC - Noordwjik, March 12-16 Coordinator: L. Salghetti
RADAR 2020KIT- Karlsruhe, May 7-11Coordinator: W. Wiesbeck
ADVANCED MATHEMATICS FOR ANTENNA ANALYSISUNIZAG - Dubrovnik, May 21-25Coordinators: Z. Sipus, S. Maci
COMPACT ANTENNASUPC - Barcelona, May 28-June 1Coordinators: L. Jofre, A. Skrivervik
TERAHERTZ TECHNOLOGY AND APPLICATIONSUPC - Barcelona, June 4-8Coordinators: L. Jofre, A. Raisanen, N. Llombart
ANTENNA MEASUREMENTSUPM – MVI Paris, June 11 - 15Coord.: M. Sierra Castaner, L. Foged
ADVANCED MATERIALS FOR ANTENNASLBORO-NCSRD Athens, June 16-20Coor: Y. Vardaxoglou, Alexandridis
MILLIMETER WAVE ANTENNASUR1 - Rennes, July 2-6Coordinators: A. Sharaiha, O. Lafond
ARRAYS AND REFLECTARRAYSUCL – Louvain La Neuve, Sept. 3 -7Coordinator: C. CraeyeADVANCED COMPUTATIONAL EM POLITO -BREST Paris, Sept. 10 - 14Coordinators: F. Andriulli, G. VecchiSHORT RANGE RADIO PROPAGATIONUNIBO - Bologna, September 24-28Coordinators: T. Kuerner, C. Oestges, F. Fuschini
MICROWAVE IMAGING AND DIAGNOSTICSUMED-UNITN, Riva del Garda, Oct 1-5Coordinators:, A. Massa, T. IserniaANTENNA SYSTEM INTEGRATION AND PACKAGING Leuven- September 17-21Coord. G. Vandenbosh
Energy Harvesting and Wireless Power Transfer for RFIDs and Wireless Sensor NetworksEdimburgh-October 8-12, 2016Coord. A. Georgiadis
ESoA off-shore
ANTENNAS FOR RADIOTELESCOPESU-CSIR, November, Stellenbosch, South Africa, Coordinators: A. Lysko, D. de Villiers
Athens
BolognaFlorence
S. MaciUNISI
A. FreniUNIFI
L. JofreUPC
F. FrezzaSAPIENZA
D. ManteuffelUNIKIEL
Y. HaoQMUL
G. VecchiPOLITO
W. R. StoneAPS-IEEE
R. ShubairGCC
L. SalghettiESA-ESTEC
W. WiesbeckKIT
A. SharaihaIETR
M. FerrandoUPV
O. ÇiviMETU
A. RäisänenAALTO
A. NetoTUDELFT
M. SalazarUC3M
J. L. DubardUNS
M. Sierra UPM
P. HazdraCTU
G. VandenboschKUL
A. SkrivervikEPFL
O. BreinbjergDTU
W. SimonIMST
G. GeriniTNO
L. FogedSATIMO
A. BoagTAU
M. IvashinaCHALMERS
C. CraeyeUCL
Z. SipusUNIZAG
O. BucciUNINA
T. IserniaUNIRC
ESoA BoardESoA Board
A. MassaUNITN
T. KürnerTUBS
F. AndriulliTB-IMT
Y.Vardaxoglou LBORO
A Galli EuMA
L CroccoCNR
N. D’limaIET

The Radio Science Bulletin No 362 (September 2017) 97
Solution Box
Özgür ErgülDepartment of Electrical and Electronics EngineeringMiddle East Technical UniversityTR-06800, Ankara, TurkeyE-mail: [email protected]
SOLBOX-08 Özgür Ergül
Department of Electrical and Electronics EngineeringMiddle East Technical University
TR-06800, Ankara, TurkeyE-mail: [email protected]
1. Introduction
Nanowires are popular components of nano-optical systems because they can be useful in many related
applications [1], such as optical transmission [2-4], sub-wavelength imaging [5, 6], and energy harvesting [7]. These structures are usually made of silver (Ag) or gold (Au), which are active at optical frequencies with strong plasmonic responses and which provide the favorable characteristics of nanowires. For example, by using a transmission line involving an arrangement of nanowires, electromagnetic energy can be carried to distances long with respect to wavelength. As the technology in this area develops, nanowires with improved geometric properties [8] – such as regularity, cross-sectional preciseness, and surface smoothness – become available, further expanding their usage. Naturally, electromagnetic simulations of nanowires [9-11], especially using their three-dimensional full-wave models, are essential to studying and understanding these important structures, as well as to designing them. In this issue of Solution Box, an optimization problem involving a nanowire transmission line to be improved by a coupler is presented (SOLBOX-08). Specifi cally, a pair of nanowires with a sharp 90° bend, which leads to signifi cant deteriorations in the power transmission capability due to refl ections and diff ractions, is considered. The purpose was to design an effi cient coupler in a limited space around
the corner, in order to improve the transmission as much as possible. In the sample solution that is also considered in this issue, cubic nanoparticles were used to reduce the refl ections and to improve the power transmission. Starting from a full grid, the existence and absence of each nanocube was decided based on an optimization via genetic algorithms (GAs). The trials during the optimization were effi ciently performed by using the Multilevel Fast Multipole Algorithm (MLFMA) [12, 13]. This has been designed for accurate analysis of plasmonic objects [14-16] without resorting to approximate and asymptotic techniques. Diff erent numerical solutions, analysis methods, and optimization tools to design more effi cient couplers, probably leading to better transmission capabilities, are welcome. We are also looking for alternative solutions to previous problems (SOLBOX-01 to SOLBOX-07), which can be found in earlier editions of this column. Please consider submitting your contributions to Ozgur Ergul ([email protected]).
2. Problems
2.1 Problem SOLBOX-08(by A. Altınoklu and Ö. Ergül)
Figure 1 depicts the considered optical transmission line involving two Ag nanowires, as well as a general view

98 The Radio Science Bulletin No 362 (September 2017)
of the optimization setup. The total length of the transmission line was 10 μm, while there was a sharp 90° bend at the middle (we note that the outer nanowire was slightly longer than the inner nanowire). Each nanowire had a 0.1 μm × 0.1 μm square cross section, while the distance between them was also set to 0.1 μm. The excitation was a pair of Hertzian dipoles (each with unit dipole moment), located at 0.2 μm distance from the nanowires. If the coordinate system in Figure 1 was considered (the transmission line was located on the x-y plane, while the fi rst half was aligned in the y direction), the dipoles were oriented in the x directions to create a pattern with two peaks. The distance between the dipoles was also 0.2 μm. The frequency was selected as 250 THz, at which the relative complex permittivity (in the frequency domain) of Ag was approximately
60.7546 i4.3097 . The aim was to design an effi cient coupler at the corner location (without any change in the nanowires and their positions), in order to improve the power transmission. The transmission was measured on a symmetrically located 1.3 μm × 1.3 μm frame, which had a distance of 0.1 μm from the output of the nanowires. Either the maximum power or the mean power on this frame could be maximized. The whole system, including nanowires and the coupler to be designed, were assumed to be in free space. In the reference solution given below, the coupler was restricted to occupying an area of 1.3 μm × 1.3 μm (on the x-y plane), while it did not increase the thickness of the system (0.1 μm in the z direction). A better coupler may be defi ned as one that improves the transmission while using the same size (1.3 μm × 1.3 μm × 0.1 μm) or one that provides similar transmission properties while being more compact.
3. Solution to Problem SOLBOX-08
3.1 Solution Summary
Solver type (e.g., noncommercial, commercial): Noncom-mercial research-based code developed at CEMMETU, Ankara, Turkey. Solution core algorithm or method: Frequency-domain Multilevel Fast Multipole Algorithm (MLFMA).
Programming language or environment (if applicable): MATLAB + MEX
Computer properties and resources used: 2.5 GHz Intel Xeon E5-2680v3 processors (using 20 cores).
Total time required to produce the results shown (categories: 1 sec, 10 sec, 1 min, 10 min, 1 hour, 10 hours, 1 day, 10 days, 10 days):10 hours (per problem):
3.2 Short Description of the Numerical Solutions
The optimization problem SOLBOX-08 was solved by using in-house implementations of genetic algorithms (GAs) and the MLFMA in the frequency domain. The plasmonic problems using the given relative permittivity value 60.7546 i4.3097 were formulated with the electric-magnetic-current combined-fi eld integral equation (JMCFIE) [17, 18], and discretized with the Rao-Wilton-Glisson functions [19]. The number of unknowns was
−1 0 1 2 3 4 5 6−1
0
1
2
3
4
5
6
x (μm)
y (μ
m)
OptimizationFrame
Dipoles
Optimization Setup
Figure 1. The optimization problem involving a pair of nanowires that are used to transmit elec-tromagnetic energy. The nanowires were excited by a pair of Hertzian dipoles. There was a sharp 90° bend that reduced the transmission. A coupler needed to be designed and located at the corner such that the transmitted power was maximized as much as possible on the optimization frame.
0 50 100 150 2006
8
10
12
14
16
18
GA Generations
Fitn
ess
Val
ue
Optimization History
Figure 2. A solution to the optimization problem de-fi ned in SOLBOX-08. An in-house implementation of GAs was used to optimize the maximum power density on the optimization frame.

The Radio Science Bulletin No 362 (September 2017) 99
approximately 13,000 (for the full structure, i.e., the nanowires and the coupler). The coupler was designed by using 90 nm × 90 nm × 90 nm Ag nanocubes in a 1.3 μm × 1.3 μm region around the corner. Specifi cally, a grid of 13 × 13 elements (with a distance of 10 nm between each consecutive particle) was considered, leading to a total of 139 nanocubes in the full grid (omitting those overlapping with the nanowires). By representing each nanocube with a binary digit, each GA individual had a chromosome of 139 bits. For the optimization detailed below, the GA implementation was employed on a pool of 40 individuals for 200 generations. The optimization was hence completed by performing 8000 MLFMA simulations, omitting the identical individuals/trials that could be skipped based on a lookup table. In order to improve the convergence of the optimization, several new GA operations, such as success-based mutations and family elitism [20], were
applied. In addition, the MLFMA was integrated into the GA implementation via dynamic accuracy control [21] in order to reduce the computational load. Finally, the iterative solutions via the MLFMA were performed by using an inner-outer scheme, where an approximate MLFMA was eff ectively used as a preconditioner [22].
3.3 ResultsFigure 2 presents the optimization history for the
setup described above. The fi tness function was selected as the maximum power density on the optimization frame (1.3 μm × 1.3μm). It could be observed that the fi tness value was dramatically increased, from 7.11 W/ms (fi rst generation) to 17.22 W/ms (last generation). The curve with respect to the number of generations also demonstrated good convergence characteristics with a smooth saturation.
−1 0 1 2 3 4 5 6−1
0
1
2
3
4
5
6
x (μm)
y (μ
m)
Coupler
−0.6 −0.2 0.2 0.6 1.0
4.0
4.2
4.4
4.6
4.8
5.0
5.2
5.4
x (μm)
y (μ
m)
Designed Coupler Designed Coupler (Zoomed)
Figure 3. A solution of SOLBOX-08. A coupler that consisted of Ag nanocubes was designed to improve the power transmission through the sharp bend.
10
15
20
25
30
3540 dBV/m
−30
−25
−20
−15
−10
−50 dBA/m
−10
−5
0
5
10
1520 dBW/ms
With
Cou
pler
10
15
20
25
30
3540 dBV/m
−30
−25
−20
−15
−10
−50 dBA/m
−10
−5
0
5
10
1520 dBW/ms
With
out C
oupl
er
Electric Field Intensity Magnetic Field Intensity Power Density
Electric Field Intensity Magnetic Field Intensity Power Density
Figure 4. The electric-fi eld intensity, magnetic-fi eld intensity, and power density for the transmis-sion line involving nanowires (SOLBOX-08). Improved transmission due to the designed coupler (see Figure 3) was visible as reduced diff raction at the corner and as increased intensity/density values at the output.

100 The Radio Science Bulletin No 362 (September 2017)
Nevertheless, heuristic optimizations do not guarantee a global convergence, and the result (the coupler design) presented in this solution may not be the ultimate structure.
Figure 3 depicts the designed coupler, where the
nanocubes are shown in addition to the nanowires. As illustrated in the zoomed plot, 70 out of 139 nanocubes were kept, to obtain approximately 17.22 W/ms mean power density. In comparison to the no-coupler case (with 6.70 W/ms maximum power density on the same frame), this corresponded to a 2.57-times enhancement. The enhancement in the mean power density was more signifi cant (nearly nine times), i.e., from 0.50 W/ms (before optimization) to 4.48 W/ms (after optimization).
Figure 4 presents the electric-fi eld intensity (V/m), magnetic-fi eld intensity (A/m), and power density (W/
ms), all with 30 dB dynamic range in the transverse plane. The improvement by the coupler was clearly visible in these plots. For example, investigating the power-density distribution, we observed that the diff racted waves in the corner region were reduced when the coupler was used. In addition, following the corner region, the power density along the nanowire surfaces in the second (horizontal) part of the transmission line seemed to be stronger when the coupler was used. Finally, the increased power density at the output of the nanowire system using the coupler was clearly seen. Similar observations could be made for the electric-fi eld intensity and the magnetic-fi eld intensity. Figure 5 presents zoomed plots where the intensity and density values are plotted further around the corner. We also observed the reduced diff raction and improved transmission in these plots. Finally, in Figure 6, we considered the intensity and density distributions on the output frames.
10
15
20
25
30
3540 dBV/m
−30
−25
−20
−15
−10
−50 dBA/m
−10
−5
0
5
10
1520 dBW/ms
Electric Field Intensity Magnetic Field Intensity Power Density
10
15
20
25
30
3540 dBV/m
−30
−25
−20
−15
−10
−50 dBA/m
−10
−5
0
5
10
1520 dBW/ms
With
Cou
pler
With
out C
oupl
er
Electric Field Intensity Magnetic Field Intensity Power Density
Figure 5. The electric-fi eld intensity, magnetic-fi eld intensity, and power density for the transmis-sion line involving nanowires (SOLBOX-08). The zoomed plots show the intensity and density values in the coupler region (see Figure 3). The results without (top row) and with (bottom row) the coupler are compared.
10
15
20
25
30
35
40 dBV/m
10
15
20
25
30
3540 dBV/m
−30
−25
−20
−15
−10
−5
0 dBA/m
−30
−25
−20
−15
−10
−50 dBA/m
−10
−5
0
5
10
15
20 dBW/ms
−10
−5
0
5
10
1520 dBW/ms
Electric Field Intensity Magnetic Field Intensity Power Density
No
Cou
pler
Opt
miz
ed C
oupl
er
Electric Field Intensity Magnetic Field Intensity Power Density
Figure 6. The electric-fi eld intensity, magnetic-fi eld intensity, and power density for the transmission line involving nanowires (SOLBOX-08). The intensity and density distributions were investigated on the output frame with and without the designed coupler (see Figure 3).

The Radio Science Bulletin No 362 (September 2017) 101
The positive eff ect of the coupler was clearly visible as signifi cantly increased values at the output.
4. References
1. X. Guo, M. Qiu, J. Bao, B. J. Wiley, Q. Yang, X. Zhang, Y. Ma, H. Yu, and L. Tong, “Direct Coupling of Plas-monic and Photonic Nanowires for Hybrid Nanophotonic Components and Circuits,” Nano Lett., 9, 12, November 2009, pp. 4515-4519.
2. A. W. Sanders, D. A. Routenberg, B. J. Wiley, Y. Xia, E. R. Dufresne, and M. A. Reed, “Observation of Plas-mon Propagation, Redirection, and Fan-Out in Silver Nanowires,” Nano Lett., 6, 8, June 2006, 1822-1826.
3. W. Wang, Q. Yang, F. Fan, H. Xu, and Z. L. Wang, “Light Propagation in Curved Silver Nanowire Plas-monic Waveguides,” Nano Lett., 11, 4, March 2011, pp. 1603-1608.
4. A. Yılmaz, B. Karaosmanoğlu, and Ö. Ergül, “Computa-tional Electromagnetic Analysis of Deformed Nanowires Using the Multilevel Fast Multipole Algorithm,” Sci. Rep., 5, 8469, February 2015.
5. J. Yao, Z. Liu, Y. Liu, Y. Wang, C. Sun, G. Bartal, A. M. Stacy, and X. Zhang, “Optical Negative Refraction in Bulk Metamaterials of Nanowires,” Science, 321, 5891, August 2008, p. 930.
6. B. D. F. Casse, W. T. Lu, Y. J. Huang, E. Gultepe, and L. Menon, “Super-Resolution Imaging Using a Three-Dimensional Metamaterials Nanolens,” Appl. Phys. Lett., 96, 023114, January 2010.
7. C. Rockstuhl, S. Fahr, and F. Lederer, “Absorption Enhancement in Solar Cells by Localized Plasmon Po-laritons,” J. Appl. Phys., 104, 123102, December 2008.
8. X. Wang, C. J. Summers, and Z. L. Wang, “Large-Scale Hexagonal-Patterned Growth of Aligned ZnO Nanorods for Nanooptoelectronics and Nanosensor Arrays,” Nano Lett., 4, 3, January 2004, pp. 423-426.
9. J. P. Kottmann and O. J. F. Martin, “Plasmon Resonances of Silver Nanowires with a Nonregular Cross Section,” Phys. Rev. B, 64, 235402, November 2001.
10. T. Sondergaard, “Modeling of Plasmonic Nanostruc-tures: Green’s Function Integral Equation Methods,” Phys. Status Solidi B, 244, October 2007, pp. 3448-3462.
11. H. Aykut Şatana, B. Karaosmanoğlu, and Ö. Ergül, “A Comparative Study of Nanowire Arrays for Maximum Power Transmission,” in K. Maaz (ed.), Nanowires, London, InTech, 2017, pp. 233-253.
12. W. C. Chew, J.-M. Jin, E. Michielssen, and J. Song, Fast and Effi cient Algorithms in Computational Electromag-netics, Norwood, MA, Artech House, 2001.
13. Ö. Ergül and L. Gürel, The Multilevel Fast Multipole Algorithm (MLFMA) for Solving Large-Scale Compu-tational Electromagnetics Problems, New York, Wiley/IEEE, 2014.
14. B. Karaosmanoğlu, A. Yılmaz, U. M. Gür, and Ö. Ergül,
“Solutions of Plasmonic Structures Using the Multi-level Fast Multipole Algorithm,” Int. J. RF Microwave Comput.-Aided. Eng., 26, 4, May 2016, pp. 335-341.
15. A. Ç ekinmez, B. Karaosmanoğ lu, and Ö. Ergü l, “Inte-gral-Equation Formulations of Plasmonic Problems in the Visible Spectrum and Beyond,” in M. Reyhanoglu (ed.), Dynamical Systems – Analytical and Computa-tional Techniques, London, InTech, 2017, pp. 191-214.
16. B. Karaosmanoğ lu, A. Yılmaz, and Ö . Ergü l, “Accurate and Effi cient Analysis of Plasmonic Structures Using Surface Integral Equations,” IEEE Trans. Antennas Propag., 65, 6, June 2017, pp. 3049-3057.
17. P. Yla-Oijala and M. Taskinen, “Application of Com-bined Field Integral Equation for Electromagnetic Scat-tering by Dielectric and Composite Objects,” IEEE Trans. Antennas Propag., 53, 3, March 2005, pp. 1168-1173.
18. Ö. Ergül and L. Gürel, “Comparison of Integral-Equation Formulations for the Fast and Accurate Solution of Scattering Problems Involving Dielectric Objects with the Multilevel Fast Multipole Algorithm,” IEEE Trans. Antennas Propag., 57, 1, January 2009, pp. 176-187.
19. S. M. Rao, D. R. Wilton, and A. W. Glisson, “Electro-magnetic Scattering by Surfaces of Arbitrary Shape,” IEEE Trans. Antennas Propag., AP-30, 3, May 1982, pp. 409-418.
20. C. Önol and Ö. Ergül, “Optimizations of Patch Antenna Arrays Using Genetic Algorithms Supported by the Multilevel Fast Multipole Algorithm,” Radioengineer-ing, 23, 4, December 2014, pp. 1005-1014.
21. C. Önol, B. Karaosmanoglu, and Ö. Ergü l, “Effi cient and Accurate Electromagnetic Optimizations Based on Approximate Forms of the Multilevel Fast Multipole Algorithm,” IEEE Antennas Wireless Propag. Lett., 15, April 2016, pp. 1113-1115.
22. C. Önol, A. Üçüncü, and Ö. Ergül, “Effi cient Three-Layer Iterative Solutions of Electromagnetic Problems Using the Multilevel Fast Multipole Algorithm,” Proceedings of the IEEE MTT-S International Conference on Nu-merical Electromagnetic and Multiphysics Modeling and Optimization for RF, Microwave, and Terahertz Applications (NEMO), 2017, pp. 170-172.

102 The Radio Science Bulletin No 362 (September 2017)
Telecommunications Health and Safety
James C. LinUniversity of Illinois at Chicago851 South Morgan Street, M/C 154Chicago, IL 60607-7053 USAE-mail: [email protected]
The Mystery of “Sonic HealthAttacks” on Havana-Based Diplomats
For the past few weeks, media outlets have been reporting on the US State Department’s disclosure that Havana-
based US diplomats were experiencing health issues [1-5]. Their residences were described to have been targeted with bursts of sound waves. Diplomatic staff and family members have repeatedly reported hearing loud buzzing or scraping sounds. Symptoms included severe hearing loss, headaches, ringing in the ears, nausea, and problems with balance or vertigo, which are suggestive of a connection to the inner-ear apparatus within the human head.
While suspicious of a Cuban governmental role in directing the “attack,” US offi cials have yet to pin down the source, nor have they found any weapon that potential culprits might have used. Experts consulted by media outlets and the US government appear to have been baffl ed by it.
The Cuban government has denied any involvement. US State Department offi cials have speculated that the diplomats may have been attacked with an advanced sonic weapon operating outside the range of human auditory response.
The reporting of health issues associated with hearing
loud buzzing, or what was described as bursts of sound, is mystifying, and has caused considerable distress among embassy staff and their families. Indeed, the incidence has caused some diplomats to return to the US with their families.
It is known among audiologists, otologists, and hearing scientists that robust audible (and perhaps, inaudible) sound could damage hearing and vestibular sensory systems,
and alter human emotions and moods. However, it is not clear whether a weapon that covertly uses sonic energy to injure people actually exists today. Nevertheless, this event is calling attention to the reality that sonic and ultrasonic waves could potentially be weaponized for health attacks.
The US State Department has called on Cuban authorities to ferret out who is making these health attacks. Apparently, the Cubans have off ered to let the FBI go to Havana and investigate the incident, implying that they are cooperative in the investigation, and that they did not deliberately target US Embassy personnel with any sonic weapon. Indeed, to date, the consensus among media reports seems to be a collective dismay, that “scientists still have a big mystery to solve.”
Wait a minute. There actually may be a scientifi c explanation.
It is plausible that the loud buzzing, burst of sound, or acoustic pressure waves may have been covertly delivered using high-power microwave radiation, instead of blasting the subjects with conventional sonic sources. It has been scientifi cally well-documented that absorption of a single microwave pulse impinging on the head, and conversion of a microwave pulse to an acoustic pressure wave by soft tissues inside the head, may be perceived as an acoustic click or knocking sound, depending on the intensity of the incident microwave power. A train of microwave pulses to the head may be sensed as an audible tune, chirp, or buzz [6-8].

The Radio Science Bulletin No 362 (September 2017) 103
Would the sound show up on an acoustic recording instrument? Yes and no. It would depend on design and fabrication of the sensing device. Some readers may regard the mentioning of auditory perception of or hearing microwave pulses as preposterous and astonishing. Therefore, let me explain.
Studies have shown that the auditory phenomenon occurs at a specifi c-energy-absorption-rate threshold of microwave radiation of 1.6 W/g for a single 10-μs-wide pulse of microwaves aimed at the subject or the subject’s head, for example. Most signifi cantly, the high-power microwave pulses may be remotely covertly delivered, so that only the intended target would perceive the sound in his or her own head. This obviously is at once astonishing and intriguing.
Microwave radiation, under other circumstances, cannot be perceived by humans, such as being seen as visible light or heard as airborne sound. Furthermore, the hearing apparatus commonly responds to acoustic or sound pressure waves in the audible frequency range (up to 20 kHz). The hearing of microwave pulses is thus a unique exception to the airborne or bone-conducted sound energy that is normally encountered in human auditory perception.
In fact, the hearing of microwave-pulse-induced sound involves a cascade of events. A minuscule but rapid (~μs) rise in tissue temperature ( 610 oC), resulting from the absorption of pulsed microwave energy, creates a thermoelastic expansion of brain matter. This small theoretical temperature elevation is hardly detectable by any currently available temperature sensors, let alone felt as a thermal sensation or heat. Nevertheless, it can launch an acoustic wave of pressure that travels inside the head to the inner ear. There, it activates the hair cells in the cochlea, and it then is relayed to the central auditory system for perception, via the same process involved for normal hearing.
Depending on the intensity of the impinging microwave pulses, the level of induced sound pressure could be considerably above the threshold of auditory perception at the cochlea: to levels approaching or exceeding discomfort and even tissue injury, including reported headaches, ringing in the ears, nausea, and problems with balance or vertigo.
Assuming that the reported event is reliable, there is actually a scientifi c explanation for the source of sonic energy. It could well be from a targeted beam of high-power microwave pulse radiation.
End note: The reader may also be interested in my article in another publication [9], where I discussed the mysterious sonic health attacks on Havana-based diplomats by the potential use of short high-power microwave pulses directed toward the subjects.
References
1. w w w. w a s h i n g t o n p o s t . c o m / w o r l d / n a t i o n a l -security/american-diplomats-suffered-traumatic-brain-injuries-in-mystery-attack-in-cuba-union-says/2017/09/01/9e02d280-8f2f-11e7-91d5-ab4e4b-b76a3a_story.html?utm_term=.1f1d5aee26f4
2. www.theverge.com/2017/9/16/16316048/sonic-weap-on-cuba-us-canadian-diplomats-ultrasound-infrasound-science
3. www.nytimes.com/2017/09/29/us/politics/us-embassy-cuba-attacks.html?mcubz=0
4. www.washingtonpost.com/world/national-security/us-will-expel-cuban-diplomats-as-fallout-deepens-over-mystery-illnesses/2017/10/03/8e8debc8-a83e-11e7-b3aa-c0e2e1d41e38_story.html?tid=hybrid_collabora-tive_1_na&utm_term=.25969005b936
5. nypost.com/2017/10/12/revealed-sound-of-the-sonic-attack-on-americans-in-cuba
6. J. C. Lin and Z.W. Wang, “Hearing of Microwave Pulses by Humans and Animals: Eff ects, Mechanism, and Thresholds” Health Physics, 92, 6, June 2007, pp. 621-628.
7. J. C. Lin, “Hearing Microwaves: The Microwave Audi-tory Phenomenon,” IEEE Microwave Magazine, 3, 2, June 2002, pp. 30-34.
8. J. C. Lin, “The Microwave Auditory Phenomenon,” Proceedings of IEEE, 68, January 1980, pp. 67-73.
9. J. C. Lin, “Strange Reports of Weaponized Sound in Cuba,” IEEE Microwave Magazine, 19, 1, 2018, pp. 18-19.

104 The Radio Science Bulletin No 362 (September 2017)
Women in Radio Science
Asta Pellinen-WannbergUmeå University, Department of Physics andSwedish Institute of Space Physics S-90187 Umeå, Sweden Tel: +46 90 786 7492 E-mail: [email protected]
Iwona Stanislawska
Space Research CentrePolish Academy of Sciences
Bartycka 18a str, 00-716 Warsaw, PolandTel: +48 668 854 496
E-mail: [email protected]
Refl ections on a Career in Radio Science
Introduction from the Associate Editor
This time, I present Iwona Stanislawska, a professor and the Director the Space Research Centre of the Polish Academy of Sciences.
I met Iwona for the fi rst time when we were candidates for the Vice Chair post for Commission G at the URSI GASS in Istanbul in 2011. She won, over me, with one vote. I was not too sad, since I knew that she had received a lot of extra work. Iwona was a very good person for that position, since she had very broad experience from international work.
Iwona got her diploma at the Faculty of Physics at the University of Warsaw, and a PhD from the Institute of Geophysics of the Polish Academy of Sciences. She received her habilitation title from the same institute, and was nominated by the President of RP as a professor at the Space Research Centre of the Polish Academy of Sciences
in 2011. Her interests cover solar-terrestrial and ionospheric physics, modeling, forecasting, and propagation conditions.
She is a former head of the Heliogeophysical Prediction Service, which was operating within the global International Space Environment Service (ISES). This group constructed one of the fi rst automatic systems for solar-terrestrial data processing and a space-weather forecasting service in the late seventies. She is a co-author of more than 220 scientifi c papers, with about 800 citations.
Iwona is a member of URSI (Commission G: Ionospheric Radio and Propagation, just stepping down as the Chair); the International Reference Ionosphere; the International Space Environment Service; the Inter-Programme Coordination Team on Space Weather (WMO); the National Committee for Radio Sciences Committee G Chair; and the National Representative in COSPAR. Here, she tells in her own words how she has reached all these important positions.
M y fi rst rendez vous with the ionosphere happened in secondary school, in lessons of astronomy. When I studied at the University of Warsaw Faculty of Physics, I focused my interest on geophysics, including solar-terrestrial aspects. The broad character of research subjects, such as electrodynamics and radio propagation, elements of solar physics and the atmosphere including the mysterious
forecasting of events, off ered an interesting track in which to succeed. In my diploma I thus selected the ionosphere. It was a time when the Institute of Geophysics Polish Academy of Sciences had just associated with the International URSIGRAM and World Days Service (IUWDS), previously of the International Space Environment Service (ISES), closely collaborated with URSI, COSPAR, and WMO.

The Radio Science Bulletin No 362 (September 2017) 105
Still as a student of Warsaw University, I joined the group performing the URSIGRAM service and, in a short time, I started to work as a duty forecaster. I thus rather quickly placed my interest in radio science activities. Questions of solar geophysical and ionospheric forecasting (and now space weather) become my scientifi c business after the move of this activity to newly created Space Research Centre Polish Academy of Sciences (SRC).
My fi rst conferences were the Solar-Terrestrial Prediction Workshop in Meudon, 1984, and the URSI General Assembly in 1990. In particular, this second meeting allowed me to join the URSI community. There, I met Peter Bradley from Rutherford Appleton Laboratory. At that time, he, with some scientists from diff erent European countries, organized a COST (European Cooperation in Science & Technology) action in the telecommunication domain. He invited me to join the group. EU-funded programs do not allow spending money for non-EU countries such as Poland was in 1990. However, the case was too interesting for me and a small group of my colleagues working with me in the SRC to miss such an opportunity. It took quite a long time to convince our authorities to apply to COST. Finally, with the positive decision of the Ministry of Science, I became a participant in the COST 238 action called PRIME (Prediction and Retrospective Ionospheric Modelling over Europe). This action was the fi rst COST action in Poland. The action offi cially started in March 1991 in Brussels. During the meeting, a Polish fl ag appeared at my table. It was a little smaller than the others, because it was quickly made in the room by cutting off the blue part of the fl ag of the Netherlands. I am still thankful to the organizers that they put forth such eff orts to satisfy European principles. COST 238 was the fi rst four-year-long telecommunication action. We exchanged not only knowledge but also our technical experience with constructing – in my institute, the Space Research Centre of the Polish Academy of Sciences – a transportable ionosonde, which we used for campaigns in Turkey and Greece. Next there were the programs COST 251, COST 271, and COST 296, in which I was much involved, often leading diff erent groups of participants. The telecommunication domain was then enlarged to space weather in the COST 724 and COST 0803 actions. My group found a good place in the ionospheric community in Europe.
Ionospheric activity is a part of a complex system of solar-terrestrial relationships that is today called space weather. The quest to forecast these leads through an understanding of what a phenomenon is and how a phenomenon works. In the early years of my work in the institute, there was created in the meantime the Regional Warning Centre of ISES RWC Warszawa, related to the concepts of how to forecast the practical consequences of space-weather disturbances. It hence was broadly based on phenomenological, statistical models, and mainly on gathered experiences. An interdisciplinary approach was necessary. Theories were often adopted from other domains and applied to space weather to gain a broader perspective
in understanding the near-Earth environment. Up to now, I think that such training is the best course dedicated to young scientists. It was also my way of teaching later students at the beginning of their scientifi c careers.
The next step of my involvement was an international cooperation. One should understand that space weather is extremely dynamic and complex, and need access to an enormous amount of observations in near-real time. Models are more and more sophisticated. Accurate specifi cation and forecasting is much more eff ective in collective work. I have been particularly fortunate in joining ISES and COST groups. Over 20 years, we used to call ourselves the COST Family. Colleagues from all European and non-European countries worked together, and together we shared the results achieved for our own applications. The sharp competition that appears in the European framework programs highly disturbs the integrity of this community. However, the personal relationships formed still yield fruit in bilateral and multilateral publications, and the common teaching of young scientists and students.
After 40 years, being almost at the end of my career, what may I say about my achievements in a scientifi c world? Now, it is not any more dominated only by men. I am a professor, and Director of the institute with more than 200 employees. My Deputy Director is a woman. My accountant who keeps the fi nancial status in the institute is a woman. The person who took the leadership role after me of the Heliogeophysical Prediction Service Laboratory was a woman, as well. Often, visitors from diff erent countries are thus a little astonished, noticing so high a female percentage in the leadership of the institute and among the researchers. I am happy to say that during all my career, I met parties where nobody looks for gender balance, but for the knowledge, ingenuity, and enthusiasm. In my opinion, it is the nature of mankind that it needs equilibrium. It is not easy to achieve. In my case, I saw the honest work of two men (not women): Prof. Andrzej Wernik, who very actively engaged through the years in URSI activities; and Prof. Zbigniew Klos, a plasma and space-weather scientist, the former Director of the Space Research Centre of the Polish Academy of Sciences. URSI Commission G confi rms that knowledge, ingenuity, and enthusiasm are essential for our activities. We have here three women, one by one. What can be said about gender factor then?

106 The Radio Science Bulletin No 362 (September 2017)

The Radio Science Bulletin No 362 (September 2017) 107
Early Career Representative Column
Stefan J. WijnholdsNetherlands Institute for Radio AstronomyOude Hoogeveensedijk 47991 PD Dwingeloo, The NetherlandsE-mail: [email protected]
The Young Scientist Program provided a number of awards to assist young scientists to attend the GASS.
These young scientists had to be less than 35 years old on September 1, 2017, and should have had a paper submitted and accepted for a regular session of the GASS. After the call for the Young Scientist Awards (YSA), 273 applications from 39 countries were received through an online application procedure. Some candidates were immediately removed from the list, since their application documents were not complete, they were too old to apply, or they already had received the Young Scientist Awards in the last triennium.
Compared to previous GASSes, the procedure to select the Young Scientist Award winners was modifi ed a bit. For the fi rst time, the Young Scientist Award candidates were ranked by both the URSI Member Committees and the URSI Commissions. The Member Committees were free to modify the Commission rankings, bearing in mind the following desirable characteristics:
• The paper should demonstrate signifi cant benefi t to both the applicant and URSI.
• The subject of the paper should fall within the terms of
Associate Editor’s IntroductionIn this ECR column, we feature two short reports on
the Young Scientist Awards (YSA) and the Student Paper Competition (SPC) at the very successful URSI GASS 2017, held in Montreal, Canada. These reports were kindly
Young Scientist Award at theURSI GASS 2017
(Report Provided by the URSI Secretariat)
reference of URSI, and should ideally report signifi cant progress.
In total, 103 Young Scientists were selected:
• 82 awardees from high-income countries
• 21 awardees from low-income countries
• 27 of the awardees were female
The Young Scientist Awards consisted of free registration, lodging, and a check to cover living expenses during the URSI 2017 GASS in Montreal. The Young Scientist Award winners from low-income countries also received travel support from URSI headquarters to attend the URSI GASS.
Ninety-two (from 32 countries) out of these 103 Young Scientist Awardees attended the URSI GASS:
• One did not accept the award
• Two could not attend due to confl icting agendas
provided respectively by the URSI Secretariat and by Prof. Rengarajan, Chair of the Student Paper Competition in the URSI GASS 2017.

108 The Radio Science Bulletin No 362 (September 2017)
• One could not attend due to illness
• Four could not attend due to visa problems
• Three could not attend due to last-minute changes
It could be concluded that the Young Scientist program was very successful, due to the high number of applications, and due to the high quality of the applications. Some of the Young Scientists are shown in Figure 1.
Student Paper Competitionat the URSI GASS 2017
(Report Provided bySembiam R. Rengarajan)
A Brief History of the Student Paper Competitions in URSI
Conferences
Prof. Piergiorgio L. E. Uslenghi, General Chair of the URSI General Assembly in Chicago in 2008, was instrumental in motivating URSI to initiate the URSI international Student Paper Competition (SPC), and in encouraging the United States National Committee of URSI (USNC-URSI) to fund the prizes. USNC-URSI has fi nancially sponsored all subsequent Student Paper Competitions at the URSI GASS in 2011, 2014, and 2017. Five cash prizes of $1500, $1250, $1000, $750, and $500 were given in each of the competitions. Prof. Steven Reising, Chair of the USNC-URSI during the 2011-2014 triennium, served as the chair of the fi rst three Student Paper Competitions. At the fi rst URSI AT-RASC, in Gran Canaria in 2015, Prof. Uslenghi introduced the Student Paper Competition with a sponsorship of $1500 from USNC-URSI. Three prizes of $750, $500, and $250 were
presented. At the second URSI AT-RASC, in Gran Canaria in 2018, USNC-URSI will sponsor four cash awards of $1000, $750, $500, and $250.
Prof. Sembiam Rengarajan (Secretary and Chair-Elect of USNC-URSI) chaired the Student Paper Competitions at AT-RASC 2015 and GASS 2017. He will chair the Student Paper Competition in Gran Canaria in 2018.
The rules and guidelines of the competition for the Student Paper Competition at the GASS 2017 are given below. They were essentially the same for all of the Student Paper Competitions. While fi ve fi nalists presented their papers in GASS 2017, ten fi nalists were invited to present and compete for the cash awards in all other Student Paper Competitions.
Rules and Guidelines for the SPC
The fi rst author and presenter must be a full-time university student. The topic of the paper must be related to the fi eld of one of the ten URSI Commissions.
A full paper, not longer than 10 pages and in single-column, single-spaced format, meeting the requirements of the full-paper URSI template, must be submitted by January 30, 2017.
The student must also submit a shortened version of the paper that adheres to the requirements of the appropriate Commission at the same time the full paper is submitted. Submissions should be made through the URSI GASS 2017 online paper-submission system, with the appropriate box (indicating the Student Paper Competition) being checked during the paper submission.
A paper that is submitted to a journal before submission to the student competition is ineligible. However, students are encouraged to submit their papers to a journal after January 30, 2017.
A letter from the student’s advisor on university letterhead must be appended to the full paper. The letter must state that the author is enrolled as a full-time university student in a degree program. If the paper is co-authored, the letter must state that all co-authors played only an advisory role. No other students are permitted as co-authors.
The full paper will be evaluated within the competition and will not be published to ensure that there are no subsequent prior-publication issues for those students who wish to submit the work to a journal. This means that the ten-page paper will not be included in the conference proceedings. Only the shortened version will appear in the conference proceedings.
Figure 1. Young Scientists enjoying the view over the city of Montreal from the conference-center terrace at the Young Scientist Party during the URSI GASS 2017.

The Radio Science Bulletin No 362 (September 2017) 109
Results of the SPC at the URSI GASS 2017
Seventy-two eligible student papers were accepted. The ten URSI Commission Chairs judged the student papers throughout the selection process. If a Commission Chair was an advisor to a student-paper contestant, the Vice Chair or the past Chair served as a judge, instead. Each paper was reviewed by independent expert reviewers recommended by the Commission Chairs. The expert reviewers scored each paper based on the quality, originality, and scientifi c merit.
Based on the expert-review scores, we chose 17 papers that were ranked by the Commission Chairs. The top ten ranked papers were chosen as fi nalists (Figure 2), and the top six were invited to present their papers in the Student Paper Competition session at the URSI GASS in Montreal. One of them withdrew.
The fi ve presenters were ranked by the URSI Commission Chairs or their representatives, based on the clarity of the presentation, adherence to time, accessibility to the broad audience of the ten URSI Commissions, and the ability to answer questions on the work. The top fi ve prize winners were as follows:
Shubhendu Bhardwaj (Ohio State University, Columbus, OH, USA; Advisers: Prof. Niru Nahar and Prof. John Volakis) “Novel Circularly-Polarized Horn Antennas and Phase-Less Characterization Methods for sub-mm-Wave and Terahertz Communication and Sensing”
Satheesh Bojja Venkatakrishnan (Ohio State University, Columbus, Ohio, USA; Advisers: Prof. Elias Alwan and Prof. John Volakis) “Multi-Band Multi-Beam Performance Evaluation of On-Site Coding Digital Beamformer Using Ultra-Wideband Antenna Array”
Takashi Nagasaka (Chuo University, Tokyo, Japan; Adviser Prof. Kazuya Kobayashi) “Plane Wave Diff raction by a Thin Material Strip: The Case of E Polarization”
Navid Rezazadeh (University of Manitoba, Winnipeg, MB, Canada; Adviser: Prof. Lot Shafai) “A Planar Controlled Reception Pattern Array with Dual-Mode TM11-TM21 Microstrip Antenna Elements for Increased Angular Coverage”
Surajit Bose (CSIR-Central Glass and Ceramic Research Institute, Kolkata, India; Adviser: Prof. Mrinmay Pal) “Eff ect of Zero-Nonlinearity Point on Optical Event Horizon in Defocused Nonlinear Media”
The fi ve students listed below received Honorable Mention certifi cates:.Armin Jam (University of Michigan, Ann Arbor, MI, USA; Adviser: Prof. Kamal Sarabandi) “A Dual-Polarized Micromachined Beam-Steering Radar at 240 GHz for Collision Avoidance Applications:
Prathap V. Prasannakumar (University of Colorado, Boulder, CO, USA; Adviser: Prof. Dejan Filipovic) “Broadband Refl ector Antenna for Simultaneous Transmit and Receive (STAR) Applications”
Jan Willem Steeb (University of Stellenbosch, Stellenbosch, South Africa; Advisers: Prof. Stefan Wijnholds and Prof. David Davidson) “Computationally Effi cient Near-fi eld Radio Frequency Source Localization”
David Themens (University of New Brunswick, Fredericton, NB, Canada; Adviser: Prof. T. P. Jayachandran) “The Empirical Canadian High Arctic Ionospheric Model (E-CHAIM): NmF2”
Aiping Yao (ETH, Zurich, Switzerland; Adviser: Prof. Niels Kuster) “Robust Experimental Evaluation Method for the Safety Assessment of Implants with Respect to RF-Induced Heating During MRI”
All anonymous reviewer comments to authors were sent to the students after the competition was over. The students could use the review to prepare their papers for submission to suitable journals.
Figure 2. Finalists of the Student Paper Competition, together with Prof. Sembiam Rengarajan (SPC chair) and Prof. Paul Cannon (URSI President), after the Student Paper Competition award ceremony dur-ing the banquet at the URSI GASS 2017.

110 The Radio Science Bulletin No 362 (September 2017)
Report on Microwave andRadio Electronics Week 2017
Microwave and Radio Electronics Week 2017 (MAREW 2017) was organized April 19-21, 2017,
by the Department of Radio Electronics, Brno University of Technology. This was done in cooperation with other Czech and Slovak technical universities. It was also under the auspices of the IEEE Czechoslovakia Section, the International Union of Radio Science (URSI), and the Radioengineering Society and Czech Electrotechnical Society.
The week consisted of two conferences: the 27th International Conference Radioelektronika 2017, and the 18th Conference on Microwave Techniques, COMITE 2017. Each year, the purpose of this three-day event is to create a discussion forum for researchers, academics, people in industry, and students who are interested in the areas of electronics, signal processing and its applications, information technologies, microwave techniques, and related disciplines. In addition to technical sessions, several keynote presentations were given by key European researchers in the domains of communications and microwave techniques, from both academia and industry. Moreover, the attendees
also had the possibility of participating in the industrial workshops.
To encourage the involvement of young researchers, the best student papers written and presented orally or in a poster session by students were given awards (Figure 1) by a jury consisting of Technical Program Committee members and representatives of professional organizations, such as URSI and the IEEE. During the closing ceremony, all awardees recei ved certifi cates and fi nancial support sponsored by the International Union of Radio Science, the Czechoslovakia Section of the IEEE, and the Radioengineering Society. This year, the support from URSI came to two students (one from Slovakia and one from the Czech Republic). Four other students (from Canada, Poland, and two from the Czech Republic) were given awards from two other professional organizations.
Roman MarsalekBrno University of TechnologyE-mail: [email protected]
Figure 1. The winners of the Student Paper Awards from Microwave and Radio Electronics Week 2017 (MAREW 2017).
The Radio Science Bulletin No 362 (September 2017) 111
URSI Conference Calendar
January 2018
USNC-URSI National Radio Science Meeting 2018Boulder, CO, USA , 4-7 January 2018Contact: Dr. David R. Jackson, Department of ECE, University of Houston, Houston, TX 77204-4005, USA, Fax: 713-743-4444, E-mail: [email protected]; Logistics: Christina Patarino, E-mail: [email protected], Fax: 303-492-5959, https://nrsmboulder.org/
March 2018
Gi4DM 2018Kyrenia, Turkish Republic of Northern Cyprus, 14-18 March 2018Contact: K2 Conference and Event Management Kosuyolu Mh. Ali Nazime Sk. No: 45 Kosuyolu 34718 Kadikoy / Istanbul Phone: +90 (216) 428 95 51 - Fax: +90 (216) 428 95 91 E-mail: [email protected], http://www.gi4dm2018.org
May 2018
AT-RASC 2018Second URSI Atlantic Radio Science ConferenceGran Canaria, Spain, 28 May – 1 June 2018Contact: Prof. Peter Van Daele, URSI Secretariat, Ghent University – INTEC, Technologiepark-Zwijnaarde 15, B-9052 Gent, Belgium, Fax: +32 9-264 4288, E-mail address: E-mail: [email protected], http://www.at-rasc.com
July 2018
COSPAR 201842nd Scientifi c Assembly of the Committee on Space Research (COSPAR) and Associated EventsPasadena, CA, USA, 14 - 22 July 2018Contact: COSPAR Secretariat ([email protected])http://www.cospar-assembly.org
August 2018
Metamaterials 201812th International Congress on Artifi cial Materials for Novel Wave PhenomenaEspoo, Finland, 27-30 August 2018Contact: http://congress2018.metamorphose-vi.org/
November 2018
APMC Asia-Pacifi c Microwave Conference 2018Kyoto, Japan, 6-9 November 2018Contact: http://www.apmc2018.org/
March 2019
C&RS “Smarter World” 18th Research Colloquium on Radio Science and Communications for a Smarter WorldDublin, Ireland, 8-9 March 2019Contact: Dr. C. Brennan (Organising Cttee Chair)http://www.ursi2016.org/content/meetings/mc/Ireland-2017-CRS Smarter World CFP.pdf
AP-RASC 20192019 URSI Asia-Pacifi c Radio Science ConferenceNew Delhi, India, 9-15 March 2019Contact: Prof. Amitava Sen Gupta, E-mail: [email protected]
May 2019
EMTS 20192019 URSI Commission B International Symposium on Electromagnetic TheorySan Diego, CA, USA, 27-31 May 2019Contact: Prof. Sembiam R. Rengarajan, California State University, Northridge, CA, USA, Fax +1 818 677 7062, E-mail: [email protected]
URSI cannot be held responsible for any errors contained in this list of meetings

112 The Radio Science Bulletin No 362 (September 2017)
Information for Authors
Content
The Radio Science Bulletin is published four times per year by the Radio Science Press on behalf of URSI, the International Union of Radio Science. The content of the Bulletin falls into three categories: peer-reviewed scientifi c papers, correspondence items (short technical notes, letters to the editor, reports on meetings, and reviews), and general and administrative information issued by the URSI Secretariat. Scientifi c papers may be invited (such as papers in the Reviews of Radio Science series, from the Commissions of URSI) or contributed. Papers may include original contributions, but should preferably also be of a suffi ciently tutorial or review nature to be of interest to a wide range of radio scientists. The Radio Science Bulletin is indexed and abstracted by INSPEC.
Scientific papers are subjected to peer review. The content should be original and should not duplicate information or material that has been previously published (if use is made of previously published material, this must be identifi ed to the Editor at the time of submission). Submission of a manuscript constitutes an implicit statement by the author(s) that it has not been submitted, accepted for publication, published, or copyrighted elsewhere, unless stated diff erently by the author(s) at time of submission. Accepted material will not be returned unless requested by the author(s) at time of submission.
Submissions
Material submitted for publication in the scientifi c section of the Bulletin should be addressed to the Editor, whereas administrative material is handled directly with the Secretariat. Submission in electronic format according to the instructions below is preferred. There are typically no page charges for contributions following the guidelines. No free reprints are provided.
Style and Format
There are no set limits on the length of papers, but they typically range from three to 15 published pages including fi gures. The offi cial languages of URSI are French and English: contributions in either language are acceptable. No specifi c style for the manuscript is required as the fi nal layout of the material is done by the URSI Secretariat. Manuscripts should generally be prepared in one column for printing on one side of the paper, with as little use of automatic formatting features of word processors as possible. A complete style guide for the Reviews of Radio Science can be downloaded from http://www.ips.gov.au/IPSHosted/NCRS/reviews/. The style instructions in this can be followed for all other Bulletin contributions, as well. The name, affi liation, address, telephone and fax numbers, and e-mail address for all authors must be included with
All papers accepted for publication are subject to editing to provide uniformity of style and clarity of language. The publication schedule does not usually permit providing galleys to the author.
Figure captions should be on a separate page in proper style; see the above guide or any issue for examples. All lettering on fi gures must be of suffi cient size to be at least 9 pt in size after reduction to column width. Each illustration should be identifi ed on the back or at the bottom of the sheet with the fi gure number and name of author(s). If possible, the fi gures should also be provided in electronic format. TIF is preferred, although other formats are possible as well: please contact the Editor. Electronic versions of fi gures must be of suffi cient resolution to permit good quality in print. As a rough guideline, when sized to column width, line art should have a minimum resolution of 300 dpi; color photographs should have a minimum resolution of 150 dpi with a color depth of 24 bits. 72 dpi images intended for the Web are generally not acceptable. Contact the Editor for further information.
Electronic Submission
A version of Microsoft Word is the preferred format for submissions. Submissions in versions of TEX can be accepted in some circumstances: please contact the Editor before submitting. A paper copy of all electronic submissions must be mailed to the Editor, including originals of all fi gures. Please do not include fi gures in the same fi le as the text of a contribution. Electronic fi les can be send to the Editor in three ways: (1) By sending a fl oppy diskette or CD-R; (2) By attachment to an e-mail message to the Editor (the maximum size for attachments after MIME encoding is about 7 MB); (3) By e-mailing the Editor instructions for downloading the material from an ftp site.
Review Process
The review process usually requires about three months. Authors may be asked to modify the manuscript if it is not accepted in its original form. The elapsed time between receipt of a manuscript and publication is usually less than twelve months.
Copyright
Submission of a contribution to the Radio Science Bulletin will be interpreted as assignment and release of copyright and any and all other rights to the Radio Science Press, acting as agent and trustee for URSI. Submission for publication implicitly indicates the author(s) agreement with such assignment, and certifi cation that publication will not violate any other copyrights or other rights associated with the submitted material.

The Radio Science Bulletin No 362 (September 2017) 113
Become An Individual Member of URSI
The URSI Board of Offi cers is pleased to announce the establishment of Individual Fellowship (FURSI), Individual Membership (MURSI), and Individual Associate Membership (AMURSI). By joining URSI, Individual Associate Members, Individual Members, and Fellows secure recognition with their peers, are better connected to URSI Headquarters, and are better connected to their National Committees. Each can then better provide support to the other. Other benefi ts include discounted registration fees at URSI conferences (beginning with the 2018 URSI AT RASC) and at some conferences cosponsored by URSI (beginning with some conferences run by IEEE AP-S), a certifi cate of membership, and e-mail notifi cation of the availability of the electronic edition of the URSI Radio Science Bulletin.
Fellowship is by invitation only. Membership and Associate Membership can be applied for through the online forms available at www.ursi.org/membership.php, or at www.ursi.org