radio. it’s on. presentation courtesy of the radio advertising bureau, 2015 – all rights...
TRANSCRIPT

Radio. It’s On.
Presentation courtesy of the Radio Advertising Bureau, 2015 – All Rights Reserved

A mass medium delivering audio content to passionate and loyal listeners across multiple platformsRADIO
Presentation courtesy of the Radio Advertising Bureau, 2015 – All Rights Reserved

RADIO TODAY
RADIOLive
Local
Mobile
Personal
Social
Interactive
Experiential
Presentation courtesy of the Radio Advertising Bureau, 2015 – All Rights Reserved

On Air
A mass medium capable of easily delivering your
message to many people
Targetable assuring the right people are
exposed to your message
A trusted medium and always available
especially during times of crisis
Online
Digital capabilities offering interactive
opportunities
Complements and enhances on air
campaign by reaching consumers using
multiple touch points
Delivers content wherever and
whenever listeners want it
On Target
An environment that delivers consumers
who are engaged and passionate about the
content
Offering companionship and
information
Exposure to the message when and
where consumers are ready to buy or shop
RADIO. IT’S ON.
Presentation courtesy of the Radio Advertising Bureau, 2015 – All Rights Reserved


RADIO BOASTS HIGHEST MASS REACH AMONG POPULAR MEDIA
Adults 18+ P18-34 P35-49
93% 93% 95%87%
76%
90%
54%49%
63%70%
80% 81%
35%42%
49%
Radio TV PC Smartphone Tablet
Source: The Nielsen Total Audience Report Q1 2015 / Adults = P18+
Weekly Reach (% of Population)
Presentation courtesy of the Radio Advertising Bureau, 2015 – All Rights Reserved
Listened to Ra-dio Past 7 Days
Watched Broadcast TV
Past Week
Watched Any Non-Premium
Cable Past Week
Read Any Newspaper Past Week
Used Cell-phone to Access In-
ternet
Visited Facebook
Past Month
Visited YouTube Past
Month
Visited Pandora Past Month
Listened to Satellite Radio
Past Week
Visited Spoti-fyPast Month
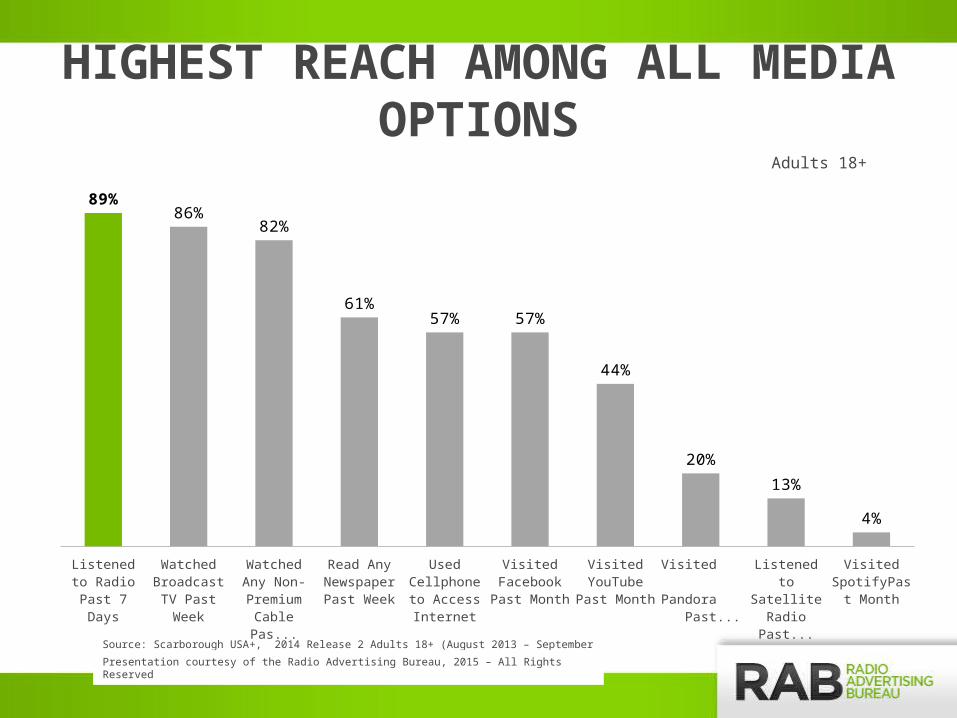
89%86%
82%
61%57% 57%
44%
20%
13%
4%
HIGHEST REACH AMONG ALL MEDIA OPTIONSAdults 18+
Source: Scarborough USA+, 2014 Release 2 Adults 18+ (August 2013 – September 2014)
Presentation courtesy of the Radio Advertising Bureau, 2015 – All Rights Reserved

Listened to Ra-dio Past 7 Days
Used Cell-phone to Access In-
ternet
Watched Any Non-Premium
Cable Past Week
Visited Facebook
Past Month
Watched Broadcast TV
Past Week
Visited YouTube Past
Month
Read Any Newspaper Past Week
Visited Pandora Past Month
Listened to Satellite Radio
Past Week
Visited Spoti-fyPast Month
92%
78% 77% 77% 76%
65%
51%
34%
10% 8%
HIGHEST REACH AMONG ALL MEDIA OPTIONSAdults 18-34
Source: Scarborough USA+, 2014 Release 2 Adults 18-34 (August 2013 – September 2014)
Presentation courtesy of the Radio Advertising Bureau, 2015 – All Rights Reserved

Listened to Ra-dio Past 7 Days
Watched Broadcast TV
Past Week
Watched Any Non-Premium
Cable Past Week
Used Cell-phone to Access In-
ternet
Visited Facebook
Past Month
Read Any Newspaper Past Week
Visited YouTube Past
Month
Visited Pandora
Past Month
Listened to Satellite Radio
Past Week
Visited Spoti-fyPast Month
93%
85%81%
70%66%
57%52%
24%
14%
4%
HIGHEST REACH AMONG ALL MEDIA OPTIONSAdults 25-54
Source: Scarborough USA+, 2014 Release 2 Adults 25-54 (August 2013 – September 2014)
Presentation courtesy of the Radio Advertising Bureau, 2015 – All Rights Reserved

CONSISTENT REACH LEVELS
Source: Nielsen Audio, RADAR® 122-125, June 2014-December 2014, June 2015 (Monday-Sunday 24-Hour Cume Estimates, All Radio)
P18+ P18-49 P25-54
92% 93% 94%91% 93% 94%91% 93% 94%91% 92% 94%91% 92% 93%
Jun '14 Sep '14 Dec '14 Mar '15 Jun '15
A MEDIUM FOR ALL SEASONS
Presentation courtesy of the Radio Advertising Bureau, 2015 – All Rights Reserved


REACH AND TIME SPENT ACROSS DEMOSWeekly Reach: 90.9%
Weekly TSL: 11hrs:52min
Best Daypart: 3-7p
Reach: 79.5%
Adults 18-34
Weekly Reach: 93.8%
Weekly TSL: 14hrs:20min
Best Daypart: 3-7p
Reach: 84.2%
Adults 35-49
Weekly Reach: 93.5%
Weekly TSL: 15hrs:53min
Best Daypart: 10a-3p
Reach: 84.1%
Adults 50-64
Weekly Reach: 93.5%
Weekly TSL: 14hrs:10min
Best Daypart: 10a-3p
Reach: 83.6%
Hispanic 18+ Weekly
Reach: 91.4%
Weekly TSL: 14hrs:23 min
Best Daypart: 10a-3p
Reach: 80.0%
African-American
18+
Source: Nielsen Audio RADAR 125, June 2015 (Monday-Sunday 24-Hour TSL and Cume Estimates; Monday-Sunday Daypart Cume Estimates)
Presentation courtesy of the Radio Advertising Bureau, 2015 – All Rights Reserved

Source: The Nielsen Total Audience Report Q1 2015 / Base: Total US Population P18+
35.8HRS
TraditionalTelevision
12.8HRSAM/FMRadio
5.6HRS
Using theInternet onComputer
7.3HRS
Using anyApp/Web onSmartphone
3.8HRS
Time-ShiftedPlayback
1.5HRS
Video on the Internet
1.6HRSGame
Console
RADIO CAPTURES 1/5 OF ALL CONTENT HOURS
68 hours of content each week across, radio, TV, online and mobile by average U.S. adults.
weekly hours spent with media
Presentation courtesy of the Radio Advertising Bureau, 2015 – All Rights Reserved

LISTENERS CHOOSE RADIO OVER FACEBOOK
Presentation courtesy of the Radio Advertising Bureau, 2015 – All Rights Reserved
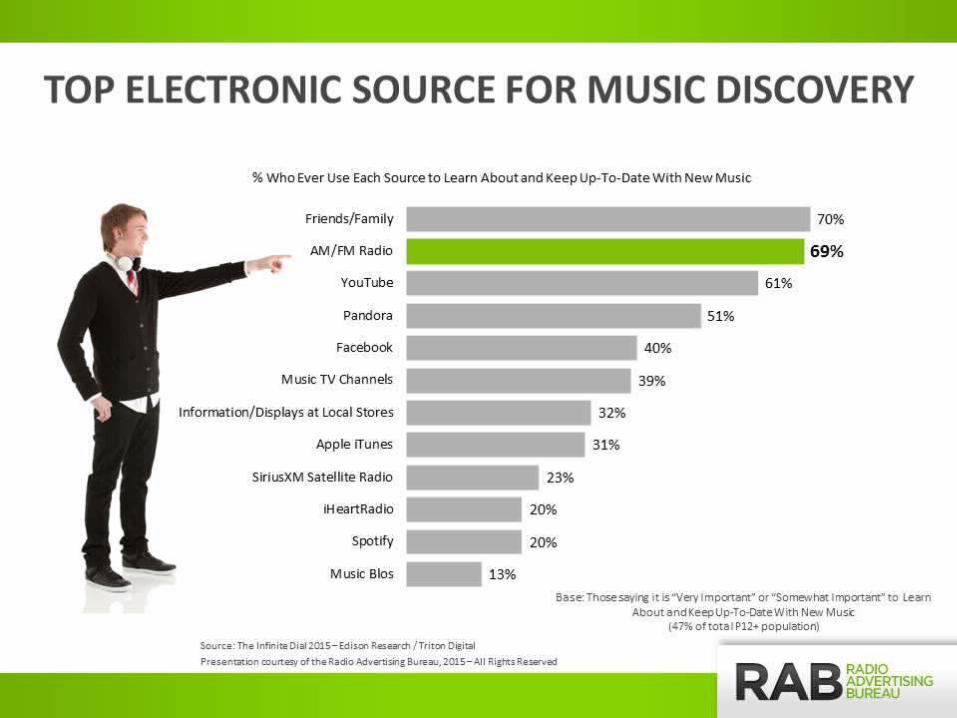

MOST USED SOURCE FOR MUSIC DISCOVERY
AM/FM Radio 29%
Friends/ Family 22%
YouTube 10%
Pandora8%
Sirius XM 4%
Facebook4%Spotify 3%
Others; 20%
2015
Source: The Infinite Dial 2015 – Edison Research / Triton Digital
Base: Those saying it is “Very Important” or “Somewhat Important” to Keep Up-To-Date With New Music
Presentation courtesy of the Radio Advertising Bureau, 2015 – All Rights Reserved

BROADCAST RADIO PLAYS MORE “LIKED” SONGS
Total CHR P1 AC/Variety Hits P1
Country P1 Rock/Alt P1 Classic Rock/Hits P1
Urban/Urban AC P1
5.7 5.8 5.56
5.66.1 5.9
5.2 5.5 5.6 5.54.8 4.9
5.3
Imagine you tune into the station you listen to most for music and listen to the next 10 songs. How many will be songs you like a lot?Imagine you start a session on Pandora and listen to ten songs without skipping any of them. How many will be songs you like a lot?
Based on 1,100 respondents 14-54 in PPM markets, 2014
Presentation courtesy of the Radio Advertising Bureau, 2015 – All Rights Reserved

CONSISTENT TIME SPENT WITH RADIO VS. OTHER DEVICES
Adults 18+ African Americans 18+ Hispanics 18+
36:07 51:23
29:13
12:58
13:29
13:38
5:34
6:23
3:19
7:17
8:14
9:54
3:34
3:06
2:24
TV Radio PC Smartphone Tablet
ACROSS ALL GROUPS
Source: The Nielsen Total Audience Report Q1 2015
Presentation courtesy of the Radio Advertising Bureau, 2015 – All Rights Reserved

MOST LISTENED TO AUDIO SOURCE
Satellite
Digital Music
Streaming
CDs/LPs/Tapes
YouTube/Vevo & TV Music Ch.
Traditional AM/FM Radio
11%
17%
31%
19%
36%
67%
19%
41%
54%
60%
69%
84%
Used Yesterday Currently Used
Question: Which of the following radio channels and sources did you listen to on (target day/typical day)?
(n=1010)
Presentation courtesy of the Radio Advertising Bureau, 2015 – All Rights Reserved


TECHNOLOGY DELIVERS RADIO BEYOND THE DIAL
Expanding Radio’s delivery platforms to
create an interactive, engaging and
highly communicative environment
via devices and apps
Image Source: Tune-In and iHeartRadio
Presentation courtesy of the Radio Advertising Bureau, 2015 – All Rights Reserved

30 millionOver the next 3 years
phones will have anFM Chip
FM-ENABLED SMARTPHONES
Source: NextRadio + TagStation Insights – For additional updates : http://tagstation.com/news/insights/
To date:• Nearly 3.2 million app downloads• 12,000 FM radio stations tuned to from the app • 6,000,000 hours of listening through NextRadio• And 4/5 in Google Play Store user rating
Presentation courtesy of the Radio Advertising Bureau, 2015 – All Rights Reserved

“Content cards” provide information and highly relevant interactive tools:• Click to buy (song or other related content)• Upcoming concerts and album releases for artist currently playing• Recent station playlist
DELIVERS RELEVANT INTERACTIVITY
Source: NextRadio + TagStation Insights – For additional updates : http://tagstation.com/news/insights/
Presentation courtesy of the Radio Advertising Bureau, 2015 – All Rights Reserved

MORE TECHNOLOGY THAT CONVERTS LISTENING TO ENGAGEMENT
Technology converts radio listening into an engaging user experience, empowering listeners to see what they hear and take action.
Image Source: Clip Interactive
Presentation courtesy of the Radio Advertising Bureau, 2015 – All Rights Reserved

PULLING DIGITAL CONTENT ONTO DEVICES
Click here to view Clip Interactive case studiesImage Source: Clip InteractivePresentation courtesy of the Radio Advertising Bureau, 2015 – All Rights Reserved

HD Radio
Over 23 Million HD radio
receivers are in the marketplace
Podcasts
46MM Americans have downloaded a podcast in the past
month
Streaming
Over 7200 streaming
stations in 2015
RADIO’S DIGITAL PLATFORMS ARE STEADILY GROWING
Source: HD Radio stat from iBiquity/HD Radio , 2015; The Infinite Dial 2015 – Edison Research / Triton Digital; Inside Radio / M Street Corp., January 2015; No Canadian or Mexican stations are included
Presentation courtesy of the Radio Advertising Bureau, 2015 – All Rights Reserved

MOST CHOSEN IN-CAR FEATURE
HD Radio
Satellite Radio
Streaming Internet Radio/ Streaming Music
Service
Satellite Radio
MP3 Smartphone
Player Access
CD Player
AM/FM Radio
25%
25%
34%
45%
48%
68%
80%
Source: Ipsos In-Car Audio Study, February 2015
Q: Disregarding any associated costs, if you could select only up to 3 of the following options to be available on your next car entertainment systems, which 3 would you select?
Preference for Entertainment Options in Next Car
Presentation courtesy of the Radio Advertising Bureau, 2015 – All Rights Reserved

THE BATTLE FOR THE DASHAll major auto brands offered factory-installed HD Radio Technology as of 2014
Brands with HD Radio Technology
Vehicle Lines with HD Radio Technology
HD Radio as Standard Equipment
90+
2010 2011 2012 2013 2014
185+
35
76
166
33
67
154
2861
109
2136
86
16
Source: iBiquity
Presentation courtesy of the Radio Advertising Bureau, 2015 – All Rights Reserved


PODCAST LISTENER PROFILEAge Composition
12-17 15%
18-24 15%
25-34 20%
35-44 17%
45-54 15%
55-64 12%
65+ 6%
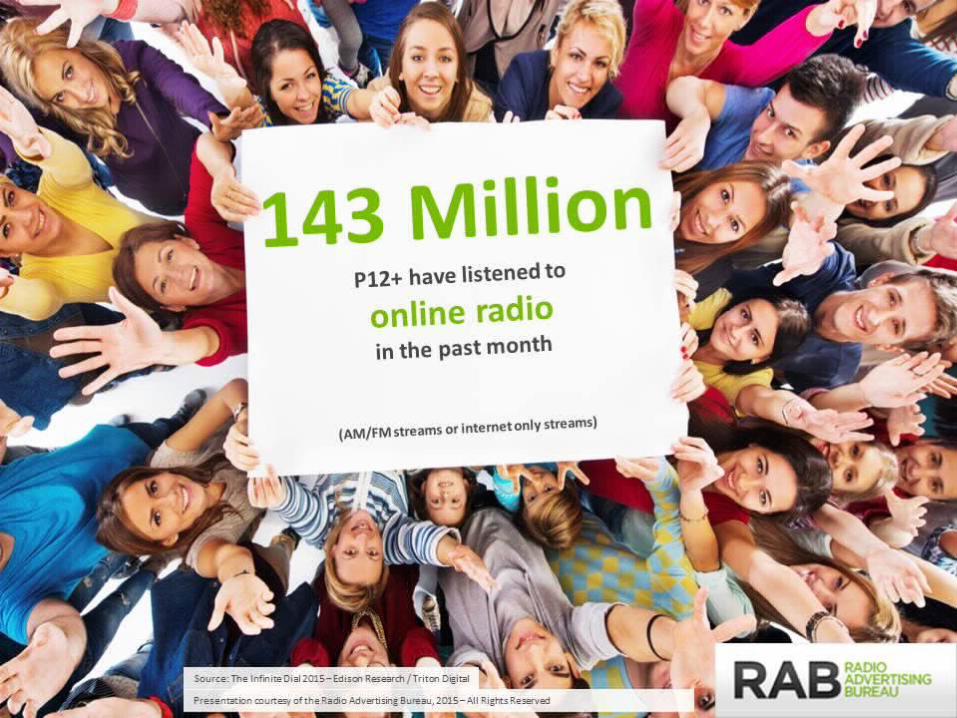
2x More Likely to Listen to Online Radio Vs. U.S. Population
Yes20%
No 80%
U.S Population Listening to Online Radio = 11% % Listening to Online Radio Past Week*
Source: The Infinite Dial 2015 – Edison Research / Triton Digital
*Online Radio defined as AM/FM Streams & Internet –Only
Presentation courtesy of the Radio Advertising Bureau, 2015 – All Rights Reserved


38
BROADCAST RADIO LISTENED TO MORE BY PURE-PLAY LISTENERS
Sources What Pandora Means for Radio, Vision Critical, November 2012; Base: American online adults, aged 18+ ; Sample: 1,017 American adults; of these, 323 identified themselves as Pandora users (used an Internet-only audio service in the past month; and at least sometimes use Pandora)
Pandora Listeners Non-Pandora Listeners
19.1
12.7
Hours Per Week
Presentation courtesy of the Radio Advertising Bureau, 2015 – All Rights Reserved
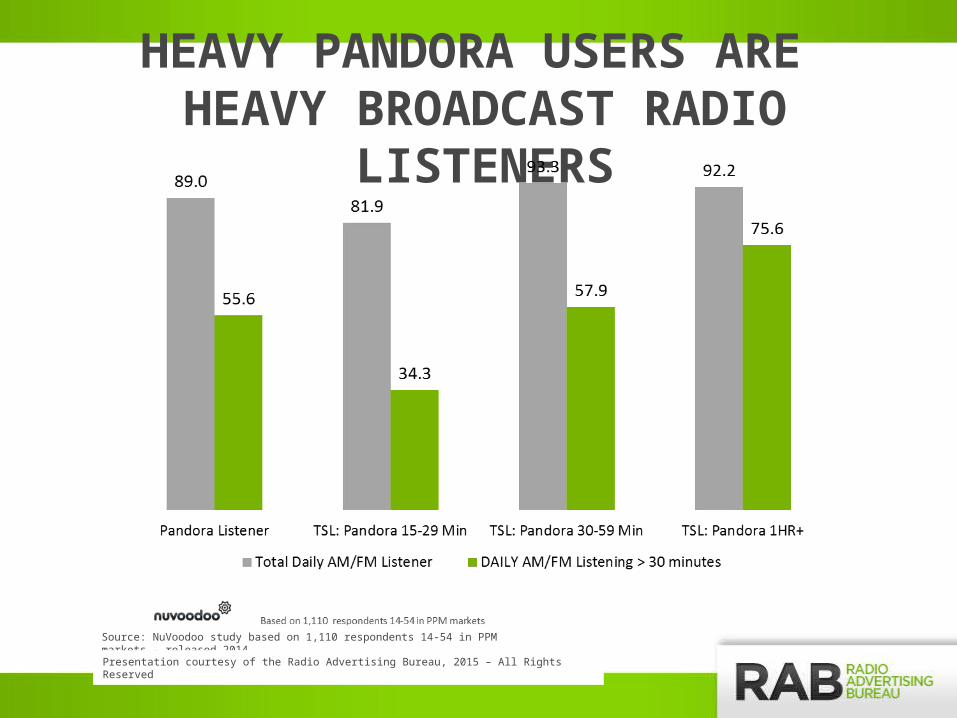
HEAVY PANDORA USERS ARE HEAVY BROADCAST RADIO LISTENERS
Source: NuVoodoo study based on 1,110 respondents 14-54 in PPM markets - released 2014
Presentation courtesy of the Radio Advertising Bureau, 2015 – All Rights Reserved

CHANGING VIEWS OF PANDORA LISTENERS
Computer/mobile device negative
Miss hearing people
Too many political spots
Not enough music discovery
Too many songs I don't like
Gets boring
Too predictable
No local information
Using other services
Commercials are annoying
Can't skip enough songs
0% 10% 20% 30% 40% 50% 60%
20152014
Source: Jacobs TechSurvey 11, 2015
NA
Among those listening less
Presentation courtesy of the Radio Advertising Bureau, 2015 – All Rights Reserved

Source: The Infinite Dial 2014 – Edison Research / Triton Digital; USC, Annenberg School for Communication & Journalism, PSI Study Released June 2012, Woodley, P. and Movius, L. People With a Favorite Radio Personality in LA; Scarborough USA+ Release 2 of 2012.
LISTENERS TAKE THEIR AUDIO ON THE GO
• On-demand content delivering sports, music, information and entertainment downloads whenever and wherever the listener wants it
• 66% of Smartphone users listen to online radio every week
• 55% of listeners said they listen to their favorite personalities on computers or mobile devices when away from a radio
Presentation courtesy of the Radio Advertising Bureau, 2015 – All Rights Reserved

GREATEST SHARE OF AUDIO
6a 7a 8a 9a10a
11a12p 1p 2p 3p 4p 5p 6p 7p
0%
100%
AM/FM Radio
Satellite Radio
Music Streaming Services
Digital/iPods/MP3s
CDs
Source: 2014.1 USA TouchPoints. Percent Share of Audio Usage by Source. Adults 18-54. Average Mon-Fri. Note: Radio includes HD Radio and radio station streaming, Music Streaming Services include iHeartRadio, Pandora, Rdio, Slacker, Spotify, etc.Presentation courtesy of the Radio Advertising Bureau, 2015 – All Rights Reserved

P18+ P25-54 P35-64
39%41%
43%41% 42%
44%41%
45% 46%
RADIO PEAKS DURING THE WORKDAY
How to read: Each day from 3-7p, radio reaches 41% of Adults 18+.
Source: Nielsen Audio, RADAR 125, June 2015 (Persons 18+ 25-54 and 35-64, Monday-Sunday 24-Hour Daily Cume Estimates, All Radio)Presentation courtesy of the Radio Advertising Bureau, 2015 – All Rights Reserved
6-10
A
10A-
3P
3-7P
7P-1
2M
6-10
A
10A-
3P
3-7P
7P-1
2M
6-10
A
10A-
3P
3-7P
7P-1
2M

RADIO SPARKS BRAND CONVERSATION
Heavy Radio listeners (2+ hrs. daily) generate
329 WOM impressions annually
…More than Heavy TV Viewers (5+ hrs. daily) at 218B…Heavy Print readers (1+ hrs. daily) at 209B…Heavy Internet users (5+ hrs. daily) at 208B
Radio is a social medium
Source: Keller Fay Group 2013
Presentation courtesy of the Radio Advertising Bureau, 2015 – All Rights Reserved
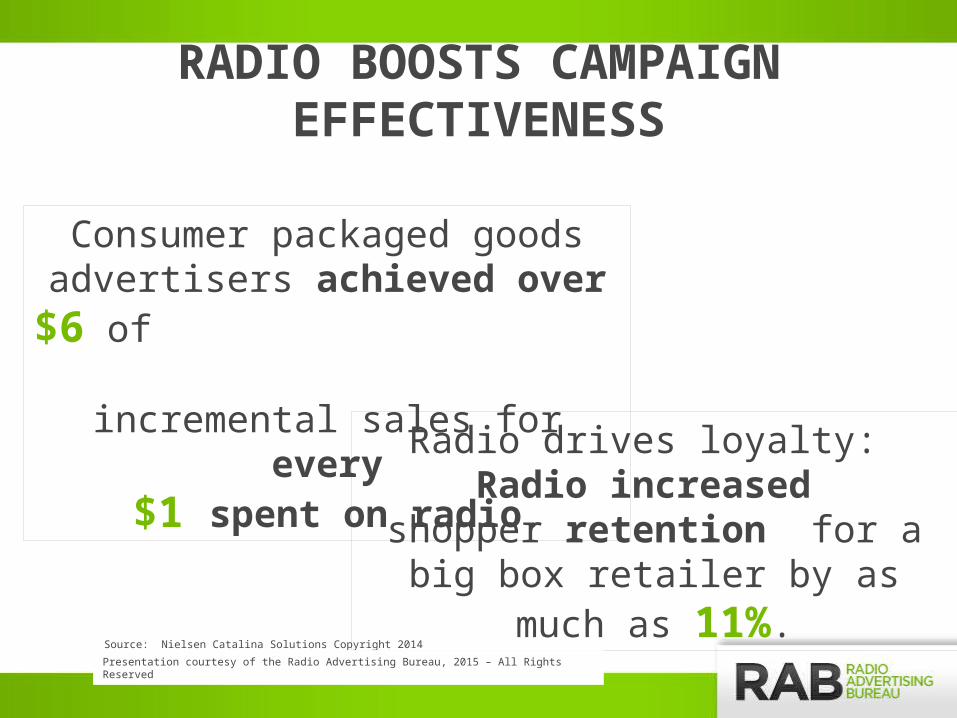
RADIO BOOSTS CAMPAIGN EFFECTIVENESS
Consumer packaged goods advertisers achieved over $6 of
incremental sales for every $1 spent on radio.
Radio drives loyalty: Radio increased
shopper retention for a big box retailer by as much as 11%.
Source: Nielsen Catalina Solutions Copyright 2014
Presentation courtesy of the Radio Advertising Bureau, 2015 – All Rights Reserved

Radio generated a $14 return for every ad dollar spent by a major Telco
MONTHLY SPEND PER EXPOSED “Telco” CUSTOMER
People who heard ads on radio spent more and Millennials spent twice that of those exposed
Source: Nielsen Buyer Insights, P18+
$14 : $1Total Exposed
(1+ Ads)Millennial Exposed(1+ Ads)
+ $8
+ $16 Campaign ROAS
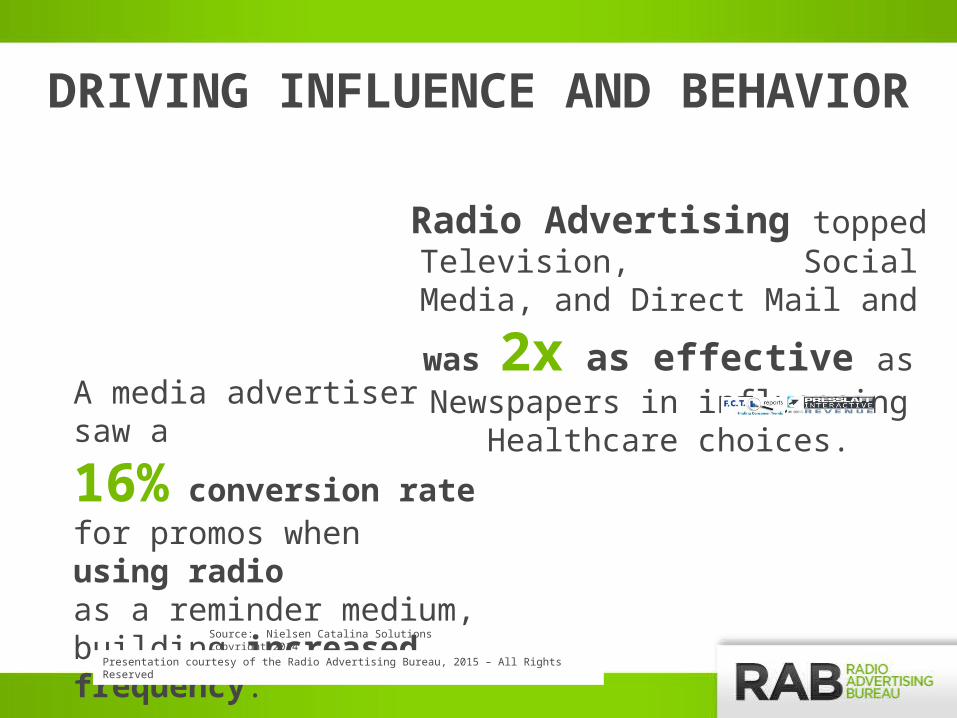
DRIVING INFLUENCE AND BEHAVIOR
Radio Advertising topped Television, Social Media, and Direct Mail and
was 2x as effective as Newspapers in influencing Healthcare choices.
A media advertiser saw a
16% conversion ratefor promos when using radioas a reminder medium,building increased frequency.
Source: Nielsen Catalina Solutions Copyright 2014
Presentation courtesy of the Radio Advertising Bureau, 2015 – All Rights Reserved

REACHING MAIN STREET CONSUMERS
94%
A18+ who are self-employed or work
at home
Household plans to buy/lease a full
size car or luxury vehicle next year
92%Spent $200+ in
groceries in past month
A18+ whose household has a home equity or
home improvement loan
90%A18+ shopped any major department
store in past 3 months
A18+ who are registered to vote
in district of residence
Source: Scarborough USA+ 2014 Release 2 (February -September 2014)
Presentation courtesy of the Radio Advertising Bureau, 2015 – All Rights Reserved


NuVoodoo PPM Prospects Study V, N=1611, Interviews conducted November 13-21, 2014
Adults 18-54 Adults 18-34 Adults 35-54
54.1% 52.6% 55.2%
Radio is great because the stations connect with their local communities [Agree only]
CONNECTED WITH THEIR COMMUNITY
Presentation courtesy of the Radio Advertising Bureau, 2015 – All Rights Reserved

AN EMOTIVE MEDIUM
Presentation courtesy of the Radio Advertising Bureau, 2015 – All Rights Reserved

A POSITIVE ENVIRONMENT TO DELIVER AD MESSAGES
49%To get into a better mood
33% Hear things that make you laugh
46%Relax &
unwind when tense
31% Keep you company
when alone
36%Take your mind off problems
29%Add to the fun
when with other people
35%Get an
energy boost
Source: Mark Kassof & Co. ListenerThink; based on an online survey of 989 listeners 18-64
Presentation courtesy of the Radio Advertising Bureau, 2015 – All Rights Reserved

DRIVEN BY AN EMOTIONAL CONNECTION TO RADIO PERSONALITIES
Have called into a station, met a DJ in their
community, or interacted in some other manner
80%
Agree that their favorite radio stations reflect who
they are as a person*
66%
Consider radio personalities to be regular
people like themselves
70%
This radio hosts are “like a friend” whose opinions they trust and value.
70%
Source: Woodley, P.. Parasocial Interaction between On-Air Radio Personalities and Listeners. USA, Annenberg Scholl for Communication & Journalism, released April 2014; * Latitude Research and OpenMind Strategy, State of Listening in America, May 2013.
Presentation courtesy of the Radio Advertising Bureau, 2015 – All Rights Reserved

Increase Decrease Stay the same I don't know
55%
2%
36%
8%
PERSONALITY TESTIMONIALS DRIVE RADIO LISTENER TRUST
Does hearing one of your favorite radio station personalities provide testimonials for health care or medical products or services make you trust that product or service…
Presentation courtesy of the Radio Advertising Bureau, 2015 – All Rights Reserved

In only one week,
radio delivered nearly a
QUARTER of the reach that TV did in 14 weeks
Cable Drama Premier: Promo Campaign
Personality Endorsement Radio excels at driving tune in for TV programs
Source: Nielsen Audio Data – Tune-in Study; Live +7.
% of campaign reach by platform

Prizes 12%
Sports 16%
Charitable Events 20%
Talk Shows 28%
Music Surprises 28%
Escape Life’s Pressures 31%
Discover New Music 34%
Emergency Info 34%
RADIO’S EQUATION
What’s Going On Locally 39%
Get in a Better Mood 40%
Keeps Me Company 45%
In the Habit 48%
News/ Weather/Traffic 49%
Like to Work with Radio 55%
DJs/ Hosts/ Shows 55%
Hear Favorite Songs 67%
Main Reason for Listening to Radio
MUSIC + INFO + EMOTION
Source: Jacobs TechSurvey 11, 2015
Presentation courtesy of the Radio Advertising Bureau, 2015 – All Rights Reserved

• 2011 highlights 93% retention• 2006 highlights 92% retention
• No time shifting• No below the fold• No load times
Sources: 2011 Nielsen Audio, Media Monitors, and Coleman Insights
NO COMMERCIAL SKIPPING
Presentation courtesy of the Radio Advertising Bureau, 2015 – All Rights Reserved

RADIO WORKS FOR THE CONSUMERAND THE ADVERTISER
Presentation courtesy of the Radio Advertising Bureau, 2015 – All Rights Reserved

On Air
A mass medium capable of easily delivering your
message to many people
Targetable assuring the right people are
exposed to your message
A trusted medium and always available
especially during times of crisis
Online
Digital capabilities offering interactive
opportunities
Complements and enhances on air
campaign by reaching consumers using
multiple touch points
Delivers content wherever and
whenever listeners want it
On Target
An environment that delivers consumers
who are engaged and passionate about the
content
Offering companionship and
information
Exposure to the message when and
where consumers are ready to buy or shop
RADIO. IT’S ON.
Presentation courtesy of the Radio Advertising Bureau, 2015 – All Rights Reserved