radiative shocks create environments for dust … shocks create environments for dust formation in...
TRANSCRIPT

MNRAS 000, 1–?? (2016) Preprint 16 May 2018 Compiled using MNRAS LATEX style file v3.0
Radiative shocks create environments for dust formation in classicalnovae
Andrea M. Derdzinski1?, Brian D. Metzger1, Davide Lazzati21Columbia Astrophysics Laboratory, Columbia University, New York, NY, 10027, USA2 Department of Physics, Oregon State University, 301 Weniger Hall, Corvallis, OR 97331, USA
Received / Accepted
ABSTRACT
Classical novae commonly show evidence of rapid dust formation within months of theoutburst. However, it is unclear how molecules and grains are able to condense within theejecta, given the potentially harsh environment created by ionizing radiation from the whitedwarf. Motivated by the evidence for powerful radiative shocks within nova outflows, wepropose that dust formation occurs within the cool, dense shell behind these shocks. We in-corporate a simple molecular chemistry network and classical nucleation theory with a modelfor the thermodynamic evolution of the post-shock gas, to demonstrate the formation of bothcarbon and forsterite (Mg2SiO4) grains. The high densities due to radiative shock compression(n ∼ 1014 cm−3) result in CO saturation and rapid dust nucleation. Grains grow efficiently tolarge sizes & 0.1µm, in agreement with IR observations of dust-producing novae, and with to-tal dust masses sufficient to explain massive extinction events such as V705 Cas. As in densestellar winds, dust formation is CO-regulated, with carbon-rich flows producing carbon-richgrains and oxygen-rich flows primarily forming silicates. CO is destroyed by non-thermalparticles accelerated at the shock, allowing additional grain formation at late times, but theefficiency of this process appears to be low. Given observations showing that individual novaeproduce both carbonaceous and silicate grains, we concur with previous works attributing thisbimodality to chemical heterogeneity of the ejecta. Nova outflows are diverse and inhomoge-neous, and the observed variety of dust formation events can be reconciled by different abun-dances, the range of shock properties, and the observer viewing angle. The latter may governthe magnitude of extinction, with the deepest extinction events occurring for observers withinthe binary equatorial plane.
Key words: novae, cataclysmic variables - shock waves
1 INTRODUCTION
Classical and recurrent novae are explosive events, powered by athermonuclear runaway (TNR) on the surface of an accreting whitedwarf (WD) in a semi-detached binary. They reach peak luminosi-ties close to or exceeding the Eddington luminosity, and they ejecta total mass of ∼ 10−5 − 10−4 M at velocities of hundreds to thou-sands of km s−1 (e.g., Bode & Evans 2008; Gehrz 2008). Althougha fraction of the matter is unbound promptly following the TNR, theremainder emerges in a continuous wind from the WD (e.g. Kato& Hachisu 1994). Novae remain bright optical sources for weeksto months, but even after they fade their bolometric luminositiescan remain roughly constant for years to decades (Krautter 2008).As the pseudo-photosphere recedes back through the ejecta shell,
? E-mail: [email protected]
the emission temperature rises, shifting to ultraviolet and then softX-ray frequencies.
Novae are remarkably diverse in their composition, spectraldevelopment, and the decline rate of their visual light curves (seeShore 2012 for a review). Starting with DQ Her in 1934 (McLaugh-lin 1935), some nova light curves show dramatic minima, indicat-ing the sudden formation of dust within the ejecta. These events aretypically observed 20−100 days after the outburst, accompanied bya simultaneous increase in the mid-infrared emission. This picturewas confirmed in the 1970s with broadband infrared (IR) photom-etry (Geisel et al. 1970; Ney & Hatfield 1978; Gehrz et al. 1980),which shows that the IR light curve usually rises to a maximumover a few months after the outburst (see Evans & Gehrz 2012 fora review). Dust grains in novae often grow to large sizes (e.g. asinferred by SED modeling of V1065 Cen, where grain sizes reachup to ∼ 1µm).
While only ∼20% of classical novae form dust along the line
c© 2016 The Authors
arX
iv:1
610.
0240
1v1
[as
tro-
ph.S
R]
7 O
ct 2
016
2 A. Derdzinski
of site, at least 40% show signatures of dust in the IR, indicat-ing that dust forms with a partial covering fraction (Helton 2010a;F. Walter, private communication). Dust formation is more com-mon in novae from less massive CO white dwarfs, and is nearly ab-sent in the Ne-enriched novae which are thought to originate frommore massive ONe WDs (Evans & Gehrz 2012), with some no-table exceptions, e.g. QU Vul (Schwarz 2002a) and V1065 Cen(Helton 2010b). When dust does form, its mass fraction within theejecta is typically Xd ∼ 10−3, corresponding to a total dust mass of∼ 10−7 − 10−6 M as inferred, e.g., from the nova remnant GK Per(Bode et al. 1987, Dougherty et al. 1996).
Optical and ultraviolet studies, as well as theoretical modelingof the TNR, indicate that the ejecta of classical nova is typically richin oxygen (Gehrz et al. 1998; Starrfield et al. 1998), perhaps pre-dicting a preference for the formation of silicate dust. However, thesame novae which show silicate dust features, in particular the wellknown 9.7µm SiO stretch feature (e.g. Gehrz et al. 1985, Rocheet al. 1984; Smith et al. 1995), often show evidence for carbongrains. In particular, some novae show evidence for emission fea-tures which are potentially associated with amorphous carbon (Sni-jders et al. 1987) or hydrogenated amorphous carbon (Scott et al.1994).
The bimodality of carbonaceous and silicate dust in novaemay be intimately tied to the chemistry of carbon monoxide (CO).When early near-infrared spectroscopic observations are available,the molecule is often detected within days of the optical outburstand prior to the formation of dust (e.g. Evans et al. 1996; Rudyet al. 2003). According to the conventional paradigm based ondense stellar winds, the composition of dust that forms in a givenenvironment depends sensitively on the ratio of carbon to oxygen.When the C:O ratio exceeds unity (carbon-rich), carbonaceous dustforms, while silicate dust forms when C:O ratio is less than unity(e.g. Waters 2004). This expectation is based on the assumption thatthe CO abundance reaches its saturation value, which may not al-ways be a good approximation for the conditions in the nova ejecta.Carbon nucleation can occur even in an oxygen rich environmentif free carbon is made available by CO destruction, as can occurdue to neutral reactions in a shielded region (Pontefract & Rawl-ings 2004) or due to dissociation by energetic electrons (e.g. Todini& Ferrara 2001; Clayton 2013; Lazzati & Heger 2016). In corecollapse supernovae, energetic electrons are produced by the ra-dioactive decay of 56Ni. As we shall describe, in novae the ionizingparticles are instead more likely to originate from shocks.
At first glance, the hostile environment of a nova is not anideal one to form molecules and dust. The chemistry leading to theformation of first diatomic, then polyatomic molecules and dust,requires an environment that is shielded from the hard radiation ofthe white dwarf (Bath & Harkness 1989; Johnson et al. 1993). Thelatter remains a supersoft X-ray source radiating near the Edding-ton luminosity for years or longer after the eruption (e.g., Schwarzet al. 2011). The general consensus appears to be that dust for-mation necessitates a carbon neutral region (Rawlings & Williams1989; Rawlings 1988, Rawlings & Evans 2008). However, this isonly possible in regions of the ejecta where the gas density is muchhigher than the average value one would predict based on freehomologous expansion. Such density enhancements are supportedempirically by spectroscopic modeling of novae which show evi-dence for a radially thin shell of clumpy ejecta (e.g. Williams 1992,Saizar & Ferland 1994), but their physical origin has not (to ourknowledge) been previously addressed (except in the rare case ofrecurrent novae that collide with remnants of previous eruptions,such as seen in T Pyxidis, e.g. Toraskar et al. 2013).
In the traditional view, novae are powered directly by theenergy released from nuclear burning (e.g. Hillman et al. 2014).However, growing evidence suggests that shock interaction playsan important role in powering nova emission across the electro-magnetic spectrum. This evidence for shocks includes multiple ve-locity components in the optical spectra (e.g. Williams & Mason2010); hard X-ray emission starting weeks to years after the out-burst (e.g. Mukai et al. 2008); and an early sharp maximum in theradio light curve on timescales of months, in clear excess of that ex-pected from freely-expanding photo-ionized ejecta (e.g. Chomiuket al. 2014; Weston et al. 2015).
The most striking indicator of shocks in novae is the recentdiscovery by Fermi LAT of & 100 MeV gamma-rays, observed attimes coincident within a few days of the optical peak and lasting afew weeks (Ackermann et al. 2014, Cheung et al. 2016). The firstnova with detected gamma-rays occurred in the symbiotic binaryV407 Cyg (Abdo et al. 2010), suggesting that shocks were pro-duced by the interaction between the nova outflow and the densewind of the companion red giant. However, gamma-rays have nowbeen detected from more than five ordinary classical novae withmain sequence companions (Ackermann et al. 2014, Cheung et al.2016). Remarkably, this demonstrates that the nova outflow runsinto dense gas even in systems not embedded in the wind of anM giant or associated with recurrent novae. This dense gas insteadlikely represents lower velocity mass ejected earlier in the outburst(‘internal shocks’; Friedjung 1987; Mukai & Ishida 2001, Metzgeret al. 2014). Current observations are consistent with many, andpossibly all, novae producing shocks and & 100 MeV gamma-rayemission. The LAT-detected novae appear to be distinguished pri-marily by their relatively close distances (e.g., Finzell et al. 2015).
Due to the high densities of novae ejecta, shocks in this en-vironment are likely to be radiative (Metzger et al. 2014, Metzgeret al. 2015). As gas cools behind the radiative shock, its densityincreases by a factor of & 103. Here we show that this providesan ideal environment for forming dust, while simultaneously offer-ing a natural explanation for the extreme density inhomogeneitiesobserved within nova ejecta.
This paper is organized as follows. In §2 we discuss the dy-namics of radiative shocks and describe our model for the thermo-dynamic trajectories experienced by the post-shock gas. In §3 wedescribe a model for molecule formation and dust nucleation. In§4 we provide our results. In §5 we discuss our results. In §6 wesummarize our conclusions.
2 RADIATIVE SHOCKS CREATE DUST FORMATIONSITES
2.1 Shock Geometry and Dynamics
Shocks were unexpected in classical novae because the pre-eruption environment surrounding the white dwarf is occupied onlyby the low density wind of the main sequence companion star, re-quiring a different source of matter into which the nova outflowcollides. One physical picture, consistent with both optical (e.g.,Schaefer et al. 2014) and radio imaging (e.g., Chomiuk et al. 2014),and the evolution of optical spectral lines (e.g., Ribeiro et al. 2013;Shore et al. 2013), is that the thermonuclear runaway is first ac-companied by a slow ejection of mass with a toroidal geometry,the shape of which may be influenced by the binary companion(e.g., Livio et al. 1990; Lloyd et al. 1997). This slow outflow isthen followed by a second ejection or a continuous wind (e.g., Bath
MNRAS 000, 1–?? (2016)

Dust formation behind nova shocks 3
Figure 1. Schematic diagram of the nova ejecta. A dense, toroidal outflowis followed by a faster, isotropic wind that collides with the slow ejecta,producing shocks in the equatorial plane. The post-shock gas is able to coolefficiently, producing a cool, dense, shell (likely clumpy) between the for-ward and reverse shocks. This is precisely where we expect dust to form. Inthis geometry, the deepest extinction events will occur for observers withinthe equatorial plane of the binary.
& Shaviv 1976) with a higher velocity and more spherical geom-etry. The subsequent collision between the fast and slow compo-nents produces strong “internal" shocks within the ejecta which areconcentrated in the equatorial plane. The fast component contin-ues to expand freely along the polar direction, creating a bipolarmorphology. Figure 1 shows a schematic diagram of the proposedgeometry, with the cold, clumpy dust-forming region highlightedin blue (see also Sokoloski et al. 2008, Orlando et al. 2009, Drakeet al. 2009, Orlando & Drake 2012 for other evidence for bipolarejecta in symbiotic novae).
We begin by estimating the density and radius of the shockedgas on the timescale of weeks - a month of the observed gamma-rays. The slow outflow of velocity vej = 103vej,8 km s−1 expands toa radius Rej = vejt ≈ 6 × 10¹³twkvej,8 cm by a time t = twk week. Thecharacteristic density of the unshocked ejecta of assumed thickness∼ Rej can be estimated as
nej ≈Mej
4πR3ej fΩmp
∼ 9 × 10¹⁰ M−4t−3wkv−3
ej,8 cm−3, (1)
where fΩ ∼ 0.5 is the fraction of the total solid-angle subtended bythe outflow and Mej = 10−4 M−4 M is the ejecta mass, normalizedto a characteristic value (e.g., Seaquist et al. 1980).
A faster outflow (“wind") of mass loss rate M and velocityvf > vej collides with the ejecta from behind. The density of thewind at the collision radius (∼ radius of the slow ejecta) is given by
nw ≈M
4πR2ejmpvf
∼ 2 × 10⁹ M−4v−3ej,8(vf/vej)−1t−2
wk cm−3, (2)
where M = 10−4 M−4 M wk−1 is normalized to a value resulting inthe ejection of ∼ 10−4 M over a week.
This interaction drives a forward shock through the slow ejectaand a reverse shock back through the fast ejecta. Shocks heat thegas to a temperature
Tsh '3
16kµmpv2
sh ≈ 1.7 × 10⁷v28 K, (3)
and compresses it to a density nsh = 4n, where n = nej (forwardshock) or n = nw (reverse shock). Here µ ' 0.76 is the mean molec-ular weight and v8 = vsh/108 cm s−1 is the shock velocity.
If the shocks are radiative, the conditions for which are de-scribed below, then the post shock material cools rapidly and pilesup in a central cold shell1 sandwiched by the ram pressure of thetwo shocks (Metzger et al. 2014). The shocked gas cools by a fac-tor of ∼ 103, its volume becoming negligible (§2.2). The post-shockgas cools so fast that it supplies little pressure support; for this rea-son, the shocks propagate outwards at the same velocity as the cen-tral shell, vsh, which obeys vej . vsh . vf . The existence of a coldthin shell composed of many ‘clumps’ or condensations is an ob-served feature of the ejecta structure of classical novae (e.g. Saizar& Ferland 1994; Friedjung et al. 1999).
The cooling timescale of the post-shock gas is given by
tcool =3kTsh
2µΛnsh, (4)
where the cooling function Λ(T ) = Λlines + Λff contains contribu-tions from free-free emission
Λff ≈ 1 × 10⁻²³(T/107K)1/2 erg cm3 s−1 (5)
and from emission lines, Λlines. The latter can be approximated inthe temperature range 3×10⁵K . T . 107K as (Vlasov et al. 2016)
Λlines ≈ 2 × 10⁻²²( T
107K
)−0.7
erg cm3 s−1, (6)
where the normalization depends on the gas composition and isgenerally much higher than for solar metallicity gas due to the largeenhancements of CNO elements. Line cooling dominates free-freecooling for shock temperatures T . 3 × 10⁷ K, corresponding toshock velocities v8 . 1.
Whether the shocks are radiative depends on the ratio of thecooling timescale to the expansion timescale ∼ t. Focusing on theforward shock, we find that
tcool
t≈
3.1 × 10⁻³v4
8 M−1−4 t2
wk v8 . 1,3 × 10⁻⁴v5.4
8 M−1−4 t2
wk v8 & 1, (7)
For shock velocities v8 . 1 and ejecta masses M−4 ∼ 0.1 − 1, theforward shock is likely to be radiative, at least during the epochof highest gamma-ray luminosity. Gas cools behind the shock onthe characteristic cooling lengthscale Lcool = 4vshtcool, such that theradiative shock condition can also be written as Lcool Rej/4.
In summary, the nova shocks responsible for the gamma-rayemission are characterized by upstream (pre-shock) gas densitiesn ∼ 109 − 1011 cm −3 and velocities vsh ∼ 500− 2000 km s−1. How-ever, these ranges remain uncertain because the outflow and shockgeometry is poorly understood theoretically and is observationallyunresolved at the time of the gamma-ray emission. However, it isimportant to note that the shock properties are constrained to pro-duce the high observed gamma-ray luminosities (Ackermann et al.2014) of
Lγ = εnthεγLsh ∼ 1035 − 1036erg s−1, (8)
where
Lsh = (9π/8) fΩR2ejnmpv3
sh & 1037 − 1038 erg s−1 (9)
1 In fact, the central shell is likely to be highly inhomogeneous due towell-known instabilities associated with radiative shocks (e.g. Chevalier& Imamura 1982; Vishniac 1983). Such inhomogeneities may explain the‘clumpiness’ inferred from spectroscopic studies of nova ejecta (Section 5),but we neglect this complication for now.
MNRAS 000, 1–?? (2016)

4 A. Derdzinski
is the kinetic power dissipated by the shocks, n is the density of theupstream unshocked gas (nej or nw above), εnth . 0.1 is the fractionof the shock power used to accelerate relativistic non-thermal par-ticles and εγ . 0.1 the fraction of this energy radiated in the LATbandpass (Metzger et al. 2015). For typical values of the shock ra-dius and density, one finds that an order unity fraction of the ejectamust pass through a shock in order to explain the high observedgamma-ray luminosities. The has important implications for thefraction of observers likely to detect dust extinction events (§5).
2.2 Thermodynamic Evolution of Post Shock Gas
The pressure behind the shock is given by the jump conditions,
Psh =2Lsh
3πvshR2ej
. (10)
The post-shock gas forms a cold shell at a temperature Tcs. For anideal gas2 which cools to a temperature Tcs = 104Tcs,4 K (see eq. 3)at roughly constant pressure P = nkT , the density increases by afactor of β ≡ 4Tsh/Tcs ≈ 9 × 10³v2
8T−1cs,4 from its pre-shock value.
Assuming that a significant fraction of the ejecta mass is shocked,this matter collects into a cold shell of mass M = M−410−4 M ofthickness ∆ ≈ Rej/β and characteristic density
nmax ≈M
4πR2ej∆mp
≈Rsh∼tvsh
4 × 10¹⁴t−3wkv−1
8 M−4Tcs,4 cm−3, (11)
For typical values of M−4 ∼ 0.1 − 1 and twk ∼ 1 − 2, the densityreaches a maximum value of nmax ∼ 1013−1014 cm−3. After achiev-ing this maximum density, cooling slows due to radiative heating bythe nova light (see below). After this point, both lateral expansion(due to the increasing radius of the shell) and radial expansion (asthe shock pressure subsides) will cause the density of the shell todecrease from its maximum value of nmax.
We now describe a more detailed model for the thermody-namic evolution of a fluid element which enters the shock and thenis deposited in the central shell. Given its high inertia, the centralshell is assumed to expand ballistically, with Rsh = vt ' Rej andvelocity v (Metzger et al. 2014), which for concreteness we take tobe twice the shock velocity vsh. The kinetic luminosity of the shockis assumed to evolve with time as
Lsh =Lsh,0
1 + (t/τ0)α, (12)
where τ0 = 1.5 × 10⁶ s is a characteristic decay timescale chosento approximate the duration of the observed the gamma-ray emis-sion, and the peak luminosity Lsh,0 = 1038 erg s−1 is that requiredto power the observed gamma-ray luminosities (Ackermann et al.2014; eq. 9 and surrounding discussion). Although the precise formof the temporal decay of Lsh we have adopted is somewhat ad hoc,
2 We neglect non-thermal pressure support in the post-shock region dueto the magnetic field or relativistic particles, which can act to temporar-ily halt the compression of the post-shock gas. However, the (small-scale,shock-generated) magnetic field is likely to decay away downstream of theshock. Non-thermal particles will also eventually cool via Coulomb col-lisions and high energy radiation (inverse Compton, synchrotron, and rel-ativistic bremsstrahlung emission), after which time the compression willproceed as if it were controlled exclusively by thermal cooling (Vurm et al.,in prep).
our choice of α = 4 results in the shock luminosity being approx-imately equal to that needed to power the non-thermal radio emis-sion on a timescale of a few months (Metzger et al. 2014; Vlasovet al. 2016).3
The enthalpy of the shell evolves with time according to
ddt
(E +
Psh
ρ
)= −
dPsh
dt1ρ−
Lrad
M, (13)
where the shock pressure Psh follows from the shock luminosityfrom equation (10), E is the specific internal energy, ρ = mpn is thedensity, and
Lrad =16πσR2
shT 4
9(τ + 2/(3τ) + 4/3)(14)
is the radiative luminosity of the shell (e.g. Sirko & Goodman2003),
τ =Mκ
8πR2sh
, (15)
is the optical depth from the center of the shell, where κ(ρ,T ) is theRosseland mean opacity.
We solve equation (13) given the known evolution of dPsh/dt,starting from a time tshock, corresponding to the time after the out-burst when a ‘typical’ fluid element enters the shock. The initialconditions at t = tshock are specified by the initial temperatureT (tshock) & 104 K, which given the initial pressure determines theinitial enthalpy. Because the cooling time behind the shock is orig-inally so short, our results are not sensitive to the precise value ofT (tshock) as long as it exceeds the temperature range of several thou-sand K relevant to molecule and dust formation.
At each time step, the known pressure Psh and enthalpy fullydetermines the other thermodynamic variables (temperature den-sity) given an equation of state (EOS). We adopt the EOS of To-mida et al. (2013, 2015), which takes into account ionization ofhydrogen and helium and molecular states of H2. We assume a hy-drogen composition of XH = 0.4 with the remainder in helium,motivated by our fiducial abundances (§3.3) and adopt a ratio ofortho- to para-H2 equal to its equilibrium value. We employ Rosse-land mean opacities as compiled by Tomida et al. (2013), whichare based on Semenov et al. (2003), Ferguson et al. (2005) and theOpacity Project (Seaton et al. 1994).
Equation (13) neglects radiative heating due to the nova lu-minosity streaming through the central shell. Following Pontefract& Rawlings (2004), we account for this by setting a floor on thetemperature of
Trad '
(L
4πR2shσ
)1/4
≈Rsh∼vsh t
2500 K(
L1038 erg s−1
)1/4
v−1/28 t−1/2
wk (16)
where L = 1038 erg s−1 is the WD luminosity, which we assume istemporally constant throughout the dust formation epoch.
Figure 2 shows the thermodynamic trajectories for our fidu-cial model of T (t), n(t), and T (n), calculated for an ejecta velocityof vej = 500 km s−1, shell velocity v = 1000 km s−1 and resultingshock velocity of vsh ' v − vej = 500 km s−1. At early times, gascools rapidly from temperatures T & 104 K to T ∼ 2 − 3000 Kas the density concomitantly rises. Below this temperature, radia-tive cooling slows down and PdV losses instead begin to dominate.
3 Radio emission, initially absorbed by photo-ionized gas ahead of theshock, only peaks once the density of the shocked gas has decreased by afactor of ∼ 103 from its peak value at the time of the gamma-ray emission.
MNRAS 000, 1–?? (2016)

Dust formation behind nova shocks 5
After this point catastrophic cooling is prevented because the tem-perature has reached its floor set by external radiation.
Absent shocks, the bulk of the ejecta, which is released ona timescales of days to weeks after the outburst, would be ex-pected to approach a phase of free radial homologous expansionon a timescale of months when dust formation is observed. Thesimplest assumption would be to approximate its geometry as thatof a freely expanding uniform sphere, with the density decreasingas n = Mej/4πR3
ejmp ∝ t−3, and the temperature determined byirradiation from a central source according to equation (16). Forcomparison to our shock models, we also consider trajectories cor-responding to such an expanding uniform sphere, as shown with asolid grey line in Figure 2.
A key question relevant to dust formation is whether the ejectawill remain neutral as it expands, or whether it will become ionizedby X-rays from the central white dwarf. In Appendix B, we es-timate that carbon will remain neutral until the density decreasesbelow a critical value of nion ≈ 109 − 1010 cm−3, depending on theWD luminosity, the carbon abundance, and the mass of the cen-tral shell. Figure 2 shows that for characteristic parameters thesedensities are not reached in our shock models until very low tem-peratures T . 500 K, well after dust condensation and growth.By comparison, for thermodynamic conditions which correspondto the naive picture of a uniform homologous sphere (i.e. neglectingshocks), these densities are reached when the temperature is muchhigher, T & 2000 K, i.e. before dust would have formed. Giventhe likely detrimental effects of ionizing radiation on the dust for-mation process, this already illustrates the crucial role played byenhanced compression due to radiative shocks in creating an envi-ronment conducive to dust formation.
3 DUST FORMATION MODEL
In this section we describe a model for the formation of simplemolecules and concomitant dust nucleation.
3.1 CO and SiO Chemistry
Molecule formation is not only a necessary precursor to dust for-mation; it also plays an important role in regulating abundances.While molecules must exist prior to forming grains, they can alsoprevent nucleation by locking up the needed elements. For thesereasons, we include the non-equilibrium formation and destructionof both SiO and CO. CO is particularly inert within the temperaturerange of interest, serving as an efficient sink for free carbon beforenucleation can take place, while SiO is a precursor molecule forsilicate dust (Section 3).
Without assuming chemical equilibrium, the abundances ofCO and SiO evolve as
dYCO
dt= nKCO
f YCYO − KCOd YCO (17)
dYSiO
dt= nKSiO
f YSiYO − KSiOd YSiO (18)
where Y is the number fraction of each element, Kf is the rate offormation due to radiative association, and Kd = Kth + Knth is therate of destruction with both thermal and non-thermal components.
10−1 100 101 102 103
t− tshock [days]
106
107
108
109
1010
1011
1012
1013
1014
1015
n[c
m−
3]
shockcom
pression
uniformsphere
10−1 100 101 102 103
t− tshock [days]
102
103
104
T[K
]shock compression
uniformsphere
107 108 109 1010 1011 1012 1013 1014 1015
n [cm−3]
101
102
103
104
105
T[K
]
shock compression
uniform sphere
C grains form
silicates form
Figure 2. Density and temperature evolution for the post-shock gas, cal-culated for mean ejecta velocity vej = 500 km s−1 and shock velocityvsh = 500 km s−1 . The fluid element enters the shock at a time tshock ∼ 106
s. Our fiducial trajectory (‘shock compression’, dashed line) includes ra-diative cooling and heating from the WD. For comparison, we include theevolution of a freely expanding uniform sphere that is irradiated by the WDluminosity (’uniform sphere’, grey line). We also show the thermodynamicevolution in the temperature-density plane, where symbols indicate at whatdensity and temperature carbon grains (blue diamonds) and silicate grains(red stars) condense. A notable feature in the trajectory involving compres-sion by shocks is the formation of grains at very high densities, where thegas is necessarily neutral.
MNRAS 000, 1–?? (2016)

6 A. Derdzinski
Following Lazzati & Heger (2016), CO forms by radiative as-sociation (C + O→ CO + hν) at a rate
KCOf =
4.467 × 10⁻¹⁷√(T
4467 K
)−2.08+
(T
4467 K
)−0.22cm3s−1, (19)
and is destroyed by thermal electrons at a rate
KCOth = Kra
(h2
2πµkBT
)−3/2
e−BCOkBT s−1, (20)
where h is Planck’s constant, µ is the reduced mass of C and O, kB
is Boltzmann’s constant, and BCO is the binding energy of CO.Similarly, SiO is formed by radiative association
(Si + O→ SiO + hν) at a rate (following Cherchneff & Dwek2009)
KSiOf = 5.52 × 10⁻¹⁸T 0.31 cm3s−1 (21)
and destroyed by thermal electrons at a rate
KSiOth = 4.4 × 10⁻¹⁰e
−98600 KT s−1. (22)
The presence of shocks allows for another destruction path-way for molecules, particularly from the production of high en-ergy particles (Appendix A). Electrons accelerated at the shock, al-though subject to cooling via Coulomb scattering in the post-shockgas, can ionize molecules if they reach the central dust-formingshell with sufficient energy. Additionally, accelerated protons cancollide with ambient protons in the post-shock gas, and a fractionof these events will produce pions (π+/−) that decay to electron-positron pairs (Kamae et al. 2006). Relativistic protons themselvesmay collide with and destroy molecules. This total ionization rateis given as Knth = lγ/WCO s−1, where lγ is the energy depositionrate per particle and WCO is the mean energy per ionization. Theproduction rate of high-energy particles should coincide with thegamma rays and be proportional to the shock power (eq. 12). Wetake lγ to be
lγ =εLsh
NtotfCO =
εLshmp
MejfCO (23)
where fCO incorporates the fraction of ejecta mass that is in COmolecules. We have introduced an efficiency factor ε, correspond-ing to the fraction of the shock kinetic luminosity placed intothe relativistic particles which are available to destroy molecules.As summarized in Appendix A, we estimate this efficiency to beε = 10−4, a number we adopt in our fiducial models. However, wealso consider models with higher ε (Section 4.2).
Our assumption of a carbon-neutral region to late times (Ap-pendix B) allows us to neglect reactions involving ions. Pontefract& Rawlings (2004) found that neutral hydrogen reactions are im-portant for forming CO at early times in nova outflows. We ne-glect the impact of hydrogen because we find that radiative asso-ciation is already sufficient to saturate CO (see Section 4). CertainH-reactions may also destroy CO at later times, but we estimate thattheir rates are negligible compared to the thermal and non-thermaldestruction rates (e.g., Cherchneff & Dwek 2009 and referencestherein).
3.2 Dust Nucleation and Growth
Dust nucleation describes the process by which gas undergoes aphase transition from single atoms to more complex clusters. Tocapture this process precisely requires solving a complex reactionnetwork that allows for the formation of small molecules, which
eventually−potentially via many pathways−grow to macroscopicdust grains. It is generally intractable to follow such a complex pro-cess, and well beyond the scope of this work.
Classical nucleation theory (CNT, Becker & Döring 1935;Feder et al. 1966) simplifies this significantly by providing analyti-cal expressions for the nucleation rate and the growth rate of grains.In CNT, when a gas becomes supersaturated, grains form as seedclusters that subsequently grow by accretion of other monomers.
We track the formation of two different dust species — car-bon grains and forsterite (Mg2SiO4) to represent the silicate grainpopulation. While observations often indicate the presence of bothcarbonaceous and silicate dust, the precise nature of the silicates isoften unknown. At later times after the dust event when infraredspectra could shed light on the silicate species, the silicates oftenappear amorphous, lacking distinct spectral features.
Following CNT, we implement dust nucleation as now de-scribed. Carbon becomes supersaturated when its density exceedsthe equilibrium density neq,
S C = ngasC /neq, (24)
where ngasC is the number density of free carbon in the gas state, and
neq = 6.9 × 10¹³/kBT e(−84428.2/T ) cm−3 (Keith & Lazzati 2011). Sil-icate grains, rather than being built by single atoms, are composedof several species (2Mg + SiO + 3O → Mg2SiO4). The saturationratio depends on each of the abundances, and is given by
ln S Si = −∆G
kBTcs+
∑i
νi ln pi, (25)
where ∆G is the Gibbs free energy of the reaction, νi are the sto-ichiometric coefficients, and pi are the partial pressures of eachspecies (Kozasa & Hasegawa 1987; Nozawa et al. 2003).
If the saturation is greater than unity, nucleation occurs expo-nentially at a rate
Ji =
√c3
shσiv2i
18π2min2
i exp(−4 c3
sh v2i σ
3
27(kBT )3(log S i)2
)cm−3s−1. (26)
For carbon grains, σi, vi, mi, and ni correspond to the specific sur-face energy, volume, mass, and number density of carbon, respec-tively. For forsterite grains, the monomers are not present in thegas phase, so we adopt the key species approach in which the nu-cleation rate is governed by the single species that sets the slowestnucleation rate (i.e. the one with the lowest collisional frequency).Hence the rate is dependent on the abundance of Mg or O, depend-ing on which is less abundant, and σi, vi, mi correspond to the spe-cific surface energy, volume, and mass of the monomer. In this workcsh refers to the grain shape factor4, which we set to csh = (36π)1/3
assuming spherical grains.Grains form at a critical size given by
Ncrit =8 c3
sh v2i σ
3i
27(kBT log S i)3 , (27)
and we impose a minimum size of 2 monomers. Any previouslyformed grains will continue to grow by accreting at a rate
dNdt
= ngasi csh(N0vi)2/3
√(kBT2πmi
)s−1, (28)
where N0 is the current size, vi is the volume of either solid C orMg2SiO4, and mi is the mass of the molecule.
4 In other works the shape factor is often denoted as cs, a term we avoid soas to prevent confusion with the gas sound speed.
MNRAS 000, 1–?? (2016)

Dust formation behind nova shocks 7
In cases where the radiation field is strong, grains will eas-ily become hotter than the surrounding gas, potentially leading toevaporation. Here we assume that the dust temperature is the sameas that of the gas, and we neglect evaporation since we are consid-ering a region that is optically thick to the UV radiation field.
3.3 Elemental Abundances
Evans & Gehrz (2008) overview the abundances in nova ejecta.The TNR results in the ejecta being enriched in CNO elements(e.g. Starrfield et al. 1998), and heavier elements like magnesiumand silicon can also have their abundances significantly altered byproton capture processes (e.g. Nofar et al. 1991). Spectroscopic ob-servations suggest that a significant fraction of the ejecta is likely tobe dredged up material from the white dwarf interior (e.g. Ferland& Shields 1978), also enhancing the C/O/Ne abundances. There isconsiderable uncertainty in observationally-determined abundancemeasurements, which depend on modeling the nebular phase andaccounting for difficulties such as extinction (both local and in-terstellar), clumpiness, the incident source of ionizing radiation,and geometry (Schwarz et al. 1997, Schwarz 2002b, Schwarz et al.2007). In our case, the latter uncertainty relates to whether the por-tion of the ejecta which is measured spectroscopically is the sameas that being shocked. The line shapes of emission lines indicatethat in some cases, oxygen and Ne-rich ejecta may reside in differ-ent parts of the ejecta (Helton et al. 2012).
We focus on CO novae, which are more frequently dust pro-ducers than ONe novae. For our fiducial model, we adopt ejectaabundances matching those of the CO nova with the most com-prehensive photo-ionization modeling to date, namely GQ Mus.Morisset & Pequignot (1996) find abundances of XH = 0.372,XHe = 0.394, XC = 8 × 10⁻³, XN = 0.125, XO = 9.5 × 10⁻²,XMg = 6.7 × 10⁻⁴, and XSi = 7.7 × 10⁻⁴. Note that the C:O ra-tio is very low for these abundances, the consequences of whichare discussed in the following section.
4 RESULTS
Here we describe in detail the dust formation in our fiducial modelbefore discussing the results from variations about this model. Theresults are summarized in Table 1, where for each run we includethe dust condensation time, the density at this time, the averagegrain sizes, and the total dust mass fraction.
We quote times as measured with respect to when a typi-cal fluid element enters the shock, which, based on the observedgamma-ray emission, is typically weeks after the initial outburstitself. Even though the post-shock gas is shielded from the ioniz-ing radiation of the WD, it is still heated by the optical radiationfield reprocessed through the gas. As a result of this temperaturefloor (eq. 16), dust cannot condense until the fluid element reachessufficiently large radii, at a time which depends on the outflow ve-locity. In this study we consider a single value of the ejecta velocityfor simplicity. However, given the observed diversity of velocities,both between different novae and within individual events, dust for-mation can commence across a range of timescales relative to thestart of the outburst (e.g. Evans & Gehrz 2012).
Our fiducial model makes the conservative assumptions of atemperature floor set by the central WD (eq. 16) and a low effi-ciency of CO destruction, ε = 10−4. However, even given theseassumptions, we find that molecule and dust formation are effi-
cient. Reasonable deviations from these adopted parameters gen-erally serve only to increase the total dust yield.
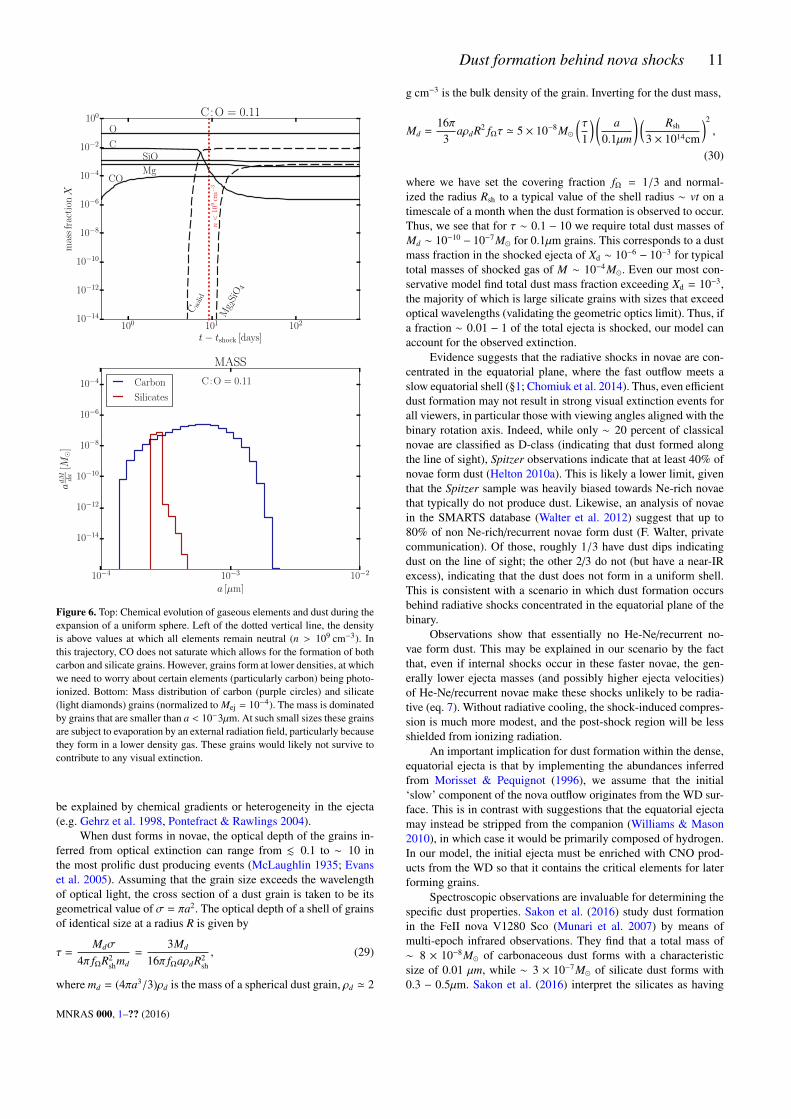
The top panel of Figure 3 shows, for our fiducial model, thechemical evolution by mass fraction as the fluid parcel is com-pressed, cools, and then expands. The high densities achieved dueto shock-induced compression allow CO to quickly saturate and de-plete all free carbon, preventing the condensation of carbon grains.Oxygen and magnesium are abundant, however, and within days ofreaching peak density there is a burst of silicate grain formation.
Rather than being a gradual process, the first burst of nu-cleation occurs rapidly. It is efficient enough to use all avail-able monomers, leaving none for subsequent grain growth. Graingrowth after this initial burst occurs more gradually as CO is de-stroyed (freeing carbon and oxygen) at later times; however, thechange in grain size is negligible in our fiducial model due to theweak level of CO destruction (low ε). This burst-like nature of con-densation results in a size distribution that is dominated by a rep-resentative size, as shown by the mass distribution in the middlepanel of Figure 3, which we have normalized to an assumed totalmass of shocked gas of 10−4 M comparable to the total ejecta mass(eq. 9 and surrounding discussion). The majority of the dust massis contained in silicate grains (XMg2SiO4∼10−3 ) with radii a ∼ 0.4 µm.
Our fiducial abundances are very carbon-poor: the ratio ofYC/YO, denoted as C:O, is less than 1. The formation of carbongrains is therefore dependent on the destruction of CO by non-thermal processes. This occurs at later times as the density de-creases, resulting in delayed formation of carbon grains (t ∼ 60days) with the mass distribution peaking at very small sizes (a ∼10−4 µm). In the presence of a UV radiation field, these smallergrains would heat up due to interactions with photons and likely notsurvive (e.g. Kochanek 2014). However, given the high densities ofthe post-shock gas, small grains are protected in a region that isoptically thick to the harsh radiation, allowing them to survive andpossibly contribute to the extinction. The time at which the densitydecreases to the value below which the carbon would be ionized(nion; eq. B9) is denoted as a vertical dotted line in Figure 3.
The bottom panel of Figure 3 shows the surface area distribu-tion of the grains, a quantity important for determining the magni-tude of optical extinction for viewers along the line of sight of theshocks. As a point of reference, for large grains with sizes in the ge-ometric optics limit (a & λ, where λ is the observing wavelength),to reach an optical depth τλ & 1 requires the surface area of thegrains at t ∼ 1 month to be σ & 4π fΩR2
sh ≈ 4π fΩ(vt)2 ∼ 1029 cm2
for a shell velocity of v ≈ 1000 km s−1 and order-unity shock cov-ering fraction fΩ ∼ 1/3. In our fiducial run, the surface area fromlarge silicate grains alone is therefore enough to produce severalmagnitudes of complete optical extinction (see also Section 5).
A unique feature of dust formation in post-shock gas of ra-diative shocks in novae (e.g., as compared to dust formation in theISM, or even in supernovae) is that the condensation temperatureis reached at extremely high densities. Not only does this justifyour assumption of a carbon-neutral region, but−given the properabundances−grain formation is remarkably efficient. On one hand,such efficient condensation can explain the observed rapid growthof grains in some novae (e.g. V705 Cas, Shore et al. 1994). Onthe other hand, such high densities make CO formation too ef-ficient, which in an oxygen-rich environment (C:O1) makes itchallenging to simultaneously produce carbon grains. As we nowdiscuss, increasing the efficiency of carbon formation from that ofour fiducial model requires either considering regions of the ejectawhich are more carbon-rich (Section 4.1), or higher efficiencies ofmolecule destruction by non-thermal particles (Section 4.2).
MNRAS 000, 1–?? (2016)
8 A. Derdzinski
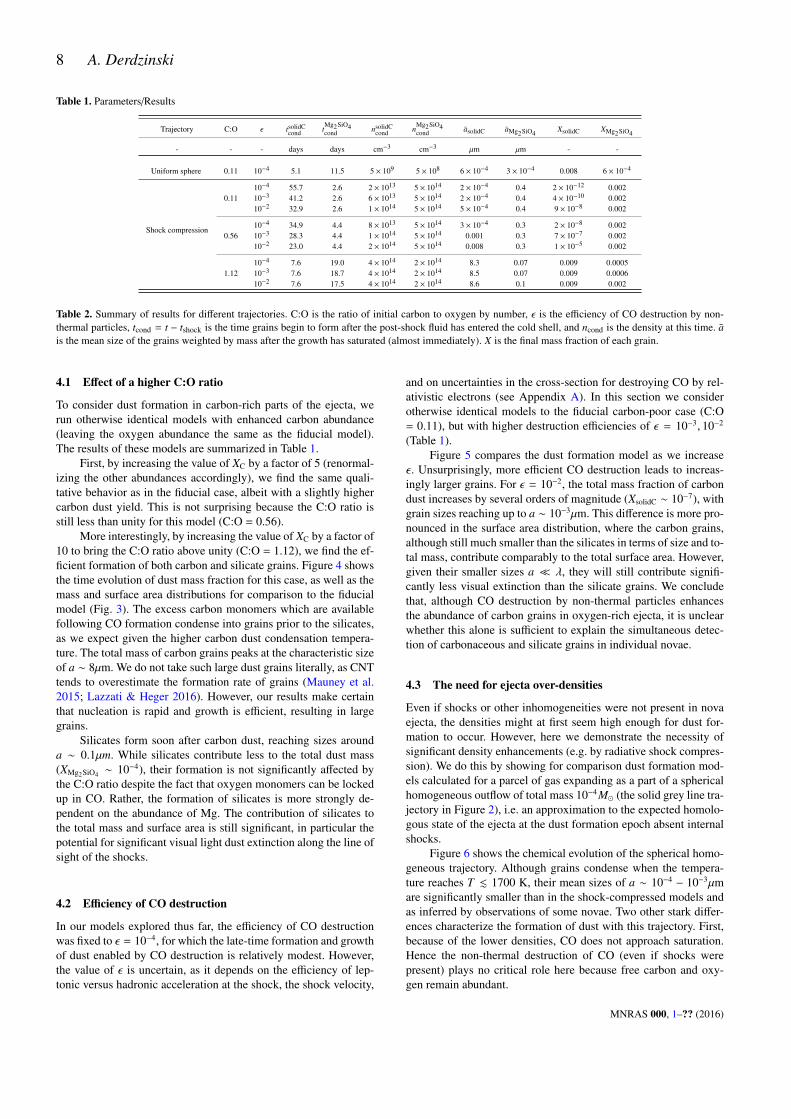
Table 1. Parameters/Results
Trajectory C:O ε tsolidCcond t
Mg2SiO4cond nsolidC
cond nMg2SiO4cond asolidC aMg2SiO4 XsolidC XMg2SiO4
- - - days days cm−3 cm−3 µm µm - -
Uniform sphere 0.11 10−4 5.1 11.5 5 × 10⁹ 5 × 10⁸ 6 × 10⁻⁴ 3 × 10⁻⁴ 0.008 6 × 10⁻⁴
Shock compression
0.1110−4 55.7 2.6 2 × 10¹³ 5 × 10¹⁴ 2 × 10⁻⁴ 0.4 2 × 10⁻¹² 0.00210−3 41.2 2.6 6 × 10¹³ 5 × 10¹⁴ 2 × 10⁻⁴ 0.4 4 × 10⁻¹⁰ 0.00210−2 32.9 2.6 1 × 10¹⁴ 5 × 10¹⁴ 5 × 10⁻⁴ 0.4 9 × 10⁻⁸ 0.002
0.5610−4 34.9 4.4 8 × 10¹³ 5 × 10¹⁴ 3 × 10⁻⁴ 0.3 2 × 10⁻⁸ 0.00210−3 28.3 4.4 1 × 10¹⁴ 5 × 10¹⁴ 0.001 0.3 7 × 10⁻⁷ 0.00210−2 23.0 4.4 2 × 10¹⁴ 5 × 10¹⁴ 0.008 0.3 1 × 10⁻⁵ 0.002
1.1210−4 7.6 19.0 4 × 10¹⁴ 2 × 10¹⁴ 8.3 0.07 0.009 0.000510−3 7.6 18.7 4 × 10¹⁴ 2 × 10¹⁴ 8.5 0.07 0.009 0.000610−2 7.6 17.5 4 × 10¹⁴ 2 × 10¹⁴ 8.6 0.1 0.009 0.002
Table 2. Summary of results for different trajectories. C:O is the ratio of initial carbon to oxygen by number, ε is the efficiency of CO destruction by non-thermal particles, tcond = t − tshock is the time grains begin to form after the post-shock fluid has entered the cold shell, and ncond is the density at this time. ais the mean size of the grains weighted by mass after the growth has saturated (almost immediately). X is the final mass fraction of each grain.
4.1 Effect of a higher C:O ratio
To consider dust formation in carbon-rich parts of the ejecta, werun otherwise identical models with enhanced carbon abundance(leaving the oxygen abundance the same as the fiducial model).The results of these models are summarized in Table 1.
First, by increasing the value of XC by a factor of 5 (renormal-izing the other abundances accordingly), we find the same quali-tative behavior as in the fiducial case, albeit with a slightly highercarbon dust yield. This is not surprising because the C:O ratio isstill less than unity for this model (C:O = 0.56).
More interestingly, by increasing the value of XC by a factor of10 to bring the C:O ratio above unity (C:O = 1.12), we find the ef-ficient formation of both carbon and silicate grains. Figure 4 showsthe time evolution of dust mass fraction for this case, as well as themass and surface area distributions for comparison to the fiducialmodel (Fig. 3). The excess carbon monomers which are availablefollowing CO formation condense into grains prior to the silicates,as we expect given the higher carbon dust condensation tempera-ture. The total mass of carbon grains peaks at the characteristic sizeof a ∼ 8µm. We do not take such large dust grains literally, as CNTtends to overestimate the formation rate of grains (Mauney et al.2015; Lazzati & Heger 2016). However, our results make certainthat nucleation is rapid and growth is efficient, resulting in largegrains.
Silicates form soon after carbon dust, reaching sizes arounda ∼ 0.1µm. While silicates contribute less to the total dust mass(XMg2SiO4 ∼ 10−4), their formation is not significantly affected bythe C:O ratio despite the fact that oxygen monomers can be lockedup in CO. Rather, the formation of silicates is more strongly de-pendent on the abundance of Mg. The contribution of silicates tothe total mass and surface area is still significant, in particular thepotential for significant visual light dust extinction along the line ofsight of the shocks.
4.2 Efficiency of CO destruction
In our models explored thus far, the efficiency of CO destructionwas fixed to ε = 10−4, for which the late-time formation and growthof dust enabled by CO destruction is relatively modest. However,the value of ε is uncertain, as it depends on the efficiency of lep-tonic versus hadronic acceleration at the shock, the shock velocity,
and on uncertainties in the cross-section for destroying CO by rel-ativistic electrons (see Appendix A). In this section we considerotherwise identical models to the fiducial carbon-poor case (C:O= 0.11), but with higher destruction efficiencies of ε = 10−3, 10−2
(Table 1).Figure 5 compares the dust formation model as we increase
ε. Unsurprisingly, more efficient CO destruction leads to increas-ingly larger grains. For ε = 10−2, the total mass fraction of carbondust increases by several orders of magnitude (XsolidC ∼ 10−7), withgrain sizes reaching up to a ∼ 10−3µm. This difference is more pro-nounced in the surface area distribution, where the carbon grains,although still much smaller than the silicates in terms of size and to-tal mass, contribute comparably to the total surface area. However,given their smaller sizes a λ, they will still contribute signifi-cantly less visual extinction than the silicate grains. We concludethat, although CO destruction by non-thermal particles enhancesthe abundance of carbon grains in oxygen-rich ejecta, it is unclearwhether this alone is sufficient to explain the simultaneous detec-tion of carbonaceous and silicate grains in individual novae.
4.3 The need for ejecta over-densities
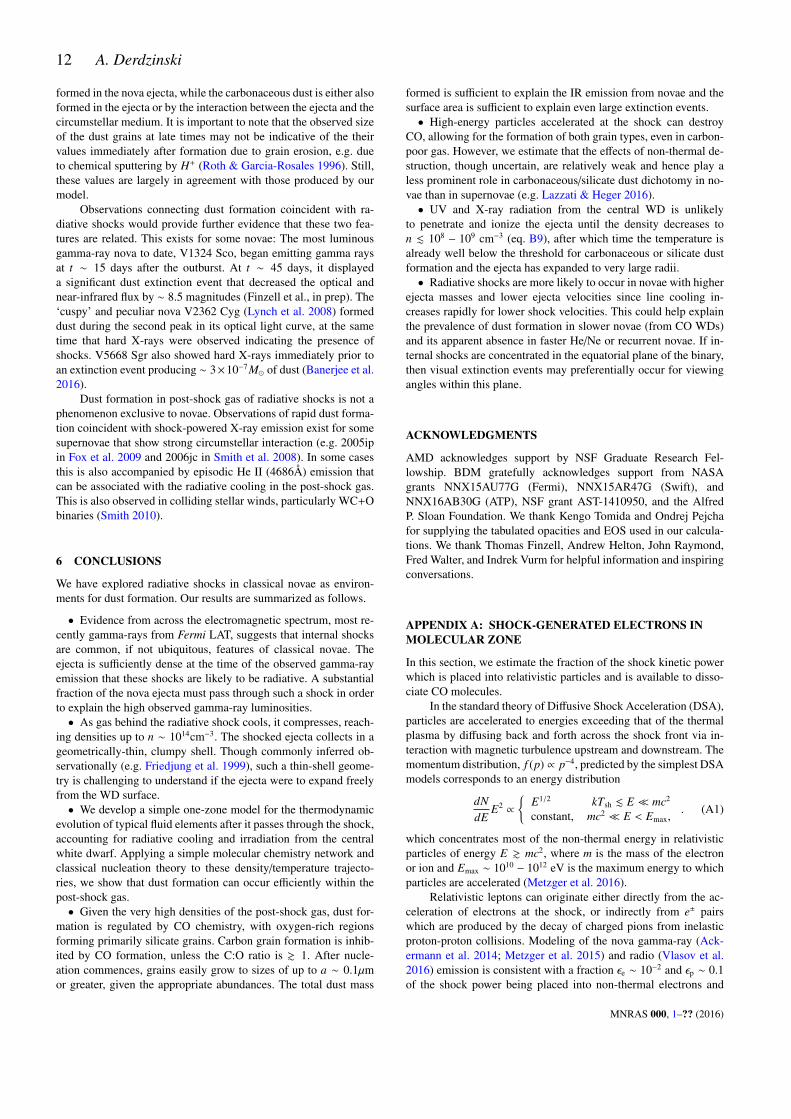
Even if shocks or other inhomogeneities were not present in novaejecta, the densities might at first seem high enough for dust for-mation to occur. However, here we demonstrate the necessity ofsignificant density enhancements (e.g. by radiative shock compres-sion). We do this by showing for comparison dust formation mod-els calculated for a parcel of gas expanding as a part of a sphericalhomogeneous outflow of total mass 10−4 M (the solid grey line tra-jectory in Figure 2), i.e. an approximation to the expected homolo-gous state of the ejecta at the dust formation epoch absent internalshocks.
Figure 6 shows the chemical evolution of the spherical homo-geneous trajectory. Although grains condense when the tempera-ture reaches T . 1700 K, their mean sizes of a ∼ 10−4 − 10−3µmare significantly smaller than in the shock-compressed models andas inferred by observations of some novae. Two other stark differ-ences characterize the formation of dust with this trajectory. First,because of the lower densities, CO does not approach saturation.Hence the non-thermal destruction of CO (even if shocks werepresent) plays no critical role here because free carbon and oxy-gen remain abundant.
MNRAS 000, 1–?? (2016)

Dust formation behind nova shocks 9
100 101 102
t− tshock [days]
10−14
10−12
10−10
10−8
10−6
10−4
10−2
100
mas
sfr
acti
onX
n<
109
cm−
3
C
O
CO
Mg
SiO
Mg 2
SiO 4
C solid
C:O = 0.11
10−4 10−3 10−2 10−1 100 101
a [µm]
10−20
10−16
10−12
10−8
10−4
adM da
[M
]
C :O = 0.11
MASS
Carbon
Silicates
10−4 10−3 10−2 10−1 100 101
a [µm]
1024
1026
1028
1030
1032
adσ da
[cm
2]
C :O = 0.11
SURFACE AREA
Carbon
Silicates
Figure 3. Top: Chemical evolution of gaseous elements and dust during thepost-shock evolution of the gas. CO saturates at early times, reducing theavailability of carbon for forming grains. Silicates (Mg2SiO4) form rapidly,and carbon grains (C solid) condense at t ∼ 2 mo. The red dotted line in-dicates at what time the density decreases below n ≤ 109 cm−3, at whichpoint we expect harsh radiation to penetrate the fluid. Middle: Mass distri-bution of carbon (blue line) and silicate (red line) grains, normalized for atotal shocked ejecta mass Mej = 10−4. Carbon grains are particularly small(a ∼ 10−4µm), given that most of the carbon is locked up in CO. Silicategrains dominate the mass with a characteristic size of a ≈ 0.3 µm. Bottom:Surface area distribution. The contribution to the surface area by silicatesalone is sufficient to cause visual extinction with τ ∼ 1.
100 101 102
t− tshock [days]
10−10
10−8
10−6
10−4
10−2
100
mas
sfr
acti
onX
n<
109
cm−
3
C
O
CO
Mg
SiO
Mg 2
SiO 4
C solid
C:O = 1.12
10−4 10−3 10−2 10−1 100 101 102
a [µm]
10−20
10−16
10−12
10−8
10−4
adM da
[M
]
C :O = 1.12
MASS
Carbon
Silicates
10−4 10−3 10−2 10−1 100 101 102
a [µm]
1024
1026
1028
1030
1032
adσ da
[cm
2]
C :O = 1.12
SURFACE AREA
Carbon
Silicates
Figure 4. Top: Chemical evolution of gaseous elements and dust for C:O >
1. Both carbon and silicate grains condense efficiently. Middle: Mass dis-tribution of carbon (blue line) and silicate (red line) grains (normalizedto Mej = 10−4). Carbon grains dominate in mass with an average mass-weighted size of a ∼ 8µm, and silicates peak at a ∼ 0.1µm. The secondpeak at smaller sizes manifests from a second, weaker burst of nucleationat later times, as CO destruction releases carbon and oxygen. Bottom panel:Surface area distribution. Both carbon and silicate grains contribute amplyto optical extinction.
MNRAS 000, 1–?? (2016)

10 A. Derdzinski
100 101 102
t− tshock [days]
10−14
10−12
10−10
10−8
10−6
10−4
10−2
100
Mas
sF
ract
ionX
C solid
Mg 2
SiO 4
ε = 10−4
ε = 10−3
ε = 10−2
C:O = 0.11
10−4 10−3 10−2 10−1 100
a [µm]
10−18
10−14
10−10
10−6
adM da
[M
] Carbon
Silicates
MASS
e = 10−2
e = 10−3
e = 10−4
10−4 10−3 10−2 10−1 100
a [µm]
1022
1026
1030
1034
adσ da
[cm
2]
Carbon
Silicates
SURFACE AREA
e = 10−2
e = 10−3
e = 10−4
Figure 5. Top: Chemical evolution of carbon and silicate grains, wherewe have varied the efficiency of molecular destruction ε. For higher valuesof ε (lighter blue lines) carbon grains condense earlier and the total mass ofsolid carbon increases considerably. Middle: Final mass distribution of bothgrain types as we increase ε. For higher ε (lighter blue lines), carbon grainsare able to reach larger sizes. Silicate formation is relatively unaffected.Bottom: Surface area distribution. At the highest estimate of ε = 10−2, thesmaller carbon grains contribute considerably to the total surface area.
The second difference, which is problematic for whethergrains can form at all, is that the ejecta density at which grainscondense is lower than in shock-compressed cases by at least 4 or-ders of magnitude (a pink dotted line in Fig. 6 indicates the timewhen the density reaches n = 109 cm−3). This is also illustrated inthe bottom panel of Figure 2, where symbols on the thermodynamictrajectories indicate the time of carbonaceous and silicate grain for-mation in different models. In the spherically homogeneous case,solid carbon grains condense at ncond ≈ 5 × 109 cm−3, followed bysilicates at ncond ≈ 5 × 108 cm−3. These values are close to, or lessthan, the critical density nion ≈ 109 cm−3 (eq. B9) below which crit-ical elements (e.g. carbon or oxygen) will become photo-ionizedby the central WD, hampering dust nucleation. Even if dust for-mation could occur in such an environment, UV radiation from theWD would render such small grains vulnerable to evaporation. Weagain conclude that extreme ejecta over-densities, such as thosewhich arise naturally behind radiative shocks, are crucial for theformation and survival of dust.
5 DISCUSSION AND COMPARISON TO OBSERVATIONS
While novae are observed to form dust on timescales of ∼ 20− 100days after the outburst, we find that nucleation can occur in lessthan 10 days after gas enters a radiative shock. The timescale overwhich the majority of the ejecta will be shocked depends on the rel-ative velocities of the dense, equatorial ejecta and the subsequentfaster ejecta shell or wind, and is typically observed based on thegamma-ray emission to occur over timescales of weeks to a month(Ackermann et al. 2014; Cheung et al. 2016). Regardless of pre-cisely where shocks form, dust formation is most likely inhibiteduntil the gas reaches a sufficiently large distance from the WD,in order for the temperature due to irradiation to decrease belowthe condensation temperature. This constraint could be alleviated ifthe radiation field is non-uniform−for instance, the nova luminositymay be preferentially directed along the polar direction instead ofthe dense equatorial plane where the shocks originate. In this casethe gas would only be subject to the luminosity from the shock it-self, allowing the gas to cool to lower temperatures and perhaps in-creasing the total dust yield. Ultimately the primary role of shocksis to create dense (low entropy), neutral regions within the ejecta,such that−when the appropriate temperature is reached−dust for-mation can occur efficiently.
While the high densities resulting from shock compression arefavorable for forming grains, they can also be problematic insofaras they enable CO saturation, preventing carbon grain formation.Our estimates of the efficacy of molecule destruction and our pa-rameterization of the shock power come with large uncertainties,and this study is meant to only illustrate a range of possibilities.Indeed, dust-forming novae exhibit a variety of grain types andcharacteristic sizes, the range of which may be reconciled with dif-ferences in abundances and ejecta velocities. We expect, given ourmodel, that the total a total dust event will result from a range of tra-jectories with variations in the composition, and the resulting grainsizes will form a distribution around some representative value(s).Nevertheless, even for high assumed CO destruction efficienciesε = 10−2, we find that the amount of carbon dust formed in highlyoxygen-rich ejecta is low by mass compared to that of silicate dust.In QV Vul (Gehrz et al. 1992), V705 Cas (Mason et al. 1998; Evanset al. 1997), and V1280 Sco (Sakon et al. 2016), carbon-rich dustis identified first, followed later by silicate formation. Our mod-els suggest that such silicate/carbon grain dichotomy in novae may
MNRAS 000, 1–?? (2016)
Dust formation behind nova shocks 11
100 101 102
t− tshock [days]
10−14
10−12
10−10
10−8
10−6
10−4
10−2
100
mas
sfr
acti
onX
n<
109
cm−
3
C
O
COMg
SiO
Mg 2
SiO
4
Cso
lid
C:O = 0.11
10−4 10−3 10−2
a [µm]
10−14
10−12
10−10
10−8
10−6
10−4
adM da
[M
]
C :O = 0.11
MASS
Carbon
Silicates
Figure 6. Top: Chemical evolution of gaseous elements and dust during theexpansion of a uniform sphere. Left of the dotted vertical line, the densityis above values at which all elements remain neutral (n > 109 cm−3). Inthis trajectory, CO does not saturate which allows for the formation of bothcarbon and silicate grains. However, grains form at lower densities, at whichwe need to worry about certain elements (particularly carbon) being photo-ionized. Bottom: Mass distribution of carbon (purple circles) and silicate(light diamonds) grains (normalized to Mej = 10−4). The mass is dominatedby grains that are smaller than a < 10−3µm. At such small sizes these grainsare subject to evaporation by an external radiation field, particularly becausethey form in a lower density gas. These grains would likely not survive tocontribute to any visual extinction.
be explained by chemical gradients or heterogeneity in the ejecta(e.g. Gehrz et al. 1998, Pontefract & Rawlings 2004).
When dust forms in novae, the optical depth of the grains in-ferred from optical extinction can range from . 0.1 to ∼ 10 inthe most prolific dust producing events (McLaughlin 1935; Evanset al. 2005). Assuming that the grain size exceeds the wavelengthof optical light, the cross section of a dust grain is taken to be itsgeometrical value of σ = πa2. The optical depth of a shell of grainsof identical size at a radius R is given by
τ =Mdσ
4π fΩR2shmd
=3Md
16π fΩaρdR2sh
, (29)
where md = (4πa3/3)ρd is the mass of a spherical dust grain, ρd ' 2
g cm−3 is the bulk density of the grain. Inverting for the dust mass,
Md =16π
3aρdR2 fΩτ ' 5 × 10⁻⁸ M
(τ
1
) ( a0.1µm
) ( Rsh
3 × 1014cm
)2
,
(30)
where we have set the covering fraction fΩ = 1/3 and normal-ized the radius Rsh to a typical value of the shell radius ∼ vt on atimescale of a month when the dust formation is observed to occur.Thus, we see that for τ ∼ 0.1 − 10 we require total dust masses ofMd ∼ 10−10 − 10−7 M for 0.1µm grains. This corresponds to a dustmass fraction in the shocked ejecta of Xd ∼ 10−6 − 10−3 for typicaltotal masses of shocked gas of M ∼ 10−4 M. Even our most con-servative model find total dust mass fraction exceeding Xd = 10−3,the majority of which is large silicate grains with sizes that exceedoptical wavelengths (validating the geometric optics limit). Thus, ifa fraction ∼ 0.01 − 1 of the total ejecta is shocked, our model canaccount for the observed extinction.
Evidence suggests that the radiative shocks in novae are con-centrated in the equatorial plane, where the fast outflow meets aslow equatorial shell (§1; Chomiuk et al. 2014). Thus, even efficientdust formation may not result in strong visual extinction events forall viewers, in particular those with viewing angles aligned with thebinary rotation axis. Indeed, while only ∼ 20 percent of classicalnovae are classified as D-class (indicating that dust formed alongthe line of sight), Spitzer observations indicate that at least 40% ofnovae form dust (Helton 2010a). This is likely a lower limit, giventhat the Spitzer sample was heavily biased towards Ne-rich novaethat typically do not produce dust. Likewise, an analysis of novaein the SMARTS database (Walter et al. 2012) suggest that up to80% of non Ne-rich/recurrent novae form dust (F. Walter, privatecommunication). Of those, roughly 1/3 have dust dips indicatingdust on the line of sight; the other 2/3 do not (but have a near-IRexcess), indicating that the dust does not form in a uniform shell.This is consistent with a scenario in which dust formation occursbehind radiative shocks concentrated in the equatorial plane of thebinary.
Observations show that essentially no He-Ne/recurrent no-vae form dust. This may be explained in our scenario by the factthat, even if internal shocks occur in these faster novae, the gen-erally lower ejecta masses (and possibly higher ejecta velocities)of He-Ne/recurrent novae make these shocks unlikely to be radia-tive (eq. 7). Without radiative cooling, the shock-induced compres-sion is much more modest, and the post-shock region will be lessshielded from ionizing radiation.
An important implication for dust formation within the dense,equatorial ejecta is that by implementing the abundances inferredfrom Morisset & Pequignot (1996), we assume that the initial‘slow’ component of the nova outflow originates from the WD sur-face. This is in contrast with suggestions that the equatorial ejectamay instead be stripped from the companion (Williams & Mason2010), in which case it would be primarily composed of hydrogen.In our model, the initial ejecta must be enriched with CNO prod-ucts from the WD so that it contains the critical elements for laterforming grains.
Spectroscopic observations are invaluable for determining thespecific dust properties. Sakon et al. (2016) study dust formationin the FeII nova V1280 Sco (Munari et al. 2007) by means ofmulti-epoch infrared observations. They find that a total mass of∼ 8 × 10⁻⁸ M of carbonaceous dust forms with a characteristicsize of 0.01 µm, while ∼ 3 × 10⁻⁷ M of silicate dust forms with0.3 − 0.5µm. Sakon et al. (2016) interpret the silicates as having
MNRAS 000, 1–?? (2016)
12 A. Derdzinski
formed in the nova ejecta, while the carbonaceous dust is either alsoformed in the ejecta or by the interaction between the ejecta and thecircumstellar medium. It is important to note that the observed sizeof the dust grains at late times may not be indicative of the theirvalues immediately after formation due to grain erosion, e.g. dueto chemical sputtering by H+ (Roth & Garcia-Rosales 1996). Still,these values are largely in agreement with those produced by ourmodel.
Observations connecting dust formation coincident with ra-diative shocks would provide further evidence that these two fea-tures are related. This exists for some novae: The most luminousgamma-ray nova to date, V1324 Sco, began emitting gamma raysat t ∼ 15 days after the outburst. At t ∼ 45 days, it displayeda significant dust extinction event that decreased the optical andnear-infrared flux by ∼ 8.5 magnitudes (Finzell et al., in prep). The‘cuspy’ and peculiar nova V2362 Cyg (Lynch et al. 2008) formeddust during the second peak in its optical light curve, at the sametime that hard X-rays were observed indicating the presence ofshocks. V5668 Sgr also showed hard X-rays immediately prior toan extinction event producing ∼ 3×10⁻⁷ M of dust (Banerjee et al.2016).
Dust formation in post-shock gas of radiative shocks is not aphenomenon exclusive to novae. Observations of rapid dust forma-tion coincident with shock-powered X-ray emission exist for somesupernovae that show strong circumstellar interaction (e.g. 2005ipin Fox et al. 2009 and 2006jc in Smith et al. 2008). In some casesthis is also accompanied by episodic He II (4686Å) emission thatcan be associated with the radiative cooling in the post-shock gas.This is also observed in colliding stellar winds, particularly WC+Obinaries (Smith 2010).
6 CONCLUSIONS
We have explored radiative shocks in classical novae as environ-ments for dust formation. Our results are summarized as follows.
• Evidence from across the electromagnetic spectrum, most re-cently gamma-rays from Fermi LAT, suggests that internal shocksare common, if not ubiquitous, features of classical novae. Theejecta is sufficiently dense at the time of the observed gamma-rayemission that these shocks are likely to be radiative. A substantialfraction of the nova ejecta must pass through such a shock in orderto explain the high observed gamma-ray luminosities.• As gas behind the radiative shock cools, it compresses, reach-
ing densities up to n ∼ 1014cm−3. The shocked ejecta collects in ageometrically-thin, clumpy shell. Though commonly inferred ob-servationally (e.g. Friedjung et al. 1999), such a thin-shell geome-try is challenging to understand if the ejecta were to expand freelyfrom the WD surface.• We develop a simple one-zone model for the thermodynamic
evolution of typical fluid elements after it passes through the shock,accounting for radiative cooling and irradiation from the centralwhite dwarf. Applying a simple molecular chemistry network andclassical nucleation theory to these density/temperature trajecto-ries, we show that dust formation can occur efficiently within thepost-shock gas.• Given the very high densities of the post-shock gas, dust for-
mation is regulated by CO chemistry, with oxygen-rich regionsforming primarily silicate grains. Carbon grain formation is inhib-ited by CO formation, unless the C:O ratio is & 1. After nucle-ation commences, grains easily grow to sizes of up to a ∼ 0.1µmor greater, given the appropriate abundances. The total dust mass
formed is sufficient to explain the IR emission from novae and thesurface area is sufficient to explain even large extinction events.• High-energy particles accelerated at the shock can destroy
CO, allowing for the formation of both grain types, even in carbon-poor gas. However, we estimate that the effects of non-thermal de-struction, though uncertain, are relatively weak and hence play aless prominent role in carbonaceous/silicate dust dichotomy in no-vae than in supernovae (e.g. Lazzati & Heger 2016).• UV and X-ray radiation from the central WD is unlikely
to penetrate and ionize the ejecta until the density decreases ton . 108 − 109 cm−3 (eq. B9), after which time the temperature isalready well below the threshold for carbonaceous or silicate dustformation and the ejecta has expanded to very large radii.• Radiative shocks are more likely to occur in novae with higher
ejecta masses and lower ejecta velocities since line cooling in-creases rapidly for lower shock velocities. This could help explainthe prevalence of dust formation in slower novae (from CO WDs)and its apparent absence in faster He/Ne or recurrent novae. If in-ternal shocks are concentrated in the equatorial plane of the binary,then visual extinction events may preferentially occur for viewingangles within this plane.
ACKNOWLEDGMENTS
AMD acknowledges support by NSF Graduate Research Fel-lowship. BDM gratefully acknowledges support from NASAgrants NNX15AU77G (Fermi), NNX15AR47G (Swift), andNNX16AB30G (ATP), NSF grant AST-1410950, and the AlfredP. Sloan Foundation. We thank Kengo Tomida and Ondrej Pejchafor supplying the tabulated opacities and EOS used in our calcula-tions. We thank Thomas Finzell, Andrew Helton, John Raymond,Fred Walter, and Indrek Vurm for helpful information and inspiringconversations.
APPENDIX A: SHOCK-GENERATED ELECTRONS INMOLECULAR ZONE
In this section, we estimate the fraction of the shock kinetic powerwhich is placed into relativistic particles and is available to disso-ciate CO molecules.
In the standard theory of Diffusive Shock Acceleration (DSA),particles are accelerated to energies exceeding that of the thermalplasma by diffusing back and forth across the shock front via in-teraction with magnetic turbulence upstream and downstream. Themomentum distribution, f (p) ∝ p−4, predicted by the simplest DSAmodels corresponds to an energy distribution
dNdE
E2 ∝
E1/2 kTsh . E mc2
constant, mc2 E < Emax,. (A1)
which concentrates most of the non-thermal energy in relativisticparticles of energy E & mc2, where m is the mass of the electronor ion and Emax ∼ 1010 − 1012 eV is the maximum energy to whichparticles are accelerated (Metzger et al. 2016).
Relativistic leptons can originate either directly from the ac-celeration of electrons at the shock, or indirectly from e± pairswhich are produced by the decay of charged pions from inelasticproton-proton collisions. Modeling of the nova gamma-ray (Ack-ermann et al. 2014; Metzger et al. 2015) and radio (Vlasov et al.2016) emission is consistent with a fraction εe ∼ 10−2 and εp ∼ 0.1of the shock power being placed into non-thermal electrons and
MNRAS 000, 1–?? (2016)

Dust formation behind nova shocks 13
protons, respectively. The fraction of the shock power given to e±
pairs is thus ε± ' fπεp/3, where fπ ≈ 0.1 is the fraction of the pro-ton energy per inelastic collision placed into pions, and the factorof 1/3 accounts for the the other 2/3 of the pion energy, which goesinto photons (π0) and neutrinos.
First, consider relativistic electrons that are directly acceler-ated at the shock and then advected downstream with the flow. Anelectron produced near the shock of initial energy Ee will lose thatenergy to inelastic Coulomb scatterings with the thermal plasma ona timescale given by
tC ≈
150(Ee/mec2)n−1
10 s, Ee mec2
100(Ee/mec2)3/2n−110 s, Ee mec2,
. (A2)
where ne ≈ n = 1010n10 cm−3 is the post-shock electon density andwe have adopted a value of ln Λ ≈ 25 for the Coulomb logarithm.This timescale is generally shorter than the cooling timescale overwhich the post-shock gas cools and enters the central shell, tcool ≈
8000n−110 v3.4
8 s (eq. 4, for v8 < 1), except for particles of energy5
Ee & Emin,lep ≈ 53mec2v3.48 . (A3)
Depending on the shock speed, electrons will enter the cool molec-ular shell with energies Ee & 1 − 100mec2.
Now consider e± pairs which are produced indirectly throughhadronic interactions. Relativistic protons accelerated at the shockto collide with background protons of density ∼ n on a timescale of
tπ = (nσπc)−1 = 8 × 10⁵n−110 s, (A4)
where σπ ≈ 4× 10⁻²⁶ cm2 is the inelastic p-p cross section (Kamaeet al. 2006). The value of tπ is much longer than the flow time be-hind the shock ∼ tcool, indicating that pion production will mainlyoccur within the central shell (Metzger et al. 2016). Charged pionsdecay into pairs of energy & 0.3mπc2 ∼ 40 MeV (e.g., Vlasov et al.2016), such that, in analogy with equation (A3), the minimum en-ergy of pairs which are injected into the molecular zone is given by
Ee & Emin,had ≈ 0.3mπc2 ≈ 40MeV (A5)
Once in the molecular region, relativistic electrons orpositrons of energy Ee & Emin,lep, Emin,had lose energy to moleculardissociation and ionization in addition to Coulomb energy losses(eq. A2). The timescale for energy loss to dissociation is given by
tdis ≈Ee
Lnmolve≈
200(Ee/mec2)2n−1
mol,10 s, Ee mec2
150(Ee/mec2)3/2n−1mol,10 s, Ee mec2,
.
(A6)
where nmol is the density of molecules and L ≈ 4×10⁻¹⁵(Ee/keV)−1
cm2 eV is the energy loss function, which we have obtained byextrapolating Fig. 3 of Victor & Liu (1994) to high energies Ee &keV.
While the electrons or positrons are still ultra-relativistic(Ee mec2), we have tC/tdis ∝ (E/mec2)−1 1, and henceCoulomb losses dominate ionization losses. However, once theelectrons cool to mildly relativistic energies (Ee . mec2) a fixedfraction tC/tdis ≈ nmol/(n + nmol) of their power goes into dis-sociation/ionization. Thus, the total fraction of the initial elec-tron/positron energy used to dissocate molecules is very roughly
5 At much higher energies, Ee & 103mec2, additional cooling from rela-tivistic bremsstrahlung emission dominates Coulomb cooling in the com-pressing gas (Vurm et al. , in prep).
approximated as
fdis ∼
(Emin
mec2
)−1
fmol, (A7)
where Emin = Emin,lep or Emin,had and fmol ≡nmol
(n+nmol)is the number
fraction of the relevant molecule.Combining the fact that electrons(positrons) of energy & Emin
represent an order-unity fraction of the total shock-accelerated pop-ulation for the standard DSA spectrum (eq. A1), we conclude that,to order of magnitude, the fraction of the shock power which goesinto dissociating molecules is given in the leptonic case by
ε ≈ εe fdis ∼
(Emin,lep
mec2
)−1
fmol ∼ 10−3v−3.48 fmol, (A8)
In the hadronic case, the fraction is
ε ≈( εp
3
)fπ
(Emin,had
mec2
)−1
fmol ∼ 10−4 fmol, (A9)
where again we have averaged over the pair distribution producedby a logarithmically flat proton energy distribution (eq. A1).
Finally, protons accelerated at the shock could themselves di-rectly dissociate molecules in the central shell. For high energy& mπc2 protons, the pion production cross section is much higherthan the molecular cross section. However, for lower energy pro-tons of energy mπc2 below the pion production threshold, per-haps constituting one percent of the total energy placed in non-thermal protons, a significant fraction of the proton energy couldbe available to ionize atoms or molecules. We therefore crudely es-timate a CO dissociation efficiency of
ε . 0.01εp fmol ∼ 3 × 10⁻³ fmol, (A10)
comparable to leptons produced in the direct acceleration case.For a typical CO molecule fraction of fmol ∼ 0.1, we estimate
total characteristic values of ε ∼ 10−4 − 3 × 10⁻³. These motivatethe fiducial value of ε = 10−4 adopted in our chemistry network(Section 3.1). We assume in equation (23) that the dissociation ratedirectly tracks the shock power. However, the effective value of εcould be higher than estimated above if, for instance, the pion pro-duction timescale within the central shell is longer than the evolu-tion timescale over which the shock power is dropping. In such acase, the rate of dissociation could be potentially higher than wouldbe predicted by the current shock power.
APPENDIX B: IONIZATION STATE
Here we address the density above which the ejecta will remainopaque to hard radiation above the ionization thresholds of abun-dant elements such as hydrogen, helium, and carbon. The latter be-ing neutral is thought to be a key requisite to the chemistry requiredto form complex molecules and dust. As the density of the ejectadecreases due to radial expansion, ionizing super-soft X-ray radi-ation from the central white dwarf (e.g. Schwarz et al. 2011, Wolfet al. 2013) will eventually penetrate this material.
Absent an external source of photo-ionization, atoms will re-combine into their ground states in the central shell. The opticaldepth through the freely expanding central shell at time t is givenby
τ =Mejκ
4πR2sh
≈ 0.23(
κ
cm2 g−1
)M−4v−2
8 t−2month, (B1)
MNRAS 000, 1–?? (2016)

14 A. Derdzinski
where κ is the opacity, Rsh = vsht, vsh = 108v8 cm s−1 and t = tmonth
month.For hydrogen-like species of charge Z, atomic mass A and
mass fraction XA, the bound-free opacity of neutral gas is approxi-mately given by (Osterbrock & Ferland 2006)
κbf ≈XAσbf,ν fn
Amp≈ 3.6 × 106 cm2 g−1 fnXAA−1Z−2
(νthr
ν
)3, (B2)
where σbf,ν is the bound-free cross section for photons of frequencyν, νthr ≈ 13.6Z2 eV is the ionization threshold frequency and fn isthe neutral fraction. For values of the opacity κ ≈ κbf correspondingto neutral ejecta with fn ∼ 1, we see that the shell will remainoptically thick τ 1 to UV/X-ray photons for many months.
Hard radiation can penetrate the ejecta once the neutral frac-tion is reduced to a value fn 1 by photo-ionization. The impor-tance of photo-ionization is commonly quantified by the ionizationparameter, which for the cold central shell is given by
ξ =4πFH
n= 0.14 erg cm s−1 L38n−1
10 v−28 t−2
month (B3)
where FH ≈ LWD/4πR2sh is the ionizing flux from the WD of lumi-
nosity LWD = 1038L38 erg s−1. An ionization parameter ξ 1 isrequired for complete ionization, depending on composition.
Nebular radiation will ionize the ejecta to a depth ∆, set bythe location at which the effective optical depth of a photon of fre-quency ν & νthr to absorption reaches unity, i.e.,
1 =
∫ ∆
0ρejκbf,ν
[1 + ρejκes s
]ds ≈ τabs(1 + τes), (B4)
where s is the depth through the ionized layer, τabs ≡ κbf,νρej∆ is theoptical depth through the layer to true absorption, and ρej = µnmp
is the density in the shell (assumed uniform). The factor 1 + τes
accounts for the additional path-length traversed by the photon dueto electron scattering, where τes = ρejκes∆ is the electron scatteringoptical depth through the ionized layer.
The neutral fraction fn is determined by the balance betweenphoto-ionization and recombination:
fn =
(1 +
4παrecne
∫Jνhνσbf,νdν
)−1
≈fn1
αrecneπR2sh
(∫ ∞
νthr
Lνhνσbf,νdν
)−1
≈πR2
shαrecne(hνth)Lνthνthσbf,th
≈ 2 × 10⁻⁵Z6ε−1thr T−0.8
e,4 n10v28t2
monthL−138 (B5)
where Jν = Lν/4π2R2sh is the mean specific intensity of ioniz-
ing radiation, αrec = 2.6 × 10⁻¹³Z2T−0.8e,4 cm3 s−1 is the approx-
imate case B radiative recombination rate, and Te,4 is the elec-tron temperature in the ionized layer in units of 104 K. We defineεthr ≡ νthrLνthr/LWD < 1 as the fraction of the total ionizing radiationwhich resides at frequencies near the ionization threshold.
Using equations (B2) and (B5), the ratio of bound-free to scat-tering opacity at the ionization threshold is given by
ζthr ≡κbf,ν
κes
∣∣∣∣∣ν=νthr
'XAσbf,νthr fn
Ampκes
≈ 180XAA−1Z4ε−1thr T−0.8
e,4 n10v28t2
monthL−1X,38 1, (B6)
where we have estimated the number density of electrons as ne ∼ n.Bound-free opacity thus dominates electron scattering opacity forparameters of interest, allowing us to neglect the effect of the latteron the opacity depth in equation (B4).
Photons of frequency νth penetrate the ejecta to a depth ∆ion ≈
ρej/κbf , the ratio with respect to the ejecta radius is given by
∆ion
∆sh≈
4πR2sh
Mejκbf≈
LνthνthAmp
MejXAαrecne(hνth)
≈ 0.06AX−1A Z−4εthr M−1
−4T 0.8e,4 n−1
10 L38, (B7)
where ∆sh = Mej/(4πρejR2sh) is the shell thickness. The shell will
shield ionizing radiation from its interior until ∆ion ∼ ∆sh, as occursbelow a critical density nion given by
nion ≈εthrLWDAmp
(hνth)αrec MejXA
≈ 6 × 108cm−3 M−1−4
(εthr
0.1
)L38Z−4A
( XA
0.1
)−1
T 0.8e,4
(B8)
Now, adopt a normalization appropriate to CI, for which hνthr ≈
11.3 eV, the threshold cross section σth ≈ 10Mb, and the recombi-nation rate is 6.9 × 10⁻¹³ cm3 s−1 for ≈ 104 K gas (Nahar 1996).Adopting these values, we find that a carbon ionization front pene-trates the ejecta below a density of
nion,C ≈ 8 × 108cm−3 M−1−4(εthr/0.1)L38(XC/0.1)−1 (B9)
Thus, the ejecta of mass ∼ 10−5 − 10−4 M will remain shieldedfrom H-ionizing 13.6 eV photons (Z = 1, A = 1, XA ∼ 1) until then . 109 − 1010 cm−3 and shielded from carbon ionizing photonsto a similar density range. As shown in Figure 2, these densitiesare only achieved at sufficiently large radii where dust has alreadyformed.
It is useful to compare the minimum shielding density to theejecta density at the time of dust condensation. The temperature Td
of a dust grain in the central shell a distance vejt from the star isgiven by
Td =
(L
16πr2σ
〈Qa〉
〈Qe〉
)1/4
, (B10)
where 〈Qa〉 and 〈Qe〉 are the Planck mean absorptivity and emis-sivity of the grain material, respectively. Taking 〈Qa〉 = 1 and〈Qe〉 ≈ 0.01bT 2 gives a condensation radius (Td ≈ Tc) of
Rc =
(L
16πσT 4c
〈Qa〉
〈Qe〉
)1/2
≈ 1.0 × 1014cm L1/238
( Tc
1200K
)−3 (b
1µm
)−1/2
, (B11)
where the condensation temperature Tc = 1200 K is normalized toa characteristic value for graphite.
The shell reaches this radius on the expansion timescale of
tc =Rc
vej≈ 12d v8L1/2
38
( Tc
1200K
)−3 (b
1µm
)−1/2
, (B12)
at which time the mean density of the (unshocked) nova ejecta isgiven by
nc ≈3Mej
4πR3cmp
≈ 3 × 1010 cm−3,M−4L−3/238
( Tc
1200K
)9 (b
1µm
)3/2
(B13)
Thus, for small grains b . 0.1µm we have nc . nion, indicatingthat such grains cannot form given the mean densities we expect ifthe nova ejecta expands as a uniform spherical outflow. This em-phasizes the need for radiative shocks, which compress the gas byfactors of & 103 (Section 4.3).
MNRAS 000, 1–?? (2016)

Dust formation behind nova shocks 15
REFERENCES
Abdo A. A., et al., 2010, Science, 329, 817Ackermann M., et al., 2014, Science, 345, 554Banerjee D. P. K., Srivastava M. K., Ashok N. M., Venkataraman V., 2016,
MNRAS, 455, L109Bath G. T., Harkness R. P., 1989, in Bode M. F., Evans A., eds, Classical
Novae. pp 61–72Bath G. T., Shaviv G., 1976, MNRAS, 175, 305Becker R., Döring W., 1935, Annalen der Physik, 24, 719Bode M. F., Evans A., 2008, Classical NovaeBode M. F., Roberts J. A., Whittet D. C. B., Seaquist E. R., Frail D. A.,
1987, Nature, 329, 519Cherchneff I., Dwek E., 2009, ApJ, 703, 642Cheung C. C., et al., 2016, preprint, (arXiv:1605.04216)Chevalier R. A., Imamura J. N., 1982, ApJ, 261, 543Chomiuk L., et al., 2014, Nature, 514, 339Clayton D. D., 2013, ApJ, 762, 5Dougherty S. M., Waters L. B. F. M., Bode M. F., Lloyd H. M., Kester
D. J. M., Bontekoe T. R., 1996, A&A, 306, 547Drake J. J., et al., 2009, ApJ, 691, 418Evans A., Gehrz R. D., 2008, in Classical NovaeEvans A., Gehrz R. D., 2012, Bulletin of the Astronomical Society of India,
40, 213Evans A., Geballe T. R., Rawlings J. M. C., Scott A. D., 1996, MNRAS,
282, 1049Evans A., Geballe T. R., Rawlings J. M. C., Eyres S. P. S., Davies J. K.,
1997, MNRAS, 292, 192Evans A., Tyne V. H., Smith O., Geballe T. R., Rawlings J. M. C., Eyres
S. P. S., 2005, MNRAS, 360, 1483Feder J., Russell K., Lothe J., Pound G., 1966, Advances in Physics, 15,
111Ferguson J. W., Alexander D. R., Allard F., Barman T., Bodnarik J. G.,
Hauschildt P. H., Heffner-Wong A., Tamanai A., 2005, ApJ, 623, 585Ferland G. J., Shields G. A., 1978, ApJ, 226, 172Finzell T., Chomiuk L., Munari U., Walter F. M., 2015, ApJ, 809, 160Fox O., et al., 2009, ApJ, 691, 650Friedjung M., 1987, A&A, 180, 155Friedjung M., Mikołajewska J., Mikołajewski M., 1999, A&A, 348, 475Gehrz R. D., 2008, in Classical NovaeGehrz R. D., Grasdalen G. L., Hackwell J. A., Ney E. P., 1980, ApJ, 237,
855Gehrz R. D., Grasdalen G. L., Hackwell J. A., 1985, ApJ, 298, L47Gehrz R. D., Jones T. J., Woodward C. E., Greenhouse M. A., Wagner
R. M., Harrison T. E., Hayward T. L., Benson J., 1992, ApJ, 400, 671Gehrz R. D., Truran J. W., Williams R. E., Starrfield S., 1998, PASP, 110, 3Geisel S. L., Kleinmann D. E., Low F. J., 1970, ApJ, 161, L101Helton L. A., 2010a, PhD thesis, University of MinnesotaHelton L. A., 2010b, PhD thesis, University of MinnesotaHelton L. A., et al., 2012, ApJ, 755, 37Hillman Y., Prialnik D., Kovetz A., Shara M. M., Neill J. D., 2014, MNRAS,
437, 1962Johnson D. J., Friedlander M. W., Katz J. I., 1993, ApJ, 407, 714Kamae T., Karlsson N., Mizuno T., Abe T., Koi T., 2006, ApJ, 647, 692Kato M., Hachisu I., 1994, ApJ, 437, 802Keith A. C., Lazzati D., 2011, MNRAS, 410, 685Kochanek C. S., 2014, preprint, (arXiv:1407.7856)Kozasa T., Hasegawa H., 1987, Progress of Theoretical Physics, 77, 1402Krautter J., 2008, in Evans A., Bode M. F., O’Brien T. J., Darnley M. J.,
eds, Astronomical Society of the Pacific Conference Series Vol. 401,RS Ophiuchi (2006) and the Recurrent Nova Phenomenon. p. 139
Lazzati D., Heger A., 2016, ApJ, 817, 134Livio M., Shankar A., Burkert A., Truran J. W., 1990, ApJ, 356, 250Lloyd H. M., O’Brien T. J., Bode M. F., 1997, MNRAS, 284, 137Lynch D. K., et al., 2008, AJ, 136, 1815Mason C. G., Gehrz R. D., Woodward C. E., Smilowitz J. B., Hayward
T. L., Houck J. R., 1998, ApJ, 494, 783Mauney C., Buongiorno Nardelli M., Lazzati D., 2015, ApJ, 800, 30
McLaughlin D. B., 1935, Popular Astronomy, 43, 265Metzger B. D., Hascoët R., Vurm I., Beloborodov A. M., Chomiuk L.,
Sokoloski J. L., Nelson T., 2014, MNRAS, 442, 713Metzger B. D., Finzell T., Vurm I., Hascoët R., Beloborodov A. M.,
Chomiuk L., 2015, MNRAS, 450, 2739Metzger B. D., Caprioli D., Vurm I., Beloborodov A. M., Bartos I., Vlasov
A., 2016, MNRAS, 457, 1786Morisset C., Pequignot D., 1996, A&A, 312, 135Mukai K., Ishida M., 2001, ApJ, 551, 1024Mukai K., Orio M., Della Valle M., 2008, ApJ, 677, 1248Munari U., Siviero A., Henden A., Ochner P., Simoncelli C., Tomasoni S.,
Moschini F., Dallaporta S., 2007, Central Bureau Electronic Telegrams,1099
Nahar S. N., 1996, ApJS, 106, 213Ney E. P., Hatfield B. F., 1978, ApJ, 219, L111Nofar I., Shaviv G., Starrfield S., 1991, ApJ, 369, 440Nozawa T., Kozasa T., Umeda H., Maeda K., Nomoto K., 2003, ApJ, 598,
785Orlando S., Drake J. J., 2012, MNRAS, 419, 2329Orlando S., Drake J. J., Laming J. M., 2009, A&A, 493, 1049Osterbrock D. E., Ferland G. J., 2006, Astrophysics of gaseous nebulae and
active galactic nucleiPontefract M., Rawlings J. M. C., 2004, MNRAS, 347, 1294Rawlings J. M. C., 1988, MNRAS, 232, 507Rawlings J., Evans A., 2008, in Classical NovaeRawlings J. M. C., Williams D. A., 1989, MNRAS, 240, 729Ribeiro V. A. R. M., Munari U., Valisa P., 2013, ApJ, 768, 49Roche P. F., Aitken D. K., Whitmore B., 1984, MNRAS, 211, 535Roth J., Garcia-Rosales C., 1996, Nuclear Fusion, 36, 1647Rudy R. J., Dimpfl W. L., Lynch D. K., Mazuk S., Venturini C. C., Wilson
J. C., Puetter R. C., Perry R. B., 2003, ApJ, 596, 1229Saizar P., Ferland G. J., 1994, ApJ, 425, 755Sakon I., et al., 2016, ApJ, 817, 145Schaefer G. H., et al., 2014, Nature, 515, 234Schwarz G. J., 2002a, ApJ, 577, 940Schwarz G. J., 2002b, ApJ, 577, 940Schwarz G. J., Hauschildt P. H., Starrfield S., Baron E., Allard F., Shore
S. N., Sonneborn G., 1997, MNRAS, 284, 669Schwarz G. J., Shore S. N., Starrfield S., Vanlandingham K. M., 2007, ApJ,
657, 453Schwarz G. J., et al., 2011, ApJS, 197, 31Scott A. D., Evans A., Rawlings J. M. C., 1994, MNRAS, 269, L21Seaquist E. R., Duric N., Israel F. P., Spoelstra T. A. T., Ulich B. L., Gregory
P. C., 1980, AJ, 85, 283Seaton M. J., Yan Y., Mihalas D., Pradhan A. K., 1994, MNRAS, 266, 805Semenov D., Henning T., Helling C., Ilgner M., Sedlmayr E., 2003, A&A,
410, 611Shore S. N., 2012, Bulletin of the Astronomical Society of India, 40, 185Shore S. N., Starrfield S., Gonzalez-Riestrat R., Hauschildt P. H., Son-
neborn G., 1994, Nature, 369, 539Shore S. N., De Gennaro Aquino I., Schwarz G. J., Augusteijn T., Cheung
C. C., Walter F. M., Starrfield S., 2013, A&A, 553, A123Sirko E., Goodman J., 2003, MNRAS, 341, 501Smith N., 2010, MNRAS, 402, 145Smith C. H., Aitken D. K., Roche P. F., Wright C. M., 1995, MNRAS, 277,
259Smith N., Foley R. J., Filippenko A. V., 2008, ApJ, 680, 568Snijders M. A. J., Batt T. J., Roche P. F., Seaton M. J., Morton D. C., Spoel-
stra T. A. T., Blades J. C., 1987, MNRAS, 228, 329Sokoloski J. L., Rupen M. P., Mioduszewski A. J., 2008, ApJ, 685, L137Starrfield S., Truran J. W., Wiescher M. C., Sparks W. M., 1998, MNRAS,
296, 502Todini P., Ferrara A., 2001, MNRAS, 325, 726Tomida K., Tomisaka K., Matsumoto T., Hori Y., Okuzumi S., Machida
M. N., Saigo K., 2013, ApJ, 763, 6Tomida K., Okuzumi S., Machida M. N., 2015, ApJ, 801, 117Toraskar J., Mac Low M.-M., Shara M. M., Zurek D. R., 2013, ApJ, 768,
48
MNRAS 000, 1–?? (2016)

16 A. Derdzinski
Vishniac E. T., 1983, ApJ, 274, 152Vlasov A., Vurm I., Metzger B. D., 2016, MNRAS, 463, 394Walter F. M., Battisti A., Towers S. E., Bond H. E., Stringfellow G. S., 2012,
PASP, 124, 1057Waters L. B. F. M., 2004, in Witt A. N., Clayton G. C., Draine B. T., eds,
Astronomical Society of the Pacific Conference Series Vol. 309, Astro-physics of Dust. p. 229
Weston J. H. S., et al., 2015, preprint, (arXiv:1505.05879)Williams R. E., 1992, ApJ, 392, 99Williams R., Mason E., 2010, Ap&SS, 327, 207Wolf W. M., Bildsten L., Brooks J., Paxton B., 2013, ApJ, 777, 136
MNRAS 000, 1–?? (2016)