radiation protection around high-intensity laser
TRANSCRIPT

SLAC-PUB- 17324
Radiation Protection around High-Intensity Laser Interactions with Solid Targets
Taiee Ted Liang1*, Johannes M. Bauer1, James C. Liu1, Sayed H. Rokni1
1SLAC National Accelerator Laboratory, Menlo Park, CA 94025
*Corresponding author: [email protected]
Abstract
Interaction of a high-intensity optical laser with a solid target can generate an ionizing
radiation hazard in the form of high-energy ‘hot’ electrons and bremsstrahlung, resulting from hot
electrons interacting with the target itself and the surrounding target chamber. Previous studies
have characterized the bremsstrahlung dose yields generated by such interactions for lasers in the
range of 1017 to 1022 W cm-2 using particle-in-cell code EPOCH and Monte Carlo code FLUKA.
In this paper, electron measurements based on a depth-dose approach are presented for two laser
intensities, which indicate a Maxwellian distribution is more suitable for estimating the hot
electrons’ energy distribution. Also, transmission factors of the resulting bremsstrahlung for
common shielding materials are calculated with FLUKA, and shielding tenth value layer
thicknesses are also derived. In combination with the bremsstrahlung dose yield, the tenth value
layers provide radiation protection programs the means to evaluate radiation hazards and design
shielding for high-intensity laser facilities.
This material is based upon work supported by the U.S. Department of Energy, Office of Science, under Contract No. DE-AC02-76SF00515.

SLAC-PUB- 17324
2
Introduction
The current count of high-intensity laser facilities worldwide numbers upwards of 69 with 19 based
in North America, 32 in Europe, and 18 in Asia (ICUIL; https://www.icuil.org/activities/laser-
labs.html). Experimenters at these facilities focus multi-terawatt and petawatt optical laser beams
to micrometer spot sizes to achieve laser intensities in excess of 1017 W cm-2. One such laser
facility is the Matter in Extreme Conditions (MEC) instrument at SLAC National Accelerator
Laboratory (Nagler et al. 2015). These high-intensity lasers can be focused onto solid foils to study
warm dense matter physics (Fletcher et al. 2015), pressure-driven shock waves in solid materials
(Kraus et al. 2016, Wehrenberg et al. 2017), and conditions inside giant planets like Jupiter and
Neptune (Davis et al. 2016, Kraus et al. 2017). With gas jets or cells for targets, high-intensity
lasers can even be used to produce energetic beams of protons (Gauthier et al. 2016) and electrons
and betatron X-rays (Albert et al. 2013). In the coming years, many high-intensity laser facilities
worldwide, including the one at MEC, are planning upgrades to achieve even higher laser
intensities and pulse repetition rates, which will permit scientists to achieve higher pressure and
temperature conditions for their experiments.
These laser facilities present a unique health physics challenge: ionizing radiation
generated from optical laser light. The interaction of a high-intensity optical laser with a solid foil
target in vacuum creates a plasma on the surface of the target, and subsequent interactions between
the laser pulse and the plasma can accelerate plasma electrons to tens and even hundreds of MeV
in energy (Tajima and Dawson 1979, Wilks and Kruer 1997). The electrons in this laser-plasma
source term are commonly referred to as ‘hot’ electrons and their interactions with both the solid
foil and the target chamber wall will generate bremsstrahlung photons (Guo et al. 2001, Chen et
SLAC-PUB- 17324
3
al. 2004). The bremsstrahlung dose generated by a high-intensity optical laser can present an
ionizing radiation hazard to personnel in the vicinity.
Over the years, radiation dose measurements from laser facilities such as at the Laboratory
for the Use of Intense Lasers (Borne et al. 2002), Rutherford Appleton Laboratory’s Vulcan facility
(Clarke et al. 2006), Lawrence Livermore National Laboratory’s Titan facility (Bauer et al. 2011),
and SLAC National Accelerator Laboratory’s MEC facility (Liang et al. 2017a) have reported
radiation dose levels that require radiation shielding to mitigate direct exposure to personnel at
these laser facilities. In addition, the radiation dose scales with laser intensity and is also
proportional to the number of laser shots taken on target. From a health physics perspective,
understanding the radiation source terms and designing adequate radiation shielding for high-
intensity laser facilities such as the aforementioned ones are crucial, especially in light of future
upgrades for pre-existing laser facilities and plans for new ones worldwide.
In this paper, the hot electron source term and subsequent bremsstrahlung dose yield from
laser interactions with solid targets are reviewed. In addition, an analysis of electron measurements
based on a depth-dose approach is presented for two laser intensities. Transmission factors of the
resulting bremsstrahlung for common shielding materials are calculated with Monte Carlo code
FLUKA (Ferrari et al. 2005, Böhlen et al. 2014), and shielding tenth value layer (TVL) thicknesses
are then derived for laser intensities in the range of 1017 to 1022 W cm-2. Therefore, health physicists
may use the bremsstrahlung dose yield and the calculated TVL thicknesses to design radiation
shielding for high-intensity laser facilities.
Hot Electron Source Term
A previous study at SLAC National Accelerator Laboratory (SLAC) characterized the hot
electron source term for laser interactions with solid targets for the purpose of radiation protection

SLAC-PUB- 17324
4
(Liang et al. 2017b). The study used the particle-in-cell (PIC) code EPOCH (Arber et al. 2015) to
characterize the energy distribution, angular distribution, and laser-to-electron conversion
efficiency of hot electrons. In addition, a bremsstrahlung dose yield parameter was defined as the
ambient dose equivalent of bremsstrahlung photons from hot electrons and normalized to the laser
pulse energy delivered onto the solid target for laser intensities between 1017 and 1022 W cm-2. In
this way, the bremsstrahlung dose generated from a high-intensity laser-solid experiment could be
estimated from laser-optics parameters and the number of laser shots during the experiment.
The key parts of the hot electron source term for the purpose of radiation protection are
summarized in this section. The hot electron energy spectrum has been found to fit the Maxwellian
distribution given as,
𝑓𝑓(𝐸𝐸) ∼ 𝐸𝐸1/2 exp �− 𝐸𝐸𝑇𝑇ℎ�, (1)
where E is the electron energy and Th is the hot electron temperature that characterizes the ‘slope’
of the distribution. Fig. 1 shows an example of the hot electron energy distribution calculated using
EPOCH for a laser intensity of 1020 W cm-2, where Th has a fitted value of 2.1 MeV.
Other studies have used the relativistic Maxwellian distribution in Equation 2 below to
approximate the hot electron source term.
𝑓𝑓(𝐸𝐸) ∼ 𝐸𝐸2 exp �− 𝐸𝐸𝑇𝑇ℎ�. (2)
Both the Maxwellian (Equation 1) and relativistic Maxwellian (Equation 2) have been used to
model the hot electron source (Wilks and Kruer 1997, Ledingham et al. 2000, Borne et al 2002).
For example, the radiation protection paper by Hayashi et al. (2006) utilized the relativistic
Maxwellian distribution for the hot electron source for estimating radiation doses generated by
high-power lasers (Hayashi et al. 2006). However, this method using a relativistic Maxwellian has
been found to be overly conservative and can overestimate the measured bremsstrahlung dose

SLAC-PUB- 17324
5
generated by hot electrons by up to two orders of magnitude for laser intensities greater than 1019
W cm-2 (Liang et al. 2017a).
For a laser wavelength of 0.8 μm, the hot electron temperature Th in MeV scales with laser
intensity I in W cm-2 as,
𝑇𝑇ℎ = 1.05 × 10⁻¹⁰ 𝐼𝐼0.514. (3)
In Fig. 2, this Th scaling is compared with results based on PIC code from studies by Wilks (Wilks
and Kruer 1997) and Kluge (Kluge et al. 2011).
The angular distribution of the hot electron emission generated from a high-intensity laser
was analyzed using EPOCH and was approximated with a simple Gaussian distribution as,
𝑓𝑓(𝜃𝜃) ∼ exp �− 𝜃𝜃2
2𝜎𝜎2�, (4)
where θ is the polar angle of the hot electron emission and with a standard deviation σ of 45o. This
assumption for the source term results in a more forward-peaked hot electron emission. Other
studies (Moore et al. 1995, Yang et al. 2017) have also simply modeled the hot electrons’ emission
angles as a function of their energy using the relativistic mass factor γ of the hot electron as,
𝜃𝜃 = tan−1 � 2𝛾𝛾−1
. (5)
In addition, the ratio of hot electrons emitted in the laser’s forward direction versus backward
direction (or downstream versus upstream from the laser’s target) must also be considered. This
ratio was calculated using EPOCH to scale with laser intensity as,
𝑟𝑟(𝐼𝐼) = 2.8 × 10⁻⁹ 𝐼𝐼0.46, (6)
where I is the laser intensity in units of W cm-2. At higher laser intensities, the hot electron emission
and the subsequent bremsstrahlung dose generated will be much more forward-peaked. For
radiation protection, more radiation shielding would be needed in the laser’s forward direction
compared to the 90o directions.

SLAC-PUB- 17324
6
The fraction of the laser pulse’s energy converted into hot electrons’ energy is the laser-to-
electron conversion efficiency η. Fig. 3 plots the values of η from EPOCH calculations and
indicates the conversion efficiency scales with laser intensity from about 10% at 1017 W cm-2 up
to a maximum of 60% starting at 1021 W cm-2.
Electron Depth-Dose Measurements
Electron depth-dose measurements were performed with a simple ‘spectrometer’ design
during two high-intensity laser-solid experiment at SLAC’s MEC laser facility (Liang et al.
2017a). One experiment was performed at a laser intensity of 1019 W cm-2 (I1), which used metal
foils of 100-μm-thick pure Cu (I1-Run1) and 15-μm-thick pure Ni (I1-Run2). Another experiment
at 7.1×10¹⁹ W cm-2 (I2) was performed parasitically to another experiment. Therefore, there was
no control over when the target chamber was opened, when spectrometers (and dosimeters) inside
could be replaced, or what target types were used. I2-Run3 used a 15-μm-thick pure Ni foil, and
I2-Run4 used an assortment of foils: 10 μm Al, 5 μm Au, 5 μm Cu (all pure metal), and 4 μm CH3
plastic.
Spectrometers were deployed inside the target vacuum chamber at various angles relative
to the laser beam direction and at a distance of 30 cm from the laser’s target. They measured dose
from both electrons and bremsstrahlung photons inside the target chamber, but the dose deposited
in the spectrometer is dominated by the electrons that stream from the laser-solid interaction
location without being attenuated by the thin micrometer foils. Fig. 4 shows the layout inside the
MEC target chamber from the I1 experiment at 1019 W cm-2. The approximate locations of the I1
spectrometers are indicated with a ‘star’ symbol. Care was taken to ensure the front face of the
spectrometers had direct line-of-sight to the target foils at the center of the chamber.

SLAC-PUB- 17324
7
The electron spectrometer’s design in Fig. 5 consisted of alternating layers of Landauer
nanoDot dosimeters (2-mm-thick) and Plexiglas (3-mm-thick, 1.18 g cm-3). The nanoDot’s
geometry was simulated in FLUKA as a 0.5-mm-thick aluminum oxide (Al2O3, 3.95 g cm-3)
‘wafer’ with radius of 2.5 mm that is contained within a plastic polyethylene (C2H4, 0.93 g cm-3)
pouch with wall thickness of 0.75 mm (total wall thickness of 1.5 mm). The thickness of the air
gaps between the Al2O3 and the plastic walls of the nanoDot were considered negligibly thin and
not included in FLUKA simulations. The Plexiglas layers will attenuate the incident radiation from
high-intensity laser-solid interactions. Fig. 6 plots the results from electron depth-dose
measurements taken during the I1 (Run1 and Run2) and I2 (Run3 and Run4) experiments for
spectrometers deployed at different angles relative to the laser direction. The measured absorbed
dose is normalized to the number of laser shots taken on target during each Run (mGy per shot)
and is then plotted as a function of depth of attenuating material (g cm-2). The uncertainty in the
measured doses is less than 10% and is not plotted in Fig. 6 to avoid visual clutter.
As expected, the (absorbed) dose per shot is higher from I2 compared to I1 because a higher
laser intensity is both correlated with an increase in the energy of generated hot electrons (Equation
3) and an increase in the laser-to-electron conversion efficiency (Fig. 3). For I1 the dose per shot
measured by the first dosimeter (0 g cm-2) is about 10-15 mGy per shot and decreases by about
three orders of magnitude to 0.01-0.03 mGy per shot at the last dosimeter (about 1.8 g cm-2). For
I2 the decrease is two orders of magnitude starting from 20-30 to 0.2-0.3 mGy per shot. This
indicates that the energy of the hot electrons for I1 is lower (and more readily attenuated) than I2.
The spread of data for all I1 Runs is within about a factor of 2, which shows the systematic
uncertainty of the measured absorbed dose to different target types and detector angles. The factor
SLAC-PUB- 17324
8
of 2 spread in the I1 dose per shot data for different detector angles also suggests that the angular
distribution of hot electron emission is semi-isotropic for I1 (1019 W cm-2).
The depth-dose response of the electron spectrometers was benchmarked with FLUKA
simulations. PRECISIO was used as the defaults for the simulations. The hot electron source was
generated by sampling primary electrons’ energies according to a Maxwellian distribution
(Equation 1) with FLUKA’s custom SOURCE subroutine. The hot electron temperature Th that
characterizes the slope of the energy distribution was calculated from Equation 3 based on the
experiments’ peak laser intensities. The angular distribution of the electron primaries were
sampled according to a Gaussian distribution (Equation 4) with σ of 45o also with SOURCE.
Transport and production of electrons and photons were all set at 1 keV threshold. To match
experimental conditions in the FLUKA simulation, primary electrons first interacted with a target
matching the ones used during the I1 and I2 experiments. In addition, the simulated spectrometer
was located with the same angle as from the experiment inside a simplified cylindrical model of
the experimental chamber: 1 m radius, 1.2 m height, 2.54-cm-thick Al walls.
Additional FLUKA simulations were also performed where the hot electron source term
was instead sampled according to a relativistic Maxwellian (Equation 2). For health physics
applications, it is necessary to identify the more appropriate energy distribution to model the hot
electron source term because this directly affects the magnitude of the estimated radiation hazard
and also the design of the radiation shielding needed to mitigate said hazard.
The FLUKA simulations scored the energy (absorbed dose) deposited in the layers of the
spectrometer, and depth-dose curves were generated after normalizing the FLUKA results to the
same metric as from Fig. 6: dose per shot (mGy per shot) as a function of depth of attenuating
material (g cm-2). Fig. 7 plots the FLUKA-calculated depth-dose response for the I1 experiment at

SLAC-PUB- 17324
9
1019 W cm-2, which used 100-μm-thick Cu (Run1) and 15-μm-thick Ni (Run2) as targets. The
‘dashed’ curves indicate the depth-dose response was calculated from a Maxwellian (Max.)
distribution for the hot electron source term, while the ‘solid’ curves indicate the response was
from a relativistic Maxwellian (rel. Max.) source term. The uncertainty in the FLUKA-calculated
dose results is less than 1% for the first dosimeter and increases with each subsequent dosimeter
in the spectrometer stack up to about 15% for the last dosimeter. The spread within the data in Fig.
7 (from either a Maxwellian or relativistic Maxwellian source term) is within about a factor of 2,
which is similar to the systematic uncertainty observed from the measured data (Fig. 6) for
different detector angles and target types. In comparison, the statistical uncertainty in the Th from
Equation 3 used in the FLUKA simulations for either a Maxwellian or relativistic Maxwellian is
less than 10% and would not cause the depth-dose response curves to shift more than a factor of
2.
As observed in Fig. 7, the FLUKA-calculated dose per shot for I1 is higher at increasing
depth of attenuating material from primary electrons with a relativistic Maxwellian energy
distribution than a Maxwellian because the spectrum is harder (and more penetrating through
material), and the average energy is also higher: 3Th vs. 1.5Th, respectively. Also because of this,
the decrease of the dose per shot from a Maxwellian source term is more rapid (steeper ‘slope’ of
the response curve) for the softer energy spectrum. For both electron source terms (Max. and rel.
Max.), the response curve for the spectrometer located at +36o is higher than the other angles by
at most a factor of 2, which corresponds to the forward-to-backward emission ratio of hot electrons
(Equation 6).
Comparing the measured results (Fig. 6) against the FLUKA-calculated results (Fig. 7) for
I1 (1019 W cm-2), the depth-dose response curves generated from a Maxwellian energy distribution

SLAC-PUB- 17324
10
fit the measurement data better than from a relativistic Maxwellian. To further demonstrate this,
the measured dose per shot from each data point (and from each Run) was compared versus its
corresponding simulated dose per shot. This ‘ratio’ is plotted in Fig. 8 for FLUKA dose per shot
from a Maxwellian source term and in Fig. 9 for dose per shot from a relativistic Maxwellian
source term. A similar analysis between measured and simulated dose was also performed for the
I2 experiment (7.1×10¹⁹ W cm-2), and the results have also been included in Figs. 8 and 9. The ‘line
of equality’ indicating where the ratio between measured versus FLUKA-calculated dose is a value
of 1 is plotted as a visual guide. Data from both Figs. 8 and 9 were also curve fitted to a power
function. Although the fit is not ideal for Fig. 9 (coefficient of determination R2 = 0.806), the fitted
curves f(x) demonstrate visually that the measured data is better predicted with calculations using
a Maxwellian source term as seen in in Fig. 8 (R2 = 0.936). Also the ‘slope’ of the fitted power
functions has a value of 1.09 for a Maxwellian source term and 0.686 for a relativistic Maxwellian
source. Comparing these values against the line of equality (slope of 1), this further supports that
a Maxwellian source term is more appropriate for predicting the measured data.
Comparison between Figs. 8 and 9 showed that measured data has a more 1:1 ratio with
the simulated results from FLUKA and better predicted using a Maxwellian source term (Fig. 8).
This comparison between source terms can be further examined by calculating the mean squared
errors (MSE) between the measured data and the simulated results for the two source terms, which
is given in Equation 7 as,
𝑀𝑀𝑀𝑀𝐸𝐸 =1𝑛𝑛
�(𝑀𝑀𝑖𝑖 − 𝑀𝑀𝑖𝑖)2𝑛𝑛
𝑖𝑖=1
. (7)
This method provides a quantitative index for evaluating of the quality of an estimator (the type
of source term in this case). Note that it is necessary to take the logarithm of the data and results
because their values span a range of 4 orders of magnitude. The MSE between all measured data

SLAC-PUB- 17324
11
and simulated results using a Maxwellian source term (Fig. 8) is 0.183 and using a relativistic
Maxwellian source term (Fig. 9) is 0.428. The value of the MSE is smaller for a Maxwellian
source, which again supports the use of a Maxwellian distribution to model the hot electron source
term and to predict the measured data.
The depth-dose response curves calculated from a Maxwellian source term describe the I1
and I2 experiments’ measurement data better than the curves calculated from a relativistic
Maxwellian source term. From a health physics perspective, it is an improvement and a more
accurate representation to model the energies of the hot electron source as a Maxwellian
distribution. Otherwise, both estimation of secondary bremsstrahlung dose generated from hot
electrons and design of shielding with a relativistic Maxwellian source term would be overly
conservative.
Bremsstrahlung Dose Yield
FLUKA can be utilized to calculate the bremsstrahlung dose yield generated from the hot
electron source (primary electrons) described previously using FLUKA’s custom SOURCE
subroutine. The energies of primary electrons were sampled according to a Maxwellian
distribution (Equation 1) with exponential slope described by Th (Equation 3). The angular
distribution of primary electrons were sampled according to a Gaussian distribution (Equation 4)
with σ of 45o and forward-to-backward emission ratio (Equation 6). The resulting bremsstrahlung
dose calculated by FLUKA can be normalized to the laser-to-electron conversion efficiency (Fig.
3). Fig. 10 shows the estimated bremsstrahlung dose yield at 1 meter distance (Liang et al. 2017b)
from a high-intensity laser interaction with a solid target for laser intensities between 1017 and 1022
W cm-2. The dose yield curves in Fig. 10 already account for attenuation by a simple cylindrical
target chamber with uniform 2.54-cm-thick aluminum walls. The dose yield (mSv J-1) parameter

SLAC-PUB- 17324
12
is the ambient dose equivalent (mSv) of bremsstrahlung photons generated from hot electrons and
normalized to the laser pulse energy on target (J).
In reality, target vacuum chambers for high-intensity laser experiments often have a
complex geometry. Fig. 11 visualizes with SimpleGeo (Theis et al. 2006) the full geometry of
MEC’s target vacuum chamber, which has a chamber radius of about 1 meter and wall thicknesses
of about 2.54-cm-thick aluminum. A large number of glass view ports around the chamber give
experimenters access to the vacuum chamber with their instruments.
The hot electron source term can also be paired with a full target chamber geometry in
FLUKA to simulate the bremsstrahlung dose generated from individual high-intensity laser
experiments, especially if laser-optics and laser target parameters are known. For example, the I1
experiment at MEC achieved a peak laser intensity of 1019 W cm-2 with a pulse energy of 0.7 J and
a pulse length of 50 fs. The laser system operated at a 1 Hz repetition rate and delivered high-
intensity laser shots onto 100-µm-thick Cu foils. The associated source term (primary electrons)
was modeled using a Maxwellian energy distribution with a Th of 0.61 MeV, a Gaussian angular
distribution with σ of 45o, a forward-to-backward emission ratio of 1.3, and a laser-to-electron
conversion efficiency of 0.51. Fig. 12 plots the bremsstrahlung dose generated per laser shot
delivered onto the target foil (mSv per shot) as calculated with FLUKA using the hot electron
source term described above. Either the dose yield curves in Fig. 10 or the direct calculation of
bremsstrahlung dose with FLUKA using an experiments’ parameters and geometries may be used
to estimate the dose to personnel from high-intensity laser-solid experiments.
Tenth Value Layers for Bremsstrahlung Photons
High-intensity laser-solid experiments need radiation shielding to mitigate the
bremsstrahlung dose hazard generated by the hot electrons. A systematic study with FLUKA used

SLAC-PUB- 17324
13
the hot electron source term modeled with a Maxwellian energy distribution and with Th derived
from laser intensity to calculate transmission factors of several common shielding materials.
Transport and production of electrons and photons were all set at 1 keV threshold. The tenth value
layer (TVL) thicknesses can then be derived from the transmission curves. In this study, TVL is
the thickness of the material needed to reduce the ambient dose equivalent of the incident radiation
(bremsstrahlung from hot electrons) by a factor of 10. Previous shielding studies for high-intensity
laser facilities have focused primarily on glass, concrete, and lead (Qiu et al. 2006, Yang et al.
2017). While those materials are also included, this study contains TVL thicknesses for other
materials not available elsewhere as a function of laser intensity from 1017 to 1022 W cm-2: Pyrex
glass* (2.23 g cm-3), Portland concrete† (2.3 g cm-3), aluminum (2.7 g cm-3), iron (7.87 g cm-3),
lead (11.34 g cm-3), and tungsten (19.25 g cm-3).
This variety of shielding materials provides health physicists flexibility when designing
radiation shielding for high-intensity laser facilities. For example, as many of these facilities
receive upgrades to their laser power and intensity, the generated ionizing radiation hazard will
also increase (Fig. 10). For pre-existing facilities, it may be impractical both financially and time-
wise to demolish and rebuild the facility housing when the wall shielding is no longer sufficient to
mitigate the increased hazard. Instead, radiation protection programs may choose to deploy local
shielding inside the target vacuum chamber and in close proximity to the laser-solid interaction.
When space is limited, lead (Pb) is a commonly chosen shielding material, but it comes with other
hazards: chemical toxicity, potential for activation by high-energy bremsstrahlung, and out-
gassing that may compromise the vacuum’s integrity. Therefore, a discerning health physicist may
choose tungsten (W) or steel (Fe) for local shielding instead. Earlier, Fig. 4 showed the layout
inside of the target chamber at MEC for the I1 experiment with laser intensity at 1019 W cm-2.

SLAC-PUB- 17324
14
During this experiment, stainless steel plates amounting to a thickness of 12 cm were used as local
shielding in the 0o and 180o directions relative to the laser direction to mitigate the bremsstrahlung
dose to personnel outside the facility.
Shielding calculations with FLUKA utilized a spherical geometry. For a chosen laser
intensity, primary electrons with energies sampled according to a Maxwellian distribution
(Equation 1) and with temperature Th (Equation 3) were emitted isotropically from the center of a
Cu sphere. The Cu sphere ‘target’ served as the electron-to-bremsstrahlung converter, and its
radius was optimized to give the highest bremsstrahlung yield from hot electrons. For example,
the optimum radius of the Cu sphere target was 2.5 mm at 1020 W cm-2. A spherical shell of the
shielding material of interest was located at 10 meters (outer radius) from the source point to
attenuate the generated bremsstrahlung photons. The ambient dose equivalent was scored at the
same radial distance outside the shield without and with shielding to generate transmission factors
for varying shielding thicknesses.
Fig. 13 plots the transmission factors for Portland concrete (CC) as a function of shielding
material thickness for selected laser intensities between 1017 and 1022 W cm-2. The uncertainties
of the estimated transmission factors were at most less than 3%. Increasing thicknesses for the
shielding were selected for increasing laser intensities because the average energy of the hot
electrons (and resulting bremsstrahlung) increases as well. A material’s photon mass attenuation
coefficient decreases with increasing photon energy, which means more material thickness is
needed to achieve the same attenuation factor for higher energy bremsstrahlung by the same factor.
Also in Fig. 13 at higher laser intensities where the energy of hot electrons is also higher,
a buildup factor is observed where the transmission curve experiences a change in slope or a ‘kink’
for 3×10²¹ and 1022 W cm-2 (at 14 and 16 cm, respectively). At these intensities, the hot electron

SLAC-PUB- 17324
15
source has energies in the 10’s of MeV and greater. The TVLs of concrete can be derived from the
transmission curves for concrete for the selected laser intensities by taking the concrete thicknesses
corresponding to a bremsstrahlung transmission factor of 0.1 and 0.01 (Fig. 13). The transmission
of bremsstrahlung dose decreases as more shielding material is added to attenuate the incident
bremsstrahlung. TVL1 corresponds to the material thickness required to reduce the incident
bremsstrahlung dose by a factor of 10. TVL2 is the thickness needed to reduce the dose by an
additional factor of 10. As observed in Fig. 13, TVL2 is also the equilibrium tenth value layer
(TVLe), which is the thickness for each subsequent TVL after TVL1 where the directional and
spectral distributions of the radiation field in the material are practically independent of thickness.
Fig. 14 provides the transmission curves for Pb, which is a higher Z and higher density
material than Portland concrete, and the thickness of lead required to achieve a transmission factor
of 0.1 and 0.01 is much less than for concrete at any selected laser intensity. At lower laser
intensities especially around 3×10¹⁸ W cm-2 and below, the transmission factor curves for Pb has
a dramatic first drop due to strong filtering of lower energies by Pb.
The values of Portland concrete TVL1 and TVLe for bremsstrahlung photons generated by
a hot electron source are plotted in Fig. 15. TVL1 is significantly greater than TVLe at laser
intensities greater than 3×10²¹ W cm-2 due to buildup. At these higher laser intensities, the
Maxwellian energy distribution of the hot electron source is characterized by a Th of 21 MeV
(Equation 3) and has a high average energy of about 32 MeV. The subsequently generated
bremsstrahlung is also high energy and causes buildup in the shielding material. Therefore,
additional concrete shielding is initially required for TVL1 to reduce the incident bremsstrahlung
dose by a factor of 10.

SLAC-PUB- 17324
16
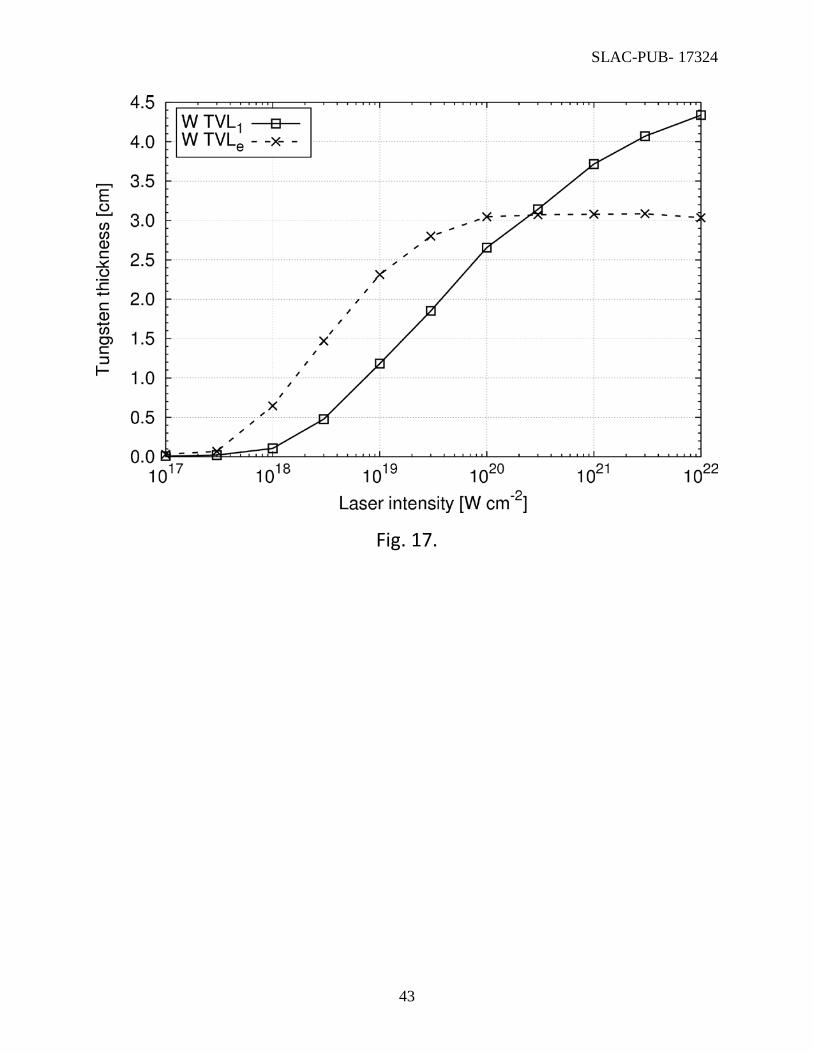
TVL1 and TVLe for lead and tungsten are similarly plotted in Figs. 16 and 17, respectively.
The effect of buildup is more pronounced for Pb and W (higher Z material) than for concrete, and
TVL1 is again greater than TVLe at laser intensities greater than 1020 W cm-2. At intensities below
the TVL1 and TVLe crossover, TVL1 is lower than TVLe due to strong filtering of the incident
bremsstrahlung’s lower energy components by Pb and W. This effect between TVL1 and TVLe
was also observed for Pb TVLs by Yang et al. (2017). TVLe for Pb and W begin to plateau starting
at about 1020 W cm-2, which corresponds to the high-energy limit or ‘Compton minimum’ of the
high energy photons.
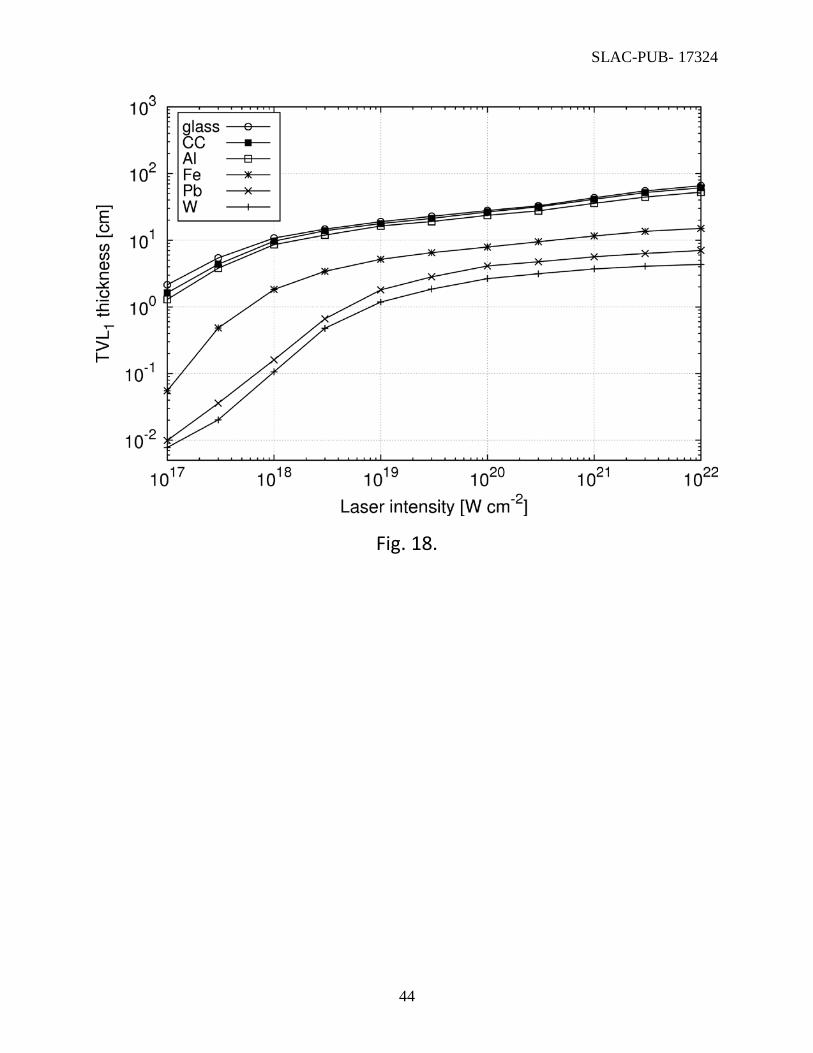
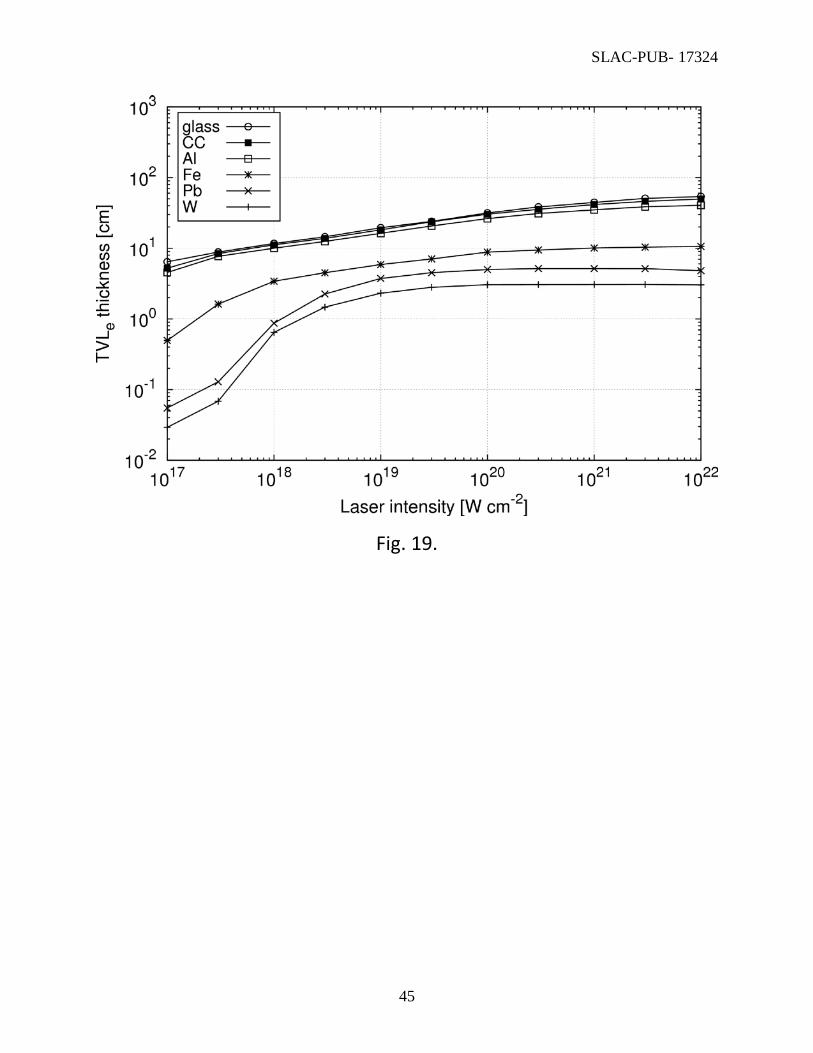
Figs. 18 and 19 summarize the values of TVL1 and TVLe for Pyrex glass, Portland concrete,
Al, Fe, Pb, and W as a function of laser intensity between 1017 and 1022 W cm-2. As expected,
materials with higher Z and density such as Pb and W are most effective for shielding photons and
require less material to attenuate the incident bremsstrahlung dose compared with the other
materials at a given laser intensity. Glass, concrete, and Al have very similar values of TVL due
to having similar densities and also similar effective Z. The overall bremsstrahlung energy (and
hot electron temperature) increases as the laser intensity increases (Fig. 2), and the opposite is also
true. For laser intensities below 1018 W cm-2 where the hot electron temperature is in the tens of
keV, there is a rapid drop in the TVL because photon mass attenuation coefficients are high due
to the effect of high photoelectric cross sections at those energies.
When designing radiation shielding using Figs. 18 and 19, the thickness of TVL1 can be
larger than TVLe at high laser intensities due to buildup, so radiation shielding for a high-intensity
laser’s hot electron source that requires multiple TVLs should use the TVL1 thickness for the first
TVL and then TVLe thickness for each subsequent TVL.
Conclusion
SLAC-PUB- 17324
17
In this paper, the hot electron source term and resulting bremsstrahlung dose yield for high-
intensity laser interactions with solid targets were summarized. Analysis of electron depth-dose
measurements from two experiments at 1019 (I1) and 7.1×10¹⁹ W cm-2 (I2) demonstrated that a
Maxwellian energy distribution is a more appropriate model for the hot electron source term than
a relativistic Maxwellian. FLUKA simulations with a hot electron source term with energy
sampled according to a Maxwellian distribution were systematically conducted, and the
transmission factors of common shielding materials (Pyrex glass, Portland concrete, Al, Fe, Pb,
and W) were obtained for the ambient dose equivalent of bremsstrahlung photons generated by
hot electrons as a function of laser intensity between 1017 and 1022 W cm-2. The tenth value layers
TVL1 and TVLe were derived from these transmission curves for each of the materials. In
combination with the hot electron source term and bremsstrahlung dose yield estimations, health
physicists will be able to utilize these TVL thicknesses to design radiation shielding for mitigation
of bremsstrahlung dose at high-intensity laser facilities.
Acknowledgements
The authors wish to thank R. Clarke of Rutherford Appleton Laboratory for lending the
electron spectrometers used in the depth-dose measurements.
This material is based upon work supported by the U.S. Department of Energy, Office of
Science, Office of Basic Energy Sciences, under Contract No. DE-AC02-76SF00515.

SLAC-PUB- 17324
18
References
• Albert F, Pollock BB, Shaw JL, Marsh KA, Ralph JE, Chen YH, Alessi D, Pak A,
Clayton CE, Glenzer SH, Joshi C. Angular Dependence of Betatron X-Ray Spectra from
a Laser-Wakefield Accelerator. Physical Review Letters 111:235004; 2013.
DOI:10.1103/PhysRevLett.111.235004
• Arber TD, Bennett K, Brady CS, Lawrence-Douglas A, Ramsay MG, Sircombe NJ,
Gillies P, Evans RG, Schmitz H, Bell AR. Contemporary particle-in-cell approach to
laser-plasma modelling. Plasma Physics and Controlled Fusion 57:113001; 2015.
DOI:10.1088/0741-3335/57/11/113001
• Bauer J, Liu JC, Prinz AA, Tran H, Xia Z. High Intensity Laser Induced Radiation
Measurements at LLNL. SLAC Radiation Physics Note RP-11-11:1-16; 2011.
• Böhlen TT, Cerutti F, Chin MPW, Fassò A, Ferrari A, Ortega PG, Mairani A, Sala PR,
Smirnov G, Vlachoudis V. The FLUKA Code: Developments and Challenges for High
Energy and Medical Applications. Nuclear Data Sheets 120:211-214; 2014.
DOI:10.1016/j.nds.2014.07.049
• Borne F, Delacroix D, Gelé JM, Massé D, Amiranoff F. Radiation Protection for an
Ultra-high Intensity Laser. Radiation Protection Dosimetry 102:61-70; 2002.
DOI:10.1093/oxfordjournals.rpd.a006074
• Chen LM, Forget P, Fourmaux S, Kieffer JC, Krol A, Chamberlain CC, Hou BX, Nees J,
Mourou G. Study of hard x-ray emission from intense femtosecond Ti:sapphire laser-
solid target interactions. Physics of Plasmas 11:4439; 2004. DOI:10.1063/1.1781625
• Clarke RJ, Neely D, Edwards RD, Wright PNM, Ledingham KWD, Heathcote R,
McKenna P, Danson CN, Brummitt PA, Collier JL, Hatton PE, Hawkes SJ, Hernandez-

SLAC-PUB- 17324
19
Gomez C, Holligan P, Hutchinson MHR, Kidd AK, Lester WJ, Neville DR, Norreys PA,
Pepler DA, Winstone TB, Wyatt RWW, Wyborn BE. Radiological characterisation of
photon radiation from ultra-high-intensity laser–plasma and nuclear interactions. Journal
of Radiological Protection 26:277-286; 2006. DOI:10.1088/0952-4746/26/3/002
• Davis P, Döppner T, Rygg JR, Fortmann C, Divol L, Pak A, Fletcher L, Becker A, Holst
B, Sperling P, Redmer R, Desjarlais MP, Celliers P, Collins GW, Landen OL, Falcone
RW, Glenzer SH. X-ray scattering measurements of dissociation-induced metallization of
dynamically compressed deuterium. Nature Communications 7:11189; 2016.
DOI:10.1038/ncomms11189
• Ferrari A, Sala PR, Fassò A, Ranft J. FLUKA: a multi-particle transport code. CERN-
2005-10, INFN/TC_05, SLAC-R-773; 2005.
• Fletcher LB, Lee HJ, Döppner T, Galtier E, Nagler B, Heimann P, Fortmann C, LePape
S, Ma T, Millot M, Pak A, Turnbull D, Chapman DA, Gericke DO, Vorberger J, White
T, Gregori G, Wei M, Barbrel B, Falcone RW, Kao CC, Nuhn H, Welch J, Zastrau U,
Neumayer P, Hastings JB, Glenzer SH. Ultrabright X-ray laser scattering for dynamic
warm dense matter physics. Nature Photonics 9:274-279; 2015.
DOI:10.1038/nphoton.2015.41
• Gauthier M, Kim JB, Curry CB, Aurand B, Gamboa EJ, Göde S, Goyon C, Hazi A, Kerr
S, Pak A, Propp A, Ramakrishna B, Ruby J, Willi O, Williams GJ, Rödel C, Glenzer SH.
High-intensity laser-accelerated ion beam produced from cryogenic micro-jet target.
Review of Scientific Instruments 87:11D827; 2016. DOI:10.1063/1.4961270
• Guo T, Spielmann Ch, Walker BC, Barty CPJ. Generation of hard x rays by ultrafast
terawatt lasers. Review of Scientific Instruments 72:41; 2001. DOI:10.1063/1.1327309
SLAC-PUB- 17324
20
• Hayashi Y, Fukumi A, Matsukado K, Mori M, Kotaki H, Kando M, Chen LM, Daito I,
Kondo S, Kanazawa S, Yamazaki A, Ogura K, Nishiuchi M, Kado M, Sagisaka A,
Nakamura S, Li Z, Orimo S, Homma T, Daido H. Estimation of photon dose generated
by a short pulse high power laser. Radiation Protection Dosimetry 121:99-107; 2006.
DOI:10.1093/rpd/nci383
• International Committee on Ultra-High Intensity Lasers (ICUIL). Intense Laser Labs
World Wide [online]. Available at: https://www.icuil.org/activities/laser-labs.html.
Accessed 8 November 2017.
• Kluge T, Cowan T, Debus A, Schramm U, Zeil K, Bussmann M. Electron Temperature
Scaling in Laser Interaction with Solids. Physical Review Letters 107:205003; 2011.
DOI:10.1103/PhysRevLett.107.205003
• Kraus D, Ravasio A, Gauthier M, Gericke DO, Vorberger J, Frydrych S, Helfrich J,
Fletcher LB, Schaumann G, Nagler B, Barbrel B, Bachmann B, Gamboa EJ, Göde S,
Granados E, Gregori G, Lee HJ, Neumayer P, Schumaker W, Döppner T, Falcone RW,
Glenzer SH, Roth M. Nanosecond formation of diamond and lonsdaleite by shock
compression of graphite. Nature Communications 7:10970; 2016.
DOI:10.1038/ncomms10970
• Kraus D, Vorberger J, Pak A, Hartley NJ, Fletcher LB, Frydrych S, Galtier E, Gamboa
EJ, Gericke DO, Glenzer SH, Granados E, MacDonald MJ, MacKinnon AJ, McBride EE,
Nam I, Neumayer P, Roth M, Saunders AM, Schuster AK, Sun P, van Driel T, Döppner
T, Falcone RW. Formation of diamonds in laser-compressed hydrocarbons at planetary
interior conditions. Nature Astronomy 1:606-611; 2017. DOI:10.1038/s41550-017-0219-
9

SLAC-PUB- 17324
21
• Ledingham KWD, Spencer I, McCanny T, Singhal RP, Santala MIK, Clark E, Watts I,
Beg FN, Zepf M, Krushelnick K, Tatarakis M, Dangor AE, Norreys PA, Allott R, Neely
D, Clark RJ, Machacek AC, Wark JS, Cresswell AJ, Sanderson DCW, Magill J.
Photonuclear Physics when a Multiterawatt Laser Pulse Interacts with Solid Targets.
Physical Review Letters 84:899; 2000. DOI:10.1103/PhysRevLett.84.899
• Liang T, Bauer J, Cimeno M, Ferrari A, Galtier E, Granados E, Lee HJ, Liu J, Nagler B,
Prinz A, Rokni S, Tran H, Woods M. Radiation Dose Measurements for High-Intensity
Laser Interactions with Solid Targets at SLAC. Radiation Protection Dosimetry 172:346-
355; 2017a. DOI: 10.1093/rpd/ncv505
• Liang T, Bauer JM, Liu JC, Rokni SH. Bremsstrahlung Dose Yield for High-Intensity
Short-Pulse Laser-Solid Experiments. Radiation Protection Dosimetry 175:304-312;
2017b. DOI:10.1093/rpd/ncw325
• Moore CI, Knauer JP, Meyerhofer DD. Observation of the Transition from Thomson to
Compton Scattering in Multiphoton Interactions with Low-Energy Electrons. Physical
Review Letters 74:2439-2442; 1995. DOI:10.1103/PhysRevLett.74.2439
• Nagler B, Arnold B, Bouchard G, Boyce RF, Boyce RM, Callen A, Campell M, Curiel R,
Galtier E, Garofoli J, Granados E, Hastings J, Hays G, Heimann P, Lee RW, Milathianaki
D, Plummer L, Schropp A, Wallace A, Welch M, White W, Xing Z, Yin J, Young J,
Zastrau U, Lee HJ. The Matter in Extreme Conditions instrument at the Linac Coherent
Light Source. J Synchrotron Rad 22:520-525; 2015. DOI:10.1107/S16005775150048
• Qiu R, Zhang H, Yang B, Liu JC, Rokni SH, Woods MB, Li JL. Dose estimation and
shielding calculation for X-ray hazard at high intensity laser facilities. Chinese Physics C
38:129001; 2014. DOI:10.1088/1674-1137/38/12/129001

SLAC-PUB- 17324
22
• Tajima T and Dawson JM. Laser electron accelerator. Physical Review Letters 43:267;
1979. DOI:10.1103/PhysRevLett.43.267
• Theis C, Buchegger KH, Brugger M, Forkel-Wirth D, Roesler S, Vincke H. Interactive
three dimensional visualization and creation of geometries for Monte Carlo calculations.
Nuclear Instruments and Methods in Physics Research A 562:827-829; 2006.
DOI:10.1016/j.nima.2006.02.125
• Wehrenberg CE, McGonegle D, Bolme C, Higginbotham A, Lazicki A, Lee HJ, Nagler
B, Park HS, Remington BA, Rudd RE, Sliwa M, Suggit M, Swift D, Tavella F, Zepeda-
Ruiz L, Wark JS. In situ X-ray diffraction measurement of shock-wave-driven twinning
and lattice dynamics. Nature 550:496-499; 2017. DOI:10.1038/nature24061
• Wilks SC and Kruer WL. Absorption of ultrashort, ultra-intense laser light by solids and
overdense plasmas. IEEE Journal of Quantum Electronics 33:1954-1968; 1997.
DOI:10.1109/3.641310
• Yang B, Qiu R, Li J, Lu W, Wu Z, Li C. Photon dose estimation from ultraintense laser-
solid interactions and shielding calculation with Monte Carlo simulation. Radiation
Physics and Chemistry 131:13-21; 2017. DOI: 10.1016/j.radphyschem.2016.10.010

SLAC-PUB- 17324
23
List of Footnotes
• * 54% O, 37.7% Si, 4% Be, 2.8% Na, 1.2% Al, 0.3% K
• † 52.9% O, 33.7% Si, 4.4% Ca, 3.4% Al, 1.6% Na, 1.4% Fe, 1.3% K, 1% H, 0.2% Mg,
0.1% C

SLAC-PUB- 17324
24
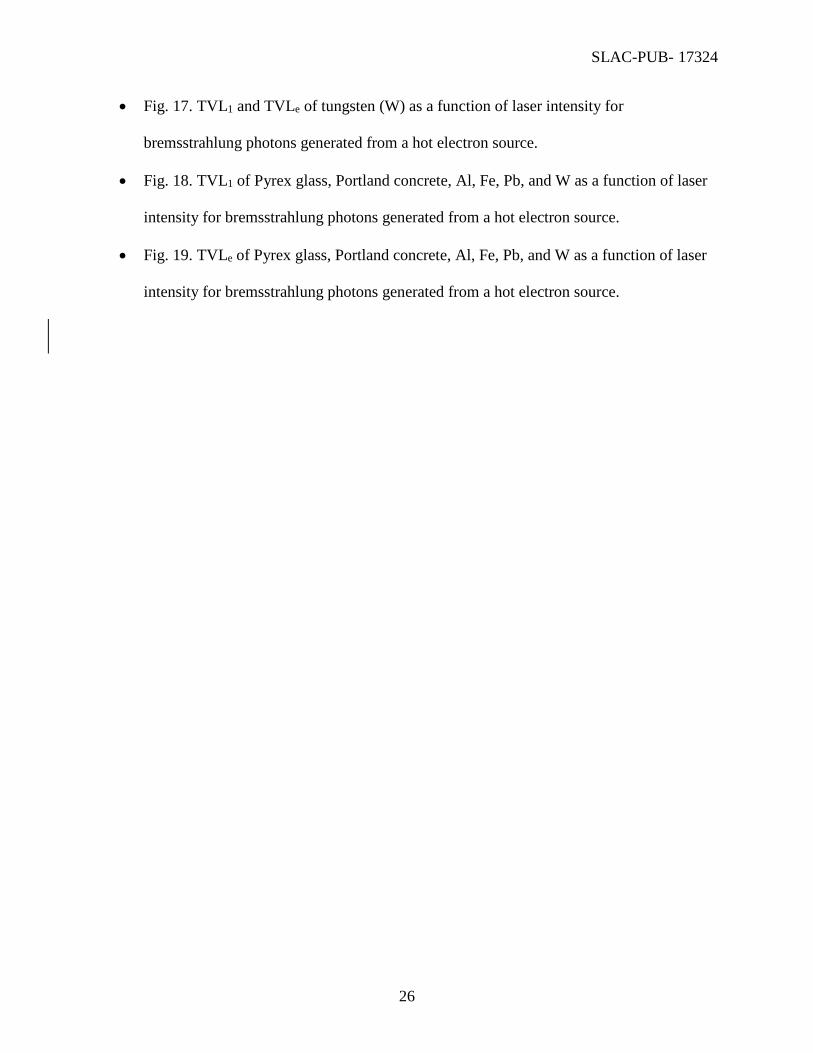
List of Figure Captions
• Fig. 1. Energy distribution of hot electrons calculated from an EPOCH simulation for
1020 W cm-2. A Maxwellian fit gives Th = 2.1 MeV.
• Fig. 2. Hot electron temperature as a function of laser intensity calculated from EPOCH
simulations (Liang et al. 2017b).
• Fig. 3. Laser-to-electron conversion efficiency as a function of laser intensity calculated
from EPOCH simulations (Liang et al. 2017b).
• Fig. 4. Layout inside MEC’s target chamber for the I1 laser-solid experiment at 1019 W
cm-2. The locations of spectrometers deployed inside are indicated with a ‘star’ symbol.
The high-intensity optical laser enters the chamber from the left and interacts with solid
metal foils at the center of the chamber.
• Fig. 5. Electron depth-dose spectrometer consisted of alternating layers of Plexiglas and
Landauer nanoDot dosimeters. Electrons enter the spectrometer from left-to-right, are
attenuated by the Plexiglas, and deposit dose in the dosimeters.
• Fig. 6. Absorbed dose per laser shot (mGy per shot) measured during I1 (Run1 and Run2)
and I2 (Run3 and Run4) experiments at MEC and plotted as a function of depth of
attenuating material (g cm-2).
• Fig. 7. Absorbed dose per laser shot (mGy per shot) calculated from FLUKA simulations
for I1 (Run1 and Run2) experiment using target types and detector angles from the I1
experiment. The ‘dashed’ curves indicate results from a Maxwellian (Max.) distribution
for the hot electron source term, while the ‘solid’ curves indicate results from a
relativistic Maxwellian (rel. Max.) source term

SLAC-PUB- 17324
25
• Fig. 8. Comparison of measured dose per shot from I1 and I2 experiments versus FLUKA-
simulated dose per shot calculated with a Maxwellian (Max.) hot electron source term.
• Fig. 9. Comparison of measured dose per shot from I1 and I2 experiments versus FLUKA-
simulated dose per shot calculated with a relativistic Maxwellian (rel. Max.) hot electron
source term.
• Fig. 10. Estimation of bremsstrahlung dose yield outside a simple 2.54-cm-thick Al target
vacuum chamber at 1 meter distance from laser-solid interaction as a function of laser
intensity from EPOCH and FLUKA calculations (Liang et al. 2017b).
• Fig. 11. Target vacuum chamber located at SLAC’s MEC laser facility, which has a
radius of 1 meter and approximate Al wall thickness of 2.54 cm.
• Fig. 12. Bremsstrahlung photon dose per laser shot (mSv per shot) at the target plane
calculated with FLUKA for the I1 (1019 W cm-2) experiment at MEC. In this simulation,
the primary electrons interacted with a 100-µm-thick Cu foil located at the center of the
target chamber.
• Fig. 13. Concrete transmission factors as a function of concrete thickness for
bremsstrahlung photons generated from a hot electron source and for selected laser
intensities (W cm-2).
• Fig. 14. Lead transmission factors as a function of lead thickness for bremsstrahlung
photons generated from a hot electron source and for selected laser intensities (W cm-2).
• Fig. 15. TVL1 and TVLe of Portland concrete (CC) as a function of laser intensity for
bremsstrahlung photons generated from a hot electron source.
• Fig. 16. TVL1 and TVLe of lead (Pb) as a function of laser intensity for bremsstrahlung
photons generated from a hot electron source.
SLAC-PUB- 17324
26
• Fig. 17. TVL1 and TVLe of tungsten (W) as a function of laser intensity for
bremsstrahlung photons generated from a hot electron source.
• Fig. 18. TVL1 of Pyrex glass, Portland concrete, Al, Fe, Pb, and W as a function of laser
intensity for bremsstrahlung photons generated from a hot electron source.
• Fig. 19. TVLe of Pyrex glass, Portland concrete, Al, Fe, Pb, and W as a function of laser
intensity for bremsstrahlung photons generated from a hot electron source.

SLAC-PUB- 17324
27
Fig. 1.

SLAC-PUB- 17324
28
Fig. 2.

SLAC-PUB- 17324
29
Fig. 3.

SLAC-PUB- 17324
30
Fig. 4.

SLAC-PUB- 17324
31
Fig. 5.

SLAC-PUB- 17324
32
Fig. 6.

SLAC-PUB- 17324
33
Fig. 7.

SLAC-PUB- 17324
34
Fig. 8.

SLAC-PUB- 17324
35
Fig. 9.

SLAC-PUB- 17324
36
Fig. 10.

SLAC-PUB- 17324
37
Fig. 11.

SLAC-PUB- 17324
38
Fig. 12.

SLAC-PUB- 17324
39
Fig. 13.

SLAC-PUB- 17324
40
Fig. 14.

SLAC-PUB- 17324
41
Fig. 15.

SLAC-PUB- 17324
42
Fig. 16.
SLAC-PUB- 17324
43
Fig. 17.
SLAC-PUB- 17324
44
Fig. 18.
SLAC-PUB- 17324
45
Fig. 19.