radarsat-2 for digital elevation model generation...
TRANSCRIPT

RADARSAT-2 for Digital Elevation
Model generation and monitoring of
the Northwest Passage
The scientific or technical validity of this Contract Report is entirely the responsibility of the Contractor
and the contents do not necessarily have the approval or endorsement of Defence R&D Canada.
Defence R&D Canada – Ottawa
Contract Report DRDC Ottawa CR 2013-116
October 2013


RADARSAT-2 for Digital Elevation Model generation and monitoring of the Northwest Passage
Defence R&D Canada – Ottawa
Octo
Contract Scientific Authority
Original signed by Jeff Secker
Jeff Secker
Defence Scientist
Approved by
Original signed by Caroline Wilcox
Caroline Wilcox
Head, Space and ISR Section
Approved for release by
Original signed by Chris McMillan
Chris McMillan
Chair, Document Control Panel
© Her Majesty the Queen in Right of Canada, as represented by the Minister of National Defence, 2013
© Sa Majesté la Reine (en droit du Canada), telle que représentée par le ministre de la Défense nationale, 2013

DRDC Ottawa CR 2013-116 i
Abstract ……..
This report provides a brief technical description of two separate sub-tasks involving exploitation of Synthetic Aperture Radar (SAR) data from RADARSAT-2. The first task consisted of generating Digital Elevation Models (DEMs) using the stereo SAR technique, stereo SAR compatible images from RADARSAT-2, and PCI Geomatics’ OrthoEngine© software. The second task consisted of creating mosaics of the Northwest Passage from 91 adjacent or overlapping RADARSAT-2 ScanSAR Narrow images, again using PCI Geomatics’ OrthoEngine© software. This report discusses the data and software that were used, the resulting DEMs and mosaic images, and the feasibility of producing these products operationally.
Résumé ….....
Ce rapport contient une brève description technique de deux sous-tâches distinctes portant sur l’exploitation des données du radar à synthèse d’ouverture (SAR) de RADARSAT-2. La première tâche visait la génération de modèles altimétriques numériques (MAN) au moyen de la technique SAR stéréo, d’images de RADARSAT-2 compatibles à la technique SAR stéréo et du logiciel OrthoEngine© de PCI Geomatics. La deuxième tâche consistait à créer des mosaïques du passage du Nord-Ouest à partir de 91 images adjacentes ou qui se chevauchent saisies par RADARSAT-2 en mode ScanSAR étroit, ici aussi, au moyen du logiciel OrthoEngine© de PCI Geomatics. Dans ce rapport, on discute des données et des logiciels utilisés, des mosaïques et des MAN obtenus, et de la faisabilité de générer ces produits dans un contexte opérationnel.

ii DRDC Ottawa CR 2013-116
This page intentionally left blank.

DRDC Ottawa CR 2013-116 iii
Executive summary
RADARSAT-2 for Digital Elevation Model generation and monitoring of the Northwest Passage
Garrett Parsons; DRDC Ottawa CR 2013-116; Defence R&D Canada – Ottawa; October 2013.
Introduction or background: This report provides a brief technical description of two separate sub-tasks involving exploitation of Synthetic Aperture Radar (SAR) data from RADARSAT-2. The first task consisted of generating Digital Elevation Models (DEMs) using the stereo SAR technique, stereo SAR compatible images from RADARSAT-2, and PCI Geomatics’ OrthoEngine© software. Four locations were used for the study; the two with large changes in elevation were acquired using Multi-Look Fine mode and the two that were flat were acquired with Ultra-Fine mode. A variety of incidence angle differences between the stereo pairs were acquired, from 2.4 to 15.4 degrees and two ascending-descending stereo pairs were also acquired. The second task consisted of creating mosaics of the Northwest Passage using 91 adjacent or overlapping RADARSAT-2 dual polarization (HH, HV) ScanSAR Narrow images, collected over a four month period in 2009, and using the auto-mosaic tool in PCI Geomatics’ OrthoEngine©
software. Three mosaics were created from the images acquired in July-August, September and October 2009. Complete coverage of the Northwest Passage was not achieved with these images, and many of the images were acquired outside of the Northwest Passage corridor; both of these were due to an error in the tasking request by DRDC Ottawa. The images acquired outside the Northwest Passage were not included in the final mosaics. This report discusses the data and software that were used, the DEMs and mosaic images that were generated, and the feasibility of producing these products operationally.
Results: The generation of DEMs from stereo RADARSAT-2 images worked best in the areas with larger changes in topography and with a larger difference in incidence angles. The DEM for the two flat locations had large regions of failed pixels. Even after reprocessing the DEMs using all possible options in OrthoEngine©, there were large differences between the stereo-derived and the reference DEMs. The Northwest Passage mosaics are very subjective and depend on the ground and sea conditions in the RADARSAT-2 images. The final recommendation for this specific set of images and based on qualitative analysis of the various mosaic options in OrthoEngine© is that the no normalization or colour-balancing of the images are necessary. However, this conclusion depends entirely on the images, and may not be accurate in different locations or at different times of the year.
iv DRDC Ottawa CR 2013-116
Sommaire .....
RADARSAT-2 for Digital Elevation Model generation and monitoring of the Northwest Passage
Garrett Parsons; DRDC Ottawa CR 2013-116; R & D pour la défense Canada – Ottawa; octobre 2013.
Introduction ou contexte : Ce rapport contient une brève description technique de deux sous-tâches distinctes portant sur l’exploitation des données du radar à synthèse d’ouverture (SAR) de RADARSAT-2. La première tâche visait la génération de modèles altimétriques numériques (MAN) au moyen de la technique SAR stéréo, d’images de RADARSAT-2 compatibles à la technique SAR stéréo et du logiciel OrthoEngine© de PCI Geomatics. Quatre endroits ont été utilisés pour cette étude : deux ayant de grandes variations d’élévation, pour lesquels les données ont été saisies en mode fin à multi-visée, et deux endroits plats pour lesquels les données ont été saisies en mode ultrafin. On a saisi un éventail de différences dans l’angle d’incidence entre les paires stéréo, allant de 2,4 à 15,4 degrés, ainsi que deux paires stéréo ascendantes/descendantes. La deuxième tâche consistait à créer des mosaïques du passage du Nord-Ouest à partir de 91 images adjacentes ou qui se chevauchent saisies par RADARSAT-2 en mode ScanSAR étroit, en polarisation double (HH, HV), pendant une période de quatre mois en 2009. Ici aussi, on a utilisé le logiciel OrthoEngine© de PCI Geomatics. Trois mosaïques ont été créées à partir des images acquises entre juillet et octobre 2009. Il n’a pas été possible d’obtenir une couverture complète du passage du Nord-Ouest avec ces images, et un grand nombre d’entre elles ont été saisies à l’extérieur du corridor du passage. Ces deux problèmes ont été causés par une erreur dans la demande de saisie faite par RDDC Ottawa. Les images saisies à l’extérieur du passage du Nord-Ouest n’ont pas été incluses dans les mosaïques finales. Dans ce rapport, on discute des données et des logiciels utilisés, des mosaïques et des MAN obtenus, ainsi que de la faisabilité de générer ces produits dans un contexte opérationnel.
Résultats : La production des MAN à partir des images stéréo de RADARSAT-2 a mieux fonctionné dans les endroits à grandes variations topographiques avec une grande différence dans les angles d’incidence. Les MAN des deux endroits plats avaient de grandes zones de pixels ratés. Même après un nouveau traitement des MAN à l’aide de toutes les options possibles d’OrthoEngine©, il y avait de grandes différences entre les MAN créés à partir des images stéréo et les MAN de référence. Les mosaïques du passage du Nord-Ouest sont très subjectives et elles dépendent des conditions au sol et en mer lors de la saisie des images par RADARSAT-2. La recommandation finale pour cet ensemble particulier d’images, basée sur une analyse qualitative des différentes options de mosaïque offertes par OrthoEngine©, est qu’il n’est pas nécessaire de faire la normalisation ou l’équilibrage des couleurs des images. Cependant, cette conclusion dépend entièrement des images et elle pourrait être erronée à d’autres endroits ou à des moments différents de l’année.

DRDC Ottawa CR 2013-116 v
Table of contents
Abstract …….. ................................................................................................................................. iRésumé …..... ................................................................................................................................... iExecutive summary ........................................................................................................................ iiiSommaire ..... .................................................................................................................................. ivTable of contents ............................................................................................................................. vList of figures ................................................................................................................................. viList of tables ................................................................................................................................. viiiAcknowledgements ........................................................................................................................ ix1 Introduction ............................................................................................................................... 12 DEM from stereo RADARSAT-2 processing .......................................................................... 2
2.1 Review of procedure using OrthoEngine© .................................................................... 22.2 Stereo DEM Processing ................................................................................................. 42.3 DEM Results ................................................................................................................. 7
2.3.1 Baffin Island ........................................................................................................ 72.3.2 Stokes Point ....................................................................................................... 122.3.3 Camp Lejeune .................................................................................................... 142.3.4 Mackenzie Delta ................................................................................................ 17
2.4 Stereo DEM Summary ................................................................................................ 223 RADARSAT-2 Northwest Passage Mosaic ............................................................................ 24
3.1 Data Assessment .......................................................................................................... 243.2 Northwest Passage Mosaic Generation ....................................................................... 31
3.2.1 Mosaic Method using OrthoEngine ................................................................... 313.2.2 Mosaic Options .................................................................................................. 32
3.2.2.1 Normalization Method ............................................................................. 323.2.2.2 Colour Balancing Method ........................................................................ 353.2.2.3 Cut Line Collection Method .................................................................... 37
3.2.3 Mosaic Results ................................................................................................... 383.3 Comments on NWP Mosaics ....................................................................................... 44
4 Discussion ............................................................................................................................... 46References ..... ............................................................................................................................... 47List of symbols/abbreviations/acronyms/initialisms ..................................................................... 49

vi DRDC Ottawa CR 2013-116
List of figures
Figure 1: Reference DEM of Baffin Island (cropped to stereo DEM) ........................................... 8
Figure 2: Stereo DEM from the ascending Baffin Island RADARSAT-2 stereo pair ................... 8
Figure 3: Scatter plot of stereo DEM vs. reference DEM for ascending Baffin Island data set ..... 9
Figure 4: Reference DEM of Baffin Island (cropped to stereo DEM) ......................................... 10
Figure 5: Stereo DEM from the descending Baffin Island RADARSAT-2 stereo pair ............... 11
Figure 6: Scatter plot of stereo DEM vs. reference DEM for descending Baffin Island data set ................................................................................................................................ 11
Figure 7: Reference DEM of Stokes Point (cropped to stereo DEM) .......................................... 13
Figure 8: Stereo DEM from the Stokes Point RADARSAT-2 stereo pair ................................... 13
Figure 9: Scatter plot of stereo DEM vs. reference DEM ............................................................ 14
Figure 10: Reference DEM of Camp Lejeune (cropped to stereo DEM) ..................................... 16
Figure 11: Stereo DEM from the Camp Lejeune RADARSAT-2 stereo pair .............................. 16
Figure 12: Scatter plot of reference and stereo DEMs ................................................................. 17
Figure 13: Stereo DEM from the Mackenzie Delta ascending stereo pair ................................... 20
Figure 14: Stereo DEM from the Mackenzie Delta descending-ascending stereo pair 1 ............. 20
Figure 15: Stereo DEM from the Mackenzie Delta descending-ascending stereo pair 2 ............. 21
Figure 16: Combined Mackenzie Delta stereo DEM using a weighted average .......................... 21
Figure 17: Plot of all NWP data sets with NWP route shown in black ........................................ 26
Figure 18: Plot of image acquisition date vs .scene centre latitude .............................................. 27
Figure 19: Selected NWP images that correspond to the NWP route shown in black ................. 28
Figure 20: Plot of image acquisitions that cover the NWP vs. image scene centre latitude ......... 29
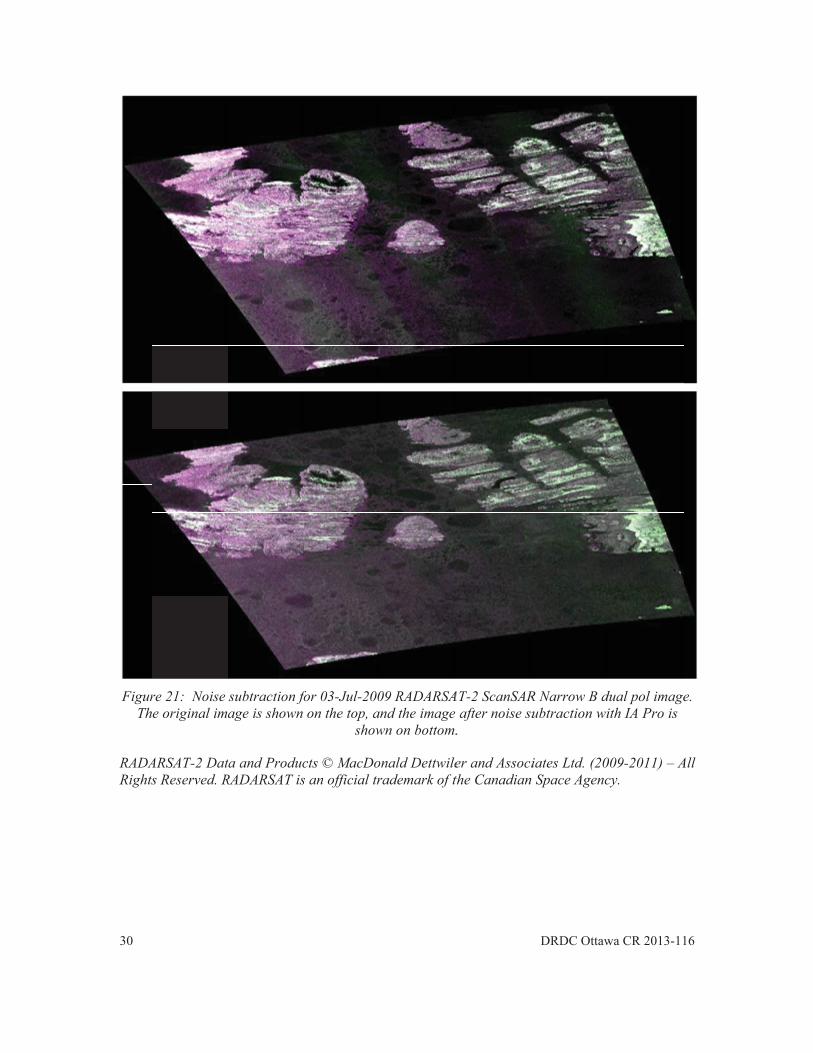
Figure 21: Noise subtraction for 03-Jul-2009 RADARSAT-2 ScanSAR Narrow B dual pol image. The original image is shown on the top, and the image after noise subtraction with IA Pro is shown on bottom. .............................................................. 30
Figure 22: September preview mosaics showing the normalization options, part 1 .................... 33
Figure 23: September preview mosaics showing the normalization options, part 2 .................... 34
Figure 24: September preview mosaics showing the colour balancing options, part 1 ................ 36
Figure 25: September preview mosaics showing the colour balancing options, part 2 ................ 37
Figure 26: September dual pol mosaic with HH as red and HV as cyan. The mosaic is largely red due to the brighter HH channel. ................................................................ 40
Figure 27: July and August Northwest Passage mosaic ............................................................... 41
Figure 28: September Northwest Passage mosaic ........................................................................ 42

DRDC Ottawa CR 2013-116 vii
Figure 29: October Northwest Passage mosaic ............................................................................ 43
Figure 30: RADARSAT-2 ScanSAR Narrow B coverage of the NWP over a 4 day period offers complete coverage. The NWP route is shown in black. .................................. 45
Figure 31: RADARSAT-2 ScanSAR Narrow B coverage of the NWP over a 3 day period still has small gaps in the coverage. The NWP route is shown in black. ................... 45

viii DRDC Ottawa CR 2013-116
List of tables
Table 1: AOIs for stereo DEM processing .................................................................................... 5
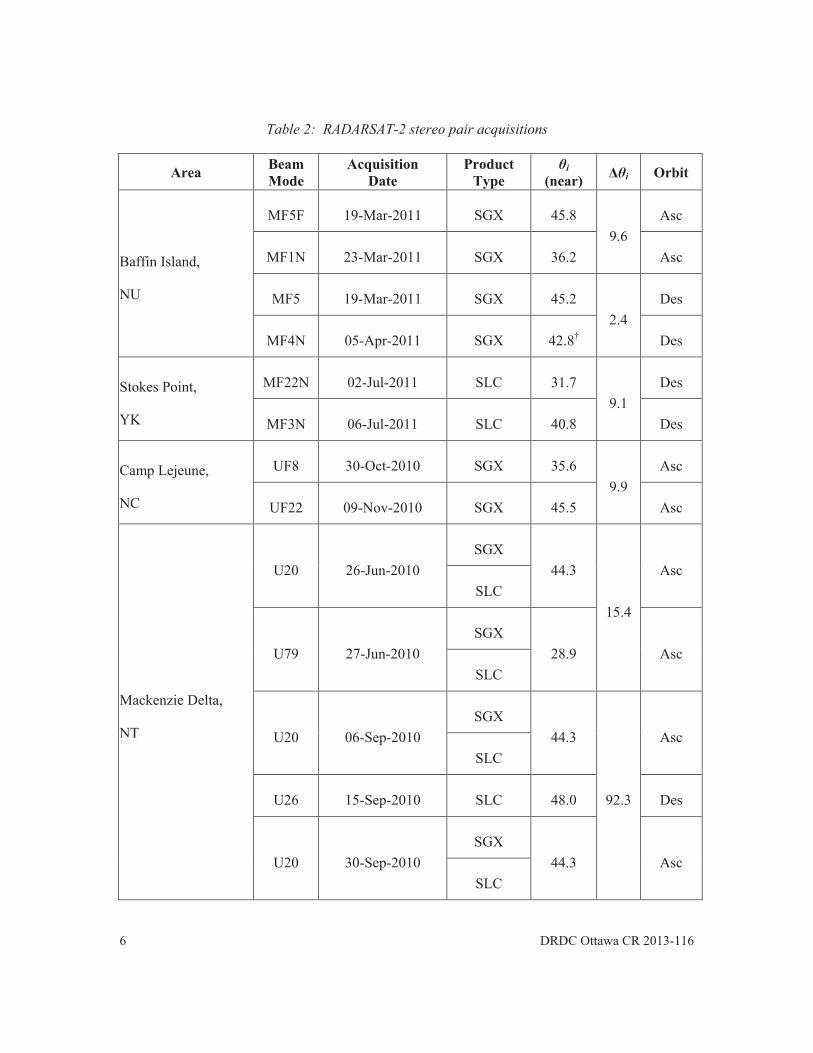
Table 2: RADARSAT-2 stereo pair acquisitions ........................................................................... 6
Table 3: Epipolar image details and stereo processing parameters for ascending Baffin Island data set ........................................................................................................................... 7
Table 4: Statistical comparison between reference and stereo DEM for the ascending Baffin Island data set ................................................................................................................ 9
Table 5: Epipolar image details and stereo processing parameters for descending Baffin Island data set .............................................................................................................. 10
Table 6: Statistical comparison between reference and stereo DEM for the descending Baffin Island data set .............................................................................................................. 12
Table 7: Epipolar image details and stereo processing parameters for Stokes Point data set ...... 12
Table 8: Statistical comparison between reference and stereo DEM for the Stokes Point data set ................................................................................................................................ 14
Table 9: Epipolar image details and stereo processing parameters for Camp Lejeune data set ... 15
Table 10: Statistical comparison between reference and stereo DEM for the Camp Lejeune data set ......................................................................................................................... 17
Table 11: Epipolar image details and stereo processing parameters for ascending Mackenzie Delta data set ............................................................................................................... 18
Table 12: Epipolar image details and stereo processing parameters for descending-ascending Mackenzie Delta stereo pair 1 ..................................................................................... 19
Table 13: Epipolar image details and stereo processing parameters for descending-ascending Mackenzie Delta stereo pair 2 ..................................................................................... 19
Table 14: Summary of reference and stereo DEM comparisons .................................................. 23
Table 15: Final automatic mosaic processing options used for NWP mosaics ............................ 38
Table 16: NWP RADARSAT-2 images used in July-August mosaic .......................................... 39
Table 17: NWP RADARSAT-2 images used in September mosaic ............................................ 39
Table 18: NWP RADARSAT-2 images used in October mosaic ................................................ 40

DRDC Ottawa CR 2013-116 ix
Acknowledgements
The RADARSAT-2 ScanSAR Narrow images used in this report were collected by J. Secker and P.W. Vachon (DRDC Ottawa).
The Image Analyst Pro (IA Pro) system was provided by J. Secker (DRDC Ottawa).
RADARSAT-2 Data and Products © MacDonald Dettwiler and Associates Ltd. (2009-2011) – All Rights Reserved. RADARSAT is an official trademark of the Canadian Space Agency.

x DRDC Ottawa CR 2013-116
This page intentionally left blank.
DRDC Ottawa CR 2013-116 1
1 Introduction
This report is a brief technical description documenting the processing of RADARSAT-2 data sets collected by Defence Research & Development Canada (DRDC) Ottawa for two separate tasks. The first task is covered in Section 2 and involved generating digital elevation models (DEMs) from RADARSAT-2 stereo images collected over four Areas of Interest (AOI) using PCI Geomatica’s OrthoEngine© software. The second task consisted of generating mosaics of Canada’s Northwest Passage (NWP) from a set of 91 RADARSAT-2 ScanSAR Narrow B images using OrthoEngine© and DRDC Ottawa’s Image Analysis Pro (IA Pro) system. Due to the large size of this data set, the task was performed in two stages. The first stage evaluated the large set of RADARSAT-2 images to determine the processing requirements. The second part generated the NWP mosaics using the appropriate processing requirements. The work performed under this task is detailed in Section 3. A brief discussion is provided in Section 4.
2 DRDC Ottawa CR 2013-116
2 DEM from stereo RADARSAT-2 processing
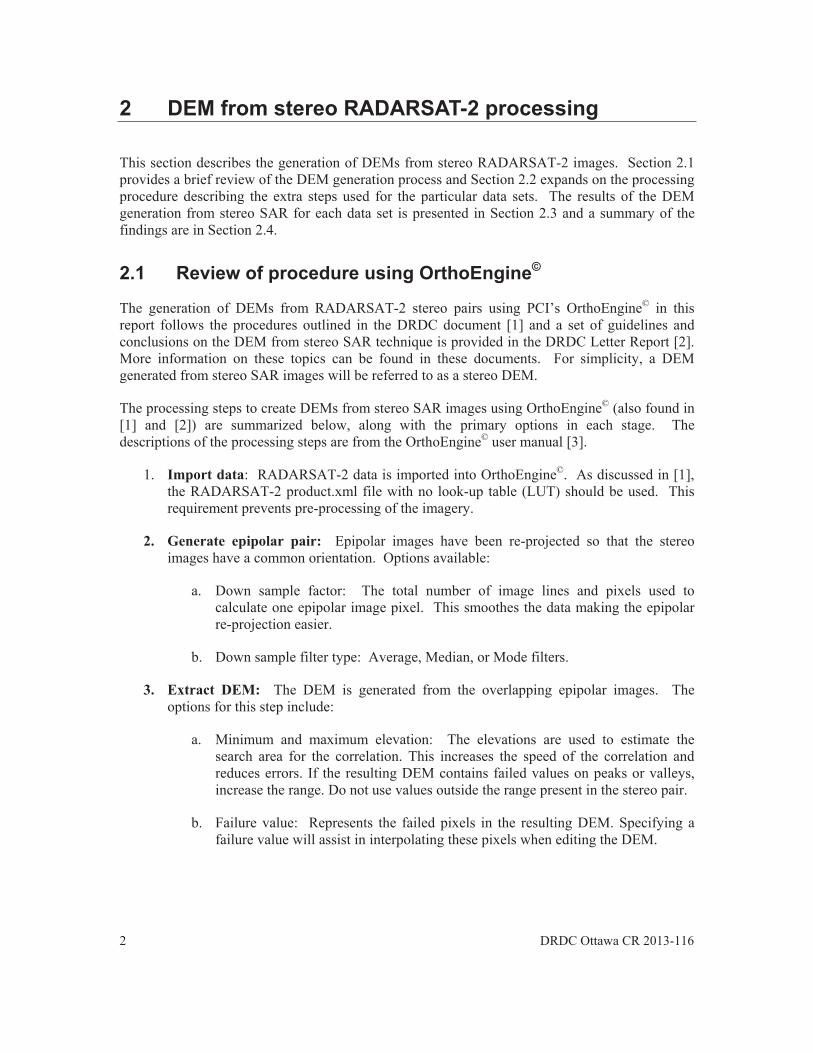
This section describes the generation of DEMs from stereo RADARSAT-2 images. Section 2.1 provides a brief review of the DEM generation process and Section 2.2 expands on the processing procedure describing the extra steps used for the particular data sets. The results of the DEM generation from stereo SAR for each data set is presented in Section 2.3 and a summary of the findings are in Section 2.4.
2.1 Review of procedure using OrthoEngine©
The generation of DEMs from RADARSAT-2 stereo pairs using PCI’s OrthoEngine© in this report follows the procedures outlined in the DRDC document [1] and a set of guidelines and conclusions on the DEM from stereo SAR technique is provided in the DRDC Letter Report [2]. More information on these topics can be found in these documents. For simplicity, a DEM generated from stereo SAR images will be referred to as a stereo DEM.
The processing steps to create DEMs from stereo SAR images using OrthoEngine© (also found in [1] and [2]) are summarized below, along with the primary options in each stage. The descriptions of the processing steps are from the OrthoEngine© user manual [3].
1. Import data: RADARSAT-2 data is imported into OrthoEngine©. As discussed in [1], the RADARSAT-2 product.xml file with no look-up table (LUT) should be used. This requirement prevents pre-processing of the imagery.
2. Generate epipolar pair: Epipolar images have been re-projected so that the stereo images have a common orientation. Options available:
a. Down sample factor: The total number of image lines and pixels used to calculate one epipolar image pixel. This smoothes the data making the epipolar re-projection easier.
b. Down sample filter type: Average, Median, or Mode filters.
3. Extract DEM: The DEM is generated from the overlapping epipolar images. The options for this step include:
a. Minimum and maximum elevation: The elevations are used to estimate the search area for the correlation. This increases the speed of the correlation and reduces errors. If the resulting DEM contains failed values on peaks or valleys, increase the range. Do not use values outside the range present in the stereo pair.
b. Failure value: Represents the failed pixels in the resulting DEM. Specifying a failure value will assist in interpolating these pixels when editing the DEM.
DRDC Ottawa CR 2013-116 3
c. Background value: Represents the 'No Data' pixels in the DEM. The 'No Data' or background identifies the pixels that lie outside the extracted DEM overlap area so they are not mistaken for elevation values.
d. DEM detail: Level of detail in the DEM. Determines the precision of the terrain in the DEM by stopping the correlation process during coarse correlation for low detail and processing to full resolution for high detail.
e. Output DEM channel type: Can select either 16 bit signed or 32 bit real.
f. Pixel sampling interval: The number of pixels and lines used to extract one DEM pixel. It is recommended not to use 1 for SAR due to speckle and the program will only let the user select 1 or 2 for the sampling interval.
4. Geocode DEM: The DEM is re-projected from the epipolar coordinate system to the ground coordinate system with a specified ground resolution.
a. Failure and background values: Failed values in the DEM can be interpolated during geocoding (see 4.b of this list) while background values are not. These were specified during the Extract DEM step.
b. Fill holes: This will interpolate the failed values in the DEM, but not the background values.
The background theory and processing procedures outlined in [1] were clear and easy to follow. Some comments regarding the procedures outlined in the document are outlined below.
When using SLC images make sure to choose channel 3, which is the amplitude channel, during the generate epipolar pair step. Channels 1 and 2 are the real and imaginary components. By default channel 1 is selected.
Regarding the ordering of images in the epipolar pair: In [1] it indicates that the order does not matter, but in the OrthoEngine manual [3] it says that the image with the larger incidence angle should be used as the left image for RADARSAT. It is unclear from the help documentation if this is a concern for RADARSAT-2 or how to order an ascending-descending pair.
The default 16 bit signed output DEM channel type will result in a DEM with integer heights. For DEMs with a large span from minimum to maximum elevation this is not a problem. However, for very flat areas such as 2 metres above sea level integer elevations are not sufficient. Selecting 32 bit real will result in decimal elevations, although the help documentation offers no suggestion about which to choose.
Although very minor, and dependant on the computer used for the processing, setting the working cache to 1024 MB also worked.

4 DRDC Ottawa CR 2013-116
2.2 Stereo DEM Processing
RADARSAT-2 stereo images were acquired over four AOI. The AOIs and a short description (from [2]) are provided in Table 1 and the details of the RADARSAT-2 images are listed in Table 2. The Baffin Island and Stokes Point regions contain changes in elevation greater than 1000 metres while the Camp Lejeune site changes less than 50 metres. The Mackenzie Delta changes only a few meters.
The data sets were initially processed with a down-sample factor of 2 during the creation of the epipolar image to improve the epipolar image pair correlation by slightly smoothing the data. If the resulting DEM had large gaps in the land areas, this value was increased.
In all cases, the stereo DEMs were edited (after step 3 in Section 2.1) before geocoding. At this point the stereo DEM pix file contains three channels: the left epipolar SAR image, a score channel which helps to identify pixels where the correlation to the ground was weak or failed which gives a truer impression of the success of the operation [3], and the stereo DEM in epipolar coordinates. The epipolar SAR image was used as a guide to create a land mask. A new channel was created in the DEM pix file and pixels under the land mask are taken from the DEM channel (channel 3) and the other pixels are set to the background value of -150. Doing so allows the geocoding step to ignore the non-land areas and still fill any holes in the land areas.
After the stereo DEMs were geocoded the reference DEMs were reprojected and cropped using Focus to match the stereo DEM resolution and coverage. The reference DEM was also used to mask out the water areas in the stereo DEM. Details of the reference DEMs used for each data set is provided in Section 2.3. The stereo and reference DEM were saved as raw files and imported into MATLAB© for statistical comparison. The DEMs were then imported into ArcMap to create output images.
The results of the stereo DEM processing for each data set are presented in Section 2.3.

DRDC Ottawa CR 2013-116 5
Table 1: AOIs for stereo DEM processing
Area Lat Lon Comments
Baffin Island, NU 66.6638 -61.3383
On Cape Dyer, eastern-most projection of Baffin Island into Davis Strait; covers DYE-M (Cape Dyer Main) DEW Line Site; rugged terrain ranges from sea level to 740 m at Cape Dyer site.
Stokes Point, YK 69.3213 -138.7504
Yukon coast, various types of shorelines, including narrow beach with cliffs, wide beach, barriers/spits with driftwood and sand to gravel, low cliffs in lagoons, and marshy lagoon edges.
Camp Lejeune, NC 34.5929 -77.3424
Marine Corps Base Camp Lejeune in North Carolina; kilometres of beach; low elevation, ranges from sea level to a maximum of approximately 12 m. Excellent temperate littoral test site with pockets of urban development.
Mackenzie Delta, NT 69.1374 -136.1363
Western-most portion of Mackenzie Delta, covers Ellice Island, Pitt Island and Olivier Islands; very low elevation (within a few metres of sea level), and very little change in elevation.
6 DRDC Ottawa CR 2013-116
Table 2: RADARSAT-2 stereo pair acquisitions
Area Beam Mode
Acquisition Date
Product Type
i (near) i Orbit
Baffin Island,
NU
MF5F 19-Mar-2011 SGX 45.8 9.6
Asc
MF1N 23-Mar-2011 SGX 36.2 Asc
MF5 19-Mar-2011 SGX 45.2 2.4
Des
MF4N 05-Apr-2011 SGX 42.8† Des
Stokes Point,
YK
MF22N 02-Jul-2011 SLC 31.7 9.1
Des
MF3N 06-Jul-2011 SLC 40.8 Des
Camp Lejeune,
NC
UF8 30-Oct-2010 SGX 35.6 9.9
Asc
UF22 09-Nov-2010 SGX 45.5 Asc
Mackenzie Delta,
NT
U20 26-Jun-2010 SGX
44.3
15.4
Asc SLC
U79 27-Jun-2010 SGX
28.9 Asc SLC
U20 06-Sep-2010 SGX
44.3
92.3
Asc SLC
U26 15-Sep-2010 SLC 48.0 Des
U20 30-Sep-2010 SGX
44.3 Asc SLC
DRDC Ottawa CR 2013-116 7
2.3 DEM Results
The following sub-sections discuss the stereo DEM results for the four AOIs.
2.3.1 Baffin Island
The Baffin Island data set consisted two stereo image pairs, one ascending and one descending. The reference DEM for both the ascending and descending stereo pairs was a 1:50,000 Canadian Digital Elevation Data (CDED) obtained from GeoBase (www.geobase.ca). The source of the CDED is described in an xml file distributed with each CDED as being from the “hypsographic and hydrographic elements of the National Topographic Data Base (NTDB) at scales of 1:50,000 and 1:250,000, or the Geospatial Data Base (GDB), or various scaled positional data acquired by the provinces and territories, or remotely sensed imagery” [3].
Ascending Stereo Pair
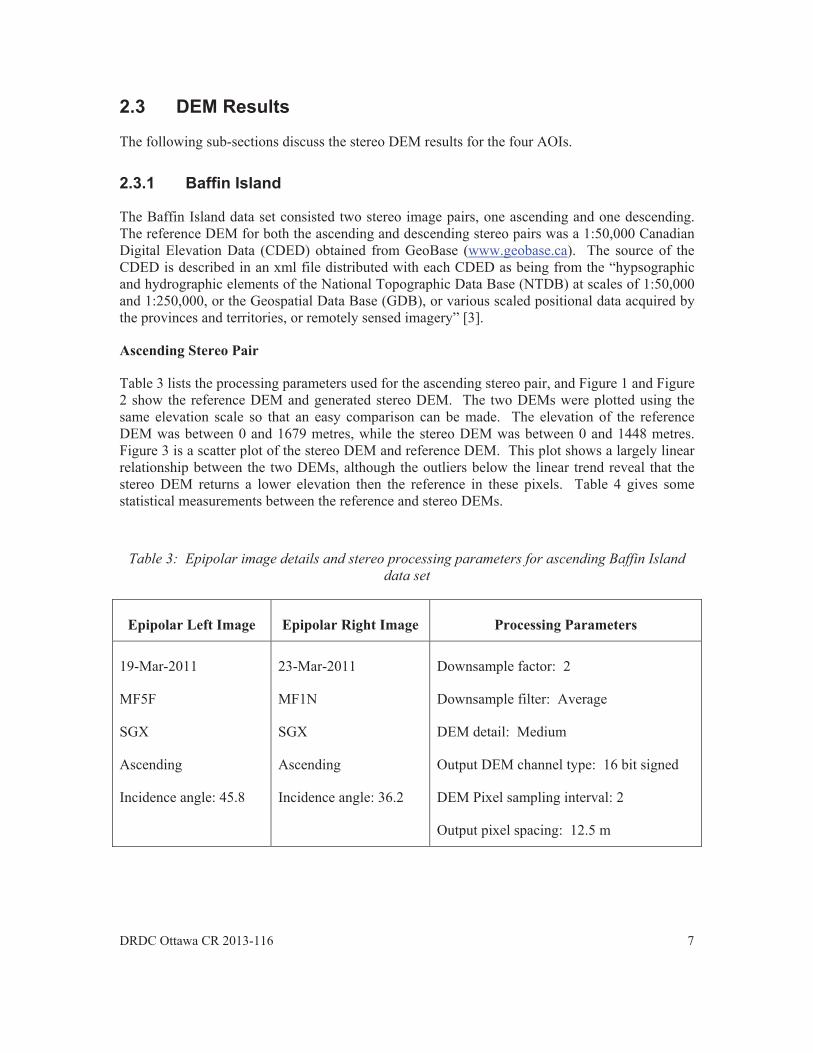
Table 3 lists the processing parameters used for the ascending stereo pair, and Figure 1 and Figure 2 show the reference DEM and generated stereo DEM. The two DEMs were plotted using the same elevation scale so that an easy comparison can be made. The elevation of the reference DEM was between 0 and 1679 metres, while the stereo DEM was between 0 and 1448 metres. Figure 3 is a scatter plot of the stereo DEM and reference DEM. This plot shows a largely linear relationship between the two DEMs, although the outliers below the linear trend reveal that the stereo DEM returns a lower elevation then the reference in these pixels. Table 4 gives some statistical measurements between the reference and stereo DEMs.
Table 3: Epipolar image details and stereo processing parameters for ascending Baffin Island data set
Epipolar Left Image Epipolar Right Image Processing Parameters
19-Mar-2011
MF5F
SGX
Ascending
Incidence angle: 45.8
23-Mar-2011
MF1N
SGX
Ascending
Incidence angle: 36.2
Downsample factor: 2
Downsample filter: Average
DEM detail: Medium
Output DEM channel type: 16 bit signed
DEM Pixel sampling interval: 2
Output pixel spacing: 12.5 m

8
Figu
Figure 2: S
ure 1: Refere
Stereo DEM f
ence DEM of
from the asce
Baffin Island
ending Baffin
d (cropped to
Island RADA
DRDC Ottaw
stereo DEM)
ARSAT-2 ster
wa CR 2013-11
reo pair
16

DRDC
Fig
Tab
Nu
86184
Desce
As wipair, aDEMbetwe
FigurelinearAgainelevatreferebias a
C Ottawa CR 2
gure 3: Scatte
ble 4: Statist
umber of Poi
410
ending Stereo
ith the ascendand Figure 4 s were plotte
een 0 and 151
e 6 shows a sr trend, althoun, there are oution that founence DEMs inand standard d
2013-116
er plot of ster
tical comparis
ints C
0.98
o Pair
ding case, Taband Figure 5
ed using the 9 metres, wh
scatter plot ofugh the distriutliers below tnd in the refn Table 6 alsdeviation.
reo DEM vs. r
son between rIsla
Correlation C
897
ble 5 lists the 5 show the resame elevati
hile the stereo
f the stereo Dibution of thethe linear trenference DEMso show that
reference DEM
reference andand data set
Coefficient
processing peference DEMion scale andDEM was be
DEM versus the points is nond indicating
M. The statisthe descendin
M for ascend
d stereo DEM
Bias
0.0106
arameters useM and generad the height oetween 0 and
he reference ot as tight as that the stere
stical measurng stereo DE
ding Baffin Isl
M for the ascen
RMS Err
562.26
ed for the desated stereo Dof the referen1448 metres.
DEM. This was in the a
eo DEM is retres between t
EM has a wor
land data set
nding Baffin
ror STD
42.84
scending stereDEM. The tw
nce DEM wa.
figure shows ascending casturning a lowethe stereo anrse correlation
9
D
eowoas
ae.erndn,

10
Tabl
Epip
19-M
MF5
SGX
Desce
Incide
le 5: Epipola
polar Left Im
ar-2011
ending
ence angle: 45
Figu
r image detai
mage Epi
5.2
05-A
MF4
SGX
Desc
Incid
ure 4: Refere
ils and stereo
polar Right I
Apr-2011
4N
X
cending
dence angle:
ence DEM of
processing pdata set
Image
42.8
Dow
Dow
DEM
Out
DEM
Out
Baffin Island
parameters fo
Proces
wnsample fac
wnsample filt
M detail: Me
tput DEM cha
M Pixel samp
tput pixel spa
d (cropped to
DRDC Ottaw
or descending
ssing Parame
ctor: 2
ter: Average
edium
annel type: 1
pling interval
acing: 12.5 m
stereo DEM)
wa CR 2013-11
g Baffin Island
eters
16 bit signed
l: 2
m
16
d

DRDC
Figu
C Ottawa CR 2
Figure 5: S
ure 6: Scatte
2013-116
Stereo DEM f
er plot of stere
from the desce
eo DEM vs. re
ending Baffin
eference DEM
n Island RADA
M for descend
ARSAT-2 ster
ding Baffin Is
1
reo pair
sland data set
11
t

12 DRDC Ottawa CR 2013-116
Table 6: Statistical comparison between reference and stereo DEM for the descending Baffin Island data set
Number of Points Correlation Coefficient Bias RMS Error STD
6919243 0.9580 0.1036 518.83 75.31
2.3.2 Stokes Point
The Stokes Point stereo pair consists of two SLC images with an incidence angle difference of 8.8 degrees. The reference DEM was a 1:50,000 CDED. Table 7 lists details of the stereo pair and the stereo DEM parameters used during processing. The reference and stereo DEMs are shown in Figure 7 and Figure 8, and were plotted using the elevation scale of the reference DEM. The maximum elevation of the reference DEM was 1147 metres and the stereo DEM was 1094 metres.
Both the scatter plot of the reference and stereo DEMs in Figure 9 and the statistics in Table 8 show that the stereo DEM was similar to the reference DEM.
Table 7: Epipolar image details and stereo processing parameters for Stokes Point data set
Epipolar Left Image Epipolar Right Image Processing Parameters
06-Jul-2011
MF3N
SLC
Descending
Incidence angel: 42.2
02-Jul-2011
MF22N
SLC
Descending
Incidence angel: 33.4
Downsample factor: 2
Downsample filter: Average
DEM detail: Medium
Output DEM channel type: 16 bit signed
Pixel sampling interval: 2
Output pixel spacing: 12.5 m

DRDCC Ottawa CR 2
Figu
Figur
2013-116
ure 7: Refere
re 8: Stereo D
ence DEM of
DEM from the
f Stokes Point
e Stokes Poin
(cropped to s
nt RADARSAT
stereo DEM)
T-2 stereo pai
1
ir
13

14
Table
N
14299
2.3.3
TableCampwith Hcould
The Csame had vincreaDEMelevatremai
Two rterms
e 8: Statistica
Number of Po
9662
3 Camp
e 9 lists the epp Lejeune steHV polarizati be a factor in
Camp Lejeunprocessing p
very little heiased from 2 t
was improvtion was chaining holes.
reference DEof resolution
Figure 9: S
al comparison
oints Co
0.9
p Lejeune
pipolar left anreo pair. It sion, which ten the poor ste
e area has litarameters as ight informato 8 in an atte
ved slightly, banged from t
EMs were avan, the ASTER
Scatter plot of
n between ref
orrelation C
9900
nd right imageshould be nond to have loreo DEM.
ttle topographwith the Baf
tion and was empt to improbut there werthe default o
ailable, an ASR DEM was
of stereo DEM
ference and s
oefficient
-
e details, andoted that theseower amplitud
hic features fffin Island and
mainly faileove the matchre still large
of -10 to -10
STER and SRselected for t
M vs. referenc
stereo DEM fo
Bias
-0.0322
d the DEM pre RADARSAde than the H
for creating thd Stokes Poined pixels. Thhing of the ep
areas of fail00 metres wh
RTM1, and bethe processin
DRDC Ottaw
ce DEM
for the Stokes
RMS Erro
208.55
rocessing paraAT-2 images HH or VV po
he stereo DEnt cases, the rhe downsamppipolar pairs. led values. hich filled in
ecause both wng. The refer
wa CR 2013-11
Point data se
or STD
23.12
ameters for thwere acquirelarizations an
EM. Using thresulting DEMple factor wa The resultinThe minimum
n many of th
were similar irence DEM fo
16
et
heednd
heMasngmhe
infor
DRDC Ottawa CR 2013-116 15
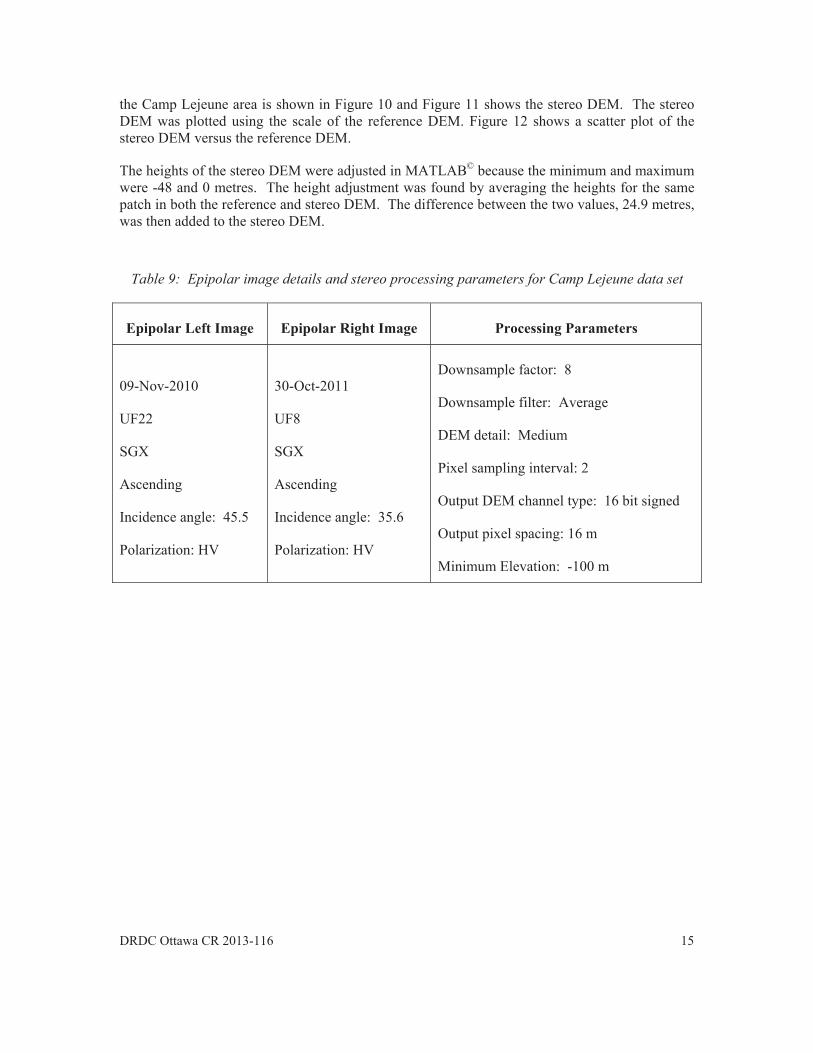
the Camp Lejeune area is shown in Figure 10 and Figure 11 shows the stereo DEM. The stereo DEM was plotted using the scale of the reference DEM. Figure 12 shows a scatter plot of the stereo DEM versus the reference DEM.
The heights of the stereo DEM were adjusted in MATLAB© because the minimum and maximum were -48 and 0 metres. The height adjustment was found by averaging the heights for the same patch in both the reference and stereo DEM. The difference between the two values, 24.9 metres, was then added to the stereo DEM.
Table 9: Epipolar image details and stereo processing parameters for Camp Lejeune data set
Epipolar Left Image Epipolar Right Image Processing Parameters
09-Nov-2010
UF22
SGX
Ascending
Incidence angle: 45.5
Polarization: HV
30-Oct-2011
UF8
SGX
Ascending
Incidence angle: 35.6
Polarization: HV
Downsample factor: 8
Downsample filter: Average
DEM detail: Medium
Pixel sampling interval: 2
Output DEM channel type: 16 bit signed
Output pixel spacing: 16 m
Minimum Elevation: -100 m

16
Figur
Figure
re 10: Refere
11: Stereo D
ence DEM of
DEM from the
Camp Lejeun
e Camp Lejeu
ne (cropped to
une RADARSA
DRDC Ottaw
o stereo DEM
AT-2 stereo p
wa CR 2013-11
M)
pair
16

DRDC
Table
Nu
73987
2.3.4
The Min TabMackoutpuintegefew melevat
Note tlocati
FollowThe wpixel
C Ottawa CR 2
e 10: Statisti
mber of Poin
75
4 Macke
Mackenzie Deble 11, Table
kenzie Delta sut DEM channer elevations metres. Thertions.
that at the timon.
wing the suggweights for eaon a scale be
2013-116
Figure 12
cal comparis
nts Co
0.656
enzie Delta
elta data set ce 12, and Tabstereo pairs wnel type is 16is not suffici
refore, a 32
me of writing
gestion in [1]ach stereo DE
etween 0 and
2: Scatter plo
on between re
orrelation Co
67
a
onsisted of file 13. As wi
was increased bit signed wient in the Mbit output D
of this report
, the three steEM pixel wa100. The sco
ot of reference
eference and set
oefficient
ive images orith the Camp to 8 to impro
which results iMackenzie Del
EM channel
t, there were n
ereo DEMs was obtained frore channel d
e and stereo D
stereo DEM f
Bias
0.6493
rganized into Lejeune, the
ove the epipoin integer sterlta where thewas selected
no reference D
were combinedrom the scoredoes contain v
DEMs
for the Camp
RMS Erro
11.35
three stereo pe downsamplelar correlationreo DEM eleve elevation vad which resu
DEMs found
d using a weie channel whvalues above
1
p Lejeune data
or STD
8.49
pairs, as showe factor for thn. The defauvations. Usinaries by only ults in decim
that cover th
ighted averagich ranks eac100, but this
17
a
wnheult ng
aal
his
ge. chis

18 DRDC Ottawa CR 2013-116
used to indicate those pixels that failed the stereo DEM processing. According to [3], the score channel gives an impression of the success of the stereo DEM processing with values near 100 representing better results than lower values. The score was used as the weighting factor for the weighted average such that:
(1)
Where:
is pixel i,j of the combined DEM
is the score for pixel i,j of the nth stereo DEM
is pixel i,j of the nth stereo DEM
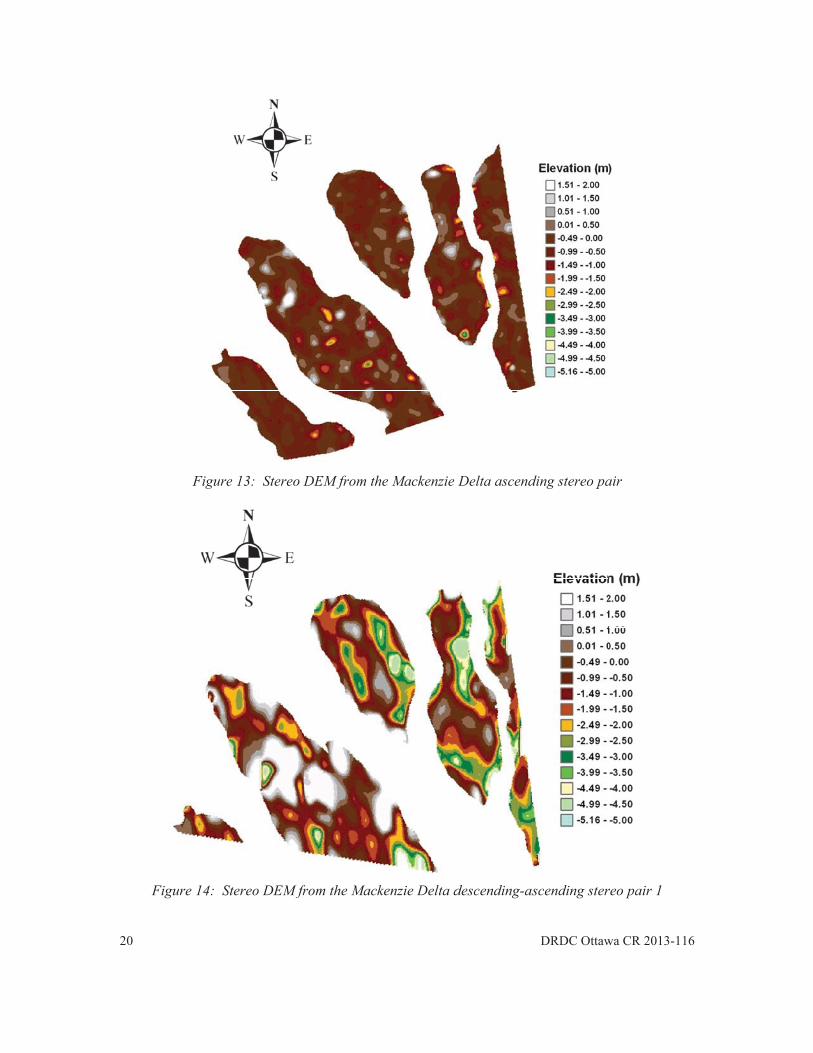
Figure 13, Figure 14, and Figure 15 show the stereo DEMs created for the three Mackenzie stereo pairs, and Figure 16 shows the combined stereo DEM. All figures are plotted on the same colour scale. Even without the aid of a reference DEM, it is obvious that the calculated elevation values do not accurately represent the actual ground elevations.
Table 11: Epipolar image details and stereo processing parameters for ascending Mackenzie Delta data set
Epipolar Left Image Epipolar Right Image Processing Parameters
26-Jun-2010
U20
SGX (& SLC)
Ascending
Incidence angle: 44.3
27-Jun-2010
U79
SGX (& SLC)
Ascending
Incidence angle: 28.9
Downsample factor: 8
Downsample filter: Average
DEM detail: Medium
Pixel sampling interval: 2
Output pixel spacing: 16 m
Output DEM channel type: 32 bit real
Minimum Elevation: -5 m
DRDC Ottawa CR 2013-116 19
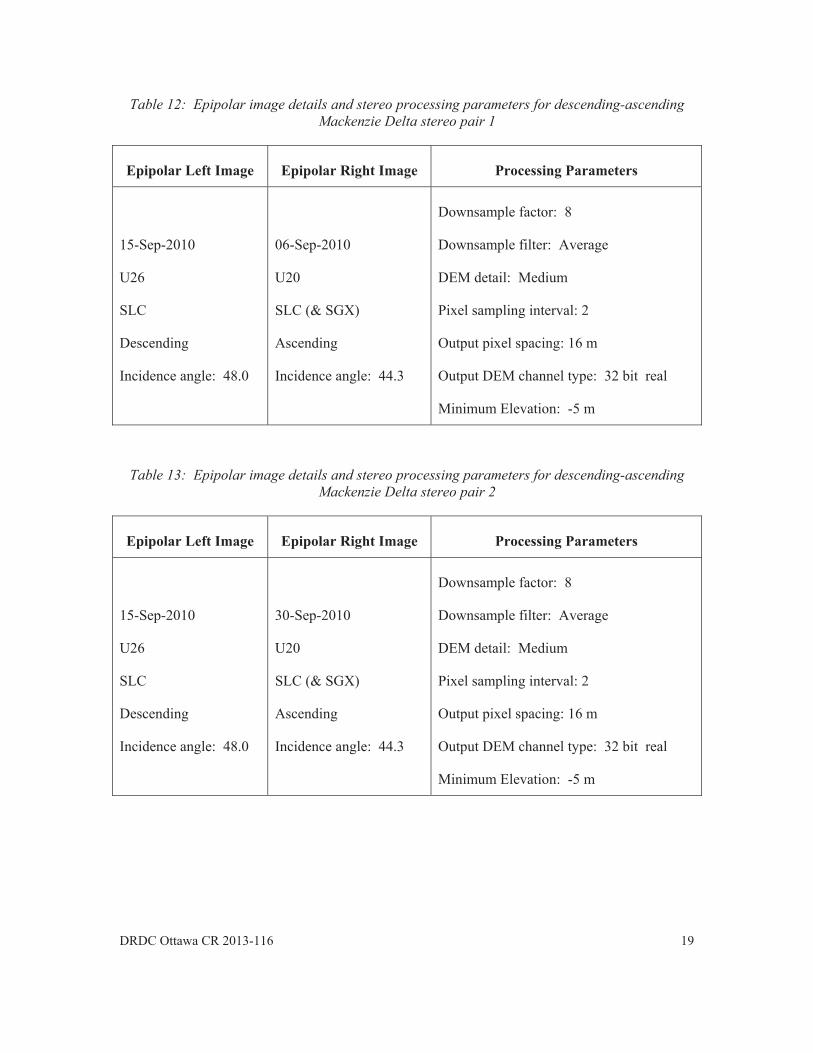
Table 12: Epipolar image details and stereo processing parameters for descending-ascending Mackenzie Delta stereo pair 1
Epipolar Left Image Epipolar Right Image Processing Parameters
15-Sep-2010
U26
SLC
Descending
Incidence angle: 48.0
06-Sep-2010
U20
SLC (& SGX)
Ascending
Incidence angle: 44.3
Downsample factor: 8
Downsample filter: Average
DEM detail: Medium
Pixel sampling interval: 2
Output pixel spacing: 16 m
Output DEM channel type: 32 bit real
Minimum Elevation: -5 m
Table 13: Epipolar image details and stereo processing parameters for descending-ascending Mackenzie Delta stereo pair 2
Epipolar Left Image Epipolar Right Image Processing Parameters
15-Sep-2010
U26
SLC
Descending
Incidence angle: 48.0
30-Sep-2010
U20
SLC (& SGX)
Ascending
Incidence angle: 44.3
Downsample factor: 8
Downsample filter: Average
DEM detail: Medium
Pixel sampling interval: 2
Output pixel spacing: 16 m
Output DEM channel type: 32 bit real
Minimum Elevation: -5 m
20
F
Figure
Figure 14: S
e 13: Stereo D
Stereo DEM fr
DEM from th
from the Mack
he Mackenzie
kenzie Delta d
Delta ascend
descending-as
DRDC Ottaw
ding stereo pa
scending ster
wa CR 2013-11
air
reo pair 1
16

DRDC
F
C Ottawa CR 2
Figure 15: S
Figure 1
2013-116
Stereo DEM fr
6: Combined
from the Mack
d Mackenzie D
kenzie Delta d
Delta stereo D
descending-as
DEM using a
scending ster
weighted ave
2
reo pair 2
erage
21
22 DRDC Ottawa CR 2013-116
2.4 Stereo DEM Summary
The generation of stereo DEMs from RADARSAT-2 stereo pairs using PCI’s OrthoEngine© was a straightforward process. However, there are few processing options available to the user during the processing. In the flatter data sets, the downsample factor was increased and the minimum elevations were lowered, in an effort to improve the resulting stereo DEMs. Only increasing the downsample factor is recommended for stereo DEM processing as lowering the minimum elevation does not appear to be reliable.
The key factors that contribute to the success of generating DEMs from SAR stereo pairs are the amount of change in topography of the AOI and the incidence angle difference between stereo images. As was found in the four AOIs, DEMs from stereo images were qualitatively best (fewer failed pixels) in the two sites with the larger changes in elevation. The incidence angle difference between the two stereo images is also important, as was found with the Baffin Island pairs. Using an ascending-descending stereo pair was investigated in the Mackenzie Delta data set, but the lack of reference DEM and the small change in elevation made evaluating this scenario difficult. Table 14 summarizes the comparisons of the reference and stereo DEMs for the four AOIs.
The stereo DEM for Camp Lejeune has fewer data points than the Baffin Island and Stokes Point data sets because the Camp Lejeune images were Ultra-Fine while the others were Multi-Look Fine. The Ultra-Fine SGX image have a pixel spacing of 1 metre and covers approximately 20 by 20 km while the Multi-Look Fine SGX images have a pixel spacing of 3.125 metres and covers approximately 50 by 50 km resulting in more pixels. Furthermore, the increased downsampling factor used with Camp Lejeune meant that a larger output DEM pixel spacing was used, which resulted in fewer pixels in the final DEM. The Mackenzie Delta also had fewer data points because of the above reasons, and that much of the image covered water areas.

DRDC Ottawa CR 2013-116 23
Table 14: Summary of reference and stereo DEM comparisons
Dataset ID Number of Data Points
Correlation Coefficient
Bias RMS Error (m)
STD
Baffin Island Ascending 8618410 0.9897 0.0106 562.26 42.84
Baffin Island Descending
6919243 0.9580 0.1036 518.83 75.31
Stokes Point 14299662 0.9900 -0.0322 208.55 23.12
Camp Lejeune 739875 0.6567 0.6493 11.35 8.49
Mackenzie Delta Ascending
109500 N/A N/A N/A N/A
Mackenzie Delta Des-Asc 1
79463 N/A N/A N/A N/A
Mackenzie Delta Des-Asc 2
73184 N/A N/A N/A N/A
Mackenzie Delta Combined
67377 N/A N/A N/A N/A

24 DRDC Ottawa CR 2013-116
3 RADARSAT-2 Northwest Passage Mosaic
The objectives of this sub-task were to generate mosaics of the Northwest Passage (NWP) from RADARSAT-2 ScanSAR Narrow B dual polarized images, and using these results, provide a set of recommendation for the routine generation of NWP mosaics from RADARSAT-2 imagery.
The assessment of the large NWP data set is presented in Section 3.1, the details of the NWP mosaic generation is discussed in Section 3.2, and some comments on the mosaic process and recommendations are found in Section 3.3.
3.1 Data Assessment
The NWP data set consisted of 91 ScanSAR Narrow B dual polarized (HH/HV) images acquired as part of a background mission between 01-Jul-2009 and 29-Oct-2009. These images were planned with the lowest possible priority and were automatically bumped when conflicts with other users were encountered. The NWP data set assessment included an evaluation of:
1. the spatial coverage of the NWP route;
2. the need for noise subtraction; and
3. the need for orthorectification.
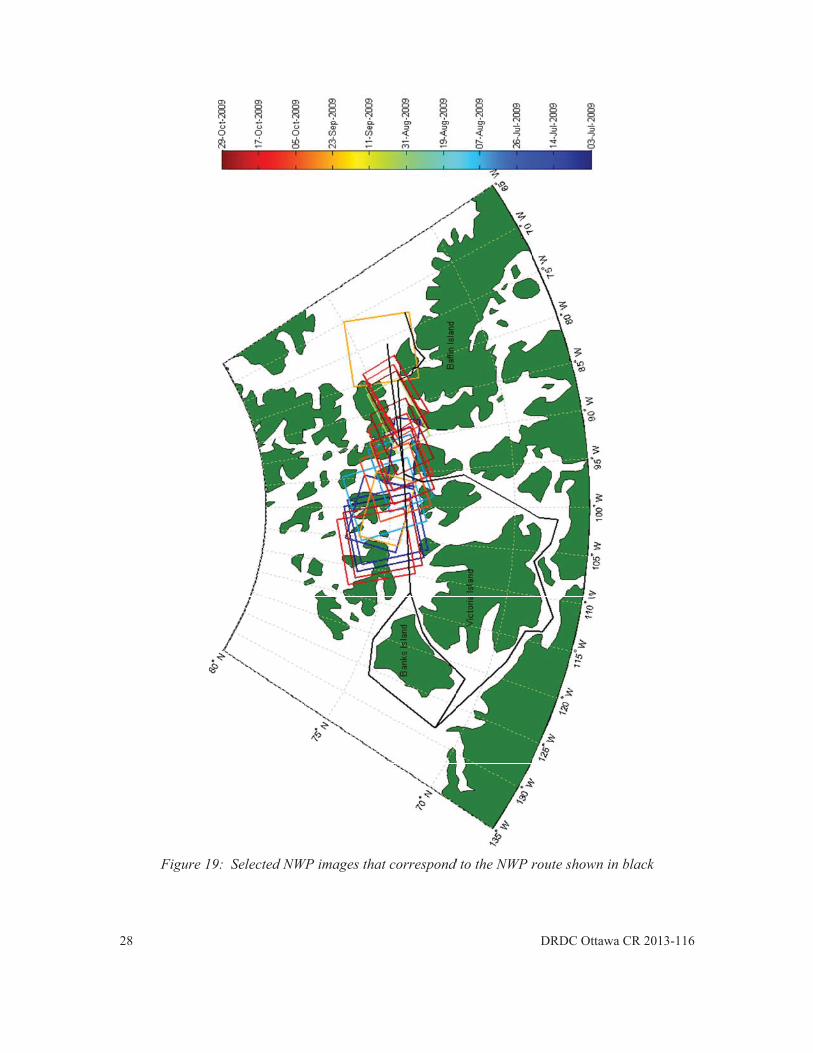
The data assessment began by evaluating the spatial coverage of the collected images. MATLAB© was used (due to the large number of images) to read the corner coordinates of each image and plot this information along with land vectors and a shape file of the NWP route, as seen in Figure 17. It is clear from this figure that the western RADARSAT-2 images do not cover the NWP route. Figure 18 shows the same dataset showing the image acquisition date versus the scene centre longitude, and shows that the vast majority of the NWP data set was collected in the western part of the NWP. Figure 17 and Figure 18 also show that the eastern part of the NWP was not extensively covered. Because these images do not cover the NWP route, they were not included in the mosaics, and the data set was reduced to 26 images, as shown in Figure 19 and Figure 20.
The second part of the data assessment involved determining if noise subtraction was required to produce the mosaics. Figure 21 shows the dual polarization RADARSAT-2 image from 03-Jul-2009 before noise subtraction in the top panel and the same image after noise subtraction in IA Pro [5] in the bottom panel. It is clear that the linear trend in the top image has been removed after noise subtraction. This trend was due to the HV channel of the dual polarized image and since the output mosaics will include the HV channel, all images had the noise subtraction performed in IA Pro.
The final part of the assessment was to determine if orthorectification was necessary. Orthorectification, even without a reference DEM, will improve the alignment of the data set images. Furthermore, choosing an appropriate projection can improve the visual quality of the images. For the NWP data set, the UTM projection was not used because the mosaic spans

DRDC Ottawa CR 2013-116 25
multiple UTM zones. The Longitude/Latitude geographic is heavily distorted in northern locations, such as the NWP. The projection selected for the orthorectification was the Lambert Conformal Conic (LCC). This was selected in OrthoEngine by choosing Other -> User Projections -> CanLCC under Output Projections of the Set Projection window. The CanLCC sets the true origin as 95° W and 49° N with the 1st and 2nd standard parallel as 49° N and 77° N, respectively. There were no alignment issues found with the orthorectified NWP data set.

26
Figuure 17: Plot oof all NWP daata sets with NNWP route sh
DRDC Ottaw
hown in black
wa CR 2013-11
k
16

DRDCC Ottawa CR 2
Figu
2013-116
ure 18: Plot of image acquisition date vs .scene cenntre longitude
227
28
Figure 19: Selected NWWP images thaat correspondd to the NWP r
DRDC Ottaw
route shown i
wa CR 2013-11
in black
16

DRDC Ottawa CR 2013-116 29
Figure 20: Plot of image acquisitions that cover the NWP vs. image scene centre longitude
30
FigurTh
RADARights
re 21: Noise e original ima
ARSAT-2 Dats Reserved. R
subtraction foage is shown
ta and ProducRADARSAT is
for 03-Jul-200on the top, an
show
cts © MacDos an official tr
09 RADARSAnd the image
wn on bottom.
onald Dettwilerademark of t
AT-2 ScanSARafter noise su
.
er and Associthe Canadian
DRDC Ottaw
R Narrow B dubtraction wi
iates Ltd. (20Space Agenc
wa CR 2013-11
dual pol imageith IA Pro is
009-2011) – Acy.
16
e.
All

DRDC Ottawa CR 2013-116 31
3.2 Northwest Passage Mosaic Generation
Three mosaics of the NWP were created. The July and August acquisitions were combined into one mosaic, due to the lack of spatial coverage, and the final two mosaics were from the images acquired in September and October.
3.2.1 Mosaic Method using OrthoEngine
The process for generating the mosaics of the NWP data were applied after the data assessment performed in Section 3.1, where the original data series was down-selected based on spatial coverage of the NWP route, the noise was subtracted, and the images were orthorectified. The process followed for producing the NWP mosaics was:
1. Open a new project in OrthoEngine
a. Under Math Modelling Method choose None (mosaic only)
b. Choose output projection
c. Choose output pixel spacing
2. Select Image Input under Processing step
a. Add the orthorectified images for the current mosaic
3. Choose Mosaic under Processing step
a. Click on Define mosaic area
i. Choose output file name and click Ok
b. Click on Automatic mosaicking.
i. Choose a normalization type. Different normalizations can be applied to images individually.
ii. Choose a starting image. This is the image that is used to build the mosaic, the colour balancing, and the cutline selection [3].
iii. Select a colour balancing method to apply to the entire mosaic
iv. Select the cutline method.
c. A preview image can be created to view a low resolution version of the mosaic by setting an appropriate preview file name and clicking Generate Preview
d. Generate the final mosaic by clicking Generate Mosaic
32 DRDC Ottawa CR 2013-116
The starting images for the mosaics were selected from an image near the centre of the NWP coverage.
3.2.2 Mosaic Options
The various normalization and colour balancing methods were tested on the September mosaic because it covered the greatest geographic area. When generating preview mosaics using the different normalization methods, the colour balance was set to none. Similarly, when testing the different colour balancing methods, the normalization was also set to none.
3.2.2.1 Normalization Method
The normalization options (descriptions from [3]) are listed below, along with a qualitative description of the resulting mosaic. The preview mosaics for the normalization options are shown in Figure 22 and Figure 23. Only the HH channels are shown due to issues with the dual pol mosaic (see 3.2.3).
None: Disable normalization
o This resulted in the best looking mosaic, with an even tone across the mosaic. This was selected for the creation of the final mosaics.
Hot Spot: Remove hot spots from the image
o Caused bright areas in water areas, not suitable.
Adaptive Filter: Balance the brightness and contrast by using a moving window. The size of the filter window is specified as a percentage of the entire image's size.
o Similar to Hot Spot, caused bright areas in open water areas.
Across Image 1st Order: Correct the gradual change in brightness from one side of the image to the other. Recommended for ScanSAR and other imagery.
o Added black background to images which were also normalized. Often resulted in distinct boundaries between calm water and water with patterns.
Across Image 2nd Order: Correct the gradual change from dark to bright to dark or vice versa across the image, also known as an antenna pattern. Recommended for ScanSAR and other imagery.
o Added black background to images which were also normalized and was more visible than in the 1st Order. Often resulted in distinct boundaries between calm water and water with patterns and between image boundaries.
Across Image 3rd Order: Correct gradual bright and dark patterns from one side of the image to the other. Recommended for ScanSAR and other imagery.
o Very similar to the 2nd Order results.

DRDC
RADARights
C Ottawa CR 2
Figure 22:
ARSAT-2 Dats Reserved. R
2013-116
September p
ta and ProducRADARSAT is
preview mosa
cts © MacDos an official tr
aics showing t
onald Dettwilerademark of t
the normaliza
er and Associthe Canadian
ation options,
iates Ltd. (20Space Agenc
3
part 1
009-2011) – Acy.
33
All

34
RADARights
Figure 23:
ARSAT-2 Dats Reserved. R
September p
ta and ProducRADARSAT is
preview mosa
cts © MacDos an official tr
aics showing t
onald Dettwilerademark of t
the normaliza
er and Associthe Canadian
DRDC Ottaw
ation options,
iates Ltd. (20Space Agenc
wa CR 2013-11
part 2
009-2011) – Acy.
16
All
DRDC Ottawa CR 2013-116 35
3.2.2.2 Colour Balancing Method
The colour balancing options (descriptions also from [3]) are listed below, along with a qualitative description of the resulting mosaic. The preview mosaics for the colour balancing options are shown in Figure 24 and Figure 25. As with the normalization images, only the HH channels are shown due to issues with the dual pol mosaic (see 3.2.3).
None: No colour balancing.
o Resulted in best looking mosaic, with an even tone across the image. This wasselected for the creation of the final mosaics.
Histogram (entire image): Compute a colour balancing histogram from the mosaic file and the input image. The default of 300% is recommended for images with low overlap or for images with systematic effects such as when images are bright at the top and dark at the bottom.
o Produced decent results; however there was a slight brightening at either end ofthe mosaic.
Overlap Area: Compute the colour balancing histogram using only the pixels in the overlapping area of the images being added to the mosaic file. This method is recommended for most images.
o Produced results similar to the Histogram colour balancing, with noticeablebrightening of left and right parts of the mosaic.
Match to Reference Image: Match the colour balancing for the mosaic to the image identified in the Mosaic reference image box.
o This method produced poor results, with one of the mosaic images being muchbrighter than the rest (this was not the reference image). Also, choosing different reference images could have a large effect on the mosaics, and adds a subjective aspect to the automatic mosaic process.
Look-Up Table (LUT): Control the colour balancing for the mosaic based on previously stored LUTs.
o Not used because no LUTs existed for image channels. LUTs can be created, butit is up to the user to select and edit the LUTs. This adds extra effort and a subjective nature to the automatic mosaic process.
Neighbourhood: Determines a set of model coefficients that change each image pixel based on the pixel values of the intersecting (neighbouring) pixels, regardless of image order. The overall pixel value of each individual image is adjusted iteratively, so that the value is similar to those of its neighbouring images. This colour balancing method adjusts the overall tonal value of the image pixels in each overlapping region, to minimize outliers (extreme pixel values) and exclude these from the coefficient computation.
o This method also produced a good visual mosaic, with even contrast across theimage.

36
RADARights
Figure 24: S
ARSAT-2 Dats Reserved. R
September pr
ta and ProducRADARSAT is
review mosaic
cts © MacDos an official tr
cs showing th
onald Dettwilerademark of t
he colour bala
er and Associthe Canadian
DRDC Ottaw
ancing option
iates Ltd. (20Space Agenc
wa CR 2013-11
ns, part 1
009-2011) – Acy.
16
All

DRDC
RADARights
3.2.2
The c
C Ottawa CR 2
Figure 25: S
ARSAT-2 Dats Reserved. R
.3 Cut L
ut line collect
Min Diffein gray val
Min Relatdifference
Edge Featdetermine
Use Entirecoordinate
2013-116
September pr
ta and ProducRADARSAT is
Line Collect
tion method c
rence: Placelues between
tive Differenin gradient v
tures: Use athe optimum
e Image: Moes of the imag
review mosaic
cts © MacDos an official tr
ion Method
consists of fou
e the cut lines the images.
nce: Place thealues between
a combinationlocation for t
osaic images ges as the cut l
cs showing th
onald Dettwilerademark of t
d
ur options list
in areas whe
e cut lines in n the images.
n of Min Difthe cut lines.
that do not ovlines to avoid
he colour bala
er and Associthe Canadian
ted below (fr
ere there is the
areas where
fference and M
verlap. Orthod gaps betwee
ancing option
iates Ltd. (20Space Agenc
rom [3]).
e least amoun
there is the le
Min Relative
oEngine uses ten the images
3
ns, part 2
009-2011) – Acy.
nt of differenc
east amount o
e Difference t
the four corne.
37
All
ce
of
to
er
38 DRDC Ottawa CR 2013-116
The Edge Features cut line method was ultimately selected as it is a combination of the first two methods. The final method is not suitable as it uses the image boundaries as cut line, which results in a mosaic that can vary significantly across the boundaries. A blend width of 16 was used to minimize the visibility of the cut line by smoothing the difference between the images for 16 pixels on either side of the cut line.
3.2.3 Mosaic Results
The final mosaic processing options used for the three mosaics are summarized in Table 15. The RADARSAT-2 ScanSAR Narrow B images used for the July-August mosaic are listed in Table 16, the September images in Table 17, and Table 18 lists the images used in the October mosaic. The final mosaics were created using the same LCC projection (CanLCC in OrthoEngine) that was used to orthorectify the RADARSAT-2 images and were produced with a 100 metre output pixel spacing.
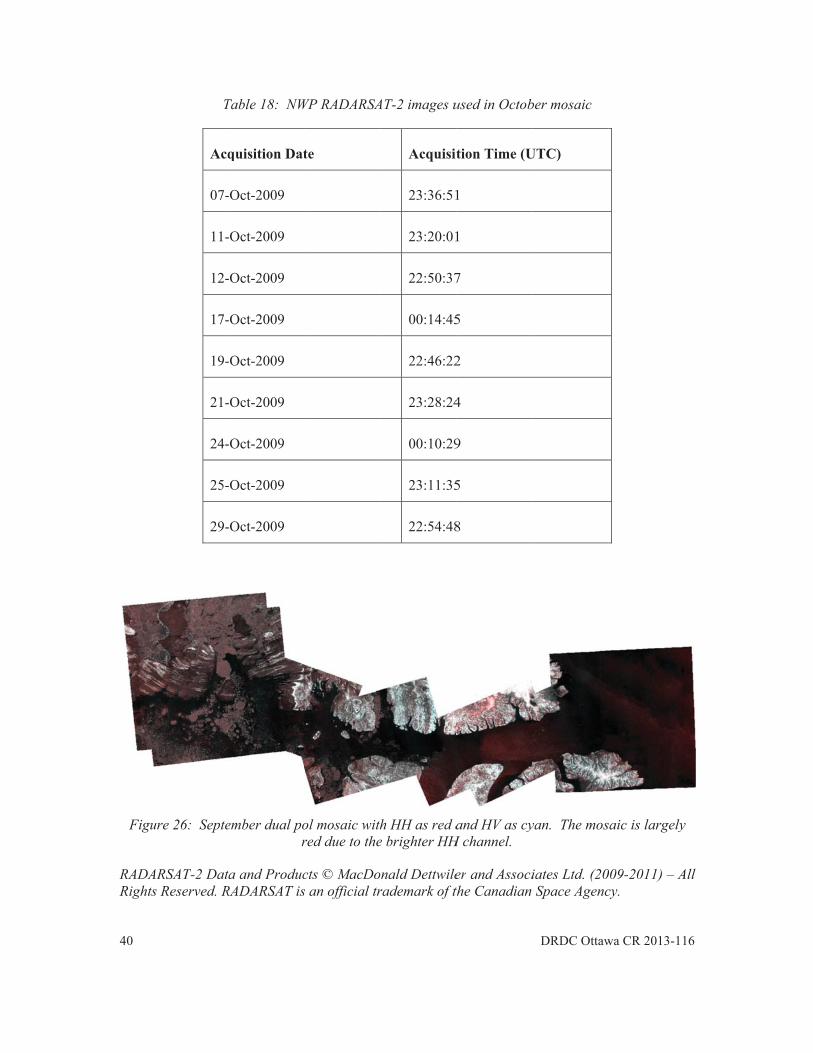
The generated mosaics contained both HH and HV channels and were displayed as RGB images with the HH channel assigned red and the HV assigned green and blue (cyan). Due to the lower amplitude values of the HV channel the mosaics always displayed red tones over much of the images. Figure 26 shows this in the September mosaic, which was typical of the other mosaics. Even when processed with the different normalization and colour balancing methods, the red tones were present.
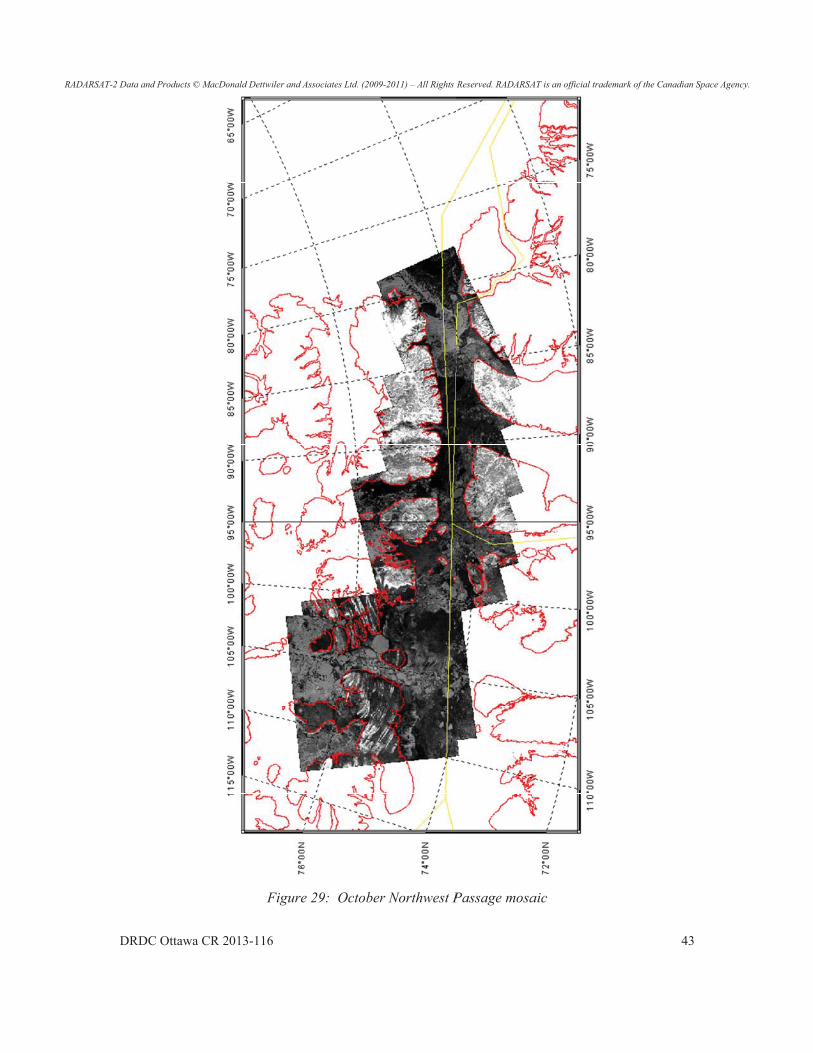
The July-August, September, and October mosaics are shown in Figure 27, Figure 28, and Figure 29, respectively. The full resolution versions of these images were made available to the Contract Scientific Authority.
Table 15: Final automatic mosaic processing options used for NWP mosaics
Mosaic Starting Image (Date and time)
Normalization Colour Balancing Cut Line & Blend Width (pixels)
July-August 17-Jul-2009
23:28:16 UTC
None None Edge features, 16
September 27-Sep-2009
23:28:23 UTC
None None Edge features, 16
October 07-Oct-2009
23:36:51 UTC
None None Edge features, 16

DRDC Ottawa CR 2013-116 39
Table 16: NWP RADARSAT-2 images used in July-August mosaic
Acquisition Date Acquisition Time (UTC)
03-Jul-2009 00:06:09
07-Jul-2009 23:19:53
10-Jul-2009 00:01:55
17-Jul-2009 23:28:16
06-Aug-2009 23:45:12
Table 17: NWP RADARSAT-2 images used in September mosaic
Acquisition Date Acquisition Time (UTC)
04-Sep-2009 22:58:55
23-Sep-2009 00:14:44
25-Sep-2009 22:46:21
27-Sep-2009 11:51:42
27-Sep-2009 13:32:18
27-Sep-2009 23:28:23
30-Sep-2009 00:10:29
40
Figu
RADARights
T
Acq
07-
11-
12-
17-
19-
21-
24-
25-
29-
ure 26: Septe
ARSAT-2 Dats Reserved. R
Table 18: NW
quisition Dat
-Oct-2009
-Oct-2009
-Oct-2009
-Oct-2009
-Oct-2009
-Oct-2009
-Oct-2009
-Oct-2009
-Oct-2009
ember dual por
ta and ProducRADARSAT is
WP RADARSA
te
ol mosaic withred due to the
cts © MacDos an official tr
AT-2 images u
Acquisit
23:36:51
23:20:01
22:50:37
00:14:45
22:46:22
23:28:24
00:10:29
23:11:35
22:54:48
h HH as red ae brighter HH
onald Dettwilerademark of t
used in Octob
tion Time (U
1
1
7
5
2
4
9
5
8
and HV as cyH channel.
er and Associthe Canadian
DRDC Ottaw
ber mosaic
UTC)
yan. The mos
iates Ltd. (20Space Agenc
wa CR 2013-11
saic is largely
009-2011) – Acy.
16
y
All

DRDC
RADARSAT-2 D
C Ottawa CR 2
Data and Products ©
2013-116
Figure 27:
© MacDonald Dettwi
: July and Au
iler and Associates L
ugust Northwe
Ltd. (2009-2011) – Al
est Passage m
ll Rights Reserved. R
mosaic
RADARSAT is an offic
4
cial trademark of the
41
e Canadian Space Aggency.

42
RADARSAT-2 Dataa and Products © Ma
Figure 2
acDonald Dettwiler a
28: Septemb
and Associates Ltd. (
er Northwest
(2009-2011) – All Rig
t Passage mos
ghts Reserved. RADA
DRDC Ottaw
saic
ARSAT is an official
wa CR 2013-11
trademark of the Can
16
nadian Space Agencyy.
RAD
DRDC
DARSAT-2 Data and
C Ottawa CR 2
d Products © MacDo
2013-116
Figure
onald Dettwiler and A
e 29: October
Associates Ltd. (2009
r Northwest P
9-2011) – All Rights R
Passage mosa
Reserved. RADARSA
aic
AT is an official trade
4
emark of the Canadia
43
an Space Agency.

44 DRDC Ottawa CR 2013-116
3.3 Comments on NWP Mosaics
The key to generating successful mosaics of the NWP using the automatic mosaic tool in PCI OrthoEngine© starts with the RADARSAT-2 data. Acquiring the data in the minimum amount of time to reduce changes and covering the entire NWP route will lead to the best chance to produce a mosaic showing useful information. One of the key problems with the data set used in this report is that only a small part of the actual NWP route was imaged. Assuming this was not due to errors in placing the RADARSAT-2 orders, it is likely that using the lowest priority to collect the data meant that much of the acquisitions over the NWP route were cancelled due to conflicts or moved to accommodate other users. The dual pol RADARSAT-2 imagery does add an extra element to the mosaic, however the mosaics produced using the automatic mosaic tool in OrthoEngine© were dominated by the HH channel. Post processing of the mosaic would be required to produce an image balanced between the HH and HV channels.
Using the RADARSAT-2 Acquisition Planning Tool (APT) to generate the acquisitions, the complete coverage of the NWP route could be completed in four days, provided there are no conflicting acquisitions. Figure 30 shows the swaths of the ascending and descending orders for a four day period. This figure includes all possible acquisitions with many overlapping scenes which are not necessary to produce a mosaic. Reducing the acquisition period to three days leaves small gaps in the NWP coverage, as shown in Figure 31. For Figure 30 the arbitrary period of 01-Oct-2011 to 04-Oct-2011 was chosen, and 01-Oct-2011 to 03-Oct-2011 for Figure 31. Moving the acquisition window within the 24-day RADARSAT-2 period will shift theacquisitions but the full NWP route can still be covered in four days. The three day mosaic will also always have gaps, although they could be moved to a less important area.
Collecting more imagery than necessary is also helpful when choosing images for the mosaic and would also allow for better contrast matching of adjacent images. More imagery would also allow a mosaic of the full NWP to be created if some acquisitions were cancelled due to conflicts. Depending on the content of the images used to create the mosaic, the automatic cutline generation may cut out sections of the images such that smaller parts of more acquisitions are used for the mosaic. Having said that, the imagery used to create mosaics are not combined or fused, they only show the images on top of the mosaic and as a result a lot of the collected images may not be used.
Caution should be used when performing any analysis or drawing conclusions from the mosaics. Any information contained in an image underneath another image is lost in the final mosaic. Furthermore, the time span between adjacent images can be many days, meaning that the ground, ice, and water conditions present in the mosaic in no way represent the actual conditions. If analysis of specific areas of the NWP is required, such as at choke points or certain ice features, then the orthorectified imagery should be used.

DRDC
Figu
Figur
C Ottawa CR 2
ure 30: RADA
re 31: RADAs
2013-116
ARSAT-2 Scacomplete c
ARSAT-2 Scansmall gaps in
anSAR Narrowcoverage. Th
nSAR Narrowthe coverage
w B coveragehe NWP route
w B coverage o. The NWP r
e of the NWP e is shown in
of the NWP oroute is shown
over a 4 day black.
over a 3 day pn in black.
4
period offers
period still ha
45
s
as

46 DRDC Ottawa CR 2013-116
4 Discussion
The generation of DEMs from stereo RADARSAT-2 images worked best in the areas with larger changes in topography and with a larger difference in incidence angles. The DEM for the two flat locations had large regions of failed pixels. Even after reprocessing the DEMs using all possible options in OrthoEngine©, there were large differences between the stereo-derived and the reference DEMs.
The Northwest Passage mosaics are very subjective and depend on the ground and sea conditions in the RADARSAT-2 images. The final recommendation for this specific set of images and based on qualitative analysis of the various mosaic options in OrthoEngine© is that the no normalization or colour-balancing of the images are necessary. However, this conclusion depends entirely on the images, and may not be accurate in different locations or at different times of the year.
Note that complete coverage of the Northwest Passage was not achieved with these images, and many of the images were acquired outside of the Northwest Passage corridor; both of these problems were due to an error in the original tasking request by DRDC Ottawa. The images acquired outside the Northwest Passage were not included in the final mosaics.

DRDC Ottawa CR 2013-116 47
References .....
[1] Secker, J., Cole, M., and Gong, S. (2011). Exploitation of space-based SAR data: Orthorectification and DEM generation using PCI Geomatics’ OrthoEngine© software. DRDC Ottawa TM 2011-233. Defence R&D Canada – Ottawa.
[2] Secker, J. and Cole, M. (2011). Exploitation of space-based SAR data: DEM generation using RADARSAT-2 stereo SAR pairs and PCI Geomatics’ OrthoEngine© software. DRDC Ottawa LR 2900-50. Defence R&D Canada – Ottawa.
[3] PCI Geomatics (2007). Geomatica® OrthoEngine® 10.1: User Guide: http://www.gis.unbc.ca/help/software/pci/orthoeng.pdf (accessed 11-Oct-2013)
[4] Centre for Topographic Information, National Resources Canada (2007). Canadian Digital Elevation Data, Level 1 Product Specifications, Edition 3.0: http://www.geobase.ca/doc/specs/pdf/GeoBase_product_specs_CDED1_3_0.pdf (accessed 11-Oct-2013).
[5] Secker, J. and Vachon, P.W. (2007). Exploitation of multi-temporal SAR and EO satellite imagery for geospatial intelligence. In Proceedings of Fusion 2007: The 10th International Conference on Information Fusion, 09-12 July 2007, Quebec City. 8 pages

48 DRDC Ottawa CR 2013-116
This page intentionally left blank.
DRDC Ottawa CR 2013-116 49
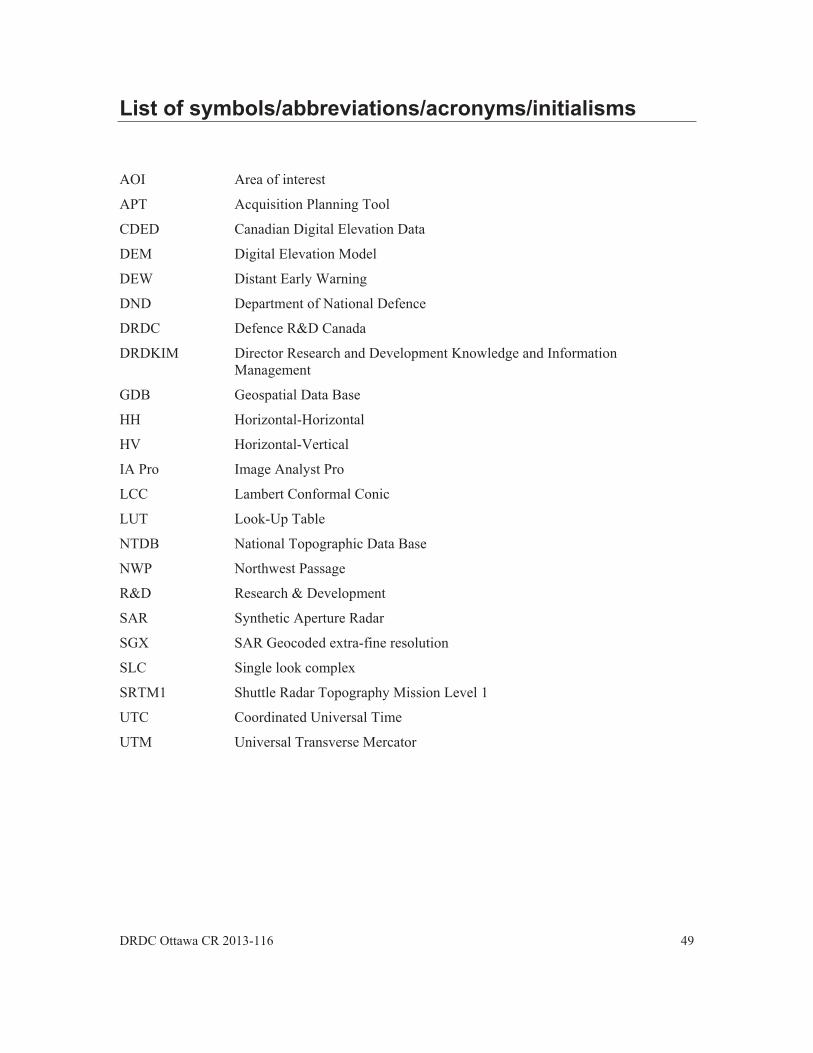
List of symbols/abbreviations/acronyms/initialisms
AOI Area of interest
APT Acquisition Planning Tool
CDED Canadian Digital Elevation Data
DEM Digital Elevation Model
DEW Distant Early Warning
DND Department of National Defence
DRDC Defence R&D Canada
DRDKIM Director Research and Development Knowledge and Information Management
GDB Geospatial Data Base
HH Horizontal-Horizontal
HV Horizontal-Vertical
IA Pro Image Analyst Pro
LCC Lambert Conformal Conic
LUT Look-Up Table
NTDB National Topographic Data Base
NWP Northwest Passage
R&D Research & Development
SAR Synthetic Aperture Radar
SGX SAR Geocoded extra-fine resolution
SLC Single look complex
SRTM1 Shuttle Radar Topography Mission Level 1
UTC Coordinated Universal Time
UTM Universal Transverse Mercator

50 DRDC Ottawa CR 2013-116
This page intentionally left blank.

DOCUMENT CONTROL DATA (Security classification of title, body of abstract and indexing annotation must be entered when the overall document is classified)
(The name and address of the organization preparing the document. Organizations for whom the document was prepared, e.g. Centre sponsoring a contractor's report, or tasking agency, are entered in section 8.)
(Overall security classification of the document including special warning terms if applicable.)
June 2010
(The complete document title as indicated on the title page. Its classification should be indicated by the appropriate abbreviation (S, C or U) in parentheses after the title.)
of the Northwest Passage(last name, followed by initials – ranks, titles, etc. not to be used)
(Month and year of publication of document.)
Octo
(Total containing information, including Annexes, Appendices, etc.)
8
(Total cited in document.)
5(The category of the document, e.g. technical report, technical note or memorandum. If appropriate, enter the type of report,
e.g. interim, progress, summary, annual or final. Give the inclusive dates when a specific reporting period is covered.)
(The name of the department project office or laboratory sponsoring the research and development – include address.)
(If appropriate, the applicable research and development project or grant number under which the document was written. Please specify whether project or grant.)
(If appropriate, the applicable number under which the document was written.)
(The official document number by which the document is identified by the originating activity. This number must be unique to this document.)
(Any other numbers which may be assigned this document either by the originator or by the sponsor.)
Ottawa CR 2013-116 (Any limitations on further dissemination of the document, other than those imposed by security classification.)
(Any limitation to the bibliographic announcement of this document. This will normally correspond to the Document Availability (11). However, where further distribution (beyond the audience specified in (11) is possible, a wider announcement audience may be selected.))
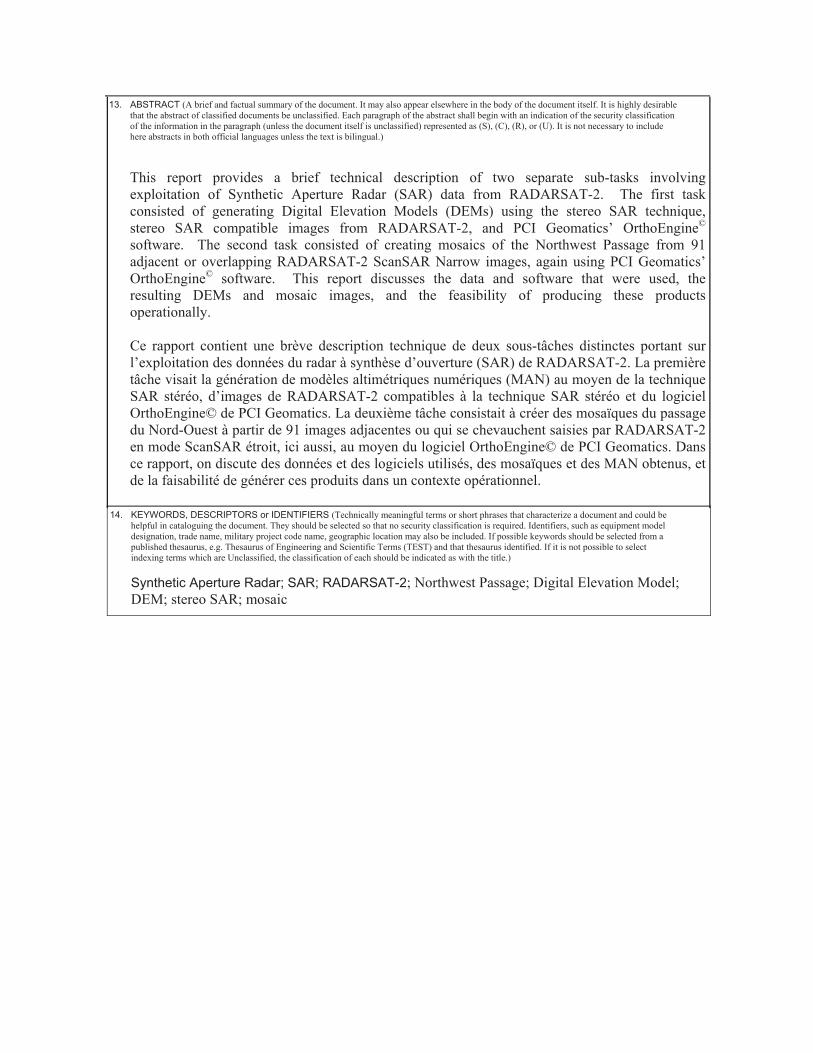
(A brief and factual summary of the document. It may also appear elsewhere in the body of the document itself. It is highly desirable that the abstract of classified documents be unclassified. Each paragraph of the abstract shall begin with an indication of the security classification of the information in the paragraph (unless the document itself is unclassified) represented as (S), (C), (R), or (U). It is not necessary to include here abstracts in both official languages unless the text is bilingual.)
This report provides a brief technical description of two separate sub-tasks involving exploitation of Synthetic Aperture Radar (SAR) data from RADARSAT-2. The first task consisted of generating Digital Elevation Models (DEMs) using the stereo SAR technique, stereo SAR compatible images from RADARSAT-2, and PCI Geomatics’ OrthoEngine©
software. The second task consisted of creating mosaics of the Northwest Passage from 91 adjacent or overlapping RADARSAT-2 ScanSAR Narrow images, again using PCI Geomatics’ OrthoEngine© software. This report discusses the data and software that were used, the resulting DEMs and mosaic images, and the feasibility of producing these products operationally.
Ce rapport contient une brève description technique de deux sous-tâches distinctes portant sur l’exploitation des données du radar à synthèse d’ouverture (SAR) de RADARSAT-2. La première tâche visait la génération de modèles altimétriques numériques (MAN) au moyen de la technique SAR stéréo, d’images de RADARSAT-2 compatibles à la technique SAR stéréo et du logiciel OrthoEngine© de PCI Geomatics. La deuxième tâche consistait à créer des mosaïques du passage du Nord-Ouest à partir de 91 images adjacentes ou qui se chevauchent saisies par RADARSAT-2 en mode ScanSAR étroit, ici aussi, au moyen du logiciel OrthoEngine© de PCI Geomatics. Dans ce rapport, on discute des données et des logiciels utilisés, des mosaïques et des MAN obtenus, et de la faisabilité de générer ces produits dans un contexte opérationnel.
(Technically meaningful terms or short phrases that characterize a document and could be helpful in cataloguing the document. They should be selected so that no security classification is required. Identifiers, such as equipment model designation, trade name, military project code name, geographic location may also be included. If possible keywords should be selected from a published thesaurus, e.g. Thesaurus of Engineering and Scientific Terms (TEST) and that thesaurus identified. If it is not possible to select indexing terms which are Unclassified, the classification of each should be indicated as with the title.)
; Northwest Passage; Digital Elevation Model; DEM; stereo SAR; mosaic

