radar imaging and physical characterization of...
TRANSCRIPT

Icarus 226 (2013) 323–335
Contents lists available at SciVerse ScienceDirect
Icarus
journal homepage: www.elsevier .com/locate / icarus
Radar imaging and physical characterization of near-Earth Asteroid(162421) 2000 ET70
0019-1035/$ - see front matter � 2013 Elsevier Inc. All rights reserved.http://dx.doi.org/10.1016/j.icarus.2013.05.025
⇑ Corresponding author. Address: Department of Earth and Space Sciences,University of California, Los Angeles, 595 Charles Young Drive East, 5656 GeologyBuilding, Los Angeles, CA90095, USA.
E-mail address: [email protected] (S.P. Naidu).1 Present address: National Radio Astronomy Observatory, 1003 Lopezville Road,
Socorro, NM 87801, USA.
Shantanu P. Naidu a,⇑, Jean-Luc Margot a,b, Michael W. Busch a,1, Patrick A. Taylor c, Michael C. Nolan c,Marina Brozovic d, Lance A.M. Benner d, Jon D. Giorgini d, Christopher Magri e
a Department of Earth and Space Sciences, University of California, Los Angeles, 595 Charles Young Drive East, Los Angeles, CA 90095, USAb Department of Physics and Astronomy, University of California, Los Angeles, 430 Portola Plaza, Los Angeles, CA 90095, USAc Arecibo Observatory, HC3 Box 53995, Arecibo, PR 00612, USAd Jet Propulsion Laboratory, California Institute of Technology, Pasadena, CA 91109-8099, USAe University of Maine at Farmington, 173 High Street, Preble Hall, Farmington, ME 04938, USA
a r t i c l e i n f o
Article history:Received 28 January 2013Revised 17 May 2013Accepted 20 May 2013Available online 10 June 2013
Keywords:Near-Earth objectsAsteroidsRadar observationsOrbit determination
a b s t r a c t
We observed near-Earth Asteroid (162421) 2000 ET70 using the Arecibo and Goldstone radar systemsover a period of 12 days during its close approach to the Earth in February 2012. We obtained continuouswave spectra and range-Doppler images with range resolutions as fine as 15 m. Inversion of the radarimages yields a detailed shape model with an effective spatial resolution of 100 m. The asteroid has over-all dimensions of 2.6 km � 2.2 km � 2.1 km (5% uncertainties) and a surface rich with kilometer-scaleridges and concavities. This size, combined with absolute magnitude measurements, implies an extre-mely low albedo (�2%). It is a principal axis rotator and spins in a retrograde manner with a sidereal spinperiod of 8.96 ± 0.01 h. In terms of gravitational slopes evaluated at scales of 100 m, the surface seemsmostly relaxed with over 99% of the surface having slopes less than 30�, but there are some outcropsat the north pole that may have steeper slopes. Our precise measurements of the range and velocity ofthe asteroid, combined with optical astrometry, enables reliable trajectory predictions for this potentiallyhazardous asteroid in the interval 460–2813.
� 2013 Elsevier Inc. All rights reserved.
1. Introduction et al., 2003; Nugent et al., 2012; Lowry et al., 2007; Taylor et al.,
Radar astronomy is arguably the most powerful Earth-basedtechnique for characterizing the physical properties of near-Earthasteroids (NEAs). Radar observations routinely provide imageswith decameter spatial resolution. These images can be used to ob-tain accurate astrometry, model shapes, measure near-surface ra-dar scattering properties, and investigate many other physicalproperties (e.g. sizes, spin states, masses, densities). Radar observa-tions have led to the discovery of asteroids exhibiting non-princi-pal axis rotation (e.g., Ostro et al., 1995; Benner et al., 2002),binary and triple NEAs (e.g., Margot et al., 2002; Ostro et al.,2006; Shepard et al., 2006; Nolan et al., 2008; Brozovic et al.,2011), and contact binary asteroids (e.g., Hudson and Ostro,1994; Benner et al., 2006; Brozovic et al., 2010). Radar-derivedshapes and spins have been used to investigate various physicalprocesses (Yarkovsky, YORP, BYORP, tides, librations, precession,etc.) that are important to the evolution of NEAs (e.g., Chesley
2007; Ostro et al., 2006; Scheeres et al., 2006; Taylor and Margot,2011; Fang et al., 2011; Fang and Margot, 2012).
Here we present the radar observations and detailed physicalcharacterization of NEA (162421) 2000 ET70. This Aten asteroid(a = 0.947 AU, e = 0.124, i = 22.3�) was discovered on March 8,2000 by the Lincoln Near-Earth Asteroid Research (LINEAR) programin Socorro, New Mexico. Its absolute magnitude was reported to be18.2 (Whiteley, 2001) which, for typical optical albedos between 0.4and 0.04, suggests a diameter between 0.5 and 1.5 km. Recent anal-ysis of the astrophotometry yields absolute magnitude values thatare comparable (Williams, 2012). Alvarez et al. (2012) obtained alightcurve of the asteroid during its close approach to the Earth inFebruary 2012. They reported a lightcurve period of8.947 ± 0.001 h and a lightcurve amplitude of 0.60 ± 0.07. Using vis-ible photometry, Whiteley (2001) classified 2000 ET70 as an X-typeasteroid in the Tholen (1984) taxonomy. The Tholen X class is adegenerate group of asteroids consisting of E, M, and P classes, whichare distinguished by albedo. Mike Hicks (personal communication)used visible spectroscopy and indicated that his observations bestmatched a C-type or possibly an E-type. Using spectral observationscovering a wavelength range of 0.8–2.5 lm in addition to the visibledata, Ellen Howell (personal communication) classified it as Xk inthe taxonomic system of Bus-DeMeo (DeMeo et al., 2009).
324 S.P. Naidu et al. / Icarus 226 (2013) 323–335
2. Observations and data processing
We observed 2000 ET70 from February 12, 2012 to February 17,2012 using the Arecibo S-band (2380 MHz, 13 cm) radar and fromFebruary 15, 2012 to February 23, 2012 using the Goldstone X-band (8560 MHz, 3.5 cm) radar. The asteroid moved �74 degreesacross the sky during this time and it came closest to Earth on Feb-ruary 19 at a distance of �0.045 Astronomical Units (AU). We ob-served it again in August 2012 when it made another closeapproach to Earth at a distance of �0.15 AU.
Radar observing involved transmitting a radio wave for approx-imately the round-trip light-time (RTT) to the asteroid, �46 s atclosest approach, and then receiving the echo reflected back fromthe target for a comparable duration. Each transmit-receive cycleis called a run. On each day we carried out runs with a monochro-matic continuous wave (CW) to obtain Doppler spectra, followedby runs with a modulated carrier to obtain range-Doppler images.CW data are typically used to measure total echo power and fre-quency extent, whereas range-Doppler images are typically usedto resolve the target in two dimensions. Table 1 summarizes theCW and range-Doppler imaging runs.
For CW runs a carrier wave at a fixed frequency was transmittedfor the RTT to the asteroid. The received echo from the asteroid wasdemodulated, sampled, and recorded. A fast Fourier transform(FFT) was applied to each echo timeseries to obtain the CW spectra.The total frequency extent (Df) or bandwidth (BW) of the CW spec-tra is equal to the sampling frequency (fs) or the reciprocal of thesampling period (Ps):
Df ¼ fs ¼1Ps: ð1Þ
The spectral resolution (df) is given by:
df ¼ Dfn; ð2Þ
where n is the FFT length. Finer spectral resolution can be achieved byincreasing n, however the signal-to-noise ratio (SNR) in each frequencybin decreases as 1=
ffiffiffinp
. The finestpossible resolution that can be achievedis limited by the number of samples obtained in one run. If we wererecording for the full duration of the RTT, the number of samples obtainedin one run would be n = RTT� fs, and the resolution would be df = 1/RTT.In reality we cannot transmit for a full RTT as it takes several seconds toswitch between transmission and reception, so the finest possible resolu-tion is df = 1/(RTT� tswitch), where tswitch is the switching time.
For range-Doppler imaging two different pulse compression tech-niques were used to achieve fine range resolution while maintainingadequate SNR (Peebles, 2007). Pulse compression is a signal condi-tioning and processing technique used in radar systems to achieve ahigh range resolution without severely compromising the ability todetect or image the target. The range resolution achievable by a radaris proportional to the pulse duration, or, equivalently, inversely pro-portional to the effective bandwidth of the transmitted signal. How-ever, decreasing the pulse duration reduces the total transmittedenergy per pulse and hence it negatively affects the ability to detectthe radar target. Pulse compression techniques allow for the transmis-sion of a long pulse while still achieving the resolution of a short pulse.
2.1. Pulse compression using binary phase coding (BPC)
We used binary codes to produce range-Doppler images of theasteroid at both Arecibo and Goldstone. In this technique we modu-lated the transmitted carrier with a repeating pseudo-random codeusing binary phase shift keying (BPSK). The code contains N elementsor bauds and the duration of each baud is Tbaud. The duration of thecode is called the pulse repetition period (PRP = N � Tbaud). The effec-tive bandwidth of the transmitted signal (Beff) is given by 1/Tbaud. For
each run we transmitted for approximately the RTT to the asteroid,followed by reception for a similar duration. The received signal wasdemodulated and then decoded by cross-correlating it with a replicaof the transmitted code. The images span a range (Dr) given by:
Dr ¼ c2
PRP; ð3Þ
and their range resolution (dr) is given by:
dr ¼ c2
Tbaud ¼c2
1Beff
; ð4Þ
where c is the speed of light. Each baud within the code eventuallymaps into a particular range bin in the image. Resolution in the fre-quency or Doppler dimension was obtained in each range bin by per-forming a FFT on the sequence of returns corresponding to that bin.The total frequency extent (Df) or bandwidth (BW) of the image is equalto the pulse repetition frequency (PRF) or the reciprocal of the PRP:
Df ¼ PRF ¼ 1PRP
: ð5Þ
The frequency resolution (df) of the image depends on the FFTlength (n) as follows:
df ¼ Dfn: ð6Þ
The RTT dictates the finest frequency resolution achievable, similarto the situation with CW spectra.
2.2. Pulse compression using linear frequency modulation (Chirp)
We also used a linear frequency modulation technique (Margot,2001; Peebles, 2007) to produce range-Doppler images of the asteroidat Goldstone. Only a fraction of the images were obtained in this modebecause this new capability is still in the commissioning phase. Chirpwaveforms allow us to maximize the bandwidth of the transmittedsignal and to obtain better range resolution than that available withBPC waveforms. They are also less susceptible to degradation due tothe Doppler spread of the targets. Finally, they are more amenableto the application of windowing functions that can be used to tradebetween range resolution and range sidelobe level (Margot, 2001).
In this technique the carrier was frequency modulated with alinear ramp signal. The resultant signal had a frequency that variedlinearly with time from x0�x to x0 + x, where x0 is the carrierfrequency and Beff = 2x is the effective bandwidth of the signal.The resultant signal is called a chirp. A repeating chirp was transmit-ted with 100% duty cycle for the duration of the round-trip light-timeto the asteroid. The time interval between the transmission of twoconsecutive chirps is the PRP. For our observations we used PRPs of125 ls and 50 ls for chirps with Beff = 2 MHz and Beff = 5 MHz,respectively. The received signal was demodulated and range com-pression was achieved by cross-correlating the echo with a replicaof the transmitted signal. The range extent and the range resolutionof the chirp images are given by Eqs. (3) and (4), respectively. Reso-lution in the frequency or Doppler dimension was obtained as in thebinary coding technique. The bandwidth of the image is given by Eq.(5) and the frequency resolution is given by Eq. (6).
3. Astrometry and orbit
A radar astrometric measurement consists of a range or Dopplerestimate of hypothetical echoes from the center of mass (COM) ofthe object at a specified coordinated universal time (UTC). In prac-tice we used our measurements of the position of the leading edgeof the echoes and our estimates of the object’s size to report preli-minary COM range estimates and uncertainties. We refined thoseestimates after we obtained a detailed shape model (Section 7).We measured Doppler astrometry from the CW spectra. Wereported 9 range estimates and 1 Doppler estimate during the

Table 12000 ET70 radar observations log.
Tel UT date(yyyy–mm–dd)
MJD Eph RTT(s)
PTX(kW)
dr(m)
df(Hz)
N Start–stop(hh:mm:ss–hh:mm:ss )
Runs Fig. 8key
A 2012–02–12 55969 s41 67 828 cw 0.167 None 08:27:51–08:37:55 5s41 15 0.075 65535 08:42:47–10:29:47 48 1–7s41 15 0.075 8191 10:53:18–11:09:55 8
A 2012–02–13 55970 s41 62 860 cw 0.182 None 08:11:06–08:23:08 6s43 15 0.075 65535 08:30:34–10:53:26 54 8–14
A 2012–02–14 55971 s43 58 811 cw 0.196 None 07:59:56–08:04:43 3s43 15 0.075 65535 08:06:40–10:19:45 59 15–22
A 2012–02–15 55972 s43 54 785 cw 0.213 None 07:43:02–07:47:29 3s43 15 0.075 65535 08:03:01–08:09:18 4s47 15 0.075 65535 08:16:38–10:09:46 60 23–29
G 2012–02–15 55972 s43 54 420 cw None 08:55:15–09:03:27 5s43 75 1.532 255 09:17:48–09:33:20 9s45 37.5 255 09:46:24–11:59:24 73s45 37.5 255 12:15:57–12:24:09 5
A 2012–02–16 55973 s51 51 760 cw 0.227 None 07:34:18–07:38:30 3s49 15 0.075 65535 07:40:56–07:46:52 4
cw None 07:48:38–07:51:06 2s49 15 0.075 65535 07:53:28–09:38:16 62 30–37
G 2012–02–16 55973 s49 51 420 cw None 09:15:46–09:23:30 5s49 75 1.532 255 09:56:39–10:02:39 4s49 37.5 0.488 None 11:35:21–11:46:33 7⁄
s49 15 1.0 None 12:15:54–12:47:10 18⁄ 43–44s49 15 1.0 None 13:10:01–13:28:09 11⁄ 45s49 15 1.0 None 13:29:04–15:29:31 70⁄ 46–53
A 2012–02–17 55974 s53 48 775 cw 0.244 None 07:38:00–07:41:57 3s53 15 0.075 65535 07:44:36–08:48:59 40 38–42
G 2012–02–17 55974 s53 48 420 cw None 07:05:53–07:13:10 5s53 75 1.532 255 07:42:55–08:00:01 11s53 37.5 0.977 None 08:16:57–12:24:19 152⁄ 54–65
G 2012–02–18 55975 s53 47 420 cw None 07:05:51–07:12:50 5s53 75 1.532 255 07:36:04–07:50:52 10s53 37.5 0.977 None 08:01:15–08:31:44 20⁄ 66s53 37.5 0.977 None 08:36:51–08:45:24 6⁄ 67
G 2012–02–19 55976 s55 46 420 cw None 07:05:51–07:12:41 5s55 75 1.532 255 07:21:55–07:36:25 10s55 37.5 0.977 None 07:46:12–11:13:58 136⁄ 68–76s55 37.5 0.977 None 11:44:10–13:07:06 55⁄ 77–80
G 2012–02–20 55977 s57 46 420 cw None 07:10:51–07:17:42 5s57 37.5 0.977 None 08:12:13–09:18:53 44⁄ 81–84s57 37.5 0.977 None 10:31:49–11:33:59 41⁄ 85–87s57 37.5 0.977 None 12:16:08–12:19:54 3⁄
G 2012–02–22 55979 s59 48 420 cw None 09:48:25–09:55:42 5s59 75 0.957 255 10:02:53–10:21:35 12s59 37.5 0.977 None 10:32:51–10:35:14 2⁄
s59 37.5 0.977 None 10:36:06–10:45:02 6⁄
G 2012–02–23 55980 s59 51 420 cw None 08:33:10–08:40:53 5s59 75 0.957 255 08:49:48–09:09:41 12s59 75 0.977 None 09:20:46–10:55:20 55⁄ 88–90
A 2012–08–24 56163 s72 153 721 cw None 15:10:51–15:18:25 2cw None 15:46:51–16:31:17 9150 0.954 8191 16:36:59–17:41:01 13
A 2012–08–26 56165 s72 157 722 cw None 15:04:24–16:20:38 15
Note: – The first column indicates the telescope: Arecibo Planetary Radar (A) or Goldstone Solar System Radar at DSS-14 (G). MJD is the modified Julian date of theobservation. Eph is the ephemeris solution number used (Section 3). RTT is the round-trip light-time to the target. PTX is the transmitter power. dr and df are the range andDoppler resolutions, respectively, of the processed data. N is the number of bauds or the length of the pseudo-random code used. The timespan of the received data is listed bytheir UT start and stop times. Runs is the number of transmit-receive cycles during the timespan. An asterisk (⁄) indicates chirp runs. Last column indicates the key to theimage numbers shown in Fig. 8.
S.P. Naidu et al. / Icarus 226 (2013) 323–335 325
course of the observing run and computed the heliocentric orbitusing the JPL on-site orbit determination software (OSOD). Theephemeris solution was updated each time new astrometric mea-surements were incorporated (Table 1). Using the best ephemerissolution at any given time minimizes smearing of the images.
At the end of our February observing campaign, we were usingephemeris solution 59. A final range measurement, obtained dur-ing the asteroid’s close approach in August 2012, was incorporatedto generate orbit solution 74. After the shape model was finalized,we updated the orbit to solution 76 by replacing the preliminaryFebruary astrometric measurements with more accurate shape-based estimates of the range to the center of mass (Table 2).
Table 3 lists the best fit orbital parameters (solution 76) gener-ated using 18 range measurements and 316 optical measurements.The optical measurements span February 1977 to December 2012.However we assigned 20 arcsec uncertainties to the two precoveryobservations from the 1977 La Silla-DSS plates, effectively removingtheir contribution to the fit and reducing the optical arc to the inter-val 2000–2012. The 1977 observations were from a single, hour-long, trailed exposure, and appear to have been reported with a�45 s timing error, consistent with the measurers’ cautionary note‘‘Start time and exposure length are uncertain’’ (MPEC 2000-L19).
The orbit computation is reliable over a period from the year 460to 2813. Beyond this interval either the 3r uncertainty of the Earth

Table 32000 ET70 heliocentric orbital elements (solution 76).
Element Value 1-r Uncertainty
Eccentricity 0.123620379 6.3 � 10�8
Semi-major axis (AU) 0.9466347364 1.2 � 10�9
Inclination (�) 22.3232174 1.2 � 10�6
Longitude of ascending node (�) 331.16730395 9.8 � 10�7
Argument of perihelion (�) 46.106698 1.1 � 10�5
Mean anomaly (�) 84.37370818 4.2 � 10�7
Note. All orbital elements are specified at epoch 2012 December 15.0 barycentricdynamical time (TDB) in the heliocentric ecliptic reference frame of J2000. Thecorresponding orbital period is (336.41246710 ± 5.5 � 10�7) days.
326 S.P. Naidu et al. / Icarus 226 (2013) 323–335
close approach time (evaluated whenever the close approach distanceis less than 0.1 AU) exceeds 10 days or the 3r uncertainty of theEarth close approach distance exceeds 0.1 AU. The current MinimumOrbit Intersection Distance (MOID) with respect to Earth is 0.03154 AU,making 2000 ET70 a potentially hazardous asteroid (PHA).
4. Radar scattering properties
We transmitted circularly polarized waves and used two sepa-rate channels to receive echoes having the same circular (SC) andthe opposite circular (OC) polarization as that of the transmittedwave (Ostro, 1993). Reflections from a plane surface reverse thepolarization of the incident waves and most of the echo power isexpected in the OC polarization. Echo power in the SC polarizationis due to multiple reflections or reflections from structures withwavelength-scale roughness at the surface or sub-surface. A higherratio of SC to OC power therefore indicates a greater degree ofnear-surface wavelength-scale roughness or multiple scattering.It is worth noting that while a larger SC to OC ratio implies a rough-er surface, there is a compositional component at well (Benneret al., 2008). This circular polarization ratio is often denoted by lC.We measured lC for all the Arecibo spectra shown in Fig. 1 andcomputed an average value of lC = 0.21 ± 0.02, where the uncer-tainty is the standard deviation of the individual estimates. Ob-served ratios for individual spectra deviate no more than 0.03from the average. This ratio is lower than that for the majority ofNEAs with known circular polarization ratios (Mean = 0.34 ± 0.25,Median = 0.26) (Benner et al., 2008) suggesting that 2000 ET70has a lower than average near-surface roughness at 10 cm scales.
The average radar albedo computed for the OC CW spectrashown in Fig. 1 is 0.063 ± 0.017, where the uncertainty is thestandard deviation of individual estimates. The radar albedo isthe ratio of the radar cross-section to the geometric cross-sectionalarea of the target. The radar cross-section is the projected area of aperfectly reflective isotropic scatterer that would return the samepower at the receiver as the target.
In our modeling of the shape of the asteroid (Sections 6 and 7),we used a cosine law to represent the radar scattering properties of2000 ET70:
drdA¼ RðC þ 1Þðcos aÞ2C
: ð7Þ
Table 22000 ET70 range measurements.
Date (UTC)(yyyy–mm–ddhh:mm:ss)
Range(ls)
1-rUncertainty(ls)
Observatory
2012–02–12 08:50:00 67220894.76 0.5 A2012–02–12 10:03:00 66974197.50 0.5 A2012–02–13 09:11:00 62452848.06 0.5 A2012–02–13 10:00:00 62298918.42 0.5 A2012–02–14 09:28:00 58061903.74 0.5 A2012–02–14 10:06:00 57953990.18 0.5 A2012–02–14 10:16:00 57925824.25 0.5 A2012–02–15 08:30:00 54319877.92 0.5 A2012–02–15 09:20:00 54206358.81 3.0 G2012–02–15 09:47:00 54126135.16 0.5 A2012–02–16 08:23:00 50979848.61 0.5 A2012–02–16 09:30:00 50840187.02 0.5 A2012–02–17 08:05:00 48327621.88 0.5 A2012–02–17 08:43:00 48267222.55 0.5 A2012–02–18 07:40:00 46481930.28 2.0 G2012–02–19 07:30:00 45481292.56 2.0 G2012–02–20 10:10:00 45483470.81 2.0 G2012–08–24 17:08:00 153139162.28 3.0 A
Note. This table lists shape-based estimates of the range to the asteroid COM. Thefirst column indicates the coordinated universal time (UTC) of the measurementepoch. The second column gives the ranges expressed as the RTT to the asteroid inmicroseconds (ls). The third column lists the 1r range uncertainty. The fourthcolumn indicates the radar used to make the measurement. A stands for the AreciboPlanetary Radar and G stands for the Goldstone Solar System Radar at DSS-14.
Here r is the radar cross section, A is the target surface area, R is theFresnel reflectivity, C is a parameter describing the wavelength-scale roughness, and a is the incidence angle. Values of C close to1 represent diffuse scattering, whereas larger values represent morespecular scattering (Mitchell et al., 1996). For specular scattering, Cis related to the wavelength-scale adirectional root-mean-square(RMS) slope S0 and angle hrms of the surface by S0 = tan(hrms) = C�1/2.
5. Range and Doppler extents
The range extent of the object in the radar images varies be-tween �600 m and �1700 m (Fig. 8), suggesting that the asteroidis significantly elongated. In most of the images two distinct ridgesthat surround a concavity are clearly visible (e.g., Fig. 8, images 8–12 and images 30–37). In images where the ridges are aligned withthe Doppler axis, they span almost the entire bandwidth extent ofthe asteroid (e.g., Fig. 8, images 11 and 34). If the concavity is acrater then these ridges could mark its rim. At particular viewinggeometries, the trailing end of the asteroid exhibits a large outcropwith a range extent of �250 m (e.g., Fig. 8, image 11). Thesefeatures suggest that the overall surface of the asteroid is highlyirregular at scales of hundreds of meters.
For a spherical object, the bandwidth (B) of the radar echo is gi-ven by:
B ¼ 4pDkP
cos d: ð8Þ
Here D is the diameter of the object, P is its apparent spin period, k isthe radar wavelength, and d is the sub-radar latitude. As d increases,B decreases. In images obtained at similar rotational phases, the band-width extent of the asteroid increased from February 12 to 20, indicat-ing that our view was more equatorial towards the end of theobserving campaign (Fig. 2). For example in Fig. 8, images 10, 33,and 68 are at similar rotational phases and their bandwidths (basedon a 2380 MHz carrier) are�3.7 Hz,�4.9 Hz, and�6.3 Hz, respectively.
6. Spin vector
We used the SHAPE software (Hudson, 1993; Magri et al., 2007)to fit a shape model to the radar images and to estimate the spinvector of 2000 ET70. Since SHAPE is not particularly effective at fit-ting the spin axis orientation and spin period of the shape model, wecarried out an extensive search for these parameters in an iterativemanner. We performed two iterations each in our search for the spinaxis orientation and spin period, where the result of each step pro-vides initial conditions for the next optimization step. This approachleads to increased confidence that a global minimum is reached.
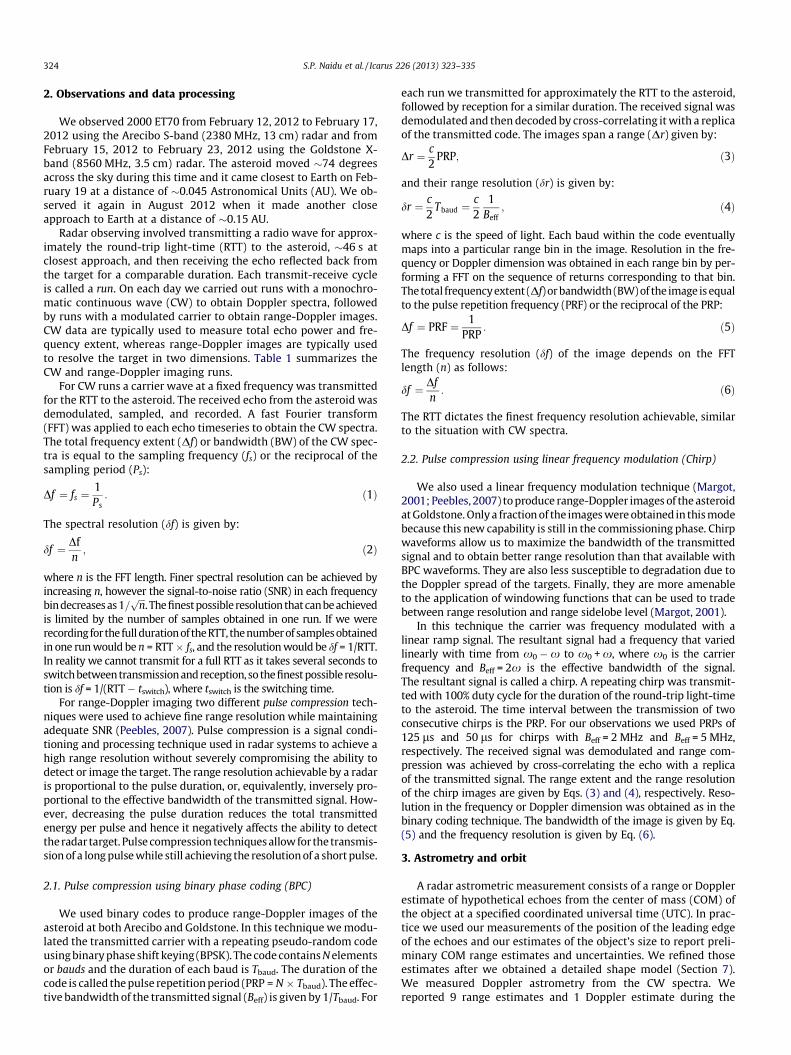
Our initial estimate of the spin period came from the time inter-val between repeating rotational phases of the object captured inthe images. Fig. 3 shows the object at similar orientations inimages taken on different days. The time interval in two of thosecases is �72 h and in the third case is �45 h. This indicates thatthe spin period of the object is close to a common factor of thetwo, that is, 9 h or a sub-multiple of 9 h. Fig. 4 shows two images

Fig. 1. Arecibo CW spectra of 2000 ET70 arranged in chronological order from left to right and top to bottom. They were obtained on February 12–17 (MJDs 55969.35,55970.34, 55971.33, 55972.32, 55973.32, 55974.32, respectively). The frequency resolution of each spectrum is given at the top right of the corresponding panel. Eachspectrum was produced by choosing a frequency resolution that allowed for the incoherent sum of 10 independent spectra, or looks, per run, and by summing over 3 runs,resulting in a total number of 30 looks. The solid and dashed lines are observed OC and SC spectra, respectively. The dot-dashed line shows the corresponding synthetic OCspectra generated using our shape model (Section 7). The circular polarization ratio (lC) values in chronological order are 0.18, 0.20, 0.24, 0.21, 0.21, and 0.24 all of which haveuncertainties of 5%, where the uncertainty is computed according to Ostro et al. (1983). The OC radar albedo values in chronological order are 0.091, 0.063, 0.073, 0.056, 0.051,and 0.044 all of which have uncertainties of 25%. The reduced chi-squares of the fits to the OC spectra vary between 0.69 to 0.72.
S.P. Naidu et al. / Icarus 226 (2013) 323–335 327
taken 22.5 h apart and the object is not close to similar orientationsin these two images, ruling out all periods that are factors of 22.5 h.Thus we are left with a period close to 3 h or 9 h. Images obtainedover observing runs longer than 3 h do not show a full rotation ofthe asteroid, ruling out a spin period of 3 h.
Using an initially fixed spin period of 9 h, we performed an exten-sive search for the spin axis orientation. The search consisted of fit-ting shape models to the images under various assumptions for thespin axis orientation. We covered the entire celestial sphere withuniform angular separations of 15� between neighboring trial poles.
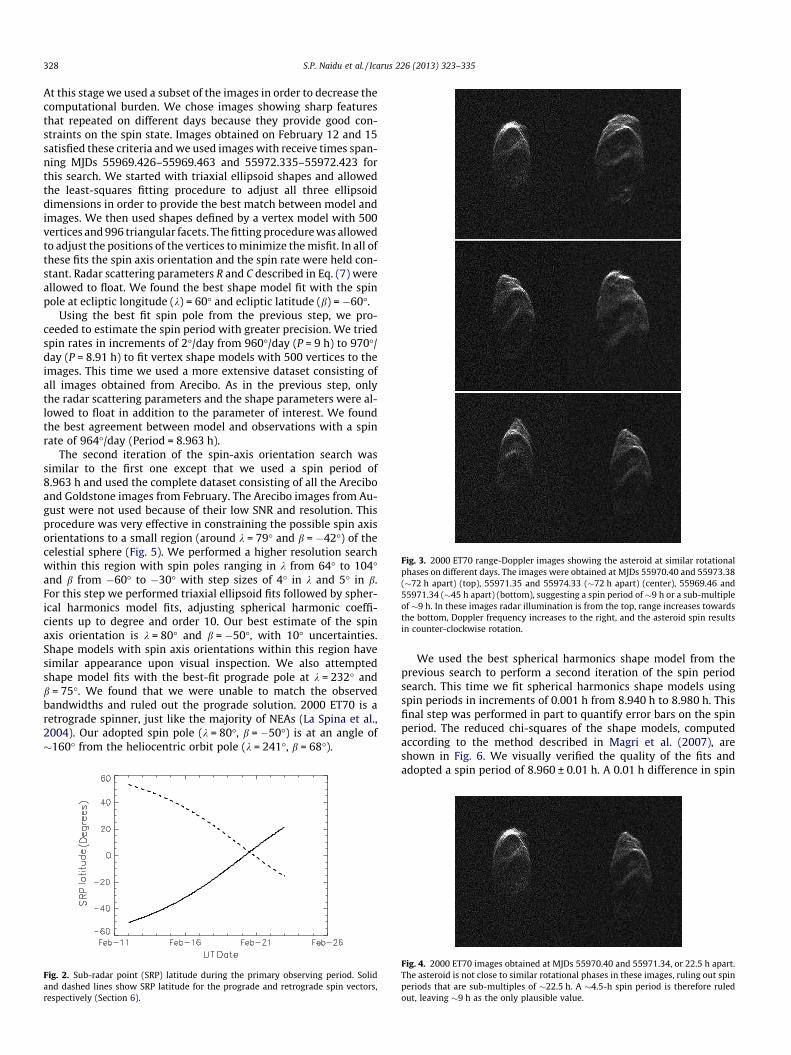
Fig. 3. 2000 ET70 range-Doppler images showing the asteroid at similar rotationalphases on different days. The images were obtained at MJDs 55970.40 and 55973.38(�72 h apart) (top), 55971.35 and 55974.33 (�72 h apart) (center), 55969.46 and55971.34 (�45 h apart) (bottom), suggesting a spin period of �9 h or a sub-multipleof �9 h. In these images radar illumination is from the top, range increases towardsthe bottom, Doppler frequency increases to the right, and the asteroid spin resultsin counter-clockwise rotation.
328 S.P. Naidu et al. / Icarus 226 (2013) 323–335
At this stage we used a subset of the images in order to decrease thecomputational burden. We chose images showing sharp featuresthat repeated on different days because they provide good con-straints on the spin state. Images obtained on February 12 and 15satisfied these criteria and we used images with receive times span-ning MJDs 55969.426–55969.463 and 55972.335–55972.423 forthis search. We started with triaxial ellipsoid shapes and allowedthe least-squares fitting procedure to adjust all three ellipsoiddimensions in order to provide the best match between model andimages. We then used shapes defined by a vertex model with 500vertices and 996 triangular facets. The fitting procedure was allowedto adjust the positions of the vertices to minimize the misfit. In all ofthese fits the spin axis orientation and the spin rate were held con-stant. Radar scattering parameters R and C described in Eq. (7) wereallowed to float. We found the best shape model fit with the spinpole at ecliptic longitude (k) = 60� and ecliptic latitude (b) = �60�.
Using the best fit spin pole from the previous step, we pro-ceeded to estimate the spin period with greater precision. We triedspin rates in increments of 2�/day from 960�/day (P = 9 h) to 970�/day (P = 8.91 h) to fit vertex shape models with 500 vertices to theimages. This time we used a more extensive dataset consisting ofall images obtained from Arecibo. As in the previous step, onlythe radar scattering parameters and the shape parameters were al-lowed to float in addition to the parameter of interest. We foundthe best agreement between model and observations with a spinrate of 964�/day (Period = 8.963 h).
The second iteration of the spin-axis orientation search wassimilar to the first one except that we used a spin period of8.963 h and used the complete dataset consisting of all the Areciboand Goldstone images from February. The Arecibo images from Au-gust were not used because of their low SNR and resolution. Thisprocedure was very effective in constraining the possible spin axisorientations to a small region (around k = 79� and b = �42�) of thecelestial sphere (Fig. 5). We performed a higher resolution searchwithin this region with spin poles ranging in k from 64� to 104�and b from �60� to �30� with step sizes of 4� in k and 5� in b.For this step we performed triaxial ellipsoid fits followed by spher-ical harmonics model fits, adjusting spherical harmonic coeffi-cients up to degree and order 10. Our best estimate of the spinaxis orientation is k = 80� and b = �50�, with 10� uncertainties.Shape models with spin axis orientations within this region havesimilar appearance upon visual inspection. We also attemptedshape model fits with the best-fit prograde pole at k = 232� andb = 75�. We found that we were unable to match the observedbandwidths and ruled out the prograde solution. 2000 ET70 is aretrograde spinner, just like the majority of NEAs (La Spina et al.,2004). Our adopted spin pole (k = 80�, b = �50�) is at an angle of�160� from the heliocentric orbit pole (k = 241�, b = 68�).
Fig. 2. Sub-radar point (SRP) latitude during the primary observing period. Solidand dashed lines show SRP latitude for the prograde and retrograde spin vectors,respectively (Section 6).
We used the best spherical harmonics shape model from theprevious search to perform a second iteration of the spin periodsearch. This time we fit spherical harmonics shape models usingspin periods in increments of 0.001 h from 8.940 h to 8.980 h. Thisfinal step was performed in part to quantify error bars on the spinperiod. The reduced chi-squares of the shape models, computedaccording to the method described in Magri et al. (2007), areshown in Fig. 6. We visually verified the quality of the fits andadopted a spin period of 8.960 ± 0.01 h. A 0.01 h difference in spin
Fig. 4. 2000 ET70 images obtained at MJDs 55970.40 and 55971.34, or 22.5 h apart.The asteroid is not close to similar rotational phases in these images, ruling out spinperiods that are sub-multiples of �22.5 h. A �4.5-h spin period is therefore ruledout, leaving �9 h as the only plausible value.

Fig. 5. Contour plot showing goodness of fit (reduced chi-square) of shape model fits under various assumptions for the ecliptic longitude (k) and ecliptic latitude (b) of thespin axis. The spin period was fixed at 8.963 h for the fits. We adopted a best fit spin axis orientation of k = 80� and b = �50� with a 10� uncertainty.
Fig. 6. Goodness of fit (reduced chi-square) of degree-and-order 10 sphericalharmonics shape models of 2000 ET70 as a function of assumed spin period. Thespin pole was fixed at k = 80� and b = �50� for the fits. We adopted a best fit spinperiod of 8.960 ± 0.01 h.
S.P. Naidu et al. / Icarus 226 (2013) 323–335 329
period amounts to a �13� offset in rotational phase over the pri-mary observing window which is detectable.
7. Shape model
As a starting point for our final shape modeling efforts we used theresults of the spin state determination (Section 6), specifically the best-fit spherical harmonics shape model with a spin period of 8.960 h and aspin pole at k = 80� and b =�50�. We proceeded to fit all the radarimages obtained in February and OC CW spectra from Fig. 1 with a ver-tex model having 2000 vertices and 3996 facets. The number of verticesis based on experience and the desire to reproduce detectable featureswithout over-interpretation. At this step the vertex locations and theradar scattering parameters were fit for, but the spin vector was heldfixed. Observed images were summed to improve their SNR. AtArecibo,8 images were typically combined. At Goldstone, 14, 9, 13, 13, 14, 12, 6,and 12 images were typically combined on February 15, 16, 17, 18, 19,20, 22, and 23, respectively. We cropped the images so that sufficientsky background remained for the computation of noise statistics, butthe optimization procedure is robust against the amount of sky back-ground. We minimized an objective function that consists of the sumof squares of residuals between model and actual images, plus a num-ber of weighted penalty functions designed to favor models with uni-form density, principal axis rotation, and a reasonably smoothsurface (Hudson, 1993; Magri et al., 2007). The choice of weights inthe penalty function is subjective, so the shape model solution is notunique. We tried to restrict the weights to the minimum value at whichthe penalty functions were effective. The minimization procedure withour choice of penalty functions produced a detailed shape model for2000 ET70 (Fig. 7 and Table 4). The agreement between model and datais generally excellent but minor disagreements are observed (Figs. 8and 1). The overall shape is roughly a triaxial ellipsoid with extentsalong the principal axes of�2.61 km,�2.22 km, and�2.04 km, whichare roughly the same as the dynamically equivalent equal volume ellip-soid (DEEVE) dimensions listed in Table 4.
The region around the north pole has two ridges that are 1–1.5 km in length and almost 100 m higher than their surroundings.These ridges enclose a concavity that seems more asymmetric thanmost impact craters. Along the negative x-axis a large protrusion isvisible. Such a feature could arise if the asteroid were made up ofmultiple large components resting on each other.
NEAs in this size range for which radar shape models exist com-monly exhibit irregular features such as concavities and ridges. Afew examples include Golevka (Hudson et al., 2000), 1992 SK(Busch et al., 2006), and 1998 WT24 (Busch et al., 2008). The
concavities observed on these NEAs cannot be adequately capturedby convex-only shape modeling techniques.
For this shape model, the best fit values for the radar scatteringparameters, R and C, were 1.9 and 1.4, respectively (Section 4). Thisvalue of C indicates that 2000 ET70 is a diffuse scatterer, simlar toother NEAs such as Geographos (Hudson and Ostro, 1999), Golevka(Hudson et al., 2000), and 1998 ML14 (Ostro et al., 2001). NEAs aregenerally expected to be diffuse scatterers at radar wavelengthsbecause of their small sizes and rough surfaces. Attempts to fitthe echoes with a two-component scattering law (diffuse plusspecular) did not yield significantly better results.
8. Gravitational environment
We used our best-fit shape model and a uniform densityassumption of 2000 kg m�3, a reasonable density for rubble-pileNEAs, (e.g., Ostro et al., 2006), to compute the gravity field at thesurface of the asteroid (Werner and Scheeres, 1997). The accelera-tion on the surface is the sum of the gravitational acceleration dueto the asteroid’s mass and the centrifugal acceleration due to theasteroid’s spin. An acceleration vector was computed at the centerof each facet. Fig. 9 shows the variation of the magnitude of thisacceleration over the surface of the asteroid. The acceleration onthe surface varies between 0.54 mm s�2 to 0.64 mm s�2, which isfour orders of magnitude smaller than that experienced on Earthand two orders of magnitude smaller than that on Vesta. Centrifu-

Fig. 7. Best-fit vertex shape model of 2000 ET70 as seen along the three principal axes x, y, and z. For principal axis rotation the spin axis is aligned with the z axis. Yellowregions at the south pole have radar incidence angles >60� and hence are not well constrained. The shape model has 2000 vertices and 3996 triangular facets giving aneffective surface resolution of �100 m. (For interpretation of the references to color in this figure legend, the reader is referred to the web version of this article.)
Table 42000 ET70 shape model parameters.
Parameters Value
Extents along principal axes (km) x 2.61 ± 5%y 2.22 ± 5%z 2.04 ± 5%
Surface area (km2) 16.7 ± 10%Volume (km3) 6.07 ± 15%Moment of inertia ratios A/C 0.800 ± 10%
B/C 0.956 ± 10%Equivalent diameter (km) 2.26 ± 5%DEEVE extents (km) x 2.56 ± 5%
y 2.19 ± 5%z 2.07 ± 5%
Spin pole (k,b) (�) (80,�50) ± 10Sidereal spin period (h) 8.96 ± 0.01
Note. The shape model consists of 2000 vertices and 3996 triangular facets, corre-sponding to an effective surface resolution of �100 m. The moment of inertia ratioswere calculated assuming homogeneous density. Here A, B, and C are the principalmoments of inertia, such that A < B < C. Equivalent diameter is the diameter of asphere having the same volume as that of the shape model. A dynamically equivalentequal volume ellipsoid (DEEVE) is an ellipsoid with uniform density having the samevolume and moment of inertia ratios as the shape model.
330 S.P. Naidu et al. / Icarus 226 (2013) 323–335
gal acceleration makes a significant contribution to the total accel-eration and varies from zero at the poles to �0.049 mm s�2 (about10% of the total acceleration) on the most protruding regions of theequator. For comparison, on Earth, centrifugal acceleration contrib-utes less than 0.5% to the total acceleration at the equator.
Fig. 10 shows the gravitational slope variation over the asteroid’ssurface. The gravitational slope is the angle that the local gravita-tional acceleration vector makes with the inward pointing sur-face-normal vector. The average slope is 9.5�. Less than 1% of thesurface has slopes greater than 30�, the approximate angle of reposeof sand, indicating a relaxed surface. Slopes on the sides of the ridgesnear the north pole reach up to �33�, and the sides facing the northpole are steeper than the opposite sides. As a result of the highslopes, along-the-surface accelerations are a substantial fractionof the total acceleration, reaching values as high as 0.34 mm s�2.One might expect mass wasting to result from this gravitationalenvironment: the sides of the ridges may have competent rocks ex-posed at the surface, and the valley between the two ridges may beoverlain by a pond of accumulated regolith. A similar mass wastingprocess is hypothesized to have occurred on Eros (Zuber et al.,2000). The accumulation of fine-grained regolith could lower thewavelength-scale surface roughness locally and perhaps explainthe lower values of lC observed at higher SRP latitudes (Fig. 1). Asimilar trend in lC was observed in the Goldstone CW spectra.
9. Discussion
Whiteley (2001) and Williams (2012) estimated 2000 ET70’sabsolute magnitude (H) to be near 18.2. The geometric albedo(pV) of an asteroid is related to its effective diameter (D) and itsH value by (Pravec and Harris, 2007, and references therein):
pV ¼1329 km� 10�0:2H
D
" #2
: ð9Þ
Using Whiteley’s (2001) H = 18.2, the above equation yieldspV = 0.018 ± 0.002 for an asteroid with an effective diameter of2.26 km ± 5% (Fig. 11). This uncertainty on pV is due to the diameteruncertainty only. A geometric albedo near 2% is extremely low com-pared to the albedos of other NEAs (Thomas et al., 2011; Stuartet al., 2004). More common values of pV would require lower valuesof the absolute magnitude (e.g., pV = 0.04 requires H = 17.5). Therange of possible H and pV values that are consistent with the radar
size estimates is shown in Fig. 11. We conclude that 2000 ET70 haseither an extremely low albedo or unusual phase function.
Alvarez et al. (2012) observed the asteroid between February 19and 24, when the view was close to the equator, and reported alightcurve amplitude of 0.60 ± 0.07 mag. If the asteroid wasapproximated by a triaxial ellipsoid with uniform albedo, thisamplitude would suggest an elongation (ratio of equatorial axes)approximately between 1.28 and 1.36. Our shape model indicatesthat this ratio is �1.18, suggesting that either the ellipsoid approx-imation is poor, the lightcurve amplitude is on the lower end of therange above, shadowing due to the terrain is playing an importantrole, there are albedo variations over the surface of the asteroid, ora combination of these factors.
Alvarez et al. (2012) also report a lightcurve period of8.947 ± 0.001 h. Their reported period is a function of the intrinsicspin state of the asteroid and of the relative motion between theasteroid, the observer, and the Sun. Therefore, it is close to but notexactly equivalent to the synodic period, which combines the (fixed)intrinsic rotation and the (variable) apparent rotation due to skymotion, but is independent of the position of the Sun. If we assumethat the reported lightcurve period is equivalent to the synodicperiod, we can compute the corresponding sidereal periods. This

Fig. 8. Comparison between radar range-Doppler images, corresponding synthetic radar images generated using our best-fit shape model, and plane-of-sky (POS) projectionsof the shape model. Range-Doppler images are oriented such that radar illumination is from the top, range increases towards the bottom, Doppler frequency increases to theright, and the asteroid spin results in counter-clockwise rotation. The POS projections are oriented north-up and east-left. Time increases from top to bottom within eachpanel and from left to right. The range and frequency resolutions of the images are given in Table 1. The reduced chi-square of the fit to the images is 0.27.
S.P. Naidu et al. / Icarus 226 (2013) 323–335 331

Fig. 8 (continued)
332 S.P. Naidu et al. / Icarus 226 (2013) 323–335

Fig. 8 (continued)
S.P. Naidu et al. / Icarus 226 (2013) 323–335 333
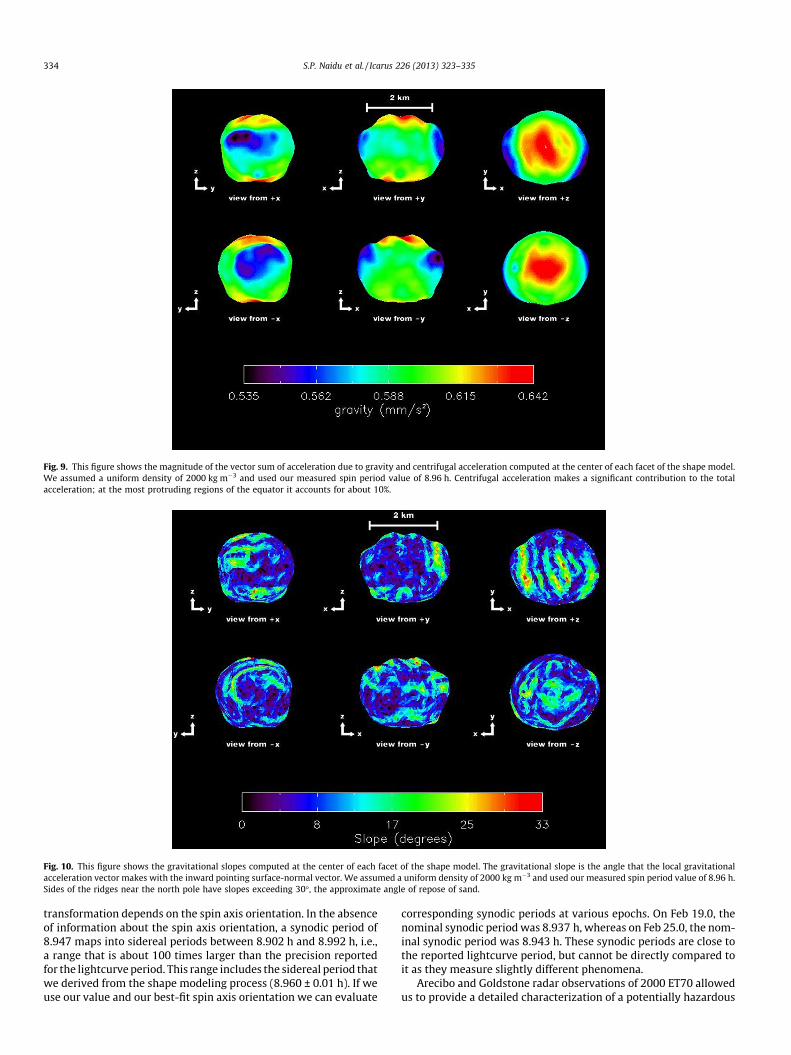
Fig. 9. This figure shows the magnitude of the vector sum of acceleration due to gravity and centrifugal acceleration computed at the center of each facet of the shape model.We assumed a uniform density of 2000 kg m�3 and used our measured spin period value of 8.96 h. Centrifugal acceleration makes a significant contribution to the totalacceleration; at the most protruding regions of the equator it accounts for about 10%.
Fig. 10. This figure shows the gravitational slopes computed at the center of each facet of the shape model. The gravitational slope is the angle that the local gravitationalacceleration vector makes with the inward pointing surface-normal vector. We assumed a uniform density of 2000 kg m�3 and used our measured spin period value of 8.96 h.Sides of the ridges near the north pole have slopes exceeding 30�, the approximate angle of repose of sand.
334 S.P. Naidu et al. / Icarus 226 (2013) 323–335
transformation depends on the spin axis orientation. In the absenceof information about the spin axis orientation, a synodic period of8.947 maps into sidereal periods between 8.902 h and 8.992 h, i.e.,a range that is about 100 times larger than the precision reportedfor the lightcurve period. This range includes the sidereal period thatwe derived from the shape modeling process (8.960 ± 0.01 h). If weuse our value and our best-fit spin axis orientation we can evaluate
corresponding synodic periods at various epochs. On Feb 19.0, thenominal synodic period was 8.937 h, whereas on Feb 25.0, the nom-inal synodic period was 8.943 h. These synodic periods are close tothe reported lightcurve period, but cannot be directly compared toit as they measure slightly different phenomena.
Arecibo and Goldstone radar observations of 2000 ET70 allowedus to provide a detailed characterization of a potentially hazardous

Fig. 11. Absolute magnitude vs. geometric albedo for an effective diameter of2.26 km (dark line) and a diameter uncertainty of 5% (light lines). The horizontaldashed line corresponds to the absolute magnitude (H = 18.2) reported by Whiteley(2001), and the vertical dashed lines indicate the corresponding geometric albedos.These albedo values are unusually low, suggesting an extraordinarily dark object oran object having an unusual phase function.
S.P. Naidu et al. / Icarus 226 (2013) 323–335 335
asteroid, including its size, shape, spin state, scattering properties,and gravitational environment. These techniques are applicable toa substantial fraction of known NEAs that make close approachesto Earth within �0.1 AU. Radar-based physical properties for thisand other asteroids are available at http://radarastronomy.org.
Acknowledgments
We thank the staff at Arecibo and Goldstone for assistance withthe observations. The Arecibo Observatory is operated by SRI Inter-national under cooperative agreement AST-1100968 with the Na-tional Science Foundation (NSF), and in alliance with Ana G.Méndez-Universidad Metropolitana, and the Universities Space Re-search Association. Some of this work was performed at the JetPropulsion Laboratory, California Institute of Technology, under acontract with the National Aeronautics and Space Administration(NASA). This material is based in part upon work supported byNASA under the Science Mission Directorate Research and AnalysisPrograms. The Arecibo Planetary Radar is supported in part byNASA Near-Earth Object Observations Program NNX12-AF24G.S.P.N. and J.L.M. were partially supported by NSF Astronomy andAstrophysics Program AST-1211581.
References
Alvarez, E.M. et al., 2012. Period determination for NEA (162421) 2000 ET70. MinorPlanet Bull. 39, 170.
Benner, L.A.M., Ostro, S.J., Nolan, M.C., Margot, J.L., Giorgini, J.D., Hudson, R.S.,Jurgens, R.F., Slade, M.A., Howell, E.S., Campbell, D.B., Yeomans, D.K., 2002.Radar observations of Asteroid 1999 JM8. Meteorit. Planet. Sci. 37, 779–792.
Benner, L.A.M., Nolan, M.C., Ostro, S.J., Giorgini, J.D., Pray, D.P., Harris, A.W., Magri,C., Margot, J.L., 2006. Near-Earth Asteroid 2005 CR37: Radar images andphotometry of a candidate contact binary. Icarus 182, 474–481.
Benner, L.A.M., Ostro, S.J., Magri, C., Nolan, M.C., Howell, E.S., Giorgini, J.D., Jurgens,R.F., Margot, J.L., Taylor, P.A., Busch, M.W., Shepard, M.K., 2008. Near-Earthasteroid surface roughness depends on compositional class. Icarus 198, 294–304. http://dx.doi.org/10.1016/j.icarus.2008.06.010.
Brozovic, M., Benner, L.A.M., Magri, C., Ostro, S.J., Scheeres, D.J., Giorgini, J.D., Nolan,M.C., Margot, J.L., Jurgens, R.F., Rose, R., 2010. Radar observations and a physicalmodel of contact binary Asteroid 4486 Mithra. Icarus 208, 207–220.
Brozovic, M., Benner, L.A.M., Taylor, P.A., Nolan, M.C., Howell, E.S., Magri, C.,Scheeres, D.J., Giorgini, J.D., Pollock, J.T., Pravec, P., Galád, A., Fang, J., Margot, J.L.,Busch, M.W., Shepard, M.K., Reichart, D.E., Ivarsen, K.M., Haislip, J.B., Lacluyze,A.P., Jao, J., Slade, M.A., Lawrence, K.J., Hicks, M.D., 2011. Radar and opticalobservations and physical modeling of triple near-Earth Asteroid (136617)1994 CC. Icarus 216, 241–256.
Busch, M.W., Ostro, S.J., Benner, L.A.M., Giorgini, J.D., Jurgens, R.F., Rose, R., Magri, C.,Pravec, P., Scheeres, D.J., Broschart, S.B., 2006. Radar and optical observationsand physical modeling of near-Earth Asteroid 10115 (1992 SK). Icarus 181, 145–155. http://dx.doi.org/10.1016/j.icarus.2005.10.024.
Busch, M.W., Benner, L.A.M., Ostro, S.J., Giorgini, J.D., Jurgens, R.F., Rose, R., Scheeres,D.J., Magri, C., Margot, J.-L., Nolan, M.C., Hine, A.A., 2008. Physical properties ofnear-Earth Asteroid (33342) 1998 WT24. Icarus 195, 614–621. http://dx.doi.org/10.1016/j.icarus.2008.01.020.
Chesley, S.R. et al., 2003. Direct detection of the Yarkovsky effect by radar ranging toAsteroid 6489 Golevka. Science 302, 1739–1742.
DeMeo, F.E., Binzel, R.P., Slivan, S.M., Bus, S.J., 2009. An extension of the Bus asteroidtaxonomy into the near-infrared. Icarus 202, 160–180. http://dx.doi.org/10.1016/j.icarus.2009.02.005.
Fang, J., Margot, J.L., 2012. Near-Earth binaries and triples: Origin and evolution of spin–orbital properties.Astron. J. 143, 24. http://dx.doi.org/10.1088/0004-6256/143/1/24.
Fang, J., Margot, J.L., Brozovic, M., Nolan, M.C., Benner, L.A.M., Taylor, P.A., 2011.Orbits of near-Earth Asteroid Triples 2001 SN263 and 1994 CC: Properties,origin, and evolution. Astron. J. 141, 154–168.
Hudson, S., 1993. Three-dimensional reconstruction of asteroids from radarobservations. Remote Sens. Rev. 8, 195–203.
Hudson, R.S., Ostro, S.J., 1994. Shape of Asteroid 4769 Castalia (1989 PB) frominversion of radar images. Science 263, 940–943.
Hudson, R.S., Ostro, S.J., 1999. Physical model of Asteroid 1620 Geographos from radarand optical data. Icarus 140, 369–378. http://dx.doi.org/10.1006/icar.1999.6142.
Hudson, R.S., Ostro, S.J., Jurgens, R.F., Rosema, K.D., Giorgini, J.D., Winkler, R., Rose, R.,Choate, D., Cormier, R.A., Franck, C.R., Frye, R., Howard, D., Kelley, D., Littlefair, R.,Slade, M.A., Benner, L.A.M., Thomas, M.L., Mitchell, D.L., Chodas, P.W., Yeomans,D.K., Scheeres, D.J., Palmer, P., Zaitsev, A., Koyama, Y., Nakamura, A., Harris, A.W.,Meshkov, M.N., 2000. Radar observations and physical model of Asteroid 6489Golevka. Icarus 148, 37–51. http://dx.doi.org/10.1006/icar.2000.6483.
La Spina, A., Paolicchi, P., Kryszczynska, A., Pravec, P., 2004. Retrograde spins ofnear-Earth asteroids from the Yarkovsky effect. Nature 428, 400–401. http://dx.doi.org/10.1038/nature02411.
Lowry, S.C. et al., 2007. Direct detection of the asteroidal YORP effect. Science 316,272–274.
Magri, C., Ostro, S.J., Scheeres, D.J., Nolan, M.C., Giorgini, J.D., Benner, L.A.M., Margot,J.L., 2007. Radar observations and a physical model of Asteroid 1580 Betulia.Icarus 186, 152–177. http://dx.doi.org/10.1016/j.icarus.2006.08.004.
Margot, J.L., 2001. Planetary Radar Astronomy with Linear FM (chirp) Waveforms.Arecibo Technical and Operations Memo Series 2001–09. Arecibo Observatory.http://www.naic.edu/�astro/aotms/misc/chirp.pdf.
Margot, J.L. et al., 2002. Binary asteroids in the near-Earth object population. Science296, 1445–1448. http://dx.doi.org/10.1126/science.1072094.
Mitchell, D.L., Ostro, S.J., Hudson, R.S., Rosema, K.D., Campbell, D.B., Velez, R.,Chandler, J.F., Shapiro, I.I., Giorgini, J.D., Yeomans, D.K., 1996. Radarobservations of Asteroids 1 Ceres, 2 Pallas, and 4 Vesta. Icarus 124, 113–133.http://dx.doi.org/10.1006/icar.1996.0193.
Nolan, M.C., Howell, E.S., Becker, T.M., Magri, C., Giorgini, J.D., Margot, J.L., 2008.Arecibo radar observations of 2001 SN263: A near-Earth triple asteroid system.Bull. Am. Astron. Soc. 40, 432.
Nugent, C.R., Margot, J.L., Chesley, S.R., Vokrouhlicky, D., 2012. Detection of semi-major axis drifts in 54 near-Earth asteroids: New measurements of theYarkovsky effect. Astron. J. 144, 60, arXiv1204.5990.
Ostro, S.J., 1993. Planetary radar astronomy. Rev. Mod. Phys. 65, 1235–1279. http://dx.doi.org/10.1103/RevModPhys.65.1235.
Ostro, S.J., Campbell, D.B., Shapiro, I.I., 1983. Radar observations of Asteroid 1685Toro. Astron. J. 88, 565–576. http://dx.doi.org/10.1086/113345.
Ostro, S.J. et al., 1995. Radar images of Asteroid 4179 Toutatis. Science 270, 80–83.http://dx.doi.org/10.1126/science.270.5233.80.
Ostro, S.J. et al., 2001. Radar observations of Asteroid 1998 ML14. Meteorit. Planet.Sci. 36, 1225–1236. http://dx.doi.org/10.1111/j.1945-5100.2001.tb01956.x.
Ostro, S.J. et al., 2006. Radar imaging of binary near-Earth Asteroid (66391) 1999KW4. Science 314, 1276–1280. http://dx.doi.org/10.1126/science.1133622.
Peebles, P.Z., 2007. Radar Principles. Wiley India Pvt. Limited, ISBN 9788126515271.<http://books.google.com/books?id=rnX21aAMKCIC>.
Pravec, P., Harris, A.W., 2007. Binary asteroid population. 1. Angular momentumcontent. Icarus 190, 250–259. http://dx.doi.org/10.1016/j.icarus.2007.02.023.
Scheeres,D.J. et al., 2006.Dynamical configuration ofbinary near-Earth Asteroid (66391)1999 KW4. Science 314, 1280–1283. http://dx.doi.org/10.1126/science.1133599.
Shepard, M.K., Margot, J.L., Magri, C., Nolan, M.C., Schlieder, J., Estes, B., Bus, S.J.,Volquardsen, E.L., Rivkin, A.S., Benner, L.A.M., Giorgini, J.D., Ostro, S.J., Busch,M.W., 2006. Radar and infrared observations of binary near-Earth Asteroid 2002CE26. Icarus 184, 198–210. http://dx.doi.org/10.1016/j.icarus.2006.04.019.
Stuart, J.S., Binzel, R.P., population, Bias-corrected, distribution, size, 2004. andimpact hazard for the near-Earth objects. Icarus 170, 295–311. http://dx.doi.org/10.1016/j.icarus.2004.03.018.
Taylor, P.A., Margot, J.L., 2011. Binary asteroid systems: Tidal end states andestimates of material properties. Icarus 212, 661–676.
Taylor, P.A. et al., 2007. Spin rate of Asteroid (54509) 2000 PH5 increasing due to theYORP effect. Science 316, 274. http://dx.doi.org/10.1126/science.1139038.
Tholen, D.J., 1984. Asteroid Taxonomy from Cluster Analysis of Photometry. Ph.D.Thesis, Arizona Univ., Tucson.
Thomas, C.A. et al., 2011. ExploreNEOs. V. Average albedo by taxonomic complex inthe near-Earth asteroid population. Astron. J. 142, 85. http://dx.doi.org/10.1088/0004-6256/142/3/85.
Werner, R.A., Scheeres, D.J., 1997. Exterior gravitation of a polyhedron derived andcompared with harmonic and mascon gravitation representations of Asteroid4769 Castalia. Celest. Mech. Dynam. Astron. 65, 313–344.
Whiteley Jr., R.J., 2001. A Compositional and Dynamical Survey of the Near-EarthAsteroids. PhD Thesis, University of Hawai’i at Manoa.
Williams, G.V., 2012. Minor Planet Astrophotometry. Ph.D. Thesis, SmithsonianAstrophysical Observatory. [email protected].
Zuber, M.T. et al., 2000. The shape of 433 Eros from the NEAR-Shoemaker laser range-finder. Science 289, 2097–2101. http://dx.doi.org/10.1126/science.289.5487.2097.