racial/ethnic outatient services differences in treatment€¦ · 3 racial/ethnic differences in...
TRANSCRIPT

CHAPTER 1 · Introduction
Racial/Ethnic Differences in Mental Health Service Use among Adults
Race
PrevalenceTreatment
Ad
ultsMental Health
Mental Health Care
Ethnicity
Outpatient Services
Inpatient Services
Services

ii
Sub
stan
ce A
bu
se a
nd
Men
tal H
ealt
h S
ervi
ces
Ad
min
istr
atio
n ·
Nat
ion
al S
urv
ey o
n D
rug
Use
an
d H
ealt
h
AcknowledgmentsThis chartbook was prepared by the Center for Behavioral Health Statistics and Quality (CBHSQ), Substance Abuse and Mental Health Services Administration (SAMHSA), U.S. Department of Health and Human Services (HHS), the National Institute of Mental Health (NIMH), National Institutes of Health (NIH), and RTI International (a registered trademark and a trade name of Research Triangle Institute), Research Triangle Park, North Carolina. Work by RTI was performed under Contract No. HHSS283201000003C and Task Order No. HHSS283200700002I/HHS28342005T.
Public Domain NoticeAll material appearing in this publication is in the public domain and may be reproduced or copied without permission from SAMHSA. However, this publication may not be reproduced or distributed for a fee without the specific, written authorization of the Office of Communications, SAMHSA, HHS. When using estimates and quotations from this publication, citation of the source is appreciated.
Recommended CitationSubstance Abuse and Mental Health Services Administration, Racial/Ethnic Differences in Mental Health Service Use among Adults. HHS Publication No. SMA-15-4906. Rockville, MD: Substance Abuse and Mental Health Services Administration, 2015.
Electronic Access and Copies of PublicationThis publication may be downloaded from http://www.samhsa.gov/data/.
Originating OfficeSubstance Abuse and Mental Health Services Administration Center for Behavioral Health Statistics and Quality 1 Choke Cherry Road, Room 2-1067 Rockville, MD 20857
February 2015

Contents
iii
y o
n D
rug
Use
an
d H
ealt
hev
Nat
ion
al S
ur
· ti
on
dm
inis
tra
es A
vic
erea
lth
Sta
l Hen
bu
se a
nd
Me
ASu
bst
anc
Highlights � � � � � � � � � � � � � � � � � � � � � � � � � � � � � � � � � � � � � � � � � � � � � � � � � � � � � � �1
1 Introduction � � � � � � � � � � � � � � � � � � � � � � � � � � � � � � � � � � � � � � � � � � � � � � � �3
2 Methods � � � � � � � � � � � � � � � � � � � � � � � � � � � � � � � � � � � � � � � � � � � � � � � � � � � �52�1 Data Sources� � � � � � � � � � � � � � � � � � � � � � � � � � � � � � � � � � � � � � � � � � � �52�2 Chartbook Methodology � � � � � � � � � � � � � � � � � � � � � � � � � � � � � � � �6
Sample � � � � � � � � � � � � � � � � � � � � � � � � � � � � � � � � � � � � � � � � � � � � � � � � �6Measures � � � � � � � � � � � � � � � � � � � � � � � � � � � � � � � � � � � � � � � � � � � � � � �7Analyses � � � � � � � � � � � � � � � � � � � � � � � � � � � � � � � � � � � � � � � � � � � � � � � �9
3 Racial/Ethnic Differences in Mental Health Service Use among Adults � � � � � � � � � � � � � � � � � � � � � � � � � � � � � � � � � � � � � � � � � � � � 113�1 Introduction � � � � � � � � � � � � � � � � � � � � � � � � � � � � � � � � � � � � � � � � � � 113�2 Racial/Ethnic Differences in Past Year Mental Health
Service Utilization among Adults � � � � � � � � � � � � � � � � � � � � � � 123�3 Racial/Ethnic Differences in Reasons for Not Using
Mental Health Services among Adults Who Reported an Unmet Need for Services � � � � � � � � � � � � � � � � � � � � � � � � � � � 18
3�4 Summary � � � � � � � � � � � � � � � � � � � � � � � � � � � � � � � � � � � � � � � � � � � � � 19
4 Differences in Mental Health Service Use among Adults with Any Mental Illness � � � � � � � � � � � � � � � � � � � � � � � � � � � 214�1 Introduction � � � � � � � � � � � � � � � � � � � � � � � � � � � � � � � � � � � � � � � � � � 214�2 Racial/Ethnic Differences in Past Year Mental Health
Service Use among Adults with Any Mental Illness � � � � � 234�3 Racial/Ethnic Differences in Reasons for Not Using
Mental Health Services among Adults with Any Mental Illness Who Reported an Unmet Need for Services � � � � � � 28
4�4 Summary � � � � � � � � � � � � � � � � � � � � � � � � � � � � � � � � � � � � � � � � � � � � � 29
5 Differences in Mental Health Service Use among Adults with Serious Mental Illness� � � � � � � � � � � � � � � � � � � � � � � � 315�1 Introduction � � � � � � � � � � � � � � � � � � � � � � � � � � � � � � � � � � � � � � � � � � 315�2 Racial/Ethnic Differences in Past Year Mental Health
Service Use among Adults with Serious Mental Illness � � 335�3 Racial/Ethnic Differences in Reasons for Not Using
Mental Health Services among Adults with Serious Mental Illness Who Reported an Unmet Need for Services � � � � � � � � � � � � � � � � � � � � � � � � � � � � � � � � � � � � � � � � � � � � � � 38
5�4 Summary � � � � � � � � � � � � � � � � � � � � � � � � � � � � � � � � � � � � � � � � � � � � � 39
End Notes � � � � � � � � � � � � � � � � � � � � � � � � � � � � � � � � � � � � � � � � � � � � � � � � � � � � � 41
List of Figures � � � � � � � � � � � � � � � � � � � � � � � � � � � � � � � � � � � � � � � � � � � � � � � � � 43
List of Tables � � � � � � � � � � � � � � � � � � � � � � � � � � � � � � � � � � � � � � � � � � � � � � � � � � 44
Contents (continued)
iv
Sub
stan
ce A
bu
se a
nd
Men
tal H
ealt
h S
ervi
ces
Ad
min
istr
atio
n ·
Nat
ion
al S
urv
ey o
n D
rug
Use
an
d H
ealt
h
Appendix
A Mental Health Service Use among Adults: Detailed Tables� � � � � � � � � � � � � � � � � � � � � � � � � � � � � � � � � � � � � � �A-1
B Mental Health Service Use among Adults with Any Mental Illness: Detailed Tables � � � � � � � � � � � � � � � � � �B-1
C Mental Health Service Use among Adults with Serious Mental Illness: Detailed Tables � � � � � � � � � � � � � �C-1
D List of Contributors � � � � � � � � � � � � � � � � � � � � � � � � � � � � � � � � � D-1

Highlights
1
This chartbook uses combined 2008 to 2012 data from the National Survey on Drug Use and Health (NSDUH) to present nationally representative estimates of mental health service utilization among adults aged 18 or older within different racial/ethnic groups in the United States. The percentages are annual averages.
● The highest estimates of past year mental health service use were for adults reporting two or more races (17.1 percent), white adults (16.6 percent), and American Indian or Alaska Native adults (15.6 percent), followed by black (8.6 percent), Hispanic (7.3 percent), and Asian (4.9 percent) adults.
● Estimates of prescription psychiatric medication use in the past year were highest for white adults (14.4 percent), adults reporting two or more races (14.1 percent), and American Indian or Alaska Native adults (13.6 percent), followed by black (6.5 percent), Hispanic (5.7 percent), and Asian (3.1 percent) adults.
● Outpatient mental health service use in the past year was highest for adults reporting two or more races (8.8 percent), white adults (7.8 percent), and American Indian or Alaska Native adults (7.7 percent), followed by black (4.7 percent), Hispanic (3.8 percent), and Asian (2.5 percent) adults.
● Past year inpatient mental health service use was more prevalent among black adults (1.4 percent) than white adults (0.7 percent).
● Racial/ethnic differences in the estimates of any past year mental health service use were similar among all adults, adults with any mental illness (AMI), and adults with serious mental illness (SMI).
● Estimates of past year mental health service use increased with the severity of mental illness across all racial/ethnic groups.
● Few racial/ethnic differences were found among the reasons for not using mental health services among all adults, adults with AMI, and adults with SMI.
● Service cost or lack of insurance coverage was the most frequently cited reason for not using mental health services across all racial/ethnic groups. The belief that use of mental health services would not help was the least frequently cited reason for not using mental health services across all racial/ethnic groups. Among all adults and adults with AMI or SMI, white adults were generally the most likely to cite cost or insurance and believing that services would not help as reasons for not using mental health services compared with other racial/ethnic groups.

This page intentionally left blank
2

1 Introduction
3
Sub
stan
ce A
bu
se a
nd
Men
tal H
ealt
h S
ervi
ces
Ad
min
istr
atio
n ·
Nat
ion
al S
urv
ey o
n D
rug
Use
an
d H
ealt
h
CHAPTER 1 · Introduction
In 2001, the U.S. Surgeon General released a seminal report, Mental Health: Culture, Race, and Ethnicity, that documented substantial differences in mental health service utilization between non-Hispanic white adults and other racial/ethnic groups.1 The report also noted racial/ethnic differences in the types of services that are used. Moreover, the Surgeon General determined that not all differences in mental health service utilization resulted from personal preference. Rather, many of the racial/ethnic differences in mental health service utilization resulted from structural barriers, such as lack of transportation, low availability of care providers, cost, and insurance barriers.
At the same time, the Surgeon General identified an acute need for additional information on racial/ethnic differences in mental health care delivery, as well as ongoing national surveillance of mental health service utilization.1 Currently, most national estimates of mental health service use among racial/ethnic groups are based on data nearing or more than a decade old.1,2,3,4,5,6,7,8,9,10,11 Since the release of the Surgeon General’s report, significant policy changes have occurred, such as the Mental Health Parity and Addiction Equity Act of 2008.12 These policy changes have affected insurance coverage for mental health care and access to care.13 Moreover, with the passage of the Affordable Care Act of 2010,14 further changes in access to care are expected.15
1

4
Sub
stan
ce A
bu
se a
nd
Men
tal H
ealt
h S
ervi
ces
Ad
min
istr
atio
n ·
Nat
ion
al S
urv
ey o
n D
rug
Use
an
d H
ealt
h
CHAPTER 1 · Introduction
The purpose of this chartbook is to provide more recent, nationally representative estimates of mental health service utilization among adults aged 18 or older across different racial/ethnic groups in the United States. These data may serve as a benchmark for examining future national-level changes in mental health service utilization among adults in different racial/ethnic groups in the United States, particularly in the context of relevant policy changes.
This chartbook uses combined 2008 to 2012 data from the National Survey on Drug Use and Health (NSDUH). NSDUH is the primary source of statistical information on the use of illegal drugs, alcohol, and tobacco by the civilian, noninstitutionalized population of the United States aged 12 years old or older. The survey also includes several modules of questions that focus on mental health issues. Conducted by the Federal Government since 1971, the survey collects data through face-to-face interviews with a representative sample of the population at the respondent’s place of residence. The survey is sponsored by the Substance Abuse and Mental Health Services Administration (SAMHSA), U.S. Department of Health and Human Services, and is planned and managed by SAMHSA’s Center for Behavioral Health Statistics and Quality (CBHSQ). Data collection and analysis are conducted under contract with RTI International.
Methods for this chartbook are presented in Section 2. The chartbook presents information on racial/ethnic differences in mental health service utilization among all adults (Section 3), among adults with any mental illness (AMI) (Section 4), and among adults with serious mental illness (i.e., mental illness with serious functional impairment; SMI) (Section 5). Data on racial/ethnic differences in mental health service utilization also are examined in the context of other characteristics, such as age, gender, and education. Sections 3 to 5 are organized uniformly, each with an introduction that describes relevant points for interpreting the data presented and a variety of figures showing racial/ethnic differences in mental health service utilization. All of the figures present annual average percentages for the 2008 to 2012 period and 95 percent confidence intervals (CIs) to show the precision of the estimates. Because of small sample sizes for some racial/ethnic groups even with 5 years of data, some estimates may be imprecise, as indicated by the wide CIs. In these situations, large apparent differences between groups may not be statistically significant. In cases where the estimates are too imprecise, statistical comparisons may not be conducted and/or estimates may be suppressed. All unsuppressed estimates are available in Appendix A (estimates among all adults), Appendix B (estimates among adults with AMI), and Appendix C (estimates among adults with SMI).

2 Methods
5
Sub
stan
ce A
bu
se a
nd
Men
tal H
ealt
h S
ervi
ces
Ad
min
istr
atio
n ·
Nat
ion
al S
urv
ey o
n D
rug
Use
an
d H
ealt
h
2.1 Data Sources
Data in this chartbook come from the 2008 to 2012 National Surveys on Drug Use and Health (NSDUHs). Each annual survey is administered to a sample of the civilian, noninstitutionalized population of the United States aged 12 or older. Respondents include residents of households and noninstitutional group quarters (e.g., shelters, rooming houses, dormitories) and civilians living on military bases. The survey excludes homeless people who do not use shelters, military personnel on active duty, and residents of institutional group quarters, such as jails and hospitals.
NSDUH collects data from a probability sample of the population aged 12 or older in all 50 States and the District of Columbia using a multistage design. For the 2008 to 2012 NSDUHs, States were first stratified into State sampling regions (SSRs). Within each SSR, the first stage of selection was census tracts. Within sampled census tracts, adjacent census blocks were combined to form the second-stage sampling units, or area segments. In each of the area segments, a listing of all addresses was made from which national samples of addresses were selected. If a sampled address was determined to be an eligible dwelling unit, sample individuals were randomly selected using an automated screening procedure programmed in a handheld computer carried by the interviewers. Up to two eligible individuals from a dwelling unit could be selected for the interview. Adolescents aged 12 to 17 and adults aged 18 to 25 are oversampled at this stage.
2

CHAPTER 2 · Methods
6
Sub
stan
ce A
bu
se a
nd
Men
tal H
ealt
h S
ervi
ces
Ad
min
istr
atio
n ·
Nat
ion
al S
urv
ey o
n D
rug
Use
an
d H
ealt
h
The NSDUH interview can be completed in English or Spanish, and both versions have the same content. If the sample individual prefers to complete the interview in Spanish, a certified bilingual interviewer is sent to the address to conduct the interview. Because the interview is not translated into any other language, if a sample individual does not speak English or Spanish, the interview is not conducted.
Immediately after completion of the household screening, interviewers attempt to conduct the NSDUH interview with each sample individual in the household. The interviewer requests the selected respondent to identify a private area in the home to conduct the interview away from other household members. The interview averages about an hour and collects data on a variety of topics, including drug and alcohol use, mental illness, substance use disorders, and the use of services for mental disorders and substance use disorders. Questions about less sensitive topics, such as demographic characteristics, are interviewer administered. Questions about sensitive topics—including criminal justice contact, substance use, and mental health issues—are administered via audio computer-assisted self-interviewing (ACASI). ACASI provides maximum privacy for respondents in the household setting to promote accurate reporting of data on sensitive topics. More information on the study design of NSDUH can be found in the 2008 national findings report and the 2009 to 2012 mental health findings reports.16,17,18,19,20
2.2 Chartbook MethodologySample
This chartbook presents data on adults aged 18 or older (henceforth referred to as “adults”). Data collection for any mental illness (AMI) and serious mental illness (SMI) began in 2008; therefore, this chartbook combines 2008 through 2012 NSDUH data. From 2008 to 2012, approximately 45,900 adults were surveyed annually.
Data are presented for racial/ethnic groups based on Federal guidelines for collecting and reporting race/ethnicity data.21 Because respondents could choose more than one racial group, a “two or more races” category is included for those who reported more than one category (i.e., white, black or African American, American Indian or Alaska Native, Native Hawaiian, Other Pacific Islander, Asian, Other). Respondents choosing both Native Hawaiian and Other Pacific Islander but no other categories are classified as being in the “Native Hawaiian or Other Pacific Islander” category instead of the “two or more races” category. Except for the “Hispanic or Latino” group, the racial/ethnic groups include only non-Hispanics. The category “Hispanic or Latino” includes Hispanics of any race.
Of the total sample of adults in the 2008 through 2012 NSDUH data, 65.4 percent were white, 11.9 percent were black, 1.3 percent were American Indian or Alaska Native, 3.6 percent were Asian, 2.6 percent reported two or more races, and 15.1 percent were Hispanic. Because of the low

CHAPTER 2 · Methods
7
Sub
stan
ce A
bu
se a
nd
Men
tal H
ealt
h S
ervi
ces
Ad
min
istr
atio
n ·
Nat
ion
al S
urv
ey o
n D
rug
Use
an
d H
ealt
h
numbers of adults who reported mental health service utilization among Native Hawaiian or Other Pacific Islander respondents, adults in this category were excluded from the sample for the presented analyses (0.4 percent of adults reported being Native Hawaiian or Other Pacific Islander). The total sample size of adults included in this chartbook is approximately 228,600 adults. Characteristics of the population of adults for this chartbook are presented in the detailed tables in the appendices. Table A.1 presents the demographic characteristics of all adults (except for Native Hawaiians or Other Pacific Islanders), regardless of mental illness status. Tables B.1 and C.1 present the demographic characteristics of adults with AMI and SMI, respectively.
Measures
Past Year Mental Health Service Utilization
In NSDUH, questions on past year mental health service utilization are asked of adult respondents regardless of mental illness status. Respondents are asked whether they received treatment or counseling in the past 12 months for any problem with emotions, “nerves,” or mental health. Respondents are asked about treatment or counseling in inpatient or outpatient settings or use of prescription medication for a mental illness or emotional condition (excluding substance use disorders).
This chartbook presents estimates of any of the three types of mental health service utilization (approximately 31,000 respondents). It also presents estimates for each
of the individual types of mental health service utilization among adults: use of inpatient mental health services (approximately 2,100 respondents), use of outpatient mental health services (approximately 16,000 respondents), and use of prescription medication (approximately 25,400 respondents).
The measurement of past year mental health service utilization that was applied for this chartbook assesses any use of services versus no use. It does not assess the quality or effectiveness of the mental health services, nor does it assess the duration or number of visits for inpatient or outpatient services. In addition, NSDUH respondents are asked only whether they took any prescribed medication for a mental or emotional condition in the past 12 months; they are not asked how long or how regularly they took medication or the types of prescribed medication that they took. Thus, the results in this chartbook do not reflect the total amount or quality of services being used by any group.
Past Year Mental Illness
The determination of past year mental illness in NSDUH is based on a statistical model developed from clinical interviews using the Structured Clinical Interview for DSM-IV-TR Axis I Disorders, Research Version, Non-patient Edition (SCID-I/NP)22 that were administered via telephone to a subsample of adult respondents who had completed the main NSDUH interview. In the clinical interviews, adults were defined as having AMI if they had a diagnosable mental disorder, excluding substance use

CHAPTER 2 · Methods
8
Sub
stan
ce A
bu
se a
nd
Men
tal H
ealt
h S
ervi
ces
Ad
min
istr
atio
n ·
Nat
ion
al S
urv
ey o
n D
rug
Use
an
d H
ealt
h
disorders and developmental disorders, based on criteria in the 4th edition of the Diagnostic and Statistical Manual of Mental Disorders (DSM-IV), regardless of the level of functional impairment because of these disorders.23 SMI in NSDUH is operationalized to reflect the definition of serious mental illness defined by SAMHSA in the 1993 Federal Register.24 Adults were defined as having SMI if they had a diagnosable mental disorder in the past 12 months that resulted in serious functional impairment that was assessed using the Global Assessment of Functioning (GAF) scale from the DSM-IV.
Based on the results of these clinical interviews, a statistical model was developed for the full NSDUH sample of adults (i.e., not just those who completed the clinical interviews) that included measures of psychological distress and functional impairment, as well as additional indicators.25 This model was then used to predict the probabilities that adults had SMI or AMI and to estimate the percentages of SMI and AMI in the past 12 months among all adults based on these predicted probabilities. More information on these methods can be found in The NSDUH Report: Revised Estimates of Mental Illness from the National Survey on Drug Use and Health.25
Reasons for Not Using Mental Health Services
Reasons for not using mental health services were assessed for all adult respondents who reported an unmet need for mental
health services. “Unmet need” was defined as feeling the need for mental health services in the past 12 months but not using them. Unmet need could include individuals who did not receive any mental health services, but also those who received inadequate services, needed additional services, or delayed seeking services but received them later.
Adult respondents who reported an unmet need for mental health services were asked to report why they did not receive these services. Reasons that were presented to adults included cost or insurance coverage (could not afford cost, health insurance does not cover mental health services, or insurance does not pay enough for mental health services), a low perceived need (did not feel the need for services or felt that they could handle the problem without treatment), a concern over prejudice and discrimination (felt that mental health service use might cause neighbors/community to have a negative opinion, might have a negative effect on employment, concerns over confidentiality, did not want others to find out, or concerns over being committed or having to take medication), structural barriers to service use (no transportation, inconvenient, did not know where to go for services, or did not have time), and concerns over efficacy (i.e., did not think it would help), as well as an open-ended response option for other reasons. Respondents could choose more than one reason for not using services. Therefore, the percentages of adults who reported different barriers to using mental health services are not mutually exclusive.

CHAPTER 2 · Methods
9
Sub
stan
ce A
bu
se a
nd
Men
tal H
ealt
h S
ervi
ces
Ad
min
istr
atio
n ·
Nat
ion
al S
urv
ey o
n D
rug
Use
an
d H
ealt
h
Other Characteristics
This chartbook also presents estimates of racial/ethnic differences in mental health service utilization according to other characteristics. For brevity, Sections 3 to 5 present estimates for selected correlates. However, detailed tables in the appendices present estimates of service use by a variety of additional correlates. Estimates are presented by gender, age in years (18 to 25, 26 to 34, 35 to 49, or 50 or older), marital status (married, widowed, divorced or separated, or never married), employment status (full time, part time, unemployed, or other/not in the labor force), highest level of education (less than high school, high school graduate, some college, or college graduate), poverty status (below the Federal poverty level, 100 to 199 percent of the Federal poverty level, or 200 percent or more of the Federal poverty level), health insurance status (uninsured, private insurance only, Medicaid and/or Medicare only, another type of insurance only, or multiple insurance types), overall health status (excellent, very good, good, or fair/poor), and the presence of a substance use disorder (none, any). Substance use disorders include dependence or abuse, which are based on definitions found in the DSM-IV.23
Federal poverty level is defined based on family size, number of children in the household, and total family income. The Federal poverty level is calculated as a percentage of the U.S. Census Bureau’s poverty level amount by dividing the total family income by the appropriate poverty level amount. Federal poverty level thresholds vary by year, but are the same
for each State. For more information, visit http://www.census.gov/hhes/www/poverty/index.html. Adults aged 18 to 22 who were living in a college dormitory were excluded from the Federal poverty level calculations.
Analyses
Weighted data were used to make inferences for adults in the civilian, noninstitutionalized population of the United States. All analyses used a multiprocedure package—SUDAAN® Software for Statistical Analysis of Correlated Data—to account for NSDUH’s complex survey design.26 The detailed tables provide estimates of the percentages of past year mental health service use and associated standard errors (SEs), while the figures present the percentages and the 95 percent confidence intervals (CIs).
All estimates presented in this chartbook have met the criteria for statistical reliability. Estimates that do not meet these criteria are suppressed and do not appear in tables, figures, or text. The suppression criteria for various NSDUHestimates are described in Section B.2.2 in the 2012 mental
health findings report and also are summarized in Table B.2 in that same report.20
All significance tests were two-sided and tested at an alpha level of .05. In cases of comparisons stratified by a covariate (e.g., gender, age, insurance status), an overall chi-square test was conducted to evaluate overall racial/ethnic differences in mental health service use across the levels of the covariate. This was done to control for Type I error due to multiple

CHAPTER 2 · Methods
10
Sub
stan
ce A
bu
se a
nd
Men
tal H
ealt
h S
ervi
ces
Ad
min
istr
atio
n ·
Nat
ion
al S
urv
ey o
n D
rug
Use
an
d H
ealt
h
comparisons. If this overall test was not significant, comparisons of racial/ethnic differences within each covariate group were not conducted. In addition, suppressed estimates are not included in statistical tests of comparisons. For example, a statement that “whites had the highest percentage” means that the estimate among whites was higher than the estimate among all nonsuppressed racial/ethnic subgroups. However, the estimate among whites was not necessarily higher than the estimate among a subgroup for which the estimate was suppressed.
Unless explicitly stated that a difference is not statistically significant, all statements that describe differences are significant at the .05 level. Statistically significant differences are described using terms such as “higher,” “lower,” “more likely,” or “less likely.” Statements that use terms such as “similar,” “comparable,” or “no difference” to describe the relationship between estimates denote that a difference is not statistically significant. When a set of estimates is presented for population subgroups or for another characteristic of interest without a statement of comparison, statistically significant differences among these estimates are not implied, and testing may not have been conducted. Evaluation of significant differences in estimates based on SE or CI overlap should not be used for formal significance testing because it can lead either to false-positive or to false-negative conclusions.27,28

3 Racial/Ethnic Differences in Mental Health Service Use among Adults
11
Sub
stan
ce A
bu
se a
nd
Men
tal H
ealt
h S
ervi
ces
Ad
min
istr
atio
n ·
Nat
ion
al S
urv
ey o
n D
rug
Use
an
d H
ealt
h
3.1 Introduction
Numerous national and regional studies have demonstrated racial/ethnic differences in the use of mental health services in the United States. However, most of the studies that examined these differences in detail used data that are now at least a decade old. This section provides more recent national estimates of mental health service utilization by race/ethnicity.
First, overall annual average estimates for the 2008 to 2012 National Surveys on Drug Use and Health (NSDUHs) are presented for past year use of any mental health services and by service type (i.e., prescription medication, outpatient, or inpatient) among all adults aged 18 or older. Next, any mental health service utilization within racial/ethnic groups is presented by correlates to examine racial/ethnic differences in mental health service use by these characteristics. Correlates include gender, poverty status, and health insurance status. Finally, reasons are presented for not using mental health services among adults with an unmet need for mental health services.
Throughout this section, annual average estimates are presented for white, black, American Indian or Alaska Native, Asian, and Hispanic adults and for adults reporting two or more races. Detailed estimates, including standard errors (SEs), for the figures in this section can be found in Appendix A.
3

3.2 Racial/Ethnic Differences in Past Year Mental Health Service Use among Adults
FIGURE 3.1 Mental Health Service Use in the Past Year among Adults, by Race/Ethnicity and Service Type, 2008-201229
CHAPTER 3 Racial/Ethnic Differences in Mental Health Service Use among Adults
12
Sub
stan
ce A
bu
se a
nd
Men
tal H
ealt
h S
ervi
ces
Ad
min
istr
atio
n ·
Nat
ion
al S
urv
ey o
n D
rug
Use
an
d H
ealt
h
Any Mental Health Service Use
Prescription Medication
Outpatient Services
Inpatient ServicesHispanic
Two or MoreRaces
Asian
American Indian or Alaska Native
Black or African American
White
16.6
8.6
15.6
4.9
17.1
7.3
14.4
6.5
13.6
3.1
14.1
5.7
7.8
4.7
7.7
2.5
8.8
3.8
0.7
1.4
1.6
0.6
1.1
0.8
Annual Average Percentage and 95% Con�dence Intervals
Source: SAMHSA, Center for Behavioral Health Statistics and Quality, National Survey on Drug Use and Health, 2008-2012 (2008-2010 Data – Revised March 2012).
● Estimates of any mental health service utilization among adults were similar for adults reporting two or more races (17.1 percent), white adults (16.6 percent), and American Indian or Alaska Native adults (15.6 percent) (Figure 3.1). Estimates of mental health service use in the past year were higher for these three groups than for black (8.6 percent), Hispanic (7.3 percent), and Asian (4.9 percent) adults. The estimate of service utilization among black adults was higher than the estimate for Hispanic and Asian adults.
● Racial/ethnic differences among adults also were observed for the utilization of different types of mental health services. Estimates of prescription medication use were highest among white adults (14.4 percent), adults who reported two or more races (14.1 percent), and American Indian or Alaska Native adults (13.6 percent).
(continued on next page)

CHAPTER 3 Racial/Ethnic Differences in Mental Health Service Use among Adults
13
Sub
stan
ce A
bu
se a
nd
Men
tal H
ealt
h S
ervi
ces
Ad
min
istr
atio
n ·
Nat
ion
al S
urv
ey o
n D
rug
Use
an
d H
ealt
h
FIGURE 3.1 (continued)
● Black adults had a higher estimate of prescription medication use compared with Hispanic adults (6.5 vs. 5.7 percent).
● Asian adults had the lowest percentage of prescription medication use (3.1 percent).
● Estimates of outpatient mental health service utilization among adults were highest for those reporting two or more races (8.8 percent), white adults (7.8 percent), and American Indian or Alaska Native adults (7.7 percent). Estimates were higher for black adults (4.7 percent) than for Hispanic adults (3.8 percent). Asian adults had the lowest percentage of outpatient service use (2.5 percent).
● The pattern of inpatient mental health service utilization across racial/ethnic groups differed from the patterns for prescription medication use and outpatient mental health service use. Estimates of inpatient mental health service use among adults were similar for adults reporting two or more races (1.1 percent), Hispanic adults (0.8 percent), white adults (0.7 percent), and Asian adults (0.6 percent).
● The percentage of inpatient service use was higher among black adults (1.4 percent) than among Hispanic, white, and Asian adults.

FIGURE 3.2 Mental Health Service Use in the Past Year among Adults, by Race/Ethnicity and Gender, 2008-201229
CHAPTER 3 Racial/Ethnic Differences in Mental Health Service Use among Adults
14
Sub
stan
ce A
bu
se a
nd
Men
tal H
ealt
h S
ervi
ces
Ad
min
istr
atio
n ·
Nat
ion
al S
urv
ey o
n D
rug
Use
an
d H
ealt
h
Male Female
11.3
6.6
16.3
4.4
12.5
5.5
21.5
10.3
15.1
5.3
21.3
9.2
White Black orAfrican
American
AmericanIndian or
Alaska Native
Asian Two or MoreRaces
Hispanic
Annu
al A
vera
ge P
erce
ntag
e an
d 95
% C
on�d
ence
Inte
rval
s
Source: SAMHSA, Center for Behavioral Health Statistics and Quality, National Survey on Drug Use and Health, 2008-2012 (2008-2010 Data – Revised March 2012).
● The pattern of past year mental health service utilization by race/ethnicity varied for adult males and females (Figure 3.2).
● White males (11.3 percent) had higher estimates of any mental health service use than black (6.6 percent), Hispanic (5.5 percent), and Asian (4.4 percent) males.
● Estimates of any mental health service use were higher for American Indian or Alaska Native males (16.3 percent) than for black, Hispanic, and Asian males.
● Estimates of any mental health service utilization were highest for white females (21.5 percent) and females reporting two or more races (21.3 percent).
● Estimates of any mental health service use were similar for females who were black (10.3 percent) and those who were Hispanic (9.2 percent).
● Asian females (5.3 percent) had the lowest percentage of mental health service use compared with females in other racial/ethnic groups.

● In each age group, white adults were more likely than their black, Asian, and Hispanic counterparts to use any mental health services (Figure 3.3). For example, among adults aged 26 to 34, 18.1 percent of white adults used mental health services in the past year compared with 8.5 percent of black adults, 5.1 percent of Asian adults, and 6.6 percent of Hispanic adults who had used mental health services.
● Among those aged 18 to 25, estimates of mental health service utilization were similar among black (6.5 percent), Asian (5.7 percent), and Hispanic (6.7 percent) adults.
● Among adults aged 50 or older, the estimate of past year service use was higher among black (8.8 percent) and Hispanic (8.6 percent) adults than among their Asian counterparts (4.5 percent).
FIGURE 3.3 Mental Health Service Use in the Past Year among Adults, by Race/Ethnicity and Age, 2008-201229
18 to 25
26 to 34
35 to 49
50 or Older
Hispanic
Two or MoreRaces
Asian
American Indian or Alaska Native
Black or African American
White
8.6
17.6
4.5
15.9
8.8
15.2
7.1
19.8
4.7
18.5
9.9
19.3
6.6
14.8
5.1
14.5
8.5
18.1
6.7
14.7
5.7
12.2
6.5
14.3
Annual Average Percentage and 95% Con�dence Intervals
CHAPTER 3 Racial/Ethnic Differences in Mental Health Service Use among Adults
15
Sub
stan
ce A
bu
se a
nd
Men
tal H
ealt
h S
ervi
ces
Ad
min
istr
atio
n ·
Nat
ion
al S
urv
ey o
n D
rug
Use
an
d H
ealt
h
Source: SAMHSA, Center for Behavioral Health Statistics and Quality, National Survey on Drug Use and Health, 2008-2012 (2008-2010 Data – Revised March 2012).

FIGURE 3.4 Mental Health Service Use in the Past Year among Adults, by Race/Ethnicity and Poverty Status, 2008-201229,30
CHAPTER 3 Racial/Ethnic Differences in Mental Health Service Use among Adults
16
Sub
stan
ce A
bu
se a
nd
Men
tal H
ealt
h S
ervi
ces
Ad
min
istr
atio
n ·
Nat
ion
al S
urv
ey o
n D
rug
Use
an
d H
ealt
h
Below the Federal Poverty Level100% to 199% of the Federal Poverty Level200% or More of the Federal Poverty Level
Hispanic
Two or MoreRaces
Asian
American Indian or Alaska Native
Black or African American
White
23.3
12.4
16.1
6.1
22.2
8.3
18.3
8.7
15.4
2.0
17.1
6.3
15.5
6.5
16.4
5.4
15.0
7.6
Annual Average Percentage and 95% Con�dence Intervals
Source: SAMHSA, Center for Behavioral Health Statistics and Quality, National Survey on Drug Use and Health, 2008-2012 (2008-2010 Data – Revised March 2012).
● White adults and adults reporting two or more races had similar estimates of any mental health service utilization within each poverty status category (Figure 3.4). Within each poverty category, white adults had higher estimates of mental health service use than black, Asian, and Hispanic adults.
● Black adults with a family income below the Federal poverty level (12.4 percent) had a higher estimate of past year mental health service use compared with their Asian (6.1 percent) and Hispanic (8.3 percent) counterparts.
● Black adults with a family income between 100 and 199 percent of the Federal poverty level (8.7 percent) had a higher estimate of mental health service use compared with their Asian (2.0 percent) and Hispanic (6.3 percent) counterparts.

● Within each health insurance group, most estimates of any past year service utilization were similar for white adults, American Indian or Alaska Native adults, and adults reporting two or more races (Figure 3.5). The exception was that American Indian or Alaska Native adults who had Medicaid/Medicare only were less likely to have used mental health services in the past year compared with their white counterparts (18.3 vs. 26.3 percent, respectively).
● Uninsured black adults had a higher percentage of mental health service use compared with uninsured Hispanic adults (6.1 vs. 4.1 percent). Similarly, estimates of any mental health service use were higher among black adults with Medicaid/Medicare only compared with Hispanic adults with similar coverage (15.8 vs. 11.5 percent).
● Black adults with private insurance were less likely than their Hispanic counterparts to use mental health services (5.6 vs. 7.7 percent).
● Within each insurance group, Asian adults had the lowest estimate of mental health service use, with one exception—Asian and black adults with private insurance had similar estimates of mental health service use (5.1 and 5.6 percent, respectively).
FIGURE 3.5 Mental Health Service Use in the Past Year among Adults, by Race/Ethnicity and Insurance Status, 2008-201229,31
CHAPTER 3 Racial/Ethnic Differences in Mental Health Service Use among Adults
17
Sub
stan
ce A
bu
se a
nd
Men
tal H
ealt
h S
ervi
ces
Ad
min
istr
atio
n ·
Nat
ion
al S
urv
ey o
n D
rug
Use
an
d H
ealt
h
NonePrivate OnlyMedicaid/Medicare OnlyOther Insurance OnlyMultiple Insurance Types
10.0
19.2
3.8
*
8.0
13.8
9.1
14.5
4.5
17.2
10.1
17.2
7.7
14.7
5.1
*
5.6
16.4
11.5
25.4
7.4
18.3
15.8
26.3
4.1
13.6
3.9
8.5
6.1
13.9
Hispanic
Two or MoreRaces
Asian
American Indian or Alaska Native
Black or African American
White
Annual Average Percentage and 95% Con�dence Intervals
* Low precision; no estimate reported.
Source: SAMHSA, Center for Behavioral Health Statistics and Quality, National Survey on Drug Use and Health, 2008-2012 (2008-2010 Data – Revised March 2012).
3.3 Racial/Ethnic Differences in Reasons for Not Using Mental Health Services among Adults Who Reported an Unmet Need for Services
FIGURE 3.6 Reasons for Not Using Mental Health Services among Adults Who Had an Unmet Need for Services in the Past Year, by Race/Ethnicity, 2008-201229
CHAPTER 3 Racial/Ethnic Differences in Mental Health Service Use among Adults
18
Sub
stan
ce A
bu
se a
nd
Men
tal H
ealt
h S
ervi
ces
Ad
min
istr
atio
n ·
Nat
ion
al S
urv
ey o
n D
rug
Use
an
d H
ealt
h
Did Not Think Services
Would Help
Structural Barriers
Prejudice and Discrimination
Low Perceived Need
Cost/Insurance
WhiteBlack or African AmericanAmerican Indian or Alaska NativeAsianTwo or More RacesHispanic
6.5
30.3
30.5
21.2
7.2
35.9
21.2
27.3
12.9
39.7
26.5
31.9
4.4
17.8
21.7
*
*
5.3
31.6
25.3
24.5
9.7
30.5
25.9
28.7
52.641.7
48.7
45.454.1
Annual Average Percentage and 95% Con�dence Intervals
* Low precision; no estimate reported.
Source: SAMHSA, Center for Behavioral Health Statistics and Quality, National Survey on Drug Use and Health, 2008-2012 (2008-2010 Data – Revised March 2012).
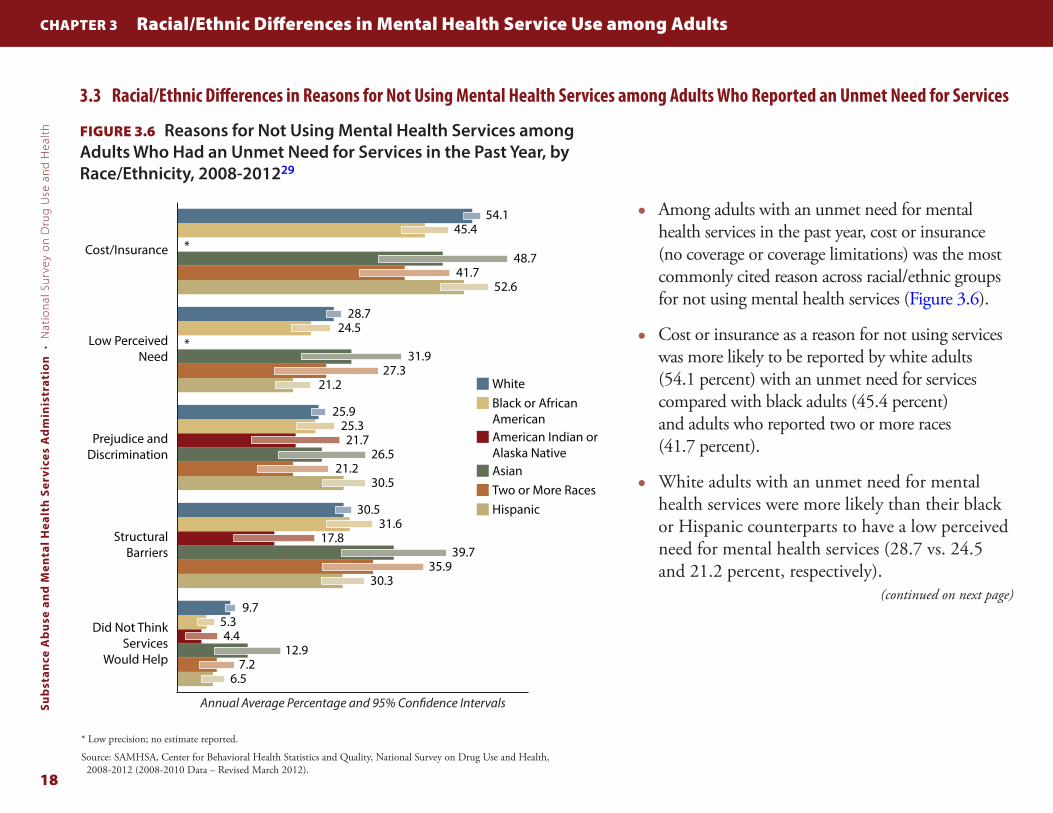
● Among adults with an unmet need for mental health services in the past year, cost or insurance (no coverage or coverage limitations) was the most commonly cited reason across racial/ethnic groups for not using mental health services (Figure 3.6).
● Cost or insurance as a reason for not using services was more likely to be reported by white adults (54.1 percent) with an unmet need for services compared with black adults (45.4 percent) and adults who reported two or more races (41.7 percent).
● White adults with an unmet need for mental health services were more likely than their black or Hispanic counterparts to have a low perceived need for mental health services (28.7 vs. 24.5 and 21.2 percent, respectively).
(continued on next page)

CHAPTER 3 Racial/Ethnic Differences in Mental Health Service Use among Adults
19
Sub
stan
ce A
bu
se a
nd
Men
tal H
ealt
h S
ervi
ces
Ad
min
istr
atio
n ·
Nat
ion
al S
urv
ey o
n D
rug
Use
an
d H
ealt
h
FIGURE 3.6 (continued)
● American Indian or Alaska Native adults (17.8 percent) with an unmet need were less likely to report structural barriers to mental health service use (e.g., lack of transportation, not knowing where or how to access mental health services) as reasons that they did not use mental health services compared with their counterparts in other racial/ethnic groups.
● The belief that mental health services would not help was the least frequently cited reason for not using mental health services among members of each racial/ethnic group. This reason for not using services was more likely to be reported by white adults with an unmet need (9.7 percent) than among their black (5.3 percent) or Hispanic (6.5 percent) counterparts. Asian adults with an unmet need for mental health services were more likely than their black counterparts to believe that mental health services would not help (12.9 vs. 5.3 percent, respectively).
3.4 Summary
White adults, American Indian or Alaska Native adults, and adults reporting two or more races consistently had a higher estimate of any past year mental health service use (ranging from 15.6 to 17.1 percent). Asian adults had the lowest estimate of mental health service use (4.9 percent), and black and Hispanic adults had similar estimates of service use that were in between those of white and Asian adults (7.3 to 8.6 percent). These patterns in the percentage of mental health service use by race/ethnicity did not change, regardless of gender, age, poverty status, and insurance status.
These findings are similar to the findings from other studies of both regional and national samples. Dobalian and Rivers, using data from the 1998 and 1999 Community Tracking Study to evaluate racial/ethnic differences in past year visits to mental health professionals, found that black and Hispanic adults had a lower estimate of mental health care visits compared with white adults, regardless of gender, age, education level, income, and insurance status.4
In a nationally representative study using medical records data from the 1997 National Ambulatory Medical Care Survey (NAMCS) and National Hospital Ambulatory Medical Care Survey (NHAMCS), Lasser and colleagues found that while there were only minor differences in the use of medical care overall among white, black, and Hispanic adults, both black and Hispanic adults had

CHAPTER 3 Racial/Ethnic Differences in Mental Health Service Use among Adults
20
Sub
stan
ce A
bu
se a
nd
Men
tal H
ealt
h S
ervi
ces
Ad
min
istr
atio
n ·
Nat
ion
al S
urv
ey o
n D
rug
Use
an
d H
ealt
h
significantly lower estimates of mental health care andprescription psychiatric medication than white adults.
2
The authors concluded that black and Hispanic adults used about half as much outpatient care (defined as outpatient counseling or medication) as white adults. The NHAMCS findings were similar to the estimates in this study for any mental health service utilization, where 16.6 percent of white adults had used mental health services compared with 8.6 and 7.3 percent of black and Hispanic adults, respectively.
Comparing the results for mental health service use among American Indian or Alaska Native adults and Asian adults with the results for adults reporting two or more races is more difficult. Few nationally representative studies examine mental health service use in these groups. Those that do often focus on descriptive measures within one racial/ethnic group and do not make comparisons with other racial/ethnic groups. Even in NSDUH, the smaller sample sizes for some groups—even with 5 years of combined data—lead to imprecision in the estimates, which results in larger SEs and reduces the ability to detect differences.
The overall pattern of differences (e.g., Asian adults having the least mental health service use, followed by black adults
and Hispanic adults) was found in any mental health service use, prescription psychiatric medication use, and outpatient mental health service use. For inpatient mental health service use, however, black adults had a higher estimate of service use than white adults.
There may be several reasons for this variation. First, it might represent a difference in service use preference. Second, these findings could be a result of structural factors. For example, Medicaid use is associated with higher inpatient service use, and this insurance type is more common among certain racial/ethnic groups.32 Third, members of certain racial/ethnic groups may be more likely to delay using mental health services until the severity necessitates inpatient services. Fourth, inpatient mental health service use is usually reserved for individuals with acutely serious mental illness. The finding that black adults were more likely to use inpatient mental health services than adults of other racial/ethnic groups may be due to an underlying difference in the estimates or severity of mental illness across these groups. To examine this possibility, the next two sections present estimates of mental health service use among adults with any mental illness (AMI) and among adults with serious mental illness (SMI) by racial/ethnic groups.

4 Differences in Mental Health Service Use among Adults with Any Mental Illness
21
Sub
stan
ce A
bu
se a
nd
Men
tal H
ealt
h S
ervi
ces
Ad
min
istr
atio
n ·
Nat
ion
al S
urv
ey o
n D
rug
Use
an
d H
ealt
h
4.1 Introduction
In Section 3, an examination of the estimates of past year mental health service use among all adults indicated racial/ethnic differences in service use. However, it is also important to consider that the prevalence of mental illness—and therefore the need for services—varies across different racial/ethnic groups.
To evaluate racial/ethnic differences in mental health service use among individuals with a similar level of need, this section examines mental health service use among individuals with AMI. However, restricting the sample to adults with AMI leads to a substantially smaller sample size; therefore, only the overall treatment graphic (i.e., Figure 4.2) presents data for all six racial/ethnic groups. The remaining figures present estimates for the three racial/ethnic groups with the largest sample sizes: white, black, and Hispanic adults. The detailed tables in Appendix B contain estimates for the other racial/ethnic groups; however, many estimates are suppressed because of small sample sizes.
4

FIGURE 4.1 Any Mental Illness in the Past Year among Adults, by Race/Ethnicity, 2008-201229,33
CHAPTER 4 Differences in Mental Health Service Use among Adults with Any Mental Illness
22
Sub
stan
ce A
bu
se a
nd
Men
tal H
ealt
h S
ervi
ces
Ad
min
istr
atio
n ·
Nat
ion
al S
urv
ey o
n D
rug
Use
an
d H
ealt
h
19.0
16.8
22.7
13.4
24.9
15.3
White Black orAfrican
American
AmericanIndian or
Alaska Native
Asian Two or MoreRaces
Hispanic
Annu
al A
vera
ge P
erce
ntag
e an
d 95
% C
on�d
ence
Inte
rval
s
Source: SAMHSA, Center for Behavioral Health Statistics and Quality, National Survey on Drug Use and Health, 2008-2012 (2008-2011 AMI Data – Revised October 2013).
● Estimates of past year any mental illness (AMI) were higher among white adults (19.0 percent) than among black (16.8 percent), Hispanic (15.3 percent), and Asian (13.4 percent) adults (Figure 4.1).
● Estimates were similar among white adults (19.0 percent) and American Indian or Alaska Native adults (22.7 percent).
● Adults who reported two or more races had the highest percentage of AMI (24.9 percent).

4.2 Racial/Ethnic Differences in Past Year Mental Health Service Use among Adults with Any Mental Illness
● Among those with AMI, estimates of any mental health service utilization in the past year were similar among white adults (46.3 percent), adults who reported two or more races (44.8 percent), and American Indian or Alaska Native adults (41.6 percent) (Figure 4.2). Estimates of any past year mental health service use were similar among black and Hispanic adults with AMI (29.8 and 27.3 percent, respectively).
● White adults with AMI (41.0 percent) were more likely to use prescription medication than their counterparts who were black (23.4 percent) or Hispanic (22.4 percent). Similarly, white adults with AMI were more likely to use outpatient services than black or Hispanic adults with AMI (25.7 vs. 18.7 and 16.6 percent, respectively).
● Asian adults with AMI were the least likely to use any mental health services (18.1 percent), prescription medication (12.2 percent), or outpatient services (11.0 percent).
● Estimates of inpatient mental health service use among adults with AMI were similar for adults who reported two or more races (3.5 percent), Hispanic adults (3.2 percent), white adults (2.9 percent), and Asian adults (2.5 percent). However, white adults with AMI were less likely than black adults with AMI to have used inpatient mental health services (2.9 vs. 5.1 percent).
FIGURE 4.2 Mental Health Service Use in the Past Year among Adults with Any Mental Illness, by Race/Ethnicity and Service Type, 2008-201229
CHAPTER 4 Differences in Mental Health Service Use among Adults with Any Mental Illness
23
Sub
stan
ce A
bu
se a
nd
Men
tal H
ealt
h S
ervi
ces
Ad
min
istr
atio
n ·
Nat
ion
al S
urv
ey o
n D
rug
Use
an
d H
ealt
h
Any Mental Health Service UsePrescription Medication
Outpatient Services
Inpatient Services
Hispanic
Two or MoreRaces
Asian
American Indian or Alaska Native
Black or African American
White
46.3
29.8
41.6
18.1
44.8
27.3
41.0
23.4
37.5
12.2
37.0
22.4
25.7
18.7
23.1
11.0
26.1
16.6
2.9
5.1
6.2
2.5
3.5
3.2
Annual Average Percentage and 95% Con�dence Intervals
Source: SAMHSA, Center for Behavioral Health Statistics and Quality, National Survey on Drug Use and Health, 2008-2012 (2008-2010 Data – Revised March 2012).

FIGURE 4.3 Mental Health Service Use in the Past Year among Adults with Any Mental Illness, by Race/Ethnicity and Gender, 2008-201229
CHAPTER 4 Differences in Mental Health Service Use among Adults with Any Mental Illness
24
Sub
stan
ce A
bu
se a
nd
Men
tal H
ealt
h S
ervi
ces
Ad
min
istr
atio
n ·
Nat
ion
al S
urv
ey o
n D
rug
Use
an
d H
ealt
h
White Black orAfrican American
Hispanic
37.7
25.3 24.0
51.7
32.229.4
Male Female
Annu
al A
vera
ge P
erce
ntag
e an
d 95
% C
on�d
ence
Inte
rval
s
Source: SAMHSA, Center for Behavioral Health Statistics and Quality, National Survey on Drug Use and Health, 2008-2012 (2008-2010 Data – Revised March 2012).
● Estimates of any mental health service utilization among adults with AMI were lower among black and Hispanic adults than among white adults, regardless of gender (Figure 4.3). For example, estimates of any mental health service use among adults with AMI were 24.0 percent for Hispanic males, 25.3 percent for black males, and 37.7 percent for white males.

● Among adults in each age group who had AMI, white adults were more likely than black or Hispanic adults to use mental health services in the past year (Figure 4.4). For example, among those aged 35 to 49 with AMI, 48.9 percent of white adults used mental health services compared with 34.2 percent of black adults and 29.3 percent of Hispanic adults.
● Estimates of past year mental health service use were similar among black and Hispanic adults with AMI within each age group.
FIGURE 4.4 Mental Health Service Use in the Past Year among Adults with Any Mental Illness, by Race/Ethnicity and Age, 2008-201229
CHAPTER 4 Differences in Mental Health Service Use among Adults with Any Mental Illness
25
Sub
stan
ce A
bu
se a
nd
Men
tal H
ealt
h S
ervi
ces
Ad
min
istr
atio
n ·
Nat
ion
al S
urv
ey o
n D
rug
Use
an
d H
ealt
h
White Black orAfrican American
Hispanic
18 to 25 26 to 34 35 to 49 50 or Older
31.131.9
47.6
29.3
34.2
48.9
25.528.0
44.7
22.019.3
38.7
Annu
al A
vera
ge P
erce
ntag
e an
d 95
% C
on�d
ence
Inte
rval
s
Source: SAMHSA, Center for Behavioral Health Statistics and Quality, National Survey on Drug Use and Health, 2008-2012 (2008-2010 Data – Revised March 2012).
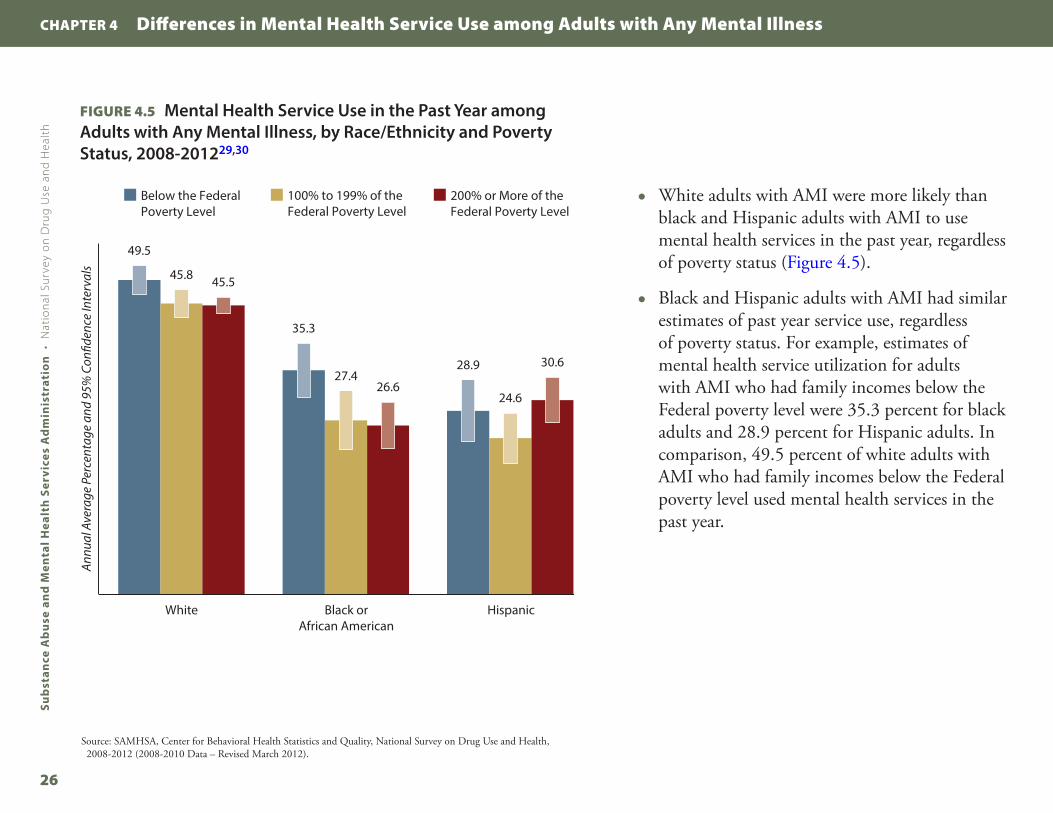
FIGURE 4.5 Mental Health Service Use in the Past Year among Adults with Any Mental Illness, by Race/Ethnicity and Poverty Status, 2008-201229,30
CHAPTER 4 Differences in Mental Health Service Use among Adults with Any Mental Illness
26
Sub
stan
ce A
bu
se a
nd
Men
tal H
ealt
h S
ervi
ces
Ad
min
istr
atio
n ·
Nat
ion
al S
urv
ey o
n D
rug
Use
an
d H
ealt
h
White Black orAfrican American
Hispanic
Below the Federal Poverty Level
100% to 199% of the Federal Poverty Level
200% or More of the Federal Poverty Level
49.5
35.3
28.9
45.8
27.4
24.6
45.5
26.6
30.6
Annu
al A
vera
ge P
erce
ntag
e an
d 95
% C
on�d
ence
Inte
rval
s
Source: SAMHSA, Center for Behavioral Health Statistics and Quality, National Survey on Drug Use and Health, 2008-2012 (2008-2010 Data – Revised March 2012).
● White adults with AMI were more likely than black and Hispanic adults with AMI to use mental health services in the past year, regardless of poverty status (Figure 4.5).
● Black and Hispanic adults with AMI had similar estimates of past year service use, regardless of poverty status. For example, estimates of mental health service utilization for adults with AMI who had family incomes below the Federal poverty level were 35.3 percent for black adults and 28.9 percent for Hispanic adults. In comparison, 49.5 percent of white adults with AMI who had family incomes below the Federal poverty level used mental health services in the past year.

● In each insurance status group, white adults with AMI were more likely to report using mental health services than black or Hispanic adults (Figure 4.6). For example, the estimate for mental health service use among uninsured white adults with AMI (34.0 percent) was higher than the estimate for uninsured black or Hispanic adults with AMI (21.6 and 18.5 percent, respectively).
● The estimate of mental health service utilization for black adults with AMI who had private insurance coverage only was lower than the estimate for their Hispanic counterparts (22.4 vs. 30.9 percent, respectively).
FIGURE 4.6 Mental Health Service Use in the Past Year among Adults with Any Mental Illness, by Race/Ethnicity and Insurance Status, 2008-201229,31
CHAPTER 4 Differences in Mental Health Service Use among Adults with Any Mental Illness
27
Sub
stan
ce A
bu
se a
nd
Men
tal H
ealt
h S
ervi
ces
Ad
min
istr
atio
n ·
Nat
ion
al S
urv
ey o
n D
rug
Use
an
d H
ealt
h
White Black orAfrican American
Hispanic
None Private Only
Medicaid/ Medicare Only
Other Insurance Only
Multiple Insurance Types
34.0
21.6
18.5
47.2
22.4
30.9
56.8
41.0
34.7
48.9
32.8
26.1
46.0
30.8
34.6
Annu
al A
vera
ge P
erce
ntag
e an
d 95
% C
on�d
ence
Inte
rval
s
Source: SAMHSA, Center for Behavioral Health Statistics and Quality, National Survey on Drug Use and Health, 2008-2012 (2008-2010 Data – Revised March 2012).

4.3 Racial/Ethnic Differences in Reasons for Not Using Mental Health Services among Adults with Any Mental Illness Who Reported an Unmet Need for Services
FIGURE 4.7 Reasons for Not Using Mental Health Services among Adults with Any Mental Illness Who Had an Unmet Need for Services in the Past Year, by Race/Ethnicity, 2008-201229
CHAPTER 4 Differences in Mental Health Service Use among Adults with Any Mental Illness
28
Sub
stan
ce A
bu
se a
nd
Men
tal H
ealt
h S
ervi
ces
Ad
min
istr
atio
n ·
Nat
ion
al S
urv
ey o
n D
rug
Use
an
d H
ealt
h
White Black or African American Hispanic
6.6
33.233.2
21.2
52.6
6.1
30.127.9
23.9
47.1
10.4
30.327.7
26.1
57.6
Did Not ThinkServices Would
Help
StructuralBarriers
Prejudice andDiscrimination
Low PerceivedNeed
Cost/Insurance
Annu
al A
vera
ge P
erce
ntag
e an
d 95
% C
on�d
ence
Inte
rval
s
Source: SAMHSA, Center for Behavioral Health Statistics and Quality, National Survey on Drug Use and Health, 2008-2012 (2008-2010 Data – Revised March 2012).
● Among white, black, and Hispanic adults with AMI who had an unmet need for services, cost or insurance (none or inadequate coverage) was the most frequently cited reason for not using mental health services (Figure 4.7). Did not think that services would help was the least frequently cited reason for not using mental health services.
● Among white adults with AMI who reported an unmet need for mental health services, 57.6 percent cited cost or insurance as a reason for not using mental health services. This was higher than the estimate among black adults with AMI who reported an unmet need for mental health services (47.1 percent).
● White adults with AMI who had an unmet need for services were more likely than black or Hispanic adults with AMI to believe that services would not help (10.4 vs. 6.1 and 6.6 percent, respectively).
● Estimates of low perceived need for services, concern over prejudice and discrimination, and structural barriers as reasons for not using mental health services did not differ significantly by race/ethnicity among adults with AMI who had an unmet need for services.

CHAPTER 4 Differences in Mental Health Service Use among Adults with Any Mental Illness
29
Sub
stan
ce A
bu
se a
nd
Men
tal H
ealt
h S
ervi
ces
Ad
min
istr
atio
n ·
Nat
ion
al S
urv
ey o
n D
rug
Use
an
d H
ealt
h
4.4 Summary
Among adults with AMI, estimates of any past year mental health service use, prescription medication use, and outpatient mental health service use among adults with AMI were greater among white adults, American Indian or Alaska Native adults, and adults who reported two or more races than among black, Asian, and Hispanic adults. Moreover, black adults with AMI were more likely than white adults with AMI to have used inpatient mental health services. These patterns in the estimates of mental health service use by race/ethnicity did not change for adults within subgroups defined by gender, age, and insurance status. These findings are consistent with those among all adults reported in Section 3.
NSDUH estimates of mental health service use among adults with AMI by racial/ethnic groups can be compared with those reported by Lee and colleagues, who utilized data from the 2001 to 2002 wave of the National Epidemiologic Survey on Alcohol and Related Conditions (NESARC) to examine racial/ethnic differences in mental health service use among adults with mood disorder.3 However, it should
be noted that the time frames differ for the published NESARC estimates and the NSDUH estimates in this chartbook; the NESARC estimates are produced from questions that ask about mental health service use in the respondents’ lifetime, while the NSDUH estimates are based on questions that ask about past year mental health service use. NESARC estimates of lifetime service use indicate that over 60 percent of white adults with a mood disorder had used mental health services in their lifetime, while 63.7 percent of American Indian or Alaska Native adults, 47.0 percent of Hispanic adults, 42.6 percent of black adults, and 32.4 percent of Asian adults with a mood disorder had used mental health services in their lifetime. Although the NESARC estimates were higher than those in NSDUH, both the NESARC and the NSDUH estimates indicate that white adults and American Indian or Alaska Native adults had similarly high estimates of mental health service use, followed by Hispanic and black adults, with the lowest estimates among Asian adults.

30
This page intentionally left blank

5 Differences in Mental Health Service Use among Adults with Serious Mental Illness
31
Sub
stan
ce A
bu
se a
nd
Men
tal H
ealt
h S
ervi
ces
Ad
min
istr
atio
n ·
Nat
ion
al S
urv
ey o
n D
rug
Use
an
d H
ealt
h
5.1 Introduction
The previous analyses demonstrated that the estimates of any mental health service use are consistently higher among white adults than among black or Hispanic adults, regardless of gender, age, poverty status, insurance status, and the presence of any mental illness (AMI). However, service use increases with the severity of mental illness. Therefore, it is possible that the findings in the previous sections could be explained by racial/ethnic differences in the severity of mental illness.
To address this possibility, this section presents estimates among adults with serious mental illness (SMI). As noted
in Section 2, SMI is defined as the presence of a Diagnostic and Statistical Manual of Mental Disorders, 4th edition (DSM-IV), diagnosable mental illness that results in serious functional impairment (excluding substance use and developmental disorders). Because of greater variability in the estimates associated with the smaller sample sizes of adults with SMI who are American Indians or Alaska Natives, Asians, or reporting two or more races, the estimates in this section are restricted to the three largest racial/ethnic groups: white, black, and Hispanic adults.
5

FIGURE 5.1 Serious Mental Illness among Adults, by Race/Ethnicity, 2008-201229,34
CHAPTER 5 Differences in Mental Health Service Use among Adults with Serious Mental Illness
32
Sub
stan
ce A
bu
se a
nd
Men
tal H
ealt
h S
ervi
ces
Ad
min
istr
atio
n ·
Nat
ion
al S
urv
ey o
n D
rug
Use
an
d H
ealt
h
4.3
3.1 3.1
White Black orAfrican American
Hispanic
Annu
al A
vera
ge P
erce
ntag
e an
d 95
% C
on�d
ence
Inte
rval
s
Source: SAMHSA, Center for Behavioral Health Statistics and Quality, National Survey on Drug Use and Health, 2008-2012 (2008-2011 SMI Data – Revised October 2013).
● Among white, black, and Hispanic adults, the estimate of SMI was higher among white adults (4.3 percent) than among black or Hispanic adults (3.1 percent) (Figure 5.1).
● Estimates for SMI, including standard errors (SEs), are found in Appendix A, Table A.1. Detailed estimates for all other figures in this section are in Appendix C.
5.2 Racial/Ethnic Differences in Past Year Mental Health Service Use among Adults with Serious Mental Illness
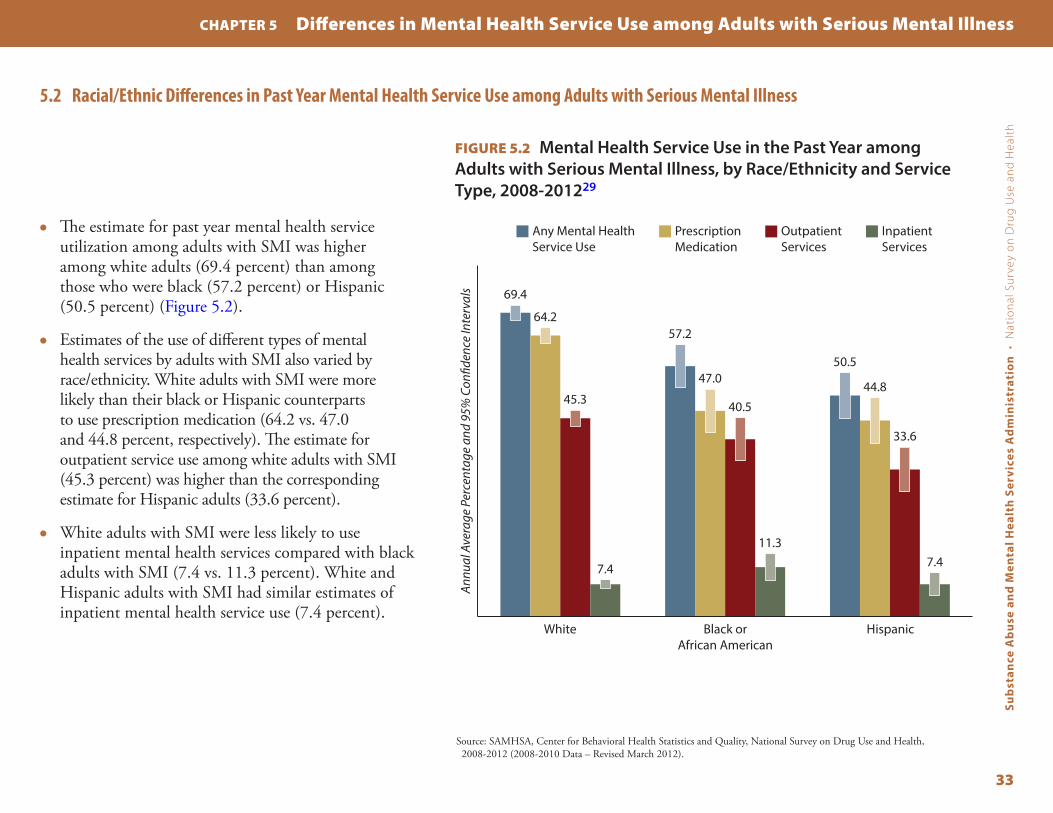
● The estimate for past year mental health service utilization among adults with SMI was higher among white adults (69.4 percent) than among those who were black (57.2 percent) or Hispanic (50.5 percent) (Figure 5.2).
● Estimates of the use of different types of mental health services by adults with SMI also varied by race/ethnicity. White adults with SMI were more likely than their black or Hispanic counterparts to use prescription medication (64.2 vs. 47.0 and 44.8 percent, respectively). The estimate for outpatient service use among white adults with SMI (45.3 percent) was higher than the corresponding estimate for Hispanic adults (33.6 percent).
● White adults with SMI were less likely to use inpatient mental health services compared with black adults with SMI (7.4 vs. 11.3 percent). White and Hispanic adults with SMI had similar estimates of inpatient mental health service use (7.4 percent).
FIGURE 5.2 Mental Health Service Use in the Past Year among Adults with Serious Mental Illness, by Race/Ethnicity and Service Type, 2008-201229
CHAPTER 5 Differences in Mental Health Service Use among Adults with Serious Mental Illness
33
Sub
stan
ce A
bu
se a
nd
Men
tal H
ealt
h S
ervi
ces
Ad
min
istr
atio
n ·
Nat
ion
al S
urv
ey o
n D
rug
Use
an
d H
ealt
h
White Black orAfrican American
Hispanic
Any Mental Health Service Use
Prescription Medication
Outpatient Services
Inpatient Services
69.4
57.2
50.5
64.2
47.044.8
45.3 40.5
33.6
7.4
11.37.4
Annu
al A
vera
ge P
erce
ntag
e an
d 95
% C
on�d
ence
Inte
rval
s
Source: SAMHSA, Center for Behavioral Health Statistics and Quality, National Survey on Drug Use and Health, 2008-2012 (2008-2010 Data – Revised March 2012).

FIGURE 5.3 Mental Health Service Use in the Past Year among Adults with Serious Mental Illness, by Race/Ethnicity and Gender, 2008-201229
CHAPTER 5 Differences in Mental Health Service Use among Adults with Serious Mental Illness
34
Sub
stan
ce A
bu
se a
nd
Men
tal H
ealt
h S
ervi
ces
Ad
min
istr
atio
n ·
Nat
ion
al S
urv
ey o
n D
rug
Use
an
d H
ealt
h
White Black orAfrican American
Hispanic
62.4
48.051.5
73.4
61.3
50.0
Male Female
Annu
al A
vera
ge P
erce
ntag
e an
d 95
% C
on�d
ence
Inte
rval
s
Source: SAMHSA, Center for Behavioral Health Statistics and Quality, National Survey on Drug Use and Health, 2008-2012 (2008-2010 Data – Revised March 2012).
● Mental health service use was higher among white adults with SMI for both males and females compared with their black or Hispanic male and female counterparts (Figure 5.3).

● Within each age group, the estimate of past year service use was higher among white adults with SMI compared with their black or Hispanic counterparts (Figure 5.4). For example, among adults aged 18 to 25, 57.6 percent of white adults with SMI had used mental health services in the past year compared with 40.3 percent of black adults and 40.2 percent of Hispanic adults with SMI.
FIGURE 5.4 Mental Health Service Use in the Past Year among Adults with Serious Mental Illness, by Race/Ethnicity and Age, 2008-201229
CHAPTER 5 Differences in Mental Health Service Use among Adults with Serious Mental Illness
35
Sub
stan
ce A
bu
se a
nd
Men
tal H
ealt
h S
ervi
ces
Ad
min
istr
atio
n ·
Nat
ion
al S
urv
ey o
n D
rug
Use
an
d H
ealt
h
White Black orAfrican American
Hispanic
57.6
40.3 40.2
65.056.2
48.7
71.3
57.9 58.5
74.5
* *
18 to 25 26 to 34 35 to 49 50 or Older
Annu
al A
vera
ge P
erce
ntag
e an
d 95
% C
on�d
ence
Inte
rval
s
* Low precision; no estimate reported.
Source: SAMHSA, Center for Behavioral Health Statistics and Quality, National Survey on Drug Use and Health, 2008-2012 (2008-2010 Data – Revised March 2012).

FIGURE 5.5 Mental Health Service Use in the Past Year among Adults with Serious Mental Illness, by Race/Ethnicity and Poverty Status, 2008-201229,30
CHAPTER 5 Differences in Mental Health Service Use among Adults with Serious Mental Illness
36
Sub
stan
ce A
bu
se a
nd
Men
tal H
ealt
h S
ervi
ces
Ad
min
istr
atio
n ·
Nat
ion
al S
urv
ey o
n D
rug
Use
an
d H
ealt
h
White Black orAfrican American
Hispanic
69.0 63.1
52.0
65.9 58.6
44.0
71.4
50.053.1
Below the Federal Poverty Level
100% to 199% of the Federal Poverty Level
200% or More of the Federal Poverty Level
Annu
al A
vera
ge P
erce
ntag
e an
d 95
% C
on�d
ence
Inte
rval
s
Source: SAMHSA, Center for Behavioral Health Statistics and Quality, National Survey on Drug Use and Health, 2008-2012 (2008-2010 Data – Revised March 2012).
● White adults with SMI who had a family income below the Federal poverty level were more likely than their Hispanic counterparts to have used mental health services in the past year (69.0 vs. 52.0 percent, respectively) (Figure 5.5).
● White and black adults with SMI who had a family income between 100 and 199 percent of the Federal poverty level had similar estimates of past year mental health service use (65.9 and 58.6 percent, respectively). White adults with SMI who had a family income between 100 and 199 percent of the Federal poverty level had a higher estimate of mental health service use than their Hispanic counterparts (65.9 vs. 44.0 percent, respectively).
● White adults with SMI who had a family income at 200 percent or more of the Federal poverty level were more likely to use mental health services than black or Hispanic adults with SMI who had a similar family income level (71.4 vs. 50.0 and 53.1 percent, respectively).

● Among uninsured adults with SMI, the estimate of past year mental health service utilization for white adults (53.1 percent) was higher than that for black adults (41.3 percent) or Hispanic adults (36.8 percent) (Figure 5.6). Estimates were similar for uninsured black and Hispanic adults with SMI.
● Among adults with SMI who had only private health insurance coverage, the percentage of mental health service use was higher among white adults (70.5 percent) than among black adults (46.6 percent) and Hispanic adults (51.9 percent). Estimates were similar for black and Hispanic adults with SMI who had only private health insurance coverage.
FIGURE 5.6 Mental Health Service Use in the Past Year among Adults with Serious Mental Illness, by Race/Ethnicity and Insurance Status, 2008-201229,31
CHAPTER 5 Differences in Mental Health Service Use among Adults with Serious Mental Illness
37
Sub
stan
ce A
bu
se a
nd
Men
tal H
ealt
h S
ervi
ces
Ad
min
istr
atio
n ·
Nat
ion
al S
urv
ey o
n D
rug
Use
an
d H
ealt
h
White Black orAfrican American
Hispanic
53.1
41.3
36.8
70.5
46.651.9
77.671.4
*
69.9
* *
83.8
* *
None Private Only
Medicaid/ Medicare Only
Other Insurance Only
Multiple Insurance Types
Annu
al A
vera
ge P
erce
ntag
e an
d 95
% C
on�d
ence
Inte
rval
s
* Low precision; no estimate reported.
Source: SAMHSA, Center for Behavioral Health Statistics and Quality, National Survey on Drug Use and Health, 2008-2012 (2008-2010 Data – Revised March 2012).

5.3 Racial/Ethnic Differences in Reasons for Not Using Mental Health Services among Adults with Serious Mental Illness Who Reported an Unmet Need for Services
FIGURE 5.7 Reasons for Not Using Mental Health Services among Adults with Serious Mental Illness Who Had an Unmet Need for Services in the Past Year, by Race/Ethnicity, 2008-201229
CHAPTER 5 Differences in Mental Health Service Use among Adults with Serious Mental Illness
38
Sub
stan
ce A
bu
se a
nd
Men
tal H
ealt
h S
ervi
ces
Ad
min
istr
atio
n ·
Nat
ion
al S
urv
ey o
n D
rug
Use
an
d H
ealt
h
Did Not ThinkServices Would
Help
StructuralBarriers
Prejudice andDiscrimination
Low PerceivedNeed
Cost/Insurance
8.7
35.135.4
20.3
58.6
5.5
31.031.2
19.7
51.7
10.8
28.929.6
22.8
62.1
White Black or African American Hispanic
Annu
al A
vera
ge P
erce
ntag
e an
d 95
% C
on�d
ence
Inte
rval
s
Source: SAMHSA, Center for Behavioral Health Statistics and Quality, National Survey on Drug Use and Health, 2008-2012 (2008-2010 Data – Revised March 2012).
● Similar to the findings among all adults and adults with AMI, cost or insurance (none or insufficient coverage) was the most commonly reported reason for not using mental health services among adults with SMI who had an unmet need for mental health services (Figure 5.7).
● Did not think services would help was the least commonly reported reason for not using mental health services in the past year among adults with SMI who had an unmet need.
(continued on next page)

CHAPTER 5 Differences in Mental Health Service Use among Adults with Serious Mental Illness
39
Sub
stan
ce A
bu
se a
nd
Men
tal H
ealt
h S
ervi
ces
Ad
min
istr
atio
n ·
Nat
ion
al S
urv
ey o
n D
rug
Use
an
d H
ealt
h
FIGURE 5.7 (continued)
● Racial/ethnic differences in the reasons for not using mental health services were seen only for cost or insurance and did not think that services would help. For both reasons, the percentage was higher among white adults with SMI who had an unmet need than among their black or Hispanic counterparts.
● Among white adults with SMI who had an unmet need, 62.1 percent reported that they did not receive services because of cost or insurance, and 10.8 percent thought that services would not help.
● Among black adults with SMI who had an unmet need, 51.7 percent did not receive services because of cost or insurance, and 5.5 percent thought that services would not help.
● Approximately 58.6 percent of Hispanic adults with SMI who had an unmet need did not receive services because of cost or insurance, and 8.7 percent thought that services would not help.
5.4 Summary
Regardless of race/ethnicity, adults with SMI were more likely than adults with AMI to report mental health service use in the past year. Among adults with mental illness, the patterns of mental health service use by race/ethnicity were similar among adults with AMI or SMI. The estimate of past year use of any mental health services was higher among white adults than black or Hispanic adults with AMI or SMI. Similarly, estimates of prescription psychiatric medication use and outpatient mental health service use were higher among white adults than among black or Hispanic adults, regardless of the severity of mental illness. However, inpatient mental health service use was more prevalent among black adults with AMI or SMI compared with inpatient white adults with AMI or SMI. To the authors’ best knowledge, NSDUH provides the only annually published nationally representative estimates of past year mental health service use among adults with AMI or SMI by race/ethnicity; therefore, the estimates in this report cannot be directly compared with estimates from other data sources.

40
This page intentionally left blank

End Notes
41
1. U.S. Department of Health and Human Services, Public Health Service, Office of the Surgeon General. (2001). Mental health: Culture, race, and ethnicity—A supplement to Mental health: A report of the Surgeon General. Rockville, MD: Author.
2. Lasser, K. E., Himmelstein, D. U., Woolhandler, S. J., McCormick, D., & Bor, D. H. (2002). Do minorities in the United States receive fewer mental health services than whites? International Journal of Health Services: Planning, Administration, Evaluation, 32, 567-578.
3. Lee, S. Y., Martins, S. S., Keyes, K. M., & Lee, H. B. (2011). Mental health service use by persons of Asian ancestry with DSM-IV mental disorders in the United States. Psychiatric Services, 62, 1180-1186.
4. Dobalian, A., & Rivers, P. A. (2008). Racial and ethnic disparities in the use of mental health services. Journal of Behavioral Health Services & Research, 35, 128-141.
5. Harris, K. M., Edlund, M. J., & Larson, S. (2005). Racial and ethnic differences in the mental health problems and use of mental health care. Medical Care, 43, 775-784.
6. Wang, P. S., Berglund, P., Olfson, M., Pincus, H. A., Wells, K. B., & Kessler, R. C. (2005). Failure and delay in initial treatment contact after first onset of mental disorders in the National Comorbidity Survey Replication. Archives of General Psychiatry, 62, 603-613.
7. Gonzalez, J. M., Alegría, M., Prihoda, T. J., Copeland, L. A., & Zeber, J. E. (2011). How the relationship of attitudes toward mental health treatment and service use differs by age, gender, ethnicity/race and education. Social Psychiatry & Psychiatric Epidemiology, 46(1), 45-57. doi:10.1007/s00127-009-0168-4
8. Keyes, K. M., Hatzenbuehler, M. L., Alberti, P., Narrow, W. E., Grant, B. F., & Hasin, D. S. (2008). Service utilization differences for Axis-I psychiatric and substance use disorders between white and black adults. Psychiatric Services, 59, 893-901.
9. McAlpine, D. D., & Mechanic, D. (2000). Utilization of specialty mental health care among persons with severe mental illness: The roles of demographics, need, insurance, and risk. Health Services Research, 35(1 Pt 2), 277-292.
10. Neighbors, H. W., Caldwell, C., Williams, D. R., Nesse, R., Taylor, R. J., Bullard, K. M. K., Torres, M., & Jackson, J. S. (2007). Race, ethnicity, and the use of services for mental disorders: Results from the National Survey of American Life. Archives of General Psychiatry, 64, 485-494.
11. Wang, P. S., Lane, M., Olfson, M., Pincus, H. A., Wells, K. B., & Kessler, R. C. (2005). Twelve-month use of mental health services in the United States: Results from the National Comorbidity Survey Replication. Archives of General Psychiatry, 62, 629-640. doi:10.1001/archpsyc.62.6.629
12. Mental Health Parity and Addiction Equity Act of 2008, Pub. L. No. 110-343, Title V, Subtitle B of Division C, §§ 511-512 (2008).
13. Barry, C. L., & Huskamp, H. A. (2011). Moving beyond parity—Mental health and addiction care under the ACA. New England Journal of Medicine, 365, 973-975. doi:10.1056/NEJMp1108649
14. Affordable Care Act of 2010, Pub. L. No. 111-148, Title II, §§ 2001-2955 (2010).
15. Garfield, R. L., Zuvekas, S. H., Lave, J. R., & Donohue, J. M. (2011). The impact of national health care reform on adults with severe mental disorders. American Journal of Psychiatry, 168, 486-494.
16. Office of Applied Studies. (2009). Results from the 2008 National Survey on Drug Use and Health: National findings (HHS Publication No. SMA 09-4434, NSDUH Series H-36). Rockville, MD: Substance Abuse and Mental Health Services Administration.

42
Sub
stan
ce A
bu
se a
nd
Men
tal H
ealt
h S
ervi
ces
Ad
min
istr
atio
n ·
Nat
ion
al S
urv
ey o
n D
rug
Use
an
d H
ealt
h
End Notes
17. Center for Behavioral Health Statistics and Quality. (2010). Results from the 2009 National Survey on Drug Use and Health: Mental health findings (HHS Publication No. SMA 10-4609, NSDUH Series H-39). Rockville, MD: Substance Abuse and Mental Health Services Administration.
18. Center for Behavioral Health Statistics and Quality. (2012a). Results from the 2010 National Survey on Drug Use and Health: Mental health findings (HHS Publication No. SMA 11-4667, NSDUH Series H-42). Rockville, MD: Substance Abuse and Mental Health Services Administration.
19. Center for Behavioral Health Statistics and Quality. (2012b). Results from the 2011 National Survey on Drug Use and Health: Mental health findings (HHS Publication No. SMA 12-4725, NSDUH Series H-45). Rockville, MD: Substance Abuse and Mental Health Services Administration.
20. Center for Behavioral Health Statistics and Quality. (2013). Results from the 2012 National Survey on Drug Use and Health: Mental health findings (HHS Publication No. SMA 13-4805, NSDUH Series H-47). Rockville, MD: Substance Abuse and Mental Health Services Administration.
21. Office of Management and Budget. (1997). Revisions to the standards for the classification of federal data on race and ethnicity. Federal Register, 62(210), 58781-58790.
22. First, M. B., Spitzer, R. L., Gibbon, M., & Williams, J. B. W. (2002, November). Structured Clinical Interview for DSM-IV-TR Axis I Disorders, Research Version, Non-patient Edition (SCID-I/NP). New York, NY: New York State Psychiatric Institute, Biometrics Research.
23. American Psychiatric Association. (1994). Diagnostic and statistical manual of mental disorders (DSM-IV) (4th ed.). Washington, DC: Author.
24. Substance Abuse and Mental Health Services Administration. (1993, May 20). Final notice establishing definitions for (1) Children with a serious emotional disturbance and (2) adults with a serious mental illness. Federal Register, 58(96), 29422-29425.
25. Substance Abuse and Mental Health Services Administration, Center for Behavioral Health Statistics and Quality. (2013, November 19). The NSDUH Report: Revised estimates of mental illness from the National Survey on Drug Use and Health. Rockville, MD.
26. RTI International. (2008). SUDAAN®, Release 10.0 [computer software]. Research Triangle Park, NC: Author.
27. Payton, M. E., Greenstone, M. H., & Schenker, N. (2003). Overlapping confidence intervals or standard error intervals: What do they mean in terms of statistical significance? Journal of Insect Science, 3, 34.
28. Schenker, N., & Gentleman, J. F. (2001). On judging the significance of differences by examining the overlap between confidence intervals. American Statistician, 55(3), 182-186.
29. This figure presents the annual average percentages and 95 percent confidence intervals for mental health service use from 2008 to 2012. The annual average is the average percentage of mental health service use per year for 2008 to 2012.
30. Respondents aged 18 to 22 currently living in a college dormitory were excluded from the poverty calculation.
31. Other health insurance is defined as having the Civilian Health and Medical Program of the Uniformed Services (CHAMPUS), TRICARE, Civilian Health and Medical Program of the Department of Veterans Affairs (CHAMPVA), the U.S. Department of Veterans Affairs (VA), military health care, or any other type of health insurance.
32. Snowden, L. R., & Cheung, F. K. (1990). Use of inpatient mental health services by members of ethnic minority groups. American Psychologist, 45, 347-355.
33. Estimates for AMI presented in this figure may differ from previously published AMI estimates because of revised estimation procedures. For details, see The NSDUH Report: Revised Estimates of Mental Illness from the National Survey on Drug Use and Health.
34. Estimates for SMI presented in this figure may differ from previously published SMI estimates because of revised estimation procedures. For details, see The NSDUH Report: Revised Estimates of Mental Illness from the National Survey on Drug Use and Health.

List of Figures
43
Figure 3�1 Mental Health Service Use in the Past Year among Adults, by Race/Ethnicity and Service Type, 2008-2012 � � � � � � � � � � � � � � � � � � � 12
Figure 3�2 Mental Health Service Use in the Past Year among Adults, by Race/Ethnicity and Gender, 2008-2012 � � � � � � � � � � � � � � � � � � � � � � � � 14
Figure 3�3 Mental Health Service Use in the Past Year among Adults, by Race/Ethnicity and Age, 2008-2012� � � � � � � � � � � � � � � � � � � � � � � � � � � � 15
Figure 3�4 Mental Health Service Use in the Past Year among Adults, by Race/Ethnicity and Poverty Status, 2008-2012 � � � � � � � � � � � � � � � � � 16
Figure 3�5 Mental Health Service Use in the Past Year among Adults, by Race/Ethnicity and Insurance Status, 2008-2012 � � � � � � � � � � � � � � � 17
Figure 3�6 Reasons for Not Using Mental Health Services among Adults Who Had an Unmet Need for Services in the Past Year, by Race/Ethnicity, 2008-2012 � � � � � � � � � � � � � � � � � � � � � � � � � � � � � � � � � � � � 18
Figure 4�1 Any Mental Illness in the Past Year among Adults, by Race/Ethnicity, 2008-2012 � � � � � � � � � � � � � � � � � � � � � � � � � � � � � � � � � � � � � � � � � � 22
Figure 4�2 Mental Health Service Use in the Past Year among Adults with Any Mental Illness, by Race/Ethnicity and Service Type, 2008-2012� � � � � � � � � � � � � � � � � � � � � � � � � � � � � � � � � � � � � � � � � � � � � � � � � � � � 23
Figure 4�3 Mental Health Service Use in the Past Year among Adults with Any Mental Illness, by Race/Ethnicity and Gender, 2008-2012� � � � � � � � � � � � � � � � � � � � � � � � � � � � � � � � � � � � � � � � � � � � � � � � � � � � 24
Figure 4�4 Mental Health Service Use in the Past Year among Adults with Any Mental Illness, by Race/Ethnicity and Age, 2008-2012� � � � � � � � � � � � � � � � � � � � � � � � � � � � � � � � � � � � � � � � � � � � � � � � � � � � 25
Figure 4�5 Mental Health Service Use in the Past Year among Adults with Any Mental Illness, by Race/Ethnicity and Poverty Status, 2008-2012 � � � � � � � � � � � � � � � � � � � � � � � � � � � � � � � � � � � � � � � � � � � � 26
Figure 4�6 Mental Health Service Use in the Past Year among Adults with Any Mental Illness, by Race/Ethnicity and Insurance Status, 2008-2012 � � � � � � � � � � � � � � � � � � � � � � � � � � � � � � � � � � � � � � � � � � � � 27
Figure 4�7 Reasons for Not Using Mental Health Services among Adults with Any Mental Illness Who Had an Unmet Need for Services in the Past Year, by Race/Ethnicity, 2008-2012 � � � � � � � � � 28
Figure 5�1 Serious Mental Illness among Adults, by Race/Ethnicity, 2008-2012� � � � � � � � � � � � � � � � � � � � � � � � � � � � � � � � � � � � � � � � � � � � � � � � � � � � 32
Figure 5�2 Mental Health Service Use in the Past Year among Adults with Serious Mental Illness, by Race/Ethnicity and Service Type, 2008-2012 � � � � � � � � � � � � � � � � � � � � � � � � � � � � � � � � � � � � � � � � � � � � � � 33
Figure 5�3 Mental Health Service Use in the Past Year among Adults with Serious Mental Illness, by Race/Ethnicity and Gender, 2008-2012� � � � � � � � � � � � � � � � � � � � � � � � � � � � � � � � � � � � � � � � � � � � � � � � � � � � 34
Figure 5�4 Mental Health Service Use in the Past Year among Adults with Serious Mental Illness, by Race/Ethnicity and Age, 2008-2012� � � � � � � � � � � � � � � � � � � � � � � � � � � � � � � � � � � � � � � � � � � � � � � � � � � � 35
Figure 5�5 Mental Health Service Use in the Past Year among Adults with Serious Mental Illness, by Race/Ethnicity and Poverty Status, 2008-2012 � � � � � � � � � � � � � � � � � � � � � � � � � � � � � � � � � � � � � � � � � � � � 36
Figure 5�6 Mental Health Service Use in the Past Year among Adults with Serious Mental Illness, by Race/Ethnicity and Insurance Status, 2008-2012 � � � � � � � � � � � � � � � � � � � � � � � � � � � � � � � � � � � � � � � � � � � � 37
Figure 5�7 Reasons for Not Using Mental Health Services among Adults with Serious Mental Illness Who Had an Unmet Need for Services in the Past Year, by Race/Ethnicity, 2008-2012� � � � � � 38

List of Tables
44
Sub
stan
ce A
bu
se a
nd
Men
tal H
ealt
h S
ervi
ces
Ad
min
istr
atio
n ·
Nat
ion
al S
urv
ey o
n D
rug
Use
an
d H
ealt
h
Table A�1 Demographic Characteristics of Adults Aged 18 or Older, by Race/Ethnicity: Percentages and Standard Errors, 2008-2012, Annual Averages � � � � � � � � � � � � � � � � � � � � � � � � � � � � � � � � � � � � � A-2
Table A�2 Past Year Use of Mental Health Services among Adults Aged 18 or Older, by Race/Ethnicity and Type of Service: Percentages and Standard Errors, 2008-2012, Annual Averages � � � � � � � � � � � � � A-4
Table A�3 Past Year Use of Any Mental Health Service among Adults Aged 18 or Older, by Race/Ethnicity and Selected Characteristics: Percentages and Standard Errors, 2008-2012, Annual Averages � � � � � � � � � � � � � � � � � � � � � � � � � � � � � � � � � � � � � A-5
Table A�4 Past Year Use of Prescription Psychiatric Medication among Adults Aged 18 or Older, by Race/Ethnicity and Selected Characteristics: Percentages and Standard Errors, 2008-2012, Annual Averages � � � � � � � � � � � � � � � � � � � � � � � � � � � � � � � � � � � � � A-7
Table A�5 Past Year Use of Outpatient Mental Health Services among Adults Aged 18 or Older, by Race/Ethnicity and Selected Characteristics: Percentages and Standard Errors, 2008-2012, Annual Averages � � � � � � � � � � � � � � � � � � � � � � � � � � � � � � � � � � � � � A-9
Table A�6 Past Year Use of Inpatient Mental Health Services among Adults Aged 18 or Older, by Race/Ethnicity and Selected Characteristics: Percentages and Standard Errors, 2008-2012, Annual Averages � � � � � � � � � � � � � � � � � � � � � � � � � � � � � � � � � � � � A-11
Table A�7 Reasons for Not Using Mental Health Services among Adults with an Unmet Need for Services, Aged 18 or Older, by Race/Ethnicity: Percentages and Standard Errors, 2008-2012, Annual Averages � � � � � � � � � � � � � � � � � � � � � � � � � � � � � � � � � � � � A-13
Table B�1 Demographic Characteristics of Adults with Any Mental Illness, Aged 18 or Older, by Race/Ethnicity: Percentages and Standard Errors, 2008-2012, Annual Averages � � � � � � � � � � � �B-2
Table B�2 Past Year Use of Mental Health Services among Adults with Any Mental Illness, Aged 18 or Older, by Race/Ethnicity and Type of Service: Percentages and Standard Errors, 2008-2012, Annual Averages � � � � � � � � � � � � � � � � � � � � � � � � � � � � � � � � � � � � � �B-4
Table B�3 Past Year Use of Any Mental Health Services among Adults with Any Mental Illness, Aged 18 or Older, by Race/Ethnicity and Selected Characteristics: Percentages and Standard Errors, 2008-2012, Annual Averages � � � � � � � � � � � � � � � � � � � � � � � � � �B-5
Table B�4 Reasons for Not Using Mental Health Services among Adults with Any Mental Illness, Aged 18 or Older, Who Reported an Unmet Need for Services, by Race/Ethnicity: Percentages and Standard Errors, 2008-2012, Annual Averages � � � � � � � � � � � �B-7
Table C�1 Demographic Characteristics of Adults with Serious Mental Illness, Aged 18 or Older, by Race/Ethnicity: Percentages and Standard Errors, 2008-2012, Annual Averages � � � � � � � � � � � �C-2
Table C�2 Past Year Use of Mental Health Services among Adults with Serious Mental Illness, Aged 18 or Older, by Race/Ethnicity and Type of Service: Percentages and Standard Errors, 2008-2012, Annual Averages � � � � � � � � � � � � � � � � � � � � � � � � � � � � � � � � � � � � � �C-4
Table C�3 Past Year Use of Any Mental Health Service among Adults with Serious Mental Illness, Aged 18 or Older, by Race/Ethnicity and Selected Characteristics: Percentages and Standard Errors, 2008-2012, Annual Averages� � � � � � � � � � � � � � � � �C-5
Table C�4 Reasons for Not Using Mental Health Services among Adults with Serious Mental Illness, Aged 18 or Older, Who Reported an Unmet Need for Mental Health Services, by Race/Ethnicity: Percentages and Standard Errors, 2008-2012, Annual Averages � � � � � � � � � � � � � � � � � � � � � � � � � � � � � � � � � � � � � �C-7

HHS Publication No. SMA-15-49062015
U.S. Department of Health and Human ServicesSubstance Abuse and Mental Health Services Administration
Center for Behavioral Health Statistics and Qualitywww.samhsa.gov