racial/ethnic differences in health: 10 key...
TRANSCRIPT

Racial/Ethnic Differences in Health:10 Key Facts
David R. Williams, Ph.D., MPHSenior Research Scientist, and
Harold W. Cruse Collegiate Professor of Sociology & Epidemiology
Institute for Social ResearchUniversity of Michigan

Key Fact #1
Racial differences in health are large

African American Mortality• For the 15 leading causes of death in the United
States in 2001, Blacks had higher death rates than whites for:
1. Heart Disease 2. Cancer3. Stroke 5. Accidents6. Diabetes 7. Flu and Pneumonia9. Kidney Diseases 10. Septicemia
14. Hypertension
• Blacks had lower death rates than whites for:4. Respiratory Diseases 8. Alzheimer’s Disease
15. Pneumonitis
11. SuicideSource: NCHS 2003
12. Cirrhosis of the liver 13. Homicide
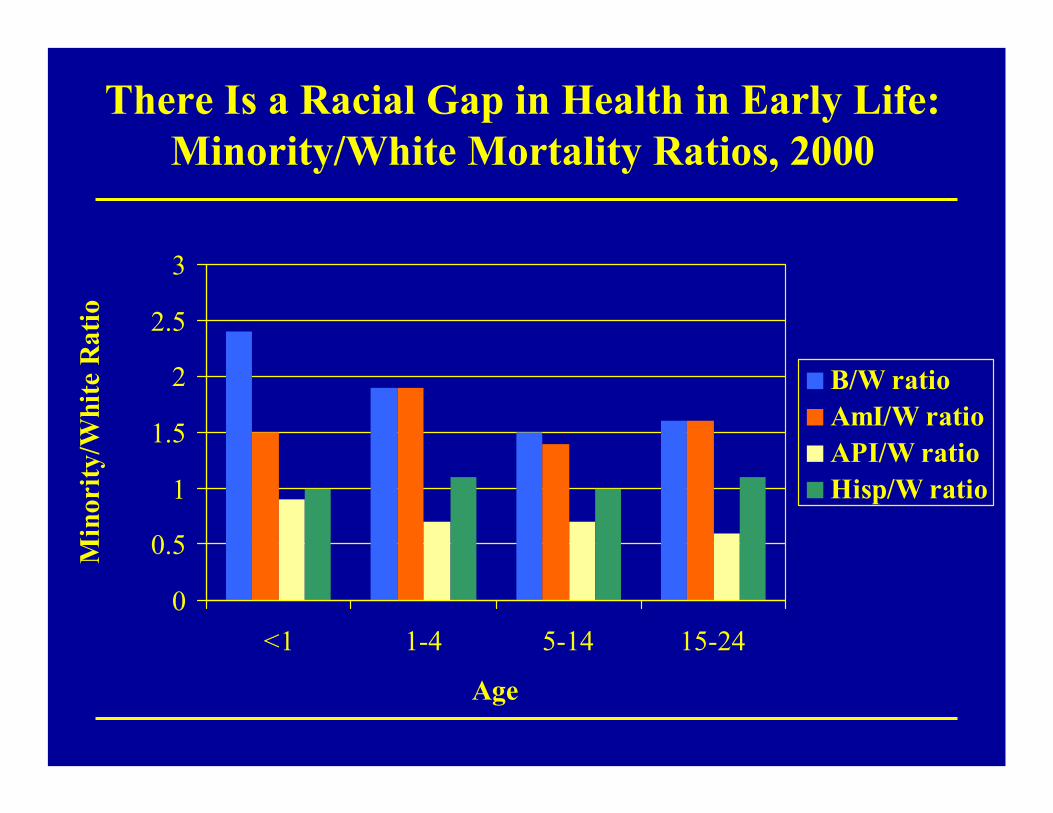
There Is a Racial Gap in Health in Early Life:Minority/White Mortality Ratios, 2000
0
0.5
1
1.5
2
2.5
3
<1 1-4 5-14 15-24
Age
Min
ority
/Whi
te R
atio
B/W ratioAmI/W ratioAPI/W ratioHisp/W ratio

There Is a Racial Gap in Health in Mid Life:Minority/White Mortality Ratios, 2000
0
0.5
1
1.5
2
2.5
25-34 35-44 45-54 55-64
Age
Min
ority
/Whi
te R
atio
B/W ratioAmI/W ratioAPI/W ratioHisp/W ratio

There Is a Racial Gap in Health in Late Life:Minority/White Mortality Ratios, 2000
0.00.20.40.60.81.01.21.41.6
65-74 75-84 85+
Age
Min
ority
/Whi
te R
atio
B/W ratioAmI/W ratioAPI/W ratioHisp/W ratio

Racial Differences in Mortality Reflect:
• Higher incidence of disease• Earlier onset of disease• Poorer survival
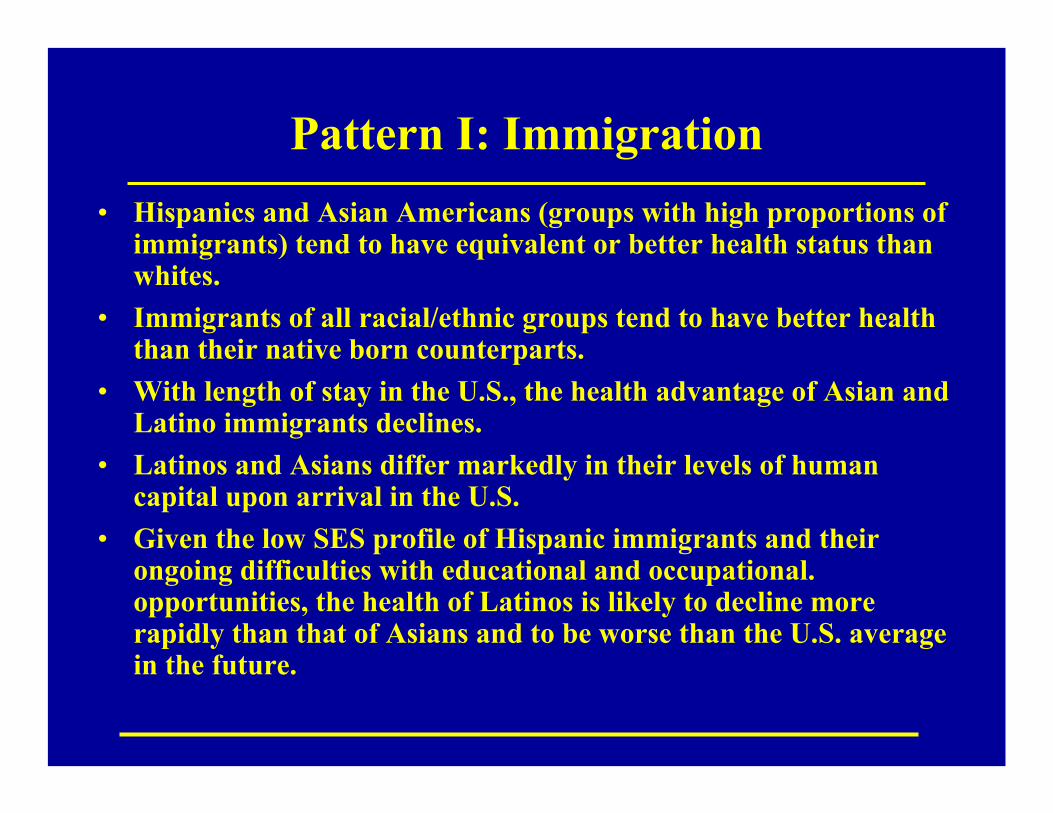
Pattern I: Immigration• Hispanics and Asian Americans (groups with high proportions of
immigrants) tend to have equivalent or better health status thanwhites.
• Immigrants of all racial/ethnic groups tend to have better health than their native born counterparts.
• With length of stay in the U.S., the health advantage of Asian and Latino immigrants declines.
• Latinos and Asians differ markedly in their levels of human capital upon arrival in the U.S.
• Given the low SES profile of Hispanic immigrants and their ongoing difficulties with educational and occupational. opportunities, the health of Latinos is likely to decline more rapidly than that of Asians and to be worse than the U.S. average in the future.

Pattern 2: Socioeconomic Disadvantage and Geographic Marginalization
• African Americans, American Indians, (and Native Hawaiians and other Pacific Islanders) tend to have poorer health outcomes than whites across the life course.
• These differences are remarkably persistent across place and time.
• Racial disparities in health persist in the context of overall improvements in health.

Key Fact #2
In the last 50 years, although overall health has improved,
racial differences in health are unchanged or have widened.
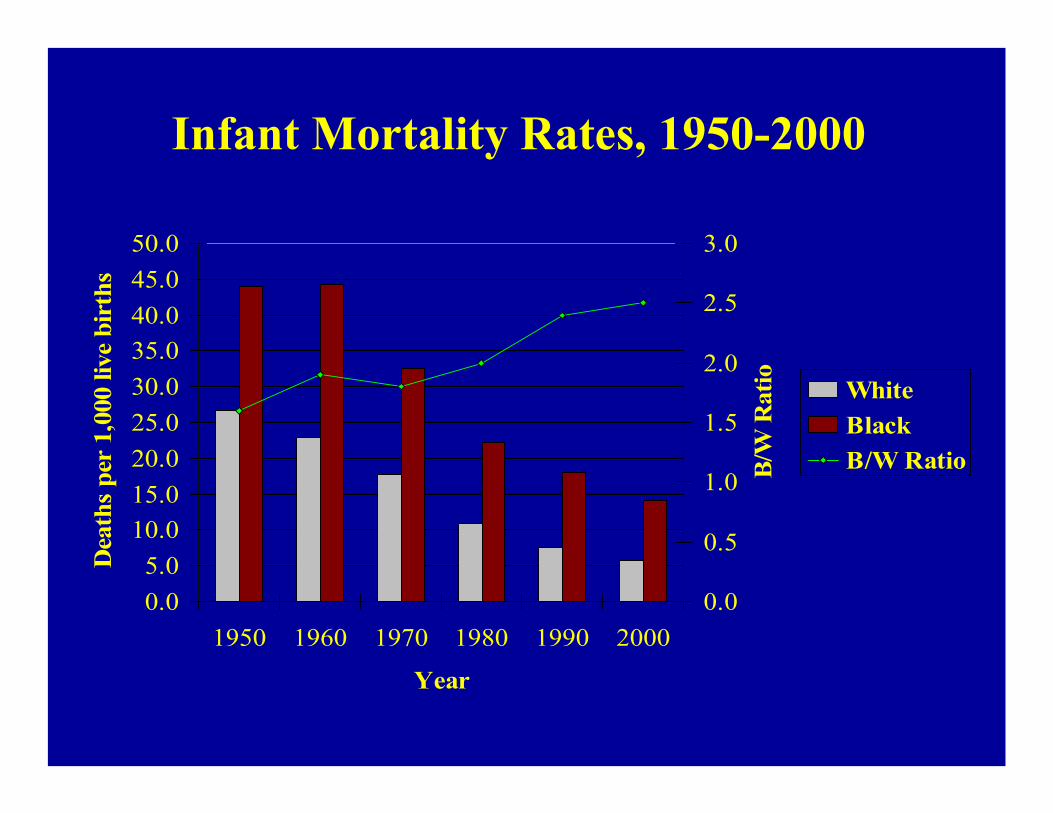
Infant Mortality Rates, 1950-2000
0.05.0
10.015.020.025.030.035.040.045.050.0
1950 1960 1970 1980 1990 2000
Year
Dea
ths
per
1,00
0 liv
e bi
rths
0.0
0.5
1.0
1.5
2.0
2.5
3.0
B/W
Rat
io WhiteBlackB/W Ratio

Mortality Rates from All Causes, 1950-2000
02468
101214161820
1950 1960 1970 1980 1990 2000
Year
Dea
ths
per
1,00
0 po
pula
tion
1.1
1.15
1.2
1.25
1.3
1.35
1.4
1.45
B/W
Rat
io WhiteBlackB/W Ratio
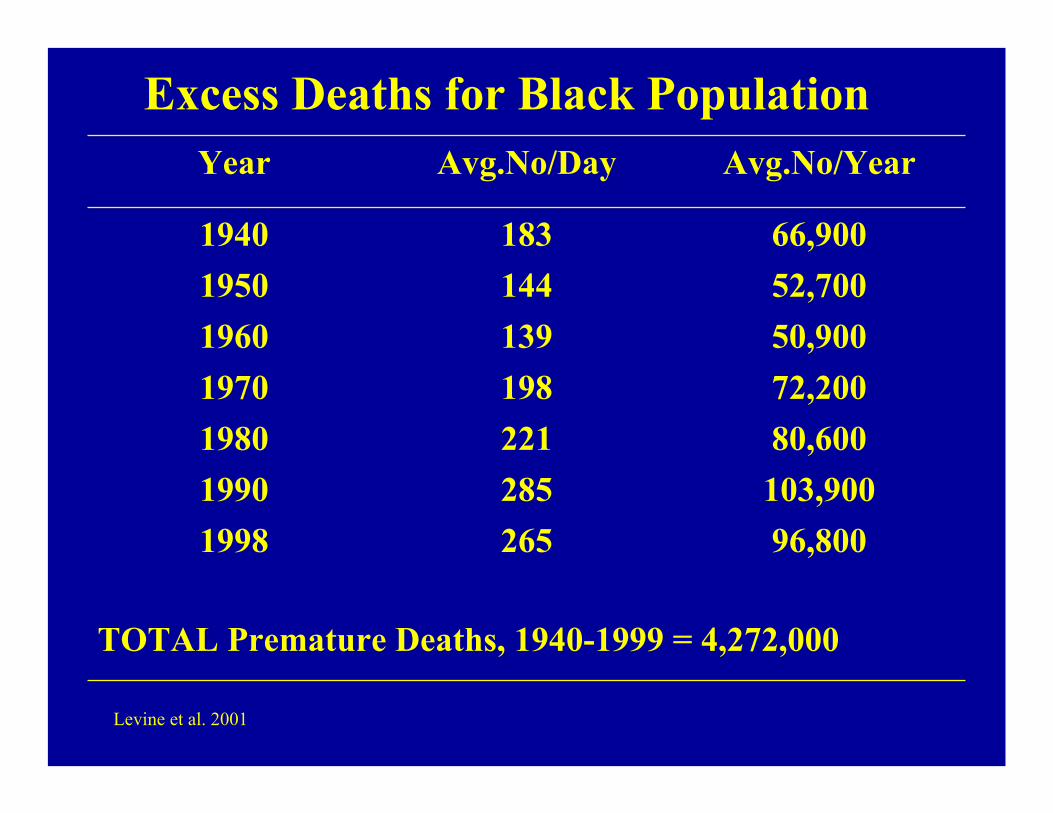
Excess Deaths for Black Population
Levine et al. 2001
TOTAL Premature Deaths, 1940-1999 = 4,272,000
96,8002651998103,900285199080,600221198072,200198197050,900139196052,700144195066,9001831940
Avg.No/YearAvg.No/DayYear

The Persistence of Racial Disparities
• We have FAILED!
• In spite of a War on Poverty, a Civil Rights revolution, Medicare, Medicaid, the Hill-Burton Act, dramatic advances in medical research and technology, we have made little progress in reducing the elevated death rates of blacks relative to whites.
Source: NCHS 2000; Deaths per 1,000 population

Key Fact #3
Racial differences in health are not primarily caused by genetic factors

The Limits of Biology• Our racial categories predate scientific theories of genetics
and modern genetic studies and do not capture well the distribution of genetic characteristics across populations.
• Groups with similar physical characteristics can be very different genetically.
• “The fact that we know what race we belong to tells us more about our society than our biological makeup”1
• “Race is a pigment of our imagination”2
• We need to understand how risk factors/resources in the social/physical environment interact with biological predispositions to affect health
1Krieger and Bassett, 1986; 2Ruben Rumbaut

Hypertension, 7 West African Origin Groups (%)
Source: International Collaborative Study of Hypertension in Blacks, 1995
0
5
10
15
20
25
30
35
Nigeria
Cameroon Rural
Cameroon UrbanJamaica
St. LuciaBarbados Illinois
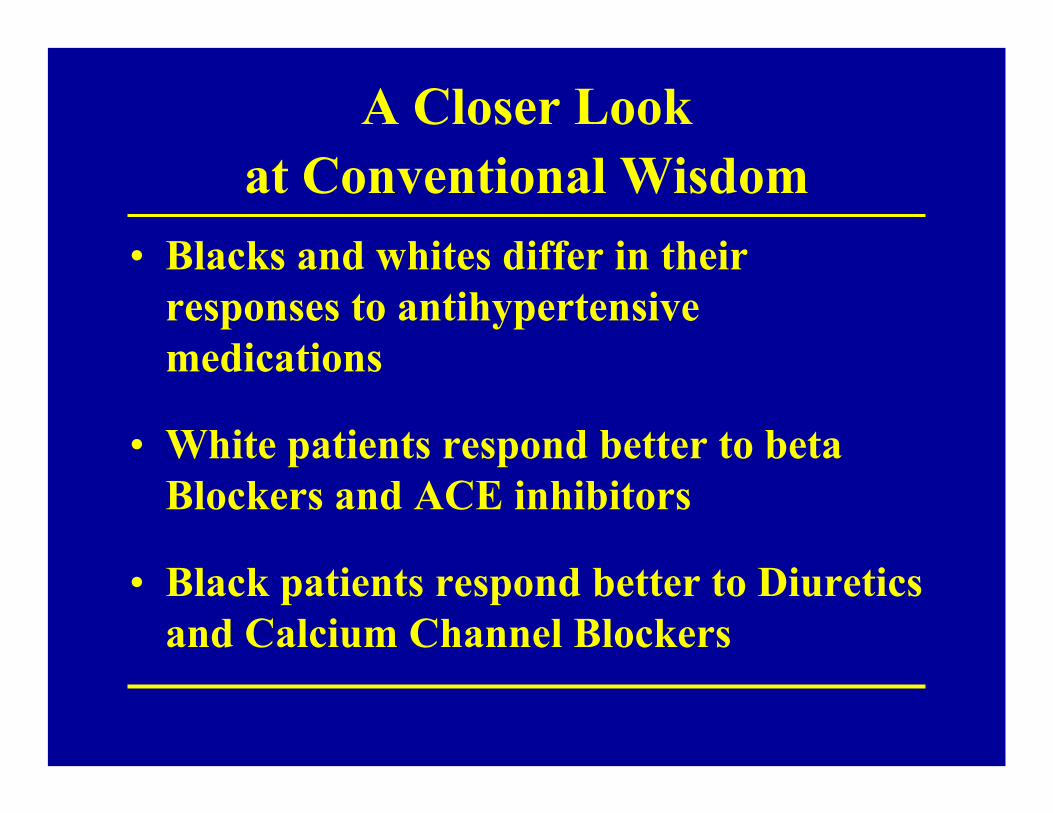
A Closer Look at Conventional Wisdom
• Blacks and whites differ in their responses to antihypertensive medications
• White patients respond better to beta Blockers and ACE inhibitors
• Black patients respond better to Diuretics and Calcium Channel Blockers

Decrement in Systolic B.P. with Antihypertensive Tx
-3.5-2.4
0.61.6
4.66
-5
0
5
10
15
20
25
Diuretic Calcium CBlocker
ß-blocker ACE Inhibitor α-blocker Central α-agonist
Std. Dev. White Std. Dev. Black Difference (W-B) White (W) Mean Black (B) Mean
Source: Sehgal, Ashwini R. (2004). Hypertension. Vol. 43:566-572

Decrement in Diastolic B.P with Antihypertensive Tx
-1.5
2.9 3
0.2
2.4
-0.6
-4
-2
0
2
4
6
8
10
12
14
16
Diuretic Calcium C Blocker ß-blocker ACE Inhibitor α-blocker Central α-agonist
Std. Dev. White Std. Dev. Black Difference (W-B) White (W) Mean Black (B) Mean
Source: Sehgal, Ashwini R. (2004). Hypertension. Vol. 43:566-572

Overlap in Antihypertensive Drug ResponsePercent of Blacks & Whites with Similar Responses to Medications
Medication Systolic Diastolic
Diuretics 86% 90%Calcium C Blocker 93% 95%β-Blocker 83% 90%ACE Inhibitor 86% 81%α-Blocker 88% 87%Central α-Agonist 92% 78%
Source: Sehgal, 2004. Meta Analysis of 15 Clinical Trials.

Skin Color in the Clinical Context
• This meta analysis of 15 clinical trials reveals that the overwhelming majority of blacks and whites have similar responses to all of the common antihypertensive medications
• Thus, simply knowing a patient’s race provides precious little guidance to a clinician in the selection of antihypertensive medications
Key Fact #4
Socioeconomic Status (SES) is a central but incomplete explanation of racial differences in health.

SES and Race• African Americans, Latinos, American Indians, and
some Asian groups have lower levels of education, income, professional status, and wealth than whites. These differences in SES are a major reason for racial/ethnic differences in health.
• Education and income are generally more strongly associated with health status than race.
• Racial differences in health status decrease substantially when blacks and whites are compared at similar levels of SES.

Percent of persons with Fair or Poor Health by Race, 1995
15.1Hispanic
17.3Black
2.26.08.29.1White
Racial DifferencesB-W H-W B-HPercentRace/Ethnicity
Poor=Below poverty; Near poor+<2x poverty; Middle Income = >2x poverty but <$50,000+
Source: Parmuk et al. 1998

Percent of Men with Fair or Poor Health by Race and Income,
1995
4.85.04.2High Income11.913.19.3Middle Income
22.132.426.3SES DifferencePoor=below poverty; Near Poor=<2x poverty; Middle Income=>2x poverty but <$50,000; High Income=$50,000+Source: Pamuk et al. 1998
10.222.621.3Near Poor26.937.430.5Poor
HispanicBlackWhiteHousehold Income

Percent of Women with Fair or Poor Health by Race and Income,
1995
7.09.25.8High Income13.514.69.2Middle Income
23.429.024.4SES DifferencePoor=below poverty; Near Poor=<2x poverty; Middle Income=>2x poverty but <$50,000; High Income=$50,000+Source: Pamuk et al. 1998
24.326.117.9Near Poor30.438.230.2Poor
HispanicBlackWhiteHousehold Income
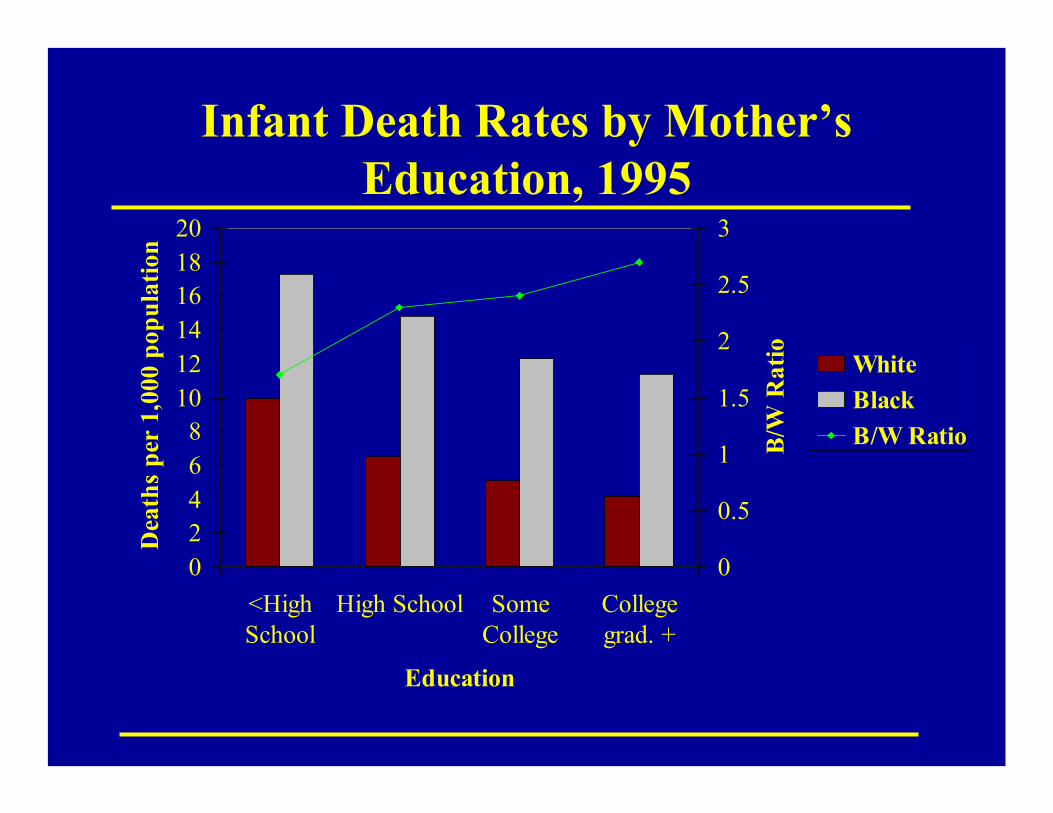
Infant Death Rates by Mother’s Education, 1995
02468
101214161820
<HighSchool
High School SomeCollege
Collegegrad. +
Education
Dea
ths
per
1,00
0 po
pula
tion
0
0.5
1
1.5
2
2.5
3
B/W
Rat
io WhiteBlackB/W Ratio
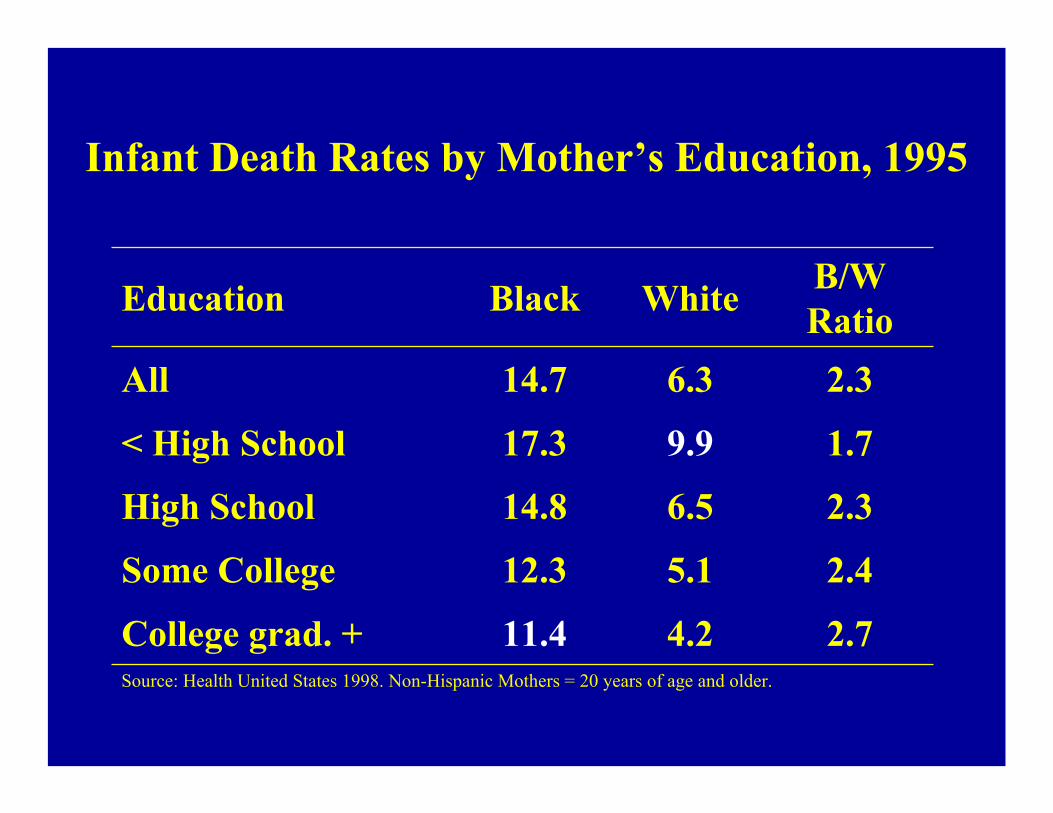
Infant Death Rates by Mother’s Education, 1995
Source: Health United States 1998. Non-Hispanic Mothers = 20 years of age and older.
2.74.211.4College grad. +
2.45.112.3Some College
2.36.514.8High School
1.79.917.3< High School
2.36.314.7All
B/W RatioWhiteBlackEducation

SES: A Gradient Effect
• At every level of ascending the scale of income, education or occupation, there is a corresponding improvement in health.
• A mid-level executive with a three bedroom home is at higher risk of illness and mortality than his/her boss in a five-bedroom home a few blocks away. Both have good jobs, decent income, high education, the same heath insurance.

Key Fact #5
All indicators of SES are not the same across racial/ethnic
groups.

Median Net Worth by Race and Household Income, 1995
Source: Eller, T.J., Household Wealth and Asset Ownership: 1991, U.S. Bureau of the Census, Current Population Reports, Pp 74-34, U.S. Government Printing Office, Washington, D.C., 1994
$80,416$40,866$123,781Richest 20%
$19,424$27,275$57,4454th Quintile
$10,377$11,623$42,1233rd Quintile
$3,898$3,998$26,5342nd Quintile
$1,250$1,500$9,720Poorest 20%
$7,255$7,073$49,030Total
HispanicBlackWhiteHousehold Income

Wealth of Whites and of Minorities per $1 of Whites, 1995
65¢33¢$123,781Richest 20%34¢47¢$57,4454th Quintile25¢28¢$42,1233rd Quintile15¢15¢$26,5342nd Quintile13¢15¢$9,720Poorest 20%15¢14¢$49,030Total
Hisp/WRatio
B/WRatio
WhiteHousehold Income
Source: U.S. Census Bureau, Survey of Income and Program Participation, (Davern et al. 2001)

Key Fact #6
In addition to SES, other factors linked to race/ethnicity (including
racism) are an added burden.

Racism Mechanisms• Institutional discrimination can restrict socioeconomic
attainment a group differences in SES a health.
• Segregation can create pathogenic residential conditions.
• Discrimination can lead to reduced access to desirable goods and services.
• Internalized racism (acceptance of society’s negative characterization) can adversely affect health.
• Racism can create conditions that increase exposure to traditional stressors (e.g. unemployment).
• Experiences of discrimination may be a neglected psychosocial stressor.
Key Fact #7
Place makes an added contribution to health.

Homicide: Case Study of Effect of Place
1. Largest racial gap of 15 leading causes of death in 1998:
6.7 times higher for black than white males3.9 times higher for black than white females
2. Stably high over time: Black homicide death rate was 30.5 per 100,000 in 1950 and 30.6 in 1996
3. Large racial differences in homicide at every level of SES
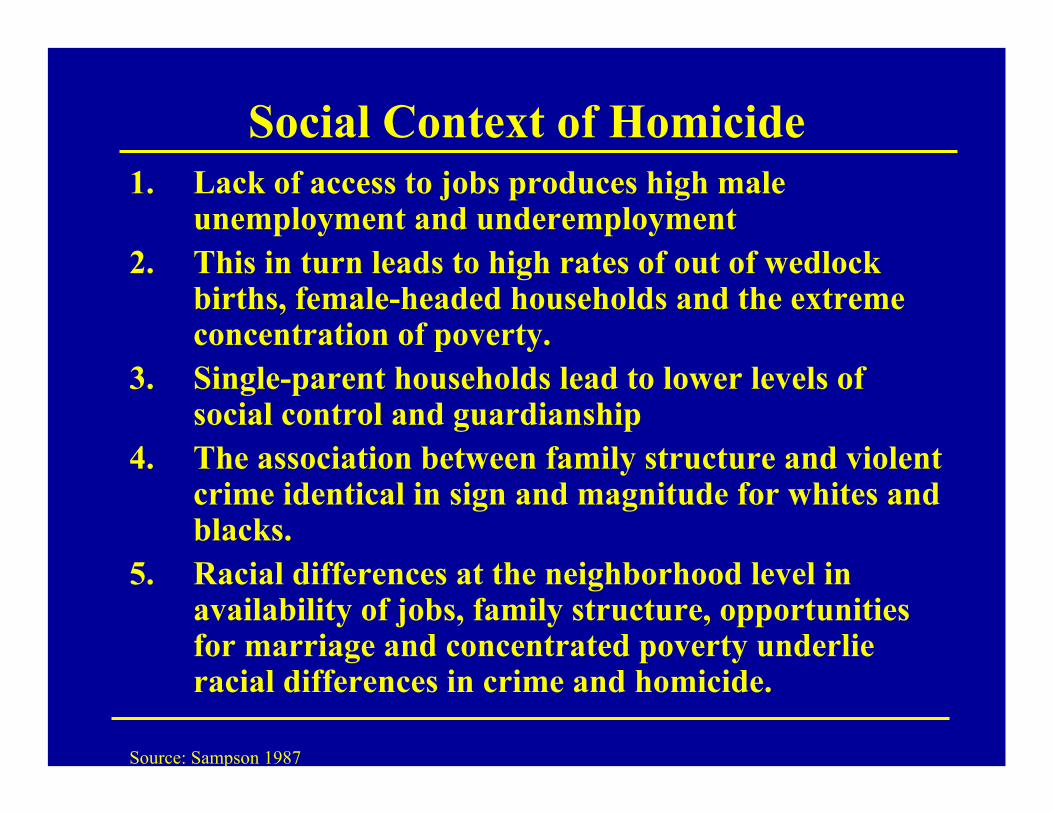
Social Context of Homicide1. Lack of access to jobs produces high male
unemployment and underemployment2. This in turn leads to high rates of out of wedlock
births, female-headed households and the extreme concentration of poverty.
3. Single-parent households lead to lower levels of social control and guardianship
4. The association between family structure and violent crime identical in sign and magnitude for whites and blacks.
5. Racial differences at the neighborhood level in availability of jobs, family structure, opportunities for marriage and concentrated poverty underlie racial differences in crime and homicide.
Source: Sampson 1987

Racial Differences in Residential Environment
• “The sources of violent crime…are remarkably invariant across race and rooted instead in the structural differences among communities, cities, and states in economic and family organization,”p. 41
• In the 171 largest cities in the U.S., there is not even one city where whites live in ecological equality to blacks in terms of poverty rates or rates of single-parent households.
• “The worst urban context in which whites reside is considerably better than the average context of black communities.” p.41
Source: Sampson & Wilson 1995

Residential Segregation and SESA study of the effects of segregation on young African American adults found that the elimination of segregation would erase black-white differences inEarningsHigh School Graduation RateUnemployment
And reduce racial differences in single motherhood by two-thirds
Cutler, Glaeser & Vigdor, 1997

Key Fact #8
There are racial/ethnic differences in access to care and the quality of care


Race and Medical Care• Across virtually every therapeutic intervention,
ranging from high technology procedures to the most elementary forms of diagnostic and treatment interventions, minorities receive fewer procedures and poorer quality medical care than whites.
• These differences persist even after differences in health insurance, SES, stage and severity of disease, co-morbidity, and the type of medical facility are taken into account.
• Moreover, they persist in contexts such as Medicare and the VA Health System, where differences in economic status and insurance coverage are minimized.
Institute of Medicine, 2002

Hispanics and African Americans More Likely to Feel Treated with Disrespect
11%9%
16%18%
13%
0%
10%
20%
Total White AfricanAmerican
Hispanic AsianAmerican
Source: The Commonwealth Fund 2001 Health Care Quality Survey*Felt disrespected because of ability to pay, to speak English, or of their race/ethnicity.
Percent of adults who felt they were treated with disrespect*:Percent of adults who felt they were treated with disrespect*:
*Felt disrespected because of ability to pay, to speak English, or of their race/ethnicity. Source: The Commonwealth Fund 2001 Health care Quality Survey

One in Five Have Gone Without Care When Needed Due to Language Obstacles
Spanish Speaking Latino Data
HQ11: In the course of the past year, how many times were you sick, but decided not to visit a doctor because the doctor didn’t speak Spanish or have an interpreter?
19% Have not sought care when needed due to language barrier

Minorities Face Greater Difficulty in Communicating with Physicians
0
5
10
15
20
25
30
35
Total White Af. Am. Hispanic Asian Am
Percent of adults with one or more communication problems*
Base: Adults with health care visit in past two years
*Problems include understanding doctor, feeling doctor listened, had questions but did not ask. Source: The Commonwealth Fund 2001 Health Care Quality Survey

Minorities More Likely to Forego Asking Questions of Their Doctor
12%10%
13%
19%
14%
0%
5%
10%
15%
20%
25%
Total White AfricanAmerican
Hispanic AsianAmerican
Source: The Commonwealth Fund 2001 Health Care Quality Survey
Base: Adults with health care visit in past two years
Percent of adults reporting they had questions whichthey did not ask on last visit:

Procedures with Higher Rates for Blacks than WhitesMedicare Beneficiaries Age 65 or Older, 1992
Source: McBean and Gornick, 1994
1 = Usually a consequence of diabetes2 = Removal of tissue, usually related to decubitus ulcers3 = Implanting shunts for chronic renal dialysis4 = Removal of both testes, generally performed because of cancer
0.793.621. Amputation (lower limb)
B/W RatioB/W RatioProcedure
Mortality RatesProcedure Rates
0.992.214. Bilateral Orchiectomy
0.665.173. Arteriovenostomy
1.222.652. Excisional Debridement

Ethnicity and AnalgesiaA chart review of 139 patients with isolated long-bone
fracture at UCLA Emergency Department (ED):• All patients aged 15 to 55 years, had the injury within 6
hours of ER visit, had no alcohol intoxication.• 55% of Hispanics received no analgesic compared to
26% of non-Hispanic whites.• With simultaneous adjustment for sex, primary
language, insurance status, occupational injury, time of presentation, total time in ED, fracture reduction and hospital admission, Hispanic ethnicity was the strongest predictor of no analgesia.
• After adjustment for all factors, Hispanics were 7.5 times more likely than non-Hispanic whites to receive no analgesia.
Todd, et al. 1993
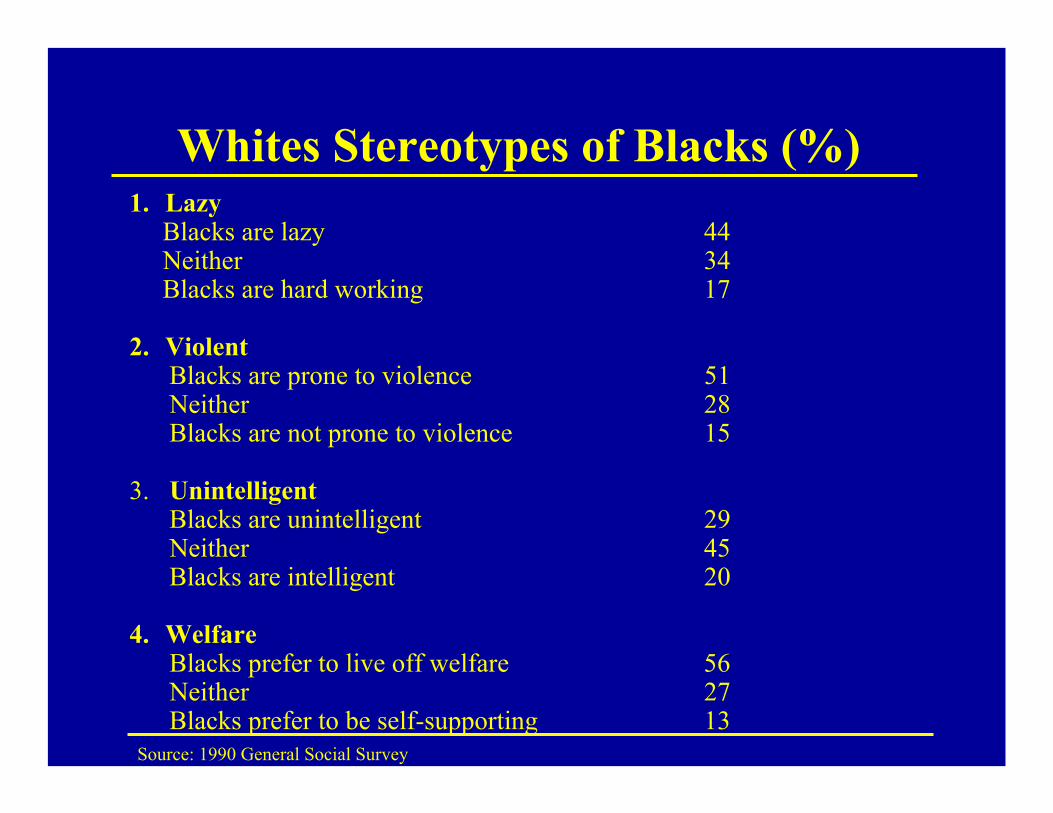
Whites Stereotypes of Blacks (%)1. Lazy
Blacks are lazy 44Neither 34Blacks are hard working 17
2. ViolentBlacks are prone to violence 51Neither 28Blacks are not prone to violence 15
3. UnintelligentBlacks are unintelligent 29Neither 45Blacks are intelligent 20
4. WelfareBlacks prefer to live off welfare 56Neither 27Blacks prefer to be self-supporting 13
Source: 1990 General Social Survey
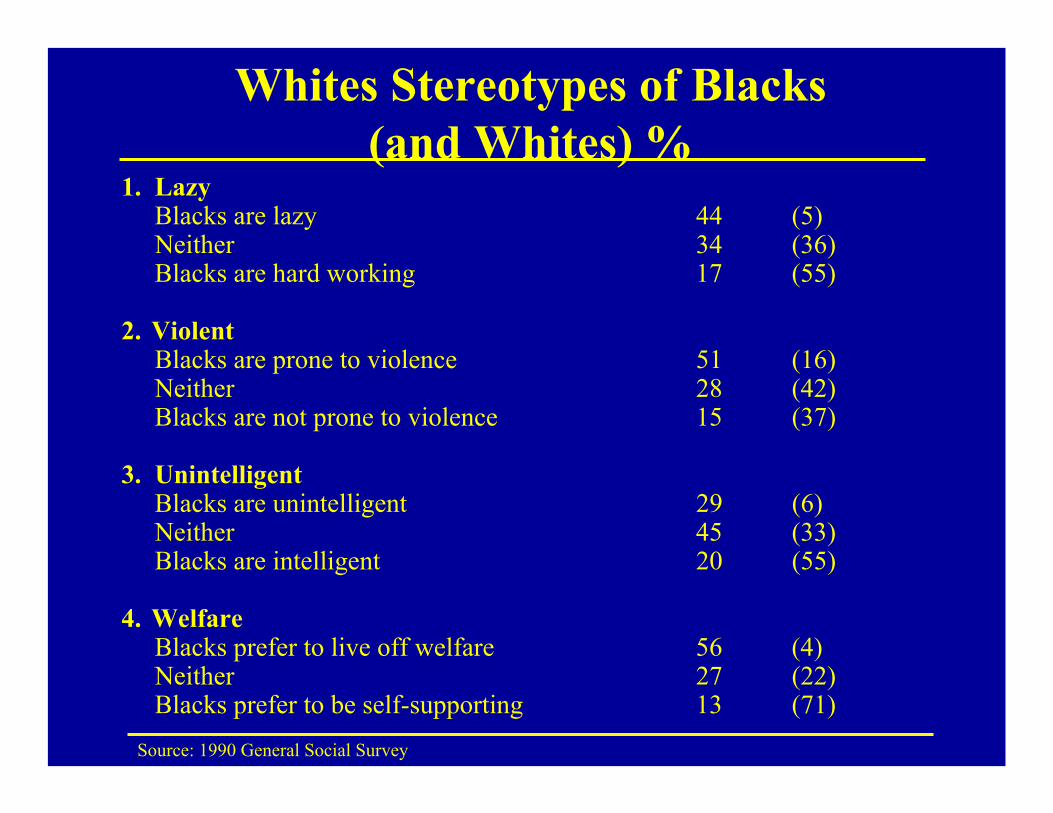
Whites Stereotypes of Blacks (and Whites) %
1. LazyBlacks are lazy 44 (5)Neither 34 (36)Blacks are hard working 17 (55)
2. ViolentBlacks are prone to violence 51 (16)Neither 28 (42)Blacks are not prone to violence 15 (37)
3. UnintelligentBlacks are unintelligent 29 (6)Neither 45 (33)Blacks are intelligent 20 (55)
4. WelfareBlacks prefer to live off welfare 56 (4)Neither 27 (22)Blacks prefer to be self-supporting 13 (71)
Source: 1990 General Social Survey
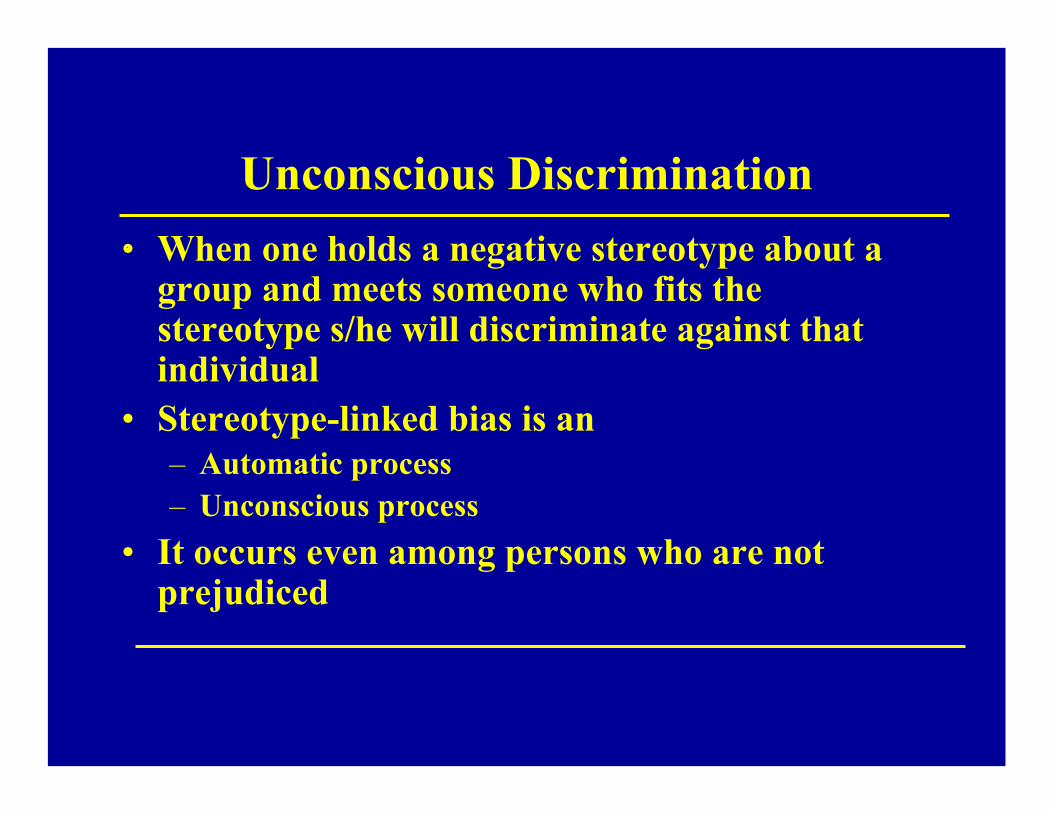
Unconscious Discrimination• When one holds a negative stereotype about a
group and meets someone who fits the stereotype s/he will discriminate against that individual
• Stereotype-linked bias is an – Automatic process– Unconscious process
• It occurs even among persons who are not prejudiced

Factors that Increase Stereotype Usage
Time PressureNeed for Quick JudgmentsHigh Cognitive demandsTask ComplexityResource constraints Anger or Anxiety
Medical Encounter: Time pressure, brief encounters, need to manage complex cognitive tasks.
Source: van Ryn 2002

Key Fact #9
Minorities are still under-represented among health
professionals.

Enrollment in Dental School:Blacks, Other Races, Women
4.7
1970-71 2000-01Percentages
37.63.1All Women 125.02.6Asian
0.60.1American-Indian5.31.0Hispanic
64.491.4White4.5Black
Source: NCHS, 2003; 1 Comparison years for women are 1971-72 with 1999-2000.
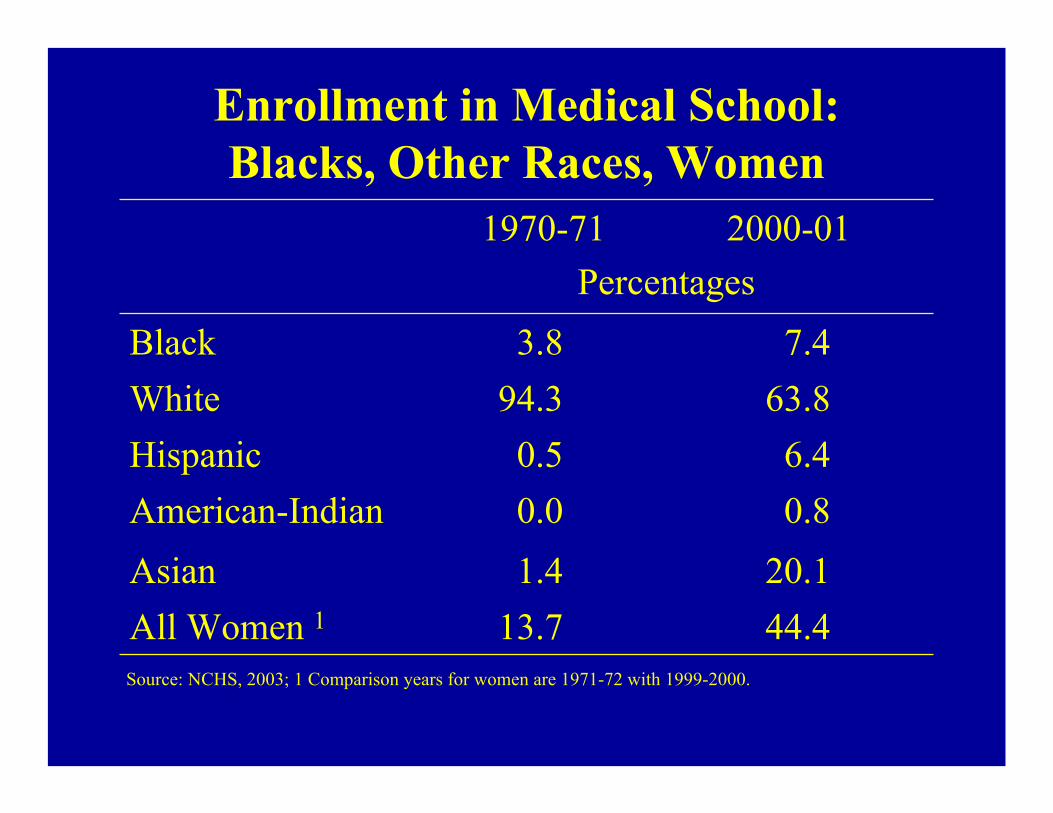
Enrollment in Medical School:Blacks, Other Races, Women
7.4
1970-71 2000-01Percentages
44.413.7All Women 120.11.4Asian
0.80.0American-Indian6.40.5Hispanic
63.894.3White3.8Black
Source: NCHS, 2003; 1 Comparison years for women are 1971-72 with 1999-2000.

Key Fact #10
African Americans have much better mental health than expected

Rates of Psychiatric Disorders and Black/White, Hispanic/White Ratios
National Comorbidity Study
Source: Kessler et.al. (1994)
1.110.7029.54. Any disorder
1.040.4711.33. Any Substance Abuse/Dependence
1.170.9017.12. Any Anxiety Disorder
1.380.7811.31. Any Affective DisorderRatioRatioH/WB/W%
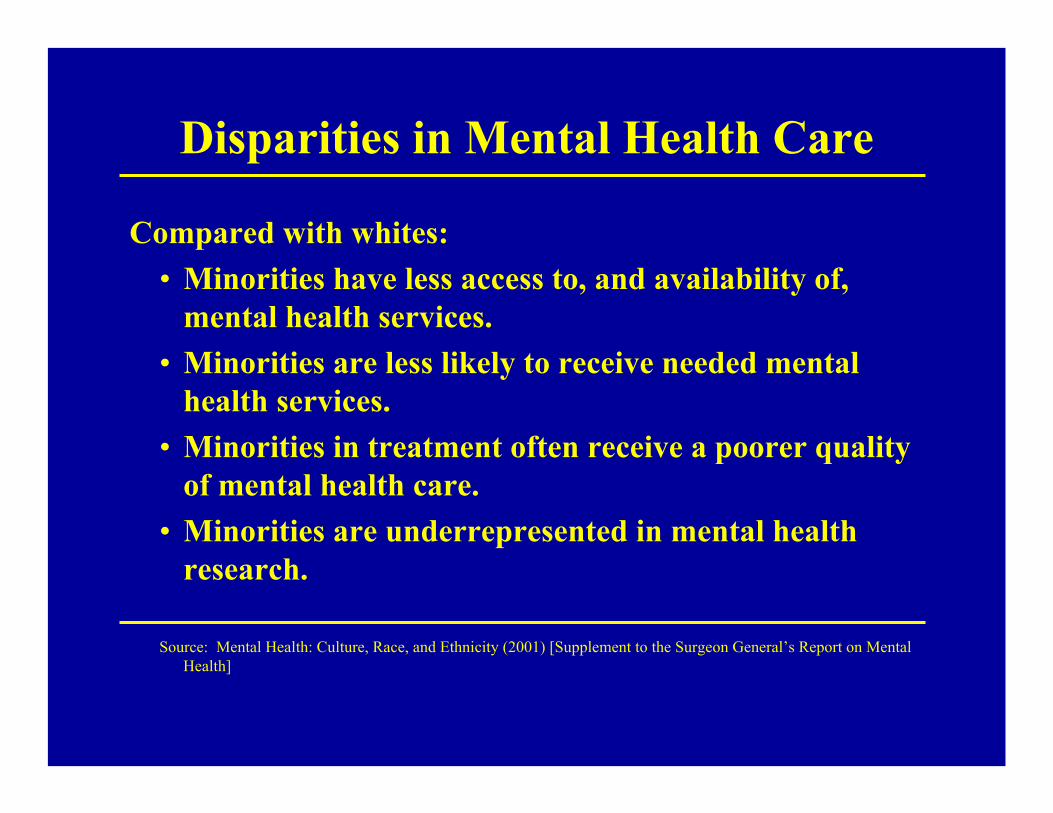
Disparities in Mental Health Care
Compared with whites:• Minorities have less access to, and availability of,
mental health services.• Minorities are less likely to receive needed mental
health services.• Minorities in treatment often receive a poorer quality
of mental health care.• Minorities are underrepresented in mental health
research.
Source: Mental Health: Culture, Race, and Ethnicity (2001) [Supplement to the Surgeon General’s Report on Mental Health]

Health Enhancing Resources?The Case of Religious Involvement
• The role of the clergy as intermediaries between clients and the health care system.
• The role of religious institutions as support resources.• The role of religious congregants as sources of support
and of stress.• The role of public religious participation as an
alternative form of therapy.• Religious belief systems can facilitate coping.• Religious belief systems can lead to poorer adaptation.• The role of religion in encouraging health practices.
The Bottom-Line
Policies to reduce inequalities in health must address fundamental
non-medical determinants.

Reducing InequalitiesAddress Underlying Determinants of Health- I
• Improve living standards for poor persons and households
• Increase access to employment opportunities• Increase education and training that provide
basic skills for the unskilled and better job ladders for the least skilled
• Invest in improved educational quality in the early years and reduce educational failure

Reducing InequalitiesAddress Underlying Determinants of Health- II
• Improve conditions of work, re-design workplaces to reduce injuries and job stress
• Enrich the quality of neighborhood environments and increase economic development in poor areas
• Improve housing quality and the safety of neighborhood environments

Reducing InequalitiesHealth Care
• Improve access to care and the quality of care• Give emphasis to the prevention of illness• Provide effective treatment• Develop incentives to reduce inequalities in the
quality of care

Reducing InequalitiesEngage Multiple Communities
• Knowledge of the extent of disparities and their causes is a prerequisite for effective action• In the U.S., over 50% of whites and over 50% of
blacks are unaware that racial disparities in health exist.
• Partnerships needed with government, industry, and other private organizations
• Important role for community involvement in the identification and management of interventions
• Strengthen the capacity of community organizations to take action

Service Delivery and Social Context•244 low-income hypertensive patients, 80% black (matched on age, race, gender, and blood pressure history) were randomly assigned to:
• Routine Care: Routine hypertensive care from a physician.• Health Education Intervention: Routine care, plus weekly clinic
meetings for 12 weeks run by a health professional.• Outreach Intervention: Routine care, plus home visits by lay health
workers*. Provided info on hypertension, discussed family difficulties, financial strain, employment opportunities, and, as appropriate,provided support, advice, referral, and direct assistance.
* Recruited from the local community, one month of training to address social and medical needs of persons with hypertension.
Source: Syme et al.

Service Delivery and Social Context: Results
After seven months of follow-up, patients in the Outreach group:1. Were more likely to have their blood pressure controlled than
patients in the other two groups.2. Knew twice as much about blood pressure as patients in the
other two groups. Those in the outreach group with more knowledge were more successful in blood pressure control.
3. Were more compliant with taking their hypertensive medication than patients in the health education intervention group. Moreover, good compliers in the outreach third group were twice as successful at controlling their blood pressure as good compliers in the health education group.
Source: Syme et al.