racial harassment , job satisfaction and intentions to
TRANSCRIPT
1
Racial Harassm ent, Job Satisfaction and Intentions to Quit:
Evidence from the British Nursing Profession
M ichael A. Shields and Stephen W heatley Price
Public Sector Economics Research Centre (PSERC), Department of Economics, University of Leicester
and Institute for the Study of Labor (IZA), Bonn
W e investigate the determinants of perceived racial harassment at the workplace, and investigate its
impact on job satisfaction and quitting behaviour amongst ethnic minority nurses. To enable this we use
data from a unique large-scale survey of British National Health Service nurses. Nearly 40% of ethnic
minority nurses report experiencing racial harassment from work colleagues, whilst more than 64% report
suffering racial harassment from patients. The experience of racial harassment at the workplace is found
to lead to a significant reduction in job satisfaction, which, in turn, significantly increases nurses’
intentions to quit their job. These results are found to be robust to endogeneity concerns, and have
important policy implications for retaining qualified nursing staff in the British National Health Service.
Keywords: Racial Harassment, Nursing, Job Satisfaction, Intentions to Quit, Discrimination
JEL Classification: J15, J24, J71

2
INTRODUCTION
For the last fifty years, the National Health Service (NHS) has been the cornerstone of the welfare state in
Britain. However, since its inception there have been persistent allegations that racial discrimination is an
inherent feature of its internal labour market. These allegations have arguably been strongest in the case
of qualified nursing staff who are a key input into the production of health care (see Akinsanya, 1988;
Baxter, 1988; Beishon et al., 1995; Department of Health, 1998a; Ellis, 1990; and Pudney and Shields,
2000a, 2000b).1 As described by Baxter (1988), ‘The endurance of black nurses has been tested more
cruelly and far longer, by persistent and systematic racism in the NHS’. This situation is in stark contrast
to the ‘m arriage of convenience’ arrangement, which occurred in the 1960s when the NHS actively
recruited ethnic minority nurses from overseas in order to meet the chronic shortage of qualified staff
faced by the hospital sector (Thomas and M orton-W illiams, 1972). Since that time, members of ethnic
minorities have been over-represented in the NHS nursing profession, with 6.3% of females nurses and
14.7% of male nurses coming from such minorities in 1990, compared with 3.6% and 3.9% in all
employment in Britain (Beishon et al., 1995). As such, the NHS represents the largest em ployer of ethnic
minority groups in Britain (Department of Health, 1998a).2 Recent government concern about the extent
of discrimination in the nursing labour market has led to ‘a fair process for determining reward’ and
‘equality of opportunity’ being identified as prime objectives in the Department of Health’s recent
Consultancy Document ‘W orking Together: Securing a Quality W orkforce for the NHS’ (Department of
Health, 1998b).
Racial discrimination, of course, is not only a characteristic of the nursing profession but also of the
labour market more generally (for recent British evidence, see Blackaby et al., 1994, 1997, 1998;
M odood et al., 1997; and Shields and W heatley Price, 1999). These studies have focussed on ‘employer
discrimination’ as the primary explanation for unexplained ethnic differences in labour market outcomes.
However, the causes and consequences of racial discrimination at the workplace have rarely been
investigated using more direct measures. In particular, we are unaware of any quantitative studies which
have explored the issue of racial harassment at the workplace.3 This is the most blatant and

3
incontrovertible form of racial discrimination in the labour market. It may take the form of ‘employee
discrimination’ or ‘consumer discrimination’ and may impact on both the well-being of the harassed
individual and their labour market behaviour.
Racial harassment at the workplace has been illegal in Britain since the Race Relations Act of 1976.4
Since the introduction of the Criminal Justice and Public Order Act in 1994, all forms of harassment,
including racial harassment at the workplace, are considered criminal offences punishable by six months
imprisonment or a fine of £5000 (Commission for Racial Equality, 1995). M oreover, the Crime and
Disorder Act of 1998 created new ‘racially aggravated offences’ such as harassment, assault or grievous
bodily harm, which carry significantly higher penalties.
In this paper, we investigate the determinants of racial harassment at the workplace, and its impact on
job satisfaction and quitting behaviour. W e examine these issues using a national survey of NHS nursing
staff collected in 1994. To the best of our knowledge this survey represents the only large-scale British
data source, which provides detailed information on workers’ experiences of racially-motivated
harassment at the workplace. Throughout the study we define racial harassment as behaviour towards the
individual nurse that is perceived to be ‘difficult, aggressive or hostile’ on the grounds of race or colour.
Given the hands-on nature of nursing, we explore the determinants and effects of such abuse emanating
from two sources: work colleagues and patients. These can be considered as particular forms of
‘employee discrimination’ and ‘consumer discrimination’, respectively (Becker, 1957).
Our working hypotheses are that (i) the probability of reporting an episode of racial harassment is a
function of the characteristics of individual nurses, the nursing job and the employer, and (ii) the
experience of racial harassment from either patients or work colleagues leads to a considerable worsening
of the work environment for affected nurses. This, in turn, reduces their overall level of job satisfaction
(or utility from work) and increases the likelihood of them wanting to quit the NHS. In addition to the
large psychological costs, ethnic minority nurses may face long-term economic disadvantage if racial
harassment at the workplace leads them to quit nursing and accept a job with lower pay, become
unemployed or even drop out of the labour market.

4
In addition to the personal costs of quitting, high quit rates in the nursing profession impose
substantial costs on society. In the UK it costs over £50,000 to train a registered nurse, the vast majority
of which is funded by the taxpayer, and over £5,000 for a NHS hospital trust to replace a core staff nurse
(Audit Commission 1997). The social cost is larger for young and newly trained nurses. As we show
later, it is precisely this group of ethnic minority nurses who are most likely to report experiencing racial
harassment at the workplace, the least likely to be satisfied with their job and the most likely to indicate
an intention to quit.
M oreover, in recent years nursing skill shortages have re-emerged in the NHS due to the falling
recruitment of school-leavers into the profession and the poor retention of experienced nursing staff.5 In
1996, for example, there were over 6,600 full-tim e equivalent posts for registered nurses vacant, of which
43% were unfilled for at least three months (Seccombe and Smith 1997). M ore recent estimates place the
nurse shortage at 15,000 (Hancock, 1999). As a result, many hospitals have been forced to rely on
temporary bank (or agency) nurses, which has led to considerable concern about the quality of patient
care. In the worst cases, staffing shortages have led to ward and theatre closures, which have increased
the length of waiting lists for many medical procedures (Audit Commission 1997).It is therefore
important to examine whether, and to what extent, either form of perceived racial harassment at the
workplace increases nurses’ quitting intentions.
The paper is organized as follows. In Section I we introduce our data source and describe the
particular characteristics of our sample. In the following three sections we first discuss some preliminary
statistical results concerning the relevant dependent variables. W e then present our empirical model and
main hypotheses. Lastly, we discuss the results of the econometric investigations. Section II deals with
perceived racial harassment at the workplace. Section III considers job satisfaction and intentions to quit
is the subject of Section IV. In Section V we examine the robustness of our estimates to endogeneity
concerns. Finally, Section VI presents the conclusions from this study.

5
I. DATA AND SAM PLE CHARACTERISTICS
Data
In order to explore the labour market consequences of racial harassment we use a unique survey of NHS
nursing staff undertaken by the Policy Studies Institute and commissioned by the Department of Health
(Beishon et. al., 1995). Postal questionnaires were sent to a random sample of one-in-three of the
permanent nursing staff of 91 NHS employers in England between February and April 1994. Employers
based in areas with a high ethnic minority density (and therefore more likely to have a high proportion of
ethnic minority staff) were deliberately over-sampled in order to provide reliable information about the
experiences of such groups in the NHS. The response rate to the questionnaire was 62% , which generated
a sample of approximately 14,000 nursing staff. The survey presents the most comprehensive source of
information regarding the state of the nursing profession in Britain, and contains wide-ranging
information about the personal and work-related characteristics of nurses as well as their employers.6
In this paper, we focus on those 1203 nurses, aged 21 to 60, who reported their ethnicity as being
other than W hite, and who were qualified as either a State Enrolled nurse (which typically requires two
years training) or Registered General nurse (which requires three years training).
Sample Characteristics
W e now describe the salient features of our sample and begin by considering the individual (or personal)
characteristics of ethnic minority nurses in the NHS. Table A1, in the Appendix, provides the descriptive
statistics of our sample and also those of white nurses as a point of comparison. Only 16.5% of the sample
are male which reflects the female-dominated nature of the nursing profession. The average age of an
ethnic minority nurse was 43 years, with 69% being married and 51% having at least one dependent child
under the age of 16. Over 20% of the nurses in our sample had a high level of education (‘A’ level or
degree), with about 56% having a moderate level of education (‘O’ level or equivalent) and around 23%
possessing no formal schooling qualification.
Using the self-reported ethnicity and country of birth information we can distinguish between four
ethnic minority groups of nurses. The largest group (comprising 38.3% of our sample) are Black
6
Caribbean, the vast majority of whom (82% ) were born in the Caribbean. Black Africans are the second
largest group (26.9% of the sample). Nearly half of this group was born in one country (M auritius)
although all are immigrants to the UK. Over 75% of South Asian nurses (comprising 15.8% of the
sample) were born in the Indian sub-continent. South East Asian nurses (mainly from M alaysia, the
Philippines, Singapore and Hong Kong) account for the remaining 19.0% of ethnic minority nurses in the
British NHS.
W e now discuss the main job-related characteristics of our sample. Three-quarters of ethnic minority
nurses are qualified as Registered General nurses and occupy Staff nurse (grades D and E only), Senior
nurse (Charge nurses - grade F - and W ard M anagers - grade G) and Nurse M anager (grades H and I)
positions. State Enrolled nurses (25.4% of the sample) can occupy grades C – E in the British NHS (grade
C is unique to them). Nearly 57% of all ethnic minority nurses are employed as core Staff nurses, whilst
37% are Senior nurses and 6.2% have a Nurse M anager role. Those working part-time (< 35 hours per
week) account for 22% of ethnic minority nurses, and the mean gross weekly wage is £279. Nearly 12%
of nurses are currently participating in post-basic training. Importantly, over 90% of our sample are
members of a trade union or professional organization. It has been shown elsewhere that ethnic minority
nurses are less likely to be found in the higher grades and receive lower pay than comparable white nurse
(see Pudney and Shields, 2000a, 2000b).
Our survey data also allows us to identify a number of further job-related characteristics, concerning
the nature of nursing in the NHS that may be important in our subsequent analysis. The most prominent
working pattern for ethnic minority nurses (accounting for 45% of our sample) is a mixed shift which
includes night duties, with the remaining shift patterns split between working days only (27.1% ), a m ixed
shift with no night duties (22.7% ) and other (5.2% ). A particular feature of nursing in the NHS, which is
likely to lead to dissatisfaction with the job, is that nearly 44% of these nurses are working a shift pattern
that is not their preferred choice. However, two-thirds of nurses do report having some degree of control
over their exact working shift or hours. In each of these non-pecuniary aspects of the job ethnic minority
nurses are more likely to report the less desirable outcomes, compared to their white colleagues.

7
In addition, ethnic minority nurses are often required to participate in unpaid overtime (nearly 7% ), to
undertake tasks that are generally above their grade (51.5% ) and undertake nursing tasks below their
grade (54.3% ). Ethnic minority nurses are spread widely across specialties with 29.2% working in general
medicine, 16.6% in primary and community care, 19.8% in mental illness, 14.9% in care of the elderly
and 13.7% in midwifery. A much smaller proportion are employed in mental handicap (7.2% ), pediatrics
(4.6% ) and other (2.4% ) specialties. A worrying feature of the internal labour market for nurses in the
NHS is that nearly 20% of ethnic minority nurses report facing discrimination with regard to gaining
promotion or access to training opportunities in their careers.
Lastly, we examine the employer-related characteristics of our sample. Since the NHS health care
reforms in 1989 most District General Hospitals (DGHs) have converted into independent NHS Trusts.
As a result only 18.2% of our sample are employed in DGHs and 77.5% work in NHS Trusts. A small
minority (4.3% ) are based in Family Health Service Authorities (FHSAs). The average size of nursing
employers (defined by the total number of nursing staff) is 1134. Interestingly, only 33% of nurses report
that their employer actively encourages them to participate in career development activities such as
further training. However, 76.1% of ethnic minority nurses report being employed at workplaces that
have an equal opportunities policy in operation.7 It is important to note that the average density of ethnic
minorities in the county in which the employers are located is 11.76% (roughly double the national
average). This reflects the fact that employers in high ethnic minority regions were over-sampled in the
survey. The average proportion of ethnic minority nurses, at our 91 employers, is over 26% . This is again
far greater than in the whole NHS. Our NHS employers are concentrated in the Regional Health
Authorities (RHAs) of London (50% of ethnic minority nurses in our sample are employed by North and
South Thames), with the remainder spread throughout the other English RHAs.

8
II. THE DETERM INANTS OF RACIAL HARASSM ENT AT THE W ORKPLACE
Preliminary Analysis
Of particular interest in this paper are the two questions asked in the survey that focus specifically on
nurses’ perceptions of person-to-person racial harassment at the workplace. The first question relates to
harassment arising from encounters with work colleagues, whilst the second concerns harassment that
occurs as a result of interactions with patients or their families. The questions are as follows:
1. Do members of the nursing staff (including supervisors or managers) ever behave towards you in a
difficult, aggressive or hostile way for reasons to do with you race or colour, and if so how often does
this happen?
2. Do patients or their families ever behave towards you in a difficult, aggressive or hostile way for
reasons to do with you race or colour, and if so how often does this happen?
Each question was addressed to the nurses in the survey, who could answer ‘yes’ to one of the following:
DAILY, W EEKLY, M ONTHLY, LESS OFTEN or NEVER. For ease of exposition, we use the term
‘racial harassment’ to cover all acts of ‘difficult, aggressive or hostile behaviour’ perceived to be based on
the grounds of race or colour. However, there are a relatively small number of cases in some of these
specific categories, especially when the sample is divided by ethnic group. Therefore, we gather together
those reporting racial harassment on a DAILY, W EEKLY or M ONTHLY basis into a FREQUENT
category. For clarity we use the term INFREQUENT for those in the LESS OFTEN category.8
Table 1 shows the distribution of the answers to these two questions by our four main ethnic minority
groups. It is immediately clear that perceived racial harassment is a substantial problem amongst NHS
nurses. Nearly 40% (compared to 4.3% of W hite nurses) of all ethnic minority nurses in our sample report
having experienced some racial harassment from work colleagues in their careers, with 6.5% (0.9% of
W hites) reporting that this occurs frequently (at least monthly). The incidence of racial harassment from
patients, or their families, is even greater. Nearly 65% (15.6% of W hites) of these nurses have been
racially harassed by those that they are seeking to help at some point in their career, with almost 10%
(2.4% of W hites) reporting that this is a frequent occurrence. It is notable that the incidence of racial
harassment is generally higher for Black nurses compared to Asian nurses.

9
TABLE 1: THE INCIDENCE OF RACIAL HARASSM ENT
AT THE W ORKPLACE BY SOURCE AND ETHNIC M INORITY GROUP
Percentage Racial Harassment from Staff Racial Harassment from PatientsFrequent Infrequent Never Frequent Infrequent Never Sample
SizeBlack African 8.3
(1.5)40.1(2.7)
51.5(2.8)
14.5(2.0)
54.9(2.8)
30.6(2.6)
324
Black Caribbean 5.6(1.1)
29.7(2.1)
64.6(2.2)
9.1(1.3)
58.8(2.3)
32.1(2.2)
461
South Asian 8.4(2.0)
30.5(3.4)
61.1(3.6)
5.8(1.7)
50.5(3.6)
43.7(3.6)
190
South East Asian 4.0(1.3)
28.1(3.0)
68.0(3.1)
7.5(1.7)
48.7(3.3)
43.9(3.3)
228
All Non-W hites 6.5(0.7)(2265)
32.3(1.4)
(11255)
61.2(1.4)
(21325)
9.7(0.9)(3380)
54.5(1.4)
(18991)
35.7(1.4)
(12440)
1203
(34845)Note:Standard errors in parenthesis; authors’ calculations of the num ber of NHS nurses (1994) in bolded parenthesis.
Black African nurses are the most likely to have ever been racially harassed by work colleagues, with
more than 48% of them having suffered such behaviour in their careers. South Asian nurses are the most
likely to experience such abuse on a frequent basis (8.4% ) whilst Southeast Asians have the lowest
incidence of frequent or infrequent racial harassment from staff. Given the hands-on nature of nursing,
and the high proportion of total work-time typically spent interacting with patients, it is worrying to find
that over two-thirds of Black nurses, and more than half of Asian nurses, report having been the subject of
racial harassment by patients or their families during their working lives.
M odel and Explanatory Variables
Given the ordinal nature of our two racial harassment questions we estimate ordered probit models to
determine the frequency of racial harassment experienced by individual nurses’ in terms of a latent
variable ( *r ) that drives the observed racial harassment frequency (r). For each individual,
(1) eaaa +′+′+′= 111 321* EM PJOBINDr
N(0,1)~,...,if *
1eIGIgMrMgr
gg−=<<= −
where321 and, aaa are vectors of parameters, g denotes the frequency of racial harassment and r is
coded as:(1) NEVER, (2) INFREQUENT and (3) FREQUENT.Equation (1) describes the individual’s
unobserved propensity to experience racial harassment, *r , given vectors of exogenous individual
10
(IND1), job-related (JOB1) and employer characteristics (EM P1). The thresholds ( 10 to −gMM ) provide
the values of *r required for a given frequency of racial harassment to be experienced, with a value of
0
* Mr < placing an individual at the lowest frequency of racial harassment. As *r increases one or
more racial harassment thresholds are crossed and the individual’s frequency of episodes increases. The
model is estimated by M aximum Likelihood and identification is achieved by setting 0M = 0 (See
Greene, 1997, for additional details).
The individual covariates included in the vector IND1 are those that work colleagues or patients with
the potential for racial harassment could use to differentiate between nurses at the workplace. Firstly, to
avoid the imposition ofany particular function form we enter age as 5 spleen dummy variables. Our
expectation is that young nurses, recently recruited to the profession, will be more vulnerable to episodes
of racial harassment than more experienced nursing staff. W e also include dichotomous variables for
gender and marital status, as well as indicators of general educational attainment in the models.9 Given
the likelihood that person-to-person racial harassment for ethnic minority nurses will be partly determined
by characteristics associated with specific ethnic groups we include our four ethnic minority group
dummy variables in the model. W e anticipate that those nurses who appear to be the most different from
the indigenous white population will be subjected to the greatest frequency of racial harassment.
The second vector of explanatory variables, JOB1, includes a number of distinctive characteristics of
the nursing job. To broadly capture the type of nursing tasks undertaken by various nurses we include
variables for seniority in our models. W e expect that Senior nurses and Nurse M anagers from ethnic
minorities would be subjected to significantly less racial harassment emanating from fellow work
colleagues than nurses at Staff nurse grades (C – E). This is because of the greater likelihood of such
incident(s) being reported and disciplinary action taken. The expected relationship, however, is not so
clear when considering patient-led episodes of racial harassment. It may be the case that the nurses most
likely to be abused are those with whom the patients and their families have the most contact (i.e. Staff
nurses). Alternatively, racial harassment by patients or their families may occur more often in more
stressful situations, such as when the patient is very ill and the family are extremely concerned about the

11
patients’ well being. If this is the case Senior Nurses are more likely to be involved in their care and
therefore subjected to such abuse.
The frequency of racial harassment is likely to be related to time spent at work. W e would anticipate
that part-time nurses might be subject to less abuse. In addition, the shift pattern worked by nurses may
make them more vulnerable to racial harassment. In particular, those working night shifts might be more
exposed to difficult or aggressive patients and their families. The smaller number of staff working during
night shifts, and especially the lower levels of supervision, might be contributory factors. The particular
medical specialty is more likely to affect the frequency of racial harassment by patients than that from
staff. For instance, patients on the paediatric wards might be less likely to racially harass nurses, whilst
patients and relatives attending accident and emergency departments (part of the general medical
specialty) might be the most aggressive and likely to be abusive.
Employer-related characteristics (contained in the vector EM P1) may also play an important part in
determining the frequency of racial harassment that occurs. Nurses working for Family Health Service
Authorities are more likely to work alone amongst patients in their own homes than those based in
hospitals. Here patients are less likely to be restrained in their behaviour or to be witnessed actually
racially harassing nurses. The expected penalty from racial harassment is thus reduced and this may
increase the frequency of such abuse. In addition, the presence of an equal opportunities policy at the
workplace is likely to deter staff from racially harassing nurses due to the increased probability of being
reported and heightened awareness of the punishments that would result. Lastly, the ethnic minority
density in the workplace may be related to staff-based racial harassment. The perceived threats to other
nurses’ job security, and the intensity of racial prejudice, are likely to be heightened when ethnic minority
nurses are more visible in the workplace. This may well lead to increased occurrences of racial
harassment by staff. Similarly, the greater the ethnic minority density in the area that the hospital serves,
the more frequent racial harassment episodes by patients are likely to be.10

12
TABLE 2: ORDERED PROBIT ESTIM ATES
OF THE DETERM INANTS OF RACIAL HARASSM ENT AT THE NHS W ORKPLAC E
Explanatory Variable RACIAL HARASSM ENT FROM STAFF
RACIAL HARASSM ENT FROM PATIENTS
Coefficient Std. Error Coefficient Std. ErrorIndividual characteristicsAge < 30 0.193 0.177 0.655 0.169***Age 30-34 -0.001 0.157 0.543 0.147***Age 35-39 0.274 0.136** 0.565 0.130***Age 40-44 0.246 0.112** 0.333 0.107***Age 45-49 -0.008 0.107 0.239 0.101**M ale 0.218 0.121* 0.019 0.114M arried 0.137 0.081* -0.045 0.076Black African 0.418 0.113*** 0.406 0.106***Black Caribbean 0.194 0.108* 0.296 0.099***South Asian 0.304 0.129** -0.023 0.122Higher qualification (‘A’ level or degree) 0.359 0.123*** 0.134 0.116M iddle qualification (‘O’ level or equivalent) 0.151 0.101 0.132 0.093Job-related characteristicsNurse m anager (grades H and I) -0.003 0.172 -0.111 0.170Senior nurse (grades F and G) -0.239 0.098** 0.099 0.093State Enrolled Staff nurse (grades C, D, and E) -0.255 0.106** 0.021 0.100Current em ployed part-tim e (< 35 hours) -0.111 0.096 -0.051 0.090Tenure in current post (in m onths) 0.003 0.002* 0.003 0.002**Tenure in current post squared / 100 -0.001 0.001* -0.001 0.000*M em ber of a trade union or professional body 0.041 0.145 0.073 0.135Day shift pattern only -0.043 0.113 -0.196 0.106*M ixed shift pattern but with no nights 0.125 0.093 -0.152 0.089*Other shift pattern but with no nights -0.056 0.174 -0.166 0.160Paediatrics specialty -0.113 0.175 -0.483 0.170***M idwifery specialty -0.095 0.119 -0.234 0.112**M ental illness specialty -0.329 0.111*** 0.005 0.102M ental handicap specialty -0.101 0.152 -0.610 0.149***Care of the elderly specialty -0.069 0.108 0.178 0.099*Prim ary and com m unity specialty -0.145 0.143 -0.221 0.134*Other specialty 0.049 0.235 0.124 0.224Em ployer-related characteristicsEm ployed by a General District Hospital -0.224 0.097** -0.004 0.069Em ployed by a Fam ily Health Service Authority -0.081 0.217 0.485 0.205**Size of em ployer / 100 (in term s of nursing staff) -0.001 0.000* -0.001 0.001Equal opportunities policy at workplace -0.151 0.086* 0.099 0.082Percentage of ethnic m inorities in county - - 0.007 0.002***Percentage of ethnic m inority staff at workplace 0.012 0.005*** - -
Sample 1203 1203Log Likelihood -1054.07 -1182.74
M odel 2c (d.f. 34, 34) 90.23*** 115.70***
Notes: * Statistically significant at the .10 level; ** at the .05 level; *** at the .01 level. – indicates that the variable is not included in the m odel. Four constant thresholds were also estim ated. Our base categories are: age 50+; fem ale; single; South East Asian;no general qualifications; Registered General Staff nurse (grades D and E); currently em ployed full-tim e, not a m em ber of a trade or professional body, m ixed shift pattern with nights; general m edical specialty; em ployed by a NHS Hospital Trust; no equal opportunities policy at workplace.

13
Empirical Results
Table 2 reports the coefficient estimates from the two ordered probit determinants of racial harassment
models.11 To a large extent these estimates confirm our prior expectations. Nurses in the prime age ranges
of 35-39 and 40-44 years old are significantly more likely to report frequent racial harassment by fellow
staff members, than those over the age of 49. Nurses in all age ranges younger than 50 are significantly
more likely to report frequent episodes of racial harassment by patients and their families, than those aged
50 or older. The magnitude of the coefficients generally decline with age suggesting that younger nurses
are more vulnerable to frequent racial harassment than older nurses. M ale nurses, those who are married
and those possessing higher qualifications are significantly more likely to report frequent racial
harassment by staff compared to their respective base groups.
Regardless of the source of racial harassment, Black African and Black Caribbean nurses are
significantly more likely to experience frequent episodes of racial harassment, compared to South East
Asian nurses. South Asian nurses also experience significantly more frequent racial harassment from staff
than their South Asian colleagues. These findings generally confirm our expectation that those nurses
who appear to be the most different from the indigenous white population will suffer the most abuse.
Racial harassment from staff is significantly less frequent amongst Senior nurse and State Enrolled Staff
nurses than for Registered General Staff nurses. Tenure in current post (and at current grade) is related to
the reporting of racial harassment from either source with an inverse U-shaped pattern.
As expected, working a shift pattern with no nights is negatively and significantly (in two out of
the three categories) associated with episodes of racial harassment from patients, compared to those
working some night shifts. Ethnic minority nurses in the medical specialties of paediatrics, midwifery,
mental handicap, primary and community report significantly less frequent occurrences of racial
harassment from patients, in comparison with the general medical specialty. However, their colleagues in
the care of the elderly specialty are significantly more likely to report frequent episodes of such abuse,
than those in the base category. In the case of racial harassment by staff, only those ethnic minority nurses
working amongst the mentally ill are less vulnerable than those in the base category. Nurses employed by
General District Hospitals are less likely to experience frequent episodes of racial harassment from staff,

14
and those employed by Family Health Service Authorities are significantly associated with frequent abuse
from patients, compared to nurses in NHS Hospital Trusts.
Interestingly, the presence of an equal opportunities policy, which implies regular training and
monitoring of these issues, significantly reduces the frequency of racial harassment by staff. Evidently,
the awareness of the legal situation that this brings, in combination with the deterrent affect of knowing
the penalties for such illegal activity, act to reduce the incidence and frequency of racial harassment by
staff. Requiring the implementation of equal opportunities policies by all nursing employers and
increasing the level of equal opportunities training may go some way towards combating this form of
racial harassment. Frequent racial harassment by work colleagues (patients) is statistically associated with
increased ethnic minority density at the workplace (in the county). Evidently the majority population, in
each case, are more likely to react in this way the greater is the perceived threat from ethnic minorities.
III. THE IM PACT OF RACIAL HARASSM ENT ON JOB SATISFACTION
Preliminary Analysis
It seems reasonable to expect that workplaces characterised by racial harassment would, for ethnic
minority workers, be less satisfying environments than those where such abuse does not take place. In
addition the frequency of occurrence and the source of the harassment would be expected to affect job
satisfaction. Therefore we examine the proportion of nurses who were satisfied with their job according to
frequency of our two separate sources of racial harassment. As before this is done for the whole ethnic
minority sample and for our four separate groups. Our overall job satisfaction measure is defined as
follows. In the survey each nurse was asked to rank their overall job satisfaction on the following four-
point scale: (1) Very Dissatisfied, (2) Dissatisfied, (3) Neither Satisfied nor Dissatisfied, and (4) Satisfied.
In Table 3 we report the proportion satisfied in each cell (i.e. category 4 only) but in our subsequent
ordered probit analysis the dependent variable takes the full range of values.
The simple calculations confirm our earlier expectations. The proportion of ethnic minority nurses
who are satisfied with their current job is inversely related to the frequency of racial harassment they
experience. Interestingly, but perhaps not surprisingly, racial harassment from staff colleagues results in a

15
lower incidence of job satisfaction (12.8% and 30.1% ), regardless of frequency, when compared to the
more common racial harassment from patients or their families (24.8% and 36.3% , respectively). This
finding generally holds for each ethnic group as well. According to our sample of ethnic minority nurses,
working in the British NHS is not a satisfying experience. Even amongst those who have never been
racially harassed generally more than 50% are not satisfied in their job.
TABLE 3: PERCENTAGE OF ETHNIC M INORITY NURSES REPORTING
JOB SATISFACTION BY SOURCE AND FREQUENCY OF RACIAL HARASSM EN T
Percentage Racial Harassment from Staff Racial Harassment from PatientsFrequent Infrequent Never Frequent Infrequent Never Sample
SizeBlack African 14.8
(7.0)24.6(3.8)
47.9(3.9)
10.6(4.6)
38.8(3.7)
42.4(5.0)
324
Black Caribbean 11.5(6.4)
27.7(3.8)
44.9(2.9)
28.6(7.1)
36.2(2.9)
43.9(4.1)
461
South Asian 12.5(8.5)
31.0(6.1)
51.7(4.7)
36.4(15.2)
36.5(4.9)
49.4(5.5)
190
South East Asian 11.1(11.1)
45.3(6.3)
41.9(4.0)
47.1(12.5)
32.4(4.5)
51.1(5.0)
228
Total Sample 12.8(3.8)
30.1(2.3)
46.1(1.8)
24.8(4.0)
36.3(1.9)
46.3(2.4)
1203
Note:Standard errors in parenthesis
M odel and Explanatory Variables
Since the seminal work of Hamermesh (1977) and Freeman (1978), there has been a growing literature by
econom ists concerned with estim ating the determ inants of job satisfaction. M uch of this work has been
motivated by the psychology literature, which has resulted in considerable agreement over the
explanatory variables that are the most important. W hilst there are a few general studies by economists of
these determinants (e.g. Freeman, 1978; Clark, 1996), most research has been directed at explaining the
relationship between one particular individual or employer characteristic and job satisfaction.12
The general framework adopted is to define an individual’s utility from working as:13
(2) ),,,,,( EM PJOBINDRYHYuU =
where Y is the absolute wage and H is the number of hours worked. Utility from work is assumed to be
positively related to wages, and negatively related to working hours. RY is the wage that the worker
believes she could earn if employed elsewhere (termed the ‘relative’ or ‘comparison’ wage). It is

16
expected that the higher RY relative to Y, the lower will be U. This captures an effect that can be
described as relative deprivation, envy, jealousy or inequity (Clark and Oswald, 1996). Variations in
work-based utility are additionally explained by differences in individual specific characteristics, IND,
job characteristics, JOB, and employer characteristics, EM P (the later two vectors characterising the
general work environment).14
In this paper we extend the elements in (2) as follows:
(3) ),,,,,,( HARASSEM PJOBINDRYHYuU =
whereHARASS is the experience of racial harassment at work, assumed to be negatively related to U.
In this context, our self-reported measure of overall job satisfaction is taken to represent a direct
proxy for U. Consequently, we estimate ordered probit models to determine the level of job satisfaction
reported by individual nurses in terms of a latent variable ( *s ) and the observed job satisfaction level (s)
as follows:
(4) 222lnln 7654321* ubbbbbbb +′+′+′+′+′+′+′= HARASSEM PJOBINDRYHYs
,1)N(0~,...,if *1 uIHIhTsThs hh −=<<= −
where ( )1...7=iib are vectors of parameters and h denotes the level of job satisfaction. W e code s as:
(1) VERY DISSATISFIED, (2) DISSATISFIED, (3) NEITHER SATISFIED NOR DISSATISFIED and
(4) SATISFIED.Equation (4) then describes the individual’s unobserved propensity for job satisfaction
(utility from work), *s , given the seven vectors of exogenous variables. 10 to −hTT are estimated constant
thresholds governing the movement along the job satisfaction index.
W e estimate two versions of the model. In the BASIC model we set β3 = β5 = β6 = 0. Following
previous studies we include controls for age, gender, marital status, ethnic minority background and level
of education in the individual characteristics vector IND2. The coefficient estimates associated with the
frequency of work colleague and patient-led racial harassment (HARASS) therefore provide a benchmark
effect of racial harassment on job satisfaction. If, however, the occurrence of frequent racial harassment is
indicative of a workplace that offers employees a poor work environment in other respects, then this
sim ple m odel will provide biased (upwards) estimates of the effect of racial harassment on job
17
satisfaction.15 Thus in our EXTENDED model we relax these restrictions and, additionally, control for
other important aspects of the nursing working environment which are likely to impact on job
satisfaction. The elements in vector JOB2 are being employed in a shift pattern which is not equal to the
preferred pattern, having a degree of control over working hours, participating in unpaid overtime,
undertaking work tasks above and below nursing grade, having experienced discrimination with regards
to promotion or training, nursing specialty, past and present human development activities, tenure in
current post and trade union membership. The type and size of employer, whether the employer
encourages human capital activities and the percentage of ethnic minority staff at the workplace constitute
EM P2.16
Finally, a continuous relative wages variable is included in log form (RY). This relative wage
measure is analogous to that of Clark and Oswald (1996), but in our case is based on the wages of other
public sector employees in Britain rather than the entire employee labour force, conditional on observable
human capital characteristics. It was constructed using data from the UK’s Quarterly labour Force Survey
(see Appendix A2 for details). The comparison with other public sector professions is pertinent since the
whole debate about the relative pay of NHS is typically positioned with respect to the pay of public sector
employees such as teachers, police and social workers.
Empirical Results
The coefficient estimates for the BASIC and EXTENDED models of job satisfaction are provided in
Table 4. A likelihood ratio test indicates that the EXTENDED model is a significant improvement over
the BASIC model ( 2c (25) = 161.56; 1% critical value = 44.3) hence we focus our discussion on these
results. As expected, the lower the (log) weekly wage and the higher the (log) comparison weekly wage,
the lower is the reported level of job satisfaction. Low rates of pay may signal to the nurse that they are
not highly valued by employers, which leads to a reduced level of job satisfaction. The second effect is
related to expectations of worth. The greater is the difference between a nurse’s pay and others in
comparable jobs then the less satisfied the nurse is likely to be.

18
TABLE 4: ORDERED PROBIT ESTIM ATESOF THE DETERM INANTS OF JOB SATISFACTION FOR NURSES
Explanatory Variables BASIC M ODEL EXTENDED M ODELCoefficient Std. Error Coefficient Std. Error
Log weekly wage (£) 0.476 0.186*** 0.409 0.225*Currently em ployed part-tim e (< 35 hours) 0.373 0.164** 0.375 0.217*Log com parison weekly wage (£) - - -0.534 0.225**Individual characteristicsAge < 30 -0.317 0.151** -0.440 0.176**Age 30-34 -0.263 0.132** -0.260 0.145*Age 35-39 -0.223 0.120* -0.172 0.129Age 40-44 -0.161 0.097* -0.086 0.107Age 45-49 -0.061 0.095 -0.018 0.100M ale -0.095 0.097 0.068 0.127M arried 0.019 0.073 0.023 0.075Black African -0.015 0.101 0.087 0.114Black Caribbean -0.043 0.095 0.018 0.108South Asian 0.142 0.116 0.221 0.128*Higher qualification (‘A’ level or degree) -0.028 0.106 0.419 0.208**M iddle qualification (‘O’ level or equivalent) -0.004 0.086 0.180 0.105*Job-related characteristicsCurrentlyundertaking post-basic training - - 0.068 0.107Num ber of com pleted post-basic training spells - - -0.067 0.031**Tenure in current post (in m onths) - - -0.001 0.002Tenure in current post squared / 100 - - 0.000 0.001M em ber of a trade union or professional body - - -0.197 0.135Actual work shift pattern is not equal to preferred - - -0.286 0.069***Som e control over working shifts and hours - - 0.115 0.070*Often participates in unpaid overtim e - - -0.243 0.135*Often undertakes nursing tasks above grade - - -0.215 0.069***Often undertakes nursing tasks below grade - - -0.266 0.071***Faced discrim ination in prom otion and training - - -0.536 0.091***Paediatrics specialty - - 0.178 0.163M idwifery specialty - - -0.147 0.107M ental illness specialty - - 0.072 0.102M ental handicap specialty - - -0.251 0.142*Care of the elderly specialty - - -0.136 0.098Prim ary and com m unity specialty - - 0.141 0.119Other specialty - - 0.016 0.224Em ployer-related characteristicsEm ployed by a General District Hospital - - 0.174 0.088**Em ployed by a Fam ily Health Service Authority - - 0.225 0.208Size of em ployer / 100 (in term s of nursing staff) - - -0.000 0.000Em ployer encourages hum an developm ent activities - - 0.295 0.076***Equal opportunities policy at workplace - - 0.020 0.080Percentage of ethnic m inority staff at workplace - - 0.002 0.002Racial harassm ent characteristicsFrequent racial harassm ent from work colleagues -0.955 0.140*** -0.589 0.147***Infrequent racial harassm ent from work colleagues -0.339 0.074*** -0.174 0.078**Frequent racial harassm ent from patients -0.263 0.125** -0.228 0.115*Infrequent racial harassm ent from patients -0.142 0.073* -0.131 0.077*Sample 1203 1203Log Likelihood -1340.30 -1260.54
M odel 2c (d.f. 18, 43) 120.31*** 279.84***
Notes: * Statistically significant at the .10 level; ** at the .05 level; *** at the .01 level. – indicates that the variable is not included in the m odel. Three constant thresholds were also estim ated. The base categories are the sam e as in Table 2 and, additionally: not currently training; actual shift pattern is equal to preferred; has no control over working shifts and hours; does not often participate in unpaid overtim e; does not often undertake nursing tasks above grade; does not often undertake nursing tasks below grade; has not faced discrim ination in prom otion or training; em ployer does not encourage hum an developm ent activities; never been racially harassed by work colleagues or patients, respectively.

19
In contrast to the U-shaped relationship found for studies of the wider workforce, our results suggest
that job satisfaction levels increase progressively with age amongst ethnic minority nurses in the British
NHS. Those under 35 years old are significantly less likely to be more satisfied with their job than nurses
over 49 years. The coefficients indicate a declining disparity from the base group with increasing age.
Interestingly neither the sex of the nurse nor their marital status or ethnic group (except South Asians)
significantly improve their levels of job satisfaction. Higher levels of qualifications also appear to be
significantly associated with higher levels of job satisfaction amongst ethnic minority nurses in Britain.
Several job-related characteristics are statistically associated with reduced levels of job satisfaction
amongst ethnic minority nurses. Specifically, those with a number of completed post-basic training spells,
required to work sub-optimal shift patterns, unpaid overtime and undertake tasks inappropriate to their
grade or working in the mental handicap specialty report lower levels of job satisfaction. However, the
nurses in our sample who have some control over their work patterns are significantly more likely to be
more satisfied than those who do not.
Furthermore, ethnic minority nurses who have faced discrimination with regard to promotion and
training are, not surprisingly, significantly less satisfied with their job than others who have not had such
experiences. The magnitude of this coefficient indicates that this is the second most important
determinant of job satisfaction. Nurses who work for a District General Hospital and those who have an
employer who encourages human development activities are significantly more likely to report increased
levels of job satisfaction. W e find no significant effect of ethnic density at the workplace.
It is clear from our multivariate analysis that the experience of racial harassment significantly reduces
job satisfaction and that frequent episodes of abuse imply a much lower level of job satisfaction than
infrequent occurrences. The strongest effects are due to racial harassment emanating from work
colleagues. Indeed, the coefficient on frequent racial harassment from work colleagues has the largest
magnitude of all the estimated coefficients in the model. This suggests that this form of ‘employee
discrimination’ is the most important determinant of job satisfaction amongst ethnic minority nurses in
the British NHS. The more common racial harassment from patients and their families (‘consumer
discrimination’) is also statistically associated with reduced levels of job satisfaction in our sample.
20
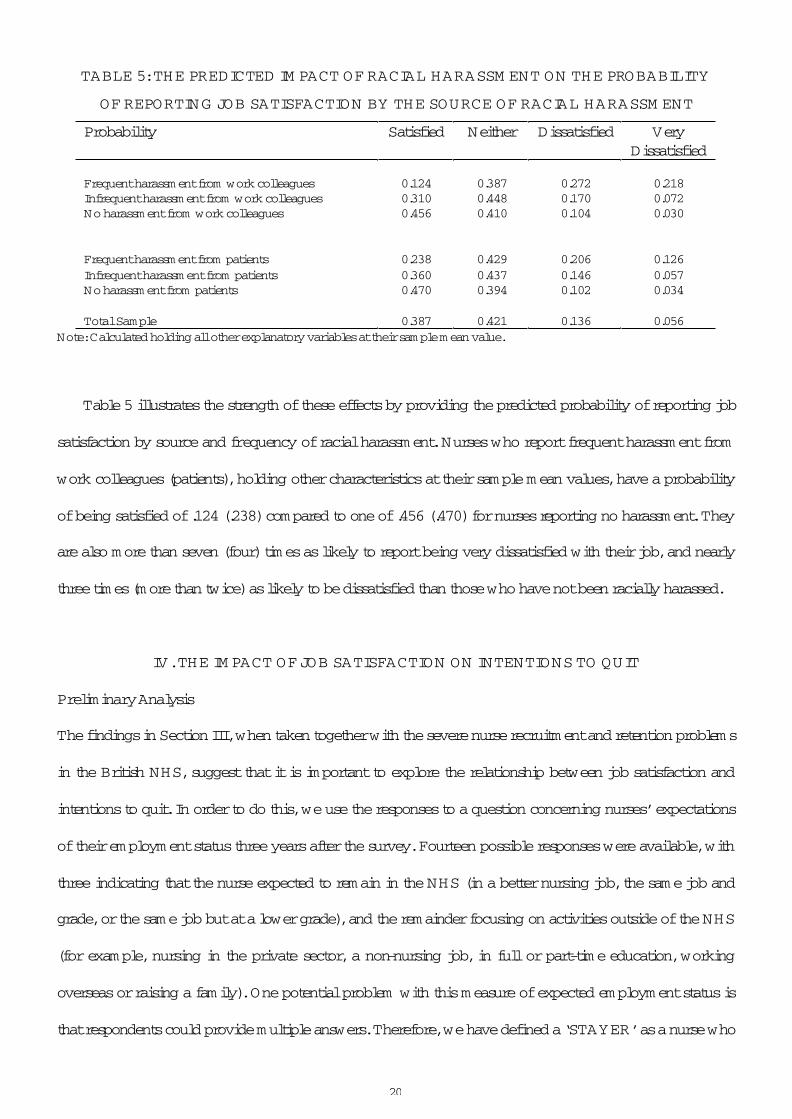
TABLE 5: THE PREDICTED IM PACT OF RACIAL HARASSM ENT ON THE PROBABILITY
OF REPORTING JOB SATISFACTION BY THE SOURCE OF RACIAL HARASSM ENT
Probability Satisfied Neither Dissatisfied VeryDissatisfied
Frequent harassm ent from work colleagues 0.124 0.387 0.272 0.218Infrequent harassm ent from work colleagues 0.310 0.448 0.170 0.072No harassm ent from work colleagues 0.456 0.410 0.104 0.030
Frequent harassm ent from patients 0.238 0.429 0.206 0.126Infrequent harassm ent from patients 0.360 0.437 0.146 0.057No harassm ent from patients 0.470 0.394 0.102 0.034
Total Sample 0.387 0.421 0.136 0.056Note: Calculated holding all other explanatory variables at their sam ple m ean value.
Table 5 illustrates the strength of these effects by providing the predicted probability of reporting job
satisfaction by source and frequency of racial harassment. Nurses who report frequent harassment from
work colleagues (patients), holding other characteristics at their sample mean values, have a probability
of being satisfied of .124 (.238) compared to one of .456 (.470) for nurses reporting no harassment. They
are also more than seven (four) times as likely to report being very dissatisfied with their job, and nearly
three times (more than twice) as likely to be dissatisfied than those who have not been racially harassed.
IV. THE IM PACT OF JOB SATISFACTION ON INTENTIONS TO QUIT
Preliminary Analysis
The findings in Section III, when taken together with the severe nurse recruitment and retention problems
in the British NHS, suggest that it is important to explore the relationship between job satisfaction and
intentions to quit. In order to do this, we use the responses to a question concerning nurses’ expectations
of their employment status three years after the survey. Fourteen possible responses were available, with
three indicating that the nurse expected to remain in the NHS (in a better nursing job, the same job and
grade, or the same job but at a lower grade), and the remainder focusing on activities outside of the NHS
(for example, nursing in the private sector, a non-nursing job, in full or part-time education, working
overseas or raising a family). One potential problem with this measure of expected employment status is
that respondents could provide multiple answers. Therefore, we have defined a ‘STAYER’ as a nurse who
21
indicates only one or more of the three staying in the NHS options but nothing else. W e define a
‘QUITTER’ as a nurse who indicates one or more of the non-NHS activities but none of the ‘STAYER’
categories.The small number of nurses who indicate both a ‘STAYER’ and ‘QUITTER’ intention we
define as a ‘QUITTER’, since they have indicated some uncertainty about their future employment status
in the NHS.17
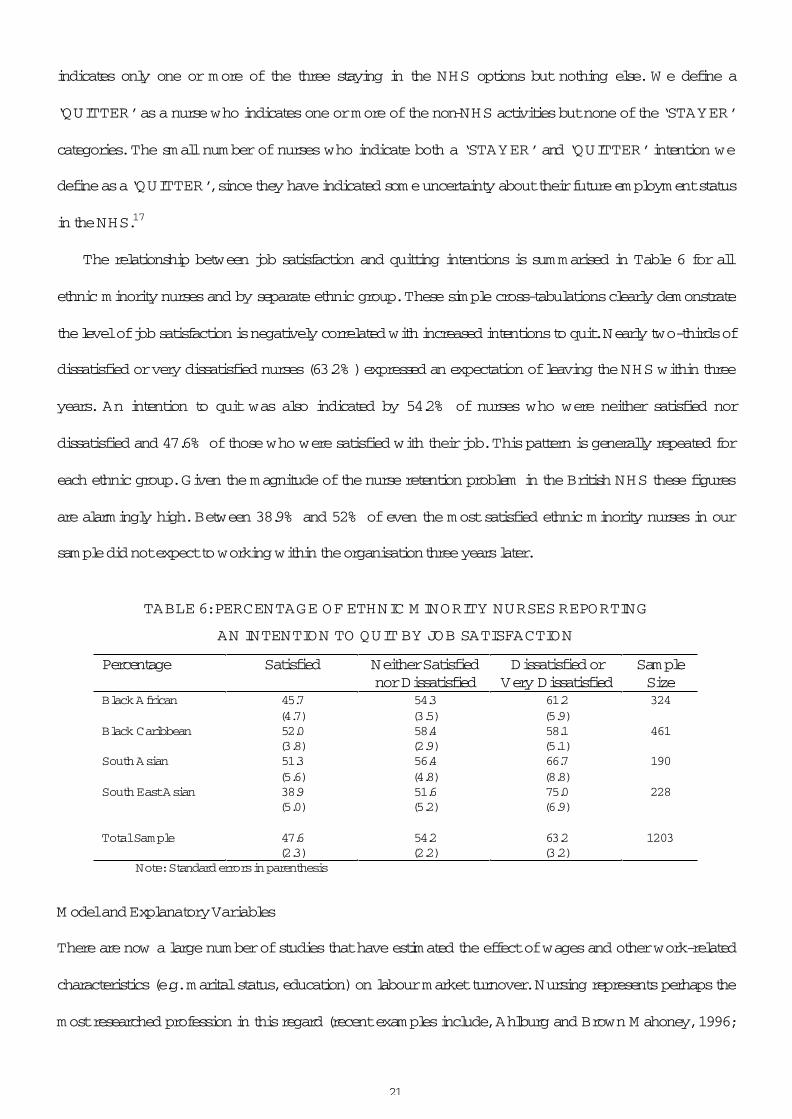
The relationship between job satisfaction and quitting intentions is summarised in Table 6 for all
ethnic minority nurses and by separate ethnic group. These simple cross-tabulations clearly demonstrate
the level of job satisfaction is negatively correlated with increased intentions to quit. Nearly two-thirds of
dissatisfied or very dissatisfied nurses (63.2% ) expressed an expectation of leaving the NHS within three
years. An intention to quit was also indicated by 54.2% of nurses who were neither satisfied nor
dissatisfied and 47.6% of those who were satisfied with their job. This pattern is generally repeated for
each ethnic group. Given the magnitude of the nurse retention problem in the British NHS these figures
are alarmingly high. Between 38.9% and 52% of even the most satisfied ethnic minority nurses in our
sample did not expect to working within the organisation three years later.
TABLE 6: PERCENTAGE OF ETHNIC M INORITY NURSES REPORTING
AN INTENTION TO QUIT BY JOB SATISFACTION
Percentage Satisfied Neither Satisfied nor Dissatisfied
Dissatisfied or Very Dissatisfied
SampleSize
Black African 45.7(4.7)
54.3(3.5)
61.2(5.9)
324
Black Caribbean 52.0(3.8)
58.4(2.9)
58.1(5.1)
461
South Asian 51.3(5.6)
56.4(4.8)
66.7(8.8)
190
South East Asian 38.9(5.0)
51.6(5.2)
75.0(6.9)
228
Total Sample 47.6(2.3)
54.2(2.2)
63.2(3.2)
1203
Note:Standard errors in parenthesis
M odel and Explanatory Variables
There are now a large number of studies that have estimated the effect of wages and other work-related
characteristics (e.g. marital status, education) on labour market turnover. Nursing represents perhaps the
most researched profession in this regard (recent examples include, Ahlburg and Brown M ahoney, 1996;

22
Parker and Rickman, 1995; Phillips, 1996; Schumacher, 1997).18 In contrast, there have been very few
studies which have examined the role played by job satisfaction in quitting decisions (Brown and
M cIntosh, 1998; Clark et al., 1999). One obvious reason for this is the lack of large-sample longitudinal
data that can be used to identify both job satisfaction at wave t-1 and job turnover between waves t-1 and
t.
The most notable exception is Freeman (1978), who used panel data from the US National
Longitudinal Survey (NLS, 1966-1971) and the M ichigan Panel Survey of Income Dynamics (PSID,
1972-73). He found that reported job satisfaction was a significant determinant of quitting and
quantitatively more important than wages. This relationship has been confirmed by Akerlof et al. (1988)
using the NLS Older men survey, and more recently by Clark (1999) and Clark et al. (1999) using data
from the first five waves of the British Household Panel Survey (1991-1996) and the first ten waves of
the German Socio-Economic Panel (1984-1993).19 These studies have robustly established that the
causality runs from job satisfaction to quitting outcomes. A further advantage of panel data studies is that
unobservable individual heterogeneity can be easily controlled for. However, it has been found that such
controls do not significantly change the estimated parameters of the model. This important result suggests
that cross-sectional estimates are robust to this issue (see Clark, 1999; Clark et al., 1999).
In the absence of appropriate panel data, an alternative approach to examining the relationship
between job satisfaction and quitting behaviour has been to use the responses from cross-sectional survey
questions asking participants about their future employment expectations or intentions (i.e. ‘latent’
turnover).20 Recently, Laband and Lentz (1998) confirmed the significance of job satisfaction as a
determinant of intentions to quit using a sample of 176 female lawyers collected by the American Bar
Association’s Young Lawyers Division in 1990. Interestingly, and closely related to the issues addressed
in this paper, Laband and Lentz (1998) also provide an insight into the impact of sexual harassment on the
labour market outcomes for this group of female employees. In particular, they found strong evidence
linking the experience of sexual harassment at the workplace (by supervisors, work colleagues and
clients) to reduced job satisfaction and an increased probability of intending to quit the law firm.

23
Given the cross-sectional nature of our data, the model of quitting behaviour we estimate is similar to
Laband and Lentz (1998). Since we are not able to track nurses over a period of time and observe their
actual quitting behaviour, we use information on nurses’ intentions to quit in the three years following
interview. The question which then arises is ‘How good a predictor of actual quitting is intended
quitting’? To answer this question we rely on a small longitudinal study of NHS nurses conducted by
M ercer (1979). Although dated, M ercer found that quitting intentions were the strongest predictor of
actual turnover, with over 83% of the 17% of nurses reporting an intention to quit having done so within
the following year. Steel and Ovalle (1984) also provide some confirmation of this finding, more
generally, using a meta-analysis of the large number of psychology studies that have examined the
relationship between behavioural intentions and employee turnover.
Considering the dichotomous nature of our quitting variable (i.e. STAYER = 0, QUITTER = 1) we
estimate a binary probit model in order to calculate the probability of nurses intending to leave the NHS
in the three years following interview. W e assume that intentions to quit are a function of current job
satisfaction (or utility from work) and vectors of individual and work-related characteristics. These
vectors aim to capture the labour and non-labour market opportunities available to our sample outside of
the NHS.
In order to gain a baseline estimate of the effect of job satisfaction on intentions to quit, we begin by
estimating a BASIC model that restricts the coefficients associated with the vectors JOB3 and EM P3 to
be zero. IND3 includes dummy variables for age, gender, marital status, ethnicity and highest
qualification, and a continuous variable for the number of children (and its square). W e might expect that
younger nurses and the more educated would have the greatest labour market opportunities outside of the
NHS. The vector of characteristics SAT comprises dummy variables for the four levels of reported job
satisfaction, with very dissatisfied acting as the comparison category.
In order to capture as much variation in intentions to quit as possible, the EXTENDED model
includes dichotomous variables for nursing seniority or grade, part-time work status, tenure in current
grade and post, trade union membership and nursing specialty (JOB3). Since senior and manager nursing
grades require a considerable am ount of nursing-specific human capital investment (on-the-job

24
experience and post-basic training), which would be lost in professions outside of nursing, we might
expect that highly trained nurses would be less likely to quit the NHS than more junior nurses. However,
it is also the case that a substantial component of senior nurses’ job tasks are management and human
resource management related, which are general skills applicable to many areas of the labour market.
Thus this group of nurses may be more likely to quit the NHS. The vector EM P3 includes controls for the
type and size of employer, whether there is an equal opportunities policy at the workplace and ethnic
minority density. Finally, eight regional dummy variables are also included in the EXTENDED model in
order to capture differences in labour market opportunities.
Empirical Results
The estimates from the BASIC and EXTENDED binary probit models are shown in Table 7. A likelihood
ratio test indicates that the inclusion of the job and employer-related variables in the EXTENDED model
do not provide a significant improvement over the BASIC model ( 2c (25) = 28.37; 10% critical value =
34.38).21 However, the full model results are presented so that it can be clearly seen which job or
employer-related characteristics are significantly associated with quitting intentions and which are not.
The probability of intending to quit for an ethnic minority nurse (using the EXTENDED model estimates
evaluated at average characteristic values) is 0.534.
In both sets of estimates nurses aged less than 30 and 30-34 are significantly more likely to indicate
an intention to leave the NHS than nurses over the age of 50. This suggests that the NHS is at a greater
risk of losing newly qualified nurses than those approaching retirement. Indeed nurses aged less than 30
(aged 30-34) have a 0.274 (0.172) increased average quitting probability, compared to the base
category.22 Nurses aged 45-49 are significantly less likely to indicate an intention to quit than those over
50 years old. Quitting intentions are also significantly related to the number of children with a U-shaped
pattern. Having a few children decreases, but having many children increases, the likelihood of a nurse
intending to leave the NHS in the near future. Being married is associated with a significantly reduced
probability of leaving, but the sex, ethnic group and level of qualifications of these nurses are not
statistically associated with their intentions to quit.

25
TABLE 7
BINARY PROBIT ESTIM ATES OF INTENTIONS TO QUIT
Explanatory Variables BASIC M ODEL EXTENDED M ODELCoefficient Std. Error Coefficient Std. Error
Individual characteristicsAge < 30 0.580 0.178*** 0.770 0.198***Age 30-34 0.328 0.153** 0.453 0.169***Age 35-39 0.144 0.143 0.282 0.153*Age 40-44 -0.168 0.119 -0.120 0.125Age 45-49 -0.240 0.109** -0.207 0.113*M ale -0.009 0.110 -0.031 0.128M arried -0.137 0.083* -0.148 0.088*Num ber of children -0.173 0.100* -0.189 0.103*Num ber of children squared 0.069 0.033** 0.074 0.034**Black African -0.056 0.116 -0.009 0.121Black Caribbean 0.024 0.108 0.023 0.112South Asian -0.097 0.131 -0.088 0.136Higher qualification (‘A’ level or degree) 0.037 0.116 -0.081 0.130M iddle qualification (‘O’ level or equivalent) 0.118 0.096 0.066 0.103Job–related characteristicsNurse m anager (grades H and I) - - 0.326 0.182*Senior nurse (grades F and G) - - 0.328 0.103***State Enrolled Staff nurse (Grade C, D, and E) - - 0.028 0.112Currently em ployed part-tim e (< 35 hours) - - 0.110 0.103Tenure in current post and grade (in m onths) - - 0.001 0.000*M em ber of a trade union or professional body - - 0.131 0.152Paediatrics specialty - - -0.478 0.185***M idwifery specialty - - -0.083 0.124M ental illness specialty - - -0.026 0.117M ental handicap specialty - - -0.104 0.169Care of the elderly specialty - - -0.074 0.112Prim ary and com m unity specialty - - -0.068 0.137Other specialty - - 0.193 0.250Em ployer-related characteristicsEm ployed by a General District Hospital - - 0.025 0.105Em ployed by a Fam ily Health Service Authority - - -0.017 0.227Size of em ployer / 100 (in term s of nursing staff) - - 0.001 0.001Equal opportunities policy at workplace - - -0.032 0.091Percentage of ethnic m inorities in region - - 0.006 0.006Job satisfaction characteristicsSatisfied overall with job -0.526 0.176*** -0.577 0.180***Neither satisfied or dissatisfied overall with job -0.379 0.175** -0.392 0.178**Dissatisfied overall with job -0.253 0.194 -0.303 0.198
Constant 0.574 0.212 0.209 0.210
Sample 1203 1203Log Likelihood -795.22 -781.03
M odel 2c (d.f. 17, 42) 71.81 100.18
Notes: * Statistically significant at the .10 level; ** at the .05 level; *** at the .01 level. – indicates that the variable is not included in the m odel. The base categories are as in Tables 4 and 5 with the addition of being very dissatisfied with job. Regional controls were also included in the m odels.
26
The EXTENDED model estimates indicate that Nurse M anagers and Senior Nurses are significantly
more likely to intend leaving the NHS than Registered General Staff nurses. Their marginal increases in
quitting probabilities are 0.126 and 0.128, respectively, over that of an otherwise average Registered
General Staff nurse. This is a cause for considerable concern since these individuals are the most
experienced and highly qualified nurses, and therefore the most difficult to replace. Paediatric nurses are
significantly less likely to quit (marginal effect = –0.188) than those in the general medical specialty. The
only other statistically significant characteristics in the EXTENDED model are for nurses aged 35-39,
tenure in current post and for three of the regional dummies.
Importantly, increased levels of job satisfaction are significantly associated with reductions in
intentions to quit amongst ethnic minority nurses in the NHS. The effects are quantitatively large with
nurses who are satisfied (neither satisfied nor dissatisfied) with their job having a probability of quitting
0.227 (0.155) lower than those who are very dissatisfied.23 Given the low levels of job satisfaction
amongst ethnic minority nurses and the nurse retention problems in the NHS these findings are
particularly worrying.
V. TESTING FOR ROBUSTNESS
In the sequential model framework we presented in Sections II, III and IV, we assumed that the error
terms of the racial harassment, job satisfaction and intentions to quit equations were independent.
However, it might be the case that there exists an unobservable individual characteristic that jointly
determines two or more of these outcome measures. Examples of such characteristics might be poor
health or a general ‘bad attitude’ to work, which are unobserved in the survey. To provide a simple test of
the robustness of our findings to endogeneity concerns we have simultaneously modelled perceptions of
racial harassment, job satisfaction and intentions to quit using a multivariate probit framework. This
model is a direct three-equation extension of the widely used bivariate probit model, and allows for
contemporaneous correlation between the residual terms. If our separate model estimates were subject to
such endogeneity concerns, this methodology would lead to more consistent estimates of the relationship
between the three outcome measures. Given the difficulties involved with the evaluation of higher-order
27
m ultivariate normal integrals, the model is estimated by approximating the CDF using the GHK simulated
maximum likelihood estimator as implemented by the M PROBIT command in LIM DEP V.7 (See Greene
1997, for a fuller discussion).
To order to estimate this model we need to construct binary indicators of racial harassment and job
satisfaction (our intentions to quit variable is already binary). Thus we have created a variable that takes
the value of unity if a nurse reports experiencing racial harassment at work (either from work colleagues
or patients) and zero otherwise.24 Similarly, we have collapsed our ordered job satisfaction measure into a
SATISFIED variable that takes the value 1 if a nurse reports satisfaction with her job, and 0 otherwise.
The covariates included in the three equations are the same as reported in the separate models presented
above, thus providing a number of identification restrictions.
The estimation results suggest both a positive and significant correlation between the error terms of
the racial harassment and job satisfaction equations (ρ = 0.255, |t| = 1.565), and between the job
satisfaction and intentions to quit residuals (ρ = 0.399, |t| = 3.069). In contrast, we find no statistically
significant between the error terms in racial harassment and intentions to quit equations (ρ = -0.050, |t| =
0.670). Importantly, our findings with respect to the effect of perceived racial harassment on job
satisfaction, and of job satisfaction on intentions to quit, remain statistically significant. It also remains
the case that perceived racial harassment from work colleagues causes a greater reduction in job
satisfaction than such harassment from patients, and that reported job satisfaction has the greatest impact
on quitting intentions of all the covariates included in the model.25 Overall, these findings provide us with
greater confidence in the robustness of our results, and also appear to support the conclusions of Clark et
al. (1999) and Clark (1999), who note that cross-sectional estimates of the determinants of job satisfaction
are typically robust to endogeneity concerns.
28
VI. CONCLUSIONS
This paper provides some of the first evidence on the incidence and determinants of (perceived) racial
harassment at the workplace and, through its association with reduced levels of job satisfaction, its impact
on intentions to quit. W e have used a large and informative survey of British NHS nurses collected in
1994, which over-samples those from ethnic minority backgrounds. Our results indicate that racial
harassment is a considerable problem in the NHS. The majority of ethnic minority nurses in our sample
report having experienced racial harassment from patients or their families and a substantial minority
report having suffered such abuse from work colleagues. However, we need to emphasise that our
findings are based on self-reported occurrences of perceived racial harassment rather than objectively
identified episodes. Unfortunately, we know nothing about the correlation between these perceived and
actual events. This is an important area for future research.
Our results indicate that Black and South Asian nurses, those with higher general qualifications or
who are Registered General Staff nurses are the most likely to report frequent episodes of perceived racial
harassment from work colleagues. In addition, this form of ‘employee discrimination’ is more likely to be
reported by nurses who work for NHS hospital trusts or for employers who do not have an equal
opportunities policy. Racial harassment by patients (or their families) is reported more frequently by
Black and younger ethnic minority nurses, those working some night shifts and those in the care of the
elderly or general medical specialties. Ethnic minority nurses employed by Family Health Service
Authorities and working in high ethnic minority density regions report more frequent occurrences of such
‘consumer discrimination’.
According to our estimates, the most important determinants of job satisfaction are having
experienced racial harassment at the workplace and self-reported perceptions of having faced
discrimination in promotion and training. Frequent episodes of perceived racial harassment from work
colleagues have the largest detrimental effect on job satisfaction levels – they are seven times as likely to
be very dissatisfied with their job than those who have never suffered such abuse. Those reporting
frequent racial harassment from patients are four times as likely to be very dissatisfied with their job than
those who report no racial harassment from this source. These findings suggest that these forms of

29
‘employee discrimination’ and ‘consumer discrimination’ significantly reduce individual nurse’s utility
from work with, with the former type having the largest effect.
Nurses who are very dissatisfied with their job, or are neither satisfied nor dissatisfied, have an
increased probability of intending to quit the NHS, compared to nurses who are satisfied. W e find that
these quantitative impacts are robust to concerns of endogeneity in our models. Since perceived racial
harassment is the quantitatively largest determinant of levels of job satisfaction, these findings suggest
that reducing the frequency of such attacks, particularly from work colleagues, may play an important
part in the struggle to retain nurses in the British NHS.
Several policy recommendations follow from this empirical investigation. They are:-
(1)NHS employers should pay particular attention to the groups of nurses identified as being most at risk
of racial harassment;
(2)Rigorous monitoring of NHS working environments should be implemented as a priority;
(3)Training should be given to ethnic minority nurses to enable them to effectively handle difficult
encounters with patients (and their families);
(4)Particular attention should be focused on workplaces with high concentrations of ethnic minority
nurses.

30
APPENDIX A – SAM PLE CHARACTERISTICS
TABLE A1
SAM PLE CHARACTERISTICS
Explanatory Variable ETHNIC M INORITY W HITEM ean Std. Error M ean Std. Error M in.M ax.
Individual characteristicsAge < 30 0.067 0.007 0.206 0.004 0 1Age 30-34 0.088 0.008 0.214 0.004 0 1Age 35-39 0.116 0.009 0.165 0.004 0 1Age 40-44 0.244 0.012 0.120 0.003 0 1Age 45-49 0.253 0.013 0.121 0.003 0 1Age 50+ 0.232 0.012 0.168 0.004 0 1M arried 0.690 0.013 0.752 0.005 0 1M ale 0.165 0.011 0.066 0.003 0 1Num ber of dependent child(ren) under 16 years 0.893 0.031 0.697 0.010 0 7Black African 0.269 0.013 - - 0 1Black Caribbean 0.383 0.014 - - 0 1South Asian 0.158 0.011 - - 0 1South East Asian 0.190 0.013 - - 0 1Higher qualification (‘A’ level or degree) 0.204 0.012 0.206 0.004 0 1M iddle qualification (‘O’ level or equivalent) 0.564 0.014 0.643 0.005 0 1No qualification 0.232 0.013 0.151 0.004 0 1Job-related characteristicsW eekly (gross) wage (£) 278.56 2.593 304.91 0.651 96.40 463.77Nurse M anager (grades H and I) 0.062 0.007 0.063 0.003 0 1Senior nurse (grades F and G) 0.370 0.014 0.373 0.005 0 1Registered General Staff nurse (grades D and E) 0.314 0.013 0.370 0.005 0 1State Enrolled Staff nurse (grades C, D, and E) 0.254 0.013 0.212 0.004 0 1Currently em ployed part-time (< 35 hours) 0.219 0.012 0.380 0.005 0 1Currently undertaking post-basic training 0.115 0.009 0.125 0.003 0 1Num ber of com pleted post-basic training spells 0.954 0.034 0.895 0.012 0 12Tenure in current post at current grade (in m onths) 113.36 2.380 77.34 0.781 0 396M em ber of a trade union or professional body 0.934 0.007 0.938 0.003 0 1Day shift pattern only 0.271 0.013 0.298 0.004 0 1M ixed shift pattern with nights 0.450 0.012 0.344 0.005 0 1M ixed shift pattern but with no nights 0.227 0.012 0.289 0.005 0 1Other shift pattern but with no nights 0.052 0.007 0.069 0.003 0 1Actual work shift pattern is not equal to preferred 0.438 0.014 0.387 0.005 0 1Has som e control over working shift and hours 0.647 0.013 0.776 0.004 0 1Often participates in unpaid overtim e 0.067 0.007 0.101 0.003 0 1Often undertakes nursing tasks above grade 0.515 0.014 0.470 0.005 0 1Often undertakes nursing tasks below grade 0.543 0.013 0.536 0.005 0 1Faced discrim ination in prom otion and training 0.180 0.011 0.005 0.001 0 1General m edicine specialty 0.292 0.013 0.420 0.005 0 1Paediatrics specialty 0.046 0.006 0.071 0.003 0 1M idwifery specialty 0.137 0.010 0.127 0.003 0 1M ental illness specialty 0.198 0.011 0.069 0.003 0 1
M ental handicap specialty 0.072 0.007 0.021 0.002 0 1Care of the elderly specialty 0.149 0.010 0.095 0.003 0 1Prim ary and com m unity specialty 0.166 0.011 0.200 0.004 0 1Other specialty 0.024 0.004 0.036 0.002 0 1Em ployer-related characteristicsEm ployed by a General District Hospital 0.182 0.011 0.207 0.004 0 1Em ployed by a Fam ily Health Service Authority 0.043 0.006 0.080 0.003 0 1Em ployed by a NHS Hospital Trust 0.775 0.012 0.713 0.005 0 1Size of em ployer (in term s of nursing staff) 1134.01 19.30 1071.64 8.34 44 2915Em ployer encourages hum an developm ent activities 0.331 0.012 0.418 0.005 0 1Equal opportunities policy at workplace 0.761 0.012 0.764 0.004 0 1

31
TABLE A1
SAM PLE CHARACTERISTICS (CONTINUED)
Percentage of ethnic m inorities in region 11.76 0.247 - - 0.43 25.64Percentage of ethnic m inority staff at workplace 26.31 0.511 - - 1.1 65.4South Tham es 0.203 0.012 0.159 0.003 0 1North Tham es 0.300 0.013 0.148 0.004 0 1East Anglia and Oxford 0.096 0.009 0.098 0.003 0 1W est M idlands 0.105 0.009 0.141 0.004 0 1Trent 0.040 0.006 0.085 0.003 0 1North W est 0.063 0.007 0.130 0.004 0 1North and Yorkshire 0.072 0.008 0.091 0.003 0 1Other 0.121 0.009 0.155 0.004 0 1Sample 1203 9220
APPENDIX B – DERIVATION OF COM PARISON W AGE M EASURE
In order to calculate our measure of the ‘comparison’ wage for NHS nurses (i.e. what a ethnic minority
nurse might expect to earn, on average, if employed in a comparable public sector profession) we have
used data from the Quarterly Labour Force Survey (QLFS) of the United Kingdom undertaken in the
Spring of 1994 (matching the date of the nursing survey). The QLFS, introduced in 1992, is a nationally
representative survey whose principal aim is to produce a set of national (and regional) labour market
statistics (mainly unemployment figures) for use by government departments. Each quarter approximately
64,000 households are surveyed eliciting information on some 160,000 individuals over the age of 16. A
panel element is incorporated into the QLFS with each individual being interviewed over five successive
quarters. Information on wages is only obtained from those about to leave the survey (or 20% of each
quarters’ sample). Selecting individuals in aged 21 to 60, in public sector employment (PUBLIC=2), in
wave 5 (THISW V = 5), we obtained a sample of 1876 individuals. A comparison wage measure was
constructed by estimating a simple log weekly wage regression for our sample of public sector
employees, controlling for age (and age squared), gender, ethnicity, marital status, highest qualification,
part-time status and region. Using the estimated parameters from this model, we mapped the predicted
weekly wage, conditional on the same set of individual characteristics, into the nursing sample. This
provides us with a continuous measure of the ‘comparison wage’, which we include as an additional
covariate in the ordered probit job satisfaction models.
32
ACKNOW LEDGEM ENTS
W e are grateful to the Policy Studies Institute and the Department of Health for providing access to the data, to the Trent Institute for Health Services Research for funding the preliminary analysis and to David Blackaby, Andrew Clark, Christian Dustmann, Ziggy M acDonald, Phil M urphy, Nigel O’Leary, Steve Pudney, Steve Thompson, M elanie W ard, seminar participants at the IZA, Leicester and Swansea,participants at the European Society for Population Economics conference (June 2000, Bonn) and at the Royal Economics Society conference (July 2000, St. Andrews) and two anonymous referees for helpful comments which have considerably improved the paper. The usual disclaimer applies.
NOTES
1 M oreover, the im portance of this issue is evident from the pages of the m ain nursing journals in Britain, such as the NursingTimes and Nursing Standard, which frequently contain articles focusing on racism in the nursing profession.2 W e have calculated that there were approxim ately 35,000 non-white ethnic m inority nurses em ployed in the NHS in 1994.3 W e have undertaken various searches of the econom ics literature in both the UK and US, and have been unable to find any published studies that have exam ined the im pact of racial harassm ent at the workplace on labour m arket outcom es in the last 15 years. Sim ilarly, there appears to be very little em pirical research that has exam ined the im pact of sexual harassm ent. One recent exception is Laband and Lentz (1998) who investigate the effects of sexual harassm ent on job satisfaction, earnings and turnover using a sm all sam ple (n=176) of fem ale lawyers in the US. 4 In fact the Race Relations Act of 1976 does not use the term ‘racial harassm ent’. However, Industrial Tribunals in Britain have becom e increasingly willing to conclude that this form of labour m arket behaviour represents ‘less favourable treatm ent on racial grounds’ and therefore constitutes unlawful racial discrim ination (Com m ission for Racial Equality, 1995).5 Between 1987 and 1995 the intake of school-leavers into nurse training fell from 19,600 to 14,200 per annum (Seccom be and Sm ith, 1997). In term s of retention, a study using 1991 Census data found that only 68% of qualified nurses in England were em ployed in the profession. The rem ainder were working in other professions (16% ) or inactive (15% ) (Lader, 1995).6 Note that even though the survey on which this study is based had a relatively high response rate of 62% it is possible that the sam ple is biased. It m ay be the case that those nurses who were least satisfied with their job and/or m ost likely to intend to quit the NHS were the m ost likely to return a survey questionnaire. If this is the case our results m ay over-state the extent of the latent retention problem . M oreover it m ay be the case that the m ost dissatisfied nurses have already have left the NHS, which would result in our estim ates of the effect of job satisfaction on quitting outcom es being biased downwards.7 It m ay be the case that an equal opportunities policy exists, but that som e individual nurses are not aware of that fact.8 It is im portant to note that we are concerned in this paper with nurses’ perceptions of racial harassm ent towards them , because it is these individual-specific perceptions that will im pact on job satisfaction and quitting behaviour. Due to the legal am biguities of defining racial harassm ent and since the m ajority of such attacks go unreported at the workplace (and few enter the industrial tribunal system ), we do not know the extent to which perceived and actual racial harassm ent are related.9 Our data set does not enable us to distinguish between educational qualifications obtained in the UK and those gained abroad.10 W e originally included eight regional control variables in the m odels. However, these were found to be statistically insignificant and have therefore been dropped from the estim ates presented here.11 W e have also estim ated the racial harassm ent m odels using a pooled sam ple of white and ethnic m inority nurses. W e find, after controlling for other relevant characteristics, that ethnicity has the largest quantitative im pact on the probability of reporting frequent harassm ent (from both sources), with each of the ethnic m inority groups reporting significantly m ore racial harassm ent than white nurses. These results are available on request. 12 For exam ple, recent studies have focused on the m arginal effect of individual characteristics such as gender (Clark, 1997; W ard and Sloane, 2001), age (Clark et al., 1996), race (Bartel, 1981) and education (Tsang et al., 1991) on job satisfaction. Other studies have concentrated on job and em ployer characteristics, identifying the effect of absolute wages and ‘com parison’ or ‘relative wages’ (Cappelli and Sherer, 1988; Clark and Oswald, 1996; Ham pton and Heywood, 1999; Sloane and W illiam s, 1996), trade union status (Bender and Sloane, 1998; Gordon and Denisi, 1995; M eng, 1990), self-em ploym ent (Blanchflower and Oswald, 1998) and firm size (Idson, 1990) on reported job satisfaction levels.13 This is nested in the ‘total’ utility function, )),,,,,,(( uEM PJOBINDRYHYutuTU = , where u is utility from work
and u is utility from other sources and spheres of life (Clark and Oswald, 1996).14 The im pact of relative wages on job satisfaction is com paratively unexplored by econom ists com pared to the other elem ents in (2). This is probably due to the difficulty in deriving a relative wage m easure. A discussion of the various psychological theories that justify the inclusion of relative wages in job satisfaction m odels can be found in Clark and Oswald (1996).15 This is akin to the debate about the effect of trade union m em bership on job satisfaction. If workplaces characterised by high levels of trade union m em bership also have better general work environm ents, then the exclusion of variables describing other aspects of the work environm ent will give biased (upwards) estim ates of the effect of union m em bership on job satisfaction (see, for exam ple, Gordon and Denisi, 1995).16 As with the racial harassm ent estim ates, we have found no statistically significant regional variations in job satisfaction. Consequently, the regional controls have been excluded from the m odels.

33
17 Over 80% of the sam ple indicated only one future em ploym ent intention. W hen the sm all group of nurses who indicated both ‘STAYER’ and ‘QUITTER’ intentions are excluded, and the results reported in Table 3 are qualitatively unchanged.18 Reviews of the nurse turnover literature in Britain include Gray and Phillips (1992) and for the US include Tai et al. (1998).19 Of course, econom ists are by no m eans the only group to study this relationship. W e can also point to a substantial literature by psychologists, which has found a negative relationship between reported job satisfaction and quitting. M any of thesestudies, however, have been based on very sm all sam ples of em ployees with little conform ity in the control variables used (Clark et al., 1999). M cEvoy and Cascio (1985) and Carsten and Spector (1987) provide evidence from m eta-analyses, and Steel and Ovalle (1984), Hom et al. (1992) and W arr (1998) review the literature. 20 For exam ple, Gordon and Denisi (1995) use data from three public sector organizations in the US prim arily to investigate the relationship between trade union m em bership and reported job satisfaction. They found, using one of their sam ples (721 full-tim e assistant, associate and full professors from Rutgers University collected in 1989-90) that job satisfaction was negativelyand significantly related to intentions to quit. Their estim ates suggest that increasing the job satisfaction index by one standard deviation reduces the average probability of intending to quit from 0.27 to 0.19, whilst a one standard deviation decrease in job satisfaction increased the quitting probability to 0.38.21 If the EXTENDED m odel is estim ated without vector EM P3, it is a significant im provem ent over the BASIC m odel.22 This finding is not only due to nurses intending to leave for child rearing. W hen the m odel is estim ated for m ale nurses alone, younger nurses are still significantly m ore likely to intend quitting the NHS.23 In this paper, we have m odelled the im pact of racial harassm ent on quitting behaviour as operating through a reduction in reported job satisfaction (interpreted as a loss of utility from work). An alternative approach would be to include both job satisfaction and racial harassm ent m easures directly into the quitting m odel (See Laband and Lentz, 1998). W hen the m odel is estim ated as such, the m arginal effect of job satisfaction on quitting intentions is slightly reduced. However, the m arginal effect of racial harassm ent, holding constant job satisfaction, becom es insignificant in the case of harassm ent from patients whilstthe probability of intending to quit increases by 0.093 for frequent racial harassm ent from staff and by 0.055 in the case of infrequent harassm ent from this source.24 In theory we could estim ate a four equation system , with separate equations for both form s of racial harassm ent. However, we do not have a suitable instrum ent or set of instrum ents which can be used to distinguish between these two equations. In the m odels of Section II the only different covariates included in the two ordered probit m odels are ethnic density in the county (in the patient m odel) and at the workplace (in the work colleagues m odel). These two m easures of density appear to be too highly correlated to act as identifying restrictions.25 The coefficients on the racial harassm ent indicators in the job satisfaction m odel, given the base category of no experience of racial harassm ent, were: -0.891 (|t| = 3.132) for frequent staff harassm ent; -0.259 (|t| = 2.764) for infrequent staff harassm ent; -0.553 (|t| = 1.657) for frequent patient harassm ent; and –0.095 (|t| = -1.070) for infrequent patient harassm ent. In the intentions to quit m odel the coefficients on the job satisfaction indicators, given the base category of very dissatisfied, were: -1.134 (|t| = 4.602) for satisfied; -0.344 (|t| = 1.807) for neither satisfied or dissatisfied; and –0.284 (|t| = 1.382) for dissatisfied. For the sake of brevity we do not present all the additional estim ates. However, they are available from the authors on request.

34
REFERENCES
AHLBURG, D. and BROW N M AHONEY, C. (1996). The effects of wages on the retention of nurses. Canadian Journal of Economics,29, S126-S129.
AKERLOF, G., ROSE, A. and YELLEN, J. (1988). Job switching and job satisfaction in the US labor market.Brookings Papers on Economics Activity,2, 495-582.
AKINSANYA, J. (1988). Ethnic minority nurses, midwives and health visitors: what role for them in the National Health Services? New Community,14, 444-50.
AUDIT COM M ISSION (1997). Finders, Keepers. The M anagement of Staff Turnover in the NHS Trusts.London: Audit Commission.
BARTEL, A. (1981). Race differences in job satisfaction: a reappraisal. Journal of Human Resources, 16,294-303.
BAXTER, C. (1988). The Black Nurse: An Endangered Species. Cambridge, UK: Training in Health and Race.
BEACON, S., VIRDEE, S. and HAGELL, A. (1995). Nursing in a M ulti-Ethnic NHS. London: Policy Studies Institute.
BECKER, G. (1957). The Economics of Discrimination. Chicago: University of Chicago Press.BENDER, K. and SLOANE, P. (1998). Job satisfaction, trade unions, and exit-voice revisited. Industrial
and Labor Relations Review,51, 222-40.BLACKABY, D., CLARK, K., LESLIE, D. and M URPHY, P. (1994). Black-white male earnings and
employment prospects in the 1970s and 1980s. Economics Letters,46, 273-79._______, DRINKW ATER, S, LESLIE, D and M URPHY, P. (1997). A picture of male and female
unemployment among Britain’s ethnic minorities. Scottish Journal of Political Economy,44, 182-97._______, LESLIE, D., M URPHY, P and O’LEARY, N. (1998). The ethnic wage gap and employment
differentials in the 1990s: evidence for Britain. Economics Letters,58, 97-103.BLANCHFLOW ER, D. and OSW ALD, A. (1998). W hat m akes an entrepreneur? Journal of Labor
Economics,16, 26-60.BROW N, D. and M cINTOSH, S. (1998). If you’re happy and you know it … job satisfaction in the low
wage service sector. Discussion Paper no. 405, Centre for Economic Policy Research, London.CAPPELLI, P. and SHERER, P. (1988). Satisfaction, market wages, and labor relations: an airline study.
Industrial Relations,27, 56-73.CARSTEN, J. and SPECTOR, P. (1987). Unem ploym ent, job satisfaction, and em ployee turnover: a m eta-
analytic test of the M uchinsky model. Journal of Applied Psychology,72, 374-381.CLARK, A. (1996). Job satisfaction in Britain. British Journal of Industrial Relations,34, 189-217._______ (1997). Job satisfaction and gender: why are women so happy at work? Labour Economics,4,
341-72.______ (1999). W hat really matters in a job? Hedonic measurement using quit data. Unpublished paper,
Universite d’ Orleans.______ and OSW ALD, A. (1996). Satisfaction and comparison income. Journal of Public Economics,61,
359-381.______, ______ and W ARR, P. (1996). Is job satisfaction U-shaped in age? Journal of Occupational and
Organizational Psychology,69, 57-81.______, GEORGELLIS, Y. and SANFREY, P. (1999). Job satisfaction, wage changes and quits: evidence
from Germany. Research in Labor Economics, 17, forthcoming.COM M ISSION FOR RACIAL EQUALITY. (1995). Racial Harassment at W ork: W hat Employers can do
about it. London: Commission for Racial Equality. DEPARTM ENT OF HEALTH. (1998a). Tackling Racial Harassment in the NHS a Plan for Action.
London._______(1998b).W orking Together: Securing a Quality W orkforce for the NHS. London.ELLIS, B. (1990). Racial Equality: The Nursing Profession. London: Kings Fund Equal Opportunities
Task Force.FREEM AN, R. (1978). Job satisfaction as an economic variable. American Economic Review, 68, 135-41.GORDON, M . and DENISI, A. (1995). A re-examination of the relationship between union membership
and job satisfaction. Industrial and Labor Relations Review,48, 222-36.

35
GRAY, A. and PHILLIPS, V. (1992). Explaining NHS staff turnover: a local labour market approach.London: London School of Hygiene and Tropical M edicine.
GREENE, W . (1997). Econometric Analysis. 3nd Edition, M acmillan.HAM M ERM ESH, D. (1977). Economic aspects of job satisfaction. In O. Ashenfelter and W . Oates (eds.)
Essays in Labor M arket Analysis. New York: John W iley.HAM PTON, M . and HEYW OOD, J. (1999). The determ inants of perceived underpaym ent: the role of
racial comparisons, Review of Social Economy,57, 141-155.HANCOCK, R. (1999). Report of the RCN Autumn Conference, 20th October, 1999. General Secretary of
the Royal College of Nursing.HOM , P., CARANIKAS-W ALDER, F., PRUSSIA, G. and GRIFFETH, R. (1992). A meta-analytic
structural equations analysis of a model of employee turnover. Journal of Applied Psychology,77,890-909.
IDSON, T. (1990). Establishment size, job satisfaction and the structure of work. Applied Economics,22,1007-18.
LABAND, D. and LENTZ, B. (1998). The effects of sexual harassment on job satisfaction, earnings, and turnover among female lawyers.Industrial and Labor Relations Review,51, 594-607.
LADER, D. (1995). Qualified Nurses, M idwives and Health Visitors. London: Department of Health.M cEVOY, G. and CASCIO, W . (1985). Strategies for reducing employee turnover: a meta-analysis.
Journal of Applied Psychology,70, 342-53.M ENG, R. (1990). The relationship between unions and job satisfaction. Applied Economics, 22, 1635-48.M ERCER, G. (1979). The Employment of Nurses: Nursing Labour Turnover in the NHS. London: Croom
Helm.M ODOOD, T. BERTHOUD, R.et al. (1997).Ethnic M inorities in Britain. London: Policy Studies
Institute.PARKER, C. and RICKM AN, B. (1995). Economic determinants of the labour force withdrawal of
registered nurses. Journal of Economics and Finance, 19, 17-26.PHILLIPS, V. (1996). Nurses’ labour supply: participation, hours of work, and discontinuities in the
supply function. Journal of Health Economics,14, 567-82.PUDNEY, S. and SHIELDS, M . (2000a). Gender, race, pay and promotion in the British nursing
profession: estimation of a generalised ordered probit model. Journal of Applied Econometrics,15,367-399.
______ and ______ (2000b). Gender and racial differentials in pay and promotion for NHS nurses. OxfordBulletin of Economics and Statistics, forthcoming.
SECCOM BE, I. and SM ITH, G. (1997). Taking Part: Registered Nurses and the Labour M arket in 1997.University of Sussex: Institute for Employment Studies.
SHIELDS, M . and W HEATLEY PRICE, S. (1999). Ethnic differences in the incidence and determinants of employer-funded training in Britain. Scottish Journal of Political Economy,46, 523-551.
SCHUM ACHER, E. (1997). Relative wages and exit behaviour among registered nurses. Journal of Labor Research,18, 581-91.
SLOANE, P. and W ILLIAM S, P. (1996). Are ‘overpaid’ workers really unhappy? A test of the theory of cognitive dissonance. Labour,10, 3-15.
STEEL, R. and OVALLE, N. (1984). A review and meta-analysis of research on the relationship between behavioural intentions and employer turnover. Journal of Applied Psychology,69, 673-86.
TAI, T., BAM E, S., ROBINSON, C. (1998). Review of nursing turnover research, 1977-1996.SocialScience and M edicine,12, 1905-24.
THOM AS, M . and M ORTON-W ILLIAM S, J. (1972). Overseas Nurses in Britain. London: Political and Economic Planning.
TSANG, M ., RUM BEREGER, R. and LEVIN, H. (1991). The impact of surplus schooling in workproductivity.Industrial Relations, 30, 209-28.
W ARD, M . and SLOANE, P. (2001). Job satisfaction within the Scottish academic profession. ScottishJournal of Political Economy, forthcoming.
W ARR, P. (1998). W ell-being and the workplace. In D. Kahneman, E. Diener and N. Schwartz (eds.), Understanding Quality of Life: Scientific Perspectives on Enjoyment and Suffering. New York: Russell Sage.