race-specific agglomeration economies: … agglomeration economies: social distance and the...
TRANSCRIPT
NBER WORKING PAPER SERIES
RACE-SPECIFIC AGGLOMERATION ECONOMIES:SOCIAL DISTANCE AND THE BLACK-WHITE WAGE GAP
Elizabeth AnanatShihe Fu
Stephen L. Ross
Working Paper 18933http://www.nber.org/papers/w18933
NATIONAL BUREAU OF ECONOMIC RESEARCH1050 Massachusetts Avenue
Cambridge, MA 02138April 2013
Ananat gratefully acknowledges funding from the William T. Grant Foundation. Any opinions andconclusions expressed herein are those of the author(s) and do not necessarily represent the viewsof the U.S. Census Bureau or the National Bureau of Economic Research. All results have been reviewedto ensure that no confidential information is disclosed. Support for this research at the Boston andNew York RDC from NSF (ITR-0427889) is also gratefully acknowledged.
At least one co-author has disclosed a financial relationship of potential relevance for this research.Further information is available online at http://www.nber.org/papers/w18933.ack
NBER working papers are circulated for discussion and comment purposes. They have not been peer-reviewed or been subject to the review by the NBER Board of Directors that accompanies officialNBER publications.
© 2013 by Elizabeth Ananat, Shihe Fu, and Stephen L. Ross. All rights reserved. Short sections oftext, not to exceed two paragraphs, may be quoted without explicit permission provided that full credit,including © notice, is given to the source.

Race-Specific Agglomeration Economies: Social Distance and the Black-White Wage GapElizabeth Ananat, Shihe Fu, and Stephen L. RossNBER Working Paper No. 18933April 2013, Revised June 2015JEL No. J15,J24,J31,R23,R32
ABSTRACT
We present evidence that benefits from agglomeration concentrate within race. Cross-sectionally, theblack-white wage gap increases by 2.5% for every million-person increase in urban population. Withincities, controlling for unobservable productivity through residential-tract-by-demographic indicators,blacks’ wages respond less than whites’ to surrounding economic activity. Individual wage returnsto nearby employment density and human capital rise with the share of same-race workers. Manufacturingfirms’ productivity rises with nearby activity only when they match nearby firms racially. Weakercross-race interpersonal interactions are a plausible mechanism, as blacks in all-white workplacesreport less closeness to whites than do even whites in all-nonwhite workplaces.
Elizabeth AnanatSanford School of Public PolicyDuke UniversityBox 90245Durham, NC 27708and [email protected]
Shihe FuResearch Institute of Economics and ManagementSouthwestern University of Finance and EconomicsChengdu, [email protected]
Stephen L. Ross University of Connecticut Department of Economics 341 Mansfield Road, Unit 1063 Storrs, CT 06269-1063 [email protected]

I. Introduction
Two well-documented characteristics of American cities are agglomeration economies—
cities exhibit higher productivity (Ciccone and Hall 1996; Henderson 2003) and wages (Glaeser
and Maré 2001) than do less-urbanized areas—and high levels of racial inequality, with African-
Americans facing significant segregation in many aspects of daily life and on average earning
substantially less than do whites (Neal and Johnson 1996; Lang and Manove 2011; Black et al.
2006). An entirely unexplored question in the literature is whether one component of racial pay
disparities is that blacks and whites derive different benefits from agglomeration, and if so
whether social distance between blacks and whites is a cause of the difference.
Consistent with this possibility, we find that the racial wage gap rises with city size. Figure 1
shows that the gap between blacks and whites rises from a base of 12% of wages by 0.3
percentage points (or 2.5%) for each million additional people in a metro area. A simple
regression over metropolitan areas indicates that a one-standard-deviation increase in total
employment is associated with an increase in the black-white wage gap of 0.66 percentage
points, and a one-standard-deviation increase in employment density (workers per square
kilometer) is associated with a 1.38 percentage point increase in the black-white wage gap.1
Looking within metropolitan areas, we find very similar effects. A one standard deviation
increase in workplace employment density increases the wage gap by 1.9 percentage points in a
wage regression with standard census controls, which is 27 percent of the unexplained black
white wage gap in our preferred specification.
In this paper, we use the restricted version of 2000 Census data to demonstrate that African-
Americans receive smaller wage benefits from employment density and human capital
concentration than do whites. Our findings are robust to including highly flexible controls
1 Similar regression results arise when the sample is restricted to metropolitan areas with populations over 2 million.

intended to capture both observed and unobserved individual attributes and to allowing for very
heterogeneous returns to workplace characteristics. Further, wage and firm total factor
productivity analyses show that a major driver of this relationship is African-Americans having
fewer same-race peers in the workplace from whom to enjoy productivity spillovers. We observe
similar patterns for wage returns to the share of college educated workers in the workplace,
which we interpret as reflecting human capital externalities. Finally, we provide evidence that
social distance between blacks and whites—that is, lower levels of between-race than within-
race social interaction conditional on physical proximity—persists regardless of the racial mix of
the workplace. Taken together, these findings are consistent with interpersonal interactions as a
transmission mechanism for agglomeration economies, and with blacks being disadvantaged in
capturing the benefits of agglomeration by having a lower intensity of interactions in majority-
white workplaces.
Studies of both the black-white wage gap and the urban wage premium raise unobserved
productivity attributes as a fundamental concern. Neal and Johnson (1996) and Lang and
Manove (2011) use AFQT score as an measure of individual ability and find that inclusion of
AFQT substantially erodes the estimated black-white gap. Glaeser and Maré (2001), Wheeler
(2001), Yankow (2006), and Combes et al. (2008) find that the estimated wage premium
associated with city size decreases substantially after the inclusion of a worker fixed effect.
Following Fu and Ross (2013), we address this concern by using residential location fixed
effects to compare similar individuals who reside in the same location, but work in different
locations, exploiting the fact that households systematically sort into residential locations where
they are similar to the other residents. Fu and Ross demonstrate that residence fixed effects

provide an effective control for unobserved ability, and find no evidence of bias in
agglomeration estimates from worker sorting over employment density.2
Further, we find that after controlling for workers’ residential location there is effectively no
correlation between their race and the employment density in their workplace; moreover, it
reduces unexplained racial differences in wages by 53%. This reduction is comparable to the
48% reduction in the black-white wage gap found by Lang and Manove (2011) from the
inclusion of the AFQT score. Moreover, additional geographic and demographic expansions of
the vector of fixed effects do little to further erode racial wage differences—suggesting that, as
found earlier, the residential fixed effects control adequately capture unobserved skill differences
between blacks and whites.
We estimate our wage models with residential location fixed effects for a sample of prime
age, fully employed males residing in metropolitan areas with more than one million residents.
We control non-parametrically for observables such as age, education, and other demographics
and allow for the wage return to agglomeration to vary across observable demographics,
industry, occupation, and metropolitan area. We find that a one-standard-deviation increase in
employment density leads to a 1.8 percentage point increase in the black-white wage gap, very
similar in magnitude to the 1.9 percentage point estimate mentioned above.
Next, we explore whether these differences in returns might be explained by race-specific
information networks (Hellerstein et al. 2011; Ionnides and Loury 2004). Consistent with this
hypothesis, we find that higher own-race representation in a work location increases the returns
2 Specifically, they find that the inclusion of census tract fixed effects has very little influence on the estimated
return to employment density across a wide variety of wage models, including models that omit all individual
demographic attributes. Consistent with this conclusion they show that the within-metropolitan-area correlation
between observable ability and agglomeration is very low. Further, they demonstrate that neither the wage return to
density nor to share college is likely to be driven by unobserved ability, because observationally equivalent workers
in different work locations are earning similar wages net of commuting costs and so earning similar real wages. See
Albouy and Lue (2014) on the role of real and nominal wages within metropolitan areas.

to employment density. These results are consistent with blacks receiving lower average returns
to agglomeration because on average they have fewer same-race peers from whom to enjoy
spillovers and so gain less productivity. Given our estimates, the black-white difference in
exposure to workers of the same race explains 65% of the standardized effect of race on the
return to agglomeration.
To test whether this difference in returns reflects a difference in productivity (rather than in,
say, bargaining power), we estimate total factor productivity (TFP) models for manufacturing
establishments3
in the same metropolitan areas as our worker sample. Following Moretti
(2004b), we identify a sample of workers in each establishment based on that establishment’s zip
code-three digit industry cell, and we confirm that firm TFP increases in locations that have high
concentrations of employment. Consistent with our hypothesis, we find that the productivity
returns to agglomeration fall substantially when the race of the firm’s workers does not closely
match the racial composition of the surrounding location. This mismatch between the racial
makeup of the firm employing the typical black worker and the racial makeup of surrounding
firms explains up to 2.1 percentage points, or about 32 percent, of our black-white wage gap.4
While the previous evidence on human capital spillovers is mixed,5 we also examine racial
differences in the return to concentrations of college-educated workers, and results are very
3 TFP models can only be estimated for manufacturing, because establishment data for other industries do not
contain estimates of either materials costs or capital stock. 4 Our model takes advantage of the evidence, discussed above, that no appreciable workplace sorting by worker race
over employment density exists within metropolitan areas after controlling for worker unobservables via residential
location. This fact gives our approach an advantage relative to cross-metropolitan TFP estimates, which may be
biased by worker sorting across metros on unobservables. 5 Moretti (2004a) finds evidence of higher wages in cities with greater concentrations of college-educated workers,
and Moretti (2004b) finds evidence of higher firm total factor productivity in cities with a large share of college
graduates using a production function that allows for substitution between high and low skill labor. In contrast,
Acemoglu and Angrist (2001) find no evidence of human capital externalities across states, and Ciccone and Peri
(2006) find no evidence of human capital externalities in cross-metropolitan wage differences after controlling for
changes in the mix of low and high skill workers in production. Fu and Ross (2013) also find mixed evidence. They
find that returns to human capital externalities are attenuated significantly by the inclusion of residential fixed
effects. However, they also demonstrate that the remaining estimated effects of human capital externalities are not

similar to those for employment density. A one-standard-deviation change in the share of area
workers who are college graduates is associated with a 1.3-percentage-point higher black-white
wage gap. Looking at college graduates by race, we find these differences are substantially
explained by the fact that blacks have lower exposure to same-race college-educated workers.
Similarly, we find that a firm’s returns from exposure to college educated workers increase when
nearby workers are of the same race as the majority of its own workers. The results of this set of
analyses generally support our hypothesis that differences in the return to agglomeration by race
result from a within-race concentration of productivity spillovers, although for reasons discussed
below we interpret the human capital spillover results with caution.
The share of same-race peers at work should not matter for density or human capital
spillovers if workers are equally likely to enjoy spillovers from any peer, regardless of race.
However, by examining self-report data from the General Social Survey we demonstrate that
African-Americans feel much greater social distance from whites than from blacks,6 and that
there is no significant reduction in this gap for African-Americans who work in majority-white
firms. Even working in an all-white firm does not increase African-Americans’ average self-
reported relative closeness to whites. We view this evidence as further support for same-race
interpersonal networks as a plausible mechanism by which African-Americans receive smaller
returns to agglomeration than do whites.
The rest of the paper proceeds as follows. Section II briefly reviews the literatures on
workplace spillovers and the role of social networks in labor markets. Section III describes our
associated with observationally equivalent workers in different work locations earning different real wages (net of
commuting costs).
6 Defined as the difference between an individual’s reported “closeness to blacks” and that individual’s reported
“closeness to whites” on a 9-point ordinal scale.

wage model. Section IV describes the individual data, and section V presents results. Section VI
concludes.
II. Literature review
Given the strong evidence that a major source of agglomeration economies is spillovers
across individuals,7 it stands to reason that peer and social interaction effects that arise in dense
areas might increase individual and firm productivity. For example, Nanda and Sorenson (2010)
find evidence of peer effects on self-employment that suggests knowledge- or experience-sharing
between workers. Peers may also affect one another’s productivity through establishing norms
about absenteeism or work effort (DePaola 2010; Bandiera, Barankay and Rasul 2005; Falk and
Ichino 2006; Mas and Moretti 2009). 8
These putative mechanisms, however, depend essentially on actual social interactions
between peers. To the extent that individuals are more likely to associate with peers of the same
race, race-specific social networks could explain why in most industries (where whites make up
the majority of workers) knowledge spillovers may accrue more to whites than to nonwhites.
For a variety of reasons, individuals appear much more likely to associate with peers of the
same race. Within the large literature documenting the adverse outcomes experienced by
African-Americans (cf. Wilson 1987), researchers have identified their exceptional isolation in
7For example, Glaeser and Maré (2001) find that workers who migrate away from large metropolitan areas retain
their earnings gains, suggesting that these permanent gains arise because workers gain skills from working in dense
urban areas. Rosenthal and Strange (2008) using wages and Rosenthal and Strange (2003) examining firm births
document a fairly rapid decay of spillovers across space, consistent with agglomeration resulting from social
interactions. Ellison, Glaeser and Kerr (2010) find evidence that spillovers between firms explain a significant
portion of the co-agglomeration of industries using metrics for the extent that firms share workers and ideas.
Audretsch and Feldman (1996) and Feldman and Audretsch (1999) demonstrate that the composition of surrounding
industry affects the rate of product innovation. Finally, Moretti (2004) finds that firms are more productive and more
innovative when located in cities that have more educated workers. See Combes and Gobillon (In Press) for a recent
review. 8 See Ross (2011) for a recent review of the general literature on peer effects.

segregated neighborhoods and metropolitan areas (cf. Massey and Denton 1993, Kain 1968) as a
significant cause of these disadvantages (Cutler and Glaeser 1997, Ananat 2011).
A growing body of recent work seeks to interpret findings on the effects of residential
segregation and spatial isolation on earnings by illustrating that demographic match with those
who are employed at a work location affect individuals’ employment opportunities. Bayer et al.
(2008) find that similar individuals who reside on the same block are more likely to work
together than dissimilar neighbors, and that the similarity of a worker to others residing nearby
drives both employment and wages. Hellerstein et al. (2008) find that the benefit to an individual
of nearby job locations depends heavily on whether members of one’s own race, not merely
otherwise similar workers of different races, are employed there.9 This previous research
evidence on segregation in social and employment networks, and its relationship to workplace
outcomes, lends support to our hypothesis that racial disparities exist in the return to workplace
externalities.
In this paper, we examine two potential types of externalities. The first, captured by the
density of industry-specific employment in the sub-area of an MSA, i.e. Public Use Microdata
Area (PUMA), in which an individual works, focuses on general spillovers associated with
industry-specific agglomeration economies. The second, captured by the share of workers in an
individual’s industry and PUMA who are college graduates, focuses on skill-based human
capital spillovers. We also test whether own-race share of employment in the area where an
individual works moderates the racial disparity in return to agglomeration. We conduct a similar
test examining firm total factor productivity. Finally, in order to help understand why racial
9 Ioannides and Loury (2004) and Ross (2011) provide detailed reviews of the extensive literature on labor market
referrals and networks.

disparities exist in the return to agglomeration, we test whether social distance between blacks
and whites is affected by workplace proximity.
III. Model Specifications for the Wage Models
First, to establish a baseline measure of agglomeration economies, we estimate the following
equation for the log wages ( ) of individual i in work location j and metropolitan area s:
(1)
where is a measure of workplace externalities in an individual’s work location, either
employment density or share college-educated, is a vector of demographic indicators, is
a vector of industry and occupation indicators, captures metropolitan area fixed effects,
represents individual unobservables, and represents an idiosyncratic error term. Standard
errors are clustered at the workplace to address correlation across industries within each
workplace.
Our main analysis organizes the individual’s in the sample into observationally equivalent
groups, indexed by {xt} to indicate individuals who belong to the same demographic cell x and
reside in the same residential location t, and is replaced by a demographic cell-residential
location fixed effect ( ).10
We also allow agglomeration effects to vary in magnitude by both
and via and , respectively.
(2)
where
and (3)
is subscripted by x instead of i to capture the fact that X does not vary within group,
represents the metropolitan specific return to , and is the individual unobservable that
10
Note the demographic cell-residential location fixed effects also captures the MSA fixed effects.

remains after conditioning on . Following Fu and Ross (2013), the logic behind this
specification is that observationally equivalent individuals who observe the same residential
opportunities within a metropolitan area and then make the same residential choices are likely to
be relatively similar on unobservables, and so we can reasonably assume that workers do not sort
into locations with high or low based on unobservable attributes (a testable assumption).
Equations (2) and (3) are estimated using a single stage linear model with standard errors
clustered at the residential location t.11
IV. Data for the Wage Models
The main models in this paper are estimated using the confidential data from the Long Form
of the 2000 U.S. Decennial Census. The sample provides detailed geographic information on
individual residential and work location. A subsample of prime-age (30-59 years of age), full
time (usual hours worked per week 35 or greater), male workers is drawn for the 49
Consolidated Metropolitan and Metropolitan Statistical Areas that have one million or more
residents.12
These restrictions lead to a sample of 2,343,092 workers, including 1,705,058 whites,
226,173 blacks, 264,880 Hispanics, and 135,577 Asians.
Table 1 reports individual, employment location PUMA,13
and metropolitan area
characteristics by race (white, African-American, Hispanic, or Asian) of the worker.14
Our
11
The clustering of standard errors on residential location addresses the bias identified by Bertrand, Duflo, and
Mullainathan (2004) for clustered data with fixed effects. The Moulton (1986) bias associated with standard errors
on variables that do not vary within a cluster is almost certainly far less severe in the model described by equations
(2) and (3) because the within-group deviation of only take the same value for individuals who belong to the
same demographic cell and choose the same residential location. As a robustness test for our standard errors, we
examine an alternative model based on Donald and Lang (2007) that explicitly recognizes that the demographic
differences in the return to agglomeration are only identified by variation across the groups defined by demographic
cell x and metropolitan area s. See appendix for details. 12
This sample is comparable to the sample drawn from the Public Use Microdata Sample (PUMS) of the 2000
Census by Rosenthal and Strange (2008) except that we explicitly restrict ourselves to considering residents of mid-
sized and large metropolitan areas. 13
We use the more homogenously defined residential PUMA, which is used to report residential location in the
PUMS, to classify employment location, rather than measuring location using the census definitions for workplace
PUMA.

dependent variable is the logarithm of the wage, which is based on an individual’s labor earnings
last year divided by the product of the number of weeks worked and the average hours per week
worked last year. Our demographic controls include categorical variables by age, education,
family structure, and immigration status. These controls are also used to create the
observationally equivalent cells described above. At the employment PUMA, we measure
employment density in units of 1000 workers per square kilometer and potential human capital
spillovers by calculating the share of workers with at least four years of college education based
on all full-time workers reporting this employment location. 15
The variables capturing the share
of workers in each category who are the same race as the individual are also constructed using all
full-time workers.16
For illustrative purposes, Table 2 reports the results of a traditional wage model with
agglomeration controls for the entire sample. The regression controls for a variety of individual
characteristics (age, race, education, family structure, and nativity), metropolitan, industry and
occupation fixed effects, as well as for education levels in the worker’s industry and occupation
at the MSA level, with standard errors clustered at the level of the employment location PUMA.
As expected, both within-industry employment density and within-industry share of workers
with a college degree in an individual’s PUMA of employment are strongly associated with
14
Throughout the paper we use the term “race” interchangeably with “race and ethnicity” to capture distinctions
between non-Hispanic whites (“whites”), non-Hispanic blacks (“blacks” or “African-Americans”), non-Hispanic
Asian-Americans (“Asians”), and Hispanics of any race (“Hispanics”). 15
The average area of PUMAs in our sample of 183 square miles is comparable to the geographic scope of within
metropolitan-spillovers identified in the literature. Rosenthal and Strange (2008) examine wage effects of the
number of full time workers within rings between 0 and 5 miles of a location (78 square miles) and find effects that
are 4 to 10 times larger than the effects found between 5 and 25 miles. Fu (2007) finds that attenuation is fairly flat
within 6 miles for human capital externalities and flat within 3 miles for employment density. Also, Fu and Ross
(2013) find qualitatively similar, but somewhat larger, agglomeration estimates for PUMAs compared to the smaller
zip code areas of 7 square miles on average in the same sample. 16
The controls shown in Table 1 include human capital measures by metropolitan area and industry and occupation.
These controls are similar in spirit to controls used by Glaeser and Maré (2001) for occupation education levels
nationally in their across metropolitan study.

higher wages for that individual.17
A one-standard-deviation increase in density (i.e. an increase
in one’s own industry and PUMA of 2,100 workers per square kilometer) is associated with
increases in wages of 2.6 percentage points. A one-standard deviation increase in share college-
educated (i.e. a 17-point increase in share college-educated in one’s own PUMA-industry) is
associated with an increase in wages of 6.6 percentage points. These estimates are highly
consistent with existing research on returns to agglomeration.18
In order to provide additional insight into our identification strategy, we examine the
correlation between our work location attributes, employment density and share college, with
indicators for racial identity. Table 3 presents the correlations with indicators of whether the
individual is white and whether the individual is black. The unconditional correlation in panel 1
between employment density and white is -0.018 and between share college and white is 0.053.
The correlations for the black indicator are substantially smaller, at 0.008 and -0.007,
respectively. Conditioning on metropolitan fixed effects lowers the correlation of employment
density substantially to 0.000 and 0.003 for the white and black indicators, respectively, but has
less effect on the correlations with share college, leaving them at 0.063 and -0.012, respectively.
With tract fixed effects, the black indicator correlation remains around 0.003 for employment
density, and while the white indicator correlation jumps up with tract fixed effects, including
indicators for race-neutral tract-by-demographic cells reduces the correlation back to very low
levels. The inclusion of tract fixed effects substantially reduces the correlation with share
college to 0.022 for the white indicator, but no controls reduce the correlations for share college
17
The within-industry and overall values of employment density and share college are highly correlated, and horse
race models with the same controls as those used in Table 2 suggest that the within-industry variables better fit the
data. Like the models presented here, models estimated using overall PUMA values of employment density and
share college instead of own industry value also find racial differences in the wage returns to density and share
college, as well as a substantial role for share own race in workplace in terms of explaining these differences. 18
For example, our estimate of the return to worker density in the industry-PUMA cell implies that a doubling of
density at the mean is associated with a 0.6 percent increase in wages, which is comparable to Rosenthal and
Strange’s (2008) estimate of 1 percent for a doubling of density within a 25-square mile radius.

much below 0.02. These correlations are consistent with the findings of Fu and Ross (2013) that
there is little sorting on unobservables across workplace based on employment density, but that
estimates on share college are likely to be substantially more sensitive to controls for unobserved
ability.
Next, in Table 4, we examine the racial and ethnic differences in wages over a variety of
models with alternative sets of fixed effects. We find that the race coefficient in our preferred
model is consistent with existing black-white wage gap estimates that control for observed
ability, and that this residual is unaffected by a variety of expanded vectors of fixed effects. The
column 1 estimates are repeated from the same metropolitan area fixed effect model reported in
Table 2. The inclusion of tract fixed effects in column 2 reduces the black-white difference in
wages from over 14 percentage points with just metropolitan area fixed effects to just below 7
percentage points, which is in line with Lang and Manove’s (2011) estimates of the black-white
wage gap after controlling for ability using the AFQT test. The black-white difference in wages
remains between 6 and 7 percentage points across a variety of controls including block group,
demographic cell by tract, industry by tract, and occupation by tract fixed effects. Note, however,
that the inclusion of demographic cell by tract fixed effects erodes the Hispanic/non-Hispanic
differences in wages, decreasing the difference to 0.066, compared to 0.094 in the tract fixed
effect model. This may explain the higher correlation for the white indicator in the tract fixed
effect model in Table 3, since whites are being compared to both blacks and Hispanics.
V. Results
We begin by showing the within-metropolitan area conditional correlations between wages
and our production externality variables, and then turn to a richer model that is intended to
address potential sources of bias in the correlation between race and the returns to agglomeration

and human capital externalities. Table 5 presents re-estimates of the models from Table 2
separately by the race and ethnicity subsamples. African-Americans get returns about one-third
as large as the white returns, 0.0047 versus 0.0138 for employment density and 0.145 versus
0.439 for share college. While other groups have smaller differences overall, Hispanics get half
as much return as whites from share college and Asians get half as much return as whites from
employment density.
Having established the basic pattern of racial differences in returns, Table 6 presents
estimates of the complete model described in equations (2) and (3), where demographic cell by
census tract fixed effects are included to control for unobserved ability differences, and where
the agglomeration variables are also interacted with worker demographics, industry, occupation
and metropolitan area in order to control for heterogeneous returns to agglomeration. The
estimates presented in the left column of Table 6 represent the interactions of employment
density with race, ethnicity, education, family structure and immigration status, and the right
column presents the estimates on the interactions of share college. As discussed above, standard
errors are clustered at the census tract level.19
Table 6 column 1 reveals that the return to employment density differs little by age,
education (with the exception of graduate level education), or immigration status. While these
are significant drivers of wages themselves (see Table 2), they do not appear to greatly affect the
relationship between wages and employment density. By contrast, blacks receive a substantially
lower return to employment density than do workers of other races. The estimated difference
between whites and blacks in the gain from agglomeration is greater than the difference in gain
19
Appendix Table A1 presents the race and ethnicity interaction estimates for the two stage model based on Donald
and Lang (2007). The standard errors are very close to the standard errors in Table 5, and the point estimates are
quite similar (nearly identical for the black interaction with employment density). Our two stage model is described
in the appendix.

among those with a degree beyond a master’s degree relative to those with only a high school
diploma. In comparison, this same education difference for wages is more than three times the
racial gap for wages. Further, the inclusion of cell by tract fixed effects and the large number of
interactions with employment density do little to erode the observed racial differences. In Table
5, the racial differences in the return to employment density imply that a one standard deviation
increase in agglomeration is associated with a 1.9 percentage point increase in the black-white
wage gap, and the differences estimated in Table 6 are consistent with a 1.8 percentage point
increase.20
We also find a substantial relationship between share college and the black-white wage gap,
as shown in Table 6 column 2. A one standard deviation increase in share college is associated
with a 1.3 percentage point increase in the black-white wage gap. However, unlike with
employment density, education and age are just as important as race for explaining differences in
the wage return to share college. Further, our controls substantially erode the black-white gap in
return to share college from 5.0 percentage points in Table 5 to 1.3 percentage points.21
Therefore, the results for share college should be interpreted with more caution than the
employment density results.22
Significantly, Hispanics do not experience lower wage premiums than whites from density or
share college-educated in the workplace in our full model specification. In other words, it
appears that Hispanics get the same returns from agglomeration and human capital externalities
as do whites after controlling for heterogeneity in the return to these spillovers and for
20
The standard deviation of employment density is 2.142. We also re-estimate our fully interactive model with the
different vectors of fixed effects, and our findings for the interaction between black and employment density are
robust across all specifications (see Table A2). 21
The black-white gaps for tract and tract by demographic cell fixed effect models estimated separately by race are
2.8 and 3.4 percentage points, respectively. Therefore, the fixed effects explain between 43 and 59 percent of the
reduction and the heterogeneous returns to share college explain the rest of the reduction. 22
On the other hand, the second panel of Table A2 shows that the black-white differences in the returns to share
college are robust in magnitude to the alternative fixed effect vectors.

unobservables that are identified by residential sorting. For Asian-Americans, results are less
consistent, with significantly higher returns to share college than whites in the full model, but no
significant difference in return to density.23
The persistence of effects for blacks, but not
Hispanics or Asians, is consistent with the literature on racial segregation that typically finds that
a large unexplained residual in segregation exists for blacks, but that segregation of Hispanics
and Asians is explained almost entirely by observables (Bayer, McMillan and Rueben 2004).
The racial return gap and the racial composition of the workforce
Next, we test whether the pattern of racial disparities in the returns to agglomeration is
consistent with agglomeration economies arising from race-specific networks. Under such
circumstances, minorities may be disadvantaged because they lack same-race peers in the area
where they work. To examine this hypothesis, in the left-hand column of Table 7 we interact
employment density with the share of all workers in the PUMA who have the same racial or
ethnic classification as the worker himself. In the right-hand column, we interact the share of
workers who are college educated with the share of college-educated workers who are of the
worker’s race.
Not surprisingly, the effect of each of these interactions is positive and highly significant,
consistent with own-race workplace networks as a conduit for receiving returns to
agglomeration.24
In fact, the magnitudes of the coefficients on these controls suggest that
exposure to others of the same race is a very important conduit for receiving returns to
agglomeration. The effect of having only workers of one’s own race in one’s PUMA (0.0537) on
the return to density is much larger than the average return to density from Table 2 (0.0118). The
23
In the two-stage model shown in the appendix, Asian-Americans have marginally significantly lower returns than
whites to density and no significant difference in return to share college. 24
Table A2 presents the interaction estimates for all demographic variables. The estimates presented here are from
specifications that include level controls for the two own-race variables. All results are robust to whether these level
controls are included or excluded from wage models.

effect of having only members of one’s race make up the college-educated workforce in one’s
PUMA is 0.160, which, while smaller than the average return to share college-educated (0.389),
is still appreciable.
Moreover, black-white differences in own-race share of the workforce can explain a
significant portion of the black-white wage gap. For the entire sample, the average difference in
whites’ versus blacks’ exposure to same race-employment density is 0.211. Multiplying by the
estimated coefficient on the own-race interaction with density implies that racial differences in
own-race exposure to employment density can explain 1.1 percentage points of the black-white
wage gap. From Table 6, the effect of a one-standard-deviation change in employment density on
the black-white difference in wages is 1.8 percentage points, and so differences in own race
explain 61% of the standardized racial differences in return to employment density. The racial
difference in exposure to college educated workers scaled by share same race is 0.101, implying
an effect of 1.6 percentage points, which is actually larger than the 1.3 percentage point
standardized effect of share college on the black-white wage gap from Table 6. These findings
complement earlier work by Hellerstein et al. (2011) arguing that employment networks operate
along racial lines; our results suggest that not only finding a job but also benefiting from returns
to agglomeration on the job depends on own-race share in the workplace.
Our finding that blacks’ lower exposure to own-race workers explains 61% of the
standardized black-white difference in returns to agglomeration might appear at odds with the
positive coefficient on the black interaction with employment density in the second panel, which
would seem to imply that, after controlling for own race, returns to agglomeration are larger for
blacks. However, the estimated coefficient on black in Table 7 is conditional on holding own-
race share in workplace fixed, while the effect of being black rather than white in a given work

location is actually the black coefficient plus the product of [(the own-race share coefficient) X
(the difference between the share of black workers and white workers)]. We have verified that
for the vast majority of work locations the effective net coefficient on the black interaction is
negative.
Finally, we conduct a series of robustness tests and present those results in Table 8, with the
results from Table 7 repeated in column 1. First, we focus on the share workers who are same-
race based on a simplified black/non-black classification.25
Next, we demonstrate that our
findings are robust to allowing the returns to employment density and share college to be
quadratic. The fourth column incorporates controls for the racial composition of the PUMA, i.e.
the percent of workers who are black, Hispanic or Asian. The fifth column adds additional
controls for the linear variables, such as age and years of education, that were divided into bins
to create the observationally equivalent cells. Finally, we drop family structure from the
demographic cells because these variables may be most at risk of being determined
simultaneously with the wage. The estimated racial differences in returns to both employment
density and share college, as well as the estimated effects of own-race share in workplace on
returns to these variables, are quite stable across these alternative specifications.
Do Racial Networks Affect Productivity?
In order to examine whether racial networks affect productivity (rather than affecting wages
through, for example, improved bargaining), we turn to estimating models of firm productivity
using establishment data gathered in the 1997 Census of Manufacturers. We are restricted to
25
The effect sizes for the black-non black model are larger than the estimates from Table 8 column 1. However, we
cannot distinguish statistically between the own-race and the black-non black model. The F-statistics from
comparing the models in columns 1 and 2 to a composite model are 1.90 and 2.02, respectively, insignificant with
type 1 error probabilities of 0.149 and 0.133.

examining only manufacturing data because information on the cost of materials and on the stock
of capital is only available for the manufacturing industry.26
Using these data, we estimate models for firm net revenue (total revenues minus material
costs) as a translog27
function of the firm’s structure capital, equipment capital, and employment,
plus linear controls for manufacturing employment density and share college at the PUMA level.
To characterize firm employment, we follow Moretti (2004b) and Hellerstein, Neumark, and
Troske (1999) and develop estimates of the share of workers at a firm with four-year college
degrees based on analysis of three-digit industry code by zip code cells in the decennial Census.
This share is combined with firm total employment to estimate the number of college-educated
and non-college-educated workers as separate factor inputs.28
All models control for three digit
industry and metropolitan area fixed effects, and standard errors are clustered at the level of the
work-location PUMA.
A natural concern in any model of the effect of agglomeration and human capital
externalities on TFP is that workers may sort across firms based on unobserved ability. Unlike
across-metropolitan areas studies (Glaeser and Maré 2001; Combes et al. 2008), however, the
correlations of both observable worker human capital and worker race with employment density
across PUMAs are near zero (see Table 3; see also Fu and Ross 2013). Further, we use the
census tract fixed effect model of wages from Table A2 to calculate a measure of expected
26
We have also explored estimating the wage models for a subsample of manufacturing workers. Estimates are
qualitatively similar to the results in Table 7, but have very large standard errors. 27
We strongly prefer the translog to the Cobb-Douglas production function. The translog model allows the marginal
product of factor returns to change with the level of factors employed in production, addressing concerns raised by
Ciccone and Peri (2006) that models of human capital externalities may confound spillovers with changes in the mix
of inputs. Further, the R-squared increases from 0.84 to 0.91 when moving from Cobb-Douglas to translog, and the
resulting F-statistic is 8,147, dramatically rejecting the Cobb-Douglas model. Moreover, the translog model yields
much more precise estimates of both the return to employment density and the return to share college-educated; the
standard errors fall by 30 and 35 percent, respectively. 28
In cases for which we cannot match to establishment zip code, we base our estimates on industry-PUMA cells.

worker quality for each tract. We then use the residential location of workers within an industry-
zip code cell to estimate implied average worker quality as an additional factor input.
The results of our baseline translog model are shown in Table 9 column 1.29
We estimate that
the effects of a one standard deviation increase in employment density and share college in a
PUMA are 0.030 and 0.022, respectively. The share college estimate is comparable in magnitude
to Moretti’s cross-MSA estimates of between 0.035 and 0.049, especially considering that our
estimate is reduced substantially by the inclusion of the control for employment density.
For each industry-zip code cell, we also use the decennial Census data to calculate the share
of the workforce that is white, black, Hispanic, or Asian-American. Using these shares, we
calculate the average exposure of workers in an industry-zip code cell to workers of the same
race in other zip codes in this PUMA and in the same industry. We calculate a similar measure
for exposure of a firm’s workforce to college-educated workers of the same race in the PUMA-
industry cell. We then interact these two variables with the PUMA-industry employment density
and the PUMA-industry share college-educated, respectively, in order to test whether returns to
agglomeration in terms of firm productivity depend upon firm employees’ within-race
interaction opportunities. We also include direct controls for the racial composition of the
workers in each firm (i.e. industry-zip code cell).
The estimates including these variables are shown in column 2. We find a strong, statistically
significant effect on productivity of the interaction between employment density and firm
workers’ average exposure to own-race workers in PUMA-industry. In fact, our estimates
suggest that there is no return to employment density for a firm whose workers have no exposure
to same-race workers in the PUMA. In other words, increased density of employment increases a
29
All the estimates for the translog models in Table 9 are shown in Table A4.

firm’s productivity, but only to the extent that the increased density comes from an increase in
the number of workers of the same race as that firm’s workers.
The estimated interaction between firm average exposure to same-race college-educated
workers and returns to share college-educated workers in a PUMA, while not quite statistically
significant in column 2 (p-value=.11), is in the expected direction and sizable, with nearly the
same magnitude as the estimate in column 1 of the direct effect of share college-educated in the
PUMA. The direct estimate on share college falls from 0.20 to 0.09 with the inclusion of the
interaction term, and a firm with zero exposure to college-educated workers in the PUMA who
are the same race as its own college-educated workers is estimated to receive one-half the
productivity benefit from college-educated workers in the PUMA than the average firm does,
according to the point estimates.
In column 3 we include controls for the unobserved ability of workers at the firm based on
the residential location of those workers.30
In this model, the effect of the firm’s own race match
with its work location on return to density is very stable, and the effect of race match on return to
share college increases by 19 percent and becomes statistically significant. Further, the estimated
return to share college with zero average exposure is now a mere 12 percent of the original
estimate in column 1.
Table 10 presents a series of robustness checks for the final model in Table 9 by adding a
series of fixed effects.31
Column 2 includes indicators for three-digit industry interacted with
density and share college-educated; column 3 includes PUMA fixed effects; and column 4
30
In order to illustrate the average effect of the mean tract FE on firm TFP, we also estimated the Cobb-Douglas
model with this control and find that, as expected, the mean tract FE variable has a strong positive effect on firm net
revenue with an estimate of 0.145 and a t-statistic of 2.69. This model also includes an indicator for whether we
were failed to match the zip code and were required to match based on industry-by-PUMA cells. 31
These results are included in the paper rather than with the other robustness checks in the appendix because they
have notably large effects on the magnitude of the estimates.
includes both. The PUMA fixed effects control non-parametrically for any relationship between
firm location and TFP, while the three-digit-industry interactions allow the returns to our two
location variables to vary across manufacturing industries. These changes greatly increase the
precision of the estimates, as well as the magnitude of the employment density and share college
interactions.
In terms of magnitude, racial differences in workers’ exposure to firms whose employees’
race matches the race of the surrounding workforce can also explain a substantial fraction of the
effect of agglomeration on the black-white wage gap. We calculate racial differences in the
average exposure to a firm’s own-race index for blacks and whites in the sample, which is 0.148
for own-race exposure and 0.166 for own-race exposure among college graduates. Given these
racial differences, a one-standard-deviation increase in employment density in the firm sample is
associated with a 1.0 to 2.1 percentage point increase in the black-white wage gap, due to higher
exposure of blacks to firms with lower productivity gains from employment density. A one-
standard-deviation increase in share college in the firm sample is associated with a 0.4 to 0.9
percentage point increase in the black-white wage gap, due to higher exposure of blacks to firms
with lower productivity gains from share college.32
These changes are similar in magnitude to
the standardized race effects estimated in the wage models, 1.8 and 1.3 percentage points for
employment density and share college, respectively.
Finally, Table 11 shows results for subsamples split by how much they rely on innovation:
columns 1 and 2 split by whether the three-digit industry has high vs. low research and
development spending; columns 3 and 4 split by whether the three-digit industry has a high vs.
32
In the firm sample weighted by number of employees, the standard deviation of employment density is 0.735 and
of share college is 0.104.

low rate of patent production.33
If the hypothesized mechanism of information spillovers that are
segregated within same-race networks holds, then racial match with surrounding firms should
matter more for productivity in industries that rely on innovation. Again, we find that precision
increases when we take account of industry type, and effects are much larger for the share
college-educated interacted with same-race college-educated exposure in high-R&D and high-
patent industries, as hypothesized. For employment density, effects are similar across R&D
levels, but are significantly higher in the high-patent than in the low-patent industries. Overall,
the estimates in Tables 9 through 11 strongly support the hypothesis that returns to
agglomeration are driven by increases in productivity due to workers’ interactions with others of
the same race.
Social distance by workplace racial composition
Finally, we examine whether self-reported patterns of individual association are consistent
with the hypothesis that social ties are disproportionately within-race, even for those whose
workplaces include no same-race peers. While it is well-established that most social interactions
are within-race, it may be that workers who lack colleagues of the same race develop strong
cross-race relationships, which would cast doubt on the proposed mechanism for our findings.
To test this possibility, we draw on data from the U.S. General Social Survey, which has been
fielded every one or two years since 1972 and contains a standardized set of demographic and
attitudinal questions, many of which are asked consistently over time. A substantial number of
respondents across a number of waves are surveyed on: racial attitudes; the racial composition of
their workplace; and how close they feel to blacks and to whites. We focus on black and white
respondents, as questions were not comparable for Hispanics and Asian-Americans. Our sample
33
We are grateful to Bill Kerr at the Harvard Business School for providing us with these data. For details on the
R&D spending data see Kerr and Fu (2008) and for patent data see Kerr (2008).

includes employed blacks and whites who responded to surveys in which the relevant questions
were asked.34
The sample is further truncated specific to each dependent variable by setting the
variable to missing when the question was not answered by the respondent.35
The first set of models that we estimate examines racial attitudes as a function of the racial
composition of the firm. We investigate survey responses to: a political attitudes question about
whether enough is being done by the government to address the condition of blacks, a social
attitudes question about whether the respondent approves of a law banning interracial marriage,
and a pair of personal attitude questions about how close the respondent is to whites and how
close the respondent is to blacks. We also construct a measure of the difference in an individual’s
reported closeness to blacks relative to whites. Our estimation sample is all employed whites and
blacks who responded to the specific racial attitude question. The purpose of these models is to
test whether more positive attitudes towards blacks are held by whites (and vice versa) when an
individual interacts with more whites (non-whites) in the workplace. We estimate a model
including an indicator for race, a measure of the percent white in workplace, and an interaction
of the two; the model also includes indicators for survey year, for missing response to percent
white in workplace, and for the interaction of race with missing response to percent white in
workplace.36
Table 12 reports results. Estimates in columns 1 and 2 demonstrate that, while African-
Americans are more likely to support increased government help for blacks than are whites and
34
Race, closeness to whites and blacks, and attitude toward government help for blacks was asked in all years of the
survey. Workplace racial composition was determined in 1990 and biannually (i.e., in every survey) between 1996
and 2010, so nearly all of the analysis uses survey waves 1990 and 1996 through 2010. The exception is the analysis
of attitude toward interracial marriage, which was discontinued as a question in 2002, meaning that analysis of that
attitude is restricted to 1990 and 1996 through 2002. 35
Whenever a respondent does not supply an answer for an independent variable used in our analysis, that variable is
set to zero, and an indicator that the variable is missing is set to one, for regressions including that independent
variable. 36
We have also estimated this set of regressions with fixed effects for MSA; standard errors increase but neither
coefficients nor the pattern of significance changes.

are less likely to oppose interracial marriage, views on these issues do not differ by the racial
composition of the firm, among either blacks or whites. This suggests that there is no systematic
sorting by racial attitudes into firms with different racial compositions,37
and no effect of percent
white in a firm on individual employees’ broader racial attitudes. By contrast, columns 3 through
5 demonstrate that there is a strong relationship between firm percent white and employee
reports of closeness to whites and to blacks.
Not surprisingly, blacks overall report being closer to blacks than do whites and report being
less close to whites than do whites; the additional “social distance” between blacks and whites,
relative to whites with whites, is 1.4 points on a 9-point scale (column 3 row 1). In addition,
people in whiter workplaces report being 1.2 points less close to blacks (column 3 row 2) and 0.3
points closer to whites (column 4 row 2). Most relevant to the central question of this paper is the
following: while black employees of otherwise all-white firms report being 0.7 (nonsignificant)
points closer to whites than do blacks employed in all-nonwhite firms (sum of rows 2 and 3 of
column 4), they are still significantly less close to whites than are whites. In fact, blacks in all-
white firms are less close to whites than are whites in all-nonwhite firms (sum of all coefficients
in column 4). These conditional correlations are suggestive that African-Americans fail to access
white social networks to the extent that whites do, even when the African-American in question
works in an all-white firm.
VI. Discussion
This paper demonstrates that blacks receive lower returns to agglomeration economies in
their place of work than do whites, a pattern that may contribute to overall racial income
disparities and a host of other social concerns. Racial differences both in the return to
37
Analysis using the percent black in the respondent’s MSA/one-digit-industry produce qualitatively similar, though
less precise, results, providing further evidence that our results are not due to race-specific sorting into firms based
on attitudes (results available upon request).

employment density and in share college in the workplace are robust to controlling for
differences in the returns over demographics, industry, occupation, and metropolitan area, and to
controlling for unobserved differences in skill as proxied by residential location. The black-white
difference in returns to employment density is substantially larger than the estimate on any other
demographic characteristic, including education, and the magnitude of the effect is relatively
stable even after including controls that are known to substantially erode the overall black-white
wage gap. For returns to share college, while the estimated racial differences decline
substantially when controls are added, the general findings are robust across a series of
specifications.
Several pieces of evidence suggest that the black disadvantage in compensation is driven by
race-specific social networks in the workplace. First, the returns to both density and share college
increase as the fraction of workers who share an individual’s race increases, and racial
differences in own-race share of workers explain a substantial fraction of the role of
agglomeration in black-white differences in returns. Second, we estimate a model of firm total
factor productivity for a sample of manufacturing establishments to directly test whether the
exposure of firm workers to workers of the same race at other nearby firms affects firm
productivity. We find strong evidence that the returns to agglomeration rise as the average
exposure of workers in a firm to same race peers rises. Finally, we find that the racial differences
in the social distance that workers report with respect to whites persists even among blacks who
work in all-white firms, suggesting that blacks experience relatively little access to white
workplace networks.
As a whole, these findings are consistent with racial differences in social interactions
between workers explaining a substantial fraction of the black-white wage gap that is observed in

U.S. urban areas. Our preferred model of the racial wage gap, with demographic cell by tract
fixed effects, results in an unexplained black-white difference in wages of 6.9 percentage points.
In comparison, given racial differences in exposure to own-race workers, one-standard-deviation
changes in employment density and share college are associated with 1.8 and 1.3 percentage
point increases in the black-white wage gap. Similarly, given racial differences in workers’
exposure to firms whose workers’ race matches the dominant racial group of surrounding
workers, one-standard-deviation changes in same-race employment density and same-race share
college are associated with 2.1 and 0.9 percentage point (given our preferred models) increases
in the black-white difference in exposure to firm productivity. These findings suggest that a
better understanding of how agglomeration economies operate, in addition to benefiting
economic science, can also help explain the reasons that African-Americans’ wages continue to
lag behind those of whites.
References
Daron Acemoglu and Joshua Angrist, 2001, How Large are Human-Capital Externalities?
Evidence from Compulsory-Schooling Laws, in Ben S. Bernanke and Kenneth Rogoff (eds.)
: NBER Macroeconomics Annual 2000, Volume 15, 9-74.
Albouy, David and Burt Lue. 2014. Driving to Opportunity: Local Wages, Commuting, and Sub-
Metropolitan Quality of Life. NBER Working Paper #19922.
Ananat, Elizabeth. 2011. The Wrong Side(s) of the Tracks: The Causal Effects of Racial
Segregation on Urban Poverty and Inequality. American Economic Journal: Applied
Economics 3(2): 34-66.

Audretsch, David B., and Maryann P. Feldman. 1996. R&D spillovers and the geography of
innovation and production. American Economic Review 86(3):630–40.
Bandiera, Oriana, Iwan Barankay and Imran Rasul (2005). Social Preferences and the Response
to Incentives: Evidence from Personnel Data, Quarterly Journal of Economics 120(3): 917-
62.
Bayer, Patrick, Robert McMillan and Kim Rueben. 2004. What Drives Racial Segregation? New
Evidence Using Census Microdata. Journal of Urban Economics 56(3): 514–35.
Bayer, Patrick, Stephen L. Ross, and Giorgio Topa. 2008. Place of Work and Place of Residence:
Informal Hiring Networks and Labor Market Outcomes. Journal of Political Economy 116:
1150-96.
Bertrand, Marianne, Esther Duflo, and Sendhil Mullainathan. 2004. How Much Should We Trust
Differences-in-Differences Estimates? Quarterly Journal of Economics 119: 249–76.
Black, Dan, Amelia Haviland, Seth Sanders and Lowell Taylor. 2006. Why Do Minority Men
Earn Less? A Study of Wage Differentials among the Highly Educated. Review of Economics
and Statistics 88(2): 300-13.
Ciccone Antonio and Robert E. Hall. 1996. Productivity and the Density of Economic Activity.
American Economic Review 86: 54-70.
Ciccone, Antonio and Giovanni Peri. 2006. Identifying Human-Capital Externalities: Theory
with Applications. The Review of Economic Studies 73(2): 381-412.
Combes, Pierre-Philipi, Gilles Duranton, and Laurent Gobillon. 2008. Spatial Wage Disparities:
Sorting Matters! Journal of Urban Economics 63: 723-42.
Combes, Pierre-Philippe and Laurent Gobillon. In Press. The Empirics of Agglomeration
Economics. In The Handbook of Urban and Regional Economics Vol 5 ( G. Duranton, V.
Henderson, W. Strange). Elsevier BV.
Cutler, David and Edward Glaeser. 1997. Are Ghettos Good or Bad? Quarterly Journal of
Economics 112: 827-72.
De Paola, Maria. 2010. Absenteeism and peer interaction effects: Evidence from an Italian
Public Institute. Journal of Behavioral and Experimental Economics 39(3): 420-28.
Donald, Stephen G. and Kevin Lang, 2007. Inference with Difference-in-Differences and Other
Panel Data. The Review of Economics and Statistics 89: 221-33.
Dustman, Christian, Albrecht Glitz, and Uta Schonberg (2009). Job Search Networks and Ethnic
Segregation in the Workplace. Working Paper.
Ellison, Glen, Edward Glaeser, and William Kerr. 2010. What Causes Industry Agglomeration?
Evidence from Coagglomeration Patterns. American Economic Review 100: 1195-213.
Falk, Armin and Andrea Ichino. 2006. Clean evidence on Peer Effects. Journal of Labor
Economics 24: 39-57.
Feldman, Maryann P. and David B. Audretsch. 1999. Innovation in Cities: Science-based
Diversity, Specialization, and Localized Competition. European Economic Review 43: 409-
29.
Fu, Shihe. 2007. Smart Café Cities: Testing Human Capital Externalities in the Boston
Metropolitan Area. Journal of Urban Economics 61: 86-111.
Fu, Shihe and Stephen L. Ross. 2013. Wage Premia in Employment Clusters: How Important is
Worker Heterogeneity? Journal of Labor Economics 21, 271-304.

Glaeser, Edward L. and David C Mare. 2001. Cities and Skills. Journal of Labor Economics, 19,
316-42.
Henderson, J. Vernon. 2003. Marshall’s Scale Economies. Journal of Urban Economics, 53, 1-
28.
Hellerstein, Judith K., Melissa McInerney, and David Neumark. 2011. Neighbors And Co-
Workers: The Importance Of Residential Labor Market Networks. Journal of Labor
Economics 29(4): 659-95.
Hellerstein, Judith K., David Neumark, and Melissa McInerny. 2008. Spatial Mismatch or Racial
Mismatch. Journal of Urban Economics 64: 464-469.
Hellerstein, Judith K., David Neumark, and Kenneth R. Troske. 1999. Wages, Productivity, and
Worker Characteristics: Evidence from Plant Level Production Functions and Wages
Equations. Journal of Labor Economimcs 17: 209-47.
Ioannides, Yannis M. and Linda Datcher Loury. 2004. Job Information Networks, Neighborhood
Effects, and Inequality. Journal of Economic Literature 42: 1056-93.
Kain, John F. 1968. Housing Segregation, Negro Employment, and Metropolitan
Decentralization. Quarterly Journal of Economics 82: 175-97.
Kerr, William R. 2008. Ethnic Scientific Communities and International Technology Diffusion.
The Review of Economics and Statistics 90: 518-37.
Kerr, William R., and Shihe Fu. 2008. The Survey of Industrial R&D--Patent Database Link
Project. Journal of Technology Transfer 33: 173–86.
Lang, Kevin and Michael Manove. 2011. Education and Labor Market Discrimination. American
Economic Review 101(4): 1467-96,

Mas, Alexandre and Enrico Moretti 2009. Peers at Work. American Economic Review 99(1):
112-45.
Massey, Douglas and Nancy Denton. 1993. American Apartheid: Segregation and the Making of
the Underclass, Cambridge, MA: Harvard University Press.
Moretti, Enrico. 2004a. Estimating the Social Return to Higher Education: Evidence From
Cross-Sectional and Longitudinal Data. Journal of Econometrics 121(1-2).
Moretti, Enrico. 2004b. Workers’ Education, Spillovers, and Productivity: Evidence from Plant
Level Production Functions. American Economic Review 94: 656-90.
Moulton, Brent R., 1986. Random Group Effects and the Precision of Regression Estimates.
Journal of Econometrics 32: 385-397.
Nanda, Ramana and Jesper B. Sorenson. 2010. Workplace Peers and Entrepreneurship.
Management Science 56: 1116-26.
Neal, Derek and William R. Johnson, 1996. The Role of Premarket Factors in Black-White
Wage Differences. Journal of Political Economy 104(5): 869-95.
Rosenthal, Stuart and William Strange. 2008. The Attenuation of Human Capital Spillovers.
Journal of Urban Economics, 64 (2), 373-89.
Rosenthal, Stuart and William Strange. 2003. Geography, Industrial Organization, and
Agglomeration. Review of Economics and Statistics, 85, 377-93.
Ross, Stephen L. Social interactions within cities: Neighborhood environments and peer
relationships. 2011. In Handbook of Urban Economics and Planning (Eds. N. Brooks, K.
Donaghy, G. Knapp). Oxford University Press.
Wheaton, William C. and Mark J. Lewis. 2002. Urban Wages and Labor Market Agglomeration.
Journal of Urban Economics, 51, 542-62.

Wheeler, Christopher H. 2001. Search, Sorting and Urban Agglomeration. Journal of Labor
Economics, 19, 879-99.
Wilson, William J. 1987. The Truly Disadvantaged: The Inner City, the Underclass, and Public
Policy. Chicago: University of Chicago Press.
Yankow, Jeffrey J. 2006. Why Do Cities Pay More? An Empirical Examination of Some
Competing Theories of the Urban Wage Premium. Journal of Urban Economics 60, 139-61.

Figure 1.

Table 1: Descriptive Statistics
White Black Hispanic Asian
Sample size 1,705,058 226,173 264,880 135,577
Dependent Variable
Average hourly wage
28.6959
(45.6694)
19.5287
(31.1947)
17.7986
(32.7494)
26.1993
(40.8411)
Workplace Controls
Employment density in own one digit industry 0.4606 (2.1408) 0.5348 (2.0841) 0.4436 (1.9072) 0.7810 (2.6242)
Share workers with college degree in industry 0.3549 (0.1703) 0.3456 (0.1687) 0.2959 (0.1580) 0.3926 (0.1726)
Share of workers of own race or ethnicity 0.7403 (0.1414) 0.1949 (0.1282) 0.2138 (0.1523) 0.1152 (0.0882)
Share college educated workers own
race/ethnicity 0.3055 (0.0846) 0.0484 (0.0386) 0.0328 (0.0334) 0.0618 (0.0491)
Metropolitan Area Controls
Percent college educated in MSA and
occupation 0.0414 (0.0433) 0.0276 (0.0357) 0.0224 (0.0314) 0.0386 (0.0404)
Percent college educated in MSA and industry 0.0401 (0.0322) 0.0409 (0.0353) 0.0334 (0.0290) 0.0459 (0.0339)
Individual Worker Controls
Age 30 to 39 0.4111 (0.4920) 0.4499 (0.4975) 0.5462 (0.4979) 0.4738 (0.4993)
Age 40 to 49 0.3663 (0.4818) 0.3605 (0.4801) 0.3103 (0.4626) 0.3455 (0.4755)
Age 50 to 59 0.2225 (0.4160) 0.1896 (0.3920) 0.1435 (0.3505) 0.1807 (0.3848)
Less than high school degree 0.0512 (0.2205) 0.1257 (0.3315) 0.3908 (0.4879) 0.1068 (0.3089)
High school degree 0.2043 (0.4032) 0.2863 (0.4520) 0.2181 (0.4130) 0.1159 (0.3201)
Associates degree 0.3020 (0.4519) 0.3560 (0.4788) 0.2391 (0.4265) 0.2037 (0.4027)
Four year college degree 0.2670 (0.4424) 0.1536 (0.3605) 0.0932 (0.2907) 0.2897 (0.4536)
Master degree 0.1126 (0.3161) 0.0546 (0.2272) 0.0324 (0.1770) 0.1706 (0.3762)
Degree beyond Masters 0.0629 (0.2428) 0.0239 (0.1528) 0.0264 (0.1603) 0.1132 (0.3168)
Single with no children 0.2296 (0.4206) 0.2811 (0.4496) 0.1822 (0.3860) 0.1483 (0.3554)
Married with no children 0.0289 (0.1674) 0.0762 (0.2653) 0.0744 (0.2624) 0.0276 (0.1638)
Single with children 0.3022 (0.4592) 0.2686 (0.4432) 0.2343 (0.4236) 0.2828 (0.4504)
Married with children 0.4393 (0.4963) 0.3741 (0.4839) 0.5091 (0.4999) 0.5413 (0.4983)
Born in the United States 0.9279 (0.2587) 0.8490 (0.3580) 0.3778 (0.4848) 0.1153 (0.3194)
Not born in U.S. resident less than 8 years 0.0149 (0.1212) 0.0272 (0.1626) 0.0966 (0.2954) 0.1807 (0.3848)
Not born in the U.S. resident 8 years or more 0.0572 (0.2322) 0.1238 (0.3294) 0.5256 (0.4993) 0.7040 (0.4565)
Notes: Means and standard deviations are for a sample of 2,343,092 observations containing all male full-time workers aged 30 to
59 who responded to the 2000 Decennial Census long form survey and reside in the metropolitan areas with populations over 1
million residents where full-time work is defined as worked an average of at least 35 hours per week. Standard deviations are
shown in parentheses.

Table 2: Baseline Agglomeration Model for Logarithm of the Wage Rate
Independent Variables Baseline Model
Employment density in own one digit industry (1000s per square KM) 0.0118 (16.23)
Share workers with college degree within own industry 0.3894 (27.87)
African-American worker -0.1465 (-45.11)
Hispanic worker -0.1656 (-49.39)
Asian and Pacific Islander worker -0.1349 (-24.00)
Other race -0.1516 (-22.61)
Age 40-49 0.1010 (66.72)
Age 50-59 0.1568 (66.91)
Less than high school degree -0.1456 (-59.85)
Associates degree 0.0851 (54.37)
Four year college degree 0.2711 (113.63)
Master degree 0.3903 (105.64)
Degree beyond Masters 0.5069 (117.4)
Single with children 0.0548 (22.19)
Married with children 0.2110 (94.37)
Married without children 0.1335 (96.46)
Not born in U.S. resident less than 8 years -0.2533 (-46.21)
Not born in the U.S. resident 8 years or more -0.0987 (-33.62)
Percent college educated in MSA and occupation 0.7453 (5.37)
Percent college educated in MSA and industry 1.1029 (8.23)
Sample Size 2,343,092
R-squared 0.2873
Notes: Coefficients from a model with industry, occupation and metropolitan fixed effects. Standard
errors are clustered on PUMA of employment with T-statistics in parentheses.
Table 3: Correlations between Race and Workplace Attributes
Unconditional Correlations White Indicator Black Indicator
Employment density in 1000’s per square KM -0.0179 0.0077
Share workers with college degree 0.0531 -0.0073
Conditional on Metropolitan Fixed Effects
Employment density in 1000’s per square KM 0.0000 0.0036
Share workers with college degree 0.0632 -0.0122
Conditional on Residential Tract Fixed Effects
Employment density in 1000’s per square KM 0.0081 0.0034
Share workers with college degree 0.0220 0.0193
Conditional on Tract by Cell Fixed Effects (omitting race)
Employment density in 1000’s per square KM -0.0035 0.0036
Share workers with college degree -0.0215 0.0231
Sample Size 2,343,092
Notes: Correlations for regression sample with a dummy variable indicating race of worker.
Conditional correlations based on deviations from cell means.

Table 4: Race Coefficients with Various Fixed Effects Structures
Variables
Metropolitan
Area Fixed
Effect
Tract Fixed
Effect
Block Group
Fixed Effect
Tract-Cell
Fixed Effect
Tract-
Industry
Fixed Effect
Tract-
Occupation
Fixed Effect
Race Coefficients from Wage Equation
African-American worker -0.1465 -0.0696 -0.0623 -0.0694 -0.0710 -0.0662
(-45.11) (-38.81) (-33.55) (-19.76) (-33.18) (-36.68)
Hispanic worker -0.1657 -0.0939 -0.0859 -0.0660 -0.0909 -0.0881
(-49.40) (-53.49) (-47.70) (-17.83) (-43.92) (-49.81)
Asian and Pacific Islander worker -0.1349 -0.1041 -0.1010 -0.0963 -0.0986 -0.1038
(-24.00) (-43.15) (-40.81) (-16.01) (-35.71) (-42.56)
R-square 0.2873 0.3307 0.3572 0.6718 0.4467 0.3436
Notes: Coefficients from fixed effect models using the regression sample of 2,343,092 observations. Each column represents estimates from
a separate model, and the first column begins with the model from Table 2. Standard errors clustered on PUMA of employment with T-
statistics in parentheses.

Table 5: Baseline Agglomeration Model by Race or Ethnicity
White
Employment density in 1000’s per square KM 0.0138 (14.98)
Share workers with college degree 0.4390 (28.69)
R-squared 0.2461
Sample size 1,705,058
African-American
Employment density in 1000’s per square KM 0.0047 (5.80)
Share workers with college degree 0.1453 (6.57)
R-squared 0.2108
Sample size 226,173
Hispanic
Employment density in 1000’s per square KM 0.0097 (9.09)
Share workers with college degree 0.2069 (9.15)
R-squared 0.2536
Sample size 264,880
Asian
Employment density in 1000’s per square KM 0.0076 (6.48)
Share workers with college degree 0.3885 (12.19)
R-squared 0.3316
Sample size 135,577
Notes: Coefficients from a model with metropolitan fixed effects. Each panel
presents estimates from a separate subsample. Standard errors clustered on
PUMA of employment, and T-statistics in parentheses.

Table 6: Model of the Wage Return to Agglomeration
Fully Interacted Model Employment Density Share College Educated
African-American worker -0.0083***(-2.99) -0.0776***(-2.92)
Hispanic worker -0.0021 (-0.58) 0.0157 (0.39)
Asian and Pacific Islander worker -0.0044 (-1.16) 0.1215**(2.05)
Age 40-49 0.0014 (1.02) 0.0721*** (5.14)
Age 50-59 0.0009 (0.44) 0.1238*** (5.64)
Less than high school degree -0.0062 (-1.29) -0.0408 (-1.10)
Associates degree 0.0007 (0.31) 0.1044*** (6.02)
Four year college degree 0.0022 (1.02) 0.1522*** (7.29)
Master degree 0.0050**(2.03) 0.1920*** (6.24)
Degree beyond Masters 0.0043 (1.20) 0.3689*** (6.00)
Single with children -0.0025 (-0.26) -0.0380 (-0.63)
Married with children 0.0033* (1.92) -0.0353** (-2.07)
Married without children 0.0022 (1.02) -0.0248 (-1.20)
Not born in U.S. resident less than 8 years -0.0016 (-0.31) 0.0390 (0.46)
Not born in the U.S. resident 8 years or more -0.0004 (-0.13) 0.0741* (1.81)
R-square 0.7139
Sample size 2,331,688
Notes: Coefficient estimates from the interactions of employment density and share college with demoraphic
attributes based on a model specification that includes demographic cell by census tract fixed effects and
interacts both employment density and share college with demographic attributes, industry, occuption, and
metropolitan area. Standard errors are clustered on the census tract of residence, and T-statistics in
parentheses.
Table 7: Agglomeration Model with Own Share Controls
Own Share Model Employment Density Share College Educated
African-American worker 0.0140* (1.65) 0.0030 (0.06)
Hispanic worker 0.0234**(2.40) 0.0821 (1.36)
Asian and Pacific Islander worker 0.0215**(2.16) 0.1918***(2.69)
Own Share in Workplace 0.0537***(2.74)
Own Share College Educated
0.1603**(2.26)
R-Square 0.7141
Sample size 2,331,688
Notes: Coefficient estimates from the interactions of employment density and share college with race
and ethnicity based on a model specification that includes demographic cell by census tract fixed effects
and interacts both employment density and share college with demographic attributes, industry,
occuption, and metropolitan area. The estimates arise from a model that includes controls for share own
race workers and share own race college educated workers in work PUMA. The own share estimates
presented are the interactions with employment density and share college. Standard errors are clustered
on the census tract of residence, and T-statistics in parentheses.
Table 8: Robustness tests
Baseline Model Black-Non Black
Non-Linear
Agglomeration
Workplace Racial
Composition
Continuous
Demographics
Dropping Family
Structure
Employment Density
African-American worker -0.0083***(-2.99) NA -0.0081***(-2.91) -0.0072***(-2.58) -0.0083***(-3.00) -0.0095***(-5.50)
with Own Share Controls
African-American worker 0.0140* (1.65) 0.0332***(2.83) 0.0078 (0.92) 0.0124 (1.46) 0.0132(1.57) 0.0150***(2.61)
Own Share in Workplace 0.0537***(2.74) 0.0639***(3.53) 0.0385**(1.96) 0.0493**(2.51) 0.0519***(2.66) 0.0581***(4.38)
Share College Educated
African-American worker -0.0776***(-2.92) NA -0.0787***(-2.95) -0.0682**(-2.55) -0.0785***(-2.96) -0.0797***(-4.63)
with Own Share Controls
African-American worker 0.0030 (0.06) 0.07831(1.00) 0.0233 (0.44) 0.0310 (0.59) -0.0003(0.00) 0.0059(0.16)
Own Share College Educated 0.1603**(2.26) 0.2276**(2.31) 0.1929***(2.71) 0.1933***(2.71) 0.1565**(2.20) 0.1625***(3.28)
Notes: Coefficient estimates from the interactions of employment density (panel 1) and share college (panel 2) with demoraphic attributes based on a model specification
that includes tract by cell fixed effects, and interacts both employment density and share college with demographic attributes, industry, occuption, and metropolitan area.
The top row of each panel presents the model estimates from the baseline model in Table 6, and the bottom row of each panel presents the own race estimates from the
Table 7 model. Each column represents separate models with modified or extended controls. The first column presents the results from Table 6 and 7. Column 2 presents
estimates where own race is based on a black-non black classification. The specification for column 3 includes the quadratic terms of employment density and share
college including the interaction, column 4 includes controls for percent of black, hispanic, and Asian workers in each PUMA, and column 5 includes linear controls for
all continuous demographic variables. Column 6 presents estimates from the baseline model where the cell structure is modified to eliminate any reference to information
on family structure. Standard errors are clustered on the census tract of residence, and T-statistics in parentheses.

Table 9 Total Factor Productivity models
Variables Translog model
Translog
Interaction Model
Translog
Interaction with
mean tract FE
Own-Race Exposure Index
Employment Density 0.0288*** (16.68) -0.0012 (-0.10) -0.0001 (-0.00)
Own-Race Exposure Index
-0.065 (-0.70) -0.0567 (-0.63)
Density*Race Exposure Index
0.0919
** (2.57) 0.0913
*** (2.94)
Share College 0.2033*** (8.30) 0.096 (1.30) 0.0253 (0.34)
Share College Own Race Exp Index
0.0534 (0.42) 0.0236 (0.20)
Share College*Coll Race Exp Index
0.1779 (1.59) 0.2115
* (1.91)
R Squared 0.9086 0.9086 0.9088
Sample Size 111695 111695 111538
Notes: Coefficients estimates of firm revenue net of materials cost on a translog model of production where
inputs are capital equipment, capital structure, college educated labor and non-college educated labor plus for
the last column average unobserved quality based on the worker residential locations and the tract FE
estimates from the wage model in column 2 of Table 4. Model is estimated for respondents of the 1997
Census of Manufacturers for in the metropolitan areas with populations over 1 million residents. The model
also includes metropolitan area and three digit industry fixed effects. Heteroskedasticity-robust standard
errors are clustered on PUMA of employment. T-statistics in parentheses.
Table 10 Total Factor Productivity models with 3-digit industry FE interactions and/or PUMA FE
Density*Index 0.0913***
(2.94) 0.1922***
(8.81) 0.1190***
(8.11) 0.1851***
(10.45)
Coll share*Coll Index 0.2115* (1.91) 0.2939
** (2.52) 0.4377
*** (2.72) 0.4897
*** (2.87)
FEs for 3-digit-Ind*(Density, Coll share)
X
X
PUMA fixed effects
X X
R Squared 0.9088 0.9094 0.9102 0.9106
Sample size 111538 111538 111538 111538
Notes: Coefficients estimates of firm revenue net of materials cost on a translog model of production where inputs are capital
equipment, capital structure, college educated labor and non-college educated labor, and unobserved quality based on the
worker residential locations. Column 1 repeats the estimates from Column 3 of Table 8, and the next columns add the
interaction of three digit industry FE's with employment density and share college, PUMA FE's and both sets of controls,
respectively. Heteroskedasticity-robust standard errors are clustered on PUMA of employment. T-statistics in parentheses.
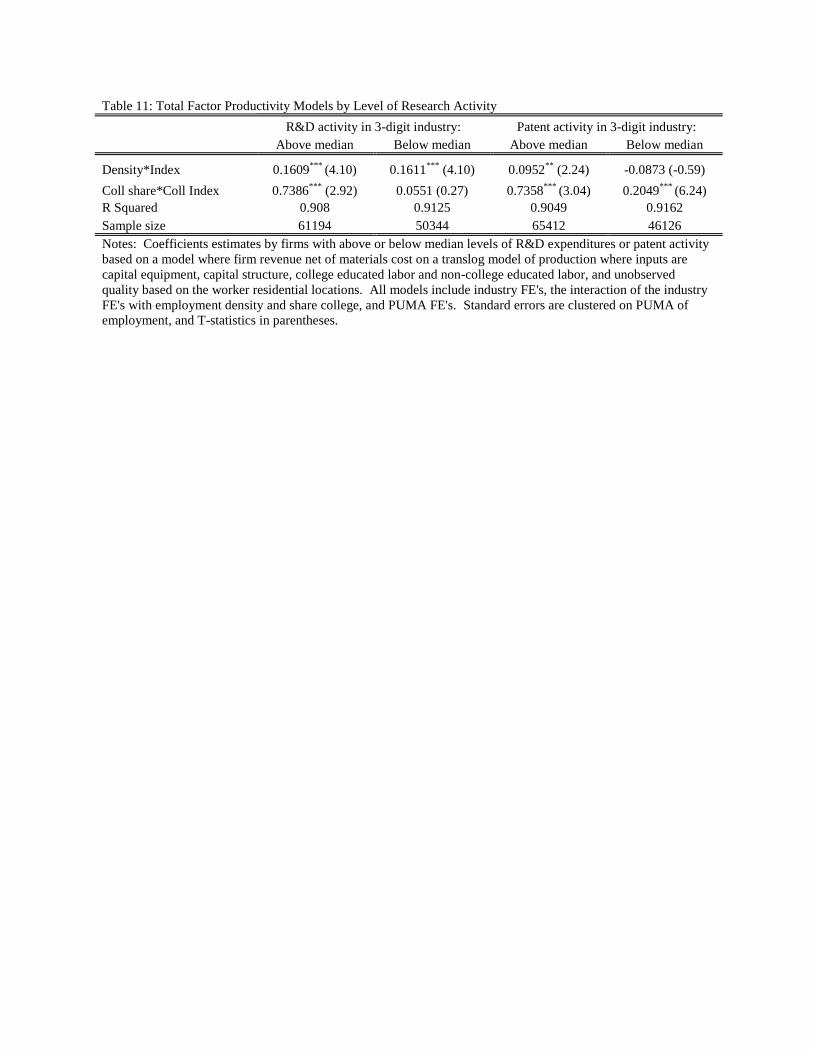
Table 11: Total Factor Productivity Models by Level of Research Activity
R&D activity in 3-digit industry: Patent activity in 3-digit industry:
Above median Below median Above median Below median
Density*Index 0.1609***
(4.10) 0.1611***
(4.10) 0.0952**
(2.24) -0.0873 (-0.59)
Coll share*Coll Index 0.7386***
(2.92) 0.0551 (0.27) 0.7358***
(3.04) 0.2049***
(6.24)
R Squared 0.908 0.9125 0.9049 0.9162
Sample size 61194 50344 65412 46126
Notes: Coefficients estimates by firms with above or below median levels of R&D expenditures or patent activity
based on a model where firm revenue net of materials cost on a translog model of production where inputs are
capital equipment, capital structure, college educated labor and non-college educated labor, and unobserved
quality based on the worker residential locations. All models include industry FE's, the interaction of the industry
FE's with employment density and share college, and PUMA FE's. Standard errors are clustered on PUMA of
employment, and T-statistics in parentheses.

Table 12: Relationship between workplace racial composition and responses to survey questions about race
Attitude toward gov't
help for blacks (1=too
little, 3=too much)
Opposed to interracial
marriage
Closeness to blacks
(1= not at all close to
9=very close)
Closeness to whites
(1= not at all close to
9=very close)
Difference between how
close to whites and how
close to blacks (-8=much
closer to blacks, 8=much
closer to whites)
Black -0.754*** -0.079* 1.376*** -1.274*** -2.613***
(0.054) (0.033) (0.198) (0.206) (0.235)
Workplace % white 0.051 -0.042 -1.226*** 0.273* 1.52***
(0.052) (0.031) (0.136) (0.127) (0.163)
Black*workplace %
white 0.026 0.025 0.98** 0.438 -0.606
(0.078) (0.046) (0.320) (0.320) (0.383)
Sample Size 6,603 3,964 6,505 6,469 6,437
Notes: Estimates based on Black and non-Hispanic white sample respondents to the General Social Survey in relevant years. Model specification includes
indicators for year of survey and for missing report of workplace % white and its interaction with black. Robust standard errors in parentheses.

Appendix for On-line Publication Only
I. Standard errors
As a robustness test for our standard errors, following Donald and Lang (2007), we
estimate the coefficients separately for each demographic cell-metropolitan area group, in
recognition of the fact that the demographic differences in the return to agglomeration captured
by are only identified by variation across the groups defined by demographic cell x and
metropolitan area s. However, given the incidental controls , we estimate this model in three
stages. First, we estimate
(A1)
in order to remove the effect of the incidental controls while mitigating bias by estimating
parameters using within-demographic-cell residential location group variation. Second, we
estimate the demographic cell-MSA group-specific parameters on using the following
equation:
(A2)
Note that it is infeasible to estimate equation (A2) in levels rather than, as written, in deviations,
because the inclusion of the incidental controls in the demographic cell-MSA group specific
models would lead to severe attrition in the resulting sample. Finally, we estimate
(A3)
using feasible GLS, as described in Donald and Lang (2007), where is the group mean of any
individual-specific heterogeneity in the return to agglomeration. This approach is imperfect
because estimates of may be biased by the omission of from the first stage, but this
bias is mitigated by use of demographic cell-tract fixed effects, which reduces the correlation

between and the incidental controls .38
Nonetheless, we only use the multi-stage
approach as a general check on the inference provided by clustered standard errors in the
baseline model, and all wage model estimates presented in the body of the paper rely on direct
estimation of equations (2) and (3) with standard errors clustered at the census tract level.
Table A1 shows the results of the two-stage estimation, where standard errors are the
result of GLS estimation. The standard errors are relatively stable for the two-stage estimates,
declining from 0.0028 based on the clustered standard errors presented in Table 6 to 0.0021 for
the black-white gap in return to employment density and increasing from 0.027 in table 6 to
0.032 for the black-white gap in return to share college. These findings suggest that clustering at
the tract level provides reasonable standard errors for inference, particularly for employment
density. While, as discussed above, we have some concerns about bias in estimating the racial
gap when using the three-stage approach, the estimated racial differences are quite stable for
employment density (0.0081 as compared to 0.0083 in the top panel) and reasonably stable for
share college (falling from 0.0776 to a two stage estimate of 0.0528).
II. Alternative fixed effects specifications
Next, we examine the robustness of our racial differences in returns to alternative fixed
effect structures. Specifically, Table A2 presents the estimated differential returns to
employment density and share college for the same set of fixed effect structures that were
considered in Table 4. The estimated black-white differences in the return to employment density
and share college are relatively stable, with the employment density estimates ranging between
38
As discussed above, it is not feasible to skip the first stage and estimate equation (A2) in levels with the incidental
controls because the number of incidental variables is large and would lead to substantial selection in our final
sample of groups in equation (6). The alternative of estimating equation (5) in levels without the incidental controls
suffers from the same bias as the above approach, but the bias is exacerbated because the correlations between
and the incidental controls is much larger in the levels than in the demographic-cell residential location
deviations.
0.0054 and 0.0086 and the share college estimates ranging between 0.0411 and 0.0776. The
inclusion of tract fixed effects reduces black-white differences in the return to employment
density and share college somewhat, but the use of block group fixed effects has no additional
impact on these estimates and the use of tract by demographic cell fixed effects increases these
estimates. The use of census tract by industry or occupation fixed effects leads to moderate
reductions in the estimated black-white differences. Unlike for blacks, the inclusion of tract by
demographic cell fixed effects substantially erodes the estimated differences for Hispanics and
Asians. A similar erosion of the Hispanic wage gap was observed in Table 4 with the inclusion
of tract by demographic cell fixed effects.
III. Estimates for own race specifications
Table A3 presents the employment density and share college interactions for all
demographic variables, not just race and ethnicity as shown in Table 7 Panel 2. The interaction
estimates are very similar to those in Table 6 with the employment density interactions primarily
small and insignificant with the exception of graduate education and many of the share college
educations statistically significant. Most notably, returns to share college increase with
education levels and age.
IV. Total factor productivity models
Table A4 presents all estimates from the translog total factor productivity models
presented in Table 9 where the left hand side is the log of net firm revenue, total revenue minus
materials costs. These models include logarithm of college employment, non-college
employment, equipment capital, structure capital, and in the third model the mean residential
tract estimated fixed effect over all firm workers. The translog model includes the squares and
the interactions of all factor inputs plus linear controls for employment density and share college

in the three digit industry by PUMA cell. The second and third models also include controls for
share own race workers in the PUMA, share of college educated workers who are of the
worker’s own race, and the interaction of each variable with either employment density or share
college, respectively.
Following Moretti, the measures of employment density are calculated omitting the
employment of the firm’s own three digit industry from the measures of employment density and
share college. These exclusions are made to eliminate bias from correlations between firm
unobservables and their contribution to the aggregate variables. However, Guryan, Kroft and
Notowindingo (2009) point out that such exclusions can bias estimates in the opposite direction,
and propose constructing a second variable omitting the same information at a higher level of
aggregation as a control function to absorb the bias. While their analysis is in the context of an
experiment, they recommend this approach for observational data as well. We include the
metropolitan employment excluding the PUMA level employment from the firm’s own three
digit industry as our control function. The control functions are also interacted with the own race
variables in columns 2 and 3 since the aggregation variables are interacted with the own race
variables in those models.
The vast majority of estimates on factor inputs are highly significant including the terms
involving unobservable ability of firm workers based on residential location. The highly
significant quadradic and interaction terms strongly support the use of a translog production
function relative to Cobb-Douglas. Most of the squared terms are positive suggesting economies
of scale, and the interaction terms are negative consistent with substitutability of these factor
inputs. The one exception is the strong complementarity between high and low labor and the
measure of average worker quality.

Table A1. Two Stage Model Estimates
Independent Variables Employment Density Share College Educated
African-American worker -0.0081*** (-3.80) -0.0528* (-1.65)
Hispanic worker -0.0052 (-1.37) -0.0291 (-0.65)
Asian and Pacific Islander worker -0.0063* (-1.74) -0.0401 (-0.37)
Second Stage R-square 0.2580 0.1067
Second Stage Sample Size 6203 6204
Notes: Estimates from regressions of demographic cell by metropolitan area fixed effects from a wage
equation on a vector of demographics and metropolitan area FE's using Feasible GLS. Heteroskedasticity-
robust standard errors clustered on the tract of residence. T-statistics in parentheses.

Table A2: Race Coefficients with varying Fixed Effects Structure
Variables
Metropolitan
Area Fixed
Effect
Tract Fixed
Effect
Block Group
Fixed Effect
Tract-Cell
Fixed Effect
Tract-
Industry
Fixed Effect
Tract-
Occupation
Fixed Effect
Race Differences in the Return to Employment Density
African-American worker -0.0086 -0.0075 -0.0076 -0.0083 -0.0054 -0.0071
(-10.07) (-9.47) (-9.23) (-2.99) (-5.26) (-8.84)
Hispanic worker -0.0076 -0.0041 -0.0042 -0.0021 -0.0037 -0.0035
(-9.90) (-4.86) (-4.71) (-0.58) (-3.65) (-4.02)
Asian and Pacific Islander worker -0.0108 -0.0071 -0.0068 -0.0044 -0.0071 -0.0070
(-13.81) (-7.35) (-6.86) (-1.16) (-6.25) (-7.22)
Race Differences in the Return to Share College-Educated
African-American worker -0.0687 -0.0491 -0.0491 -0.0776 -0.0411 -0.0416
(-5.69) (-5.76) (-5.57) (-2.92) (-3.51) (-4.76)
Hispanic worker 0.0440 0.0238 0.0224 0.0157 0.0037 0.0280
(3.15) (2.47) (2.25) (0.39) (0.30) (2.85)
Asian and Pacific Islander worker 0.1952 0.1821 0.1815 0.1215 0.1725 0.1873
(8.98) (13.57) (13.16) (2.05) (10.85) (13.79)
sample size 2,343,092 2,343,092 2,343,092 2,343,092 2,343,092 2,343,092
Notes: Coefficient estimates from the interactions of employment density (panel 1) and share college (panel 2) with demoraphic attributes
based on a model specification that uses various fixed effect structures, includes controls for demographic attributes for all but the tract by
cell fixed effects, and interacts both employment density and share college with demographic attributes, industry, occuption, and
metropolitan area. Heteroskedasticity-robust standard errors are clustered on the census tract of residence, and T-statistics in parentheses.

Table A3: Model of the Wage Return to Agglomeration with Own Race Controls
Fully Interacted Model Employment Density Share College Educated
African-American worker 0.0140* (1.65) 0.0030 (0.06)
Hispanic worker 0.0234**(2.40) 0.0821 (1.36)
Asian and Pacific Islander worker 0.0215**(2.16) 0.1918***(2.69)
Age 40-49 0.0014(0.99) 0.0727***(5.18)
Age 50-59 0.0008(0.40) 0.1254***(5.72)
Less than high school degree -0.0055(-1.14) -0.0434(-1.17)
Associates degree 0.0006(0.28) 0.1046***(6.03)
Four year college degree 0.0021(0.97) 0.1547***(7.42)
Master degree 0.0049*(1.99) 0.1946***(6.32)
Degree beyond Masters 0.0044(1.22) 0.3769***(6.14)
Single with children 0.0018(0.84) -0.0396(-0.66)
Single without children -0.0029(-0.30) -0.0270(-1.31)
Married without children 0.0029*(1.67) -0.0377**(-2.22)
Not born in U.S. resident less than 8 years -0.0012(-0.23) 0.0513(0.60)
Not born in the U.S. resident 8 years or more 0.0003(0.12) 0.0736*(1.79)
Own Share in Workplace 0.0537***(2.74) NA
Own Share College Educated NA 0.1603**(2.26)
R-square 0.7141
Sample size 2,331,688
Notes: Coefficient estimates from the interactions of employment density and share college with demoraphic
attributes based on a model specification that includes demographic cell by census tract fixed effects and
interacts both employment density and share college with demographic attributes, industry, occuption, and
metropolitan area. Heteroskedasticity-robust standard errors are clustered on the census tract of residence,
and T-statistics in parentheses.

Table A4 Total Factor Productivity models
Variables Translog model
Translog
Interaction Model
Translog Interaction
with mean tract FE
Non College Employment 0.3502***(21.07) 0.3515***(21.37) 0.3461***(21.22)
Non College Employment Squared 0.0512***(71.91) 0.0515***(76.59) 0.0523***(80.49)
College Employment 0.0695***(13.57) 0.0679***(13.15) 0.0745***(15.02)
College Employment Squared 0.0169***(35.96) 0.0166***(37.01) 0.0159***(37.17)
Equipment Capital 0.4729***(27.42) 0.4743***(27.55) 0.4842***(29.21)
Equipment Capital Squared 0.0217***(22.11) 0.0218***(22.11) 0.0215***(22.06)
Structure Capital 0.0872***(21.37) 0.0869***(21.27) 0.0872***(21.44)
Structure Capital Squared 0.0022***(6.20) 0.0022***(6.19) 0.0023***(6.35)
Mean Tract FE
-1.0220***(-4.58)
Mean Tract FE Squared
0.2806**(2.09)
Equipment Capital*Non College Employment -0.0600***(-34.96) -0.0604***(-36.30) -0.0607***(-35.94)
Equipment Capital*College Employment -0.0111***(-14.76) -0.0109***(-14.45) -0.0110***(-14.85)
Structure Capital*Non College Employment -0.0027***(-4.47) -0.0027***(-4.48) -0.0027***(-4.46)
Structure Capital*College Employment -0.0014***(-6.38) -0.0014***(-6.39) -0.0014***(-6.16)
Equipment Capital*Structure Capital -0.0053***(-8.22) -0.0053***(-8.13) -0.0054***(-8.22)
Non College Employment*College Employment -0.0034***(-4.30) -0.0033***(-4.16) -0.0031***(-3.95)
Mean Tract FE*Equipment Capital 0.0314(0.92)
Mean Tract FE*Structure Capital -0.0030(-0.42)
Mean Tract FE*Non College Employment 0.0722***(2.66)
Mean Tract FE*College Employment 0.0389***(5.18)
Employment Density 0.0288*** (16.68) -0.0012 (-0.10) -0.0001 (-0.00)
Own-Race Exposure Index
-0.065 (-0.70) -0.0567 (-0.63)
Density*Race Exposure Index
0.0919
** (2.57) 0.0913
*** (2.94)
Share College 0.2033*** (8.30) 0.096 (1.30) 0.0253 (0.34)
Share College Own Race Exp Index
0.0534 (0.42) 0.0236 (0.20)
Share College*Coll Race Exp Index
0.1779 (1.59) 0.2115
* (1.91)
Firm Percent Black -0.0377 (0.93) -0.0311 (0.79)
Firm Percent Hispanic -0.08473** (2.06) -0.07597* (1.92)
Firm Percent Asian -0.07857** (2.04) -0.06999* (1.89)
Firm Percent Other Race -0.0981 (1.57) -0.0914 (1.46)

Variables Translog model
Translog
Interaction Model
Translog Interaction
with mean tract FE
Guryan controls for emp den -0.5166(-0.02) -3.8784(-0.12) -4.6216(-0.16)
Guryan controls for college share -6.2514**(-2.19) -5.8335**(-1.97) -5.3116*(-1.82)
Guryan controls for emp den*Race Exposure Index
2.7116*(1.77) 2.1239(1.43)
Guryan controls for college share*Coll Race Exposure Index -0.3994(-1.62) -0.3420(-1.50)
R Squared 0.9086 0.9086 0.9088
Sample size 111695 111695 111538
Notes: Coefficients estimates of firm revenue net of materials cost on a translog model of production where inputs are
capital equipment, capital structure, college educated labor and non-college educated labor plus for the last column average
unobserved quality based on the worker residential locations and the tract FE estimates from the wage model in column 2 of
Table 4. Model is estimated for respondents of the 1997 Census of Manufacturers for in the metropolitan areas with
populations over 1 million residents. The model also includes metropolitan area and three digit industry fixed effects.
Heteroskedasticity-robust standard errors are clustered on PUMA of employment. T-statistics in parentheses.