r. · see notice at ~~9-10and a-4to a-5.-23 - 1. usgs lulc grid size. as the usgs'sown guide...
TRANSCRIPT

approach is not acceptable from either a scientific or public policy perspective since it violates both
(1) the principles that should strive to protect the exclusive property rights oflocal broadcast stations
and (2) the Notice's own stated principle "of not assigning values unless measurement data have
been analyzed andpublished for matching situations."36
In addition, the lowest frequency at which Okumura conducted field tests is 453 MHz.31 To
obtain some results in the high VHF band, Okumura himself only utilized the results conducted by
different experimenters at 200 MHz which were obtained using different methods.38 The core of
Okumura's trends, therefore, stop far short of even the high VHF band. Hata, who developed
empirical formulas from Okumura's curves, did not attempt to take any extrapolation below
150 MHz.39 Other researchers have also observed that the correction functions employed in
Okumura's method are derived "from UHF measurements which ... cannot be generalized for VHF
predictions."40
The extrapolated clutter loss values for low VHF frequencies contained in Table 3 of the
Notice's Appendix are not based on empirical measurements obtained anywhere near low VHF
J§I See id. at ~ 12 (emphasis added).
TIl See Y. Okumura et aI., Field Strength and Its Variability in VHF and UHF Land-MobileRadio Service, 16 REv. OF THE ELEC. COMM. LAB. 825 (Sept.-Oct. 1968), 828.
~ See id. at 841; E. Shimizu et aI., Propagation Tests ofFrequencies for VHF Mobile Radio,5 REp. OF THE ELEC. COMM. LAB. 1 (Jan. 1957), 13.
~ See M. Hata, Empirical Formulator Propagation Loss in Land Mobile Radio Services, 29IEEE TRANS. ON VEHICULAR TECH. 317 (Aug. 1980), 318, 324 (limiting the frequency to the range
of 150 MHz to 1500 MHz).
~ R. Grosskopf, Comparison ofDifferent Methods for the Prediction ofthe Field Strength inthe VHF Range, 35 IEEE TRANS. ON ANTENNAS AND PROPAGATION 852 (July 1987),857.
- 18 -

frequencies nor can these values be theoretically derived. Furthermore, scientific evidence suggests
that loss due to vegetation is "appreciably less at VHF frequencies than at higher frequencies because
vegetation is appreciably more transparent at longer wavelengths and because obstacles, such as
vegetation, diffract more energy into shadow zones at longer wavelengths."41 Because both the
statute and the Notice contemplate that the Commission will continue to refine the ILLR model as
better data become available42 and because there can be no assurance that the extrapolated clutter loss
values for the low VHF band do not underpredict Grade B service, the Commission should not
incorporate clutter loss values for low VHF at this time.
6. Rubinstein's Use OfOkumura's Cunres For Signal Strength Predictions. Rubinstein
began by computing signal strength predictions adapted from Okumura's curves with the addition
of the "open space correction factor" but without the "hilly correction factor" or statisticalloss.43
Since Rubinstein is particularly interested in land mobile applications, as was Okumura, this
methodological starting point is not inherently suspect for that purpose. However, in the instant
context, where modification of the ILLR model is at issue, one should methodologically begin by
determining the path loss from free space as calculated by Longley-Rice. This, in fact, as shown
above, is what the Notice proposes.44 It makes no sense in this context to begin from an assumed
ill M.M. Weiner, Use of the Longley-Rice and Johnson-Gierhart Tropospheric RadioPropagation Programs: 0.02-20 GHz, 4 IEEE J. ON SELECTED AREAS IN COMMUNICATIONS 297(Mar. 1986), 298.
~/ See 47 U.S.C. § 339(c)(3); Notice at ~ 13.
W See T.N. Rubinstein, Clutter Losses and Environmental Noise Characteristics Associatedwith Various LULC Categories, 44 IEEE TRANS. ON BROADCASTING 286 (Sept. 1998),287.
~ See Notice at A-2.
- 19 -
--------.-_._----------

base of urban clutter loss and then add in a factor (the "open space correction factor") that attempts
to eliminate this clutter loss in open spaces and then subtract again the clutter losses empirically
determined. For the purposes of this context, Rubinstein's methodology effectively adds fudge
factor upon fudge factor, and second order fudge factors are inherently suspect. This methodological
flaw, for the purposes of this proceeding, combined with the other serious shortcomings of
Rubinstein's data for broadcast television services, demonstrates that the clutter loss values proposed
in the Notice are severely deficient for the purpose of refining the ILLR model.
7. Limited Number And Types Of Geographical Areas Surveyed. Rubinstein collected
measurements in four locations: Los Angeles; San Diego; Atlanta; and Whatcom County,
Washington. He subsequently combined the Los Angeles and San Diego data due to the similarity
of the two areas.45 He also characterized his data as reflecting Large City, Medium City, and Rural
morphology.46 However, Atlanta is the eleventh largest metropolitan area in the United States and
cannot fairly be characterized as a "Medium City."47 In effect, Rubinstein only surveyed two distinct
types of built-up areas-heavily urbanized and rural/suburban.
In addition, only three types of geographical areas were surveyed, urban southern California,
urban Atlanta, and rural/suburban northwest Washington state. This if far too slim a basis upon
which to base clutter loss values throughout the United States. For example, in order to obtain a
:!1i See T.N. Rubinstein, Clutter Losses and Environmental Noise Characteristics Associatedwith Various LULC Categories, 44 IEEE TRANS. ON BROADCASTING 286 (Sept. 1998),288.
1§1 See id. at 290.
£J.! See Metropolitan Area Rankings (visited Feb. 10,2000) <http://www.census.gov/PressRelease/metro01.prn>. In comparison, the Los Angeles metropolitan area is the second largest andthe San Diego metropolitan area is the seventeenth largest in the United States.
- 20-

significant sample of the various climate, terrain, and vegetation types found in the United States,
data would need to be obtained for areas located in northeast deciduous areas (e.g., Boston or
Buffalo and environs); arid/desert areas (e.g., Las Vegas or Phoenix and environs); southeast scrub
pine areas (e.g., Orlando and environs); hilly areas (e.g., Pittsburgh and environs); mountainous areas
(e.g., Denver and environs); Great Plains areas (e.g., Des Moines and environs); and southern
semi-tropical areas (e.g., Miami, New Orleans, or Houston and environs). Each of these areas has
significantly different climate, terrain, and foliage characteristics than the three areas surveyed by
Rubinstein. The absence of surveyed data in northeast deciduous areas, in the Washington, D.C. to
Boston corridor, where a disproportionate share of the American populace lives, is particularly
problematic.
* * *
There are, therefore, essentially fatal deficiencies in attempting to base clutter loss values on
Rubinstein's data. This is not to impugn Rubinstein, for his entire experimental design was
predicated on land mobile applications, not broadcast television service. Although it would be
theoretically difficult to determine precisely how the multiple effects of differences in receiving
antenna height, transmitting antenna height, polarization, and Fresnel zone clearance should be
aggregated, it is clear that by considering only the minimum effects of each of these
differences--4 dB (one-story) or 7 dB (two-story and higher) for receiving antenna height gain,
15 dB for transmitting antenna height gain, 3-9 dB for polarization effects, and 4-5 dB for lack of
Fresnel zone clearance-Rubinstein's clutter loss values would be adjusted to zero in all categories.
Afortiori, the Commission's proposed clutter values in the Notice would also be reduced to zero.
- 21 -
This result is neither counter-intuitive nor unexpected. As Network Affiliates have
consistently argued, both in CS Docket No. 98-201 and supra, Longley-Rice is an empirically-based
model that already incorporates certain clutter features in its algorithm, a feature which is
well-established in the scientific and technical community.48 The fact of the matter is that the
Longley-Rice model, in its current form, already does an extremely good job of predicting signal
strength at individual locations. Indeed, empirical data actually demonstrate that the Longley-Rice
model, without further considering buildings or vegetation beyond that built into its empirical
foundations, is remarkably accurate in predicting Grade B field strength. In connection with the CBS
v. PrimeTime 24 lawsuit, Jules Cohen, an eminent broadcasting engineer with decades ofexperience,
supervised signal intensity measurements at more than 500 households. In analyzing the data
collected, he determined that Longley-Rice successfully predicted the presence or absence ofa signal
of Grade B intensity, as verified by actual measurement, at 100% ofthe locations in Miami, 99% of
the locations in Charlotte, 94% of the locations in Baltimore, 73% of the locations in Pittsburgh
~/ See supra at part 1. See also R. Grosskopf, Comparison of Different Methods for thePrediction of the Field Strength in the VHF Range, 35 IEEE TRANS. ON ANTENNAS ANDPROPAGATION 852 (July 1987),852 (stating that in the Longley-Rice model "empirically gainedquantities influence the field strength prediction"); M.L. Meeks, VHF Propagation over Hilly,Forested Terrain, 31 IEEE TRANS. ON ANTENNAS AND PROPAGATION 483 (May 1983), 488(recognizing the semi-empirical nature of the Longley-Rice model and the fact that if affects themodel's prediction of propagation loss); M.M. Weiner, Use of the Longley-Rice and JohnsonGierhart Tropospheric Radio Propagation Programs: 0.02-20 GHz, 4 IEEE J. ON SELECTED AREAS
IN COMMUNICATIONS 297 (Mar. 1986), 297 (stating that Longley-Rice is a"statistical/semi-empiricalmodel[] of tropospheric radio propagation"); id. at 299 (stating that it is necessary to take accountofvegetation only in the immediate vicinity ofthe receiving antenna because "knife-edge diffractionby vegetation distant from the antennas is usually included in the semi-empirical methods used forestimating the excess propagation loss").
- 22-

(chosen to be an extreme worst case), and 99% of the locations in Raleigh-Durham.49 These field
strength tests, conducted at randomly selected, specific subscriber households, confirm the predictive
accuracy of Longley-Rice.
Because SHVIA makes the sine qua non ofpredictive accuracy comparison with actual field
test data, it is clear that once Rubinstein's (and, consequently, the Notice's) clutter loss values are
subjected to necessary adjustments for broadcast television service, the existing ILLR model need
not-and, indeed, must not-have a "fudge factor" subtracted from it that artificially underpredicts
actual service at individual household locations.
III. There Are Serious Difficulties With Attempting To Use The USGS LandUse And Land Clutter Categories For Purposes Of Refining The ILLRModel
The Notice proposes to utilize the Land Use and Land Clutter ("LULC") database of the
United States Geological Survey ("USGS"). In order to simplify use of the database for ILLR
purposes, the Notice further proposes to reduce the 37 USGS environmental LULC categories to 10
ILLR clutter categories.so There are serious deficiencies with the USGS LULC database that make
its use for purposes of refining the ILLR model highly questionable. The IITRI Engineering
Statement analyzes these deficiencies in detail. The following summarizes the principal defects:
~ See NAB Comments, CS Docket No. 98-201 (filed Dec. 11, 1998), Cohen EngineeringStatement, at 14-17.
See Notice at ~~ 9-10 and A-4 to A-5.
- 23 -

1. USGS LULC Grid Size. As the USGS's own guide states:
The minimum area representing the man made features of the LULCpolygons are 10 acres (4 hectares) that have a minimum width of 660feet (200 meters). This minimum width precludes the existence ofvery narrow or long tracts of data classification. Non-urban andnon-man made features may be mapped with polygons with aminimal area of 40 acres (16 hectares) that have minimum width of1320 feet (400 meters).51
Therefore, man-made and urban features are mapped in 200 m x 200 m grids, and rural areas are
mapped in 400 m x 400 m grids. However, these scales are far too gross to accurately reflect the
land cover variations at the receiving antenna site. It is well-accepted in the scientific literature that
only clutter in the immediate vicinity of the antennas should be considered in estimating clutter loss
because knife-edge diffraction by clutter distant from the antennas is already included in the
semi-empirical Longley-Rice model in estimating excess propagation 10ss.52 Moreover, as Longley
has observed, because the
transmitting antennas for broadcast services ... are usually wellelevated above the buildings and trees, . . . the dominant factorsinfluencing propagation to homes ... [are] (a) terrain irregularitiesalong the transmission path, and (b) the urban or environmentalclutter near the receiving site.53
Any "error in estimating the dominant clutter type at the terminal point can cause significant
51 USGS Land Use and Land Cover Data (visited Feb. 3, 2000)<http://edcwww.cr.usgs.gov/glis/hyper/guide/l_250_lulc>.
52 See, e.g., M.M. Weiner, Use of the Longley-Rice and Johnson-Gierhart TroposphericRadio Propagation Programs: 0.02-20 GHz, 4 IEEE J. ON SELECTED AREAS IN COMMUNICATIONS
297 (Mar. 1986),298-99.
53 A.G. Longley, Radio Propagation in Urban Areas, CONF. REc. 28TH IEEE VEHICULARTECH. CONF. 503 (Denver, Colo., Mar. 22-24, 1978),506 (emphasis added).
- 24-
--_ .._--_.-

departure of the prediction from the real signal that would be measured."54 In addition, as one
researcher has observed:
The local clutter environment affecting a terminal can changeconsiderably with changes in location of only 10 or 20 metres, andthe existing 500m resolution [UK Ordnance Survey] clutter databaseis clearly far from ideal. Accurate estimates of the end effects are farmore important to "fixed" service applications ....55
Because the real question of Grade B service will occur near the fringes of a station's
FCC-predicted Grade B contour and such fringes are frequently in more rural areas, in many cases
the receiving site in question will be classified only in a 400 m x 400 m grid. This is simply not a
fine enough resolution to be of much help in predicting the actual signal intensity at the receiving
location. Even locations classified with reference to a 200 m x 200 m grid will contain far too many
prediction errors, as this resolution is 10 to 20 times too gross for the purposes of accurately
predicting the effects of the clutter environment in the immediate vicinity of the rooftop receiving
antenna.
2. Age Of USGS LULC Database. The USGS's LULC database was generated from data
obtained more than 20 years ago, in the late 1970s. Consequently, much of the data for urban
regions and their immediate environs is suspect due to development over the past two decades.
Frankly, because of both the age and resolution of the current LULC database, the Commission
54 M.T. Hewitt, Surface Feature Data for Propagation Modelling, IEE COLLOQUIUM ONTERRAIN MODELLING AND GROUND COVER DATA FOR PROPAGATION (1993), at 4/2.
55 Id. at 4/3.
- 25 -

should await the data reduction of the Landsat 7 data that is currently being obtained.56
* * *
Notwithstanding the methodological shortcomings for ILLR purposes of the Notice's
proposed clutter loss values as seen above in part II, the additional shortcomings ofthe USGS LULC
database make it manifest that the USGS LULC database cannot serve as a basis by which to
categorize clutter loss values for purposes of refining the ILLR model.
IV. Longley Has Derived An "Urban Factor" Correction That ConfirmsThat The ILLR Model Is Highly Accurate In Its Current Form
Based on empirical prediction curves, especially Okumura's, Longley developed an "urban
factor" that was meant to be applied as a correction to the Longley-Rice model to take into account
generalized urban clutter, including buildings and vegetation.57 She developed her formula
specifically for a transmitting antenna height of 200 meters and a receiving antenna height of
3 meters. Longley introduced her urban factor correction as follows:
The urban factor, UF, increases smoothly with increasing frequency,and decreases with increasing distance from the transmitter. Thisrelationship can be expressed as
UF = 16.5 + 15 log (f/100) - 0.12d dB,
with an error of less than 1 dB at all frequencies, to a distance of70 kIn. At frequencies greater than 500 MHz, and distances greaterthan 70 kIn, this relationship tends to over-estimate the loss, because
56 See Notice at ~ 13 n.15 (discussing significance of the Landsat 7 data).
57 See AG. Longley, Radio Propagation in Urban Areas, CONF. REc. 28TH IEEE VEHICULARTECH. CONF. 503 (Denver, Colo., Mar. 22-24, 1978),506.
- 26 -

the attenuation decreases somewhat more rapidly with distance in thisrange.58
Longley further observed that the Longley-Rice "computer prediction model, with the urban factor
added, should adequately predict the median attenuation for moderately large cities in rather smooth
terrain."59 In quite hilly terrain, as exemplified by Pittsburgh, Longley found that it was not
necessary to add an urban factor at all, concluding that the "urban factor is also a function of terrain
irregularity and decreases as the terrain becomes more irregular."60
In order to apply Longley's "urban factor" in the context of the ILLR model, it is first
necessary to adjust the formula for differences in transmitting antenna height and receiving antenna
height. Although the interaction between simultaneous changes in transmitting and receiving
antenna heights is not clear, it may be assumed, at least as a rough first estimate for purposes of
observing the likely effects, that a correction factor for both a different transmitting antenna height
and a different receiving antenna height (i.e., different than those assumed by Longley) needs to be
added to her "urban factor" function. Such a revised "urban factor" function may be expressed
generally as follows:
UP = 16.5 + 15 log (£'100) - 0.12d - a(ht) - b(hr)
where a(hJ represents a correction for a change in the transmitting antenna height from 200 meters
and b(hr ) represents a correction for a change in the receiving antenna height from 3 meters. For
58Id.
59 !d.
60 !d. at 506-07 (emphasis added).
- 27 -

purposes of this estimate, expressions for a(ht) and b(hr) may be derived from Hata's equations,
discussed supra, as follows:
a(ht) = (13.82 + 6.55 . log d) . (log ht - 2.3)
and
for a medium-small city,
b(hr) = (1.1 . log f - 0.7)' (hr - 3)
for a large city, where f ~ 200 MHz,
b(hr) = 8.29 . (log (1.54 . hrW - 3.66
for a large city, where f:2: 400 MHz,
b(hr) = 3.2 . (log (11.75 . ~)f - 7.66
With these corrections, Longley's "urban factor" may be examined for illustrative purposes
in several different contexts, as the accompanying tables show:
- 28 -

Longley Urban Factor, Medium-Small City Table 5aAttenuation (dB)
Transmitting antenna height = 300 m
Receiving antenna height = 6 m
Frequency (MHz)
d (kIn) 66 100 150 200 300 500 750
10 5.1 7.2 9.3 10.7 12.8 15.4 17.4
20 3.5 5.6 7.7 9.2 11.2 13.8 15.9
30 2.1 4.2 6.3 7.8 9.8 12.4 14.5
40 0.8 2.9 5.0 6.4 8.5 11.1 13.1
50 -0.5 1.6 3.6 5.1 7.2 9.8 11.8
60 -1.8 0.3 2.4 3.8 5.9 8.5 10.5
70 -3.1 -1.0 1.1 2.5 4.6 7.2 9.3
80 -4.4 -2.3 -0.2 1.3 3.3 5.9 8.0
90 -5.6 -3.5 -1.5 0.0 2.1 4.7 6.7
100 -6.9 -4.7 -2.7 -1.3 0.8 3.4 5.5
- 29-

Longley Urban Factor, Medium-Small City Table 5bAttenuation (dB)
Transmitting antenna height = 300 m
Receiving antenna height = 9 m
Frequency (MHz)
d (km) 66 100 150 200 300 500 750
10 1.2 2.7 4.2 5.2 6.7 8.6 10.0
20 -0.4 1.1 2.6 3.7 5.2 7.0 8.5
30 -1.8 -0.3 1.2 2.3 3.8 5.6 7.1
40 -3.1 -1.6 -0.1 0.9 2.4 4.3 5.7
50 -4.4 -2.9 -1.4 -0.4 1.1 3.0 4.4
60 -5.7 -4.2 -2.7 -1.7 -0.2 1.7 3.1
70 -7.0 -5.5 -4.0 -3.0 -1.5 0.4 1.9
80 -8.3 -6.8 -5.3 -4.2 -2.8 -0.9 0.6
90 -9.5 -8.0 -6.5 -5.5 -4.0 -2.1 -0.7
100 -10.8 -9.3 -7.8 -6.7 -5.3 -3.4 -1.9
- 30-

Longley Urban Factor, Medium-Small City Table 5cAttenuation (dB)
Transmitting antenna height = 500 m
Receiving antenna height = 6 m
Frequency (MHz)
d (km) 66 100 150 200 300 500 750
10 0.6 2.7 4.7 6.2 8.3 10.9 12.9
20 -1.4 0.7 2.8 4.2 6.3 8.9 10.9
30 -3.1 -1.0 1.1 2.6 4.6 7.2 9.3
40 -4.6 -2.5 -0.4 1.0 3.1 5.7 7.7
50 -6.1 -4.0 -1.9 -0.4 1.6 4.2 6.3
60 -7.5 -5.4 -3.3 -1.8 0.2 2.8 4.9
70 -8.9 -6.7 -4.7 -3.2 -1.2 1.4 3.5
80 -10.2 -8.1 -6.0 -4.6 -2.5 0.1 2.2
90 -11.5 -9.4 -7.4 -5.9 -3.8 -1.2 0.8
100 -12.9 -10.7 -8.7 -7.2 -5.2 -2.6 -0.5
- 31 -

Longley Urban Factor, Medium-Small City Table 5dAttenuation (dB)
Transmitting antenna height = 500 m
Receiving antenna height = 9 m
Frequency (MHz)
d(km) 66 100 150 200 300 500 750
10 -3.3 -1.8 -0.4 0.7 2.2 4.0 5.5
20 -5.3 -3.8 -2.3 -1.3 0.2 2.1 3.5
30 -7.0 -5.5 -4.0 -3.0 -1.5 0.4 1.9
40 -8.5 -7.0 -5.5 -4.5 -3.0 -1.1 0.4
50 -10.0 -8.5 -7.0 -5.9 -4.5 -2.6 -1.1
60 -11.4 -9.9 -8.4 -7.3 -5.9 -4.0 -2.5
70 -12.8 -11.2 -9.8 -8.7 -7.2 -5.4 -3.9
80 -14.1 -12.6 -11.1 -10.1 -8.6 -6.7 -5.2
90 -15.4 -13.9 -12.4 -11.4 -9.9 -8.1 -6.6
100 -16.8 -15.2 -13.8 -12.7 -11.2 -9.4 -7.9
Negative numbers in Tables 5a-5d represent a gain, instead of an attenuation. Examination of these
tables shows that in most instances, for distances of 60 kilometers and greater from the transmitting
site, i.e., as one would approach the traditional FCC-determined Grade B fringe of a television
station's service area, there is very slight, if any, attenuation due to clutter. Indeed, it must also be
recalled that Longley stated that "[a]t frequencies greater than 500 MHz, and distances greater than
70 km," the urban factor correction "tends to over-estimate the 10SS."61
61 A.G. Longley, Radio Propagation in Urban Areas, CONF. REc. 28TH IEEE VEHICULARTECH. CONF. 503 (Denver, Colo., Mar. 22-24, 1978),506 (emphasis added).
- 32 -

The point of these examples is not to advocate that Longley's "urban factor" correction,
suitably adjusted to account for transmitting antenna and receiving antenna height gains, be utilized
in place ofRubinstein and that, for many cases, the ILLR model should incorporate again. Instead,
Longley's "urban factor" correction, suitably adjusted, confirms that, were Rubinstein's data suitably
adjusted, there is virtually no clutter loss for which the ILLR model does not already account.
Because the ILLR model is a semi-empirical predictive model, it already takes account of buildings
and vegetation to a certain extent. What the adjustments to Rubinstein's data, the adjusted Longley
"urban factor" correction, and the empirical results of Jules Cohen's 500 measurements in five
different geographical areas62 all show are that, in fact, the ILLR model very accurately predicts
signal strength at individual locations without the need to add a "fudge factor" for additional clutter
loss.
In sum, the ILLR model, in its current form, does a remarkably good job of accurately
predicting signal strength at individual locations-and without grossly underpredicting or
overpredicting service. Because SHVIA authorizes the Commission to modify the ILLR model only
ifthe modifications increase the accuracy ofthe model-as determined by actual field test data-and
because it is local network affiliates' copyright interests that must be protected, Network Affiliates
submit that the ILLR model should not be modified at this time to take account of clutter loss, either
as proposed in the Notice or as may be derived from Rubinstein's data. As the Notice correctly
contemplates, only when "high quality engineering studies containing conclusions based on reliable
62 See NAB Comments, CS Docket No. 98-201 (filed Dec. 11, 1998), Cohen EngineeringStatement, at 14-17.
- 33 -

and publicly available measurement data" are presented to the Commission and made available for
public comment, should the Commission again examine whether the ILLR model may be tweaked
to improve its already-high predictive accuracy.63
V. Error Code Treatment Must Not Result In Underprediction Of Service
The Notice proposes that "where error codes indicate severe error, the field strength is
deemed inadequate for TV service."64 The Notice then further clarifies that the ILLR model should
be run so that when the error marker KWX equals 0 or 1 the field strength prediction should be
accepted, but when KWX equals 2, 3, or 4, the field strength should be presumed to be "inadequate
for TV reception."65 This approach is a total volte-face from the Commission's considered view only
last year in the SHVA Order and is directly contrary to the principles that must guide the
Commission in narrowly construing the terms of a compulsory copyright license.
In the SHVA Order, the Commission carefully considered the opposing views of the parties
with regard to the treatment of error codes and ultimately concluded that
a party should either accept the prediction by ignoring the error codeor test the result with an on-site measurement. If the result isaccepted and is high enough to predict service, the household shall beclassified as served. If the result is low enough to predict lack ofservice, the household shall be classified as unserved.66
The Commission justified this decision, in part, as follows:
63 Notice at ~ 13.
64 Notice at A-I.
65Id. at A-3.
66 SHVA Order at ~ 85.
- 34 -

Ifwe change the model's assumption of service so that it assumes noservice [when an error code is returned], we risk shifting the satellitecarriers' burden of proving (through actual testing) that a householdis "unserved" in such a way that appears to contravene the statute.67
Now, without any explication whatsoever, the Notice proposes that error code markers 2, 3,
and 4 be treated as a lack of service. Nothing has changed in the computer code of the ILLR model
since the time of the SHVA Order to warrant this diametrically opposite treatment oferror codes, and
nothing has changed in the United States Code, Section 119 compulsory copyright license. SHVIA
left the burden of proof unchanged in Section 119. Section 119(a)(5)(D) still reads:
In any action brought under this paragraph, the satellite carrier shallhave the burden of proving that its secondary transmission of aprimary transmission by a network station is for private homeviewing to an unserved household.68
Consequently, the Commission's ratio decidendi in the SHVA Order for treatment oferror codes still
holds true.
When a calculation is considered outside certain preset limits on reliability, the ILLR model
does not actually predict service but, instead, sets a flag that the prediction may not be reliable. In
the DTV implementation of Longley-Rice, these flagged values were ignored and service was
assumed at that point. That treatment of the flags was a policy decision, not something built into,
or inherent in, the Longley-Rice model itself.69
Further analysis of those flagged Longley-Rice field strength values has shown that, in most
67Id. at ~ 85 n.219.
68 47 U.S.c. § 119(a)(5)(D) (emphasis added).
69 See Supplemental Information ofthe Affiliate Associations, CS Docket No. 98-201 (filedJan.15, 1999), Further Engineering Statement of William R. Meintel at 5-6.
- 35 -

instances, the flags were false alanns. In these cases, the flagged values have been found to be in
reasonable agreement with other non-flagged, reliable predictions in the immediate area surrounding
the point in question. 70
A predictive model is not a substitute for an actual measurement, which still remains the
ultimate arbiter of service under Section 119. Even the ILLR model, which creates helpful, but
rebuttable presumptions, is still just an administrative tool that can be used within its recognized
limitations.
The ILLR model, when run with the standard inputs specified in the SHVA Order, is neither
over- nor under-predictive. Where outside its preset reliability limits, the model will flag the
returned field strength values. Because most of these flags are false alarms, one possibility is to
ignore the flags and use the returned field strength values. This was the course of action
recommended by Hammett & Edison, Inc. in CS Docket No. 98-201,71 and the course actually
followed by the Commission in the SHVA Order.
The better option for purposes of the Section 119 compulsory copyright license, however,
is to make a policy decision similar to the one the Commission made in the DTV implementation
of Longley-Rice which is to treat all flagged points as served. In the Section 119 context, flagged
values should be evaluated with respect to a threshold level below Grade B service. Where returned
values are flagged that exceed the threshold, the location should be treated as served; flagged values
below the threshold would be ignored, indicating the location is unserved. The reason for this
70 See id. at 6.
71 See Comments of Hammett & Edison, Inc., CS Docket No. 98-201 (filed Dec. 11, 1998),at 7.
- 36-

policy, and for setting the threshold below current Grade B service levels, is clear: To promote
localism and preserve the network/affiliate relationship, a principal goal of the original Satellite
Home Viewer Act as well as all of its amendments, the Commission should take all appropriate
action to protect the integrity of the copyrights and copyright licenses acquired in a free market by
networks and their local affiliates. It is an axiom of statutory construction that compulsory licenses
are to be construed narrowlY,72 which the Conference Committee expressly recognized in fashioning
SHVIA.73 If the Commission is to err, it should err on the side of protecting copyrights and local,
free, over-the-air broadcast service. It should not err by altering the ILLR model to make it
understate the number of "served" households, a point which the Commission fully respected in the
SHVA Order. 74 Had Congress intended for the Commission to do otherwise, it would have said so
when SHVIA was adopted.
According to the Hammett & Edison analysis, on average approximately one-fifth (18%) of
the population will reside in cells for which KWX=3. 75 Consequently, if the ILLR model is run as
the Notice proposes, on average approximately one-fifth of the viewers of any given local network
affiliate will be automatically classified as "unserved" and hence eligible for distant network service.
This one change could do more to harm the viability oflocal network affiliates than any other change
proposed in the Notice. This change in the treatment of error codes must not be allowed to be
72 See, e.g., Fame Publ'g Co. v. Alabama Custom Tape, Inc., 507 F.2d 667,670 (5th Cir.),cert. denied, 423 U.S. 841 (1975).
73 See Conference Report at 2.
74 See SHVA Order at ~~ 8, 65, 77.
75 See Comments ofHarnmett & Edison, Inc., CS Docket No. 98-201 (filed Dec. 11, 1998),at 7.
- 37 -
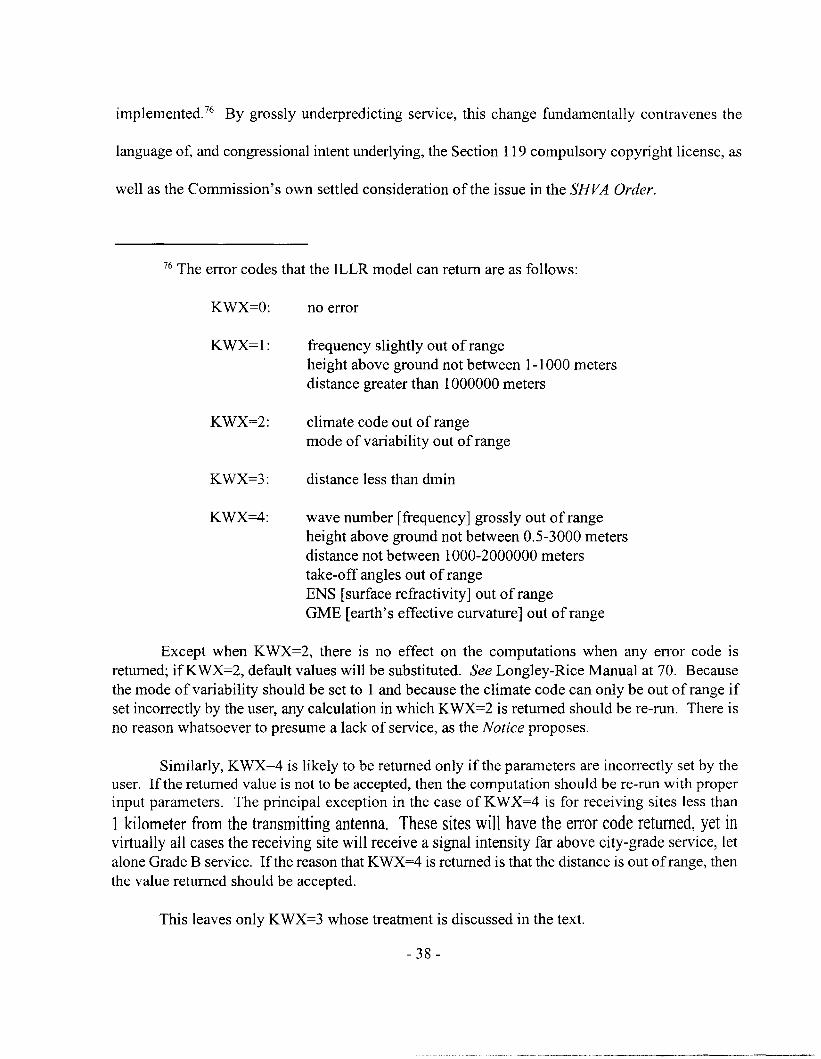
implemented. 76 By grossly underpredicting service, this change fundamentally contravenes the
language of. and congressional intent underlying, the Section 119 compulsory copyright license, as
well as the Commission's own settled consideration of the issue in the SHVA Order.
76 The error codes that the ILLR model can return are as follows:
KWX=O:
KWX=I:
KWX=2:
KWX=3:
KWX=4:
no error
frequency slightly out of rangeheight above ground not between 1-1000 metersdistance greater than 1000000 meters
climate code out of rangemode of variability out of range
distance less than dmin
wave number [frequency] grossly out of rangeheight above ground not between 0.5-3000 metersdistance not between 1000-2000000 meterstake-off angles out of rangeENS [surface refractivity] out ofrangeGME [earth's effective curvature] out of range
Except when KWX=2, there is no effect on the computations when any error code isreturned; ifKWX=2, default values will be substituted. See Longley-Rice Manual at 70. Becausethe mode of variability should be set to 1 and because the climate code can only be out of range ifset incorrectly by the user, any calculation in which KWX=2 is returned should be re-run. There isno reason whatsoever to presume a lack of service, as the Notice proposes.
Similarly, KWX=4 is likely to be returned only if the parameters are incorrectly set by theuser. If the returned value is not to be accepted, then the computation should be re-run with properinput parameters. The principal exception in the case of KWX=4 is for receiving sites less than
1 kilometer from the transmitting antenna. These sites will have the error code returned, yet invirtually all cases the receiving site will receive a signal intensity far above city-grade service, letalone Grade B service. If the reason that KWX=4 is returned is that the distance is out of range, thenthe value returned should be accepted.
This leaves only KWX=3 whose treatment is discussed in the text.
- 38 -
----------------------------------- -------------------

VI. Certain Parameter Values In The ILLR Model Need To Be Modified
If the ILLR model is to be refined, then the Commission should take the opportunity to use
appropriate and realistic values for surface refractivity, rather than rely on a merely median value,
as proposed in the Notice. 77 It is a straightforward matter to create a database of surface refractivity
values for use in the ILLR model. The values may be keyed to the appropriate clutter category, or,
alternatively, used as a stand-alone database with appropriate values selected for the receiving
antenna location. Additional details are provided in the IITRI Engineering Statement.
77 See Notice at A-3. The Notice also proposes to use median values for relative permittivityand ground conductivity. Because the effect ofdifferences from the median values are insignificantwith respect to broadcast service, it is not necessary to vary from the median values proposed in theNotice.
- 39 -

Conclusion
The proposal contained in the Notice to subtract clutter loss values from the current ILLR
model is ill-founded. There are fatal difficulties with attempting to derive clutter loss values from
Rubinstein's data for purposes of predicting television signal strength at individua110cations, and
there are very serious difficulties with attempting to assign clutter loss values to individual locations
with regard to simplified USGS LULC categories. As substantial empirical data demonstrate, the
semi-empirical ILLR model already does a remarkably good job of predicting signal strength at
individua110cations with a high degree of accuracy.
Network Affiliates respectfully urge the Commission to continue to respect the principles
of narrowly construing a compulsory copyright license that is in derogation of local network
affiliates' property rights, of refusing to create methods whereby served households are deemed
unserved, and ofrefusing to permit any predictive model to underpredict true service. By respecting
the integrity of the Commission's own decision in CS Docket No. 98-201 and SHVIA's statutory
language and legislative history, it becomes clear that the Commission should not act to modify the
ILLR model as proposed in the Notice. It continues to remain premature to modify the ILLR model
based on the engineering and technical studies that have been performed to date.
- 40-

--
By / {;ttlcfDavid KushnerBROOKS, PIERCE, McLENDON,
HUMPHREY & LEONARD, L.L.P.First Union Capitol CenterSuite 1600 (27601)Post Office Box 1800Raleigh, North Carolina 27602Telephone: (919) 839-0300Counsel for the ABC TelevisionAffiliates Associatio andfor theFox Television Affi 'ates Association
A.COVINGTON & BURLING1201 Pennsylvania Avenue, N.W. (20004)Post Office Box 7566Washington, D.C. 20044-7566Telephone: (202) 662-6000Counsel for the CBS TelevisionNetwork Affiliates Association andfor theNBC Television Affiliates Association
February 22, 2000
- 41 -

.-