r freight profile -...
TRANSCRIPT
GREATER CHARLOTTE REGIONAL FREIGHT MOBILITY PLAN
GASTON-CLEVELAND-LINCOLN
METROPOLITAN PLANNING
ORGANIZATION REGIONAL FREIGHT PROFILE
Prepared for:
Prepared by:
January 2017
GREATER CH ARLOTTE RE G IONAL FRE IGHT MOB IL ITY PLAN i
TABLE OF CONTENTS
1 Greater Charlotte Regional Freight Plan ................................................................................... 3
1.1 Overview of Public and Stakeholder Engagement ................................................................ 3
1.2 Regional Freight Goals ........................................................................................................... 4
1.3 Performance Measures ......................................................................................................... 5
1.4 Application of Plan Recommendations and Policy Guidance ................................................ 7
2 Existing Conditions .................................................................................................................. 8
2.1 Assets and Critical Infrastructure Within the Gaston-Cleveland-Lincoln MPO ..................... 8
2.1.1 Regional Strategic Freight Network .......................................................................... 8
2.1.2 Critical Rural and Urban Freight Corridors ............................................................. 10
2.2 Existing Conditions Within the Gaston-Cleveland-Lincoln MPO ......................................... 10
2.2.1 Trucking .................................................................................................................. 10
2.2.2 Rail .......................................................................................................................... 14
2.2.3 Air Cargo ................................................................................................................. 17
3 Future Freight Demand and Land Uses ................................................................................... 19
3.1 Freight Land use ................................................................................................................... 19
3.2 Future Regional Commodity Flows ...................................................................................... 22
4 Recommendations of the Freight Plan ................................................................................... 23
4.1 Prioritized Projects ............................................................................................................... 23
4.1.1 Trucking Related Recommendations ...................................................................... 23
4.1.2 Rail Related Recommendations .............................................................................. 26
4.2 Funding Strategies ............................................................................................................... 27
4.2.1 FAST Act .................................................................................................................. 27
4.2.2 State Funding Sources ............................................................................................ 27
4.3 Policy Recommendations .................................................................................................... 28
4.4 Public-Private Partnership Opportunities ............................................................................ 29
4.4.1 Truck Parking .......................................................................................................... 30
4.4.2 Truck Data ............................................................................................................... 30

Gaston-Cleveland-Lincoln MPO Freight Profile • Table of Contents
GREATER CH ARLOTTE RE G IONAL FRE IGHT MOB IL ITY PLAN ii
LIST OF TABLES
Table 1.1: Freight Mobility Plan Goals and Performance Measures ....................................................... 6
Table 2.1: Regional Railroad Ownership ................................................................................................ 14
Table 3.1: Existing Freight Acreage in the Gaston Cleveland Lincoln MPO Counties ............................ 20
Table 3.2: Gaston Cleveland Lincoln MPO Corridors (Acres) ................................................................. 21
Table 3.3: Gaston Cleveland Lincoln MPO Concentrations ................................................................... 21
Table 4.1: Truck Related Recommendations ......................................................................................... 24
Table 4.2: Rail Related Recommendations ............................................................................................ 26
Table 4.3: General Freight Policy Recommendations ............................................................................ 28
LIST OF FIGURES
Figure 2.1: Strategic Freight Network in the GCLMPO Area .................................................................... 9
Figure 2.2: Strategic Freight Network (Roadways Only) .......................................................................... 9
Figure 2.3: Strategic Freight Network (Roadways Only) and Urban Area Clusters in Gaston-Cleveland-Lincoln MPO Region ........................................................................................................... 10
Figure 2.4: Regional Truck Average Daily Truck Volumes (2012) .......................................................... 11
Figure 2.5: Charlotte Region Truck Bottlenecks in Relation to Gaston-Cleveland-Lincoln MPO ........... 12
Figure 2.6: Structurally Deficient and Functionally Obsolete Bridges in the GCLMPO Region ............. 12
Figure 2.7: Commercial Vehicle Crash Hotspots (2009-2013) ............................................................... 13
Figure 2.8: Bicycle Routes within the GCLMPO Region ......................................................................... 14
Figure 2.9: Greater Charlotte Regional Rail Network ............................................................................ 15
Figure 2.10: Regional Class I Annual Rail Freight Volumes (2014) ........................................................ 16
Figure 2.11: Regional Rail Freight Top Commodities (By Weight) ......................................................... 16
Figure 2.12: Greater Charlotte Regional Public Airports ....................................................................... 17
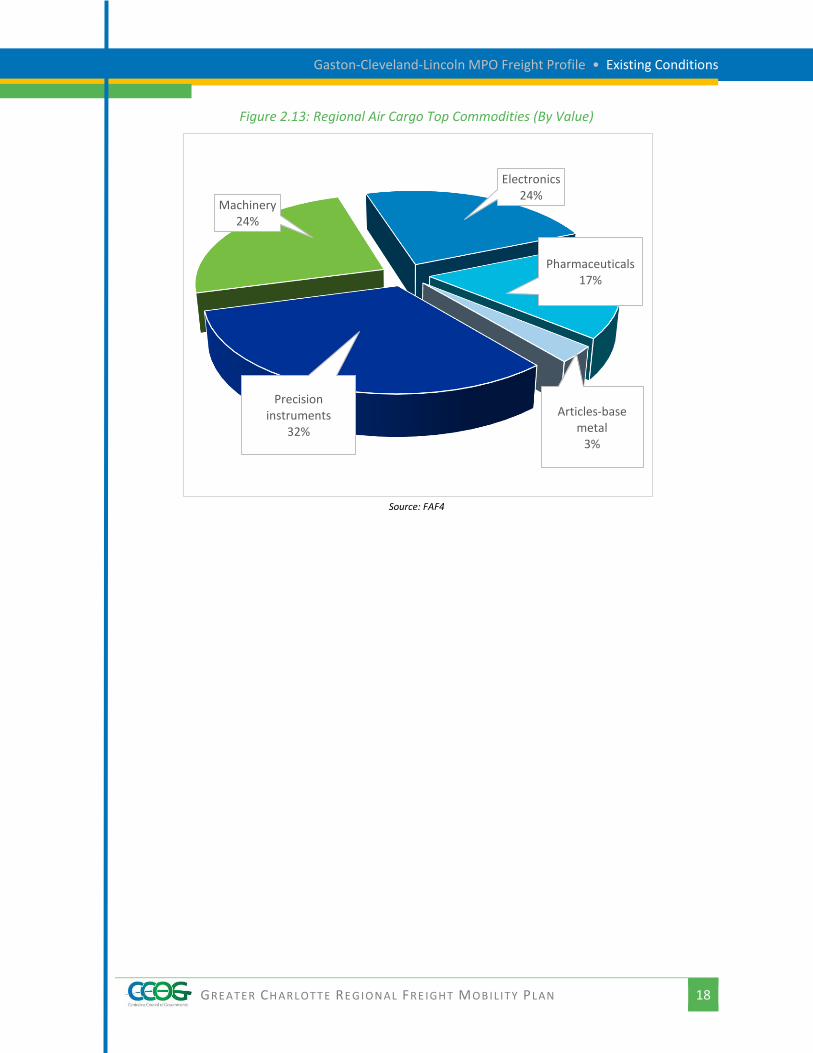
Figure 2.13: Regional Air Cargo Top Commodities (By Value) ............................................................... 18
Figure 3.1: Identification of Freight Corridors and Concentrations ...................................................... 19
Figure 3.2: Identification of Freight Corridors and Concentrations within the GCLMPO Region .......... 20
Figure 3.3: Wetlands Within the Corridors and Concentrations of the GCLMPO Region ..................... 21
Figure 4.1: Trucking Related Recommendations for GCLMPO .............................................................. 25
GREATER CH ARLOTTE RE G IONAL FRE IGHT MOB IL ITY PLAN 3
1 GREATER CHARLOTTE REGIONAL FREIGHT PLAN
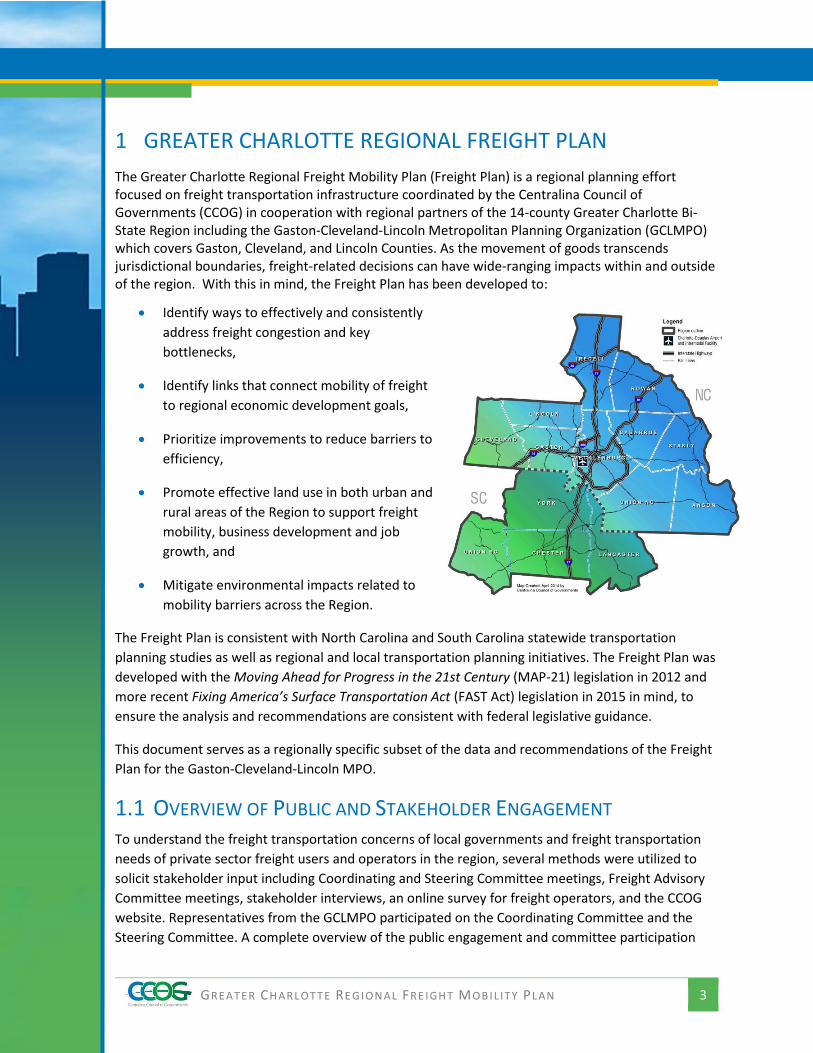
The Greater Charlotte Regional Freight Mobility Plan (Freight Plan) is a regional planning effort focused on freight transportation infrastructure coordinated by the Centralina Council of Governments (CCOG) in cooperation with regional partners of the 14-county Greater Charlotte Bi-State Region including the Gaston-Cleveland-Lincoln Metropolitan Planning Organization (GCLMPO) which covers Gaston, Cleveland, and Lincoln Counties. As the movement of goods transcends jurisdictional boundaries, freight-related decisions can have wide-ranging impacts within and outside of the region. With this in mind, the Freight Plan has been developed to:
Identify ways to effectively and consistently
address freight congestion and key
bottlenecks,
Identify links that connect mobility of freight
to regional economic development goals,
Prioritize improvements to reduce barriers to
efficiency,
Promote effective land use in both urban and
rural areas of the Region to support freight
mobility, business development and job
growth, and
Mitigate environmental impacts related to
mobility barriers across the Region.
The Freight Plan is consistent with North Carolina and South Carolina statewide transportation
planning studies as well as regional and local transportation planning initiatives. The Freight Plan was
developed with the Moving Ahead for Progress in the 21st Century (MAP-21) legislation in 2012 and
more recent Fixing America’s Surface Transportation Act (FAST Act) legislation in 2015 in mind, to
ensure the analysis and recommendations are consistent with federal legislative guidance.
This document serves as a regionally specific subset of the data and recommendations of the Freight
Plan for the Gaston-Cleveland-Lincoln MPO.
1.1 OVERVIEW OF PUBLIC AND STAKEHOLDER ENGAGEMENT To understand the freight transportation concerns of local governments and freight transportation
needs of private sector freight users and operators in the region, several methods were utilized to
solicit stakeholder input including Coordinating and Steering Committee meetings, Freight Advisory
Committee meetings, stakeholder interviews, an online survey for freight operators, and the CCOG
website. Representatives from the GCLMPO participated on the Coordinating Committee and the
Steering Committee. A complete overview of the public engagement and committee participation
Gaston-Cleveland-Lincoln MPO Freight Profile • Greater Charlotte Regional Freight Plan
GREATER CH ARLOTTE RE G IONAL FRE IGHT MOB IL ITY PLAN 4
process is included in the Final Plan, Appendix A – Summary of Public Information and Stakeholder
Feedback.
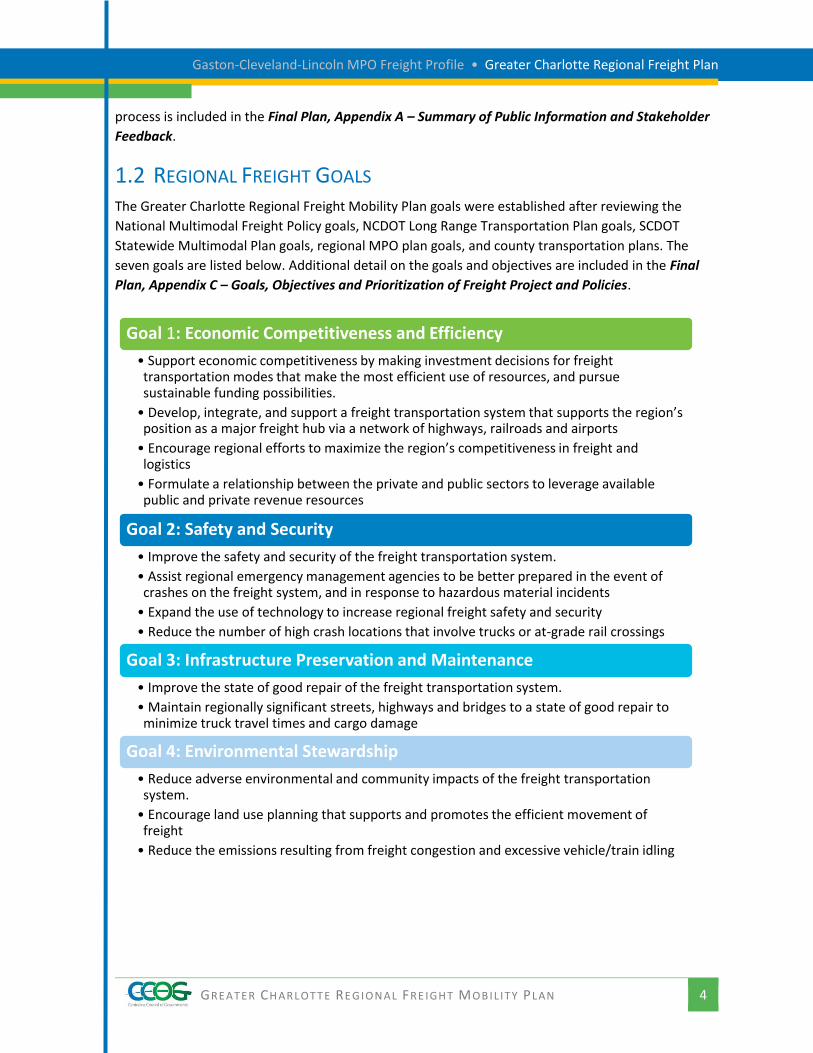
1.2 REGIONAL FREIGHT GOALS The Greater Charlotte Regional Freight Mobility Plan goals were established after reviewing the
National Multimodal Freight Policy goals, NCDOT Long Range Transportation Plan goals, SCDOT
Statewide Multimodal Plan goals, regional MPO plan goals, and county transportation plans. The
seven goals are listed below. Additional detail on the goals and objectives are included in the Final
Plan, Appendix C – Goals, Objectives and Prioritization of Freight Project and Policies.
Goal 1: Economic Competitiveness and Efficiency
• Support economic competitiveness by making investment decisions for freight transportation modes that make the most efficient use of resources, and pursue sustainable funding possibilities.
• Develop, integrate, and support a freight transportation system that supports the region’s position as a major freight hub via a network of highways, railroads and airports
• Encourage regional efforts to maximize the region’s competitiveness in freight and logistics
• Formulate a relationship between the private and public sectors to leverage available public and private revenue resources
Goal 2: Safety and Security
• Improve the safety and security of the freight transportation system.
• Assist regional emergency management agencies to be better prepared in the event of crashes on the freight system, and in response to hazardous material incidents
• Expand the use of technology to increase regional freight safety and security
• Reduce the number of high crash locations that involve trucks or at-grade rail crossings
Goal 3: Infrastructure Preservation and Maintenance
• Improve the state of good repair of the freight transportation system.
• Maintain regionally significant streets, highways and bridges to a state of good repair to minimize truck travel times and cargo damage
Goal 4: Environmental Stewardship
• Reduce adverse environmental and community impacts of the freight transportation system.
• Encourage land use planning that supports and promotes the efficient movement of freight
• Reduce the emissions resulting from freight congestion and excessive vehicle/train idling
Gaston-Cleveland-Lincoln MPO Freight Profile • Greater Charlotte Regional Freight Plan
GREATER CH ARLOTTE RE G IONAL FRE IGHT MOB IL ITY PLAN 5
1.3 PERFORMANCE MEASURES The Freight Plan’s performance measures were developed consistent with the Plan’s overall goals
and objectives, the region’s long range transportation plans, as well as the South Carolina Statewide
Freight Plan. Under the MAP-21 Act and the FAST Act, State DOTs and MPOs are required to set
performance targets consistent with the established national performance measures for freight,
integrate those targets within their planning processes, and report to the USDOT on their progress.
Beyond federal requirements, freight performance measures will provide the project partners and
MPOs and RPOs with the ability to monitor how well the transportation system is accommodating
safe and effective freight movements. These measures will allow for the identification of trends or
challenges before they become problems, and the project partners can be better prepared and
responsive to private sector needs. Table 1.1 illustrates the performance measures recommended to
evaluate the established goals and objectives.
This list should provide guidance in data coordination and goal setting as performance measures are
developed for inclusion in the long range transportation plan for the GCLMPO region. These will
provide benchmarks at the local and regional levels, tracking how well policies and projects are
working to achieve the stated goals. This also provides an opportunity for alignment with data
sources that are to be maintained at the regional and state level, streamlining the data collection and
maintenance efforts of planning staff.
Goal 5: Congestion and Reliability
• Reduce travel times and increase the reliability of the freight transportation system.
Goal 6: Performance and Accountability
• Develop methods to track and improve performance and accountability of the operations and maintenance of the freight transportation system.
• Decrease the costs of freight movement by reducing empty backhaul movements
• Improve freight system operations and information sharing to benefit regional planning and decision making through improvements in technology
• Increase freight knowledge and expertise by planners and elected officials throughout the region
• Implement a performance-based tracking process to determine how well the freight system is functioning relative to freight investments
Goal 7: Regional Coordination
• Establish/Improve the coordination of regional public and private sector organizations to improve freight planning and policy and project implementation.
• Engage private sector freight stakeholders to inform freight transportation planning and decision making
Gaston-Cleveland-Lincoln MPO Freight Profile • Greater Charlotte Regional Freight Plan
GREATER CH ARLOTTE RE G IONAL FRE IGHT MOB IL ITY PLAN 6
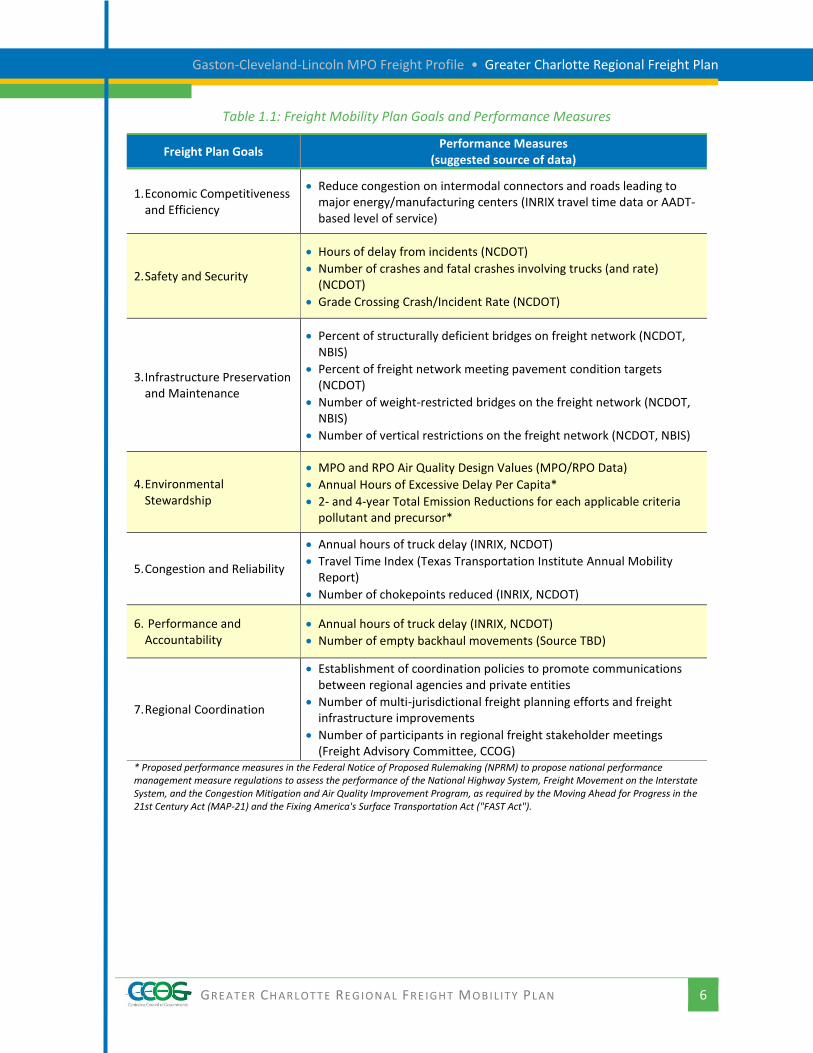
Table 1.1: Freight Mobility Plan Goals and Performance Measures
Freight Plan Goals Performance Measures
(suggested source of data)
1. Economic Competitiveness and Efficiency
Reduce congestion on intermodal connectors and roads leading to major energy/manufacturing centers (INRIX travel time data or AADT-based level of service)
2. Safety and Security
Hours of delay from incidents (NCDOT)
Number of crashes and fatal crashes involving trucks (and rate) (NCDOT)
Grade Crossing Crash/Incident Rate (NCDOT)
3. Infrastructure Preservation and Maintenance
Percent of structurally deficient bridges on freight network (NCDOT, NBIS)
Percent of freight network meeting pavement condition targets (NCDOT)
Number of weight-restricted bridges on the freight network (NCDOT, NBIS)
Number of vertical restrictions on the freight network (NCDOT, NBIS)
4. Environmental Stewardship
MPO and RPO Air Quality Design Values (MPO/RPO Data)
Annual Hours of Excessive Delay Per Capita*
2- and 4-year Total Emission Reductions for each applicable criteria pollutant and precursor*
5. Congestion and Reliability
Annual hours of truck delay (INRIX, NCDOT)
Travel Time Index (Texas Transportation Institute Annual Mobility Report)
Number of chokepoints reduced (INRIX, NCDOT)
6. Performance and Accountability
Annual hours of truck delay (INRIX, NCDOT)
Number of empty backhaul movements (Source TBD)
7. Regional Coordination
Establishment of coordination policies to promote communications between regional agencies and private entities
Number of multi-jurisdictional freight planning efforts and freight infrastructure improvements
Number of participants in regional freight stakeholder meetings (Freight Advisory Committee, CCOG)
* Proposed performance measures in the Federal Notice of Proposed Rulemaking (NPRM) to propose national performance management measure regulations to assess the performance of the National Highway System, Freight Movement on the Interstate System, and the Congestion Mitigation and Air Quality Improvement Program, as required by the Moving Ahead for Progress in the 21st Century Act (MAP-21) and the Fixing America's Surface Transportation Act ("FAST Act").

Gaston-Cleveland-Lincoln MPO Freight Profile • Greater Charlotte Regional Freight Plan
GREATER CH ARLOTTE RE G IONAL FRE IGHT MOB IL ITY PLAN 7
1.4 APPLICATION OF PLAN RECOMMENDATIONS AND POLICY GUIDANCE Implementation of the Freight Plan and its recommendations requires coordination from local,
regional, state, and national partners, involving both public and private sectors. With this in mind,
the Freight Plan is designed to assist local municipalities and governmental agencies to facilitate their
efforts on comprehensive plan updates, mapping updates of land use and zoning layers, as well as
development service planning. This Freight Plan serves four principal purposes:
1. Data resource: a great deal of data has been compiled with the development of this plan.
Infrastructure, parking, land use and other relevant data are available for reference and / or
implementation, as well as ongoing planning efforts. CCOG can assist with this information.
2. Provide freight related recommendations for inclusion in state and local land use and
transportation plans: throughout the Freight Plan, recommendations for performance
measures, project prioritization recommended policies, as well as programs and projects are
presented. These should be considered for inclusion in GCLMPO transportation plans and
should provide useful guidance in land use planning.
3. Serve as an example of effective regional coordination and transportation system planning:
This work effort has initiated a valuable dialogue across the public and private sectors, raising
awareness of freight mobility and its role in the regional economy. This plan should serve as
the foundation for continued engagement of freight stakeholders and an ongoing focus on
freight mobility within the greater Charlotte region. With this in mind, GCLMPO is
encouraged to have continued staff participation and board representation in regional
freight planning efforts.
4. It is requested that the Greater Charlotte Regional Freight Mobility Plan be reviewed and
accepted by the GCLMPO Policy Committee: with a principal goal of this regional planning
effort being to raise awareness of the importance of regional freight mobility and
incorporate appropriate freight elements into transportation planning practices on a
consistent basis. This action will codify the months of effort and participation of members of
the Coordinating Committee, and will sustain the ongoing dialogue of supporting freight
mobility in the region. By design, the recommendations of this Freight Plan are not given
numeric scoring but rather relative prioritization on a regional level. Those recommendations
should be considered for further analysis and inclusion in local prioritization processes.
GREATER CH ARLOTTE RE G IONAL FRE IGHT MOB IL ITY PLAN 8
2 EXISTING CONDITIONS
The existing conditions of the Freight Plan analysis was the starting point for understanding what
actions and investments will help meet the Greater Charlotte Region’s freight-related economic
competitiveness goals and objectives. The existing conditions analysis identified, inventoried, and
assessed the current condition and performance of trucking, rail, and air cargo within the freight
transportation system. The condition and performance is a product of economic conditions, system
demand, quality and timing of operations, maintenance, and investments. Portions of the existing
conditions analysis specific to the GCLMPO region are summarized below. The full existing conditions
technical memorandum can be found in the Final Plan, Appendix B.
2.1 ASSETS AND CRITICAL INFRASTRUCTURE WITHIN THE GASTON-CLEVELAND-LINCOLN MPO
2.1.1 Regional Strategic Freight Network A key element of Freight Planning is the identification of the regional Strategic Freight Network (SFN).
By definition, a SFN is a system of infrastructure critical to the successful movement of freight. For
the Freight Plan, this SFN serves as the network around which the region currently moves freight and
plans to continue to support safe, efficient movement of freight into the forecast plan years.
Many recommendations related to infrastructure improvements are limited to the SFN. With
consideration of limited resources for infrastructure projects, the Freight Plan focuses on this
network identified as critical to the Greater Charlotte Region.
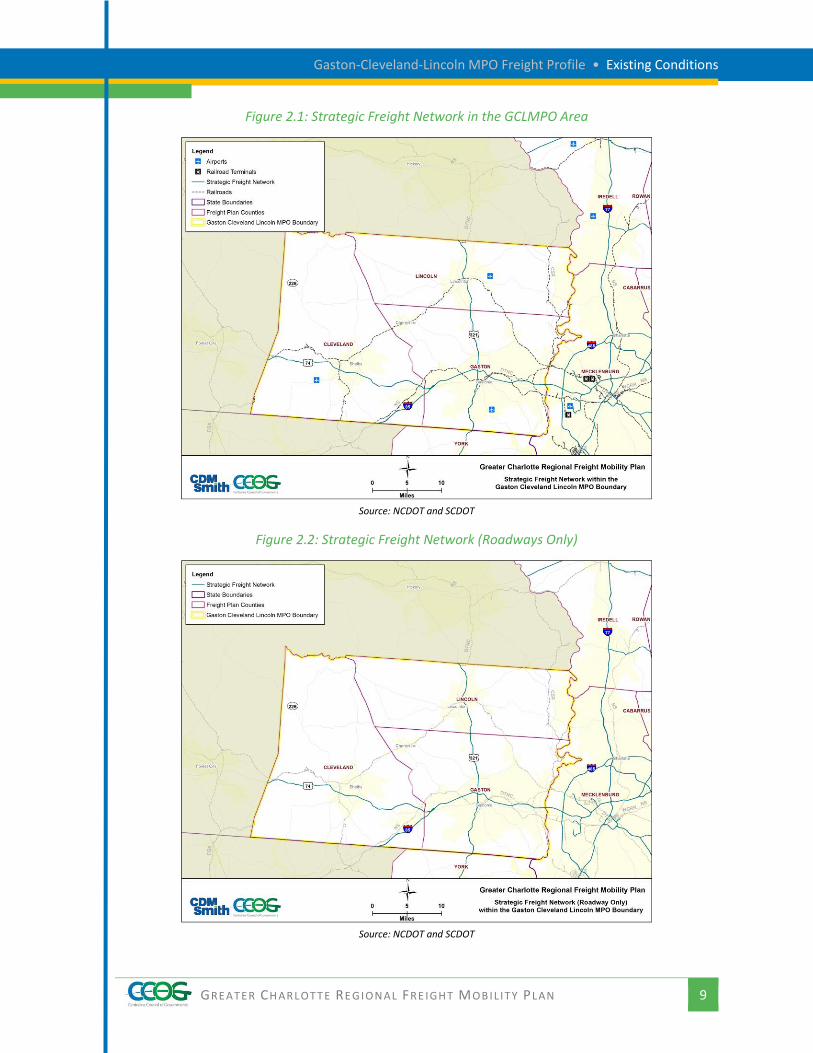
Illustrated in Figure 2.1 and Figure 2.2, the GCLMPO SFN encompasses all modes of freight moving
transportation. In partnership with the Coordinating Committee, the following criteria were used to
finalize the roadway and other modal components of the SFN:
Highways
Those on the National Multimodal Freight System (NMFS) and/or all Interstates
Those designated as truck routes by NCDOT
Approved Intermodal Connectors on the National Highway System
Those identified by planning agencies as critical to local freight movement
Railroads
All active freight railroads
All active intermodal rail terminals
Aviation
All commercial service airports
Gaston-Cleveland-Lincoln MPO Freight Profile • Existing Conditions
GREATER CH ARLOTTE RE G IONAL FRE IGHT MOB IL ITY PLAN 9
Figure 2.1: Strategic Freight Network in the GCLMPO Area
Source: NCDOT and SCDOT
Figure 2.2: Strategic Freight Network (Roadways Only)
Source: NCDOT and SCDOT
Gaston-Cleveland-Lincoln MPO Freight Profile • Existing Conditions
GREATER CH ARLOTTE RE G IONAL FRE IGHT MOB IL ITY PLAN 10
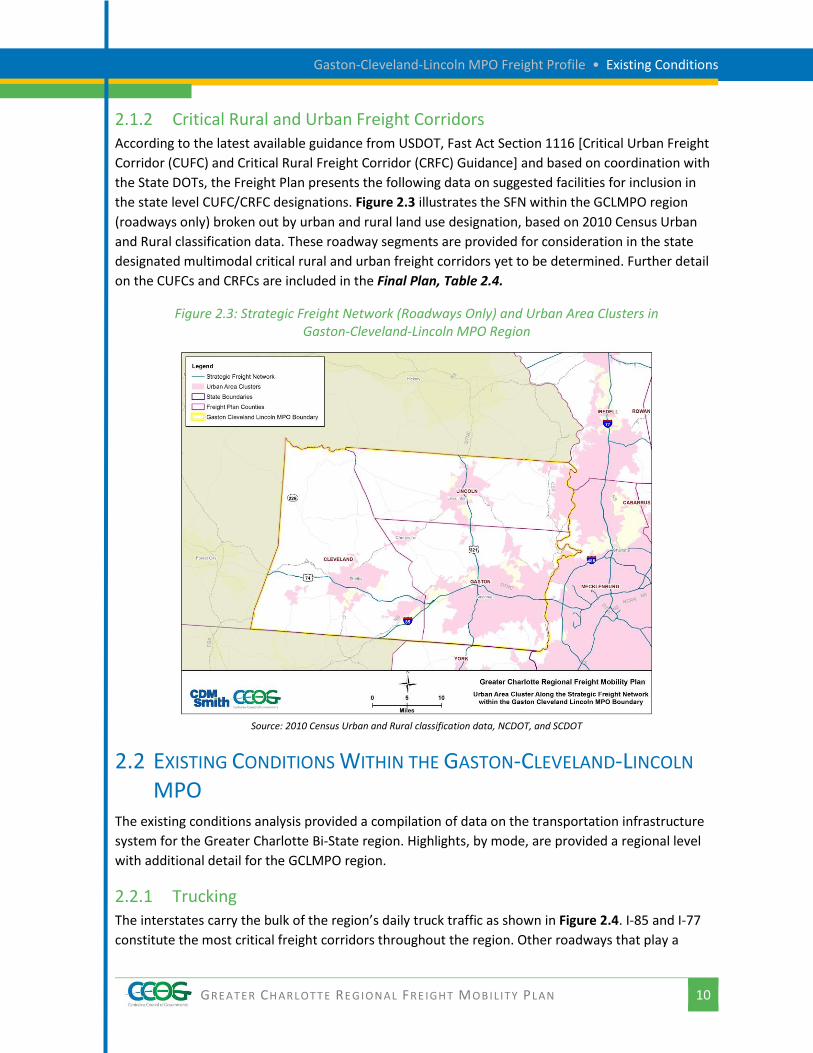
2.1.2 Critical Rural and Urban Freight Corridors According to the latest available guidance from USDOT, Fast Act Section 1116 [Critical Urban Freight
Corridor (CUFC) and Critical Rural Freight Corridor (CRFC) Guidance] and based on coordination with
the State DOTs, the Freight Plan presents the following data on suggested facilities for inclusion in
the state level CUFC/CRFC designations. Figure 2.3 illustrates the SFN within the GCLMPO region
(roadways only) broken out by urban and rural land use designation, based on 2010 Census Urban
and Rural classification data. These roadway segments are provided for consideration in the state
designated multimodal critical rural and urban freight corridors yet to be determined. Further detail
on the CUFCs and CRFCs are included in the Final Plan, Table 2.4.
Figure 2.3: Strategic Freight Network (Roadways Only) and Urban Area Clusters in Gaston-Cleveland-Lincoln MPO Region
Source: 2010 Census Urban and Rural classification data, NCDOT, and SCDOT
2.2 EXISTING CONDITIONS WITHIN THE GASTON-CLEVELAND-LINCOLN
MPO The existing conditions analysis provided a compilation of data on the transportation infrastructure
system for the Greater Charlotte Bi-State region. Highlights, by mode, are provided a regional level
with additional detail for the GCLMPO region.
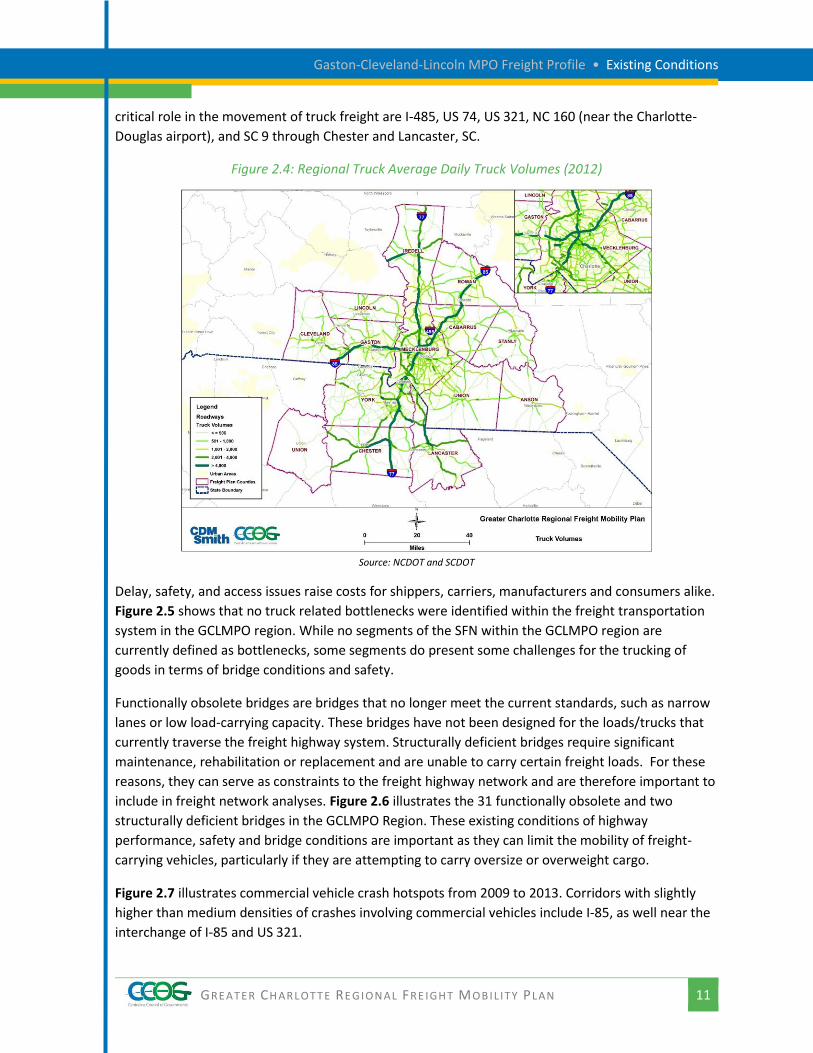
2.2.1 Trucking The interstates carry the bulk of the region’s daily truck traffic as shown in Figure 2.4. I-85 and I-77
constitute the most critical freight corridors throughout the region. Other roadways that play a
Gaston-Cleveland-Lincoln MPO Freight Profile • Existing Conditions
GREATER CH ARLOTTE RE G IONAL FRE IGHT MOB IL ITY PLAN 11
critical role in the movement of truck freight are I-485, US 74, US 321, NC 160 (near the Charlotte-
Douglas airport), and SC 9 through Chester and Lancaster, SC.
Figure 2.4: Regional Truck Average Daily Truck Volumes (2012)
Source: NCDOT and SCDOT
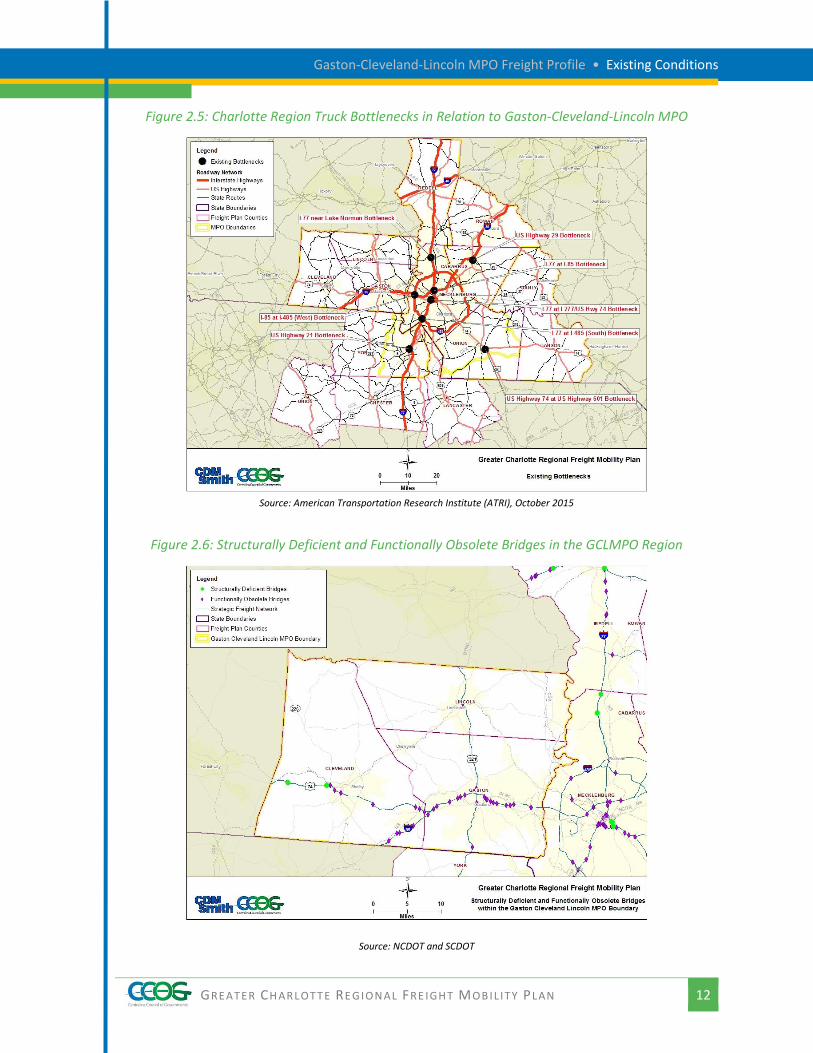
Delay, safety, and access issues raise costs for shippers, carriers, manufacturers and consumers alike.
Figure 2.5 shows that no truck related bottlenecks were identified within the freight transportation
system in the GCLMPO region. While no segments of the SFN within the GCLMPO region are
currently defined as bottlenecks, some segments do present some challenges for the trucking of
goods in terms of bridge conditions and safety.
Functionally obsolete bridges are bridges that no longer meet the current standards, such as narrow
lanes or low load-carrying capacity. These bridges have not been designed for the loads/trucks that
currently traverse the freight highway system. Structurally deficient bridges require significant
maintenance, rehabilitation or replacement and are unable to carry certain freight loads. For these
reasons, they can serve as constraints to the freight highway network and are therefore important to
include in freight network analyses. Figure 2.6 illustrates the 31 functionally obsolete and two
structurally deficient bridges in the GCLMPO Region. These existing conditions of highway
performance, safety and bridge conditions are important as they can limit the mobility of freight-
carrying vehicles, particularly if they are attempting to carry oversize or overweight cargo.
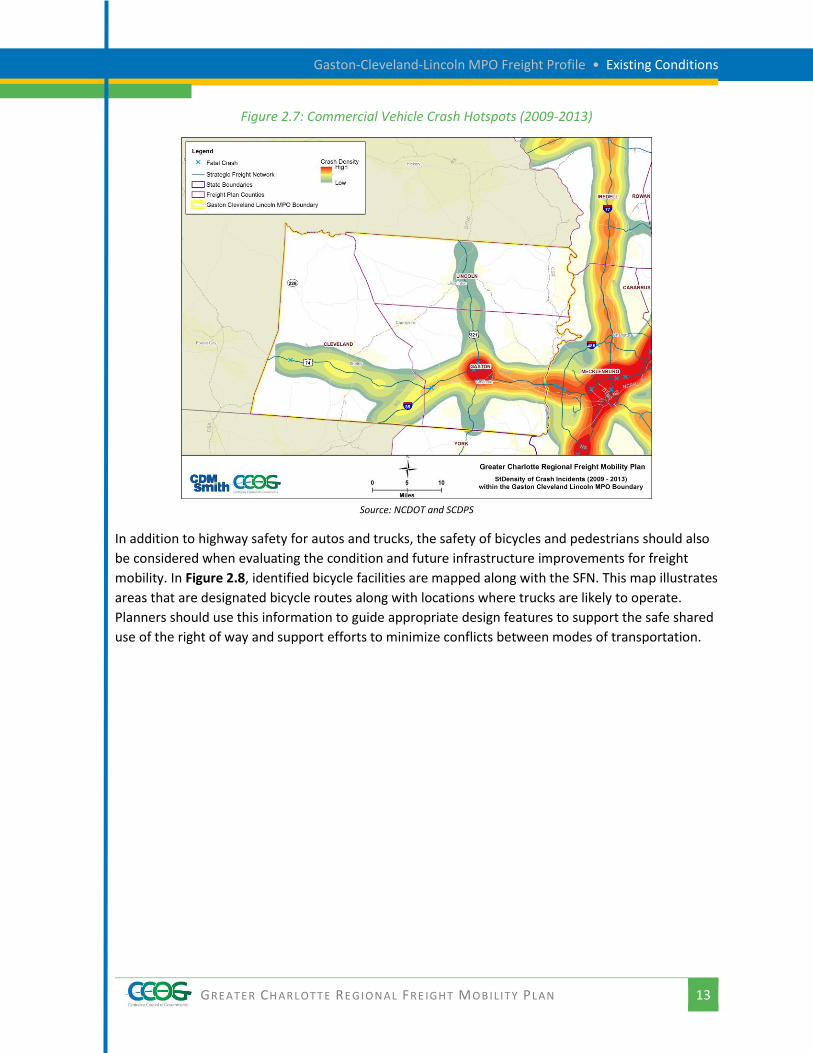
Figure 2.7 illustrates commercial vehicle crash hotspots from 2009 to 2013. Corridors with slightly
higher than medium densities of crashes involving commercial vehicles include I-85, as well near the
interchange of I-85 and US 321.
Gaston-Cleveland-Lincoln MPO Freight Profile • Existing Conditions
GREATER CH ARLOTTE RE G IONAL FRE IGHT MOB IL ITY PLAN 12
Figure 2.5: Charlotte Region Truck Bottlenecks in Relation to Gaston-Cleveland-Lincoln MPO
Source: American Transportation Research Institute (ATRI), October 2015
Figure 2.6: Structurally Deficient and Functionally Obsolete Bridges in the GCLMPO Region
Source: NCDOT and SCDOT
Gaston-Cleveland-Lincoln MPO Freight Profile • Existing Conditions
GREATER CH ARLOTTE RE G IONAL FRE IGHT MOB IL ITY PLAN 13
Figure 2.7: Commercial Vehicle Crash Hotspots (2009-2013)
Source: NCDOT and SCDPS
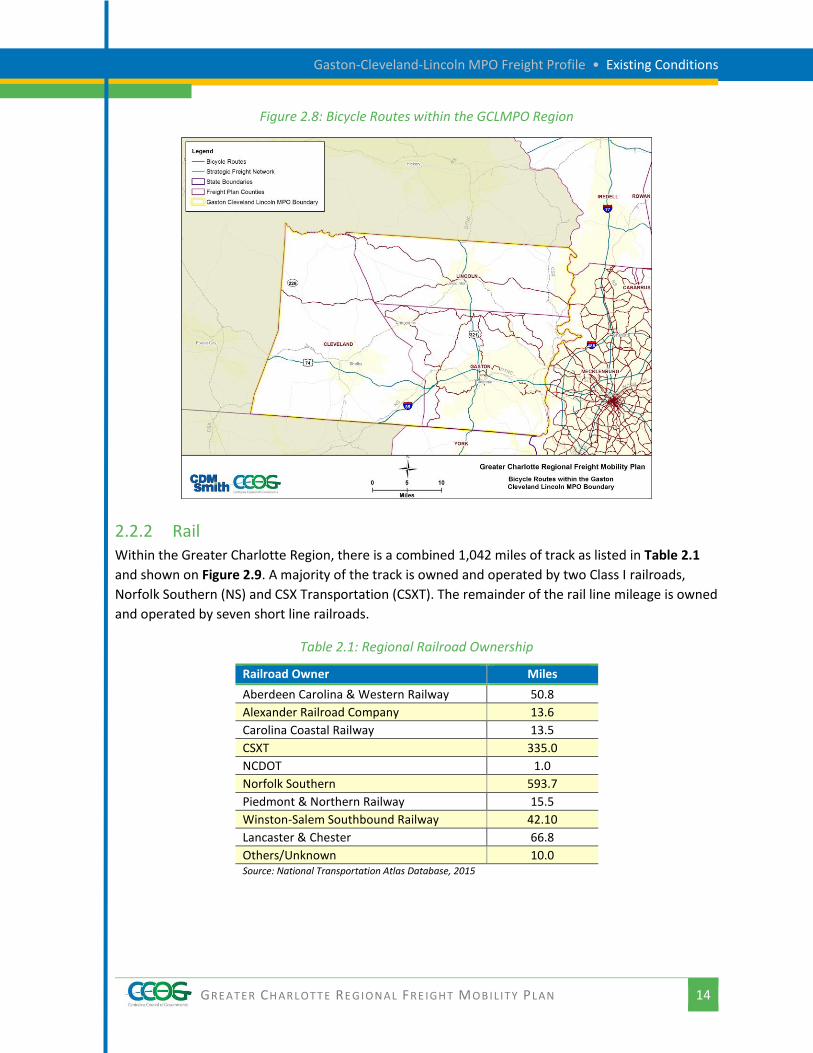
In addition to highway safety for autos and trucks, the safety of bicycles and pedestrians should also
be considered when evaluating the condition and future infrastructure improvements for freight
mobility. In Figure 2.8, identified bicycle facilities are mapped along with the SFN. This map illustrates
areas that are designated bicycle routes along with locations where trucks are likely to operate.
Planners should use this information to guide appropriate design features to support the safe shared
use of the right of way and support efforts to minimize conflicts between modes of transportation.
Gaston-Cleveland-Lincoln MPO Freight Profile • Existing Conditions
GREATER CH ARLOTTE RE G IONAL FRE IGHT MOB IL ITY PLAN 14
Figure 2.8: Bicycle Routes within the GCLMPO Region
2.2.2 Rail Within the Greater Charlotte Region, there is a combined 1,042 miles of track as listed in Table 2.1
and shown on Figure 2.9. A majority of the track is owned and operated by two Class I railroads,
Norfolk Southern (NS) and CSX Transportation (CSXT). The remainder of the rail line mileage is owned
and operated by seven short line railroads.
Table 2.1: Regional Railroad Ownership
Railroad Owner Miles
Aberdeen Carolina & Western Railway 50.8
Alexander Railroad Company 13.6
Carolina Coastal Railway 13.5
CSXT 335.0
NCDOT 1.0
Norfolk Southern 593.7
Piedmont & Northern Railway 15.5
Winston-Salem Southbound Railway 42.10
Lancaster & Chester 66.8
Others/Unknown 10.0 Source: National Transportation Atlas Database, 2015
Gaston-Cleveland-Lincoln MPO Freight Profile • Existing Conditions
GREATER CH ARLOTTE RE G IONAL FRE IGHT MOB IL ITY PLAN 15
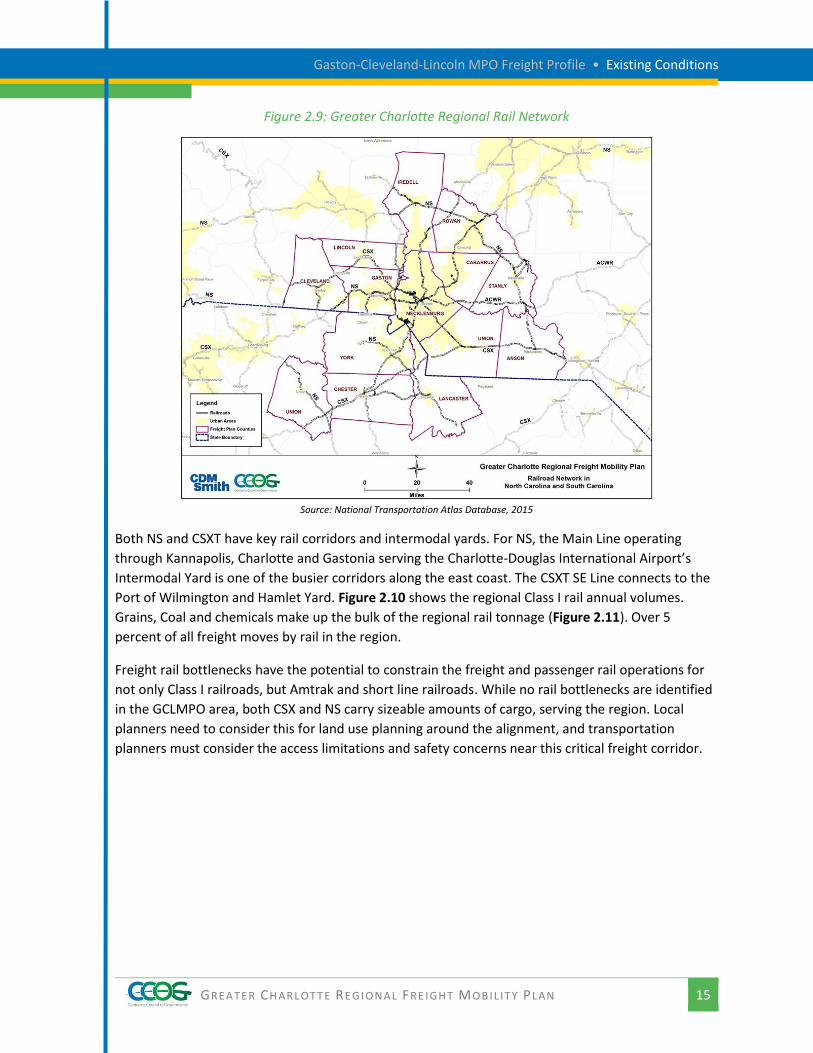
Figure 2.9: Greater Charlotte Regional Rail Network
Source: National Transportation Atlas Database, 2015
Both NS and CSXT have key rail corridors and intermodal yards. For NS, the Main Line operating
through Kannapolis, Charlotte and Gastonia serving the Charlotte-Douglas International Airport’s
Intermodal Yard is one of the busier corridors along the east coast. The CSXT SE Line connects to the
Port of Wilmington and Hamlet Yard. Figure 2.10 shows the regional Class I rail annual volumes.
Grains, Coal and chemicals make up the bulk of the regional rail tonnage (Figure 2.11). Over 5
percent of all freight moves by rail in the region.
Freight rail bottlenecks have the potential to constrain the freight and passenger rail operations for
not only Class I railroads, but Amtrak and short line railroads. While no rail bottlenecks are identified
in the GCLMPO area, both CSX and NS carry sizeable amounts of cargo, serving the region. Local
planners need to consider this for land use planning around the alignment, and transportation
planners must consider the access limitations and safety concerns near this critical freight corridor.
Gaston-Cleveland-Lincoln MPO Freight Profile • Existing Conditions
GREATER CH ARLOTTE RE G IONAL FRE IGHT MOB IL ITY PLAN 16
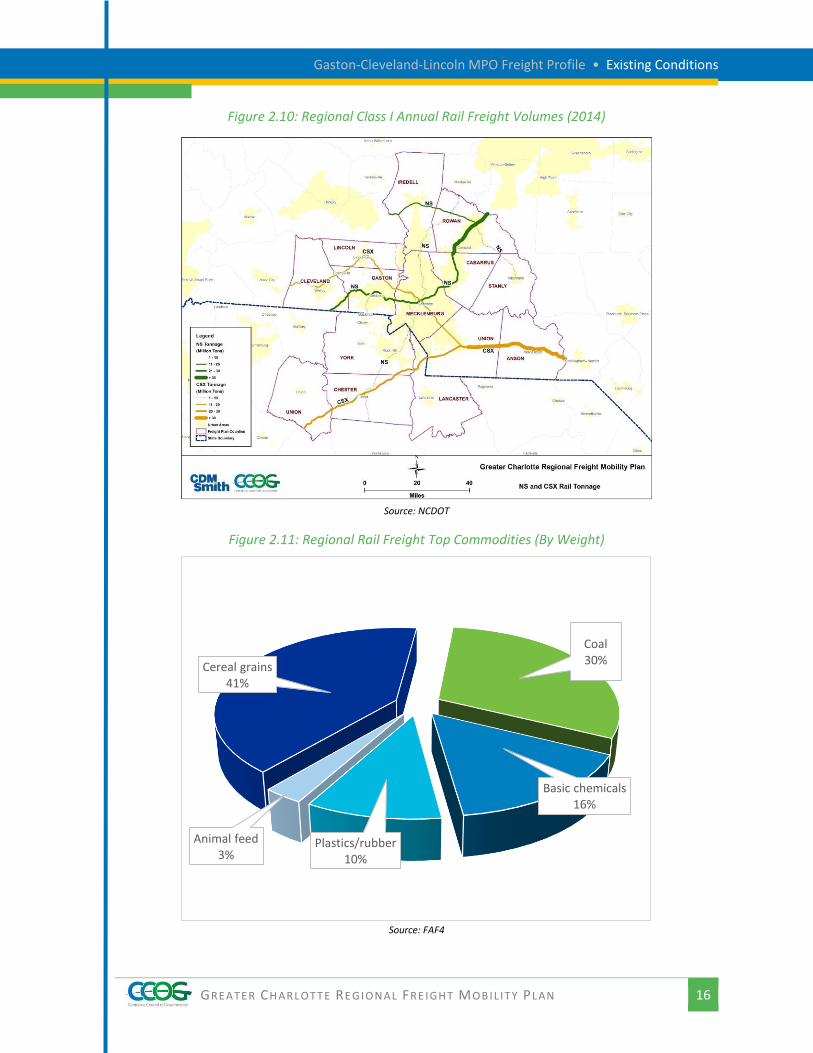
Figure 2.10: Regional Class I Annual Rail Freight Volumes (2014)
Source: NCDOT
Figure 2.11: Regional Rail Freight Top Commodities (By Weight)
Source: FAF4
Cereal grains41%
Coal30%
Basic chemicals16%
Plastics/rubber10%
Animal feed3%
Gaston-Cleveland-Lincoln MPO Freight Profile • Existing Conditions
GREATER CH ARLOTTE RE G IONAL FRE IGHT MOB IL ITY PLAN 17
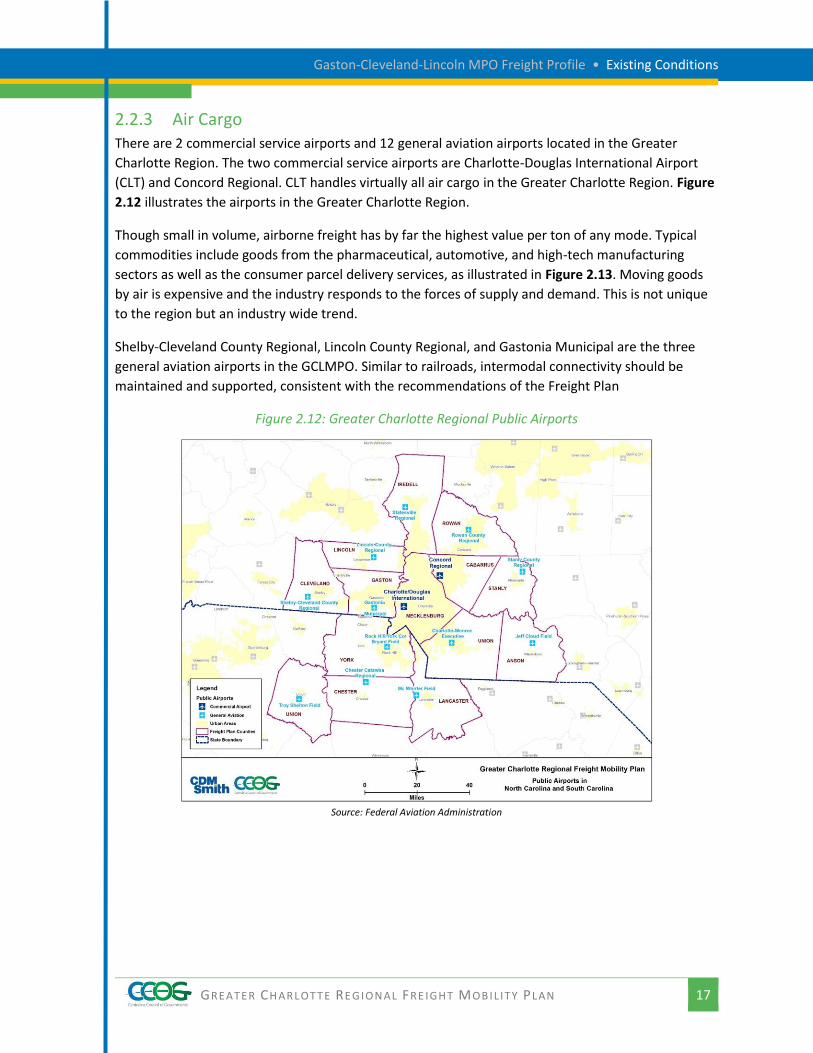
2.2.3 Air Cargo There are 2 commercial service airports and 12 general aviation airports located in the Greater
Charlotte Region. The two commercial service airports are Charlotte-Douglas International Airport
(CLT) and Concord Regional. CLT handles virtually all air cargo in the Greater Charlotte Region. Figure
2.12 illustrates the airports in the Greater Charlotte Region.
Though small in volume, airborne freight has by far the highest value per ton of any mode. Typical
commodities include goods from the pharmaceutical, automotive, and high-tech manufacturing
sectors as well as the consumer parcel delivery services, as illustrated in Figure 2.13. Moving goods
by air is expensive and the industry responds to the forces of supply and demand. This is not unique
to the region but an industry wide trend.
Shelby-Cleveland County Regional, Lincoln County Regional, and Gastonia Municipal are the three
general aviation airports in the GCLMPO. Similar to railroads, intermodal connectivity should be
maintained and supported, consistent with the recommendations of the Freight Plan
Figure 2.12: Greater Charlotte Regional Public Airports
Source: Federal Aviation Administration
Gaston-Cleveland-Lincoln MPO Freight Profile • Existing Conditions
GREATER CH ARLOTTE RE G IONAL FRE IGHT MOB IL ITY PLAN 18
Figure 2.13: Regional Air Cargo Top Commodities (By Value)
Source: FAF4
Precision instruments
32%
Machinery24%
Electronics24%
Pharmaceuticals17%
Articles-base metal
3%
GREATER CH ARLOTTE RE G IONAL FRE IGHT MOB IL ITY PLAN 19
3 FUTURE FREIGHT DEMAND AND LAND USES
For both land use and transportation planners, it is important to understand and quantify travel
demand, or trips generated by different types of land use. The CCOG identified land use
classifications as a part of the CONNECT Our Future planning effort, and those data were utilized in
this analysis on the regional level.
3.1 FREIGHT LAND USE
The freight planning team evaluated land use trends and the relative transportation system. A series
of linear “Corridors” and nodal “Concentrations” were identified for further analysis.
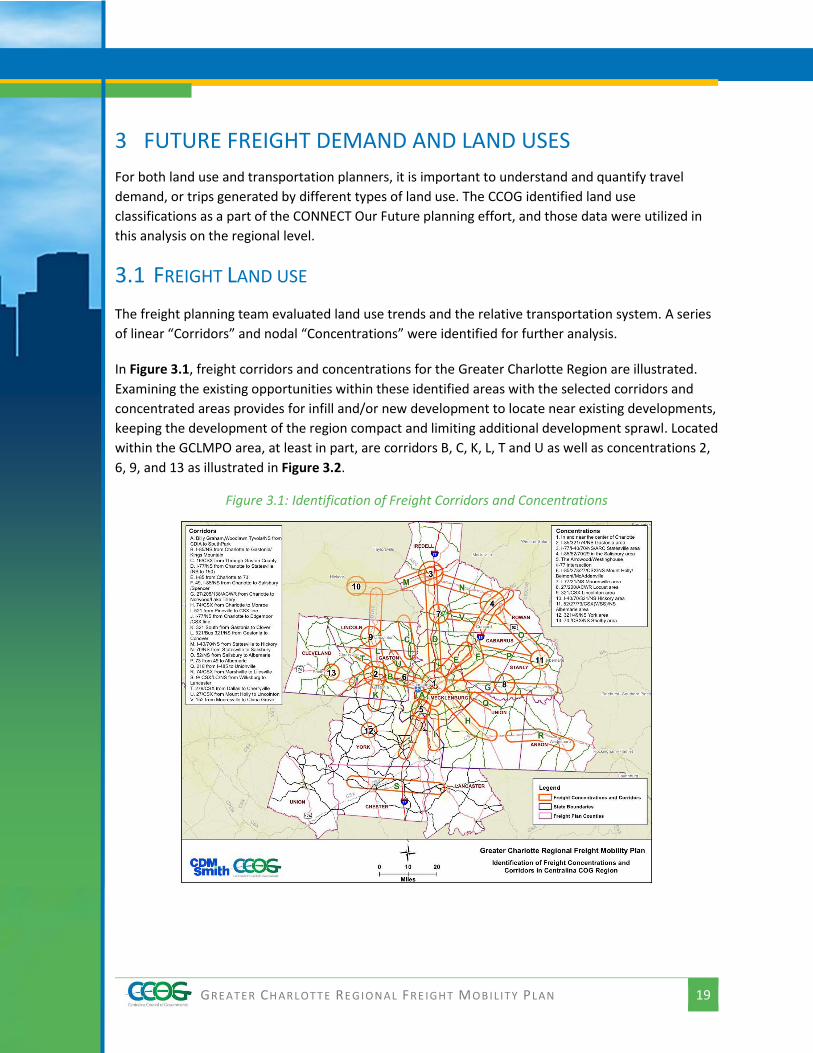
In Figure 3.1, freight corridors and concentrations for the Greater Charlotte Region are illustrated.
Examining the existing opportunities within these identified areas with the selected corridors and
concentrated areas provides for infill and/or new development to locate near existing developments,
keeping the development of the region compact and limiting additional development sprawl. Located
within the GCLMPO area, at least in part, are corridors B, C, K, L, T and U as well as concentrations 2,
6, 9, and 13 as illustrated in Figure 3.2.
Figure 3.1: Identification of Freight Corridors and Concentrations
Gaston-Cleveland-Lincoln MPO Freight Profile • Future Freight Demand
GREATER CH ARLOTTE RE G IONAL FRE IGHT MOB IL ITY PLAN 20
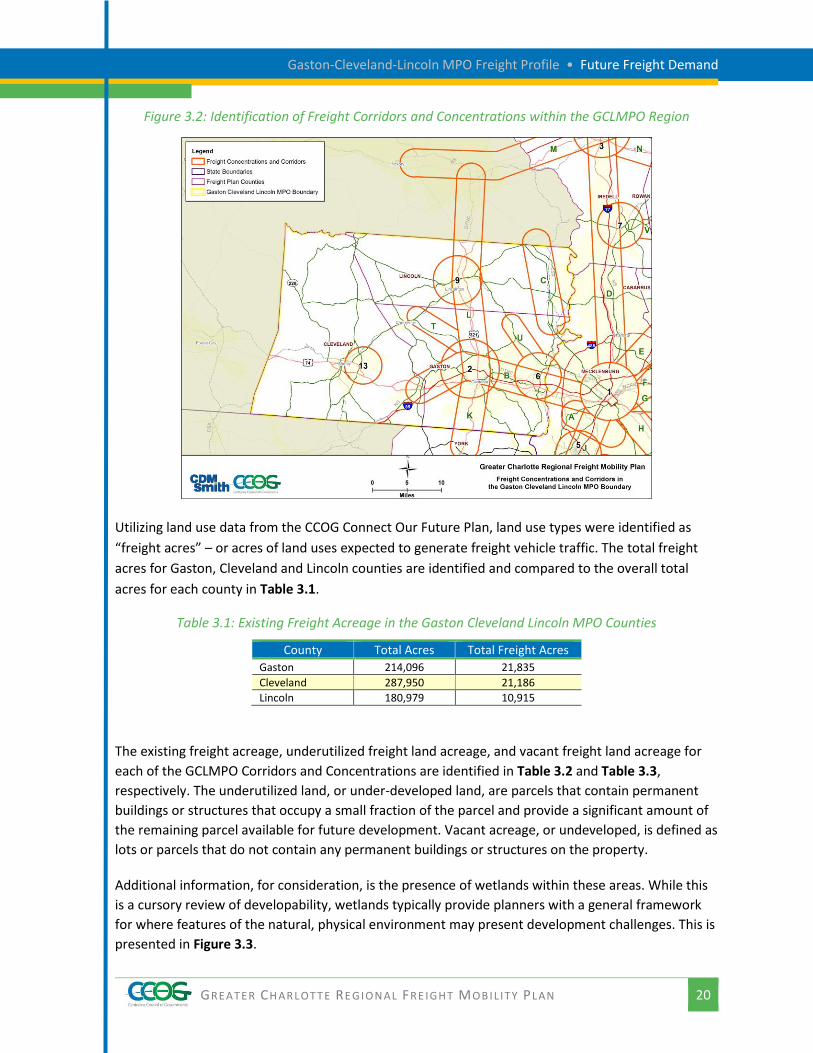
Figure 3.2: Identification of Freight Corridors and Concentrations within the GCLMPO Region
Utilizing land use data from the CCOG Connect Our Future Plan, land use types were identified as
“freight acres” – or acres of land uses expected to generate freight vehicle traffic. The total freight
acres for Gaston, Cleveland and Lincoln counties are identified and compared to the overall total
acres for each county in Table 3.1.
Table 3.1: Existing Freight Acreage in the Gaston Cleveland Lincoln MPO Counties
County Total Acres Total Freight Acres
Gaston 214,096 21,835
Cleveland 287,950 21,186
Lincoln 180,979 10,915
The existing freight acreage, underutilized freight land acreage, and vacant freight land acreage for
each of the GCLMPO Corridors and Concentrations are identified in Table 3.2 and Table 3.3,
respectively. The underutilized land, or under-developed land, are parcels that contain permanent
buildings or structures that occupy a small fraction of the parcel and provide a significant amount of
the remaining parcel available for future development. Vacant acreage, or undeveloped, is defined as
lots or parcels that do not contain any permanent buildings or structures on the property.
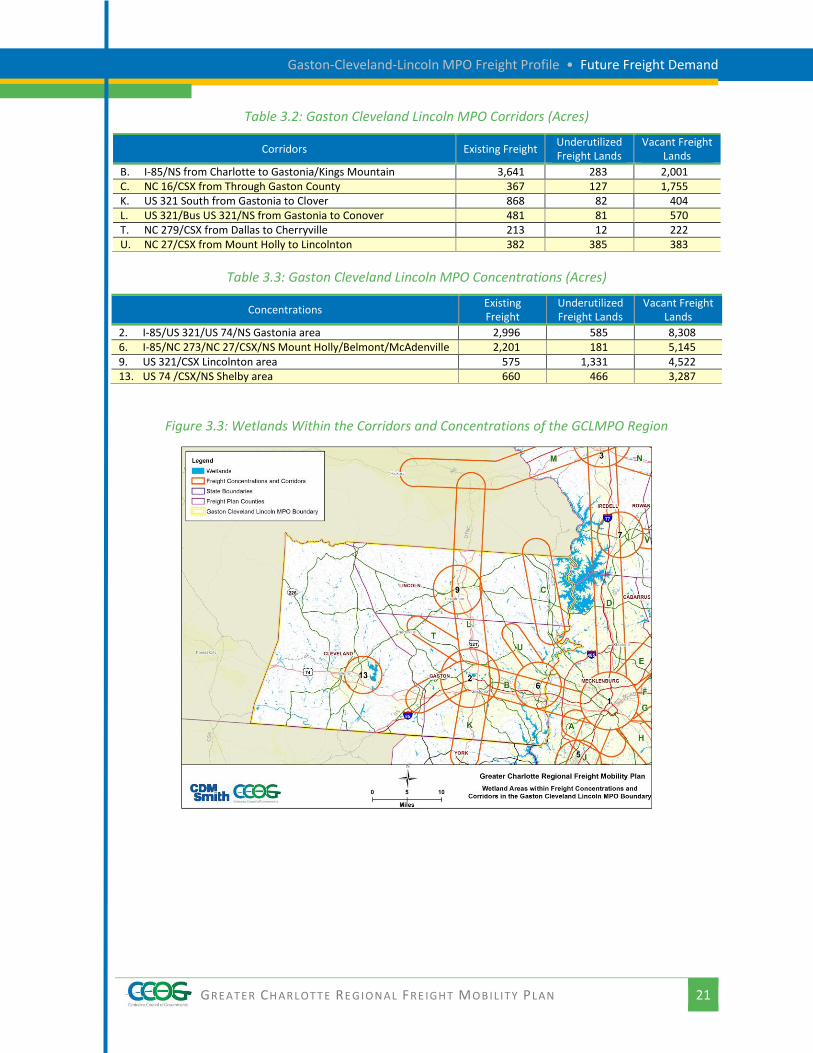
Additional information, for consideration, is the presence of wetlands within these areas. While this
is a cursory review of developability, wetlands typically provide planners with a general framework
for where features of the natural, physical environment may present development challenges. This is
presented in Figure 3.3.
Gaston-Cleveland-Lincoln MPO Freight Profile • Future Freight Demand
GREATER CH ARLOTTE RE G IONAL FRE IGHT MOB IL ITY PLAN 21
Table 3.2: Gaston Cleveland Lincoln MPO Corridors (Acres)
Corridors Existing Freight Underutilized Freight Lands
Vacant Freight Lands
B. I-85/NS from Charlotte to Gastonia/Kings Mountain 3,641 283 2,001 C. NC 16/CSX from Through Gaston County 367 127 1,755 K. US 321 South from Gastonia to Clover 868 82 404 L. US 321/Bus US 321/NS from Gastonia to Conover 481 81 570 T. NC 279/CSX from Dallas to Cherryville 213 12 222 U. NC 27/CSX from Mount Holly to Lincolnton 382 385 383
Table 3.3: Gaston Cleveland Lincoln MPO Concentrations (Acres)
Concentrations Existing Freight
Underutilized Freight Lands
Vacant Freight Lands
2. I-85/US 321/US 74/NS Gastonia area 2,996 585 8,308 6. I-85/NC 273/NC 27/CSX/NS Mount Holly/Belmont/McAdenville 2,201 181 5,145 9. US 321/CSX Lincolnton area 575 1,331 4,522 13. US 74 /CSX/NS Shelby area 660 466 3,287
Figure 3.3: Wetlands Within the Corridors and Concentrations of the GCLMPO Region
Gaston-Cleveland-Lincoln MPO Freight Profile • Future Freight Demand
GREATER CH ARLOTTE RE G IONAL FRE IGHT MOB IL ITY PLAN 22
3.2 FUTURE REGIONAL COMMODITY FLOWS This section provides a summary of the freight flow forecasts for goods moving to, from, and within
the Greater Charlotte Bi-State region by domestic mode and commodity type.
Total freight tonnage from, to and within the Charlotte region is projected to increase 35
percent from 2015 to 2045, or at a compound annual growth rate of 1.1 percent per year. In
2015 about 95 percent of total freight tons were domestic and these volumes are projected
to grow by 30 percent.
While they represent a small share of total volumes in 2015 foreign freight flows are
expected to grow faster than domestic freight with imports more than doubling and exports
tripling from 2015 to 2045.
Total freight value growth of 79 percent is expected to be more than double growth in tons,
reflecting higher volume growth for high-value products compared to that of low-valued
products.
Freight flows moving within the Charlotte region are predominantly transported by truck; are
much less than inbound or outbound flows in terms of tonnage or value; and are expected to
grow more slowly, at 17 percent for tons and 48 percent for value over the forecast period.
Inbound freight tonnage in 2015 through 2045 is larger than outbound freight due to natural
gas transported into the region by pipeline. However, trucking is the largest mode of
transportation for both inbound and outbound flows for both tons and value, and for this
large segment of freight, outbound volumes exceed inbound from 2015 through 2045.
Freight transported by air represents a small portion of tons moved inbound or outbound
from the Charlotte region, but it is expected to be the largest mode in terms of growth in
value, 176 percent growth in inbound value from 2015 to 2045 and 350 percent growth in
outbound value over that period. Top product groups transported by air include electronics,
machinery, pharmaceuticals, precision instruments and chemical products.
The strongest directional growth is outbound shipping by value, which doubles over the
forecast period. Driven by increases in such commodities as machinery, electronics, and
pharmaceuticals, this is a very positive indicator for the regional economy.
Origins of inbound freight and destinations of outbound freight are concentrated in North
Carolina, South Carolina, Virginia and Georgia. The concentrations in these four states are
especially high for tonnage since heavier and lower-valued commodities tend to be
transported shorter distances.
GREATER CH ARLOTTE RE G IONAL FRE IGHT MOB IL ITY PLAN 23
4 RECOMMENDATIONS OF THE FREIGHT PLAN
A series of recommendations were produced for the Freight Plan. One of the key results of the
Greater Charlotte Regional Freight Mobility Plan was the identification of recommended policies,
programs, and projects that could be implemented in the region to facilitate the movement of
freight. These recommendations were identified throughout the planning process and originate from
three primary sources; 1) the needs analysis, 2) stakeholder engagement, and 3) a review of best
practices in freight planning.
4.1 PRIORITIZED PROJECTS The recommendations most relevant to the GCLMPO portion of the regional network have been
identified and are provided in the following sections. The recommendations of the Freight Plan in
their entirety can be found in the Final Plan, Appendix G – Recommendations. The projects and
policies in the Freight Plan are defined based on the three freight relevance categories and then
prioritized. The prioritization framework is intended to guide future investments. Funding availability,
environmental restrictions, political considerations, and other relevant factors influenced the
rankings. Reinforcing the intention of this serving as a guiding document, not a funded programmatic
transportation plan, prioritization is represented by graphical pie charts, not numeric scoring or
ranking. As such, these recommendations are provided for consideration within the GCLMPO region.
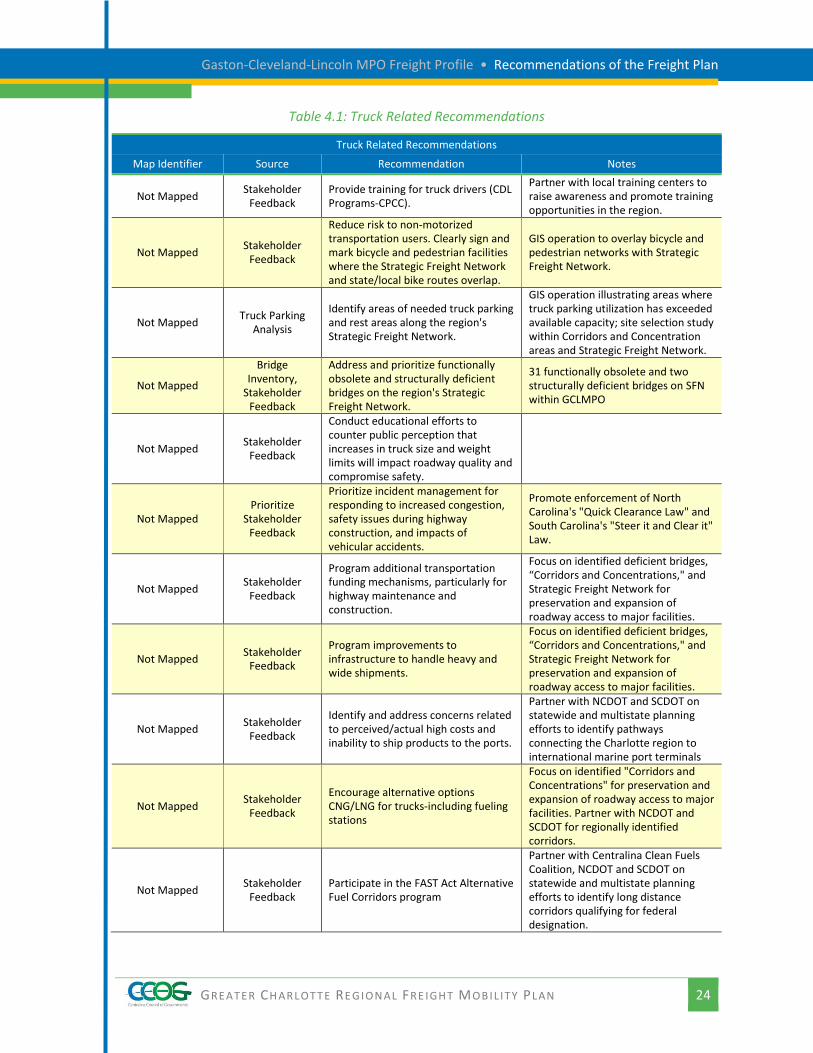
4.1.1 Trucking Related Recommendations Trucking related recommendations are focused on the mobility and safety of truck activity in the
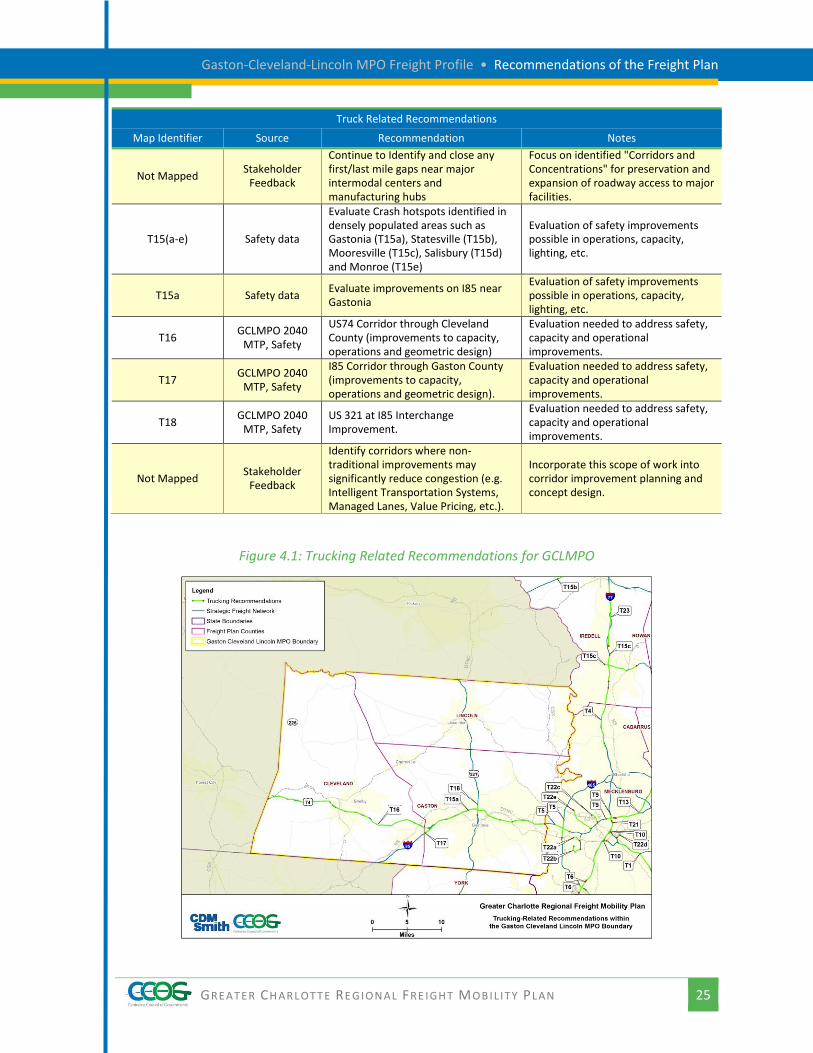
GCLMPO area. These recommendations, listed in Table 4.1 and illustrated in Figure 4.1, have the
potential to benefit other modes of transport but are primarily truck-focused. For those
recommendations that are location-specific, a mapping identifier is included in the table. Those that
are not site specific are listed as “Not Mapped.” The “Source” of the recommendations provides
insight as to how the recommendations were identified in the Freight Plan development.
Infrastructure improvements are recommended in several locations within GCLMPO. These are
primarily sections of highways on the SFN that have been identified at commercial vehicle safety
hotspots. While safety, alone, is not typically a reason for a major infrastructure investment, these
recommendations are for further evaluation of the causes of accidents, review of pavement
conditions and evaluation of operational of capacity improvements that may improve the overall
performance of the freight network.
Listed as “Not Mapped” because they are not individually labeled are the 31 functionally obsolete
and two structurally deficient bridges on the SFN within the GCLMPO. The recommendation is to
address and prioritize functionally obsolete and structurally deficient bridges on the region's SFN to
preserve the infrastructure of the freight network.
Gaston-Cleveland-Lincoln MPO Freight Profile • Recommendations of the Freight Plan
GREATER CH ARLOTTE RE G IONAL FRE IGHT MOB IL ITY PLAN 24
Table 4.1: Truck Related Recommendations
Truck Related Recommendations
Map Identifier Source Recommendation Notes
Not Mapped Stakeholder
Feedback Provide training for truck drivers (CDL Programs-CPCC).
Partner with local training centers to raise awareness and promote training opportunities in the region.
Not Mapped Stakeholder
Feedback
Reduce risk to non-motorized transportation users. Clearly sign and mark bicycle and pedestrian facilities where the Strategic Freight Network and state/local bike routes overlap.
GIS operation to overlay bicycle and pedestrian networks with Strategic Freight Network.
Not Mapped Truck Parking
Analysis
Identify areas of needed truck parking and rest areas along the region's Strategic Freight Network.
GIS operation illustrating areas where truck parking utilization has exceeded available capacity; site selection study within Corridors and Concentration areas and Strategic Freight Network.
Not Mapped
Bridge Inventory,
Stakeholder Feedback
Address and prioritize functionally obsolete and structurally deficient bridges on the region's Strategic Freight Network.
31 functionally obsolete and two structurally deficient bridges on SFN within GCLMPO
Not Mapped Stakeholder
Feedback
Conduct educational efforts to counter public perception that increases in truck size and weight limits will impact roadway quality and compromise safety.
Not Mapped Prioritize
Stakeholder Feedback
Prioritize incident management for responding to increased congestion, safety issues during highway construction, and impacts of vehicular accidents.
Promote enforcement of North Carolina's "Quick Clearance Law" and South Carolina's "Steer it and Clear it" Law.
Not Mapped Stakeholder
Feedback
Program additional transportation funding mechanisms, particularly for highway maintenance and construction.
Focus on identified deficient bridges, “Corridors and Concentrations," and Strategic Freight Network for preservation and expansion of roadway access to major facilities.
Not Mapped Stakeholder
Feedback
Program improvements to infrastructure to handle heavy and wide shipments.
Focus on identified deficient bridges, “Corridors and Concentrations," and Strategic Freight Network for preservation and expansion of roadway access to major facilities.
Not Mapped Stakeholder
Feedback
Identify and address concerns related to perceived/actual high costs and inability to ship products to the ports.
Partner with NCDOT and SCDOT on statewide and multistate planning efforts to identify pathways connecting the Charlotte region to international marine port terminals
Not Mapped Stakeholder
Feedback
Encourage alternative options CNG/LNG for trucks-including fueling stations
Focus on identified "Corridors and Concentrations" for preservation and expansion of roadway access to major facilities. Partner with NCDOT and SCDOT for regionally identified corridors.
Not Mapped Stakeholder
Feedback Participate in the FAST Act Alternative Fuel Corridors program
Partner with Centralina Clean Fuels Coalition, NCDOT and SCDOT on statewide and multistate planning efforts to identify long distance corridors qualifying for federal designation.
Gaston-Cleveland-Lincoln MPO Freight Profile • Recommendations of the Freight Plan
GREATER CH ARLOTTE RE G IONAL FRE IGHT MOB IL ITY PLAN 25
Truck Related Recommendations
Map Identifier Source Recommendation Notes
Not Mapped Stakeholder
Feedback
Continue to Identify and close any first/last mile gaps near major intermodal centers and manufacturing hubs
Focus on identified "Corridors and Concentrations" for preservation and expansion of roadway access to major facilities.
T15(a-e) Safety data
Evaluate Crash hotspots identified in densely populated areas such as Gastonia (T15a), Statesville (T15b), Mooresville (T15c), Salisbury (T15d) and Monroe (T15e)
Evaluation of safety improvements possible in operations, capacity, lighting, etc.
T15a Safety data Evaluate improvements on I85 near Gastonia
Evaluation of safety improvements possible in operations, capacity, lighting, etc.
T16 GCLMPO 2040
MTP, Safety
US74 Corridor through Cleveland County (improvements to capacity, operations and geometric design)
Evaluation needed to address safety, capacity and operational improvements.
T17 GCLMPO 2040
MTP, Safety
I85 Corridor through Gaston County (improvements to capacity, operations and geometric design).
Evaluation needed to address safety, capacity and operational improvements.
T18 GCLMPO 2040
MTP, Safety US 321 at I85 Interchange Improvement.
Evaluation needed to address safety, capacity and operational improvements.
Not Mapped Stakeholder
Feedback
Identify corridors where non-traditional improvements may significantly reduce congestion (e.g. Intelligent Transportation Systems, Managed Lanes, Value Pricing, etc.).
Incorporate this scope of work into corridor improvement planning and concept design.
Figure 4.1: Trucking Related Recommendations for GCLMPO

Gaston-Cleveland-Lincoln MPO Freight Profile • Recommendations of the Freight Plan
GREATER CH ARLOTTE RE G IONAL FRE IGHT MOB IL ITY PLAN 26
4.1.2 Rail Related Recommendations Rail related recommendations are focused on the mobility and safety of rail based activity in the
study area. These recommendations, presented in Table 4.2, have the potential to benefit other
modes of transport but are primarily railroad-focused.
Table 4.2: Rail Related Recommendations
Rail Related Recommendations
Map Identifier Source Recommendation Notes
Not Mapped Stakeholder
Feedback Greater Charlotte Region Traffic Separation Studies (TSS).
At-grade rail crossing studies (TSS): A TSS will evaluate the need for improving the rail at-grade crossings’ warning systems or reducing and eliminating at-grade crossing to address potential safety conflicts; thus allowing partnerships with the railroads to prioritize grade crossing improvements.
Not Mapped Stakeholder
Feedback
Partner with the development community to identify and find solutions for existing or forecast terminal capacity constraints. Support efficient transfer of bulk commodities such as grain, coal, oil, etc. requires adequate intermodal operations capacity to move goods from production to consumption markets.
Working with the Class I railroads and local stakeholders in ensuring programs and policies are developed to ensure improved operation efficiencies.
Not Mapped Stakeholder
Feedback
Support an effort to improve the ability of short line railroads to accommodate 286,000 lb. standard rail cars.
Work with Class I and shortline railroads in changing the weight limits and identifying funding sources to assist in shortline railroads to upgrade rails.
Not Mapped Stakeholder
Feedback
Support opportunities for Intermodal terminal development and multimodal diversity.
This includes working with the Class I railroads and local stakeholders to ensure programs and policies are developed to ensure improved operation efficiencies.
Not Mapped Stakeholder
Feedback Retain existing rail corridors and halt track removal.
By ensuring rail corridors stay intact and that adding, not reducing, track improves the efficiency of freight movements on rail, reducing the dependency on long-haul trucking movements.
Not Mapped Stakeholder
Feedback Continue direct support for short-line railroad infrastructure improvements.
Short-line railroads provide local transportation options to industries, thus improves local economic benefits.
Not Mapped Stakeholder
Feedback
Explore routing options for hazardous materials shipments to avoid highly populated areas.
By utilizing rail to transport hazardous materials reduces the dependency on long-haul trucking movements and reduces safety hazards along heavily congested urban areas and networks.
Not Mapped Stakeholder
Feedback
Expand capacity in high-use rail corridors, including the expansion into double/triple track configurations.
Not Mapped Stakeholder
Feedback Raise awareness of environmental justice concerns in rail expansions
Implement policies that require NEPA evaluations for mitigating the impacts to EJ communities on new rail corridors, as well as rail corridor improvements.
Not Mapped Stakeholder
Feedback Create rail-focused business parks.
By creating rail-focused business parks, truck and freight movements can be centralized and increase the opportunity for intermodal movements.
Gaston-Cleveland-Lincoln MPO Freight Profile • Recommendations of the Freight Plan
GREATER CH ARLOTTE RE G IONAL FRE IGHT MOB IL ITY PLAN 27
4.2 FUNDING STRATEGIES
4.2.1 FAST Act Signed into law on December 4, 2015, the FAST Act provides updated federal guidance for
transportation funding, including freight planning and investment. The FAST Act requires the
development of a National Freight Strategic Plan, which includes mechanisms to monitor the
conditions and performance of the national freight system.
The new bill increases overall transportation funding by 11 percent over five years, while providing a
dedicated source of Federal funding for freight projects, including multimodal projects by
establishing both formula and discretionary grant programs to fund projects that would benefit
freight movements. Discretionary funding totaling $4.5 billion over the next five years is included in
the bill, and is eligible to States, MPOs, local governments, special purpose districts, and public
authorities – including port authorities. An estimated 90 percent of the $6.3 billion in formula funds
in the new freight program will be used for highway projects, leaving up to 10 percent for other
modes (ports, railroads, intelligent transportation systems, or better demand management).
Examples of Federal Grant and Loan Programs which are included in the FAST Act:
TIGER Discretionary Grants
Congestion Mitigation and Air Quality (CMAQ) program
Federal Rail Safety Improvement Act of 2008
Rail Line Relocation and Improvement Capital Grant Program
Transportation Infrastructure Finance and Innovation Act (TIFIA)
The Railroad Rehabilitation and Improvement Financing Program
Section 45G Track Rehabilitation Tax Credit
Airport Improvement Program (AIP)
4.2.2 State Funding Sources North Carolina utilizes a variety of revenue sources to build their 10-year State Transportation
Improvement Program (STIP). These sources include the state gas tax, the federal fuel tax share, the
Highway Use Tax and DMV fees. These sources do not provide enough revenue to meet North
Carolina’s high levels of growth and demand for infrastructure. All of these revenue sources
combined (including the new Strategic Transportation Investments) are only adequate to fund 1 in 5
of the 3,100 projects submitted for the last STIP update. To help meet these needs the state is
pursuing alternative funding solutions, such as public private partnerships and bond programs.
Governor McCrory has proposed two bonds of approximately $1.4 billion. One would be used for
roads and the other for other types of public infrastructure.
4.2.2.1 NCDOT – Strategic Transportation Investments law (STI)
In 2013, the Strategic Transportation Investments law (STI) was passed by the North Carolina legislature which provides more funding flexibility to the NCDOT. In addition, the STI also establishes the Strategic Mobility Formula, which is on data-driven scoring and local input. It was used for the

Gaston-Cleveland-Lincoln MPO Freight Profile • Recommendations of the Freight Plan
GREATER CH ARLOTTE RE G IONAL FRE IGHT MOB IL ITY PLAN 28
first time to develop NCDOT's current construction schedule, the 2016-2025 STIP.
https://www.ncdot.gov/strategictransportationinvestments/
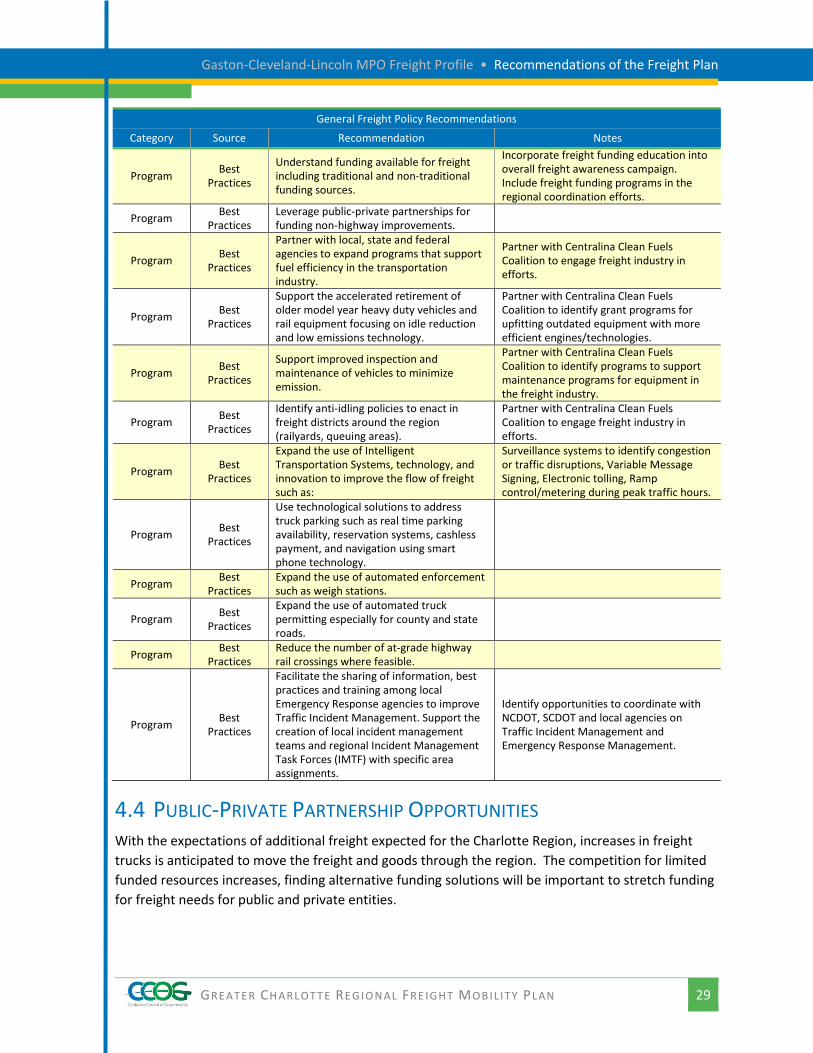
4.3 POLICY RECOMMENDATIONS In conjunction with the freight infrastructure improvement recommendations, the freight policy
recommendations will provide guidance in the maintenance and investment of the freight
infrastructure and movement of freight and goods in the GCLMPO. A list of freight policy
recommendations area provided in Table 4.3.
Table 4.3: General Freight Policy Recommendations
General Freight Policy Recommendations
Category Source Recommendation Notes
Program Stakeholder Input, Best Practices
CCOG and planning partners should continue to work with multi-state partners to make corridor-wide system decisions.
Program Stakeholder Input, Best Practices
Establish “logistics villages” within the greater Charlotte region.
The goal of logistics villages is to help increase economic activity and transportation efficiency at these sites, such as access between intermodal and private distribution centers, rest and parking areas for drivers, and fixing choke points and bottlenecks. This is an opportunity for Public Private Partnership.
Program Stakeholder
Input
Increase and/or raise awareness of training opportunities for careers in logistics and transportation.
Partner with local technical training programs and colleges to promote training opportunities.
Program Stakeholder
Input
Develop local transportation plans for areas adjacent to freight intermodal facilities.
Incorporate freight related transportation needs into planning efforts for freight related land use development plans. This includes traffic impact analyses and necessary modal access.
Program Stakeholder
Input
Prioritize intermodal connection projects, as these projects are often the most conduc ive to reducing overall supply chain costs.
This should be used to inform MPO/TPO planning partners of the prioritization of intermodal connectivity in transportation planning.
Program Stakeholder
Input
Develop a freight network resiliency plan. This plan would help bring freight dependent industries back online after an emergency event and would assist with hurricane relief efforts. This plan should be developed with local or state homeland security partners.
Program Stakeholder
Input
Create a commercial vehicle crash database. Extract commercial vehicle crash data from the statewide database to identify patterns or particular situations to address.
Data compiled in development of the Freight Plan; identify staff resources to maintain and provide data for interested parties
Program Best
Practices
Ensure freight representation and participation by private sector in the MPO planning processes.
Program Stakeholder Input, Best Practices
Prioritize projects designed to improve freight mobility and eliminate freight bottlenecks.
Gaston-Cleveland-Lincoln MPO Freight Profile • Recommendations of the Freight Plan
GREATER CH ARLOTTE RE G IONAL FRE IGHT MOB IL ITY PLAN 29
General Freight Policy Recommendations
Category Source Recommendation Notes
Program Best
Practices
Understand funding available for freight including traditional and non-traditional funding sources.
Incorporate freight funding education into overall freight awareness campaign. Include freight funding programs in the regional coordination efforts.
Program Best
Practices Leverage public-private partnerships for funding non-highway improvements.
Program Best
Practices
Partner with local, state and federal agencies to expand programs that support fuel efficiency in the transportation industry.
Partner with Centralina Clean Fuels Coalition to engage freight industry in efforts.
Program Best
Practices
Support the accelerated retirement of older model year heavy duty vehicles and rail equipment focusing on idle reduction and low emissions technology.
Partner with Centralina Clean Fuels Coalition to identify grant programs for upfitting outdated equipment with more efficient engines/technologies.
Program Best
Practices
Support improved inspection and maintenance of vehicles to minimize emission.
Partner with Centralina Clean Fuels Coalition to identify programs to support maintenance programs for equipment in the freight industry.
Program Best
Practices
Identify anti-idling policies to enact in freight districts around the region (railyards, queuing areas).
Partner with Centralina Clean Fuels Coalition to engage freight industry in efforts.
Program Best
Practices
Expand the use of Intelligent Transportation Systems, technology, and innovation to improve the flow of freight such as:
Surveillance systems to identify congestion or traffic disruptions, Variable Message Signing, Electronic tolling, Ramp control/metering during peak traffic hours.
Program Best
Practices
Use technological solutions to address truck parking such as real time parking availability, reservation systems, cashless payment, and navigation using smart phone technology.
Program Best
Practices Expand the use of automated enforcement such as weigh stations.
Program Best
Practices
Expand the use of automated truck permitting especially for county and state roads.
Program Best
Practices Reduce the number of at-grade highway rail crossings where feasible.
Program Best
Practices
Facilitate the sharing of information, best practices and training among local Emergency Response agencies to improve Traffic Incident Management. Support the creation of local incident management teams and regional Incident Management Task Forces (IMTF) with specific area assignments.
Identify opportunities to coordinate with NCDOT, SCDOT and local agencies on Traffic Incident Management and Emergency Response Management.
4.4 PUBLIC-PRIVATE PARTNERSHIP OPPORTUNITIES With the expectations of additional freight expected for the Charlotte Region, increases in freight
trucks is anticipated to move the freight and goods through the region. The competition for limited
funded resources increases, finding alternative funding solutions will be important to stretch funding
for freight needs for public and private entities.
Gaston-Cleveland-Lincoln MPO Freight Profile • Recommendations of the Freight Plan
GREATER CH ARLOTTE RE G IONAL FRE IGHT MOB IL ITY PLAN 30
4.4.1 Truck Parking As more freight trucks travel on the freight network, constructing safe rest areas to accommodate
freight truck parking. Public agency partners should work with private fleet owners identifying
vehicle parking trends of drivers. Offering a safe environment for truck parking, while reducing the
negative impact from truck parking on private property and roadway shoulders. Communication of
available parking at public and private truck parking sites should be provided via ITS technology or
other connected technologies to communicate with truck drivers about parking availability.
4.4.2 Truck Data Target opportunities to share freight data between public agencies and private industries which
benefit both entities by providing public agencies with travel movement and volumes, while
providing the public infrastructure most utilized by private fleets priority for public investments.
Detecting freight related movements between private and public to prioritize investments on the
freight transportation network. Public agencies should continue to investigate data technologies and
coordinate with private data providers for data sharing opportunities.
Benefits to sharing data include:
Data to enhance and validate regional and state travel demand models;
Data to calibrate freight trip lengths in travel demand models; and,
Potential for enhancing performance measures.