r e v i e w o f e n e r g y e f f i c i e n c y a c t i v ...€¦ · 800 900 1000 watts time power...
TRANSCRIPT

R E V I E W O F E N E R G Y E F F I C I E N C Y A C T I V I T I E S U N D E R T H E S A R E E S S C H E M E
R Final Report, Prepared for DSD by EES, BA and Common Capital, July 2014 i
Review of Residential Energy Efficiency Activities under the SA REES Scheme
July 2014
Prepared for the
Department of State
Development, South
Australia
Prepared by Energy Efficient Strategies
Beletich and Associates and Common Capital
0
100
200
300
400
500
600
700
800
900
1000
Ave
rage
Wat
ts
Time
Power 2
Power 1
Oven
Light 2
Light 1

R E V I E W O F E N E R G Y E F F I C I E N C Y A C T I V I T I E S U N D E R T H E S A R E E S S C H E M E
R Final Report, Prepared for DSD by EES, BA and Common Capital, July 2014 2
Review of Residential Energy Efficiency Activities under the SA REES Scheme Report prepared for: Department of State Development, South Australia Report Authors: Lloyd Harrington, Energy Efficient Strategies Robert Foster, Energy Efficient Strategies Jack Brown, Energy Efficient Strategies Steven Beletich, Beletich Associates Henry Adams, Common Capital Final Report, 4 July 2014 Disclaimer:
The views, conclusions and recommendations expressed in this report are those of Energy Efficient Strategies, Beletich Associates and Common Capital. While the authors have taken every care to accurately report and analyse a range of data used in this report, the authors are not responsible for the source data, nor for any use or misuse of any data or information provided in this report, nor any loss arising from the use of this data. The scope of work for this project and our expertise are in energy savings. Some activities may require installation of complex equipment. Some activities are undertaken in difficult circumstances. While the authors have taken due care to review and nominate specifications on safety, DSD and ESCOSA should seek advice from the appropriate SA Government departments on the safety and EMC requirements that should apply to each activity, including products and their installation. The authors take no responsibility for operational decisions on issues regarding product safety and occupational health and safety matters within REES.
Project leaders: Energy Efficient Strategies, PO Box 515, Warragul VIC 3820 Telephone: (03) 5626 6333 www.energyefficient.com.au

R E V I E W O F E N E R G Y E F F I C I E N C Y A C T I V I T I E S U N D E R T H E S A R E E S S C H E M E
R Final Report, Prepared for DSD by EES, BA and Common Capital, July 2014 3
Contents Appendix 2 - Technical Assessments 4
Installation of insulation in an uninsulated ceiling - BS1A 5
Installation of (top up) ceiling insulation - BS1B 16
Installation of insulation to an external wall - BS1C 26
Installation of insulation to floors - BS1D 36
Building Sealing Activities (Various) - BS2 44
Replace an inefficient window with a thermal efficient window – BS3A 58
Secondary Glazing Retrofit - BS3B 67
Install Heating and Cooling Systems - HC1, HC2A, HC2B 78
Install Efficient New Ductwork - HC3A 106
Replace ductwork with an enhanced ductwork system - HC3B 118
Replace or upgrade water heater - WH1 129
Replace an inefficient showerhead with an efficient showerhead - WH2 144
Install CFL or LED general purpose lamp - L1 160
Install LED Down-light Lamp or LED Down-light Luminaire - L2 174
Replace Halogen Floodlight Luminaire - L3 187
Replace Linear Fluorescent Luminaire - L4 193
Standby Power Controllers - SPC1 & SPC2 200
Purchase a High Efficiency Appliances - APP1 226
Remove and destroy an unwanted household refrigerator or freezer - APP2 272
Installation of a High Efficiency Pool Pump - APP3 290
Aggregate Metered Baseline Method (AMB) 304
Appendix 3 - Thermal Modelling Method 321
Appendix 4 - Water Heater Modelling Method 337

R E V I E W O F E N E R G Y E F F I C I E N C Y A C T I V I T I E S U N D E R T H E S A R E E S S C H E M E
R Final Report, Prepared for DSD by EES, BA and Common Capital, July 2014 4
Appendix 2 - Technical Assessments
Appendix 2 includes the full –Technical Assessments for all the activities reviewed as part of this report. It includes detailed assessment of current requirements (where applicable), review of comparable interstate requirements, market and technical analysis of each activity, assessment against the proposed new ministerial protocols and detailed proposals for revised requirements for each activity. At the conclusion of each technical assessment there is a proposed set of draft specifications for each activity analysed. These draft specifications draw on:
The contents of current specifications (where they exist)
The approaches used in other jurisdictions in relation to specification of activities with a view to ensuring the specifications are as robust as possible and that they align as far as possible with approaches taken in other jurisdictions
The results of the technical analysis undertaken in this study, particularly the default savings factors determined in this study.
Appendix 3 Thermal Modelling Method – this appendix sets out in more detail the thermal performance modelling methodology used to support the analysis for building shell and space conditioning related activities. Appendix 4 Water Heater Modelling Method – this appendix sets out in more detail some of the detailed water heater modelling used to support the analysis for water heaters.

R E V I E W O F E N E R G Y E F F I C I E N C Y A C T I V I T I E S U N D E R T H E S A R E E S S C H E M E
R Final Report, Prepared for DSD by EES, BA and Common Capital, July 2014 5
Installation of insulation in an uninsulated ceiling - BS1A
Technical Assessment – BS1A
Installation of insulation in a ceiling area which has not been previously insulated
REES Activity Reference: BS1A REES Activity title: Install ceiling insulation Target: Improved building shell thermal performance Savings: Activity saves energy indirectly by reducing thermal loads on space conditioning equipment Pre-conditions: No pre-existing ceiling insulation

R E V I E W O F E N E R G Y E F F I C I E N C Y A C T I V I T I E S U N D E R T H E S A R E E S S C H E M E
R Final Report, Prepared for DSD by EES, BA and Common Capital, July 2014 6
Scheme Review – REES CURRENT REES ACTIVITY DESCRIPTION This activity currently forms part of the REES scheme code1 . The current summary description within the REES scheme code is as follows: “Installation of insulation in the ceiling area above living or habitable space, which has not been previously insulated” The activity involves the installation of minimum R3.5 insulation product to a ceiling area (or part of a ceiling area) which is “above a living or habitable space”, and which has not been previously insulated. This excludes topping up existing insulation (that is, installing insulation on top of existing insulation). The specification does not define the terms “a living or habitable space”. This activity currently attracts a deemed CO2-e value of 0.2 tonnes of CO2-e. . PROPOSED REES ACTIVITY DESCRIPTION The proposed activity is fundamentally unchanged, that is: “Installation of ceiling insulation in an uninsulated ceiling space above a habitable room” The activity now includes for two different levels of insulation (and default savings factors) depending upon the BCA climate zone location (either zones 4 & 5 or zone 6). Furthermore, all habitable rooms that are practical to insulate are required to be insulated. KEY SPECIFICATION CHANGES The proposed key specification changes from the current REES activity description are as follows:
The terms “habitable room”, “ceiling” and “uninsulated ceiling space” are now defined terms
The requirement is to insulate all habitable rooms that are practical to insulate (the NSW scheme required 95% of the ceiling to be insulated)
The NSW scheme requires that “There must be no existing roof or ceiling insulation present in the ceiling space”. This provision however would appear to limit the flexibility of the scheme (eg a dwelling with only half of its ceiling insulated could not have the remaining half insulated under this provision). In this case the provision used in Victoria and ACT has been adopted ie a minimum of 20m2 must be insulated under this activity
Two insulation options are proposed for this activity (R3.5 and R5.0) on the basis that this aligns with the arrangements under the NSW scheme (based on BCA climate zones). R3.5 shall apply to BCA climate zones 4 & 5 and R5.0 shall apply to BCA climate zone 6
The latest (draft version) of AS3999 (2014) is proposed to be cited as it is assumed to have come into force by the time the proposed new REES specifications are published. In particular this new standard covers off on safety, pre-inspection and risk assessment procedures, electrical safety provisions and provisions for limiting moisture ingress.
1 RESIDENTIAL ENERGY EFFICIENCY SCHEME CODE REESC/07 February 2014

R E V I E W O F E N E R G Y E F F I C I E N C Y A C T I V I T I E S U N D E R T H E S A R E E S S C H E M E
R Final Report, Prepared for DSD by EES, BA and Common Capital, July 2014 7
Scheme Review – Other jurisdictions The following jurisdictions also include a ceiling insulation activity within their schemes:
Victoria (VEET schedule No 11 – Ceiling Insulation2)
NSW (ESS activity No D6 - Install ceiling insulation in an uninsulated ceiling space)
Table 1 below provides a comparison of the key elements of each jurisdictions ceiling insulation installation scheme.
Scheme Review - Potential of the activity (overview) The activity involves the installation of ceiling insulation to previously uninsulated ceiling spaces. Insulation fundamentally acts to reduce the rate of heat flow from areas of higher temperature (e.g. the heated interior of a dwelling) to areas of lower temperature (e.g. the exterior of a dwelling during a cold winter’s day). By limiting such heat flows, either out of a building in the winter or into the building in the summer it is possible to reduce the need for space conditioning (i.e. energy) as a means of maintaining acceptable internal comfort conditions for the dwellings occupants. Ceiling insulation is particularly effective in limiting heat flow from inside a dwelling to outside, as natural convective currents mean that the highest internal temperatures (and hence the site for potentially the greatest heat flows) are at the ceiling. Furthermore, because roof spaces can become exceedingly hot in the summer (>500C), ceiling insulation is also effective in limiting heat flow from the roof space down into the dwelling.
2 Whilst this activity is included in the VEET scheme the credit available was amended to zero
following the Home Insulation program. Effectively this means there has been no uptake of this activity.
R E V I E W O F E N E R G Y E F F I C I E N C Y A C T I V I T I E S U N D E R T H E S A R E E S S C H E M E
R Final Report, Prepared for DSD by EES, BA and Common Capital, July 2014 8
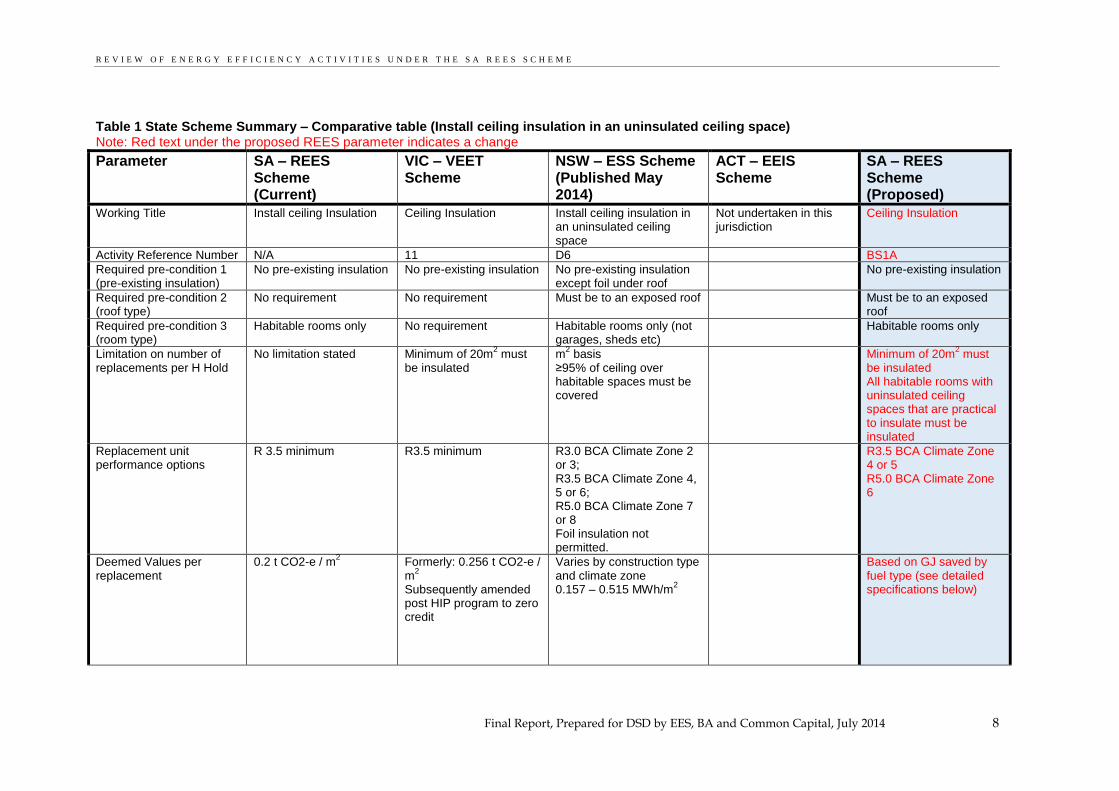
Table 1 State Scheme Summary – Comparative table (Install ceiling insulation in an uninsulated ceiling space) Note: Red text under the proposed REES parameter indicates a change
Parameter SA – REES Scheme (Current)
VIC – VEET Scheme
NSW – ESS Scheme (Published May 2014)
ACT – EEIS Scheme
SA – REES Scheme (Proposed)
Working Title Install ceiling Insulation Ceiling Insulation Install ceiling insulation in an uninsulated ceiling space
Not undertaken in this jurisdiction
Ceiling Insulation
Activity Reference Number N/A 11 D6 BS1A
Required pre-condition 1 (pre-existing insulation)
No pre-existing insulation No pre-existing insulation
No pre-existing insulation except foil under roof
No pre-existing insulation
Required pre-condition 2 (roof type)
No requirement No requirement Must be to an exposed roof Must be to an exposed roof
Required pre-condition 3 (room type)
Habitable rooms only No requirement Habitable rooms only (not garages, sheds etc)
Habitable rooms only
Limitation on number of replacements per H Hold
No limitation stated Minimum of 20m2 must
be insulated m
2 basis
≥95% of ceiling over habitable spaces must be covered
Minimum of 20m2 must
be insulated All habitable rooms with uninsulated ceiling spaces that are practical to insulate must be insulated
Replacement unit performance options
R 3.5 minimum R3.5 minimum R3.0 BCA Climate Zone 2 or 3; R3.5 BCA Climate Zone 4, 5 or 6; R5.0 BCA Climate Zone 7 or 8 Foil insulation not permitted.
R3.5 BCA Climate Zone 4 or 5 R5.0 BCA Climate Zone 6
Deemed Values per replacement
0.2 t CO2-e / m2 Formerly: 0.256 t CO2-e /
m2
Subsequently amended post HIP program to zero credit
Varies by construction type and climate zone 0.157 – 0.515 MWh/m
2
Based on GJ saved by fuel type (see detailed specifications below)
R E V I E W O F E N E R G Y E F F I C I E N C Y A C T I V I T I E S U N D E R T H E S A R E E S S C H E M E
R Final Report, Prepared for DSD by EES, BA and Common Capital, July 2014 9
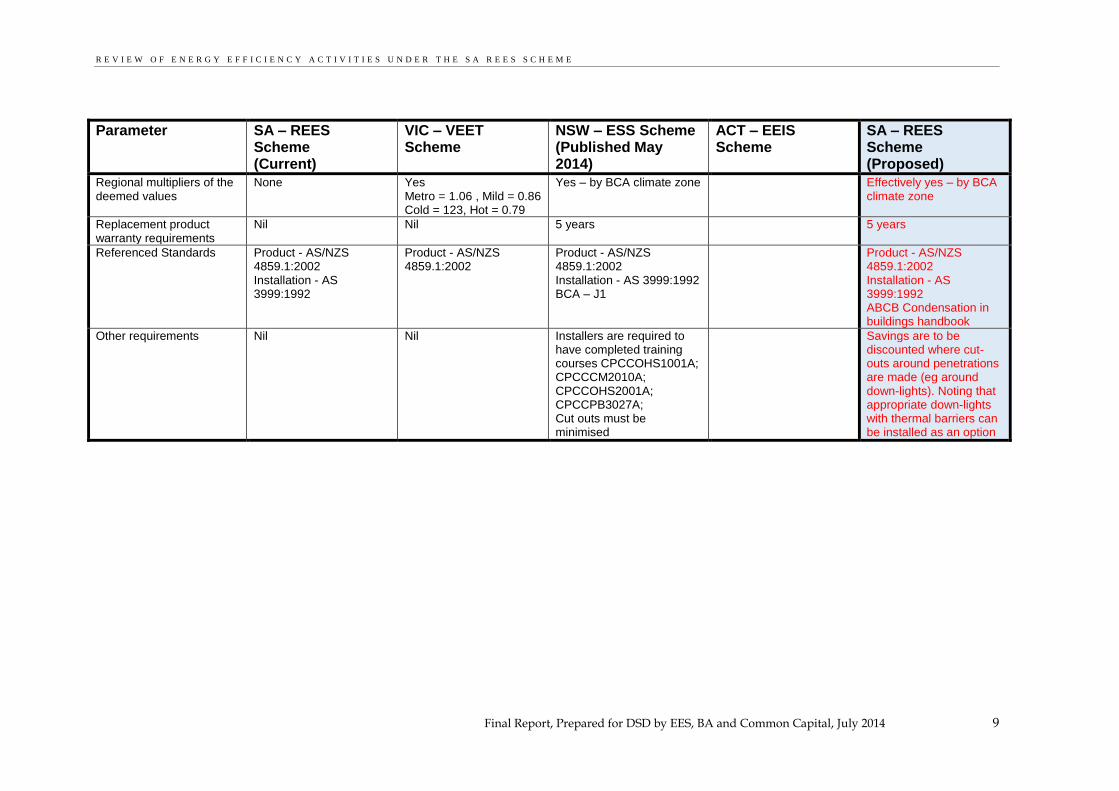
Parameter SA – REES Scheme (Current)
VIC – VEET Scheme
NSW – ESS Scheme (Published May 2014)
ACT – EEIS Scheme
SA – REES Scheme (Proposed)
Regional multipliers of the deemed values
None Yes Metro = 1.06 , Mild = 0.86 Cold = 123, Hot = 0.79
Yes – by BCA climate zone Effectively yes – by BCA climate zone
Replacement product warranty requirements
Nil Nil 5 years 5 years
Referenced Standards Product - AS/NZS 4859.1:2002 Installation - AS 3999:1992
Product - AS/NZS 4859.1:2002
Product - AS/NZS 4859.1:2002 Installation - AS 3999:1992 BCA – J1
Product - AS/NZS 4859.1:2002 Installation - AS 3999:1992 ABCB Condensation in buildings handbook
Other requirements Nil Nil Installers are required to have completed training courses CPCCOHS1001A; CPCCCM2010A; CPCCOHS2001A; CPCCPB3027A; Cut outs must be minimised
Savings are to be discounted where cut-outs around penetrations are made (eg around down-lights). Noting that appropriate down-lights with thermal barriers can be installed as an option

R E V I E W O F E N E R G Y E F F I C I E N C Y A C T I V I T I E S U N D E R T H E S A R E E S S C H E M E
R Final Report, Prepared for DSD by EES, BA and Common Capital, July 2014 10
Assessment Against Scheme Principles This activity aligns with all major policy objectives. It is however true to observe that for low income households the cost of insulating a ceiling can be seen as significant (typically in the range of $1000 - $2000) but the payback period is relatively short (4 years in SA (ICANZ 2011)). The significant benefits from this activity are also likely to be reflected in the level of incentive to be offered to property owners. The incentive in theory should bring the cost down below $1000 per household.
Table 2: Alignment with Policy Objectives for Ceiling insulation
Policy Objective Reduces household and/or business energy use Provides a focus on low income households
Associated Objectives: Provides greenhouse gas emission benefits
Provides energy cost benefits
The following table provides an assessment of the activity against the new principles proposed for REES code. Table 3: Activity Alignment with REES General Principles – Ceiling insulation
Principle Assessment
1. Provides evidence based energy savings
These products are used widely in South Australia. The basis for energy savings associated with this activity is well evidenced. Evidence is available in the form of both thermal simulation modelling and from a number of monitoring studies. It should be noted however that some rebound is known to be associated with this type of activity. Provided that such rebound is taken into account the savings can be considered verifiable.
2. Energy savings are additional to base case (BAU) and minimises free riders
As the activity requires that the existing ceiling space be un-insulated the activity provides significant additionality over the pre-existing base case. At present no regulations mandate the retrofit of ceiling insulation except in relation to major building renovation activities which only affect about 2% of the housing stock annually (EES 2008). Estimates in the 2008 Residential Baseline study put the rate of retrofit of ceiling insulation in SA at just 3.8% of the remaining stock of uninsulated dwellings (EES 2008) so this activity provides significant scope for additionality over the BAU case. Some free riders will exist, but accounted for through energy saving discounts.
3. Reward best practice in relation to product performance
The proposed approach is to set a minimum performance requirement that reflects the currently agreed optimum level for cost effective insulation for the particular climate zone. The performance specification is generic which means that there is no limitation placed on the type of product used thereby encouraging innovation to achieve the most cost effective solution that meets the minimum performance requirement.
4. Provides a means for ensuring quality assurance and participant satisfaction
Pre-existing Australian standards set performance requirements to ensure that the activity maintains its performance throughout its expected lifetime and meets consumer expectations.
5. Credible approach for the calculation of energy savings
Default savings factors provide a robust approach to the calculation of average energy savings across a wide range of household types. An additional climate zone has been introduced to account for regional differences in heating and cooling demands.
6. Provides scope for objective, cost effective and practical auditing
Auditing is relatively straight forward to undertake via a visual inspection of the installed materials coupled with a simple area measurement to establish the quantum of activity undertaken.
7. Good practice Activities are typically undertaken by qualified installers. Installed materials are required to comply with relevant Australian standards. Australian standards also dictate safe installation methods as do, to a lesser degree, manufacturer’s instructions.

R E V I E W O F E N E R G Y E F F I C I E N C Y A C T I V I T I E S U N D E R T H E S A R E E S S C H E M E
R Final Report, Prepared for DSD by EES, BA and Common Capital, July 2014 11
Principle Assessment
8. Harmonisation (as far as practical)
This activity is available in the latest NSW scheme, it is also included in the Victorian scheme but has effectively been suspended following the commencement of the HIP program. Each jurisdiction that lists this activity includes similar elements within their specifications for this activity although some of the details do vary (see Table 1). This activity generally provides good scope for inter jurisdictional alignment, although climatic and space conditioning equipment profile difference between the various jurisdictions will mean that default savings factors will vary to some degree.
9. Safety and minimising overall risk
Activities are typically undertaken by qualified installers. Products are required to comply with relevant standards and safe installation methods are set out in relevant Australian standards and to a lesser degree in manufacturer’s instructions.
Energy Savings - Review Overview of methodology The estimate of energy savings that are expected to be realised from this activity are based on simulated (AccuRate) thermal load reductions associated with an average household with and without the insulation activity applied. Those thermal load reductions are then applied to a space conditioning stock model for South Australia in order that end use energy savings by fuel type can be derived. Finally the estimated state average household input energy saving is constrained to take account of three limiting factors:
Limitations on the additionality of the activity (if any)
The impact of “free riders”
The impact of any rebound The modelling method used in this study is based on that used in the study Energy Use in the Australian Residential Sector 1986-2020 (EES 2008). A schematic of that model is shown in Figure 38 . This is believed to be the most comprehensive “bottom up” model of residential energy use available and has been verified against top down (BREE) data. Further details regarding the methodology are contained in Appendix 3 - Thermal Modelling Method. As noted above this study also considered those factors that are likely to constrain the energy savings arising from the particular activity in the form of rebound effects. These are also detailed at the rear of Appendix 3 - Thermal Modelling Method . The “rebound effect” or “comfort creep” is the perceived tendency of householder to increase their minimum comfort requirements following the application of building shell improvement measures. Such improvements in comfort requirements could take the form of changed thermostat settings and or an increase in actual conditioned floor area. The underlying assumptions used as the basis for the calculation of energy savings in this study are detailed in Table 4.

R E V I E W O F E N E R G Y E F F I C I E N C Y A C T I V I T I E S U N D E R T H E S A R E E S S C H E M E
R Final Report, Prepared for DSD by EES, BA and Common Capital, July 2014 12
Table 4: Energy Savings Estimate – Underlying Key Assumptions (Ceiling Insulation)
Parameter Value Basis / Comment
Energy Service Levels Space Heating and Cooling service including heating and cooling availability, time of use, zoning constraint and thermostat settings
State Weighted Average
Refer to Appendix 3 - Thermal Modelling Method for details
Pre-existing Ceiling insulation level
Nil (R0)
Base Case Assumptions Building Stock State
Weighted Average
State average housing stock without ceiling insulation Refer to Appendix 3 - Thermal Modelling Method for details
Space Heating Equipment installed
State Weighted Average
State average stock of heating and cooling equipment – refer to Appendix 3 - Thermal Modelling Method for details
Climate Zones BCA 4 and 5 BCA 6
As agreed with DSD
Weather file type AccuRate TMY
REES Activity Assumptions
Performance of Installed Insulation
R 3.5 (BCA zones 4 & 5) R 5.0 (BCA zone 6)
Current level applied to BCA zones 4 & 5, For cooler BCA zone 6 the higher level of R5 has been adopted
Lifetime and persistance
Product lifetime 25 years As used in NSW
Product persistence 25 years As used in NSW
Adjustment Factors
Additionality discount factor 1.0 Additionality is covered in the free rider discount factor (below)
Free rider discount 0.95 Underlying retrofit rate estimated at 3.8% (EES 2008) 0.95 is therefore a conservative estimate
Rebound discount factor 0.85 refer to Appendix 3 - Thermal Modelling Method
Compliance discount factor 0.95 There is no available research data on this aspect so the default value of 0.95 is assumed
Total Discount factor 0.77 Product of individual factors
Climatic Adjustments
Adjustments required Yes Different deeming values are applied according to the climate zone. Either BCA Zone 4 & 5, or BCA zone 6

R E V I E W O F E N E R G Y E F F I C I E N C Y A C T I V I T I E S U N D E R T H E S A R E E S S C H E M E
R Final Report, Prepared for DSD by EES, BA and Common Capital, July 2014 13
Energy Savings Calculation Using the methodology and assumptions as detailed in the preceding sections, an estimate of energy savings associated with the installation of ceiling insulation to previously uninsulated ceiling spaces was undertaken. The detailed analysis can be found in the MS Excel spreadsheet delivered with this report (File Name REES 2014 Review - Ceiling Insulation V01). A summary of the estimated energy savings by fuel type over the assumed lifetime for a product installation in 2016 can be found in Table 5 below.
Table 5: Energy Savings Estimate – (Ceiling Insulation) Activity default energy savings The total Gigajoule equivalent energy (GJe) saved attributed to this activity per residential premises is
equal to: Activity Energy Savings = (Savings Factor (as per table below) x Insulation Area*)
Activity Electricity (GJ saved/ m
2)
Gas (GJ saved/ m
2)
Firewood (GJ saved/ m
2)
BCA Zones 4&5 - install R3.5 0.54 0.49 1.26
BCA Zones 6 - Install R5.0 0.78 0.91 2.36
* Where cut-outs are made (eg around down-lights) an area equal to the actual cut-out shall be excluded from the calculation of energy savings
Potential Compliance Issues There are two main concerns in relation to compliance under the proposed specification:
the completeness of the products coverage of the ceiling area.
the temptation for unscrupulous installers to remove the pre-existing insulation and claim that the installation was to an uninsulated ceiling space, an activity that attracts significantly higher credits at little additional cost to the installer (anecdotally this form of rorting happened under the Commonwealth HIP scheme)
These potential risks should be managed through a robust compliance checking and enforcement program.
Recommended Specification The proposed revised specification for this activity can be found below on the following page.

R E V I E W O F E N E R G Y E F F I C I E N C Y A C T I V I T I E S U N D E R T H E S A R E E S S C H E M E
R Final Report, Prepared for DSD by EES, BA and Common Capital, July 2014 14
Ceiling Insulation Activity No.
BS1A
1. Activity Specific Definitions
Habitable Room means any space that can be occupied within a class 1 or class 2 dwelling. This does not include any attached garages, sheds or the like Ceiling means the uppermost surface of a habitable room that has an exposed roof or the attic space of
an exposed roof immediately above. Ceilings do not include ceilings of rooms that have another habitable room above the subject portion of the ceiling Uninsulated ceiling space means a ceiling space without ceiling insulation installed. For the purposes of this Activity, ceiling spaces with single sheet reflective foil insulation hung below the roofing material are deemed to be uninsulated ceiling spaces.
2. Activity Description (Summary)
Install ceiling insulation in an uninsulated ceiling space above a habitable room
3. Activity Eligibility Requirements
1. A residential premises subject to this activity must contain at least 20m2 of uninsulated ceiling
space above a habitable room or rooms 2. All habitable rooms with uninsulated ceiling spaces that are practical to insulate must be insulated
as part of this activity. 3. The installation of ceiling insulation must not be otherwise required by law, for example as condition
of a development approval under the Development Act 1993.
4. Installed Product Requirements
The installed product must: 1. Comply with the performance requirements of the effective version of AS/NZS 4859.1 2. Achieve a minimum winter R value, when measured in accordance with the effective version of
AS/NZS 4859.1 of: a) R3.5 if the Site is in BCA Climate Zone 4 or 5 b) R5.0 if the Site is in NatHERS climate zone 6 3. Comply with any product safety or other product performance requirements in a relevant code of
practice or other relevant legislation applying to the activity. 4. Be fit for the purpose for which it is intended to be used. 5. Come with a minimum 5 year product warranty
5. Minimum Installation Requirements
1. The insulation product used must be installed in compliance with the effective version of AS 3999, AS/NZS 3000 (as applicable) and the National Construction Code BCA Section J1.2. In particular the safety, pre-inspection and risk assessment procedures, electrical safety provisions and provisions for limiting moisture ingress of AS 3999 shall be observed.
2. The activity must be completed and certified in accordance with any relevant code or codes of practice and other relevant legislation applying to the activity, including any licensing, registration, statutory approval, activity certification, health, safety, environmental or waste disposal requirements;
3. The undertaking of this activity shall not compromise the condensation management of the building. Reference should be made to the provisions in the Australian Building Codes Board publication “Condensation in buildings – Information handbook”
4. Cut outs around ceiling penetrations such as down-lights must be kept to the minimum permitted by regulation.

R E V I E W O F E N E R G Y E F F I C I E N C Y A C T I V I T I E S U N D E R T H E S A R E E S S C H E M E
R Final Report, Prepared for DSD by EES, BA and Common Capital, July 2014 15
6. Activity default energy savings The total Gigajoule equivalent energy (GJe) saved attributed to this activity per residential premises is
equal to: Activity Energy Savings = (Savings Factor (as per table below) x Insulation Area*)
Activity Electricity (GJ saved/ m
2)
Gas (GJ saved/ m
2)
Firewood (GJ saved/ m
2)
BCA Zones 4&5 - install R3.5 0.54 0.49 1.26
BCA Zones 6 - Install R5.0 0.78 0.91 2.36
* Where cut-outs are made (eg around down-lights) an area equal to the actual cut-out shall be excluded from the calculation of energy savings
7. Guidance Notes (Informative only – not mandatory)
1. Nil

R E V I E W O F E N E R G Y E F F I C I E N C Y A C T I V I T I E S U N D E R T H E S A R E E S S C H E M E
R Final Report, Prepared for DSD by EES, BA and Common Capital, July 2014 16
Installation of (top up) ceiling insulation - BS1B
Technical Assessment – BS1B
Installation of (top up) ceiling insulation to an under insulated ceiling space
REES Activity Reference: BS1B REES Activity title: Ceiling top up insulation Target: Improved building shell thermal performance Savings: Activity saves energy indirectly by reducing thermal loads on space conditioning equipment Pre-conditions: No pre-existing ceiling insulation > R1.5

R E V I E W O F E N E R G Y E F F I C I E N C Y A C T I V I T I E S U N D E R T H E S A R E E S S C H E M E
R Final Report, Prepared for DSD by EES, BA and Common Capital, July 2014 17
Scheme Review – REES CURRENT REES ACTIVITY DESCRIPTION This activity currently does not form part of the REES scheme code. PROPOSED REES ACTIVITY DESCRIPTION The proposed activity involves the installation of top up ceiling insulation to a ceiling area (or part of a ceiling area) above a habitable space, which has previously been insulated but with a sub optimal level of ceiling insulation. In summary the activity is: Install ceiling insulation to a previously under insulated ceiling space above a habitable room For the purposes of this activity sub-optimal insulation has been defined as any level of insulation that is less than R1.5 (assumed average level for stock so classified being R1.0 ie between R0.5 and R1.5) and the target insulation level meeting or exceeding the requirements of REES activity BS1A (typically R3.5 or R5.0 depending on the BCA climate zone).
Scheme Review – Other jurisdictions The following jurisdictions also include a top up ceiling insulation activity within their schemes:
NSW (ESS activity No D7 - Install ceiling insulation in an under-insulated ceiling space)
Table 6 below provides a comparison of the key elements of each jurisdictions top up ceiling insulation installation scheme.
Scheme Review - Potential of the activity (overview) The activity involves the installation of top up ceiling insulation to previously under or sub optimally insulated ceiling spaces. Insulation fundamentally acts to reduce the rate of heat flow from areas of higher temperature (e.g. the heated interior of a dwelling) to areas of lower temperature (e.g. the exterior of a dwelling during a cold winter’s day). By limiting such heat flows, either out of a building in the winter or into the building in the summer it is possible to reduce the need for space conditioning (i.e. energy) as a means of maintaining acceptable internal comfort conditions for the dwellings occupants. Ceiling insulation is particularly effective in limiting heat flow from inside a dwelling to outside, as natural convective currents mean that the highest internal temperatures (and hence the site for potentially the greatest heat flows) are at the ceiling. Furthermore, because roof spaces can become exceedingly hot in the summer (>500C), ceiling insulation is also effective in limiting heat flow from the roof space down into the dwelling.

R E V I E W O F E N E R G Y E F F I C I E N C Y A C T I V I T I E S U N D E R T H E S A R E E S S C H E M E
R Final Report, Prepared for DSD by EES, BA and Common Capital, July 2014 18
Table 6: State Scheme Summary – Comparative table (Ceiling top up insulation)
Parameter SA – REES Scheme (Current)
VIC – VEET Scheme
NSW – ESS Scheme (Published May 2014)
ACT – EEIS Scheme
SA – REES Scheme (Proposed)
Working Title Not undertaken in this jurisdiction
Not undertaken in this jurisdiction
Install ceiling insulation to an under insulated ceiling space
Not undertaken in this jurisdiction
Ceiling top-up insulation
Activity Reference Number D7 BS1B
Required pre-condition 1 (pre-existing insulation)
The pre-existing ceiling insulation must be below R 3.5 (Note: The current draft specifications are ambiguous in relation to this aspect. Elsewhere it notes that there must be “No pre-existing insulation except foil under roof”)
The pre-existing ceiling insulation must be below R 1.5
Required pre-condition 2 (roof type)
Must be to an exposed roof Must be to an exposed roof
Required pre-condition 3 (room type)
Habitable rooms only (not garages, sheds etc)
Habitable rooms only (not garages, sheds etc)
Limitation on number of replacements per H Hold
m2 basis
≥95% of ceiling over habitable spaces must be covered
m2 basis
All habitable rooms with under-insulated ceiling spaces that are practical to insulate must be insulated
Replacement unit performance options
R3.0 BCA Climate Zone 2 or 3; R3.5 BCA Climate Zone 4, 5 or 6; R5.0 BCA Climate Zone 7 or 8 Foil insulation not permitted.
+R3.0 BCA Climate Zone 5 or 6; +R4.5 BCA Climate Zone 6
Deemed Values per replacement
Varies by construction type and climate zone 0.019 – 0.021 MWh/m
2
Based on GJ saved by fuel type (see detailed specifications below)

R E V I E W O F E N E R G Y E F F I C I E N C Y A C T I V I T I E S U N D E R T H E S A R E E S S C H E M E
R Final Report, Prepared for DSD by EES, BA and Common Capital, July 2014 19
Parameter SA – REES Scheme (Current)
VIC – VEET Scheme
NSW – ESS Scheme (Published May 2014)
ACT – EEIS Scheme
SA – REES Scheme (Proposed)
Regional multipliers of the deemed values
Yes – by BCA climate zone Effectively yes – by BCA climate zone
Replacement product warranty requirements
5 years 5 years
Referenced Standards Product - AS/NZS 4859.1:2002 Installation - AS 3999:1992 BCA – J1
Product - AS/NZS 4859.1:2002 Installation - AS 3999:1992 ABCB Condensation in buildings handbook
Other requirements Installers are required to have completed training courses CPCCOHS1001A; CPCCCM2010A; CPCCOHS2001A; CPCCPB3027A; Cut outs must be minimised

R E V I E W O F E N E R G Y E F F I C I E N C Y A C T I V I T I E S U N D E R T H E S A R E E S S C H E M E
R Final Report, Prepared for DSD by EES, BA and Common Capital, July 2014 20
Older housing stock (generally stock more than 20 years old) that was fitted with ceiling insulation at the time of construction was typically fitted with what is now considered a sub-optimal level of ceiling insulation (as low as R1 or even lower). This deficiency offers scope for rectification through the application of top up insulation. However, the benefits are significantly less than those associated with insulating a previously un-insulated ceiling whereas the costs are almost the same (ie same labour costs and only a minimal saving in material costs). Consequently the cost effectiveness of this measure is relatively poor (although it does improve in cases where there is a high degree of comfort taken by the householder for instance, households with whole of house heating and cooling systems used frequently).
Assessment Against Scheme Principles This activity aligns with all major policy objectives except possibly for the focus on low income households. Unlike the insulation of previously uninsulated ceiling spaces the insulation of under insulated ceiling spaces offers significantly reduced benefits whilst the costs are almost the same. The payback period is relatively long effectively only paying for itself at the assumed end of the products life 20 – 30 years (ICANZ 2013)). The relatively low benefits from this activity will be reflected in a low level of incentive to be offered to property owners making this option less attractive for low income households.
Table 7: Alignment with Policy Objectives for Top up Ceiling insulation
Policy Objective Reduces household and/or business energy use Provides a focus on low income households x
Associated Objectives: Provides greenhouse gas emission benefits
Provides energy cost benefits
The following table provides an assessment of the activity against the new principles proposed for REES code. Table 8: Activity Alignment with REES General Principles – Ceiling insulation
Principle Assessment
1. Provides evidence based energy savings
These products are used widely in South Australia. The basis for energy savings associated with this activity is well evidenced. Evidence is available in the form of both thermal simulation modelling and from a number of monitoring studies. It should be noted however that some rebound is known to be associated with this type of activity. Provided that such rebound is taken into account the savings can be considered verifiable.
2. Energy savings are additional to base case (BAU) and minimises free riders
As the activity is less likely to be undertaken by householders with under insulated ceilings, compared to householders with uninsulated ceilings (where the deficiency is more obvious to the householder) the activity provides significant additionality over the pre-existing case base case.
At present no regulations mandate the retrofit of ceiling insulation to under insulated ceilings except in relation to major building renovation activities which only affect about 2% of the housing stock annually (EES 2008). Estimates in the 2008 Residential Baseline study put the rate of retrofit of ceiling insulation in SA at just 3.8% of the remaining stock of uninsulated dwellings (EES 2008) and much of this activity would be in relation to un-insulated ceilings, so this activity provides significant scope for additionality over the BAU case.

R E V I E W O F E N E R G Y E F F I C I E N C Y A C T I V I T I E S U N D E R T H E S A R E E S S C H E M E
R Final Report, Prepared for DSD by EES, BA and Common Capital, July 2014 21
Principle Assessment
3. Reward best practice in relation to product performance
The proposed approach is to set a minimum performance requirement that reflects the currently agreed optimum level for cost effective insulation for the particular climate zone. The performance specification is generic which means that there is no limitation placed on the type of product used thereby encouraging innovation to achieve the most cost effective solution that meets the minimum performance requirement
4. Provides a means for ensuring quality assurance and participant satisfaction
Pre-existing Australian standards set performance requirements to ensure that the activity maintains its performance throughout its expected lifetime and meets consumer expectations.
5. Credible approach for the calculation of energy savings
Default savings factors provide a robust approach to the calculation of average energy savings across a wide range of household types. Two climate zones have been used to account for regional differences in heating and cooling demands.
6. Provides scope for objective, cost effective and practical auditing
Auditing is relatively straight forward to undertake via a visual inspection of the installed materials coupled with a simple area measurement to establish the quantum of activity undertaken.
7. Good practice Best practice installation guidelines are covered by a set of pre-existing Australian standards that govern the installation of this product type
8. Harmonisation (as far as practical)
This activity is available in the latest NSW scheme only. The NSW scheme includes similar elements within their specifications for this activity although some of the details do vary (see Table 6). This activity generally provides good scope for inter jurisdictional alignment, although climatic and space conditioning equipment profile difference between the various jurisdictions will mean that default savings factors will vary to some degree.
9. Safety and minimising overall risk
Activities are typically undertaken by qualified installers. Installed materials are required to comply with relevant Australian standards. Australian standards also dictate safe installation methods as do, to a lesser degree, manufacturer’s instructions.
Energy Savings - Review Overview of methodology The estimate of energy savings that are expected to be realised from this activity are based on simulated (AccuRate) thermal load reductions associated with an average dwelling with an optimal level of ceiling insulation compared to the same dwelling with a less than optimal level of ceiling insulation. Those thermal load reductions are then applied to a space conditioning stock model for South Australia in order that end use energy savings by fuel type can be derived. Finally the estimated state average household input energy saving is constrained to take account of three limiting factors:
Limitations on the additionality of the activity (if any)
The impact of “free riders”
The impact of any rebound The modelling method used in this study is based on that used in the study Energy Use in the Australian Residential Sector 1986-2020 (EES 2008). A schematic of that model is shown in Figure 38. This is believed to be the most comprehensive “bottom up” model of residential energy use available and has been verified against top down (BREE) data. Further details regarding the methodology are contained in Appendix 3 - Thermal Modelling Method. As noted above this study also considered those factors that are likely to constrain the energy savings arising from the particular activity in the form of rebound effects

R E V I E W O F E N E R G Y E F F I C I E N C Y A C T I V I T I E S U N D E R T H E S A R E E S S C H E M E
R Final Report, Prepared for DSD by EES, BA and Common Capital, July 2014 22
These are also detailed at the rear of Appendix 3 - Thermal Modelling Method . The “rebound effect” or “comfort creep” is the perceived tendency of householder to increase their minimum comfort requirements following the application of building shell improvement measures. Such improvements in comfort requirements could take the form of changed thermostat settings and or an increase in actual conditioned floor area. The underlying assumptions used as the basis for the calculation of energy savings in this study are detailed in Table 9.
Table 9: Energy Savings Estimate – Underlying Key Assumptions (Top up Insulation)
Parameter Value Basis / Comment
Energy Service Levels Space Heating and Cooling service including heating and cooling availability, time of use, zoning constraint and thermostat settings
State Weighted Average
Refer to Appendix 3 - Thermal Modelling Method for details
Pre-existing Ceiling insulation level
R1.0 average
The case for top up insulation assumes that the pre-existing insulation is in the range R0.5 to R1.5.
Base Case Assumptions Building Stock State
Weighted Average
State average housing stock with sub optimal insulation Refer to Appendix 3 - Thermal Modelling Method for details
Space Heating Equipment installed
State Weighted Average
State average stock of heating and cooling equipment – refer to Appendix 3 - Thermal Modelling Method for details
Climate Zones BCA 4 and 5 BCA 6
As agreed with DSD
Weather file type AccuRate TMY
REES Activity Assumptions
Performance of Installed Insulation
R 3.0 (BCA zones 4 & 5) R 4.5 (BCA zone 6)
Combined with the pre-existing insulation (min assumed to be R0.5) the total then matches the proposed levels to be applied under the REES scheme for retrofit to uninsulated ceilings
Lifetime and persistance
Product lifetime 25 years As proposed to be used in NSW
Product persistence 25 years As proposed to be used in NSW
Adjustment Factors
Additionality discount factor 1.0 Additionality is covered in the free rider discount factor (below)
Free rider discount 0.95 Underlying retrofit rate estimated at 3.8% (EES 2008)
Rebound discount factor 0.85 refer to Appendix 3 - Thermal Modelling Method
Compliance discount factor 0.95 There is no available research data on this aspect so the default value of 0.95 is assumed
Total Discount factor 0.77 Product of individual factors
Climatic Adjustments
Adjustments required Yes Different deeming values are applied according to the climate zone. Either BCA Zone 4 & 5, or BCA zone 6

R E V I E W O F E N E R G Y E F F I C I E N C Y A C T I V I T I E S U N D E R T H E S A R E E S S C H E M E
R Final Report, Prepared for DSD by EES, BA and Common Capital, July 2014 23
Energy Savings Calculation Using the methodology and assumptions as detailed in the preceding sections, an estimate of energy savings associated with the installation of ceiling insulation to previously under insulated ceiling spaces was undertaken. The detailed analysis can be found in the MS Excel spreadsheet delivered with this report (File Name REES 2014 Review – Top up Ceiling Insulation V01). A summary of the estimated energy savings by fuel type over the assumed lifetime for a product installation in 2016 can be found in Table 10 below.
Table 10: Energy Savings Estimate – (Top up Insulation) Activity default energy savings The total Gigajoule equivalent energy (GJe) saved attributed to this activity per residential premises is
equal to: Activity Energy Savings = (Savings Factor (as per table below) x Insulation Area*)
Activity Electricity (GJ saved/ m
2)
Gas (GJ saved/ m
2)
Firewood (GJ saved/ m
2)
BCA Zones 4&5 - Install R3.0 0.09 0.08 0.22
BCA Zone 6 - Install R4.5 0.15 0.17 0.45
* Where cut-outs are made (eg around down-lights) an area equal to the actual cut-out shall be excluded from the calculation of energy savings
Potential Compliance Issues The main concern in relation to compliance under the proposed specification is in relation to the completeness of the products coverage of the ceiling area. This potential risk should be managed through a robust compliance checking and enforcement program.
Recommended Specification The proposed specification (see following page) is largely based on the NSW draft specification but with the following differences:
The terms “habitable room”, “ceiling” and “under insulated ceiling space” are now defined terms
The requirement is to insulate all habitable rooms that are practical to insulate (the NSW scheme required 95% of the ceiling to be insulated)
As per the NSW scheme a minimum 5 year warranty period has been applied.
The latest (draft version) of AS3999 (2014) is assumed to have come into force by the time the proposed new REES specifications are published. In particular this new standard covers off on safety, pre-inspection and risk assessment procedures, electrical safety provisions and provisions for limiting moisture ingress.
There is no exclusion of foil based products.
R E V I E W O F E N E R G Y E F F I C I E N C Y A C T I V I T I E S U N D E R T H E S A R E E S S C H E M E
R Final Report, Prepared for DSD by EES, BA and Common Capital, July 2014 24
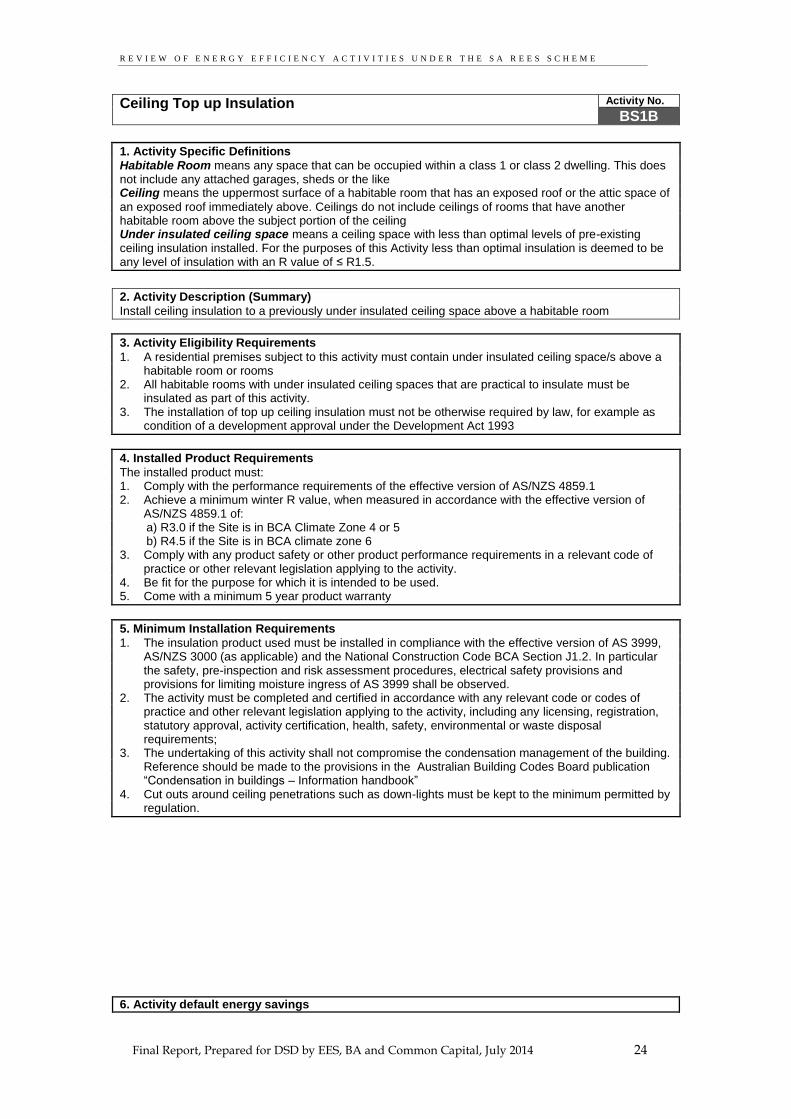
Ceiling Top up Insulation Activity No.
BS1B
1. Activity Specific Definitions
Habitable Room means any space that can be occupied within a class 1 or class 2 dwelling. This does not include any attached garages, sheds or the like Ceiling means the uppermost surface of a habitable room that has an exposed roof or the attic space of
an exposed roof immediately above. Ceilings do not include ceilings of rooms that have another habitable room above the subject portion of the ceiling Under insulated ceiling space means a ceiling space with less than optimal levels of pre-existing ceiling insulation installed. For the purposes of this Activity less than optimal insulation is deemed to be any level of insulation with an R value of ≤ R1.5.
2. Activity Description (Summary)
Install ceiling insulation to a previously under insulated ceiling space above a habitable room
3. Activity Eligibility Requirements
1. A residential premises subject to this activity must contain under insulated ceiling space/s above a habitable room or rooms
2. All habitable rooms with under insulated ceiling spaces that are practical to insulate must be insulated as part of this activity.
3. The installation of top up ceiling insulation must not be otherwise required by law, for example as condition of a development approval under the Development Act 1993
4. Installed Product Requirements
The installed product must: 1. Comply with the performance requirements of the effective version of AS/NZS 4859.1 2. Achieve a minimum winter R value, when measured in accordance with the effective version of
AS/NZS 4859.1 of: a) R3.0 if the Site is in BCA Climate Zone 4 or 5 b) R4.5 if the Site is in BCA climate zone 6 3. Comply with any product safety or other product performance requirements in a relevant code of
practice or other relevant legislation applying to the activity. 4. Be fit for the purpose for which it is intended to be used. 5. Come with a minimum 5 year product warranty
5. Minimum Installation Requirements
1. The insulation product used must be installed in compliance with the effective version of AS 3999, AS/NZS 3000 (as applicable) and the National Construction Code BCA Section J1.2. In particular the safety, pre-inspection and risk assessment procedures, electrical safety provisions and provisions for limiting moisture ingress of AS 3999 shall be observed.
2. The activity must be completed and certified in accordance with any relevant code or codes of practice and other relevant legislation applying to the activity, including any licensing, registration, statutory approval, activity certification, health, safety, environmental or waste disposal requirements;
3. The undertaking of this activity shall not compromise the condensation management of the building. Reference should be made to the provisions in the Australian Building Codes Board publication “Condensation in buildings – Information handbook”
4. Cut outs around ceiling penetrations such as down-lights must be kept to the minimum permitted by regulation.
6. Activity default energy savings

R E V I E W O F E N E R G Y E F F I C I E N C Y A C T I V I T I E S U N D E R T H E S A R E E S S C H E M E
R Final Report, Prepared for DSD by EES, BA and Common Capital, July 2014 25
The total Gigajoule equivalent energy (GJe) saved attributed to this activity per residential premises is
equal to: Activity Energy Savings = (Savings Factor (as per table below) x Insulation Area*)
Activity Electricity (GJ saved/ m
2)
Gas (GJ saved/ m
2)
Firewood (GJ saved/ m
2)
BCA Zones 4&5 Install R3.0 0.09 0.08 0.22
BCA Zone 6 Install R4.5 0.15 0.17 0.45
* Where cut-outs are made (eg around down-lights) an area equal to the actual cut-out shall be excluded from the calculation of energy savings
7. Guidance Notes (Informative only – not mandatory)
1. As a guide, any bulk ceiling insulation with an uncompressed thickness of less than 75mm can be considered to be less than R1.5 rated
R E V I E W O F E N E R G Y E F F I C I E N C Y A C T I V I T I E S U N D E R T H E S A R E E S S C H E M E
R Final Report, Prepared for DSD by EES, BA and Common Capital, July 2014 26
Installation of insulation to an external wall - BS1C
Technical Assessment – BS1C
Installation of insulation to an external wall which has not been previously insulated
REES Activity Reference: BS1C REES Activity title: Wall insulation Target: Improved building shell thermal performance Savings: Activity saves energy indirectly by reducing thermal loads on space conditioning equipment Pre-conditions: No pre-existing wall insulation (except foil sarking)

R E V I E W O F E N E R G Y E F F I C I E N C Y A C T I V I T I E S U N D E R T H E S A R E E S S C H E M E
R Final Report, Prepared for DSD by EES, BA and Common Capital, July 2014 27
Scheme Review – REES CURRENT REES ACTIVITY DESCRIPTION This activity currently does not form part of the REES scheme code. PROPOSED REES ACTIVITY DESCRIPTION The activity involves the installation of wall insulation to a previously uninsulated external wall of a habitable room. This activity can take place at times of renovation works to brick veneer or lightweight external walls in circumstances where internal linings are removed. The more common application however is as a pumped in product that can be installed without the need to remove linings. In summary the activity is: Installation of insulation to an uninsulated external wall The level of insulation that can be retrofitted will to some degree be dictated by the particular wall construction of the dwelling. Cavity brick construction will typically permit the pumping in of only 40mm of insulation (R1) whereas brick veneer walls could accept anywhere from an average of R1.5 to R3.0 depending on whether sarking is fitted to the outside of the frame and or if the internal linings are removed. .
Scheme Review – Other jurisdictions The following jurisdictions also include a ceiling insulation activity within their schemes:
NSW (ESS activity No D9 - Install wall insulation) Table 11 below provides a comparison of the key elements of each jurisdictions wall insulation installation scheme.
Scheme Review - Potential of the activity (overview) The activity involves the installation of wall insulation to previously uninsulated external walls. Insulation fundamentally acts to reduce the rate of heat flow from areas of higher temperature (e.g. the heated interior of a dwelling) to areas of lower temperature (e.g. the exterior of a dwelling during a cold winter’s day). By limiting such heat flows, either out of a building in the winter or into the building in the summer it is possible to reduce the need for space conditioning (i.e. energy) as a means of maintaining acceptable internal comfort conditions for the dwellings occupants. Whilst it is true that ceiling insulation provides the most beneficial effect on heat flows into and out of the dwelling, wall insulation is also effective although the cost is typically significantly higher than for ceiling insulation retrofit The payback period is relatively long effectively only paying for itself at the assumed end of the products life 20 – 30 years (ICANZ 2011)), although it is postulated in the ICANZ study that costs could be significantly reduced if the application of pumped in wall insulation became a more common practice bringing increased competition to the market. Also when the activity is undertaken as part of a renovation process that necessitates the

R E V I E W O F E N E R G Y E F F I C I E N C Y A C T I V I T I E S U N D E R T H E S A R E E S S C H E M E
R Final Report, Prepared for DSD by EES, BA and Common Capital, July 2014 28
Table 11: State Scheme Summary – Comparative table (Install wall insulation)
Parameter SA – REES Scheme (Current)
VIC – VEET Scheme
NSW – ESS Scheme (Published May 2014)
ACT – EEIS Scheme
SA – REES Scheme (Proposed)
Working Title Not undertaken in this jurisdiction
Not undertaken in this jurisdiction
Install wall insulation Not undertaken in this jurisdiction
Wall insulation
Activity Reference Number D7 BS1C
Required pre-condition 1 (pre-existing insulation)
No pre-existing insulation except reflective foil sarking
No pre-existing insulation except reflective foil sarking
Required pre-condition 2 (roof type)
Must be to an external wall excluding any common or party walls
Must be to an external wall excluding any common or party walls
Limitation on number of replacements per H Hold
m2 basis
≥95% of wall area must be covered
m2 basis
All habitable rooms with uninsulated walls that are practical to insulate must be insulated
Replacement unit performance options
R2.0 minimum Foil insulation not permitted.
No specific R rating. All wall cavities that are practical to insulate must be filled with insulation with a minimum resistance of R1.0 per 45mm thickness of insulation
Deemed Values per replacement
Varies by construction type and climate zone 0.059 – 0.1.21 MWh/m
2
For climate zones 5 and 6
Based on GJ saved by fuel type (see detailed specifications below)
Regional multipliers of the deemed values
Yes – by BCA climate zone Effectively yes – by BCA climate zone
Replacement product warranty requirements
5 years 5 years

R E V I E W O F E N E R G Y E F F I C I E N C Y A C T I V I T I E S U N D E R T H E S A R E E S S C H E M E
R Final Report, Prepared for DSD by EES, BA and Common Capital, July 2014 29
Parameter SA – REES Scheme (Current)
VIC – VEET Scheme
NSW – ESS Scheme (Published May 2014)
ACT – EEIS Scheme
SA – REES Scheme (Proposed)
Referenced Standards Product - AS/NZS 4859.1:2002 Installation - AS 3999:1992 BCA – J1
Product - AS/NZS 4859.1:2002 Installation - AS 3999:1992 ABCB Condensation in buildings handbook
Other requirements Installers are required to have completed training courses CPCCOHS1001A; CPCCCM2010A; CPCCOHS2001A; CPCCPB3027A;

R E V I E W O F E N E R G Y E F F I C I E N C Y A C T I V I T I E S U N D E R T H E S A R E E S S C H E M E
R Final Report, Prepared for DSD by EES, BA and Common Capital, July 2014 30
removal of linings then the cost effectiveness increases significantly due to significantly reduced installation costs.
Assessment Against Scheme Principles This activity aligns with all major policy objectives except possibly for the focus on low income households. Unlike the insulation of previously uninsulated ceiling spaces the insulation of wall spaces offers somewhat reduced benefits whilst the costs are relatively high (except in circumstances where wall linings are being removed in any case). The payback period is relatively long, effectively only paying for itself at the assumed end of the products life 20 – 30 years (ICANZ 2013)). The moderate level of benefits from this activity will be reflected in a moderate level of incentive to be offered to property owners, making this option less attractive for low income households.
Table 12: Alignment with Policy Objectives for Wall Insulation
Policy Objective Reduces household and/or business energy use Provides a focus on low income households x
Associated Objectives: Provides greenhouse gas emission benefits
Provides energy cost benefits
The following table provides an assessment of the activity against the new principles proposed for REES code. Table 13: Activity Alignment with REES General Principles – Wall insulation
Principle Assessment
1. Provides evidence based energy savings
The basis for energy savings associated with this activity is well evidenced. Evidence is available in the form of both thermal simulation modelling and from a number of monitoring studies. It should be noted however that some rebound is known to be associated with this type of activity. Provided that such rebound is taken into account the savings can be considered verifiable.
2. Energy savings are additional to base case (BAU) and minimises free riders
This activity is at present rarely undertaken by householders except at times of major renovation where wall linings are removed. At present no regulations mandate the retrofit of wall insulation except in relation to major building renovation activities which only affect about 2% of the housing stock annually (EES 2008). Estimates in the study The Value of Insulation Based Residential Energy Savings Measures In Australia (ICANZ 2013) estimate the rate of retrofit of wall insulation at less than 0.1%, so this activity provides significant scope for additionality over the BAU case.
3. Reward best practice in relation to product performance
The proposed approach is to simply require that the available wall cavity space be filled with insulation with a minimum material performance specification. The material performance specification is generic which means that there is no limitation placed on the type of product used thereby encouraging innovation to achieve the most cost effective solution that meets the minimum performance requirement.
4. Provides a means for ensuring quality assurance and participant satisfaction
Pre-existing Australian standards set performance requirements to ensure that the activity maintains its performance throughout its expected lifetime and meets consumer expectations.
5. Credible approach for the calculation of energy savings
Default savings factors provide a robust approach to the calculation of average energy savings across a wide range of household types. Two climate zones have been used to account for regional differences in heating and cooling demands.
R E V I E W O F E N E R G Y E F F I C I E N C Y A C T I V I T I E S U N D E R T H E S A R E E S S C H E M E
R Final Report, Prepared for DSD by EES, BA and Common Capital, July 2014 31
Principle Assessment
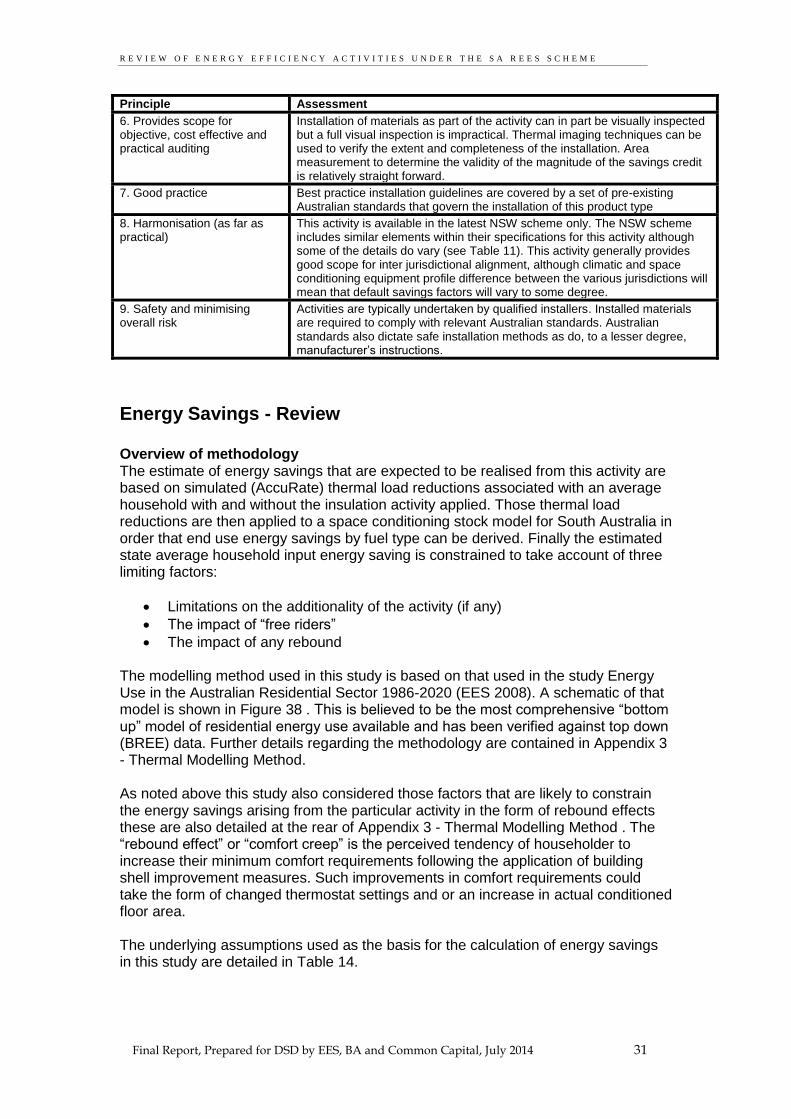
6. Provides scope for objective, cost effective and practical auditing
Installation of materials as part of the activity can in part be visually inspected but a full visual inspection is impractical. Thermal imaging techniques can be used to verify the extent and completeness of the installation. Area measurement to determine the validity of the magnitude of the savings credit is relatively straight forward.
7. Good practice Best practice installation guidelines are covered by a set of pre-existing Australian standards that govern the installation of this product type
8. Harmonisation (as far as practical)
This activity is available in the latest NSW scheme only. The NSW scheme includes similar elements within their specifications for this activity although some of the details do vary (see Table 11). This activity generally provides good scope for inter jurisdictional alignment, although climatic and space conditioning equipment profile difference between the various jurisdictions will mean that default savings factors will vary to some degree.
9. Safety and minimising overall risk
Activities are typically undertaken by qualified installers. Installed materials are required to comply with relevant Australian standards. Australian standards also dictate safe installation methods as do, to a lesser degree, manufacturer’s instructions.
Energy Savings - Review Overview of methodology The estimate of energy savings that are expected to be realised from this activity are based on simulated (AccuRate) thermal load reductions associated with an average household with and without the insulation activity applied. Those thermal load reductions are then applied to a space conditioning stock model for South Australia in order that end use energy savings by fuel type can be derived. Finally the estimated state average household input energy saving is constrained to take account of three limiting factors:
Limitations on the additionality of the activity (if any)
The impact of “free riders”
The impact of any rebound The modelling method used in this study is based on that used in the study Energy Use in the Australian Residential Sector 1986-2020 (EES 2008). A schematic of that model is shown in Figure 38 . This is believed to be the most comprehensive “bottom up” model of residential energy use available and has been verified against top down (BREE) data. Further details regarding the methodology are contained in Appendix 3 - Thermal Modelling Method. As noted above this study also considered those factors that are likely to constrain the energy savings arising from the particular activity in the form of rebound effects these are also detailed at the rear of Appendix 3 - Thermal Modelling Method . The “rebound effect” or “comfort creep” is the perceived tendency of householder to increase their minimum comfort requirements following the application of building shell improvement measures. Such improvements in comfort requirements could take the form of changed thermostat settings and or an increase in actual conditioned floor area. The underlying assumptions used as the basis for the calculation of energy savings in this study are detailed in Table 14.

R E V I E W O F E N E R G Y E F F I C I E N C Y A C T I V I T I E S U N D E R T H E S A R E E S S C H E M E
R Final Report, Prepared for DSD by EES, BA and Common Capital, July 2014 32
Table 14: Energy Savings Estimate – Underlying Key Assumptions (Wall Insulation)
Parameter Value Basis / Comment
Energy Service Levels Space Heating and Cooling service including heating and cooling availability, time of use, zoning constraint and thermostat settings
State Weighted Average
Refer to Appendix 3 - Thermal Modelling Method for details
Pre-existing Wall insulation level
Nil (R0)
Base Case Assumptions Building Stock State
Weighted Average
State average housing stock without wall insulation Refer to Appendix 3 - Thermal Modelling Method for details
Space Heating Equipment installed
State Weighted Average
State average stock of heating and cooling equipment – refer to Appendix 3 - Thermal Modelling Method for details
Climate Zones BCA 4 and 5 BCA 6
As agreed with DSD
Weather file type AccuRate TMY
REES Activity Assumptions
Performance of Installed Insulation
Range from R1 to R3.0
The level of insulation is dependent on the available space for fitting insulation. In the case of cavity brick type walls it is assumed that R1 only is achievable. In the case of brick veneer and lightweight wall construction the value will range from R1.5 to R3.0 depending on the particular construction and access provisions (refer to the study: The Value of Insulation Based Residential Energy Savings Measures In Australia (ICANZ 2013))
Lifetime and persistance
Product lifetime 25 years As used in NSW
Product persistence 25 years As used in NSW
Adjustment Factors
Additionality discount factor 1.0 Additionality is covered in the free rider discount factor (below)
Free rider discount 1.0 Considered to be negligible (ICANZ 2013)
Rebound discount factor 0.85 refer to Appendix 3 - Thermal Modelling Method
Compliance discount factor 0.95 There is no available research data on this aspect so the default value of 0.95 is assumed
Total Discount factor 0.808 Product of individual factors
Climatic Adjustments
Adjustments required Yes Different deeming values are applied according to the climate zone. Either BCA Zone 4 & 5, or BCA zone 6

R E V I E W O F E N E R G Y E F F I C I E N C Y A C T I V I T I E S U N D E R T H E S A R E E S S C H E M E
R Final Report, Prepared for DSD by EES, BA and Common Capital, July 2014 33
Energy Savings Calculation Using the methodology and assumptions as detailed in the preceding sections, an estimate of energy savings associated with the installation of insulation to previously uninsulated walls was undertaken. The detailed analysis can be found in the MS Excel spreadsheet delivered with this report (File Name REES 2014 Review - Wall Insulation V01). A summary of the estimated energy savings by fuel type over the assumed lifetime for a product installation in 2016 can be found in Table 15 below.
Table 15: Energy Savings Estimate – (Wall Insulation) Activity default energy savings The total Gigajoule equivalent energy (GJe) saved attributed to this activity per residential premises is
equal to: Activity Energy Savings = (Savings Factor (as per table below) x Insulation Area)
Activity Electricity (GJ saved/ m
2)
Gas (GJ saved/ m
2)
Firewood (GJ saved/ m
2)
BCA Zones 4&5 0.18 0.14 0.36
BCA Zone 6 0.28 0.34 0.89
Potential Compliance Issues The main concern in relation to compliance under the proposed specification is in relation to the completeness of the products coverage of the wall area. This potential risk should be managed through a robust compliance checking and enforcement program which may include the use of thermal imaging.
Recommended Specification The proposed specification (see following page) is largely based on the NSW draft specification but with the following differences:
The terms “habitable room”, “external wall” and “uninsulated external wall” are now defined terms
The requirement is to insulate all uninsulated external walls that are practical to insulate (the NSW scheme required a minimum of 95% of the walls to be insulated)
There is no set insulation R value that must be achieved. Instead the requirement is that as much of the available cavity space must be filled with insulation that has a minimum resistance of R1.0 per 45mm thickness.
As per the NSW scheme a minimum 5 year warranty period has been applied.
The latest (draft version) of AS3999 (2014) is assumed to have come into force by the time the proposed new REES specifications are published. In particular this new standard covers off on safety, pre-inspection and risk assessment procedures, electrical safety provisions and provisions for limiting moisture ingress.

R E V I E W O F E N E R G Y E F F I C I E N C Y A C T I V I T I E S U N D E R T H E S A R E E S S C H E M E
R Final Report, Prepared for DSD by EES, BA and Common Capital, July 2014 34
Wall Insulation Activity No.
BS1C
1. Activity Specific Definitions
Habitable Room means any space that can be occupied within a class 1 or class 2 dwelling. This does not include any attached garages, sheds or the like External wall means any external (perimeter) wall within a residential premises that encloses a
habitable room. External walls do not include any common or party walls (as defined by the National Construction Code) Uninsulated external wall means an external wall without insulation. For the purposes of this Activity, external walls with single sheet reflective foil sarking materials are deemed to be uninsulated external walls.
2. Activity Description (Summary)
Installation of insulation to an uninsulated external wall
3. Activity Eligibility Requirements
1. A residential premises subject to this activity must contain uninsulated external walls. 2. The installation of wall insulation must not be otherwise required by law, for example as condition of
a development approval under the Development Act 1993.
4. Installed Product Requirements
The installed product must: 1. Comply with the performance requirements of the effective version of AS/NZS 4859.1 2. The insulation material must have a minimum thermal resistance of R1.0 per 45mm thickness. 3. Be fit for the purpose for which it is intended to be used. Where installed in areas that could be
subject to dampness (eg immediately behind external brick walls) the insulation material must be suitable for installation in wet environments without compromise to the rated performance of the product.
4. Comply with any product safety or other product performance requirements in a relevant code of practice or other relevant legislation applying to the activity.
5. Come with a minimum 5 year product warranty
5. Minimum Installation Requirements
1. The insulation product used must be installed in compliance with the effective version of AS 3999, AS/NZS 3000 (as required) and the National Construction Code BCA Section J1.2. In particular the safety, pre-inspection and risk assessment procedures, electrical safety provisions and provisions for limiting moisture ingress of AS 3999 shall be observed.
2. Fully fill available wall cavities as far as is practical, typically between framing members and in cavities behind brickwork as applicable.
3. The activity must be completed and certified in accordance with any relevant code or codes of practice and other relevant legislation applying to the activity, including any licensing, registration, statutory approval, activity certification, health, safety, environmental or waste disposal requirements;
4. The undertaking of this activity shall not compromise the condensation management of the building. Reference should be made to the provisions in the Australian Building Codes Board publication “Condensation in buildings – Information handbook”
6. Activity default energy savings The total Gigajoule equivalent energy (GJe) saved attributed to this activity per residential premises is
equal to: Activity Energy Savings = (Savings Factor (as per table below) x Insulation Area)
Activity Electricity (GJ saved/ m
2)
Gas (GJ saved/ m
2)
Firewood (GJ saved/ m
2)
BCA Zones 4&5 0.18 0.14 0.36
BCA Zone 6 0.28 0.34 0.89

R E V I E W O F E N E R G Y E F F I C I E N C Y A C T I V I T I E S U N D E R T H E S A R E E S S C H E M E
R Final Report, Prepared for DSD by EES, BA and Common Capital, July 2014 35
7. Guidance Notes (Informative only – not mandatory)
1. When insulating brick veneer walls from the top of the wall (using blow or pump in insulation) both the cavity and the space between studwork should be filled where possible. Where sarking is fixed to the outside of the frame the insulation should be injected into the cavity between the brickwork and the sarking and whenever possible and permitted, past the sarking into the top half of the stud framing between each stud down to the nogging level.

R E V I E W O F E N E R G Y E F F I C I E N C Y A C T I V I T I E S U N D E R T H E S A R E E S S C H E M E
R Final Report, Prepared for DSD by EES, BA and Common Capital, July 2014 36
Installation of insulation to floors - BS1D
Technical Assessment – BS1D
Installation of insulation to ground floor suspended timber floors which have not been previously insulated
REES Activity Reference: BS1D REES Activity title: Floor insulation Target: Improved building shell thermal performance Savings: Activity saves energy indirectly by reducing thermal loads on space conditioning equipment Pre-conditions: No pre-existing floor insulation (including foil sarking)

R E V I E W O F E N E R G Y E F F I C I E N C Y A C T I V I T I E S U N D E R T H E S A R E E S S C H E M E
R Final Report, Prepared for DSD by EES, BA and Common Capital, July 2014 37
Scheme Review - REES CURRENT REES ACTIVITY DESCRIPTION This activity currently does not form part of the REES scheme code. PROPOSED REES ACTIVITY DESCRIPTION The activity involves the installation of insulation to a previously uninsulated suspended timber ground floor of a habitable room. This activity can take place at times of renovation works in circumstances where the ground floor boards are removed and subsequently replaced. The more common application however is an installation from below the floor (in the subfloor “crawl” space) where the insulation can be installed without the need to remove the flooring material. In summary the activity is: “Installation of insulation to an uninsulated suspended ground floor”
Scheme Review – Other jurisdictions The following jurisdictions also include a under floor insulation activity within their schemes:
NSW (ESS activity No D8 - Install wall insulation) Table 16 below provides a comparison of the key elements of each jurisdictions floor insulation installation scheme.
Scheme Review - Potential of the activity (overview) The activity involves the installation of floor insulation to previously uninsulated suspended timber floors. Insulation fundamentally acts to reduce the rate of heat flow from areas of higher temperature (e.g. the heated interior of a dwelling) to areas of lower temperature (e.g. the exterior of a dwelling during a cold winter’s day). By limiting such heat flows, either out of a building in the winter or into the building in the summer it is possible to reduce the need for space conditioning (i.e. energy) as a means of maintaining acceptable internal comfort conditions for the dwellings occupants. Of all the insulation options (floor, wall and ceiling) floor insulation is the least cost effective. Heat transfers through a typical floor are relatively modest (<10% of total heat transfers in a typical dwelling) and the cost of retrofit is relatively high due to often cramped working conditions. The benefit to cost ration is typically less than 0.25 in South Australia (ICANZ 2013)

R E V I E W O F E N E R G Y E F F I C I E N C Y A C T I V I T I E S U N D E R T H E S A R E E S S C H E M E
R Final Report, Prepared for DSD by EES, BA and Common Capital, July 2014 38
Table 16: State Scheme Summary – Comparative table (Install under floor insulation)
Parameter SA – REES Scheme (Current)
VIC – VEET Scheme
NSW – ESS Scheme (Published May 2014)
ACT – EEIS Scheme
SA – REES Scheme (Proposed)
Working Title Not undertaken in this jurisdiction
Not undertaken in this jurisdiction
Install under floor insulation Not undertaken in this jurisdiction
Floor Insulation
Activity Reference Number D8 BS1D
Required pre-condition 1 (pre-existing insulation)
No pre-existing insulation No pre-existing insulation
Limitation on number of replacements per H Hold
m2 basis
≥95% of floor area must be covered
m2 basis
No limitation
Replacement unit performance options
R2.5 minimum Foil insulation not permitted.
R2.5 minimum
Deemed Values per replacement
Varies by construction type and climate zone 0.009 – 0.015 MWh/m
2
For climate zones 5 and 6
Based on GJ saved by fuel type (see detailed specifications below)
Regional multipliers of the deemed values
Yes – by BCA climate zone Effectively yes – by BCA climate zone
Replacement product warranty requirements
5 years 5 years
Referenced Standards Product - AS/NZS 4859.1:2002 Installation - AS 3999:1992 BCA – J1
Product - AS/NZS 4859.1:2002 Installation - AS 3999:1992 ABCB Condensation in buildings handbook
Other requirements Installers are required to have completed training courses CPCCOHS1001A; CPCCCM2010A; CPCCOHS2001A; CPCCPB3027A;

R E V I E W O F E N E R G Y E F F I C I E N C Y A C T I V I T I E S U N D E R T H E S A R E E S S C H E M E
R Final Report, Prepared for DSD by EES, BA and Common Capital, July 2014 39
Assessment Against Scheme Principles This activity aligns with all major policy objectives except for the focus on low income households. Unlike the insulation of previously uninsulated ceiling spaces the insulation of underfloor spaces offers a poor return on investment in South Australia as a whole with a B/C ratio less than 0.25(ICANZ 2013)). The relatively low benefits from this activity will be reflected in a low level of incentive to be offered to property owners making this option less attractive for low income households. The ICANZ study did however find that the activity will have a marginally positive B/C ratio (>1) in the coldest regions in the state such as Mt Lofty and Mt Gambier (the finding in the ICANZ study was in fact in relation to the Canberra climate zone which is similar to that in Mt Gambier and particularly Mt Lofty)
Table 17: Alignment with Policy Objectives for Floor Insulation
Policy Objective Reduces household and/or business energy use Provides a focus on low income households x
Associated Objectives: Provides greenhouse gas emission benefits
Provides energy cost benefits
The following table provides an assessment of the activity against the new principles proposed for REES code. Table 18: Activity Alignment with REES General Principles – Floor Insulation
Principle Assessment
1. Provides evidence based energy savings
The basis for energy savings associated with this activity is well evidenced. Evidence is available in the form of both thermal simulation modelling and from a number of monitoring studies. It should be noted however that some rebound is known to be associated with this type of activity. Provided that such rebound is taken into account the savings can be considered verifiable.
2. Energy savings are additional to base case (BAU) and minimises free riders
This activity is at present rarely undertaken by householders except at times of major renovation where flooring is removed and even in those circumstances it is rare. At present no regulations mandate the retrofit of floor insulation except occasionally in relation to major building renovation activities which only affect about 2% of the housing stock annually (EES 2008). Estimates in the study The Value of Insulation Based Residential Energy Savings Measures In Australia (ICANZ 2013) estimate the rate of retrofit of floor insulation at less than 0.6%, so this activity provides significant scope for additionality over the BAU case.
3. Reward best practice in relation to product performance
The proposed approach is to set a minimum performance requirement that reflects an optimum level for cost effective insulation. The performance specification is generic which means that there is no limitation placed on the type of product used thereby encouraging innovation to achieve the most cost effective solution that meets the minimum performance requirement.
4. Provides a means for ensuring quality assurance and participant satisfaction
Pre-existing Australian standards set performance requirements to ensure that the activity maintains its performance throughout its expected lifetime and meets consumer expectations.
5. Credible approach for the calculation of energy savings
Default savings factors provide a robust approach to the calculation of average energy savings across a wide range of household types. Two climate zones have been used to account for regional differences in heating and cooling demands.
6. Provides scope for objective, cost effective and practical auditing
Auditing is relatively straight forward to undertake via a visual inspection of the installed materials coupled with a simple area measurement to establish the quantum of activity undertaken.

R E V I E W O F E N E R G Y E F F I C I E N C Y A C T I V I T I E S U N D E R T H E S A R E E S S C H E M E
R Final Report, Prepared for DSD by EES, BA and Common Capital, July 2014 40
Principle Assessment
7. Good practice Best practice installation guidelines are covered by a set of pre-existing Australian standards that govern the installation of this product type
8. Harmonisation (as far as practical)
This activity is available in the latest NSW scheme only. The NSW scheme includes similar elements within their specifications for this activity although some of the details do vary (see Table 16). This activity generally provides good scope for inter jurisdictional alignment, although climatic and space conditioning equipment profile difference between the various jurisdictions will mean that default savings factors will vary to some degree.
9. Safety and minimising overall risk
Activities are typically undertaken by qualified installers. Installed materials are required to comply with relevant Australian standards. Australian standards also dictate safe installation methods as do, to a lesser degree, manufacturer’s instructions.
Energy Savings - Review Overview of methodology The estimate of energy savings that are expected to be realised from this activity are based on simulated (AccuRate) thermal load reductions associated with an average household with and without the insulation activity applied. Those thermal load reductions are then applied to a space conditioning stock model for South Australia in order that end use energy savings by fuel type can be derived. Finally the estimated state average household input energy saving is constrained to take account of three limiting factors:
Limitations on the additionality of the activity (if any)
The impact of “free riders”
The impact of any rebound The modelling method used in this study is based on that used in the study Energy Use in the Australian Residential Sector 1986-2020 (EES 2008). A schematic of that model is shown in Figure 38 . This is believed to be the most comprehensive “bottom up” model of residential energy use available and has been verified against top down (BREE) data. Further details regarding the methodology are contained in Appendix 3 - Thermal Modelling Method. As noted above this study also considered those factors that are likely to constrain the energy savings arising from the particular activity in the form of rebound effects These are also detailed at the rear of Appendix 3 - Thermal Modelling Method . The “rebound effect” or “comfort creep” is the perceived tendency of householder to increase their minimum comfort requirements following the application of building shell improvement measures. Such improvements in comfort requirements could take the form of changed thermostat settings and or an increase in actual conditioned floor area. The underlying assumptions used as the basis for the calculation of energy savings in this study are detailed in Table 19.

R E V I E W O F E N E R G Y E F F I C I E N C Y A C T I V I T I E S U N D E R T H E S A R E E S S C H E M E
R Final Report, Prepared for DSD by EES, BA and Common Capital, July 2014 41
Table 19: Energy Savings Estimate – Underlying Key Assumptions (Floor Insulation)
Parameter Value Basis / Comment
Energy Service Levels Space Heating and Cooling service including heating and cooling availability, time of use, zoning constraint and thermostat settings
State Weighted Average
Refer to Appendix 3 - Thermal Modelling Method for details
Pre-existing floor insulation level
Nil (R0)
Base Case Assumptions Building Stock State
Weighted Average
State average housing stock without floor insulation Refer to Appendix 3 - Thermal Modelling Method for details
Space Heating Equipment installed
State Weighted Average
State average stock of heating and cooling equipment – refer to Appendix 3 - Thermal Modelling Method for details
Climate Zones BCA 4 and 5 BCA 6
As agreed with DSD
Weather file type AccuRate TMY
REES Activity Assumptions
Performance of Installed Insulation
Range from R 2.5
The study, The Value of Insulation Based Residential Energy Savings Measures In Australia (ICANZ 2013) found that due to the high installation costs it was more cost effective to install relatively high levels of under floor insulation, consequently R 2.5 has been adopted. This thickness of insulation will just fit into the space available from a typical 100mm floor joist. R2.5 is also the level proposed for adoption in NSW
Lifetime and persistance
Product lifetime 25 years As proposed to be used in NSW
Product persistence 25 years As proposed to be used in NSW
Adjustment Factors
Additionality discount factor 1.0 Additionality is covered in the free rider discount factor (below)
Free rider discount 1.0 Considered to be negligible (ICANZ 2013)
Rebound discount factor 0.85 refer to Appendix 3 - Thermal Modelling Method
Compliance discount factor 0.95 There is no available research data on this aspect so the default value of 0.95 is assumed
Total Discount factor 0.808 Product of individual factors
Adjustments required
Adjustments required Yes Different deeming values are applied according to the climate zone. Either BCA Zone 4 & 5, or BCA zone 6

R E V I E W O F E N E R G Y E F F I C I E N C Y A C T I V I T I E S U N D E R T H E S A R E E S S C H E M E
R Final Report, Prepared for DSD by EES, BA and Common Capital, July 2014 42
Energy Savings Calculation Using the methodology and assumptions as detailed in the preceding sections, an estimate of energy savings associated with the installation of insulation to previously uninsulated floors was undertaken. The detailed analysis can be found in the MS Excel spreadsheet delivered with this report (File Name REES 2014 Review - Floor Insulation V01). A summary of the estimated energy savings by fuel type over the assumed lifetime for a product installation in 2016 can be found in Table 20 below.
Table 20: Energy Savings Estimate – (Floor Insulation) 6. Activity default energy savings The total Gigajoule equivalent energy (GJe) saved attributed to this activity per residential premises is
equal to: Activity Energy Savings = (Savings Factor (as per table below) x Insulation Area)
Activity Electricity (GJ saved/ m
2)
Gas (GJ saved/ m
2)
Firewood (GJ saved/ m
2)
BCA Zones 4&5 0.02 0.04 0.1
BCA Zone 6 0.08 0.11 0.3
Potential Compliance Issues The main concern in relation to compliance under the proposed specification is in relation to the completeness of the products coverage of the floor area. This potential risk should be managed through a robust compliance checking and enforcement program which may include the use of thermal imaging.
Recommended Specification The proposed specification (see following page) is largely based on the NSW draft specification but with the following differences:
The terms “habitable room”, “ground floor ” and “uninsulated ground floor” are now defined terms
There is no requirement to insulate the entire floor area, however, a hierarchy of areas to be insulated is stipulated.
As per the NSW scheme a minimum 5 year warranty period has been applied.
The latest (draft version) of AS3999 (2014) is assumed to have come into force by the time the proposed new REES specifications are published. In particular this new standard covers off on safety, pre-inspection and risk assessment procedures, electrical safety provisions and provisions for limiting moisture ingress.
Foil based products are not excluded from the scheme (as is the case in NSW)

R E V I E W O F E N E R G Y E F F I C I E N C Y A C T I V I T I E S U N D E R T H E S A R E E S S C H E M E
R Final Report, Prepared for DSD by EES, BA and Common Capital, July 2014 43
Floor Insulation Activity No.
BS1D
1. Activity Specific Definitions
Habitable Room means any space that can be occupied within a class 1 or class 2 dwelling. This does not include any attached garages, sheds or the like Ground floor means the lowest floor of a habitable room within a residential premises that sits immediately above a subfloor space. Ground floors do not include concrete floors or floors that separate habitable rooms. Uninsulated ground floor means a ground floor without insulation. For the purposes of this Activity, ground floors with single sheet reflective foil sarking materials hung beneath the flooring are NOT deemed to be uninsulated ground floors.
2. Activity Description (Summary)
Installation of insulation to an uninsulated suspended ground floor
3. Activity Eligibility Requirements
1. A residential premises subject to this activity must contain an uninsulated ground floor or part thereof.
2. Where only part of an uninsulated ground floor is insulated then living areas must be insulated as a priority, followed by bedrooms.
3. The installation of floor insulation must not be otherwise required by law, for example as condition of a development approval under the Development Act 1993.
4. Installed Product Requirements
The installed product must: 1. Comply with the performance requirements of the effective version of AS/NZS 4859.1 2. Have a minimum R value of R2.5 3. Comply with any product safety or other product performance requirements in a relevant code of
practice or other relevant legislation applying to the activity. 4. Be fit for the purpose for which it is intended to be used. 5. Come with a minimum 5 year product warranty
5. Minimum Installation Requirements
1. The insulation product used must be installed in compliance with the effective version of AS 3999, AS/NZS 3000 (as required) and the National Construction Code BCA Section J1. In particular the safety, pre-inspection and risk assessment procedures, electrical safety provisions and provisions for limiting moisture ingress of AS 3999 shall be observed.
2. The insulation product must be securely fixed in place and adequately supported to ensure that the product will remain in its intended position throughout the life of the product
3. The activity must be completed and certified in accordance with any relevant code or codes of practice and other relevant legislation applying to the activity, including any licensing, registration, statutory approval, activity certification, health, safety, environmental or waste disposal requirements;
4. The undertaking of this activity shall not compromise the condensation management of the building. Reference should be made to the provisions in the Australian Building Codes Board publication “Condensation in buildings – Information handbook”
6. Activity default energy savings The total Gigajoule equivalent energy (GJe) saved attributed to this activity per residential premises is
equal to: Activity Energy Savings = (Savings Factor (as per table below) x Insulation Area)
Activity Electricity (GJ saved/ m
2)
Gas (GJ saved/ m
2)
Firewood (GJ saved/ m
2)
BCA Zones 4&5 0.02 0.04 0.1
BCA Zone 6 0.08 0.11 0.3
7. Guidance Notes (Informative only – not mandatory)
1. Nil

R E V I E W O F E N E R G Y E F F I C I E N C Y A C T I V I T I E S U N D E R T H E S A R E E S S C H E M E
R Final Report, Prepared for DSD by EES, BA and Common Capital, July 2014 44
Building Sealing Activities (Various) - BS2
Technical Assessment – BS2
Building Sealing Activities (Various)
REES Activity Reference: BS2 REES Activity title: Building Sealing Activities Target: Improved building shell thermal performance Savings: Activity saves energy indirectly by reducing infiltration based thermal loads on space conditioning equipment Pre-conditions: No pre-existing sealing Activities

R E V I E W O F E N E R G Y E F F I C I E N C Y A C T I V I T I E S U N D E R T H E S A R E E S S C H E M E
R Final Report, Prepared for DSD by EES, BA and Common Capital, July 2014 45
Scheme Review – REES CURRENT REES ACTIVITY DESCRIPTION This activity currently forms part of the REES scheme code3 . The current summary description within the REES scheme code is as follows: “Installation of products to doors, windows, chimneys of open fireplaces or to exhaust fans to restrict or prevent air flow.” The activity involves the installation of draught proofing devices to the following potential sources of air infiltration into a residential premises:
Doors
Windows
Chimneys or open fireplaces
Exhaust fans This activity currently attracts the following deemed CO2-e values:
Doors 0.2
Windows 0.02
Chimneys or open fireplaces 2.9
Exhaust fans 0.1 PROPOSED REES ACTIVITY DESCRIPTION The proposed is fundamentally unchanged except that it has now been extended to include the sealing of wall vents ie: “Installation of products designed to restrict or prevent air flow through doors, windows, chimneys/open fireplaces, exhaust fans or wall vents” KEY SPECIFICATION CHANGES The proposed key specification changes from the current REES activity description are as follows:
The activity now includes for 2 different climate zones (BCA zone 4 &5 and BCA zone 6) each offering different levels of default savings.
The activity now includes for the sealing of wall vents
The activity in relation to the sealing of fireplaces now differentiates between fireplaces that have permanent sealing solutions and ones that have removable sealing solutions (eg chimney balloons). Each attracts different levels of savings credit
The activity in relation to the sealing of windows and doors now differentiates between seals that are mechanically fixed and those that are not mechanically fixed (typically adhesive fixed). Each attracts different levels of savings credit
Whenever a particular sealing activity is to be undertaken (eg windows), all windows within the residential premises must be sealed.
Warranty periods now apply to each type of sealing product
Scheme Review – Other jurisdictions
3 RESIDENTIAL ENERGY EFFICIENCY SCHEME CODE REESC/07 February 2014
R E V I E W O F E N E R G Y E F F I C I E N C Y A C T I V I T I E S U N D E R T H E S A R E E S S C H E M E
R Final Report, Prepared for DSD by EES, BA and Common Capital, July 2014 46
The following jurisdictions also include a building sealing activity within their schemes:
Victoria (VEET schedule No 15A – 15F – Install draught proofing products)
NSW (ESS activity No E10 – E12 –Modify doors and windows with draught proofing, Modify chimneys or fireplaces by sealing with a damper
ACT (EEIS Parts 1.1, 1.2 and 1.3 building sealing activities) Table 21 below provides a comparison of the key elements of each jurisdictions building sealing scheme.
Scheme Review - Potential of the activity (overview) The activity involves the installation of various forms of draught proofing devices as a means for restricting or preventing air flow into or out of the residential premises. Draught proofing fundamentally acts to reduce the rate of air flow or exchange between the internal conditioned spaces within a building and the unconditioned exterior of the building. By limiting airflow, convective heat losses in the winter and convective heat gains in the summer can be limited thereby reducing the need for space conditioning (i.e. energy) as a means of maintaining acceptable internal comfort conditions for the dwellings occupants. Sealing activities are generally low cost activities that are very cost effective making them particularly suitable for application to low income households.

R E V I E W O F E N E R G Y E F F I C I E N C Y A C T I V I T I E S U N D E R T H E S A R E E S S C H E M E
R Final Report, Prepared for DSD by EES, BA and Common Capital, July 2014 47
Table 21: State Scheme Summary – Comparative table (Building Sealing Activities)
Parameter SA – REES Scheme (Current)
VIC – VEET Scheme
NSW – ESS Scheme (Published May 2014)
ACT – EEIS Scheme
SA – REES Scheme (Proposed)
Working Title Install draught proofing products
Weather sealing Modify a : External door with draught proofing External window with draught proofing Fireplace or chimney by sealing with a damper
Building sealing activities Building sealing activities
Activity Reference Number N/A 15A – 15F E7, E8 and E9 Parts 1.1, 1.2 and 1.3 BS2
Required pre-condition 1 (Doors)
Habitable rooms only Residential premises External doors to living spaces only with pre-existing gaps
Habitable rooms only. Infers that both the frame and the door must be sealed?
External doors to habitable rooms only with pre-existing gaps
Required pre-condition 2 (Windows)
Habitable rooms only Residential premises External windows only with gaps between sash and frame (gap size not specified)
Habitable rooms only. Infers that both the sash and the frame must be sealed
External windows to habitable rooms only with pre-existing gaps
Required pre-condition 3 (Chimney)
Habitable rooms only Residential premises Open fireplace without pre-existing damper
Habitable rooms only The fireplace must be in a habitable room, be an open fireplace that is unsealed and not have a pre-existing chimney damper.
Required pre-condition 4 (Exhaust Fan)
Habitable rooms only Residential premises Not covered Exhaust fan that is not fitted with a self-closing sealing device (Wall or Ceiling mount)
Exhaust fan that is not fitted with a self-closing sealing device
Required pre-condition 5 (Ventilation openings)
Not covered Residential premises Not covered Habitable rooms only Habitable rooms only where the vent is not the only source of ventilation
Limitation on number of replacements per H Hold
No limitation stated No limitation stated No limitation stated No limitation stated No limitation
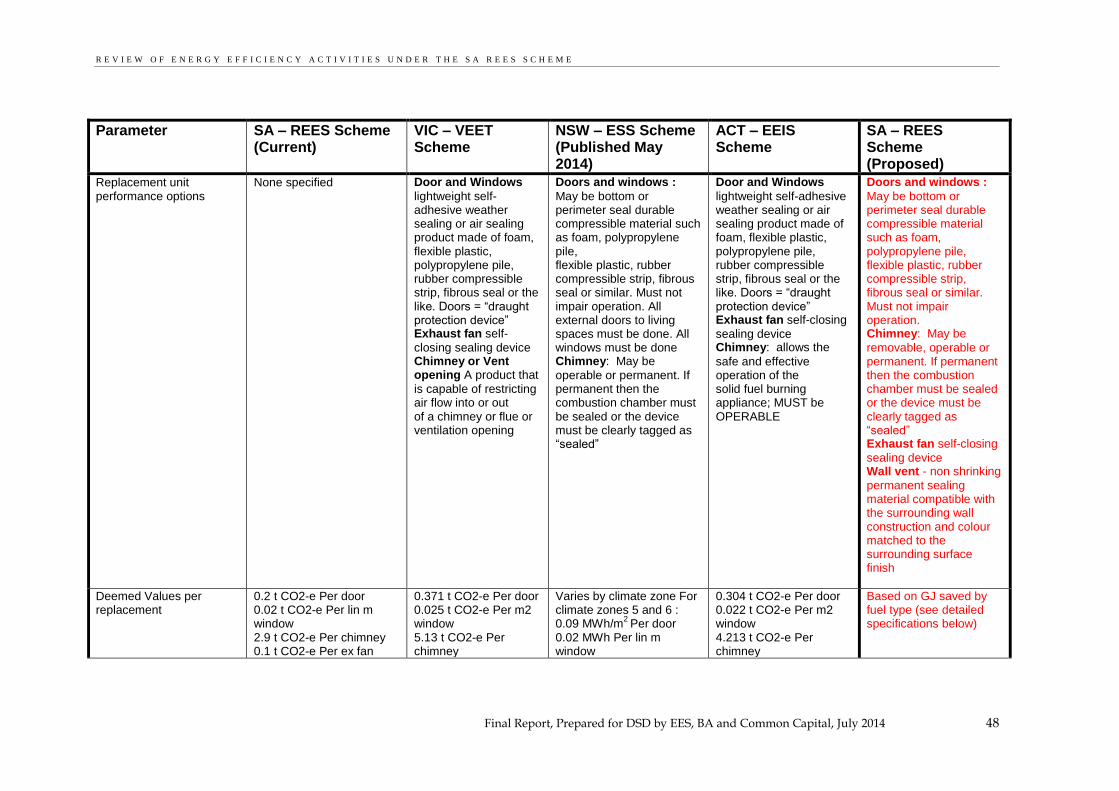
R E V I E W O F E N E R G Y E F F I C I E N C Y A C T I V I T I E S U N D E R T H E S A R E E S S C H E M E
R Final Report, Prepared for DSD by EES, BA and Common Capital, July 2014 48
Parameter SA – REES Scheme (Current)
VIC – VEET Scheme
NSW – ESS Scheme (Published May 2014)
ACT – EEIS Scheme
SA – REES Scheme (Proposed)
Replacement unit performance options
None specified Door and Windows
lightweight self-adhesive weather sealing or air sealing product made of foam, flexible plastic, polypropylene pile, rubber compressible strip, fibrous seal or the like. Doors = “draught protection device” Exhaust fan self-
closing sealing device Chimney or Vent opening A product that
is capable of restricting air flow into or out of a chimney or flue or ventilation opening
Doors and windows :
May be bottom or perimeter seal durable compressible material such as foam, polypropylene pile, flexible plastic, rubber compressible strip, fibrous seal or similar. Must not impair operation. All external doors to living spaces must be done. All windows must be done Chimney: May be
operable or permanent. If permanent then the combustion chamber must be sealed or the device must be clearly tagged as “sealed”
Door and Windows
lightweight self-adhesive weather sealing or air sealing product made of foam, flexible plastic, polypropylene pile, rubber compressible strip, fibrous seal or the like. Doors = “draught protection device” Exhaust fan self-closing
sealing device Chimney: allows the
safe and effective operation of the solid fuel burning appliance; MUST be OPERABLE
Doors and windows :
May be bottom or perimeter seal durable compressible material such as foam, polypropylene pile, flexible plastic, rubber compressible strip, fibrous seal or similar. Must not impair operation. Chimney: May be
removable, operable or permanent. If permanent then the combustion chamber must be sealed or the device must be clearly tagged as “sealed” Exhaust fan self-closing
sealing device Wall vent - non shrinking
permanent sealing material compatible with the surrounding wall construction and colour matched to the surrounding surface finish
Deemed Values per replacement
0.2 t CO2-e Per door 0.02 t CO2-e Per lin m window 2.9 t CO2-e Per chimney 0.1 t CO2-e Per ex fan
0.371 t CO2-e Per door 0.025 t CO2-e Per m2 window 5.13 t CO2-e Per chimney
Varies by climate zone For climate zones 5 and 6 : 0.09 MWh/m
2 Per door
0.02 MWh Per lin m window
0.304 t CO2-e Per door 0.022 t CO2-e Per m2 window 4.213 t CO2-e Per chimney
Based on GJ saved by fuel type (see detailed specifications below)

R E V I E W O F E N E R G Y E F F I C I E N C Y A C T I V I T I E S U N D E R T H E S A R E E S S C H E M E
R Final Report, Prepared for DSD by EES, BA and Common Capital, July 2014 49
Parameter SA – REES Scheme (Current)
VIC – VEET Scheme
NSW – ESS Scheme (Published May 2014)
ACT – EEIS Scheme
SA – REES Scheme (Proposed)
Vent openings not covered 0.911 t CO2-e Per ex fan 0.231 t CO2-e Per vent open
1.3 MWh/m2
Per chimney 0.748 t CO2-e Per ex fan 0.19 t CO2-e Per vent open
Regional multipliers of the deemed values
None Yes Metro = 1.03 Mild = 0.91 Cold = 1.3 Hot = 0.84
Yes – by climate zone except for chimneys
None Effectively yes – by BCA climate zone
Replacement product warranty requirements
2 Years generally 12 months for exhaust fans
Not specified Doors – 2 years Windows – 2 years Chimney – 5 years
Not specified Varies by product type – see specifications below
Referenced Standards None Part 3.8.5 of the 2008 edition of the Building Code
National Construction Code BCA Section J3 Part 3.8.5 of the 2008 edition of the Building Code
General compliance only National Construction Code BCA Section J3 and any applicable Australian Standards.
Other requirements Must not be otherwise required by law Must comply with South Australian Housing Code (minimum requirements for air movement in habitable rooms)
Not being an activity that results, or two or more activities that together result, in the premises failing to receive natural air changes at a rate of at least 0·5 per hour or failing to comply with the minimum ventilation requirements of Part 3.8.5 of the 2008 edition of the Building Code
Not being an activity that results, in the premises failing to receive natural air changes at a rate of at least 0·5 per hour or failing to comply with the minimum ventilation requirements of Part 3.8.5 of the 2008 edition of the Building Code
installation maintains natural air changes and ventilation at a rate that complies with the building code and other relevant legislation in force at the time of installation.
Must not be otherwise required by law The activity shall not compromise the condensation management of the building (refer provisions in the Australian Building Codes Board publication “Condensation in buildings – Information handbook”)

R E V I E W O F E N E R G Y E F F I C I E N C Y A C T I V I T I E S U N D E R T H E S A R E E S S C H E M E
R Final Report, Prepared for DSD by EES, BA and Common Capital, July 2014 50
Assessment Against Scheme Principles This activity aligns with all major policy objectives and consequently is recommended for continued inclusion in the REES scheme.
Table 22: Alignment with Policy Objectives for Building Sealing Activities
Policy Objective Reduces household and/or business energy use Provides a focus on low income households
Associated Objectives: Provides greenhouse gas emission benefits
Provides energy cost benefits
The following table provides an assessment of the activity against the new principles proposed for REES code. Table 23: Activity Alignment with REES General Principles – Floor Insulation
Principle Assessment
1. Provides evidence based energy savings
The basis for energy savings associated with this activity is well evidenced. Evidence is available in the form of both thermal simulation modelling and from a number of monitoring studies. It should be noted however that some rebound is known to be associated with this type of activity. Provided that such rebound is taken into account the savings can be considered verifiable.
2. Energy savings are additional to base case (BAU) and minimises free riders
As the activity requires that the existing source of infiltration be un-sealed the activity provides significant additionality over the pre-existing base case. At present, no regulations mandate the retrofit of draught proofing devices except possibly in relation to major building renovation activities which only affect about 2% of the housing stock annually (EES 2008). There is no known source of data in relation to the rate of retrofit of draught proofing devices in South Australia in the absence of government incentive schemes such as REES.
3. Reward best practice in relation to product performance
The proposed activity offers a broad range of sealing options. Activity providers can choose to include as many of the various sealing options as they see fit, each option providing additional credits. In addition, in relation to window and door seals, additional credit is offered for seals that are fixed using mechanical fixings (rather than basic adhesive fixings) on the basis that such fixings are more robust and consequently lead to improved persistence to the seal
4. Provides a means for ensuring quality assurance and participant satisfaction
All products are required to be installed in accordance with manufacturer’s instructions. In addition it is proposed that all works must be carried out in accordance with the National Construction Code BCA Section J3 and any applicable Australian Standards. Finally, in relation to the replacement of ceiling exhaust fans the use of a registered electrician is mandated.
5. Credible approach for the calculation of energy savings
Default savings factors provide a robust approach to the calculation of average energy savings across a wide range of household types. An additional climate zone has been introduced to account for regional differences in heating and cooling demands.
6. Provides scope for objective, cost effective and practical auditing
Auditing is relatively straight forward to undertake via a visual inspection of the installed products.
7. Good practice Best practice installation guidelines are covered by reference to the use of manufacturer’s instructions and the provisions of the National Construction Code BCA Section J3 and any applicable Australian Standards

R E V I E W O F E N E R G Y E F F I C I E N C Y A C T I V I T I E S U N D E R T H E S A R E E S S C H E M E
R Final Report, Prepared for DSD by EES, BA and Common Capital, July 2014 51
Principle Assessment
8. Harmonisation (as far as practical)
This activity is available in all jurisdictions (although not all jurisdictions carry the full range of variants). Each jurisdiction that lists this activity includes similar elements within their specifications for this activity although some of the details do vary (seeTable 21). This activity provides good scope for inter jurisdictional alignment, although climatic and space conditioning equipment profile difference between the various jurisdictions will mean that default savings factors will vary to some degree.
9. Safety and minimising overall risk
Activities are typically undertaken by qualified installers. In the more hazardous cases (eg electric exhaust fan replacement) products and their installation are required to comply with relevant Australian standards. Specific risks in relation to condensation management issues are also dealt with via reference to the provisions in the Australian Building Codes Board publication “Condensation in buildings – Information handbook
Energy Savings - Review Overview of methodology The estimate of energy savings that are expected to be realised from this activity are based on simulated (AccuRate) thermal load reductions associated with an average household with and without the draught proofing activity applied. Those thermal load reductions are then applied to a space conditioning stock model for South Australia in order that end use energy savings by fuel type can be derived. Finally the estimated state average household input energy saving is constrained to take account of three limiting factors:
Limitations on the additionality of the activity (if any)
The impact of “free riders”
The impact of any rebound The modelling method used in this study is based on that used in the study Energy Use in the Australian Residential Sector 1986-2020 (EES 2008). A schematic of that model is shown in Figure 38 . This is believed to be the most comprehensive “bottom up” model of residential energy use available and has been verified against top down (BREE) data. Further details regarding the methodology are contained in Appendix 3 - Thermal Modelling Method. An enhancement to the sealing of windows and or doors activities is a proposed new requirement that when undertaking these activities, in addition any gaps around the external perimeters of window or door frames/architraves or gaps between suspended timber floors and the underside of skirtings must be caulked with flexible, non-shrinking caulking. Estimates of the likely benefits from this additional sealing are difficult to quantify without further research, however some unpublished research undertaken in Victoria suggests that the benefits from the caulking of gaps is likely to be equal to or possibly more than the benefits derived from the fitting of seals to windows and doors. Consequently, the calculated benefits associated with the sealing of windows and doors alone have been doubled to account for the additional requirement to caulk other gaps as noted. As noted above this study also considered those factors that are likely to constrain the energy savings arising from the particular activity in the form of rebound effects these are also detailed at the rear of Appendix 3 - Thermal Modelling Method . The

R E V I E W O F E N E R G Y E F F I C I E N C Y A C T I V I T I E S U N D E R T H E S A R E E S S C H E M E
R Final Report, Prepared for DSD by EES, BA and Common Capital, July 2014 52
“rebound effect” or “comfort creep” is the perceived tendency of householder to increase their minimum comfort requirements following the application of building shell improvement measures. Such improvements in comfort requirements could take the form of changed thermostat settings and or an increase in actual conditioned floor area. The underlying assumptions used as the basis for the calculation of energy savings in this study are detailed in Table 4.
Table 24: Energy Savings Estimate – Underlying Key Assumptions (Building Sealing)
Parameter Value Basis / Comment
Energy Service Levels Space Heating and Cooling service including heating and cooling availability, time of use, zoning constraint and thermostat settings
State Weighted Average
Refer to Appendix 3 - Thermal Modelling Method for details
Pre-existing draught proofing Nil
Base Case Assumptions Building Stock State
Weighted Average
State average housing stock Refer to Appendix 3 - Thermal Modelling Method for details
Space Heating Equipment installed
State Weighted Average
State average stock of heating and cooling equipment – refer to Appendix 3 - Thermal Modelling Method for details
Climate Zones BCA 4 and 5 BCA 6
As agreed with DSD
Weather file type AccuRate TMY
REES Activity Assumptions
Door and window seals See comment column
Durable weather sealing or air sealing compressible material such as foam, polypropylene pile, flexible plastic, rubber compressible strip, fibrous seal or similar.
Exhaust fan seals “ ” self-closing sealing device
Chimney or fireplace “ ” Options: Permanently sealed Operable metal damper Removable seal (eg chimney balloons)
Wall vents “ ” Permanent seal
Lifetime and persistence
Product lifetime See Persistence Assumptions
Product persistence See comments column
Door seals – 5 years or 10 years for mechanically fixed Window seals – 5 years or 10 years for mechanically fixed Exhaust fans – 5 years Chimney – Permanent options 10 years Chimney – Removable options 5 years Wall vents - 10 years Generally these values match those proposed for use in NSW except in relation to
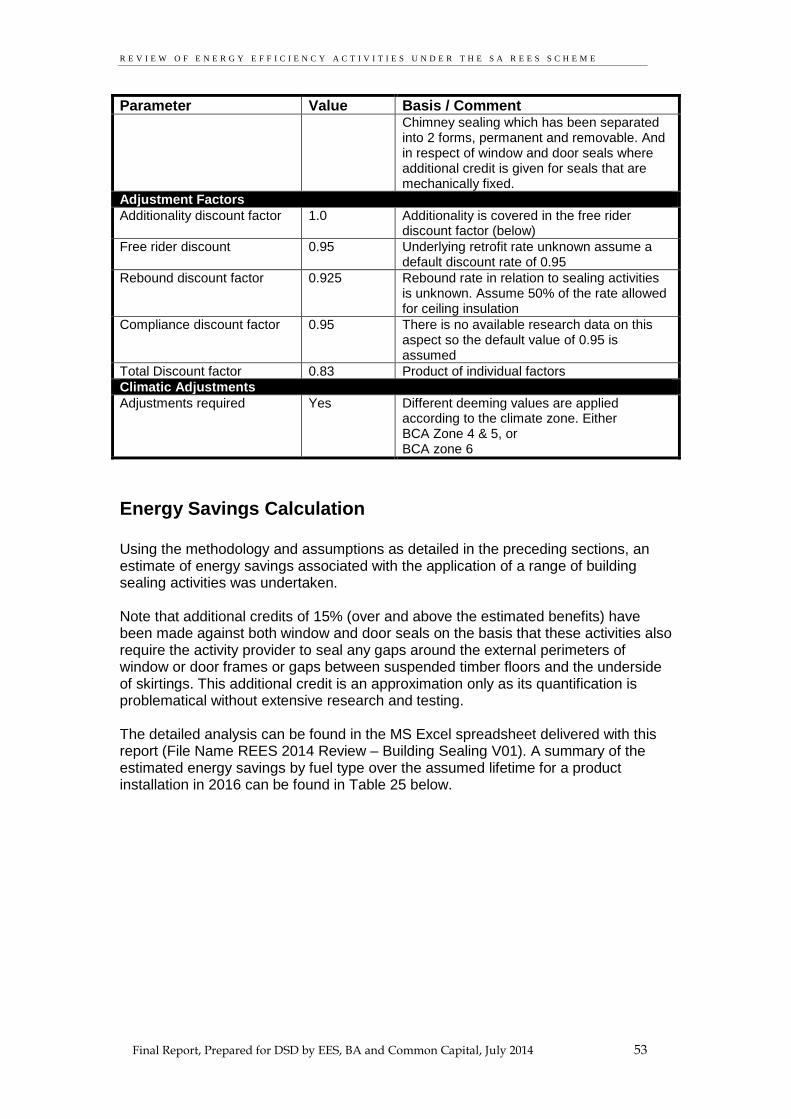
R E V I E W O F E N E R G Y E F F I C I E N C Y A C T I V I T I E S U N D E R T H E S A R E E S S C H E M E
R Final Report, Prepared for DSD by EES, BA and Common Capital, July 2014 53
Parameter Value Basis / Comment Chimney sealing which has been separated into 2 forms, permanent and removable. And in respect of window and door seals where additional credit is given for seals that are mechanically fixed.
Adjustment Factors
Additionality discount factor 1.0 Additionality is covered in the free rider discount factor (below)
Free rider discount 0.95 Underlying retrofit rate unknown assume a default discount rate of 0.95
Rebound discount factor 0.925 Rebound rate in relation to sealing activities is unknown. Assume 50% of the rate allowed for ceiling insulation
Compliance discount factor 0.95 There is no available research data on this aspect so the default value of 0.95 is assumed
Total Discount factor 0.83 Product of individual factors
Climatic Adjustments
Adjustments required Yes Different deeming values are applied according to the climate zone. Either BCA Zone 4 & 5, or BCA zone 6
Energy Savings Calculation Using the methodology and assumptions as detailed in the preceding sections, an estimate of energy savings associated with the application of a range of building sealing activities was undertaken. Note that additional credits of 15% (over and above the estimated benefits) have been made against both window and door seals on the basis that these activities also require the activity provider to seal any gaps around the external perimeters of window or door frames or gaps between suspended timber floors and the underside of skirtings. This additional credit is an approximation only as its quantification is problematical without extensive research and testing. The detailed analysis can be found in the MS Excel spreadsheet delivered with this report (File Name REES 2014 Review – Building Sealing V01). A summary of the estimated energy savings by fuel type over the assumed lifetime for a product installation in 2016 can be found in Table 25 below.

R E V I E W O F E N E R G Y E F F I C I E N C Y A C T I V I T I E S U N D E R T H E S A R E E S S C H E M E
R Final Report, Prepared for DSD by EES, BA and Common Capital, July 2014 54
Table 25: Energy Savings Estimate – (Building Sealing) Activity default energy savings The total Gigajoule equivalent energy (GJe) saved attributed to this activity per residential premises is
equal to: Activity Energy Savings = For Door sealing = Savings Factor (as per table below) x No. of doors sealed For Window sealing = Savings Factor (as per table below) x Lineal metres of window perimeter sealed For fireplace or chimney sealing = Savings Factor (as per table below) x No of f/places/chimneys sealed For exhaust fan sealing = Savings Factor (as per table below) x No. of exhaust fans sealed For Wall vent sealing = Savings Factor (as per table below) x No. Wall vents sealed Savings factors BCA Zones 5 & 6
Activity Electricity (GJ saved)
Gas (GJ saved)
Firewood (GJ saved)
Door Sealing (adhesive fix) 0.32 0.60 1.18
Door Sealing (mechanical fix) 0.64 1.18 2.38
Window Sealing (adhesive fix) 0.04 0.06 0.12
Window Sealing (mechanical fix) 0.06 0.12 0.26
Fireplace or chimney Sealing (permanent) 4.1 7.4 14.9
Fireplace or chimney Sealing (removable) 2.1 3.8 7.4
Exhaust fan sealing 0.12 0.24 0.47
Wall vent sealing 0.12 0.25 0.50
Savings factors BCA Zone 6
Activity Electricity (GJ saved)
Gas (GJ saved)
Firewood (GJ saved)
Door Sealing (adhesive fix) 0.46 1.04 2.06
Door Sealing (mechanical fix) 0.92 2.04 4.12
Window Sealing (adhesive fix) 0.04 0.10 0.22
Window Sealing (mechanical fix) 0.10 0.22 0.42
Fireplace or chimney Sealing (permanent) 5.60 12.24 24.79
Fireplace or chimney Sealing (removable) 2.88 6.32 12.38
Exhaust fan sealing 0.17 0.40 0.79
Wall vent sealing 0.17 0.41 0.83
Potential Compliance Issues The main concern in relation to compliance under the proposed specification would be the fitting of additional seals to already well sealed windows or doors. This potential risk should be managed through a robust compliance checking and enforcement program.
Recommended Specification The proposed specification (see following page) is based on the range specification provisions used across the various jurisdictions (including SA), effectively retaining

R E V I E W O F E N E R G Y E F F I C I E N C Y A C T I V I T I E S U N D E R T H E S A R E E S S C H E M E
R Final Report, Prepared for DSD by EES, BA and Common Capital, July 2014 55
the existing key requirements from the SA specifications and integrating what were considered to be valuable additional requirements from the other schemes.
Building Sealing Activities Activity No.
BS2
1. Activity Specific Definitions
Habitable Room means any space that can be occupied within a class 1 or class 2 dwelling. This does not include any attached garages, sheds or the like Permanent fireplace or chimney sealing means a sealing device that is not capable of removal from
the chimney or fireplace without the use of tools Removable fireplace or chimney sealing means a sealing device that is capable of removal from the
chimney or fireplace without the use of tools. For the purposes of this activity Removable fireplace or chimney sealing includes chimney balloons
2. Activity Description (Summary)
Installation of products designed to restrict or prevent air flow through doors, windows, chimneys/open fireplaces, exhaust fans or wall vents
3. Activity Eligibility Requirements 1. General: Any individual activity listed below or combination of activities may be undertaken at a
residential premises in circumstances where the particular sealing activity has not previously been undertaken. However, the installation of any of the noted building sealing activities must not be otherwise required by law, for example as condition of a development approval under the Development Act 1993.
2. Doors: Doors to be draught proofed must be on external walls of habitable rooms and present with
gaps between the door and frame and/or threshold that permit the infiltration of air into or out of the dwelling. All eligible doors at a residential premises must be draught proofed where practical.
3. Windows: Windows to be draught proofed must be on external walls of habitable rooms and
present with gaps between the sash and frame that permit the infiltration of air into or out of the dwelling. All eligible windows at a residential premises must be draught proofed where practical.
4. Chimneys/Fireplaces: The fireplace must be in a habitable room, be an open fireplace that is
unsealed and not have a pre-existing chimney damper. All eligible chimneys/fireplaces at a residential premises must be draught proofed where practical
5. Exhaust Fans: Exhaust fans to be draught proofed must be located in a habitable room and not
fitted with a self-closing sealing device. Note: for this activity either a self-closing damper can be fitted to an existing exhaust fan or alternatively the entire fan assembly can be replaced with a new fan assembly that includes an integral self-closing damper. All eligible exhaust fans at a residential premises must be draught proofed where practical.
6. Wall Vents: Wall vents to be draught proofed must be located in external walls of habitable rooms
and have an open area not less than 50 cm2
open to the outside air. External wall openings to underfloor spaces must not be sealed. All eligible wall vents at a residential premises must be draught proofed where practical.
4. Installed Product Requirements
The installed product must meet the following requirements Doors and Windows
1. The equipment to be applied must be a retail door bottom sealing product or door/window perimeter weather stripping product or a combination of the two as required
2. The product’s sealing surface must be made of a durable compressible material such as foam, polypropylene pile, flexible plastic, rubber compressible strip, fibrous seal or similar.
3. The product must not impair the proper operation of the door or window 4. The product, once applied, must effectively restrict the airflow into or out of the dwelling around the
perimeter of the door or window as applicable 5. The product must be fit for the purpose for which it is intended to be used, 6. The product must come with a minimum 2 year product warranty 7. In addition to the fitting of seals to either doors or windows in each habitable room treated, any gaps
around the external perimeters of window or door frames/architraves or gaps between suspended timber floors and the underside of skirtings must be caulked with flexible, non-shrinking caulking in ether clear finish or colour matched (as far as practical) to the surrounding surface (caulking colours should be agreed with the property owner before undertaking this work)

R E V I E W O F E N E R G Y E F F I C I E N C Y A C T I V I T I E S U N D E R T H E S A R E E S S C H E M E
R Final Report, Prepared for DSD by EES, BA and Common Capital, July 2014 56
Chimneys/Fireplaces
1. The damper must be durable fit for purpose and capable of effectively sealing the flue or chimney of an open fireplace
2. If the damper is designed to be used in an operable fireplace then it must be of a durable construction such that its operation is not adversely affected by the heat of a fire and when open it must not adversely affect the operation of the fireplace, in particular the chimney/flue’s capacity to “draw” smoke out of the firebox
3. The product must come with a minimum 5 year product warranty Exhaust Fans
The installed product must: 1. Be either a ceiling or wall exhaust fan that is fitted with a self-closing damper, flap or other sealing
product that can be closed to seal the exhaust of a fan and is suitable for installation in the location in which it is to be installed, or a product that is a self-closing damper, flap, filter or other sealing product that can be closed to seal the exhaust of a fan and is suitable for installation on the exhaust fan on which it is to be installed
2. Come with a minimum 2 year product warranty Wall Vents
1. The product must be a robust non shrinking permanent sealing material compatible with the surrounding wall construction and colour matched to the surrounding surface finish.
General Requirements (all forms of sealing device)
1. All products must be fit for purpose 2. All products must comply with any product safety or other product performance requirements in a
relevant code of practice or other relevant legislation applying to the activity.
5. Minimum Installation Requirements
1. All products must be installed in accordance with manufacturer’s instructions 2. Works must be carried out in accordance with the National Construction Code BCA Section J3 and
any applicable Australian Standards. 3. Any building sealing activity must comply with the South Australian Housing Code (minimum
requirements for air movement in habitable rooms). 4. No building sealing activity must occur in rooms that have an existing flue-less gas space heater or
a connection that could be used for a flue-less gas space heater. 5. Any product installed must be tested to ensure it is correctly installed, is operating correctly, and
does not interfere with the normal operation of the door, window, fire place or fan to which it is fixed. 6. The person undertaking this activity in a residential customer’s premises must satisfy the REES
Code mandatory safety training requirements. Registered Plumbers, Gas Fitters, Electricians and Building Work Supervisors are exempt from this requirement notwithstanding that in the case of complete replacement of a ceiling fan assembly, only a registered electrician may undertake this work.
7. The activity must be completed and certified in accordance with any relevant code or codes of practice and other relevant legislation applying to the activity, including any licensing, registration, statutory approval, activity certification, health, safety, environmental or waste disposal requirements;
8. The undertaking of the activity shall not compromise the condensation management of the building. Reference should be made to the provisions in the Australian Building Codes Board publication “Condensation in buildings – Information handbook”
Doors and Windows (additional requirements)
9. Draft proofing devices may be either adhesive fixed or mechanically fixed (or both). Different default savings factors apply based on the fixing type.
Chimneys/Fireplaces (additional requirements)
10. If the sealing device is not designed to be used in an operable fireplace (i.e. permanent sealing) the fireplace must be sealed such that access to the combustion chamber is also permanently sealed or if the firebox is not to be sealed then the fuel burning device must be clearly tagged as having been sealed.
11. If the sealing device is designed to be used in an operable fireplace (ie an operable damper) it must be installed in a manner that ensures that the safe operation of the fireplace is not compromised.

R E V I E W O F E N E R G Y E F F I C I E N C Y A C T I V I T I E S U N D E R T H E S A R E E S S C H E M E
R Final Report, Prepared for DSD by EES, BA and Common Capital, July 2014 57
12. If the sealing device can be removed without the use of tools (eg chimney balloons) then it is deemed to be removable, otherwise it is deemed to be permanent. Different default savings factors apply according to the type.
Wall vents (additional requirements)
13. Where a wall vent connects an inside space to the outside via a wall cavity, only the inside face of the wall vent shall be sealed. The wall cavity must remain connected via the opening in the external wall to the outside air.
14. Where a wall vent or vents are the only source of ventilation to a room (ie no windows or external doors) they shall not be sealed.
6. Activity default energy savings The total Gigajoule equivalent energy (GJe) saved attributed to this activity per residential premises is
equal to: Activity Energy Savings = For Door sealing = Savings Factor (as per table below) x No. of doors sealed For Window sealing = Savings Factor (as per table below) x Lineal metres of window perimeter sealed For fireplace or chimney sealing = Savings Factor (as per table below) x No of f/places/chimneys sealed For exhaust fan sealing = Savings Factor (as per table below) x No. of exhaust fans sealed For Wall vent sealing = Savings Factor (as per table below) x No. Wall vents sealed Savings factors BCA Zones 5 & 6
Activity Electricity (GJ saved)
Gas (GJ saved)
Firewood (GJ saved)
Door Sealing (adhesive fix) 0.32 0.60 1.18
Door Sealing (mechanical fix) 0.64 1.18 2.38
Window Sealing (adhesive fix) 0.04 0.06 0.12
Window Sealing (mechanical fix) 0.06 0.12 0.26
Fireplace or chimney Sealing (permanent) 4.1 7.4 14.9
Fireplace or chimney Sealing (removable) 2.1 3.8 7.4
Exhaust fan sealing 0.12 0.24 0.47
Wall vent sealing 0.12 0.25 0.50
Savings factors BCA Zone 6
Activity Electricity (GJ saved)
Gas (GJ saved)
Firewood (GJ saved)
Door Sealing (adhesive fix) 0.46 1.04 2.06
Door Sealing (mechanical fix) 0.92 2.04 4.12
Window Sealing (adhesive fix) 0.04 0.10 0.22
Window Sealing (mechanical fix) 0.10 0.22 0.42
Fireplace or chimney Sealing (permanent) 5.60 12.24 24.79
Fireplace or chimney Sealing (removable) 2.88 6.32 12.38
Exhaust fan sealing 0.17 0.40 0.79
Wall vent sealing 0.17 0.41 0.83
7. Guidance Notes (Informative only – not mandatory)
1. Nil

R E V I E W O F E N E R G Y E F F I C I E N C Y A C T I V I T I E S U N D E R T H E S A R E E S S C H E M E
R Final Report, Prepared for DSD by EES, BA and Common Capital, July 2014 58
Replace an inefficient window with a thermal efficient window – BS3A
Technical Assessment – BS3A
Window Replacement
REES Activity Reference: BS3A REES Activity title: Window Replacement Target: Improved building shell thermal performance Savings: Activity saves energy indirectly by reducing thermal loads on space conditioning equipment Pre-conditions: Must replace a single glazed pre-existing window

R E V I E W O F E N E R G Y E F F I C I E N C Y A C T I V I T I E S U N D E R T H E S A R E E S S C H E M E
R Final Report, Prepared for DSD by EES, BA and Common Capital, July 2014 59
Scheme Review - REES CURRENT REES ACTIVITY DESCRIPTION This activity currently does not form part of the REES scheme code. PROPOSED REES ACTIVITY DESCRIPTION The activity involves the replacement of a pre-existing window in the external wall of a residential premises with a new higher thermal performance window. Eligibility of the pre-existing window is defined differently in different jurisdictions. In the ACT the pre-existing window must have a performance level less than 4 stars under the WERS rating scheme. In NSW the pre-existing window simply needs to be a single glazed window and in Victoria there is no requirement. The simplest and most reliable approach is considered to be the NSW requirement (ie pre-existing single glazed window). The replacement window is generally defined in terms of its WERS rating. Different jurisdictions allow different ratings in the range from 4 stars to 6 stars (or better). For the proposed REES activity ratings of ≥ 4 WERS stars or ≥ 6 WERS stars are proposed. Victoria and the ACT also require a minimum area of window to be replaced in a single residential premises (5m2). In summary the activity is: “Replace an external single glazed window with a new thermally efficient window”
Scheme Review – Other jurisdictions The following jurisdictions also include a window replacement activity within their schemes:
Victoria (VEET schedule No 13 – Thermally efficient window)
NSW (ESS activity No D1 - Replace an external single-glazed window with a thermally efficient Window).
ACT (EEIS - Install a thermally efficient Window) Table 26 below provides a comparison of the key elements of each jurisdictions window replacement scheme.
Scheme Review - Potential of the activity (overview) The activity involves the replacement of a low thermal efficiency window or windows with new higher efficiency windows. Improved thermal efficiency of a window (typically a change from single to double glazing) fundamentally acts to reduce the rate of heat flow from areas of higher temperature (e.g. the heated interior of a dwelling) to areas of lower temperature (e.g. the exterior of a dwelling during a cold winter’s day). By limiting such heat flows, either out of a building in the winter or into the building in the summer it is possible to reduce the need for space conditioning (i.e. energy) as a means of maintaining acceptable internal comfort conditions for the dwellings occupants.

R E V I E W O F E N E R G Y E F F I C I E N C Y A C T I V I T I E S U N D E R T H E S A R E E S S C H E M E
R Final Report, Prepared for DSD by EES, BA and Common Capital, July 2014 60
Table 26: State Scheme Summary – Comparative table (Window Replacement)
Parameter SA – REES Scheme (Current)
VIC – VEET Scheme NSW – ESS Scheme (Published May 2014)
ACT – EEIS Scheme
SA – REES Scheme (Proposed)
Working Title Not undertaken in this jurisdiction
Thermally efficient Window Replace an external single-glazed window with a thermally efficient Window
Install a thermally efficient Window
Replace an external single glazed window with a new thermally efficient window
Activity Reference Number 13 D1 Part 1.4 BS3A
Required pre-condition 1 (pre-existing window)
No requirement apart from the window being located in an external wall
Single glazed window to a habitable room
Window must be located in an external wall. Existing glazing does not meet the minimum performance requirements for the activity ie < WERS 4
Single glazed window to a habitable room
Limitation on number of replacements per H Hold
None but minimum = 5 m2
replaced None m
2 basis
None but minimum = 5 m
2 replaced
None m
2 basis
Replacement unit performance options
Total U-value of not more than 4, is WERS rated and labelled to a minimum of 4 stars for heating Option 1 WERS 4 – 4.9 Option 2 WERS 5 – 5.9 Option 3 WERS 6 or more
Option 1 WERS 4 ( H=4, C=1.5 U =3.1) Option 2 WERS 6 (H=6, C=3, U = 2.3)
Total U-value of not more than 4, is WERS rated and labelled to a minimum of 4 stars for heating Option 1 WERS 4 – 4.9 Option 2 WERS 5 – 5.9 Option 3 WERS 6 or more
Option 1 WERS 4 ( H=4, C=1.5 U =3.1) Option 2 WERS 6 (H=6, C=3, U = 2.3)
Deemed Values per replacement
WERS 4 – 4.9: 0.394t CO2-e/m
2
WERS 5 – 5.9: 0.493t CO2-e/ m
2
WERS 6 or more : 0.591t CO2-e/ m
2
Based on glazed area
Varies by climate zone and replacement unit performance For climate zone 5/6 WERS 4 = 0.11 MWh/m
2
WERS 6 = 0.22 MWh/m2
WERS 4 – 4.9: 0.263t CO2-e/m
2
WERS 5 – 5.9: 0.328t CO2-e/ m
2
WERS 6 or more : 0.394t CO2-e/ m
2
Based on glazed area
Based on GJ saved by fuel type (see detailed specifications below)
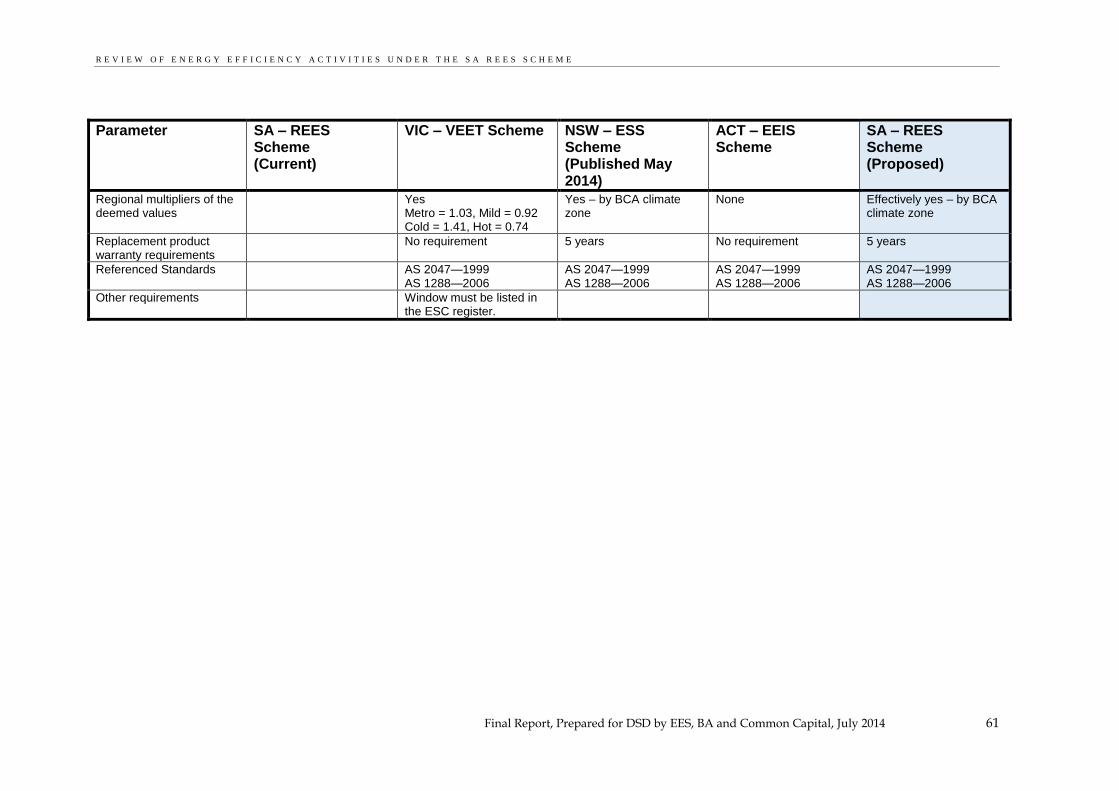
R E V I E W O F E N E R G Y E F F I C I E N C Y A C T I V I T I E S U N D E R T H E S A R E E S S C H E M E
R Final Report, Prepared for DSD by EES, BA and Common Capital, July 2014 61
Parameter SA – REES Scheme (Current)
VIC – VEET Scheme NSW – ESS Scheme (Published May 2014)
ACT – EEIS Scheme
SA – REES Scheme (Proposed)
Regional multipliers of the deemed values
Yes Metro = 1.03, Mild = 0.92 Cold = 1.41, Hot = 0.74
Yes – by BCA climate zone
None Effectively yes – by BCA climate zone
Replacement product warranty requirements
No requirement 5 years No requirement 5 years
Referenced Standards AS 2047—1999 AS 1288—2006
AS 2047—1999 AS 1288—2006
AS 2047—1999 AS 1288—2006
AS 2047—1999 AS 1288—2006
Other requirements Window must be listed in the ESC register.

R E V I E W O F E N E R G Y E F F I C I E N C Y A C T I V I T I E S U N D E R T H E S A R E E S S C H E M E
R Final Report, Prepared for DSD by EES, BA and Common Capital, July 2014 62
Single glazed windows represent a particular weakness in the thermal resistance of the building fabric typically having a resistance less than one tenth of an insulated wall that might surround the window. Replacing low thermal performance windows with higher thermal performance windows can therefore significantly improve the thermal performance of the building fabric. In addition, low thermal performance windows can also lead to significant radiation losses in winter from the side of an occupant that is facing the cold glass surface. Cold glass surfaces can also generate cold draughts, consequently, having poorly performing glazing in a room can lead to occupants setting higher than normal thermostat settings in the winter in an attempt to counter both the direct radiant losses and draughts that tend to induce a sense of coldness in the occupant despite the ambient temperature being within the usual range of acceptance. The energy savings and health benefits that are associated with this activity means that generally it aligns well with the policy objectives. The activity does however come with a high capital cost. This cost typically means that the activity is not cost effective unless it is being undertaken at the end of the pre-existing windows lifetime. In these circumstances the cost is only the marginal cost difference between single and double glazing which can be as low as $100 per m2.
Assessment Against Scheme Principles This activity aligns with all major policy objectives. The activity is considered suitable for uptake by low income households only in circumstances where the window was to be replaced in any case (ie generally at the end of the pre-existing windows lifespan)
Table 27: Alignment with Policy Objectives for Window Replacement
Policy Objective Reduces household and/or business energy use Provides a focus on low income households *
Associated Objectives: Provides greenhouse gas emission benefits
Provides energy cost benefits * see note above regarding applicability to low income households
The following table provides an assessment of the activity against the new principles proposed for REES code. Table 28: Activity Alignment with REES General Principles – Window Replacement
Principle Assessment
1. Provides evidence based energy savings
The basis for energy savings associated with this activity is well evidenced. Evidence is available in the form of both thermal simulation modelling, WERS rating data and from a number of monitoring studies.
2. Energy savings are additional to base case (BAU) and minimises free riders
As the proposed activity specification requires that the existing window be single glazed the activity provides significant additionality over the base case.
At present no regulations mandate the retrofit of high performance windows except in relation to some major building renovation activities which only affect about 2% of the housing stock annually (EES 2008). Whilst high performance windows are becoming quite common in new housing where BCA minimum building shell standards apply, in relation to retrofit activities to existing dwellings the practice of using high performance windows is still relatively uncommon. Consequently this activity provides significant scope for additionality over the BAU case.
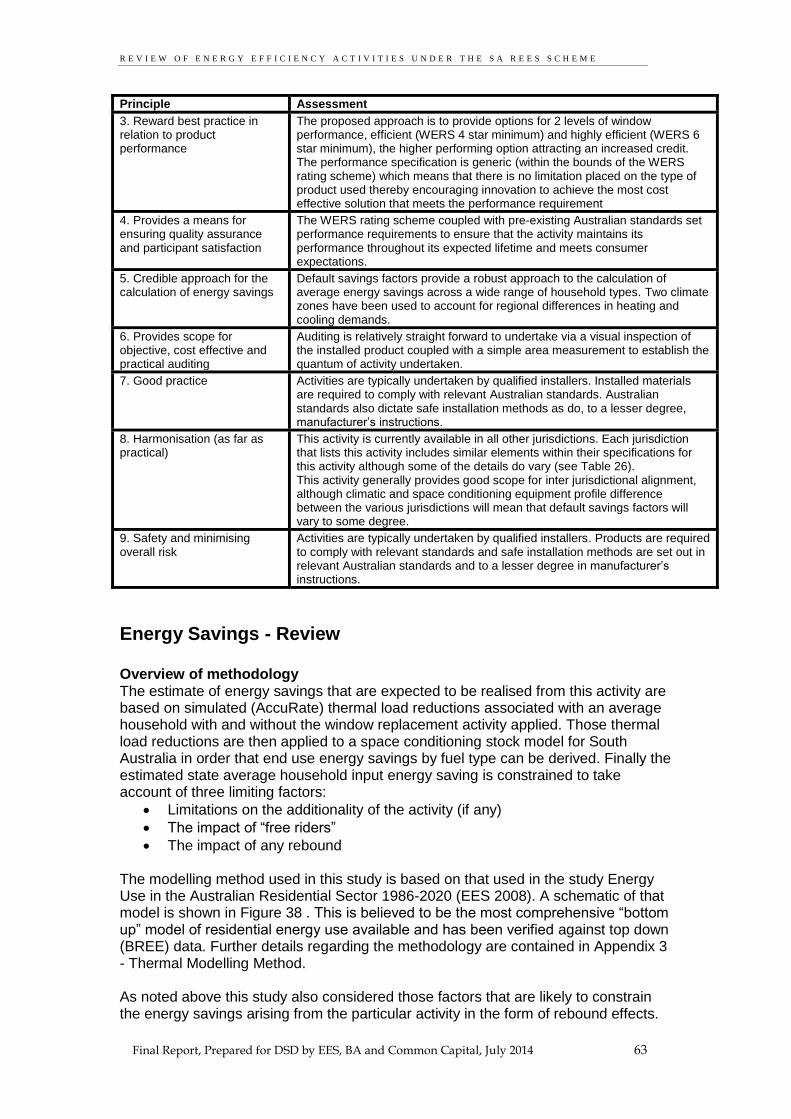
R E V I E W O F E N E R G Y E F F I C I E N C Y A C T I V I T I E S U N D E R T H E S A R E E S S C H E M E
R Final Report, Prepared for DSD by EES, BA and Common Capital, July 2014 63
Principle Assessment
3. Reward best practice in relation to product performance
The proposed approach is to provide options for 2 levels of window performance, efficient (WERS 4 star minimum) and highly efficient (WERS 6 star minimum), the higher performing option attracting an increased credit. The performance specification is generic (within the bounds of the WERS rating scheme) which means that there is no limitation placed on the type of product used thereby encouraging innovation to achieve the most cost effective solution that meets the performance requirement
4. Provides a means for ensuring quality assurance and participant satisfaction
The WERS rating scheme coupled with pre-existing Australian standards set performance requirements to ensure that the activity maintains its performance throughout its expected lifetime and meets consumer expectations.
5. Credible approach for the calculation of energy savings
Default savings factors provide a robust approach to the calculation of average energy savings across a wide range of household types. Two climate zones have been used to account for regional differences in heating and cooling demands.
6. Provides scope for objective, cost effective and practical auditing
Auditing is relatively straight forward to undertake via a visual inspection of the installed product coupled with a simple area measurement to establish the quantum of activity undertaken.
7. Good practice Activities are typically undertaken by qualified installers. Installed materials are required to comply with relevant Australian standards. Australian standards also dictate safe installation methods as do, to a lesser degree, manufacturer’s instructions.
8. Harmonisation (as far as practical)
This activity is currently available in all other jurisdictions. Each jurisdiction that lists this activity includes similar elements within their specifications for this activity although some of the details do vary (see Table 26). This activity generally provides good scope for inter jurisdictional alignment, although climatic and space conditioning equipment profile difference between the various jurisdictions will mean that default savings factors will vary to some degree.
9. Safety and minimising overall risk
Activities are typically undertaken by qualified installers. Products are required to comply with relevant standards and safe installation methods are set out in relevant Australian standards and to a lesser degree in manufacturer’s instructions.
Energy Savings - Review Overview of methodology The estimate of energy savings that are expected to be realised from this activity are based on simulated (AccuRate) thermal load reductions associated with an average household with and without the window replacement activity applied. Those thermal load reductions are then applied to a space conditioning stock model for South Australia in order that end use energy savings by fuel type can be derived. Finally the estimated state average household input energy saving is constrained to take account of three limiting factors:
Limitations on the additionality of the activity (if any)
The impact of “free riders”
The impact of any rebound The modelling method used in this study is based on that used in the study Energy Use in the Australian Residential Sector 1986-2020 (EES 2008). A schematic of that model is shown in Figure 38 . This is believed to be the most comprehensive “bottom up” model of residential energy use available and has been verified against top down (BREE) data. Further details regarding the methodology are contained in Appendix 3 - Thermal Modelling Method. As noted above this study also considered those factors that are likely to constrain the energy savings arising from the particular activity in the form of rebound effects.

R E V I E W O F E N E R G Y E F F I C I E N C Y A C T I V I T I E S U N D E R T H E S A R E E S S C H E M E
R Final Report, Prepared for DSD by EES, BA and Common Capital, July 2014 64
The “rebound effect” or “comfort creep” is the perceived tendency of householder to increase their minimum comfort requirements following the application of building shell improvement measures. Such improvements in comfort requirements could take the form of changed thermostat settings and or an increase in actual conditioned floor area. As noted earlier in this section, the installation of high performance glazing provides an increase in comfort levels in the absence of any changes to thermostat levels. This means that lower rather than higher thermostat settings in the winter months are likely to be adopted following the application of this activity. On the other hand occupants may choose to condition more of their dwelling following application of this activity. These two factors would be expected to tend to cancel each other out and on this basis no allowance for rebound is recommended. The underlying assumptions used as the basis for the calculation of energy savings in this study are detailed in Table 29.
Table 29: Energy Savings Estimate – Underlying Key Assumptions (Window Replacement)
Parameter Value Basis / Comment
Energy Service Levels Space Heating and Cooling service including heating and cooling availability, time of use, zoning constraint and thermostat settings
State Weighted Average
Refer to Appendix 3 - Thermal Modelling Method for details
Pre-existing window performance
Single glazed Metal frame
Base Case Assumptions Building Stock State
Weighted Average
State average housing stock Refer to Appendix 3 - Thermal Modelling Method for details
Space Heating Equipment installed
State Weighted Average
State average stock of heating and cooling equipment – refer to Appendix 3 - Thermal Modelling Method for details
Climate Zones BCA 4 and 5 BCA 6
As agreed with DSD
Weather file type AccuRate TMY
REES Activity Assumptions
Performance of Installed Windows
WERS 4 star WERS 6 Star
Aligns with ESS scheme
Lifetime and persistence
Product lifetime 30 years As used in NSW ESS scheme
Product persistence 30 years As used in NSW ESS scheme
Adjustment Factors
Additionality discount factor 1.0 Additionality is covered in the free rider discount factor (below)
Free rider discount 0.95 Underlying retrofit rate is unknown. 0.95 is a guesstimate
Rebound discount factor 1.0 See discussion in above section
Compliance discount factor 0.95 There is no available research data on this aspect so the default value of 0.95 is assumed.
Total Discount factor 0.9 Product of individual factors

R E V I E W O F E N E R G Y E F F I C I E N C Y A C T I V I T I E S U N D E R T H E S A R E E S S C H E M E
R Final Report, Prepared for DSD by EES, BA and Common Capital, July 2014 65
Climatic Adjustments
Adjustments required Yes Different deeming values are applied according to the climate zone. Either BCA Zone 4 & 5, or BCA zone 6
Energy Savings Calculation Using the methodology and assumptions as detailed in the preceding sections, an estimate of energy savings associated with the replacement of single glazed windows with new higher thermal performance windows. The detailed analysis can be found in the MS Excel spreadsheet delivered with this report (File Name REES 2014 Review – Window Replacement V01). A summary of the estimated energy savings by fuel type over the assumed lifetime for a product installation in 2016 can be found in Table 5 below.
Potential Compliance Issues There are no particular compliance issues associated with this activity. However random checks to ensure that the installed product meets the required specification should be undertaken as a matter of course
Table 30: Energy Savings Estimate – (Window Replacement) Activity default energy savings The total Gigajoule equivalent energy (GJe) saved attributed to this activity per residential premises is
equal to: Activity Energy Savings = (Savings Factor (as per table below) x Total Window Area)
Activity Electricity (GJ saved/ m
2)
Gas (GJ saved/ m
2)
Firewood (GJ saved/ m
2)
4 Star Window (BCA Zones 4&5) 0.25 0.22 0.45
6 Star Window (BCA Zones 4&5) 0.46 0.6 1.25
4 Star Window (BCA Zones 6) 0.24 0.36 0.75
6 Star Window (BCA Zones 6) 0.54 1.02 2.12
Recommended Specification The proposed specification (see following page) is based on the specifications applied in other jurisdictions but with the following differences:
The terms “habitable room”, “thermally efficient window” and “WERS” and “System U-Value” are defined terms
There is no minimum area of window that is required to be treated (as per the Victorian and ACT schemes). Such restrictions could unnecessarily limit the flexibility of the scheme.

R E V I E W O F E N E R G Y E F F I C I E N C Y A C T I V I T I E S U N D E R T H E S A R E E S S C H E M E
R Final Report, Prepared for DSD by EES, BA and Common Capital, July 2014 66
Window Replacement Activity No.
BS3A
1. Activity Specific Definitions
Habitable Room means any space that can be occupied within a class 1 or class 2 dwelling. This does not include any attached garages, sheds or the like Thermally efficient window means a window (including glazing and frame) that meets the
requirements of Table BS3A.1 below WERS means the Window Energy Rating Scheme managed by the Australian Window Association System U-Value means the thermal transmittance, in W/m
2K, of a window system including glass,
sash and frame, as registered under WERS.
Table BS3A.1 : Minimum requirements for a thermally efficient window
Window Rating Min. WERS Star Rating Heating Mode
Min. WERS Star Rating Cooling Mode
Maximum System U Value (W/m
2K)
4 star Minimum 4 stars 1.5 stars 3.1
6 star Minimum 6 stars 3.5 stars 2.3
2. Activity Description (Summary)
Replace an external single glazed window with a new thermally efficient window
3. Activity Eligibility Requirements
1. Pre-existing windows to be replaced must be single glazed and located in an external wall of a habitable room
2. The installation of thermally efficient windows must not be otherwise required by law, for example as condition of a development approval under the Development Act 1993.
4. Installed Product Requirements
The installed product must : 1. be a window product (glazing and frame) rated by WERS. 2. comply with the effective version of AS 2047 and AS 1288. 3. be either a 4 or 5 Star Window, or a 6 Star Window in accordance with the minimum requirements
for a thermally efficient window as detailed in the table above. 4. have a warranty of at least 5 years. 5. comply with any product safety or other product performance requirements in a relevant code of
practice or other relevant legislation applying to the activity. 6. Be fit for the purpose for which it is intended to be used
5. Minimum Installation Requirements
1. All products must be installed in accordance with manufacturer’s instructions 2. The window must be installed in compliance with the effective versions of AS 2047 and AS 1288. 3. The window frame must be effectively sealed around its entire perimeter to prevent infiltration of
outside air 4. The activity must be completed and certified in accordance with any relevant code or codes of
practice and other relevant legislation applying to the activity, including any licensing, registration, statutory approval, activity certification, health, safety, environmental or waste disposal requirements;
6. Activity default energy savings The total Gigajoule equivalent energy (GJe) saved attributed to this activity per residential premises is
equal to: Activity Energy Savings = (Savings Factor (as per table below) x Total Window Area)
Activity Electricity (GJ saved/ m
2)
Gas (GJ saved/ m
2)
Firewood (GJ saved/ m
2)
4 Star Window (BCA Zones 4&5) 0.25 0.22 0.45
6 Star Window (BCA Zones 4&5) 0.46 0.6 1.25
4 Star Window (BCA Zones 6) 0.24 0.36 0.75
6 Star Window (BCA Zones 6) 0.54 1.02 2.12
7. Guidance Notes (Informative only – not mandatory)
1. Nil

R E V I E W O F E N E R G Y E F F I C I E N C Y A C T I V I T I E S U N D E R T H E S A R E E S S C H E M E
R Final Report, Prepared for DSD by EES, BA and Common Capital, July 2014 67
Secondary Glazing Retrofit - BS3B
Technical Assessment – BS3B
Secondary Glazing Retrofit
REES Activity Reference: BS3B REES Activity title: Secondary Glazing Retrofit Target: Improved building shell thermal performance Savings: Activity saves energy indirectly by reducing thermal loads on space conditioning equipment Pre-conditions: Pre-existing windows to be retrofitted must be single glazed

R E V I E W O F E N E R G Y E F F I C I E N C Y A C T I V I T I E S U N D E R T H E S A R E E S S C H E M E
R Final Report, Prepared for DSD by EES, BA and Common Capital, July 2014 68
Scheme Review - REES CURRENT REES ACTIVITY DESCRIPTION This activity currently does not form part of the REES scheme code. PROPOSED REES ACTIVITY DESCRIPTION The activity involves the application of a second sheet of glazing (including air gap) to a pre-existing single glazed window in the external wall of a residential premises. The activity results in a still air gap being created between the single glazed pre-existing window and the applied glazing sheet (effectively creating a double glazed unit) thereby raising the thermal efficiency performance of the window. Eligibility of the pre-existing window is defined similarly in each jurisdiction that offers this activity. The pre-existing window simply needs to be a single glazed window. In Victoria and the ACT the applied glazing is simply specified as either a glass/acrylic product or a film. In NSW film products are not permitted, only glass/polycarbonate/acrylic type products are permitted and the final assembly must meet a WERS minimum performance standard in the range from 4 stars to 6 stars (or better). The use of films, whilst relatively inexpensive, is not recommended. Unlike rigid plastics and glass, film is not robust, can be easily damaged and can suffer seal failure. In addition, anecdotally, homeowners consider that the product looks “cheap” and have been known to remove the product for this reason. The other advantage of rigid products is that a range of these have been rated under the WERS scheme and their performance has therefore been established through recognised test methods. Finally, in consideration of potential condensation issues that may arise between the two glazing sheets the specification is proposed to permit only secondary glazing that is removable (by the householder) In summary the activity is: “Retrofit secondary glazing to a pre-existing single glazed window in the external wall of a residential premises.” .
Scheme Review – Other jurisdictions The following jurisdictions also include a window replacement activity within their schemes:
Victoria (VEET schedule No 14 – Installation Of Product On Single Glazed Window Raising Thermal Efficiency)
NSW (ESS activity No D2 - Modify An External Window By Installing Secondary Glazing).
ACT (EEIS part 1.5- Retrofit thermally efficient glazing) Table 31below provides a comparison of the key elements of each jurisdictions secondary glazing retrofit scheme.

R E V I E W O F E N E R G Y E F F I C I E N C Y A C T I V I T I E S U N D E R T H E S A R E E S S C H E M E
R Final Report, Prepared for DSD by EES, BA and Common Capital, July 2014 69
Table 31: State Scheme Summary – Comparative table (Secondary Glazing Retrofit)
Parameter SA – REES Scheme (Current)
VIC – VEET Scheme
NSW – ESS Scheme (Published May 2014)
ACT – EEIS Scheme
SA – REES Scheme (Proposed)
Working Title Not undertaken in this jurisdiction
Installation of product on single glazed Window raising thermal efficiency
Modify an external window by installing secondary glazing
Retrofit thermally efficient glazing
Secondary glazing retrofit
Activity Reference Number 14 D2 Part 1.5 BS3B
Required pre-condition 1 (pre-existing window)
Single glazed window in an external wall
Single glazed window to a habitable room
Single glazed window in an external wall of a habitable area
Single glazed window to a habitable room
Limitation on number of replacements per H Hold
None but minimum = 5 m
2 to be modified
None None None
Replacement unit performance options
A product that, when installed on a single glazed window, results in a still air gap being created between the single glazed window and the product and raises the thermal efficiency performance of the window Option 1 Glass or Acrylic Option 2 Film
A secondary glazing product that retrofits a second glazing sheet (e.g. glass or acrylic or polycarbonate) to an existing single glazed window so as to form a still air gap between Option 1 WERS 4 ( H=4, C=1.5 U =3.1) Option 2 WERS 6 (H=6, C=3, U = 2.3)
Deemed Values per replacement
Glass or Acrylic = 0.213t CO2-e/m
2
Film = 0.071t CO2-e/m2
Difference assumed to be related mainly to longevity
Varies by climate zone and replacement unit performance For climate zone 5/6 WERS 4 = 0.04 MWh/m
2
WERS 6 = 0.07 MWh/m2
Glass or Acrylic = 0.179t CO2-e/m
2
Film = 0.083t CO2-e/m2
Difference assumed to be related mainly to longevity
Based on GJ saved by fuel type (see detailed specifications below)
Regional multipliers of the deemed values
Metro = 1.03, Mild = 0.92 Cold = 1.41, Hot = 0.74
Yes – by BCA climate zone None Effectively yes – by BCA climate zone
Replacement product warranty requirements
No requirement 5 years No requirement 5 years
Referenced Standards None AS 2047—1999 complies with any AS 2047—1999

R E V I E W O F E N E R G Y E F F I C I E N C Y A C T I V I T I E S U N D E R T H E S A R E E S S C H E M E
R Final Report, Prepared for DSD by EES, BA and Common Capital, July 2014 70
Parameter SA – REES Scheme (Current)
VIC – VEET Scheme
NSW – ESS Scheme (Published May 2014)
ACT – EEIS Scheme
SA – REES Scheme (Proposed)
AS 1288—2006 product safety or other product requirements in a relevant code of practice or other relevant legislation.
AS 1288—2006
Other requirements Assumed persistence = 10 years
Films are not permitted and the secondary glazing must be easily removable

R E V I E W O F E N E R G Y E F F I C I E N C Y A C T I V I T I E S U N D E R T H E S A R E E S S C H E M E
R Final Report, Prepared for DSD by EES, BA and Common Capital, July 2014 71
Scheme Review - Potential of the activity (overview) The activity involves the upgrading of the thermal efficiency of a single glazed window to a higher thermal efficiency glazing via the application of a second sheet of glazing (including air gap). Improved thermally efficiency of a window (via a change from single to double glazing) fundamentally acts to reduce the rate of heat flow from areas of higher temperature (e.g. the heated interior of a dwelling) to areas of lower temperature (e.g. the exterior of a dwelling during a cold winter’s day). By limiting such heat flows, either out of a building in the winter or into the building in the summer it is possible to reduce the need for space conditioning (i.e. energy) as a means of maintaining acceptable internal comfort conditions for the dwellings occupants. Single glazed windows represent a particular weakness in the thermal resistance of the building fabric typically having a resistance less than one tenth of an insulated wall that might surround the window. Replacing low thermal performance windows with higher thermal performance windows can therefore significantly improve the thermal performance of the building fabric. In addition, low thermal performance windows can also lead to significant radiation losses in winter from the side occupants that is facing the cold glass surface Cold glass surfaces can also generate cold draughts, consequently, having poorly performing glazing in a room can lead to occupants setting higher than normal thermostat settings in the winter in an attempt to counter the direct radiant losses and draughts that induce a sense of coldness in the occupant despite the ambient temperature being within the usual range of acceptance. The energy savings and health benefits that are associated with this activity means that generally it aligns well with the policy objectives. The activity does however come with a relatively high capital cost compared to the benefits.
Assessment Against Scheme Principles This activity aligns with all major policy objectives. The activity may be suitable for low income households where the area to be treated is modest in size (ie relatively low capital cost).
Table 32: Alignment with Policy Objectives for Window Replacement
Policy Objective Reduces household and/or business energy use Provides a focus on low income households *
Associated Objectives: Provides greenhouse gas emission benefits
Provides energy cost benefits * see note above regarding applicability to low income households

R E V I E W O F E N E R G Y E F F I C I E N C Y A C T I V I T I E S U N D E R T H E S A R E E S S C H E M E
R Final Report, Prepared for DSD by EES, BA and Common Capital, July 2014 72
The following table provides an assessment of the activity against the new principles proposed for REES code. Table 33: Activity Alignment with REES General Principles – Window Replacement
Principle Assessment
1. Provides evidence based energy savings
The basis for energy savings associated with this activity is well evidenced. Evidence is available in the form of both thermal simulation modelling, WERS rating data and from a number of monitoring studies.
2. Energy savings are additional to base case (BAU) and minimises free riders
As the proposed activity specification requires that the existing window be single glazed the activity provides significant additionality over the base case.
At present no regulations mandate the retrofit of high performance glazing except in relation to some major building renovation activities which only affect about 2% of the housing stock annually (EES 2008). Whilst high performance glazing is becoming quite common in new housing where BCA minimum building shell standards apply in relation to retrofit activities to existing dwellings the practice of glazing retrofit is still relatively uncommon. Consequently this activity provides significant scope for additionality over the BAU case.
3. Reward best practice in relation to product performance
The proposed approach is to provide options for 2 levels of window performance, efficient (WERS 4 star minimum) and highly efficient (WERS 6 star minimum), the higher performing option attracting an increased credit. The performance specification is generic (within the bounds of the WERS rating scheme) which means that there is little limitation placed on the type of product used thereby encouraging innovation to achieve the most cost effective solution that meets the performance requirement
4. Provides a means for ensuring quality assurance and participant satisfaction
The WERS rating scheme coupled with pre-existing Australian standards set performance requirements to ensure that the activity maintains its performance throughout its expected lifetime and meets consumer expectations. To further enhance quality assurance, only rigid secondary glazing materials have been permitted under the proposed activity specification.
5. Credible approach for the calculation of energy savings
Default savings factors provide a robust approach to the calculation of average energy savings across a wide range of household types. Two climate zones have been used to account for regional differences in heating and cooling demands.
6. Provides scope for objective, cost effective and practical auditing
Auditing is relatively straight forward to undertake via a visual inspection of the installed product coupled with a simple area measurement to establish the quantum of activity undertaken.
7. Good practice Activities are typically undertaken by qualified installers. Installed materials are required to comply with relevant Australian standards. Australian standards also dictate safe installation methods as do, to a lesser degree, manufacturer’s instructions.
8. Harmonisation (as far as practical)
This activity is currently available in all other jurisdictions. Each jurisdiction that lists this activity includes similar elements within their specifications for this activity although some of the details do vary (see Table 31). This activity generally provides good scope for inter jurisdictional alignment, although climatic and space conditioning equipment profile difference between the various jurisdictions will mean that default savings factors will vary to some degree.
9. Safety and minimising overall risk
Activities are typically undertaken by qualified installers. Products are required to comply with relevant standards and safe installation methods are set out in relevant Australian standards and to a lesser degree in manufacturer’s instructions.

R E V I E W O F E N E R G Y E F F I C I E N C Y A C T I V I T I E S U N D E R T H E S A R E E S S C H E M E
R Final Report, Prepared for DSD by EES, BA and Common Capital, July 2014 73
Energy Savings - Review Overview of methodology The estimate of energy savings that are expected to be realised from this activity are based on simulated (AccuRate) thermal load reductions associated with an average household with and without the window retrofit activity applied. Those thermal load reductions are then applied to a space conditioning stock model for South Australia in order that end use energy savings by fuel type can be derived. Finally the estimated state average household input energy saving is constrained to take account of three limiting factors:
Limitations on the additionality of the activity (if any)
The impact of “free riders”
The impact of any rebound The modelling method used in this study is based on that used in the study Energy Use in the Australian Residential Sector 1986-2020 (EES 2008). A schematic of that model is shown in Figure 38 . This is believed to be the most comprehensive “bottom up” model of residential energy use available and has been verified against top down (BREE) data. Further details regarding the methodology are contained in Appendix 3 - Thermal Modelling Method. As noted above this study also considered those factors that are likely to constrain the energy savings arising from the particular activity in the form of rebound effects. The “rebound effect” or “comfort creep” is the perceived tendency of householder to increase their minimum comfort requirements following the application of building shell improvement measures. Such improvements in comfort requirements could take the form of changed thermostat settings and or an increase in actual conditioned floor area. As noted earlier in this section however, the installation of high performance glazing provides an increase in comfort levels in the absence of any changes to thermostat levels. This means that lower rather than higher thermostat settings in the winter months are likely to be adopted following the application of this activity. On the other hand occupants may choose to condition more of their dwelling following application of this activity. These two factors tend to cancel each other out and on this basis no allowance for rebound is recommended. The underlying assumptions used as the basis for the calculation of energy savings in this study are detailed in Table 34.
Table 34: Energy Savings Estimate – Underlying Key Assumptions (Window Replacement)
Parameter Value Basis / Comment
Energy Service Levels Space Heating and Cooling service including heating and cooling availability, time of use, zoning constraint and thermostat settings
State Weighted Average
Refer to Appendix 3 - Thermal Modelling Method for details
Pre-existing window performance
Single glazed Metal frame

R E V I E W O F E N E R G Y E F F I C I E N C Y A C T I V I T I E S U N D E R T H E S A R E E S S C H E M E
R Final Report, Prepared for DSD by EES, BA and Common Capital, July 2014 74
Base Case Assumptions Building Stock State
Weighted Average
State average housing stock Refer to Appendix 3 - Thermal Modelling Method for details
Space Heating Equipment installed
State Weighted Average
State average stock of heating and cooling equipment – refer to Appendix 3 - Thermal Modelling Method for details
Climate Zones BCA 4 and 5 BCA 6
As agreed with DSD
Weather file type AccuRate TMY
REES Activity Assumptions
Performance of upgraded Windows
WERS 4 star WERS 6 Star
Aligns with NSW ESS scheme
Lifetime and persistence
Product lifetime 15 years Assumes window is at half expected lifetime of 30 years when retrofitted (Note: ESS scheme assumes only 10 years)
Product persistence 15 years Assumes window is at half expected lifetime of 30 years when retrofitted (Note: ESS scheme assumes only 10 years)
Adjustment Factors
Additionality discount factor 1.0 Additionality is covered in the free rider discount factor (below)
Free rider discount 0.95 Underlying retrofit rate is unknown. 0.95 is a conservative guesstimate
Rebound discount factor 1.0 See discussion in above section
Compliance discount factor 0.95 There is no available research data on this aspect so the default value of 0.95 is assumed.0
Total Discount factor 0.9 Product of individual factors
Climatic Adjustments
Adjustments required Yes Different deeming values are applied according to the climate zone. Either BCA Zone 4 & 5, or BCA zone 6
Energy Savings Calculation Using the methodology and assumptions as detailed in the preceding sections, an estimate of energy savings associated with the application of a second sheet of glazing (including air gap) to a pre-existing single glazed window was made. The detailed analysis can be found in the MS Excel spreadsheet delivered with this report (File Name REES 2014 Review – Window Retrofit V01). A summary of the estimated energy savings by fuel type over the assumed lifetime for a product installation in 2016 can be found in Table 35 below.

R E V I E W O F E N E R G Y E F F I C I E N C Y A C T I V I T I E S U N D E R T H E S A R E E S S C H E M E
R Final Report, Prepared for DSD by EES, BA and Common Capital, July 2014 75
Table 35: Energy Savings Estimate – (Secondary Glazing Retrofit) 6. Activity default energy savings The total Gigajoule equivalent energy (GJe) saved attributed to this activity per residential premises is
equal to: Activity Energy Savings = (Savings Factor (as per table below) x Total Window Area)
Activity Electricity (GJ saved/ m
2)
Gas (GJ saved/ m
2)
Firewood (GJ saved/ m
2)
4 Star Window (BCA Zones 4&5) 0.13 0.11 0.23
6 Star Window (BCA Zones 4&5) 0.23 0.31 0.63
4 Star Window (BCA Zones 6) 0.12 0.18 0.37
6 Star Window (BCA Zones 6) 0.27 0.52 1.06
Potential Compliance Issues There are no particular compliance issues associated with this activity. However random checks to ensure that the installed product meets the required specification should be undertaken as a matter of course.
Recommended Specification The proposed specification (see following page) is based on the specifications applied in other jurisdictions but with the following differences
The terms “habitable room”, “thermally efficient window” and “WERS” and “Sustem U-Value” are defined terms
There is no minimum area of window that is required to be treated (as per the Victorian and ACT schemes). Such restrictions could limit the flexibility of the scheme.

R E V I E W O F E N E R G Y E F F I C I E N C Y A C T I V I T I E S U N D E R T H E S A R E E S S C H E M E
R Final Report, Prepared for DSD by EES, BA and Common Capital, July 2014 76
Secondary Glazing Retrofit Activity No.
BS3B
1. Activity Specific Definitions
Habitable Room means any space that can be occupied within a class 1 or class 2 dwelling. This does not include any attached garages, sheds or the like Secondary Glazing means a removable rigid sheet of glass, acrylic or polycarbonate that is fitted to an
existing single glazed window so as to create a still air gap between the sheets. For the purposes of this activity description “secondary glazing” does not include any form of film. Thermally efficient window means a window (including glazing and frame) that meets the requirements of Table BS3AB1 below WERS means the Window Energy Rating Scheme managed by the Australian Window Association System U-Value means the thermal transmittance, in W/m
2K, of a window system including glass, sash
and frame, as registered under WERS.
Table BS3B.1 : Minimum requirements for a thermally efficient window
Window Rating Min. WERS Star Rating Heating Mode
Min. WERS Star Rating Cooling Mode
Maximum System U Value (W/m
2K)
4 star Minimum 4 stars 1.5 stars 3.1
6 star Minimum 6 stars 3.5 stars 2.3
2. Activity Description (Summary)
Retrofit secondary glazing to a pre-existing single glazed window in the external wall of a residential premises.
3. Activity Eligibility Requirements
1. Pre-existing windows to be retrofitted must be single glazed in good condition without rot, or corrosion or other form of material defect and located in an external wall of a habitable room
2. The retrofit of secondary glazing must not be otherwise required by law, for example as condition of a development approval under the Development Act 1993.
4. Installed Product Requirements
The installed product must : 1. be a window product rated by WERS. 2. be either glass, acrylic or polycarbonate (films are not eligible) 3. be simply removable by the home owner so as to permit access to the formed air gap for
cleaning/drying purposes. 4. comply with the effective version of AS 2047 and AS 1288. 5. be either a 4 or 5 Star Window, or a 6 Star Window in accordance with the minimum requirements
for a thermally efficient window as detailed in the table above 6. have a warranty of at least 5 years. 7. be fit for the purpose for which it is intended to be used 8. comply with any product safety or other product performance requirements in a relevant code of
practice or other relevant legislation applying to the activity.
6. Minimum Installation Requirements
1. All products must be installed in accordance with manufacturer’s instructions 2. The window must be installed in compliance with the effective versions of AS 2047 and AS 1288. 3. The activity must be completed and certified in accordance with any relevant code or codes of
practice and other relevant legislation applying to the activity, including any licensing, registration, statutory approval, activity certification, health, safety, environmental or waste disposal requirements;

R E V I E W O F E N E R G Y E F F I C I E N C Y A C T I V I T I E S U N D E R T H E S A R E E S S C H E M E
R Final Report, Prepared for DSD by EES, BA and Common Capital, July 2014 77
6. Activity default energy savings The total Gigajoule equivalent energy (GJe) saved attributed to this activity per residential premises is
equal to: Activity Energy Savings = (Savings Factor (as per table below) x Total Window Area)
Activity Electricity (GJ saved/ m
2)
Gas (GJ saved/ m
2)
Firewood (GJ saved/ m
2)
4 Star Window (BCA Zones 4&5) 0.13 0.11 0.23
6 Star Window (BCA Zones 4&5) 0.23 0.31 0.63
4 Star Window (BCA Zones 6) 0.12 0.18 0.37
6 Star Window (BCA Zones 6) 0.27 0.52 1.06
7. Guidance Notes (Informative only – not mandatory)
1. Nil

R E V I E W O F E N E R G Y E F F I C I E N C Y A C T I V I T I E S U N D E R T H E S A R E E S S C H E M E
R Final Report, Prepared for DSD by EES, BA and Common Capital, July 2014 78
Install Heating and Cooling Systems - HC1, HC2A, HC2B
Technical Assessment – HC1 & HC2
HC1 Install an efficient new gas space heater (Non-Ducted) (existing)
HC2A Install an efficient new Heating/Cooling System (Non-
Ducted) (existing)
HC2B Install an efficient new Heating/Cooling System (Ducted) (new)
REES Activity Reference: HC1 REES Activity title: Install an efficient new gas space heater (Non-Ducted) Target product: New gas space heaters Savings: Activity saves energy directly by encouraging the purchase of a new product that is better than average efficiency Pre-conditions: None REES Activity Reference: HC2 REES Activity title: HC2A Install an Efficient new Heating/Cooling System (Non-Ducted) HC2B Install an Efficient new Heating/Cooling System (Ducted) Target product: New non-ducted or ducted reverse cycle air conditioners Savings: Activity saves energy directly by encouraging the purchase of a new product that is better than average efficiency Pre-conditions: None

R E V I E W O F E N E R G Y E F F I C I E N C Y A C T I V I T I E S U N D E R T H E S A R E E S S C H E M E
R Final Report, Prepared for DSD by EES, BA and Common Capital, July 2014 79
Current REES Activity Description This activity currently forms part of the REES scheme code4 . The current summary description within the REES scheme code is as follows:
“Install upgraded efficient room reverse cycle air conditioner or gas room heater”
This activity covers the installation of any efficient new ducted air conditioner and/or gas heater in a house. While it states that the installed system is “upgraded”, there is no specification for any existing system, so it covers new and replacement systems. Currently there are four cases specified under REES:
Gas heater less than or equal to 6.5 kW (23.4 MJ/hour)
Gas heater greater than 6.5 kW (23.4 MJ/hour)
Reverse cycle air conditioner less than or equal to 4 kW
Reverse cycle air conditioner greater than 4 kW. Minimum performance specifications are set out for each option. These are effectively 5 stars for gas heaters (AS4553) and 3 stars for reverse cycle air conditioners (AS/NZS3823.2-2013). Current credits under REES for each type of heater are set out below. Table 36: Current REES credits for installation of an efficient heater
Heater Type Small tCO2-e
Large tCO2-e
Install 5 star gas heater 2.3 2.6
Install 6 star gas heater 3.1 3.5
Install a 3 star reverse cycle air conditioner 0.1 1.4
Install a 4 star reverse cycle air conditioner 0.6 2.4
Install a 5 star reverse cycle air conditioner 1.0 3.2
Install a 6 star reverse cycle air conditioner 1.3 3.8
Proposed REES Activity Description It is proposed that this activity be broken into 3 main parts, depending on the equipment selected:
(1) “Install an efficient gas room heater” (2) “Install an efficient non-ducted reverse cycle air conditioner”
(3) “Install an efficient ducted reverse cycle air conditioner”
The first option under this activity covers the installation of an efficient new gas space heater (non-ducted) in a house. This is fully equivalent to the existing REES specification.
4 RESIDENTIAL ENERGY EFFICIENCY SCHEME CODE REESC/07 February 2014

R E V I E W O F E N E R G Y E F F I C I E N C Y A C T I V I T I E S U N D E R T H E S A R E E S S C H E M E
R Final Report, Prepared for DSD by EES, BA and Common Capital, July 2014 80
The second option under this activity covers the installation of an efficient new non-ducted reverse cycle air conditioner in a house. This is fully equivalent to the existing REES specification. The third option under this activity covers the installation of an efficient new ducted reverse cycle air conditioner in a house. This is a new activity that is not currently covered by REES. The requirements for each of the equipment types are set out below. Air conditioners general requirements The air conditioner must be currently registered for MEPS (and energy labelling where applicable) The air conditioner must be a reverse cycle type Any reverse cycle air conditioner installed must comply with AS/NZS 60335.2.40 Multi-split systems or water source heat pump types are not eligible The air conditioner is to be installed in a residential premise Requirements for non-ducted air conditioners The air conditioner must achieve an SRI of ≥ 3.0 stars for heating and cooling under AS/NZS3823.2 (2013) (ACOP and AEER at rated capacity of ≥3.75) Requirements for ducted air conditioners The air conditioner must have a registered ACOP and AEER at rated capacity of ≥ 3.5 for heating and cooling under AS/NZS3823.2 (2013) Default lifetime energy savings for each case is given by:
Default savings = ZMC
C
RC
C
MH
H
RH
H
109.0
Where H is a climate related total heating load in GJ/year C is a climate related total cooling load in GJ/year 0.9 is a program related factor 10 is the assumed life in years Z is the assumed zoning factor RH is the reference heating performance in W/W (ACOP) RC is the reference cooling performance in W/W (AEER) MH is the registered heating ACOP at rated capacity in accordance with AS/NZS3823.2 of the eligible product being installed MC is the registered heating ACOP at rated capacity in accordance with AS/NZS3823.2 of the eligible product being installed Default energy savings are in GJ of electricity Values for each of the variables is given below. Table 37: Variables for calculation of default savings factors
Climate Type H GJ/y C GJ/y Z RH RC
BCA Climate Zone 6 Non-ducted reverse 71.52 3.11 0.3 3.5 3.25
All other areas Non-ducted reverse 31.40 16.51 0.3 3.5 3.25
BCA Climate Zone 6 Ducted reverse 71.52 3.11 0.7 3.35 3.2
All other areas Ducted reverse 31.40 16.51 0.7 3.35 3.2
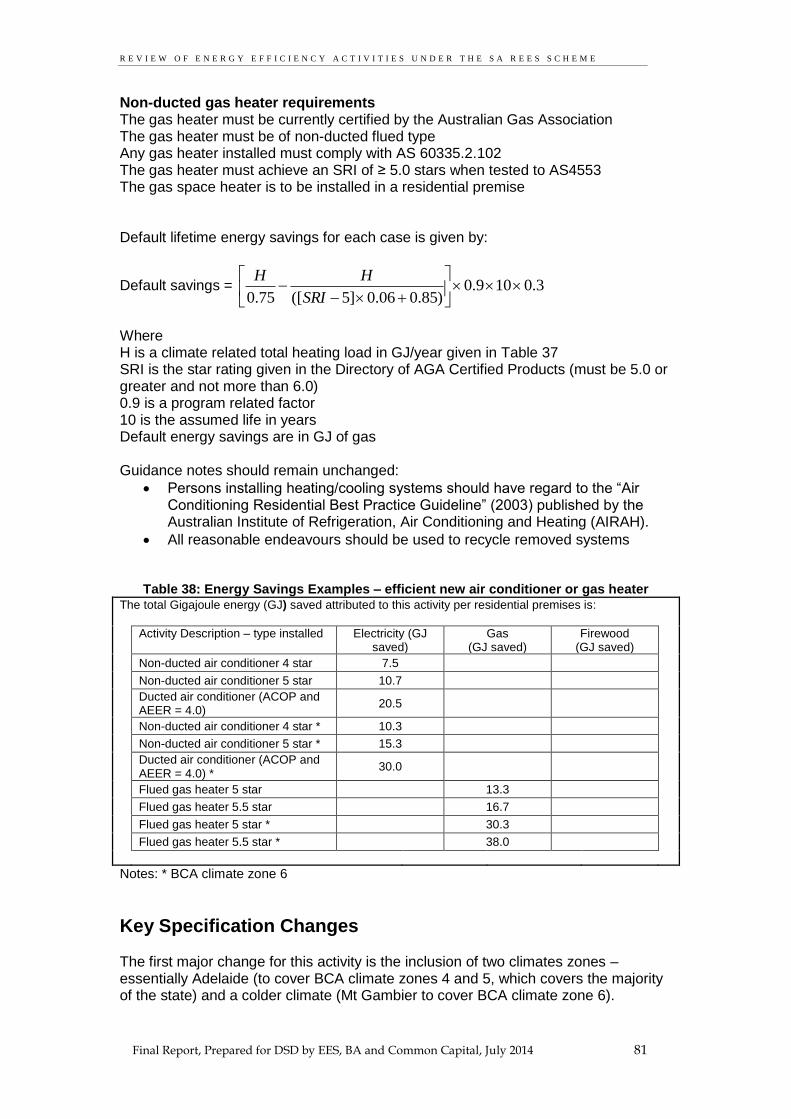
R E V I E W O F E N E R G Y E F F I C I E N C Y A C T I V I T I E S U N D E R T H E S A R E E S S C H E M E
R Final Report, Prepared for DSD by EES, BA and Common Capital, July 2014 81
Non-ducted gas heater requirements The gas heater must be currently certified by the Australian Gas Association The gas heater must be of non-ducted flued type Any gas heater installed must comply with AS 60335.2.102 The gas heater must achieve an SRI of ≥ 5.0 stars when tested to AS4553 The gas space heater is to be installed in a residential premise Default lifetime energy savings for each case is given by:
Default savings = 3.0109.0)85.006.0]5([75.0
SRI
HH
Where H is a climate related total heating load in GJ/year given in Table 37 SRI is the star rating given in the Directory of AGA Certified Products (must be 5.0 or greater and not more than 6.0) 0.9 is a program related factor 10 is the assumed life in years Default energy savings are in GJ of gas Guidance notes should remain unchanged:
Persons installing heating/cooling systems should have regard to the “Air Conditioning Residential Best Practice Guideline” (2003) published by the Australian Institute of Refrigeration, Air Conditioning and Heating (AIRAH).
All reasonable endeavours should be used to recycle removed systems
Table 38: Energy Savings Examples – efficient new air conditioner or gas heater The total Gigajoule energy (GJ) saved attributed to this activity per residential premises is:
Activity Description – type installed Electricity (GJ saved)
Gas (GJ saved)
Firewood (GJ saved)
Non-ducted air conditioner 4 star 7.5
Non-ducted air conditioner 5 star 10.7
Ducted air conditioner (ACOP and AEER = 4.0)
20.5
Non-ducted air conditioner 4 star * 10.3
Non-ducted air conditioner 5 star * 15.3
Ducted air conditioner (ACOP and AEER = 4.0) *
30.0
Flued gas heater 5 star 13.3
Flued gas heater 5.5 star 16.7
Flued gas heater 5 star * 30.3
Flued gas heater 5.5 star * 38.0
Notes: * BCA climate zone 6
Key Specification Changes The first major change for this activity is the inclusion of two climates zones – essentially Adelaide (to cover BCA climate zones 4 and 5, which covers the majority of the state) and a colder climate (Mt Gambier to cover BCA climate zone 6).

R E V I E W O F E N E R G Y E F F I C I E N C Y A C T I V I T I E S U N D E R T H E S A R E E S S C H E M E
R Final Report, Prepared for DSD by EES, BA and Common Capital, July 2014 82
The requirements for gas space heaters (non-ducted) remains largely unchanged, except that the distinction between small and large has been eliminated (virtually no products on the market were in the small category). Savings are now calculated based on the fractional star rating of the product (noting that no products in this category currently reach 6 stars – maximum available is 5.5 stars). The default savings factors for BCA climate zone 5 (Adelaide) are somewhat lower than the current values. The default savings factors for BCA climate zone 6 (Mt Gambier) are similar to the current values. A significant change for air conditioners is that the default savings for all reverse cycle air conditioners now includes values for heating and cooling5. The requirements for non-ducted reverse cycle air conditioners are very similar to the previous specification, except that the distinction between small and large has been eliminated. The default savings factors for BCA climate zone 5 (Adelaide) are similar to the current values. The default savings factors for BCA climate zone 6 (Mt Gambier) are somewhat higher than the current values. The most significant change to this specification is the addition of ducted reverse cycle air conditioners as a new type of eligible product (previously restricted to non-ducted reverse cycle air conditioners). Default savings factors are calculated for ducted systems on the same basis as non-ducted systems except that a larger share of total floor area is assumed to be conditioned. See Appendix 3 for details. This review has been undertaken after a reassessment of building heating and cooling requirements based on the latest building shell simulation data for South Australia. There has also been a reappraisal of the default energy savings calculations based on the latest market data for air conditioners and gas heaters to establish new baseline values. Potential refinements to the activity could be developed around using the part load efficiency for variable output air conditioners to reflect their likely improved efficiency during normal use. Further research on typical load duration curves for air conditioners during typical use would be required.
Scheme Review – Other jurisdictions The following jurisdictions also include non-ducted and ducted space conditioning activity within their schemes:
Victoria: VEET Schedule 7 – High efficiency ducted air to air heat pump replacing a ducted air to air heat pump
Victoria: VEET Schedule 8 – High efficiency ducted air to air heat pump replacing central electric resistance heater
Victoria: VEET Schedule 9 – Gas flued space heater
Victoria: VEET Schedule 10 – Space air to air heat pump
NSW: Activity D3 - Replace an existing air conditioner with a high efficiency air conditioner
NSW: Activity D4 - Install a high efficiency air conditioner
ACT Part 2.3: Install a gas or liquid petroleum gas space heater.
5 For BCA Climate 5 (Adelaide) cooling makes up about one third of all default savings and
largely explains the increase in the revised specification. The heating load in BCA Climate 6 (Mt Gambier) is significantly higher than Adelaide and there is little cooling load.

R E V I E W O F E N E R G Y E F F I C I E N C Y A C T I V I T I E S U N D E R T H E S A R E E S S C H E M E
R Final Report, Prepared for DSD by EES, BA and Common Capital, July 2014 83
Table 39: State Scheme Summary – Comparative table for non-ducted space heaters
Parameter SA – REES Scheme (current)
VIC – VEET Scheme *
NSW – ESS Scheme ACT – EEIS Scheme SA – REES Scheme (proposed)
Working Title Install upgraded efficient room reverse cycle air conditioner or gas room heater
Gas flued space heater Space air to air heat pump
Replace an existing air conditioner with a high efficiency air conditioner Install a high efficiency air conditioner
Install a gas or liquid petroleum gas space heater
Install efficient gas room heater or non-ducted reverse cycle air conditioner
Activity Reference Number
N/A Schedules 9 and 10 Activity D3 and D4 Part 2.3 HC1, HC2A
Sectors Not stated Residential or business Not stated Residential or business Residential
Required pre-condition None stated AC only in non-gas area D3 – working AC D4 – no existing AC
No operating gas heater None
Target Energy Service Heating Heating Heating and Cooling Heating Heating and Cooling
Replacement options Gas flued heater (non-ducted) Unflued gas not permitted Reverse cycle air conditioner (non-ducted)
Gas flued heater (non-ducted) Unflued gas not permitted Reverse cycle air conditioner (non-ducted)
Non-ducted (or ducted) cooling only or reverse cycle air conditioner – any size
Gas flued heater (non-ducted) Unflued gas not permitted
Gas flued heater (non-ducted) Unflued gas not permitted Reverse cycle air conditioner (non-ducted)
Performance requirements
Gas 5 star AC 3 stars heat and cool
Gas 4 star,>2kW AC COP ≥3.5, > 2kW (H1)
D3 – smaller than existing, higher star rating than existing D3 & D4 - 5 year warranty
Gas 4 star,>2kW Gas 5 star Non ducted AC 3 stars heat/cool
Deemed savings per replacement
Complex – tables of values, fixed value by size and star rating and type
Complex – table of values by size and COP/star rating
Complex – table by star rating and type and 4 climate zones – MWh per kW of rating – cooling and heating separate
Complex – table of values by size and star rating
Formula by climate zone and star rating, GJ saving by fuel
Replacement product warranty requirements
Nil Nil Nil Nil
Referenced Standards AS4553 AS/NZS3823.2-2013 AS 60335.2.102:2004 (safety) AS 60335.2.40:2006 (safety)
AS 4553 (2000 & 2008) AS/NZS 3823.2: 2005 AS/NZS 3823.1.1:1998
AS/NZS 3823.2:2011 AS4553 (also incorrectly references AS4556)
AS4553 AS/NZS3823.2-2013 AS/NZS 60335.2.102 (safety) AS/NZS 60335.2.40 (safety)
Notes: Requirements are very complex have been simplified for this table. * All VEET specifications have different emission factors for metropolitan versus regional installations

R E V I E W O F E N E R G Y E F F I C I E N C Y A C T I V I T I E S U N D E R T H E S A R E E S S C H E M E
R Final Report, Prepared for DSD by EES, BA and Common Capital, July 2014 84
Table 40: State Scheme Summary – Comparative table for ducted air conditioners
Parameter SA – REES Scheme (current)
VIC – VEET Scheme * NSW – ESS Scheme ACT – EEIS Scheme
SA – REES Scheme (proposed)
Working Title No activity High efficiency ducted air to air heat pump replacing a ducted air to air heat pump High efficiency ducted air to air heat pump replacing central electric resistance heater
Replace an existing air conditioner with a high efficiency air conditioner Install a high efficiency air conditioner
No activity Install efficient ducted reverse cycle air conditioner
Activity Reference Number
N/A Schedules 7 and 8 Activity D3 and D4 N/A HC2B
Sectors Residential or business Not stated Residential
Required pre-condition 7 = existing ducted AC 8 = central resistance heater AC only in non-gas area
D3 – working AC D4 – no existing AC
None
Target Energy Service Heating Heating and Cooling Heating and Cooling
Replacement options Reverse cycle air conditioner (ducted)
Ducted (or non-ducted) cooling only or reverse cycle air conditioner – any size
Reverse cycle air conditioner (ducted)
Performance requirements
AC COP ≥3.5, > 10kW (H1) D3 – smaller than existing, higher star rating than existing D3 & D4 - 5 year warranty
Ducted ACOP/ AEER ≥ 3.5
Deemed savings per replacement
Complex – table of values by size and COP
Complex – table by star rating and type and 4 climate zones – MWh per kW of rating – cooling and heating separate
Formula by climate zone and star rating, GJ saving by fuel
Replacement product warranty requirements
Nil Nil
Referenced Standards AS/NZS 3823.2: 2005 AS/NZS 3823.1.2:2001
AS/NZS 3823.2:2011 AS4553 AS/NZS3823.2-2013 AS/NZS 60335.2.102 (safety) AS/NZS 60335.2.40 (safety)
Notes: Requirements are very complex have been simplified for this table. * All VEET specifications have different emission factors for metropolitan versus regional installations

R E V I E W O F E N E R G Y E F F I C I E N C Y A C T I V I T I E S U N D E R T H E S A R E E S S C H E M E
R Final Report, Prepared for DSD by EES, BA and Common Capital, July 2014 85
Victoria covers both gas space heaters and reverse cycle air conditioners for heating. Reverse cycle air conditioners are only permitted in non-gas areas. NSW covers cooling only and reverse cycle air conditioners (replacement and new) and provides separate energy credits for heating and cooling. These activities in NSW also cover ducted systems. ACT only covers gas space heaters (air conditioners are not included in the scheme). Table 39and Table 40 above provide a comparison of the key elements of space heating in each jurisdiction.
Scheme Review - Potential of the activity (overview) ABS4602 data shows that there has been a strong trend towards electric space heating in South Australia for many years. The majority of these electric systems (85%) are now reverse cycle air conditioners in South Australia. Of the reverse cycle air conditioners used for heating, some 40% are ducted systems in South Australia. Only 2% of all space heaters in South Australia are ducted gas. There appears to be an ongoing decline in the use of gas space heaters in South Australia. A significant share of space heating in South Australia is provided by wood. A review of potential activities earlier in the review process ruled out ducted gas space heaters as a new activity under REES as there are such low levels of ownership of this type of appliance. Figure 1: Trends in space heater ownership in South Australia
Source: ABS4602 (2011) and author estimates
As NSW covers cooling as well as heating, this review is also examining whether air conditioning cooling should be included as a separate activity. Cooling loads are more significant in South Australia than in Victoria and ACT, so this activity warrants investigation.
0.0
0.1
0.2
0.3
0.4
0.5
0.6
0.7
1990
1993
1996
1999
2002
2005
2008
2011
2014
2017
2020
Ow
ne
rsh
ip
Year
Summary for South Australia
Electric Heat
Oil Heat
Gas Heat
Wood Heat
ActualProjected

R E V I E W O F E N E R G Y E F F I C I E N C Y A C T I V I T I E S U N D E R T H E S A R E E S S C H E M E
R Final Report, Prepared for DSD by EES, BA and Common Capital, July 2014 86
ABS4602 data shows that there has been strong growth in air conditioner ownership for many years. This mirrors changes in other states. Figure 2: Trends in air conditioner ownership in South Australia
Figure 3: Trends in share of air conditioner type in South Australia
0.0
0.2
0.4
0.6
0.8
1.0
1.2
1.4
1990
1993
1996
1999
2002
2005
2008
2011
2014
2017
2020
AC
Ow
ne
rsh
ip
Year
Summary for South Australia
Actual Projected
0%
5%
10%
15%
20%
25%
30%
35%
40%
45%
50%
1990
1993
1996
1999
2002
2005
2008
2011
2014
2017
2020
Air
Co
nd
itio
ner
Sh
are
by T
yp
e
Year
Summary for South Australia
Central CO Central RC Nonduct RC Nonduct CO Evaporative
Actual Projected

R E V I E W O F E N E R G Y E F F I C I E N C Y A C T I V I T I E S U N D E R T H E S A R E E S S C H E M E
R Final Report, Prepared for DSD by EES, BA and Common Capital, July 2014 87
There have been a number of long term changes in the air conditioner stock over time. The most important observations regarding air conditioner are that:
40% are non-ducted reverse cycle and their share is increasing
25% are evaporative types and their share is steady (slow decrease)
22% are ducted reverse cycle and their share is increasing
10% are non-ducted cooling only and their share is decreasing
Ducted cooling only represents a very small share of the stock. Considering heating and cooling data together, it appears that there is a strong trend towards reverse cycle (ducted and non-ducted) for both heating and cooling. So these two technologies should be the main focus of this review. There is a decline in gas space heating and cooling only air conditioning. Reverse cycle air conditioners are displacing gas as the main type of heating. The Victorian activities for ducted air conditioners are quite restrictive in that they are only permitted in non-gas areas and specify an existing system that is to be replaced (existing air conditioner or central electric resistance heater). The central electric (mainly slab heaters) are more common in Victoria (7%) and relatively uncommon in South Australia (2%), so a special activity targeting this existing case is not warranted for South Australia (even though the energy savings are potentially large – the abatement figures for Victoria for this activity are very large indeed). The specification for NSW for air conditioners has been examined in some detail. The savings for heating and cooling for activities D3 and D4 appear to be inconsistent and it was not possible to assess the methodology for the calculation of energy savings. NSW uses 4 climate zones (which many not be relevant to South Australia) and their approach scales energy savings in proportion to rated capacity, which is generally not supported (as discussed below). This review does not explicitly cover wood heating as a potential activity (this is not covered by any other state). Evaporative air conditioners have not been included in this review (even though there is an activity in Victoria to convert from refrigerative air conditioning to evaporative air conditioning – however there has never been any activity under VEET). Ducted gas space heaters have been assessed and ruled out due to their very low penetration and the decreasing share of gas space heating in South Australia. The current REES specification for heating does not specify any existing heating system. So the existing REES activity is being assessed as a new appliance installation (i.e. not dependent on the existing installation). It is proposed to expand the specification to cover ducted reverse cycle air conditioners – these should be assessed on the same basis. For this type of activity, the savings are assessed as a function of the energy consumption of the new efficient appliance selected compared to the average appliance that would have been installed in the absence of REES (business as usual – market average).
Assessment Against Scheme Principles This activity aligns with all major policy objectives, except there is limited scope for participation for low income households (due to capital costs and/or investment by landlords).

R E V I E W O F E N E R G Y E F F I C I E N C Y A C T I V I T I E S U N D E R T H E S A R E E S S C H E M E
R Final Report, Prepared for DSD by EES, BA and Common Capital, July 2014 88
Table 41: Alignment with Policy Objectives for Space Conditioners
Policy Objective Reduces household and/or business energy use Provides a focus on low income households ×
Associated Objectives: Provides greenhouse gas emission benefits
Provides energy cost benefits
The following table provides an assessment of the activity against the new principles proposed for REES code. Table 42: Activity Alignment with REES General Principles - space conditioners
Principle Assessment
1. Provides evidence based energy savings
These products are used widely in South Australia. The basis for energy savings associated with this activity is well evidenced through standards, testing and in use measurements. The energy consumption for gas space heaters is covered by an Australian Standard and products are tested and approved by the industry association (AGA). Air conditioners are regulated for energy labelling and MEPS and products are listed on the energy rating website for the purposes of verification.
2. Energy savings are additional to base case (BAU) and minimises free riders
This is assessed as the difference in energy consumption between an average new appliance for each type (business as usual) the appliance installed under the REES activity. A qualifying threshold for eligible products (significantly better than market average) is specified. New appliances will be purchased in any case and the specification leverages on these purchases to encourage the selection of high efficiency appliances. Some free riders will exist, but accounted for through energy saving discounts.
3. Reward best practice in relation to product performance
The proposed approach is to reward products based on their measured performance and efficiency once they exceed a specified efficiency threshold. Products are regulated for efficiency and the data is readily available.
4. Provides a means for ensuring quality assurance and participant satisfaction
Standards set performance requirements to ensure that energy services can be delivered in line with consumer expectations.
5. Credible approach for the calculation of energy savings
Default savings factors provide a robust approach to the calculation of average energy savings across a wide range of household types. An additional climate zone has been introduced to account for regional differences in heating and cooling demands.
6. Provides scope for objective, cost effective and practical auditing
Installation of equipment as part of the activity is simple and easy to audit.
7. Good practice Old products are to be recycled and installation should be by professional installers who follow good practice codes such as AIRAH.
8. Harmonisation (as far as practical)
Variants of this activity are available in ACT, Victoria and NSW, although the scope and requirements are highly variable across states. ACT focuses on gas heating, while Victoria focuses on heating but restricts air conditioner activity to non-gas areas. Victorian specifications also focus largely on replacement of specific existing central systems (especially slab heaters), which are unusual in South Australia. NSW covers cooling and heating. The approach and outcomes of each scheme are highly variable and it appears there is little potential for alignment in the short term.
9. Safety and minimising overall risk
Activities are typically undertaken by qualified professionals. Products are required to comply with relevant safety standards. Installations should meet AIRAH guidelines and manufacturer’s instructions.
Energy Savings - Review
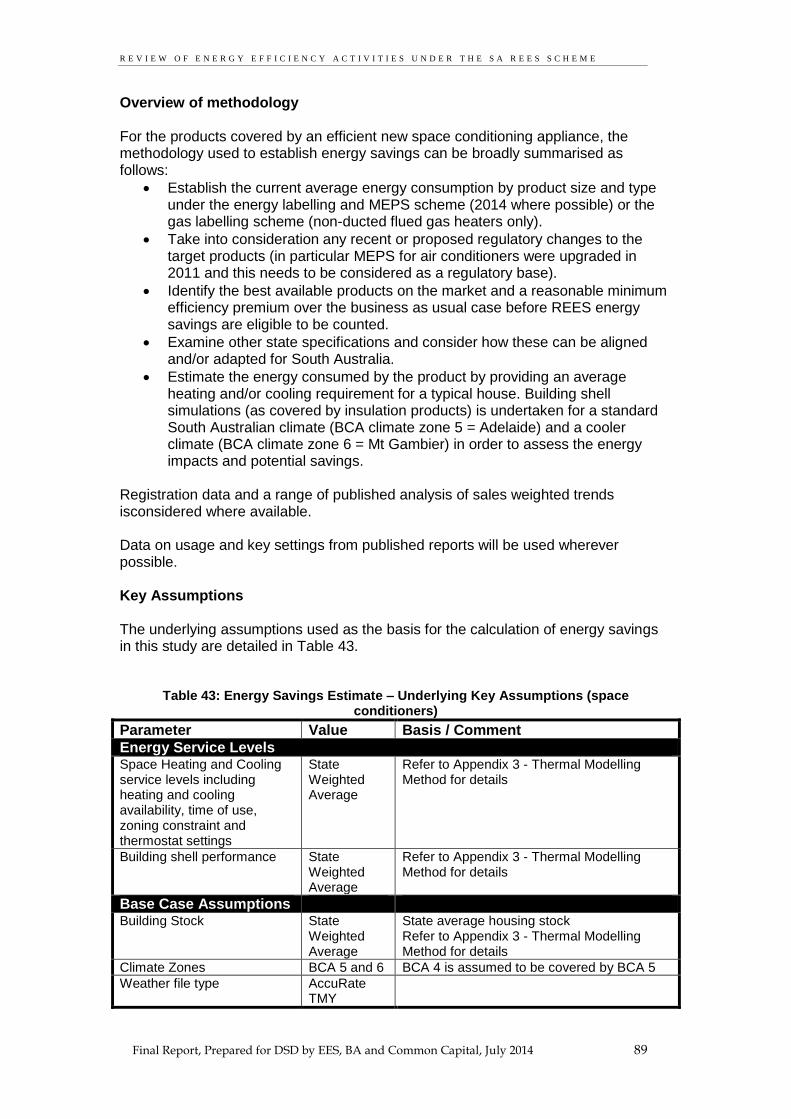
R E V I E W O F E N E R G Y E F F I C I E N C Y A C T I V I T I E S U N D E R T H E S A R E E S S C H E M E
R Final Report, Prepared for DSD by EES, BA and Common Capital, July 2014 89
Overview of methodology For the products covered by an efficient new space conditioning appliance, the methodology used to establish energy savings can be broadly summarised as follows:
Establish the current average energy consumption by product size and type under the energy labelling and MEPS scheme (2014 where possible) or the gas labelling scheme (non-ducted flued gas heaters only).
Take into consideration any recent or proposed regulatory changes to the target products (in particular MEPS for air conditioners were upgraded in 2011 and this needs to be considered as a regulatory base).
Identify the best available products on the market and a reasonable minimum efficiency premium over the business as usual case before REES energy savings are eligible to be counted.
Examine other state specifications and consider how these can be aligned and/or adapted for South Australia.
Estimate the energy consumed by the product by providing an average heating and/or cooling requirement for a typical house. Building shell simulations (as covered by insulation products) is undertaken for a standard South Australian climate (BCA climate zone 5 = Adelaide) and a cooler climate (BCA climate zone 6 = Mt Gambier) in order to assess the energy impacts and potential savings.
Registration data and a range of published analysis of sales weighted trends isconsidered where available. Data on usage and key settings from published reports will be used wherever possible. Key Assumptions The underlying assumptions used as the basis for the calculation of energy savings in this study are detailed in Table 43.
Table 43: Energy Savings Estimate – Underlying Key Assumptions (space conditioners)
Parameter Value Basis / Comment
Energy Service Levels Space Heating and Cooling service levels including heating and cooling availability, time of use, zoning constraint and thermostat settings
State Weighted Average
Refer to Appendix 3 - Thermal Modelling Method for details
Building shell performance State Weighted Average
Refer to Appendix 3 - Thermal Modelling Method for details
Base Case Assumptions Building Stock State
Weighted Average
State average housing stock Refer to Appendix 3 - Thermal Modelling Method for details
Climate Zones BCA 5 and 6 BCA 4 is assumed to be covered by BCA 5
Weather file type AccuRate TMY
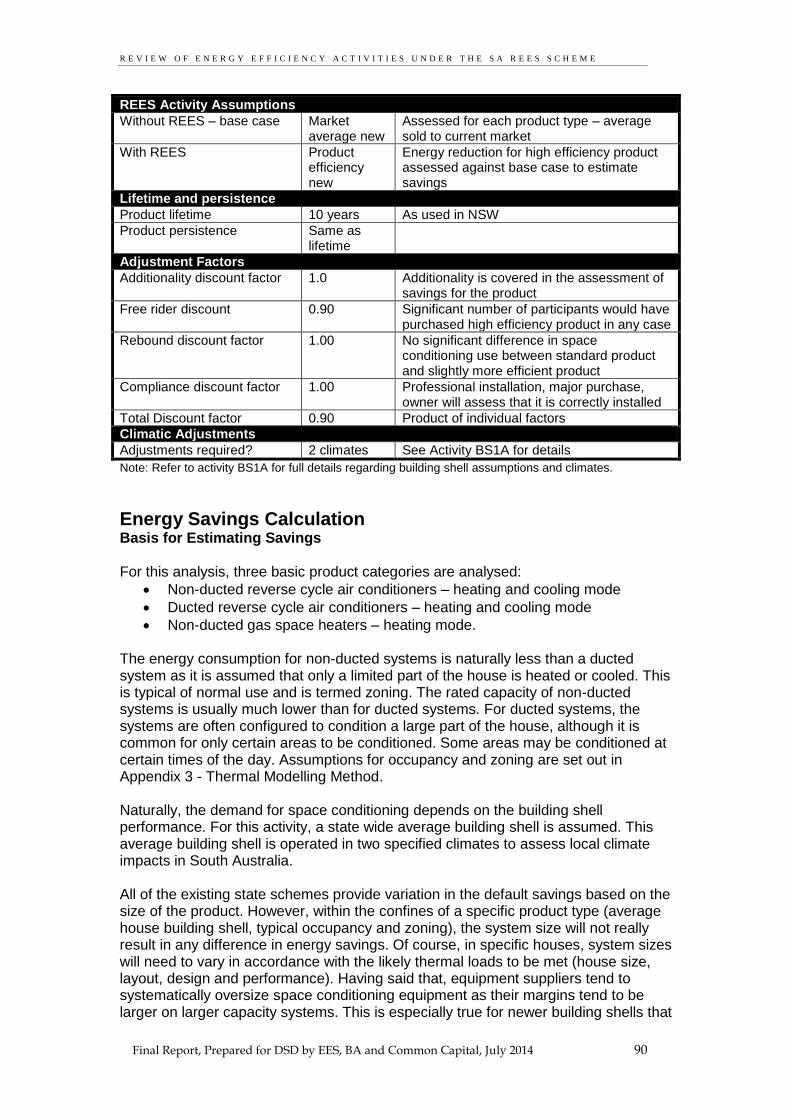
R E V I E W O F E N E R G Y E F F I C I E N C Y A C T I V I T I E S U N D E R T H E S A R E E S S C H E M E
R Final Report, Prepared for DSD by EES, BA and Common Capital, July 2014 90
REES Activity Assumptions
Without REES – base case Market average new
Assessed for each product type – average sold to current market
With REES Product efficiency new
Energy reduction for high efficiency product assessed against base case to estimate savings
Lifetime and persistence
Product lifetime 10 years As used in NSW
Product persistence Same as lifetime
Adjustment Factors
Additionality discount factor 1.0 Additionality is covered in the assessment of savings for the product
Free rider discount 0.90 Significant number of participants would have purchased high efficiency product in any case
Rebound discount factor 1.00 No significant difference in space conditioning use between standard product and slightly more efficient product
Compliance discount factor 1.00 Professional installation, major purchase, owner will assess that it is correctly installed
Total Discount factor 0.90 Product of individual factors
Climatic Adjustments
Adjustments required? 2 climates See Activity BS1A for details
Note: Refer to activity BS1A for full details regarding building shell assumptions and climates.
Energy Savings Calculation Basis for Estimating Savings For this analysis, three basic product categories are analysed:
Non-ducted reverse cycle air conditioners – heating and cooling mode
Ducted reverse cycle air conditioners – heating and cooling mode
Non-ducted gas space heaters – heating mode. The energy consumption for non-ducted systems is naturally less than a ducted system as it is assumed that only a limited part of the house is heated or cooled. This is typical of normal use and is termed zoning. The rated capacity of non-ducted systems is usually much lower than for ducted systems. For ducted systems, the systems are often configured to condition a large part of the house, although it is common for only certain areas to be conditioned. Some areas may be conditioned at certain times of the day. Assumptions for occupancy and zoning are set out in Appendix 3 - Thermal Modelling Method. Naturally, the demand for space conditioning depends on the building shell performance. For this activity, a state wide average building shell is assumed. This average building shell is operated in two specified climates to assess local climate impacts in South Australia. All of the existing state schemes provide variation in the default savings based on the size of the product. However, within the confines of a specific product type (average house building shell, typical occupancy and zoning), the system size will not really result in any difference in energy savings. Of course, in specific houses, system sizes will need to vary in accordance with the likely thermal loads to be met (house size, layout, design and performance). Having said that, equipment suppliers tend to systematically oversize space conditioning equipment as their margins tend to be larger on larger capacity systems. This is especially true for newer building shells that

R E V I E W O F E N E R G Y E F F I C I E N C Y A C T I V I T I E S U N D E R T H E S A R E E S S C H E M E
R Final Report, Prepared for DSD by EES, BA and Common Capital, July 2014 91
meet recent building shell standards and generally need much smaller capacity systems to meet heating and cooling needs. The end point of the argument is that scaling savings to system capacity provides larger savings credits for larger systems, which in turn encourages the oversizing of systems, without any associated energy savings under the range of normal use in a given home. If there was confidence that all systems were sized correctly in the market, then there may be some scaling of energy savings with rated capacity. Offering a flat energy saving credit will keep downward pressure on system size, which ultimately will contribute to the REES energy saving goal and increase the cost effectiveness of the activity for end users. This approach is in keeping with a range of other activities under REES. If default savings were to be provided in proportion to system size, the savings would need to be normalised back to a sales weighted average system size to ensure that, on average, the correct savings were estimated. This is complex exercise as thermal loads on a range of different sized houses with different thermal performance would need to be examined and a function of savings by size would need to be developed. And such an approach would depend on system capacity for all future installations being accurately sized to total thermal load (which is rarely done accurately). The building shell modelling approach used for this project estimates a total heating and cooling load requirement for a typical house in two climates in South Australia. This space conditioning load includes the impacts of three different occupancy profiles as set out in Appendix 3 - Thermal Modelling Method. The heating and cooling loads from simulations are summarised in the following table. Table 44: Heating and cooling loads for selected climates in South Australia
Average House Load in 2016 Heat
MJ/m2/y
Cool MJ/m
2/y
Heat GJ/y
Cool GJ/y
State Average 256.9 98.9 38.94 15.00
Adelaide BCA climate zone 5 (NatHERS climate 16) 207.1 108.9 31.40 16.51
Mt Lofty (NatHERS climate 59) 747.3 14.7 113.29 2.22
Mt Gambier (NatHERS climate 61) 471.8 20.5 71.52 3.11
Population weighted average: Mt Lofty and Mt Gambier 624.3 17.3 94.65 2.62
Notes: Average stock house size in 2016 is estimated to be 151.6 m2. Both Mt Lofty and Mt Gambier lie
within BCA climate zone 6. See Figure 2.
After consultation with DSD, for this study it is proposed to use two climate zones:
Mt Gambier for households that lie with BCA climate zone 6.
Adelaide for all other houses in South Australia. The above heating and cooling values include occupancy effects but not zoning. Table 45: Assumed zoning factors for heating and cooling by equipment type in South Australia
Assumed zoning factors by system type Zoning factor
Non ducted air conditioner - heating 0.3
Non ducted air conditioner - cooling 0.3
Ducted air conditioner - heating 0.7
Ducted air conditioner - cooling 0.7
Non ducted gas space heater 0.3

R E V I E W O F E N E R G Y E F F I C I E N C Y A C T I V I T I E S U N D E R T H E S A R E E S S C H E M E
R Final Report, Prepared for DSD by EES, BA and Common Capital, July 2014 92
Notes: See Appendix 3 - Thermal Modelling Method and EES (2008).
The energy savings for the base case and the high efficiency case is then determined from the total heating and/or cooling energy multiplied by the zone factor divided by the overall system efficiency of the space conditioning equipment. For air conditioners, the efficiency is defined as the annual energy efficiency ratio (AEER) for cooling and the annual coefficient of performance (ACOP) for heating. This includes non-operating energy and is more representative or typical use (than just operating EER and COP – see below). For gas space heaters, the efficiency is defined by AS4553. Assessment of air conditioner efficiency Air conditioners have been subject to energy labelling since the 1980s, although the precise scope of labelled products has changed slightly over the years. Currently all single phase non-ducted units are required to carry an energy label unless they can be shown to be exclusively for commercial applications (these are rare – typically high end roof cassettes). Given that current input limitations on single phase is about 15 to 20 amps (for a hard wired system) this put a natural cap on the capacity of these systems of about 12 kW to 15 kW. Energy labelling was originally based on the operating energy efficiency ratio (EER) for cooling and the operating coefficient of performance (COP) for heating. Labelling re-grades occurred in 2000 and 2010. In 2010 energy labelling changed from the basis of operating efficiency to annual EER and annual COP – this includes the energy associated when the product is not operating (mainly standby power and in some case crankcase heaters), thus penalising products with significant power consumption in non-operating modes (or requiring increases in operating efficiency to offset non-operating energy for the same star rating). A product that consumes 0W in its non-operating mode will have the same EER and AEER. Three phase air conditioners were first regulated for MEPS in 2001 and single phase units had MEPS applied in 2004. Since that date there have been many changes in MEPS requirements, including 2006, 2007, 2010, April 2011 and October 2011. A requirement for heating MEPS (equal to cooling MEPS) was introduced in 2010. As for energy labelling, the basis for MEPS was changed to AEER and ACOP in April 2011 to incorporate any non-operating power effects. The scope of MEPS also changed at various times. Currently, the air conditioner types currently regulated are set out in AS/NZS 3823.2-2013 and cover products with a rated output of up to 65kW as follows:
Non ducted unitary (window walls for smaller systems)
Non ducted split
Ducted
Multi-split systems
Water source heat pumps. The first three system types are within the scope of this study. Very large unitary systems (over 10kW) are not suitable for residential installations. Multi-split systems and water source heat pumps are also not usually suitable for residential installations and have been excluded from the analysis. The same MEPS levels apply to heating and cooling and to single and three phase products. For simplicity, it is assumed that products up to 19kW will be within the scope of this analysis (usually significantly smaller).

R E V I E W O F E N E R G Y E F F I C I E N C Y A C T I V I T I E S U N D E R T H E S A R E E S S C H E M E
R Final Report, Prepared for DSD by EES, BA and Common Capital, July 2014 93
NZ have lower MEPS levels for cooling - this does not apply in Australia and is not considered. Table 46: Australian MEPS levels for air conditioners with the scope of this study
Type Min AEER and ACOP
Non-ducted unitary to 19kW 3.10
Non-ducted split systems to <4kW 3.66
Non-ducted split systems to 4kW to <10kW 3.22
Non-ducted split systems to 10kW to <19kW 3.10
Ducted systems to 19kW 3.10
Source: AS/NZS3823.2-2013
Under AS/NZS3823.2, the heating MEPS level is set by the cooling output for reverse cycle units (there are virtually no heating only units registered in Australia). For variable output compressor systems, if the product does not meet MEPS at rated capacity (but exceeds 0.95 of the MEPS level at rated capacity), they can demonstrate compliance with MEPS at part load. This is assessed on a sliding scale such that the part load MEPS at 50% output is 1.25 times the MEPS at rated capacity. This option allows products with variable output, that are more efficient at part load, to demonstrate that their overall efficiency is satisfactory. The result of this requirement is that some products appear to “fail” MEPS at rated capacity – these will all be variable output systems. Firstly, heating mode is considered. Models registered from 2012 to 2014 are shown below. Figure 4: Non ducted air conditioners registered 2012 to 2014 - heating
2
2.5
3
3.5
4
4.5
5
5.5
6
0 2 4 6 8 10 12 14 16 18 20
AC
OP
W/W
Cooling Capacity kW
Models
MEPS - Non-ducted split
5 star
4 star
3 star
2 star
1 star

R E V I E W O F E N E R G Y E F F I C I E N C Y A C T I V I T I E S U N D E R T H E S A R E E S S C H E M E
R Final Report, Prepared for DSD by EES, BA and Common Capital, July 2014 94
Notes: MEPS shown is for non-ducted split systems. Window wall and split system models shown.Note that for heating mode in reverse cycle units, the relevant MEPS for heating is defined by the cooling capacity (not the heating capacity).
The current REES specification for non-ducted air conditioners is a star rating that is greater than or equal to of 3.0 stars. This equates to an annual coefficient of performance (ACOP) of 3.75 or greater. The MEPS levels for smaller products (<4kW) is an ACOP of 3.66. This falls to 3.22 for sizes from 4 to 10kW and down to 3.1 for products above 10 kW. Window wall products have a MEPS level of 3.1 for all sizes (note that there are very few reverse cycle window wall models on the market). The current REES specification of 3 stars (ACOP of 3.75) is a reasonable qualification requirement for heating. There are a range of products up to 12 kW that can achieve this requirement on heating, but for products that exceed 6kW output, there are relatively few systems that can achieve 3 stars in cooling (the REES requirement is 3 stars for heating and cooling). Some models at 10kW are available. This efficiency requirement is slightly more stringent than the requirements specified in Victoria (COP=3.5). Victoria specifies a minimum capacity of 2kW, but almost no products are smaller than this capacity, so this requirement is considered unnecessary. The next issue to assess is the baseline from which savings are to be calculated. This is quite difficult for air conditioners as MEPS for smaller units is quite stringent and this is less stringent as capacity increases. The market average is clearly better than MEPS, but this varies a lot by size. One possible approach is to set the MEPS level for smaller units as the base for all product sizes (at an ACOP of 3.66). This would obviously provide default savings that are somewhat generous for small units (as all units will be better than the base as they have to exceed MEPS) but less generous for larger units (where MEPS is much less stringent). However, having a common base across all sizes would reward all products equally on the basis of their actual efficiency and therefore their likely in-use energy consumption. A second option would be to reduce the base for calculation of savings to be an ACOP of 3.5 – this is closer to the market average across all sizes. This provides a clear 0.5 star buffer between the assumed baseline (2.5 stars) and the qualification efficiency of 2.0 stars. Another issue to consider is that on average, ACOP values are around 0.20 higher than AEER values (the actual difference varies by model and it depends on the product design and optimisation). This is because the energy input into the compressor can contribute to the heating output, whereas it cannot contribute to the cooling output (compressor input energy has to be rejected at the condenser during cooling mode). This would suggest that a small difference in the baseline for the calculation of energy savings between heating and cooling should be included (lower baseline efficiency for cooling). On consideration of all this data, it is suggested that the qualification for non-ducted air conditioners remain at 3 stars for heating and cooling (as per current REES specification). The baseline for the calculation of energy savings should be an ACOP of 3.50 for heating (all sizes) and an AEER of 3.25 for cooling (all sizes). This is slightly generous for small products (under 4kW) but is otherwise a quite reasonable baseline. A default savings credit has not previously been available for air conditioners on cooling mode. If this was to be included, it should be the same general specification as for heating. Any cooling savings will be modest in Adelaide (total cooling load is around half the heating load for Adelaide) and very small for Mt Lofty/Mt Gambier.

R E V I E W O F E N E R G Y E F F I C I E N C Y A C T I V I T I E S U N D E R T H E S A R E E S S C H E M E
R Final Report, Prepared for DSD by EES, BA and Common Capital, July 2014 95
Figure 5: Non ducted air conditioners registered 2012 to 2014 - cooling
Notes: MEPS shown is for non-ducted split systems. Window wall and split system models shown.
The default savings from a baseline of an ACOP of 3.5 (2.5 stars) is shown below. Table 47: Default savings for non-ducted air conditioners BCA climate 5 (Adelaide)
Stars (SRI) ACOP/AEER
Annual Heating
GJ
Annual Cooling
GJ
Lifetime Heating
GJ
Lifetime Cooling
GJ
Default savings
(H&C) GJ
Reference 3.5/3.25 2.69 1.52 26.9 15.2 0.0
2.5 3.50 2.69 1.42 26.9 14.2 1.0
3 3.75 2.51 1.32 25.1 13.2 3.4
3.5 4.00 2.35 1.24 23.5 12.4 5.6
4 4.25 2.22 1.17 22.2 11.7 7.5
4.5 4.50 2.09 1.10 20.9 11.0 9.2
5 4.75 1.98 1.04 19.8 10.4 10.7
5.5 5.00 1.88 0.99 18.8 9.9 12.1
6 5.25 1.79 0.94 17.9 9.4 13.3 Notes: Assumes a life of 10 years and a baseline ACOP of 3.5 and AEER of 3.25.Calculation of savings are for a model with the same AEER and ACOP as shown. Non-ducted zoning factor of 0.3. Default savings include heating and cooling energy reductions. An overall program adjustment of 0.9 has been included in the default savings as set out in the assumptions.
These savings are in line with the larger non-ducted air conditioner savings under the current REES specification. Note these this includes cooling (around one third of energy in Adelaide climate). Savings are also calculated for the colder BCA climate 6(Mt Gambier). This has a substantially larger heating load and almost no cooling.
2
2.5
3
3.5
4
4.5
5
5.5
6
0 2 4 6 8 10 12 14 16 18 20
AEE
R W
/W
Cooling Capacity kW
Models
MEPS - Non-ducted split
5 star
4 star
3 star
2 star
1 star
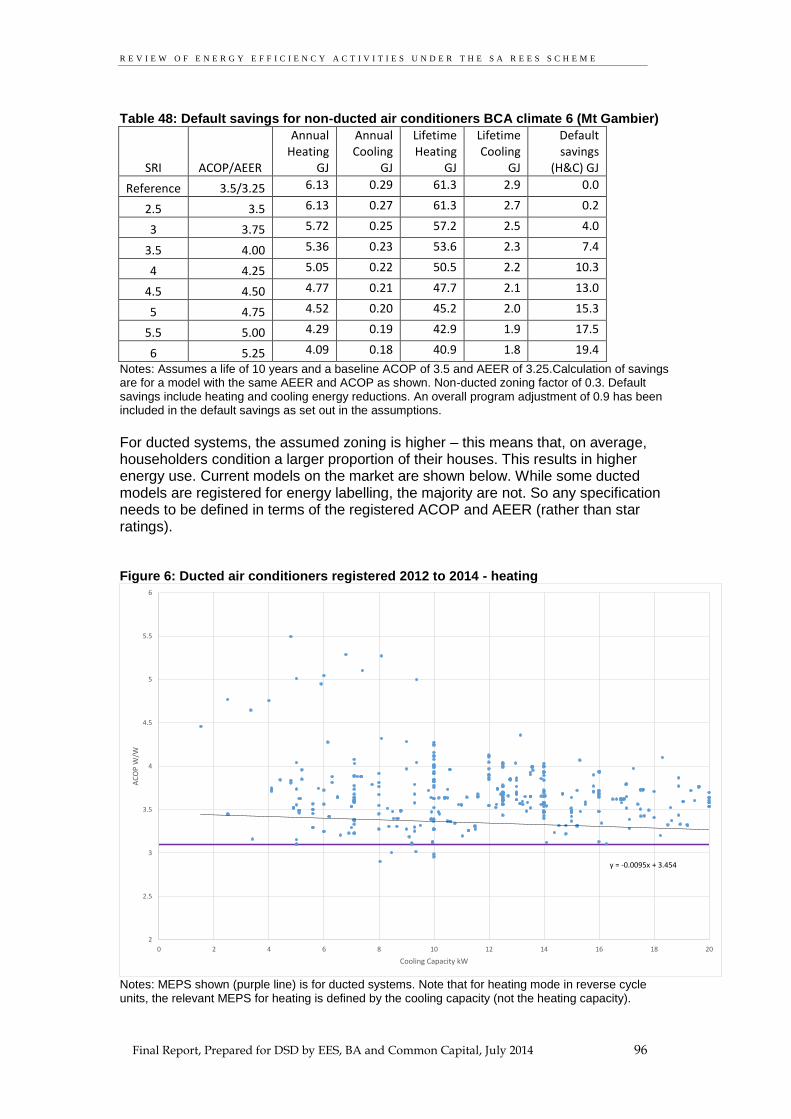
R E V I E W O F E N E R G Y E F F I C I E N C Y A C T I V I T I E S U N D E R T H E S A R E E S S C H E M E
R Final Report, Prepared for DSD by EES, BA and Common Capital, July 2014 96
Table 48: Default savings for non-ducted air conditioners BCA climate 6 (Mt Gambier)
SRI ACOP/AEER
Annual Heating
GJ
Annual Cooling
GJ
Lifetime Heating
GJ
Lifetime Cooling
GJ
Default savings
(H&C) GJ
Reference 3.5/3.25 6.13 0.29 61.3 2.9 0.0
2.5 3.5 6.13 0.27 61.3 2.7 0.2
3 3.75 5.72 0.25 57.2 2.5 4.0
3.5 4.00 5.36 0.23 53.6 2.3 7.4
4 4.25 5.05 0.22 50.5 2.2 10.3
4.5 4.50 4.77 0.21 47.7 2.1 13.0
5 4.75 4.52 0.20 45.2 2.0 15.3
5.5 5.00 4.29 0.19 42.9 1.9 17.5
6 5.25 4.09 0.18 40.9 1.8 19.4
Notes: Assumes a life of 10 years and a baseline ACOP of 3.5 and AEER of 3.25.Calculation of savings are for a model with the same AEER and ACOP as shown. Non-ducted zoning factor of 0.3. Default savings include heating and cooling energy reductions. An overall program adjustment of 0.9 has been included in the default savings as set out in the assumptions.
For ducted systems, the assumed zoning is higher – this means that, on average, householders condition a larger proportion of their houses. This results in higher energy use. Current models on the market are shown below. While some ducted models are registered for energy labelling, the majority are not. So any specification needs to be defined in terms of the registered ACOP and AEER (rather than star ratings). Figure 6: Ducted air conditioners registered 2012 to 2014 - heating
Notes: MEPS shown (purple line) is for ducted systems. Note that for heating mode in reverse cycle units, the relevant MEPS for heating is defined by the cooling capacity (not the heating capacity).
y = -0.0095x + 3.454
2
2.5
3
3.5
4
4.5
5
5.5
6
0 2 4 6 8 10 12 14 16 18 20
AC
OP
W/W
Cooling Capacity kW
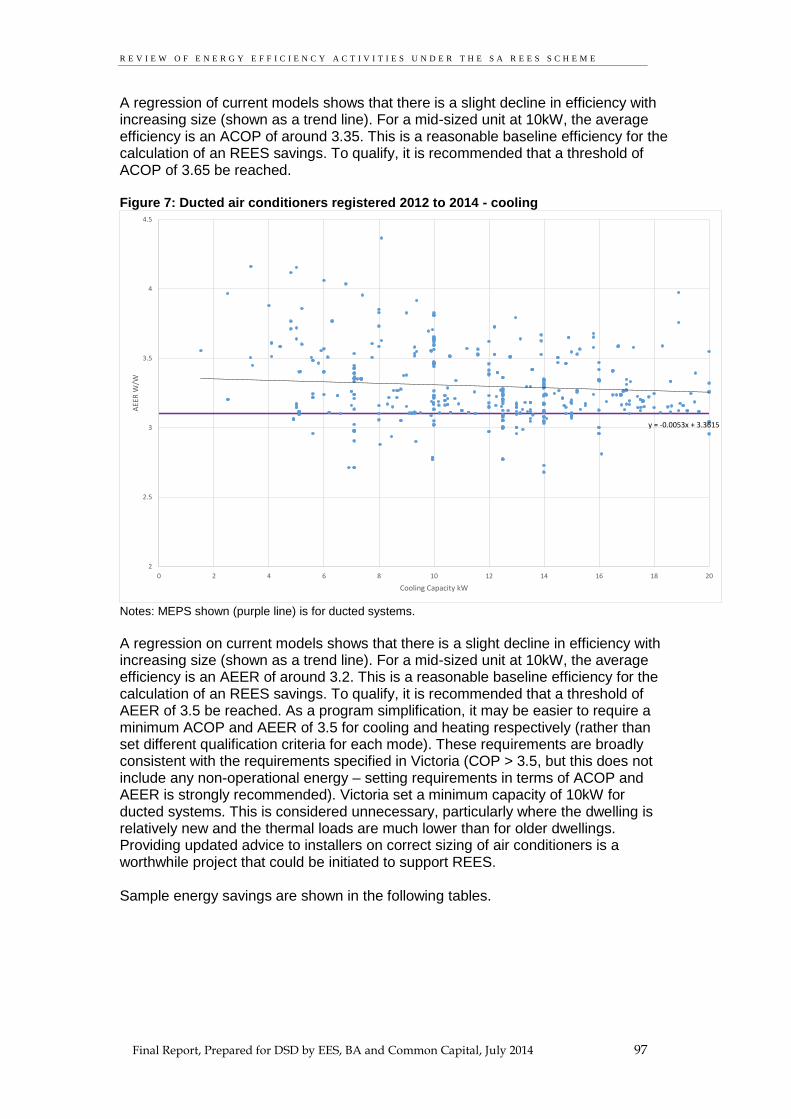
R E V I E W O F E N E R G Y E F F I C I E N C Y A C T I V I T I E S U N D E R T H E S A R E E S S C H E M E
R Final Report, Prepared for DSD by EES, BA and Common Capital, July 2014 97
A regression of current models shows that there is a slight decline in efficiency with increasing size (shown as a trend line). For a mid-sized unit at 10kW, the average efficiency is an ACOP of around 3.35. This is a reasonable baseline efficiency for the calculation of an REES savings. To qualify, it is recommended that a threshold of ACOP of 3.65 be reached. Figure 7: Ducted air conditioners registered 2012 to 2014 - cooling
Notes: MEPS shown (purple line) is for ducted systems. A regression on current models shows that there is a slight decline in efficiency with increasing size (shown as a trend line). For a mid-sized unit at 10kW, the average efficiency is an AEER of around 3.2. This is a reasonable baseline efficiency for the calculation of an REES savings. To qualify, it is recommended that a threshold of AEER of 3.5 be reached. As a program simplification, it may be easier to require a minimum ACOP and AEER of 3.5 for cooling and heating respectively (rather than set different qualification criteria for each mode). These requirements are broadly consistent with the requirements specified in Victoria (COP > 3.5, but this does not include any non-operational energy – setting requirements in terms of ACOP and AEER is strongly recommended). Victoria set a minimum capacity of 10kW for ducted systems. This is considered unnecessary, particularly where the dwelling is relatively new and the thermal loads are much lower than for older dwellings. Providing updated advice to installers on correct sizing of air conditioners is a worthwhile project that could be initiated to support REES. Sample energy savings are shown in the following tables.
y = -0.0053x + 3.3615
2
2.5
3
3.5
4
4.5
0 2 4 6 8 10 12 14 16 18 20
AEE
R W
/W
Cooling Capacity kW

R E V I E W O F E N E R G Y E F F I C I E N C Y A C T I V I T I E S U N D E R T H E S A R E E S S C H E M E
R Final Report, Prepared for DSD by EES, BA and Common Capital, July 2014 98
Table 49: Default savings for ducted air conditioners BCA climate 5 (Adelaide)
SRI ACOP/AEER
Annual Heating
GJ
Annual Cooling
GJ
Lifetime Heating
GJ
Lifetime Cooling
GJ
Default savings
(H&C) GJ
Reference 3.35/3.2 6.56 3.61 65.6 36.1 0.0
2.5 3.5 6.28 3.30 62.8 33.0 5.3
3 3.75 5.86 3.08 58.6 30.8 11.1
3.5 4.00 5.49 2.89 54.9 28.9 16.1
4 4.25 5.17 2.72 51.7 27.2 20.5
4.5 4.50 4.88 2.57 48.8 25.7 24.5
5 4.75 4.63 2.43 46.3 24.3 28.0
5.5 5.00 4.40 2.31 44.0 23.1 31.2
6 5.25 4.19 2.20 41.9 22.0 34.1 Notes: Assumes a life of 10 years and a baseline ACOP of 3.35 and AEER of 3.2.Calculation of savings are for a model with the same AEER and ACOP as shown. Most ducted units are not registered for energy labelling so star rating SRI is only shown for reference. Ducted zoning factor of 0.7. Default savings include heating and cooling energy reductions. An overall program adjustment of 0.9 has been included in the default savings as set out in the assumptions.
Table 50: Default savings for ducted air conditioners BCA climate 6 (Mt Gambier)
SRI ACOP/AEER
Annual Heating
GJ
Annual Cooling
GJ
Lifetime Heating
GJ
Lifetime Cooling
GJ
Default savings
(H&C) GJ
Reference 3.35/3.2 14.94 0.68 149.4 6.8 0.0
2.5 3.5 14.30 0.62 143.0 6.2 6.3
3 3.75 13.35 0.58 133.5 5.8 15.2
3.5 4.00 12.52 0.54 125.2 5.4 23.1
4 4.25 11.78 0.51 117.8 5.1 30.0
4.5 4.50 11.13 0.48 111.3 4.8 36.1
5 4.75 10.54 0.46 105.4 4.6 41.6
5.5 5.00 10.01 0.44 100.1 4.4 46.6
6 5.25 9.54 0.41 95.4 4.1 51.1
Notes: Assumes a life of 10 years and a baseline ACOP of 3.35 and AEER of 3.2.Calculation of savings are for a model with the same AEER and ACOP as shown. Most ducted units are not registered for energy labelling so star rating SRI is only shown for reference. Ducted zoning factor of 0.7. Default savings include heating and cooling energy reductions. An overall program adjustment of 0.9 has been included in the default savings as set out in the assumptions.
A possible refinement to the air conditioner energy savings analysis would be to take into account part load operation (and the associated increases in operating efficiency) for products with variable output compressors. This would result in even greater energy savings where variable output products have registered a part load efficiency (nominally at 50% output) for energy labelling. In order to assess the likely overall energy impact of variable output compressors, some investigations into the distribution of time spent at various output levels in typical homes would have to be examined. Around 165 products have part load data at an output of 50% of rated capacity in the registration system. On average, part load efficiency is around 30% better than full load efficiency for the products registered. However, for individual models, this improvement varies from as low as 5% to as high as 70%, so the measured data for each model would have to be used. Such products could reduce overall energy by a further 30%, depending the assumed load distribution and the part and full load performance of an individual model.

R E V I E W O F E N E R G Y E F F I C I E N C Y A C T I V I T I E S U N D E R T H E S A R E E S S C H E M E
R Final Report, Prepared for DSD by EES, BA and Common Capital, July 2014 99
Figure 8: Full and part load AEER value for various air conditioners – cooling mode
Source: Registration database – note X axis is rated capacity for both rated ACOP and part load ACOP.
Figure 9: Full and part load AEER value for various air conditioners – cooling mode
Source: Registration database – note X axis is rated capacity for both rated AEER and part load AEER.
0
1
2
3
4
5
6
7
0 5 10 15 20 25 30
Par
t Lo
ad A
EER
(5
0%
)
Cooling Capacity kW
50% load
Rated
0
1
2
3
4
5
6
7
0 5 10 15 20 25 30
Par
t Lo
ad A
CO
P (
50
%)
Heating Capacity kW
50% load
Rated

R E V I E W O F E N E R G Y E F F I C I E N C Y A C T I V I T I E S U N D E R T H E S A R E E S S C H E M E
R Final Report, Prepared for DSD by EES, BA and Common Capital, July 2014 100
Assessment of non-ducted gas heater efficiency Currently REES includes non-ducted gas heaters. These have been examined as part of this review. Initial evaluation of market potential has ruled out the inclusion of gas ducted heaters from the revised REES scheme. So this section focuses on non-ducted systems. As REES (and all state schemes that cover gas) do not permit unflued gas heaters, these are also excluded from consideration. For gas space heating appliances under AS 4553, the star rating is calculated on the basis of net heater efficiency. Net heater efficiency is calculated on the basis of a combination of full load efficiency and part load efficiency (where applicable) and takes into account all gas and electrical inputs for an assumed use of 5 hours per day. So this value is a reasonable basis for estimating typical in-use efficiency. The net efficiency also takes into account standby components (standby electricity and gas pilot lights) for non-use periods. The net efficiency of a space heater of 61% defines the 1 star level. An increase in 6% efficiency is required for each additional star, with 91% efficiency achieving 6 stars. The annual energy consumption depends on the output capacity of the space heater. For reference, the thermal efficiency of aunflued heater is assumed to be 90.4%, but these are excluded from the scheme due to concerns about ventilation. The Directory of AGA Certified Products (AGA 2013) lists all products currently on the market. This directory is regulatory updated (see AGA website). The only product types considered for this project are:
Flued Radiant/Convection Heaters
Balanced Flue Convection Heaters
Wall Furnaces
Flued Pot Belly Heaters. The following types of heaters have been excluded from the analysis:
Ducted air heaters (AS4556)
Flueless convection and radiant heaters. As at late 2013 there were 138 models of flued gas heater on the market within the specified 4 categories. The AGA listing provides details on the annual energy consumption (CEC) and the star rating (1 decimal place). The heating output can be estimated from the annual energy consumption, while the star rating defines the overall operating efficiency of the product. Around 10 models are currently on the market and that exceed 5 stars (current REES qualification criteria). These range in size from around 25 MJ/hour to 40 MJ/hour. No products currently meet the small product definition REES (<6.5 kW = 23.4 MJ/hour and ≥5 stars). The requirement in Victoria and ACT for a minimum of 4.0 stars is considered too weak in the light of current REES requirements. The Victoria and ACT requirements of a minimum output of 2kW is considered unnecessary as the smallest product currently on the market is 19 MJ/hour (=5kW).

R E V I E W O F E N E R G Y E F F I C I E N C Y A C T I V I T I E S U N D E R T H E S A R E E S S C H E M E
R Final Report, Prepared for DSD by EES, BA and Common Capital, July 2014 101
Figure 10: Current model non-ducted flued gas space heaters
Source: AGA 2013.
The average star rating of all non-ducted flued products is 3.3 stars (there is an apparent decline in efficiency with size). As there is no sales data available from which estimate a sales weighted average, a model weighted average of 3.3 stars (which equates to an operating efficiency of 75%) has been used as the base from which to calculate energy savings. For reference, the annual energy consumption includes any electricity standby. For the calculation of default savings, it is assumed that the difference in standby between an average product and a 5 star gas heater is negligible. Standby values have improved in recent years. Table 51: Default savings for non-ducted flued gas space heaters BCA climate 5 (Adelaide)
SRI (AGA) Efficiency
Annual Heating
GJ
Lifetime Heating
GJ
Default savings (H&C)
GJ
3.3 Reference 75% 12.56 125.6 0.0
5.0 85% 11.08 110.8 13.3
5.5 88% 10.70 107.0 16.7
6.0 91% 10.35 103.5 19.9 Notes: Assumes a life of 10 years and a baseline reference efficiency of 75% (3.3 stars).Non-ducted zoning factor of 0.3. An overall program adjustment of 0.9 has been included in the default savings as set out in the assumptions.
The values for Adelaide above appear to be about one third of the current default factors within REES for a large 5 star gas heater. It is not clear how there could be such a large difference (given the close agreement for air conditioners). However, it
0
1
2
3
4
5
6
0 10 20 30 40 50 60 70 80
Star
Rat
ing
Approx MJ/hr

R E V I E W O F E N E R G Y E F F I C I E N C Y A C T I V I T I E S U N D E R T H E S A R E E S S C H E M E
R Final Report, Prepared for DSD by EES, BA and Common Capital, July 2014 102
would appear that the assumed base case for the calculations of energy savings may have been set at 1 star (61% efficiency). If this is the case, this previous requirement is rather too weak for the calculation of default energy savings given the current market offerings. Table 52: Default savings for non-ducted flued gas space heaters BCA climate 6 (Mt Gambier)
SRI (AGA) Efficiency
Annual Heating
GJ
Lifetime Heating
GJ
Default savings (H&C)
GJ
3.3 Reference 75% 28.61 286.1 0.0
5.0 85% 25.24 252.4 30.3
5.5 88% 24.38 243.8 38.0
6.0 91% 23.58 235.8 45.3
Notes: Assumes a life of 10 years and a baseline reference efficiency of 75% (3.3 stars).Non-ducted zoning factor of 0.3. An overall program adjustment of 0.9 has been included in the default savings as set out in the assumptions.
Potential Compliance Issues There are nomajor concerns in relation to compliance under the specification as long as details of the purchase and installation are verified. Products should be professionally installed by accredited installers. All safety requirements should be met.

R E V I E W O F E N E R G Y E F F I C I E N C Y A C T I V I T I E S U N D E R T H E S A R E E S S C H E M E
R Final Report, Prepared for DSD by EES, BA and Common Capital, July 2014 103
Install Efficient New Gas Space Heater Activity No.
HC1A
1. Activity Specific Definitions
Gas Space Heater means a gas heating appliance that runs on natural gas or LPG and that is certified and listed in the Directory of Australian Gas Association Certified Products.
2. Activity Description (Summary)
Install efficient new gas space heater
3. Activity Eligibility Requirements
Any residential household in South Australia where the installed product requirements and minimum installation requirements can be met. This can include new or replacement systems.
4. Installed Product Requirements
1. Gas space heaters shall be rated at not less than 5.0 stars in accordance with AS4553 and be certified and listed in the Directory of AGA Certified Products.
2. The gas heater must be of non-ducted flued type (unflued heaters are not eligible).
5. Minimum Installation Requirements
Any gas heater installed must comply with AS 60335.2.102.
6. Activity default energy savings The total Gigajoule energy (GJ) saved attributed to this activity per appliance purchased is:
Savings GJ = 7.2)85.006.0]5([75.0
SRI
HH
SRI is the star rating to 1 decimal place in the Directory of AGA Certified Products Where H is 71.52 GJ/year for BCA climate zone 6 (Mt Gambier) Where H is 31.40 GJ/year for all other places in South Australia Default energy savings are in GJ of gas
7. Guidance Notes (Informative only – not mandatory)
Persons installing heating/cooling systems should have regard to the “Air Conditioning Residential Best Practice Guideline” (2003) published by the Australian Institute of Refrigeration, Air Conditioning and Heating (AIRAH). All reasonable endeavours should be used to recycle removed systems. Main gas, LPG and other gas systems are permitted under this specification.Directory of Australian Gas Association Certified Products can be found at http://www.aga.asn.au/complete_product_directory Equivalent table to the formula is provided below.
AGA Star Rating
BCA climate 6 - GJ gas saved
All other areas - GJ gas saved
5.0 30.3 13.3
5.1 31.9 14.0
5.2 33.5 14.7
5.3 35.0 15.4
5.4 36.5 16.0
5.5 38.0 16.7
5.6 39.5 17.4
5.7 41.0 18.0
5.8 42.4 18.6
5.9 43.9 19.3
6.0 45.3 19.9

R E V I E W O F E N E R G Y E F F I C I E N C Y A C T I V I T I E S U N D E R T H E S A R E E S S C H E M E
R Final Report, Prepared for DSD by EES, BA and Common Capital, July 2014 104
Install an Efficient new Reverse Cycle Air Conditioner (Non-Ducted) Activity No.
HC2A
1. Activity Specific Definitions
Reverse cycle air conditioner (non-ducted) means a single phase non ducted air conditioner with
both heating and cooling functions that is registered for energy labelling and MEPS under standard AS/NZS3823.2. ACOP means the annual coefficient of performance as defined in AS/NZS3823.2 in W/W AEER means the annual energy efficiency ratio as defined in AS/NZS3823.2 in W/W
2. Activity Description (Summary)
Install an efficient new reverse cycle air conditioner (non-ducted)
3. Activity Eligibility Requirements
Any residential household in South Australia where the installed product requirements and minimum installation requirements can be met. This can include new or replacement systems.
4. Installed Product Requirements
1. The non-ducted reverse cycle air conditioner must achieve an SRI of ≥ 3.0 stars for both heating and cooling under AS/NZS3823.2 (2013) (ACOP and AEER at rated capacity of ≥3.75).
2. The product shall have a valid registration with an Australian or New Zealand regulator for energy efficiency (energy labelling and MEPS) at the time of sale.
3. The reverse cycle air conditioner (non ducted) shall be single phase and have a rated cooling output not exceeding 13kW.
4. Multi-split systems or water source heat pumps are not eligible.
5. Minimum Installation Requirements
Any reverse cycle air conditioner installed must comply with AS 60335.2.40.
6. Activity default energy savings The total Gigajoule energy (GJ) saved attributed to this activity per appliance purchased is:
Savings GJ BCA climate 6 =
MCMH
4.81.1938.57
Savings GJ other places in SA =
MCMH
6.448.849.37
MH is the registered value for rated heating ACOP at rated capacity in accordance with AS/NZS3823.2 MC is the registered value for rated cooling AEER at rated capacity in accordance with AS/NZS3823.2 Default energy savings are in GJ of electricity
7. Guidance Notes (Informative only – not mandatory)
1. Persons installing heating/cooling systems should have regard to the “Air Conditioning Residential Best Practice Guideline” (2003) published by the Australian Institute of Refrigeration, Air Conditioning and Heating (AIRAH). All reasonable endeavours should be used to recycle removed systems. 2. MH and MC values (ACOP and AEER) can be found at the Energy rating website at: http://reg.energyrating.gov.au/comparator/product_types/64/search/ select “Download CSV”

R E V I E W O F E N E R G Y E F F I C I E N C Y A C T I V I T I E S U N D E R T H E S A R E E S S C H E M E
R Final Report, Prepared for DSD by EES, BA and Common Capital, July 2014 105
Install an Efficient new Reverse Cycle Air Conditioner (Ducted) Activity No.
HC2B
1. Activity Specific Definitions
Reverse cycle air conditioner (ducted) means a ducted air conditioner with both heating and cooling functions that is registered for energy labelling and MEPS under standard AS/NZS3823.2. ACOP means the annual coefficient of performance as defined in AS/NZS3823.2 in W/W AEER means the annual energy efficiency ratio as defined in AS/NZS3823.2 in W/W
2. Activity Description (Summary)
Install an efficient new reverse cycle air conditioner (ducted)
3. Activity Eligibility Requirements
Any residential household in South Australia where the installed product requirements and minimum installation requirements can be met. This can include new or replacement systems.
4. Installed Product Requirements
1. The ducted reverse cycle air conditioner must achieve a rated heating ACOP and a rated cooling AEER of ≥3.5 at rated capacity under AS/NZS3823.2 (2013)
2. Multi-split systems or water source heat pumps are not eligible.
5. Minimum Installation Requirements
Any reverse cycle air conditioner installed must comply with AS 60335.2.40.
6. Activity default energy savings The total Gigajoule energy (GJ) saved attributed to this activity per appliance purchased is:
Savings GJ BCA climate 6 =
MCMH
6.196.4506.140
Savings GJ other places in SA =
MCMH
0.1048.1976.91
MH is the registered value for rated heating ACOP at rated capacity in accordance with AS/NZS3823.2 MC is the registered value for rated cooling AEER at rated capacity in accordance with AS/NZS3823.2 Default energy savings are in GJ of electricity
7. Guidance Notes (Informative only – not mandatory)
1. Persons installing heating/cooling systems should have regard to the “Air Conditioning Residential Best Practice Guideline” (2003) published by the Australian Institute of Refrigeration, Air Conditioning and Heating (AIRAH). All reasonable endeavours should be used to recycle removed systems. 2. MH and MC values (ACOP and AEER) can be found at the Energyrating website at: http://reg.energyrating.gov.au/comparator/product_types/64/search/ select “Download CSV”

R E V I E W O F E N E R G Y E F F I C I E N C Y A C T I V I T I E S U N D E R T H E S A R E E S S C H E M E
R Final Report, Prepared for DSD by EES, BA and Common Capital, July 2014 106
Install Efficient New Ductwork - HC3A
Technical Assessment – HC3A
Install Efficient New Ductwork
REES Activity Reference: HC3A REES Activity title: Install Efficient New Ductwork Target: Improved ducted space conditioner system performance Savings: Activity saves energy by reducing system losses from space conditioning equipment Pre-conditions: No pre-existing conditions

R E V I E W O F E N E R G Y E F F I C I E N C Y A C T I V I T I E S U N D E R T H E S A R E E S S C H E M E
R Final Report, Prepared for DSD by EES, BA and Common Capital, July 2014 107
Scheme Review – REES CURRENT REES ACTIVITY DESCRIPTION This activity currently forms part of the REES scheme code6 . The current summary description within the REES scheme code is as follows: “Installation of ductwork of higher than standard insulation to a small or large reverse cycle air conditioner or gas central heater” This activity is intended to encourage installation of ductwork in either a ceiling or a subfloor space with an insulation value higher than might otherwise occur. The REES scheme anticipates that the higher performance ductwork will be installed at the time of installing a heating/cooling system, however, retrofitting is not precluded. Because the assumption is that the higher performance ductwork will be installed at the time of installing a heating/cooling system the base case is assumed to be the industry standard. For new dwellings and major renovations this is governed by the BCA (see extract below).
For South Australia this translates into R1.0 for heating or cooling only systems and for combined heating and cooling systems R1.5. For installations undertaken outside the control of the BCA (eg replacement systems or installations into existing dwellings Note – some uncertainty in relation to when BCA applies) the minimum standard understood to now be commonly used is R1.0 ducting. In circumstances where R1.5 is required by the BCA then a residential premises would be ineligible for this activity, consequently the assumed base case is R1.0. . PROPOSED REES ACTIVITY DESCRIPTION The proposed activity is fundamentally unchanged, that is: “Installation of ductwork of higher than standard insulation R value to a reverse cycle ducted air conditioner or gas ducted central heater.”
6 RESIDENTIAL ENERGY EFFICIENCY SCHEME CODE REESC/07 February 2014
R E V I E W O F E N E R G Y E F F I C I E N C Y A C T I V I T I E S U N D E R T H E S A R E E S S C H E M E
R Final Report, Prepared for DSD by EES, BA and Common Capital, July 2014 108
The activity now includes for savings based on the actual output capacity of the space conditioner. Default savings are also dependent upon the BCA climate zone location (either zones 4 & 5 or zone 6). KEY SPECIFICATION CHANGES The proposed key specification changes from the current REES activity description are as follows:
Default savings factors are calculated based on the output capacity of the space conditioning equipment to which the ductwork is attached.
Two levels of duct insulation are now options, R1.5 or R2.0 each attracting different levels of default savings.
Default savings are now applied according to the particular location of the residential premises (BCA climate zone location zones 4 & 5 or zone 6).
Installation requirements have been more tightly specified to ensure savings are realised.
Scheme Review – Other jurisdictions The following jurisdictions also include a ductwork upgrade activites within their schemes:
Victoria (VEET schedule No 28A ) Replacement of gas heating ductwork
ACT (EEIS part 2.5) Install insulated gas heating ductwork Table 53 below provides a comparison of the key elements of each jurisdictions ductwork installation scheme.
Scheme Review - Potential of the activity (overview) The activity involves the installation of high performance ducting (assumed to be R1.5 or better) to either a gas heater or a reverse cycle air-conditioner in preference to stock average performance ducting (assumed to be R1.0). This can be at the time a heater/cooler is first installed or at the time of replacement. Ductwork Insulation fundamentally acts to reduce the rate of heat flow from inside the ducts to outside the ducts in heating mode and visa-versa in cooling mode. By limiting such heat loss or gain to the conditioned air within the ductwork it is possible to reduce energy input into the space conditioning unit whilst still maintaining acceptable internal comfort conditions for the dwellings occupants.

R E V I E W O F E N E R G Y E F F I C I E N C Y A C T I V I T I E S U N D E R T H E S A R E E S S C H E M E
R Final Report, Prepared for DSD by EES, BA and Common Capital, July 2014 109
Table 53: State Scheme Summary – Comparative table (Install Efficient Ductwork)
Note: Red text under the proposed REES parameter indicates a change
Parameter SA – REES Scheme (Current)
VIC – VEET Scheme
NSW – ESS Scheme (Published May 2014)
ACT – EEIS Scheme
SA – REES Scheme (Proposed)
Working Title Upgrade ductwork Replacement of gas heating ductwork
Not undertaken in this jurisdiction
Install insulated gas heating ductwork
Upgrade ductwork HC3A
Activity Reference Number N/A 28A Part 2.5 HC3A
Required pre-condition 1 (RC unit )
Option 1: 7-14 kW unit Option 2: >14 kW unit
Not included Not included No pre-condition
Required pre-condition 2 (Gas unit)
Any unit Option 1 – 10-18kWor unknown Option 2 – 18 – 28 kW Option 3 >28kW
Option 1 – 10-18kWor unknown Option 2 – 18 – 28 kW Option 3 >28kW
No pre-condition
Limitation on number of replacements per H Hold
No limitation stated but would usually be one
No limitation stated but would usually be one
No limitation stated but would usually be one
No limitation stated but would usually be one
Replacement unit performance options
R 1.5 R 1.5 (AS 4254–2002) Duct = R 1.5 (AS 4254–2002) Fittings = R0.4
R 1.5 or R2.0
Deemed Values per replacement
7-14kW RC = 2.0 t CO2-e >14kW RC = 2.7 t CO2-e Gas = 1.7 t CO2-e
Unknown = 12.13 t CO2-e 10-18 kW Gas = 12.13 t CO2-e 18 – 28 kW = 15.4 t CO2-e >28 kW = 15.4 t CO2-e
10-18 kW Gas = 12.51 t CO2-e 18 – 28 kW = 15.85 t CO2-e >28 kW = 19.84 t CO2-e
Based on GJ saved by fuel type (see detailed specifications below)
Regional multipliers of the deemed values
None Yes Metro = 1.0 Mild = 1.0 Cold = 1.61 Hot = 0.71
None Effectively yes – by BCA climate zone
Replacement product warranty requirements
Nil Nil Nil 20 years
Referenced Standards None Ductwork - AS 4254–2002 Insulation - AS/NZS 4859.1:2002 Uses fittings that achieve
Ductwork - AS 4254–2002 Insulation - AS/NZS 4859.1:2002
Ductwork - AS 4254–2002 Insulation - AS/NZS 4859.1:2002 Uses fittings that achieve

R E V I E W O F E N E R G Y E F F I C I E N C Y A C T I V I T I E S U N D E R T H E S A R E E S S C H E M E
R Final Report, Prepared for DSD by EES, BA and Common Capital, July 2014 110
Parameter SA – REES Scheme (Current)
VIC – VEET Scheme
NSW – ESS Scheme (Published May 2014)
ACT – EEIS Scheme
SA – REES Scheme (Proposed)
at least the R-value specified by Table 3.12.5.2 of the Building Code (R0.4)
at least the R-value specified by Table 3.12.5.2 of the Building Code (R0.4)
Other requirements May be applied to a pre-existing unit or to a new/replacement unit Credits appear to be based on a new replacement unit ie not replacement of existing ductwork
Duct must be marked with manufacturer, diameter, the R value and note compliance with AS 4254–2002
Duct must be marked with manufacturer, diameter, the R value and note compliance with AS 4254–2002
Duct must be marked with manufacturer, diameter, the R value and note compliance with AS 4254–2002

R E V I E W O F E N E R G Y E F F I C I E N C Y A C T I V I T I E S U N D E R T H E S A R E E S S C H E M E
R Final Report, Prepared for DSD by EES, BA and Common Capital, July 2014 111
Assessment Against Scheme Principles This activity aligns with all major policy objectives. Whilst only a small proportion of low income households are likely to use ducted heating and or ducted cooling systems the marginal cost of using R1.5 ducting compared to R1.0 ducting is quite modest.
Table 54: Alignment with Policy Objectives for Installation of Efficient New Ductwork
Policy Objective Reduces household and/or business energy use Provides a focus on low income households
Associated Objectives: Provides greenhouse gas emission benefits
Provides energy cost benefits
The following table provides an assessment of the activity against the new principles proposed for REES code. Table 55: Activity Alignment with REES General Principles – Install Efficient New Ductwork
Principle Assessment
1. Provides evidence based energy savings
These products are used widely in South Australia. The basis for energy savings associated with this activity is well evidenced. Evidence is available mainly in the form of thermal simulation modelling plus some monitoring studies.
2. Energy savings are additional to base case (BAU) and minimises free riders
As this activity requires that the ducting to be installed must meet a higher than industry standard (noting that we are only considering installations where regulations do not already require the higher performance ducting), the activity provides a degree of additionality. Naturally some homeowners may have chosen to use the higher performance ducting in any case so there will likely be some free riders.
3. Reward best practice in relation to product performance
The proposed approach is to set a minimum performance requirement that reflects the currently agreed optimum level for cost effective insulation. The performance specification is generic which means that there is no limitation placed on the type of product used thereby encouraging innovation to achieve the most cost effective solution that meets the minimum performance requirement.
4. Provides a means for ensuring quality assurance and participant satisfaction
Pre-existing Australian standards set performance requirements to ensure that the activity maintains its performance throughout its expected lifetime and meets consumer expectations.
5. Credible approach for the calculation of energy savings
Default savings factors provide a robust approach to the calculation of average energy savings across a wide range of household types. An additional climate zone has been introduced to account for regional differences in heating and cooling demands.
6. Provides scope for objective, cost effective and practical auditing
Auditing is relatively straight forward to undertake via a visual inspection of the installed product as well as an inspection of the space conditioning unit itself (to determine output capacity)
7. Good practice Activities are typically undertaken by qualified installers. Installed materials are required to comply with relevant Australian standards. Australian standards also dictate safe installation methods as do, to a lesser degree, manufacturer’s instructions.
8. Harmonisation (as far as practical)
This activity is available in the Victorian scheme and the ACT scheme but in each of those schemes the activity is limited only to ducted gas heating. The expanded South Australian scope (ie includes reverse cycle ducted air-conditioners) is considered sensible, particularly given that ducted reverse cycle units are more prevalent in SA than gas ducted heating systems. This activity provides reasonable scope for inter jurisdictional alignment although climatic and space conditioning equipment profile difference between the various jurisdictions will mean that default savings factors will

R E V I E W O F E N E R G Y E F F I C I E N C Y A C T I V I T I E S U N D E R T H E S A R E E S S C H E M E
R Final Report, Prepared for DSD by EES, BA and Common Capital, July 2014 112
Principle Assessment
vary to some degree.
9. Safety and minimising overall risk
Activities are typically undertaken by qualified installers. Products are required to comply with relevant standards and safe installation methods are set out in relevant Australian standards and to a lesser degree in manufacturer’s instructions.
Energy Savings - Review Overview of methodology The estimate of energy savings that are expected to be realised from this activity are based on simulated (AccuRate) thermal load estimates for South Australia. Those thermal loads were then applied to a space conditioning stock model for South Australia (ducted gas and ducted reverse cycle only). The varying duct efficiencies for the base case and the upgraded cases were then applied to the loads in order that end use energy savings by fuel type could be derived. Finally the estimated state average household input energy saving is constrained to take account of three limiting factors:
Limitations on the additionality of the activity (if any)
The impact of “free riders”
The impact of any rebound The modelling method used in this study is based on that used in the study Energy Use in the Australian Residential Sector 1986-2020 (EES 2008). A schematic of that model is shown in Figure 38 . This is believed to be the most comprehensive “bottom up” model of residential energy use available and has been verified against top down (BREE) data. Further details regarding the methodology are contained in Appendix 3 - Thermal Modelling Method. The installed ductwork was assumed to have the following efficiencies:
R1 = 80%
R1.5 = 83%
R2 = 85% These values were derived from estimates undertaken by Pitt and Sherry for the Department of Climate Change and Energy Efficiency in the study Pathway to 2020 for Increased Stringency in New Building Energy Efficiency Standards (DCCEE 2012) The underlying assumptions used as the basis for the calculation of energy savings in this study are detailed in Table 56.

R E V I E W O F E N E R G Y E F F I C I E N C Y A C T I V I T I E S U N D E R T H E S A R E E S S C H E M E
R Final Report, Prepared for DSD by EES, BA and Common Capital, July 2014 113
Table 56: Energy Savings Estimate – Underlying Key Assumptions (Upgrade ductwork)
Parameter Value Basis / Comment
Energy Service Levels Space Heating and Cooling service including heating and cooling availability, time of use, zoning constraint and thermostat settings
State Weighted Average for particular end uses
Refer to Appendix 3 - Thermal Modelling Method for details
Base Case Assumptions Building Stock State
Weighted Average
State average housing stock Refer to Appendix 3 - Thermal Modelling Method for details
Space Heating Equipment installed
Gas ducted and RC ducted
State average stock efficiencies– refer to Appendix 3 - Thermal Modelling Method for details
Climate Zones BCA 4 and 5 BCA 6
As agreed with DSD
Weather file type AccuRate TMY
Assumed Performance of BAU ductwork
R1.0 Ie The assumed industry standard in the absence of regulations that require higher performance levels.
REES Activity Assumptions
Performance of Ductwork to be installed
R 1.5 or R2.0
Lifetime and persistence
Product lifetime 14 years As used in Victoria (represents the life of the space conditioning unit)
Product persistence 14 years As per lifetime
Adjustment Factors
Additionality discount factor 1.0 Covered under “free riders”
Free rider discount 0.8 Unknown – assume that 20% of owners would have selected the higher performance ducting in the absence of the scheme incentive)
Rebound discount factor 0.95 Rebound is expected to be minimal given that the householder already expects I high standard of comfort and there is limited scope for increasing the conditioned floor area
Compliance discount factor 0.95 There is no available research data on this aspect so the default value of 0.95 is assumed. This discount would relate mainly to poor installation in terms of leakage prevention.
Total Discount factor 0.72 Product of individual factors
Climatic Adjustments
Adjustments required Yes Different deeming values are applied according to the climate zone. Either BCA Zone 4 & 5, or BCA zone 6

R E V I E W O F E N E R G Y E F F I C I E N C Y A C T I V I T I E S U N D E R T H E S A R E E S S C H E M E
R Final Report, Prepared for DSD by EES, BA and Common Capital, July 2014 114
Energy Savings Calculation Using the methodology and assumptions as detailed in the preceding sections, an estimate of energy savings associated with the installation of higher performance ductwork was undertaken. The detailed analysis can be found in the MS Excel spreadsheet delivered with this report (File Name REES 2014 Review - Ductwork V01). A summary of the estimated energy savings by fuel type over the assumed lifetime for a product installation in 2016 can be found in Table 57 below.
Table 57: Energy Savings Estimate – (Upgrade Ductwork) Activity default energy savings The total Gigajoule equivalent energy (GJe) saved attributed to this activity per residential premises is
equal to: Activity Energy Savings = (Savings Factor (as per table below) x The rated output of the space conditioning to which the ductwork is attached in kW*)
Climate Zone
Activity Electricity (GJ saved/
kW capacity)
Gas (GJ saved/ kW Capacity)
Firewood (GJ saved/
kW Capacity)
BCA Zones 4 & 5
Gas ducted heater Fitted with R1.5 minimum ductwork
0 0.52 0
Gas ducted heater Fitted with R2.0 minimum ductwork
0 0.85 0
Reverse cycle air-conditioner Fitted with R 1.5 minimum ductwork
0.17 0 0
Reverse cycle air-conditioner Fitted with R 2.0 minimum ductwork
0.28 0 0
BCA Zone 6 Gas ducted heater Fitted with R1.5 minimum ductwork
0 1.25 0
Gas ducted heater Fitted with R2.0 minimum ductwork
0 2.04 0
Reverse cycle air-conditioner Fitted with R 1.5 minimum ductwork
0.28 0 0
Reverse cycle air-conditioner Fitted with R 2.0 minimum ductwork
0.46 0 0
* In the case of reverse cycle air-conditioners the products rating in heating mode shall be used. Where ratings are in MJ/h, divide this number by 3.6 to derive the equivalent rating in kW
Potential Compliance Issues There are no particular compliance issues associated with this activity. However random checks to ensure that the installed product meets the required specification should be undertaken as a matter of course. In particular checks should be undertaken that the rating of the ductwork is maintained throughout the ductwork system (and not just where it attaches to the space conditioning unit) and secondly that the ductwork is properly sealed. A method for checking compliance could be to utilize the process as described in Activity number HC3B which involves actual measurement of the performance of the installed system.

R E V I E W O F E N E R G Y E F F I C I E N C Y A C T I V I T I E S U N D E R T H E S A R E E S S C H E M E
R Final Report, Prepared for DSD by EES, BA and Common Capital, July 2014 115
Recommended Specification The proposed specification (see following page) is based largely on the recently developed specification for Activity HC3B. This specification was developed in consultation with the University of South Australia and generally includes similar provisions to those used in the ACT and Victoria (plus some additional provisions).

R E V I E W O F E N E R G Y E F F I C I E N C Y A C T I V I T I E S U N D E R T H E S A R E E S S C H E M E
R Final Report, Prepared for DSD by EES, BA and Common Capital, July 2014 116
Install Efficient New Ductwork Activity No.
HC3A
1. Activity Specific Definitions
Thermally efficient ductwork means flexible ductwork that is certified by an accredited body or approved laboratory as complying with AS/NZS 4859.1:2002 and is insulated using bulk insulation that achieves a minimum R value of R1.5 (option 1) or R2.0 (option 2) when measured in a flat plate test in accordance with AS/NZS 4859.1:2002
2. Activity Description (Summary)
Installation of ductwork of higher than standard insulation R value to a reverse cycle ducted air conditioner or gas ducted central heater. See also guidance notes below
3. Activity Eligibility Requirements
1. The space conditioning unit to which the thermally efficient ductwork is to be attached must be located in a residential premises and must be either a reverse cycle ducted air conditioner or gas ducted central heater.
2. The relevant ductwork must be flexible ductwork and be installed within a roof space or between a floor and the natural ground.
3. The installation of ductwork with an R value that exceeds R1.0 must not be otherwise required by law, for example as condition of a development approval under the Development Act 1993.
4. Installed Product Requirements
The installed product must : 1. be thermally efficient ductwork as defined above. 2. have a thickness of the insulation as installed in the ducting that matches the design insulation
thickness as specified by the insulation manufacturer 3. be longitudinally labelled at intervals of not more than 1.5 metres, in characters that are clearly
legible and at least 18mm high stating: i. the duct manufacturer’s or duct assembler’s name; and ii. the diameter of the duct core; and iii. the R-value of the bulk insulation; and iv. whether the ductwork complies with AS 4254.1-2012;
4. use fittings that achieve at least the R-value specified by Table 3.12.5.2 of the Building Code of Australia (BCA2013). All dampers must be positive seal dampers to prevent leakage
5. have a warranty of at least 5 years. 6. comply with any product safety or other product performance requirements in a relevant code of
practice or other relevant legislation applying to the activity 7. Be fit for the purpose for which it is intended to be used
5. Minimum Installation Requirements
When installing the flexible ductwork system, the installer shall, at a minimum: 1. Undertake the installation in accordance with manufacturer’s instructions 2. Install and support the system in accordance with the requirements set out in AS 4254.1-2012; 3. duct tape the inner liner to the collar and ensure the insulation is pulled up over the collar before the
outer is duct taped and mechanically fixed to minimize heat loss at the collar join; 4. tape any small tears/holes in the outer or inner sleeve using foil tape for the outer sleeve and duct
tape for the inner sleeve. Taping of any significant tears of more than one quarter of the circumference of the duct may not last and therefore that section of duct is no longer suitable and should be replaced.
5. ensure the activity is completed and certified in accordance with any relevant code or codes of practice and other relevant legislation applying to the activity, including any licensing, registration, statutory approval, activity certification, health, safety, environmental or waste disposal requirements;

R E V I E W O F E N E R G Y E F F I C I E N C Y A C T I V I T I E S U N D E R T H E S A R E E S S C H E M E
R Final Report, Prepared for DSD by EES, BA and Common Capital, July 2014 117
6. Activity default energy savings The total Gigajoule equivalent energy (GJe) saved attributed to this activity per residential premises is
equal to: Activity Energy Savings = (Savings Factor (as per table below) x The rated output of the space conditioning to which the ductwork is attached in kW*)
Climate Zone
Activity Electricity (GJ saved/
kW capacity)
Gas (GJ saved/ kW Capacity)
Firewood (GJ saved/
kW Capacity)
BCA Zones 4 & 5
Gas ducted heater Fitted with R1.5 minimum ductwork
0 0.52 0
Gas ducted heater Fitted with R2.0 minimum ductwork
0 0.85 0
Reverse cycle air-conditioner Fitted with R 1.5 minimum ductwork
0.17 0 0
Reverse cycle air-conditioner Fitted with R 2.0 minimum ductwork
0.28 0 0
BCA Zone 6 Gas ducted heater Fitted with R1.5 minimum ductwork
0 1.25 0
Gas ducted heater Fitted with R2.0 minimum ductwork
0 2.04 0
Reverse cycle air-conditioner Fitted with R 1.5 minimum ductwork
0.28 0 0
Reverse cycle air-conditioner Fitted with R 2.0 minimum ductwork
0.46 0 0
* In the case of reverse cycle air-conditioners the products rating in heating mode shall be used. Where ratings are in MJ/h, divide this number by 3.6 to derive the equivalent rating in kW
7. Guidance Notes (Informative only – not mandatory)
1. This activity is intended to encourage installation of ductwork with insulation value higher than might otherwise occur. It is anticipated that the ductwork will be installed at the time of installing a heating/cooling system. However, retrofitting is not precluded.

R E V I E W O F E N E R G Y E F F I C I E N C Y A C T I V I T I E S U N D E R T H E S A R E E S S C H E M E
R Final Report, Prepared for DSD by EES, BA and Common Capital, July 2014 118
Replace ductwork with an enhanced ductwork system - HC3B
Technical Assessment – HC3B
Replace ductwork with an enhanced ductwork system
REES Activity Reference: HC3B REES Activity title: Replace ductwork with an enhanced ductwork system Target: Improved ducted space conditioner system performance Savings: Activity saves energy by reducing system losses from space conditioning equipment Pre-conditions: Pre and Post installation measurements are required to establish actual savings achieved

R E V I E W O F E N E R G Y E F F I C I E N C Y A C T I V I T I E S U N D E R T H E S A R E E S S C H E M E
R Final Report, Prepared for DSD by EES, BA and Common Capital, July 2014 119
Scheme Review – REES CURRENT REES ACTIVITY DESCRIPTION This activity currently forms part of the REES scheme code7 . The current summary description within the REES scheme code is as follows: “Replacement of an existing flexible ductwork system for a reverse cycle air-conditioner with a new flexible ductwork system (including all fittings).” Unlike activity HC3A, this activity is focused on the replacement of pre-existing ductwork (rather than upgrading the specification of ductwork to be newly installed) and is applied exclusively to reverse cycle ducted air conditioner systems. In addition this particular activity features a measurement (before and after) and verification process as a means for ensuring that the benefits obtained match the default savings Because the assumption is that the higher performance ductwork will replace existing ductwork of a known (measured) performance level the base case is determined through measurement and is not simply an assumed performance level based on market averages. Of course this activity assumes that the owner would not have replaced their ductwork in any case. Duct replacement is an unlikely activity except at the time of the replacement of the space conditioning unit. Industry sources (limited) suggest that duct replacement at the time of space conditioner unit replacement occurs in between 10% to 33% of cases (say 20% on average). . PROPOSED REES ACTIVITY DESCRIPTION The proposed activity is fundamentally unchanged, that is: “Replacement of an existing flexible ductwork system for a reverse cycle air-conditioner with a new flexible ductwork system (including all fittings).” KEY SPECIFICATION CHANGES The proposed key specification changes from the current REES activity description are as follows:
Default savings factors are calculated based on the output capacity of the space conditioning equipment to which the ductwork is attached.
Default savings are now applied according to the particular location of the residential premises (BCA climate zone location zones 4 & 5 or zone 6).
.
Scheme Review – Other jurisdictions The following jurisdictions also include a ductwork upgrade activities within their schemes, noting however that these activities relate only to gas heaters and do not include any verification measurements:
Victoria (VEET schedule No 28A ) Replacement of gas heating ductwork
ACT (EEIS part 2.5) Install insulated gas heating ductwork Table 58 below provides a comparison of the key elements of each jurisdictions ductwork installation scheme.
7 RESIDENTIAL ENERGY EFFICIENCY SCHEME CODE REESC/07 February 2014

R E V I E W O F E N E R G Y E F F I C I E N C Y A C T I V I T I E S U N D E R T H E S A R E E S S C H E M E
R Final Report, Prepared for DSD by EES, BA and Common Capital, July 2014 120
Scheme Review - Potential of the activity (overview) The activity involves the replacement of existing ducting with high performance ducting (assumed to be R1.5 or better) to a reverse cycle air-conditioner. Ductwork Insulation fundamentally acts to reduce the rate of heat flow from inside the ducts to outside the ducts in heating mode and visa-versa in cooling mode. By limiting such heat loss or gain to the conditioned air within the ductwork it is possible to reduce energy input into the space conditioning unit whilst still maintaining acceptable internal comfort conditions for the dwellings occupants. The activity utilizes a specially designed empirically based software tool developed by the University of South Australia to assess the performance of the pre-existing ducting system and thereby determine the current duct efficiency and by inference the percentage improvement that will be afforded by the replacement system. The software requires the following input:
Supply air register temperatures (closest to fan coil unit and furthest to fan coil unit).
Estimated length of ducts from indoor fan coil to the closest and furthest supply registers.
Roof space air temperature.
Flow measurements of all active supply air registers and the return air grille. By measuring the performance of the pre-existing system there can be a high degree of confidence in relation to the actual level of savings made. Based on the analysis by the University of South Australia of a number of existing installations ranging from 4 years old to more than 20 years old the system is expected to save on average 45% on energy costs. However, actual savings for each individual application are determined on site and on this basis under the current rules the activity provider can claim either a minimum of 30% savings or a minimum of 40% savings as applicable. Savings of less than 30% are not eligible for this activity.

R E V I E W O F E N E R G Y E F F I C I E N C Y A C T I V I T I E S U N D E R T H E S A R E E S S C H E M E
R Final Report, Prepared for DSD by EES, BA and Common Capital, July 2014 121
Table 58: State Scheme Summary – Comparative table (Replace ductwork with an enhanced ductwork system)
Parameter SA – REES Scheme (Current)
VIC – VEET Scheme
NSW – ESS Scheme (Published May 2014)
ACT – EEIS Scheme
SA – REES Scheme (Proposed)
Working Title Replacement of an existing flexible ductwork system for a reverse cycle air-conditioner with a new flexible ductwork system (including all fittings)
Replacement of gas heating ductwork
Not undertaken in this jurisdiction
Install insulated gas heating ductwork
Ductwork Replacement
Activity Reference Number N/A 28A Part 2.5 HC3B
Required pre-condition 1 (RC unit )
Measured savings ≥ 30% or Measured savings ≥ 40% or
Not included Not included Measured savings ≥ 30% or Measured savings ≥ 40% or
Required pre-condition 2 (Gas unit)
Not included Option 1 – 10-18kWor unknown Option 2 – 18 – 28 kW Option 3 >28kW
Option 1 – 10-18kWor unknown Option 2 – 18 – 28 kW Option 3 >28kW
Not included
Limitation on number of replacements per H Hold
No limitation stated but would usually be one
No limitation stated but would usually be one
No limitation stated but would usually be one
No limitation stated but would usually be one
Replacement unit performance options
R 1.5 R 1.5 (AS 4254–2002) Duct = R 1.5 (AS 4254–2002) Fittings = R0.4
R 1.5
Deemed Values per replacement
Varies according to savings achieved and climate from 11.9 t CO2-e to 32.8 t CO2-e
Unknown = 12.13 t CO2-e 10-18 kW Gas = 12.13 t CO2-e 18 – 28 kW = 15.4 t CO2-e >28 kW = 15.4 t CO2-e
10-18 kW Gas = 12.51 t CO2-e 18 – 28 kW = 15.85 t CO2-e >28 kW = 19.84 t CO2-e
Varies according to savings achieved and climate. Now based on GJ saved by fuel type (see detailed specifications below)
Regional multipliers of the deemed values
Yes – 4 climate zones: Metropolitan (Adelaide) Hot (Mildura) Cool (Mt Gambier) Cold (Mt Lofty)
Yes Metro = 1.0 Mild = 1.0 Cold = 1.61 Hot = 0.71
None Effectively yes – by BCA climate zone Zones 4 & 5 , or Zone 6
Replacement product warranty requirements
20 years Nil Nil 20 years

R E V I E W O F E N E R G Y E F F I C I E N C Y A C T I V I T I E S U N D E R T H E S A R E E S S C H E M E
R Final Report, Prepared for DSD by EES, BA and Common Capital, July 2014 122
Parameter SA – REES Scheme (Current)
VIC – VEET Scheme
NSW – ESS Scheme (Published May 2014)
ACT – EEIS Scheme
SA – REES Scheme (Proposed)
Referenced Standards Ductwork - AS 4254–2002 Insulation - AS/NZS 4859.1:2002
Ductwork - AS 4254–2002 Insulation - AS/NZS 4859.1:2002 Uses fittings that achieve at least the R-value specified by Table 3.12.5.2 of the Building Code
Ductwork - AS 4254–2002 Insulation - AS/NZS 4859.1:2002
Ductwork - AS 4254–2002 Insulation - AS/NZS 4859.1:2002
Other requirements Requires pre installation performance assessment
Duct must be marked with manufacturer, diameter, the R value and note compliance with AS 4254–2002
Duct must be marked with manufacturer, diameter, the R value and note compliance with AS 4254–2002
Requires pre installation performance assessment

R E V I E W O F E N E R G Y E F F I C I E N C Y A C T I V I T I E S U N D E R T H E S A R E E S S C H E M E
R Final Report, Prepared for DSD by EES, BA and Common Capital, July 2014 123
Assessment Against Scheme Principles This activity aligns with all major policy objectives with the exception of providing a focus for low income households. Only a small proportion of low income households are likely to use ducted reverse cycle air-conditioning and the capital costs are relatively high (typically several thousand dollars per installation)
Table 59: Alignment with Policy Objectives for Installation of Efficient New Ductwork
Policy Objective Reduces household and/or business energy use Provides a focus on low income households x
Associated Objectives: Provides greenhouse gas emission benefits
Provides energy cost benefits
The following table provides an assessment of the activity against the new principles proposed for REES code. Table 60: Activity Alignment with REES General Principles – Install Efficient New Ductwork
Principle Assessment
1. Provides evidence based energy savings
The basis for energy savings associated with this activity is well evidenced. The activity includes its own verification process involving before and after measurements
2. Energy savings are additional to base case (BAU) and minimises free riders
This activity is most likely to be undertaken at the time of a space conditioner unit replacement and at such times it might be expected that 20% of owners would have opted to replace their ductwork in any case (based on advice from limited industry sources). Consequently, whilst this activity does provide additionality it is not 100%
3. Reward best practice in relation to product performance
The proposed approach is to set two levels of performance (minimum 30% reduction in losses and minimum 40% reduction in loses). The performance specification is generic which means that there is no limitation placed on the type of product used thereby encouraging innovation to achieve the most cost effective solution that meets either of the performance requirements
4. Provides a means for ensuring quality assurance and participant satisfaction
Pre-existing Australian standards set performance requirements to ensure that the activity maintains its performance throughout its expected lifetime and meets consumer expectations.
5. Credible approach for the calculation of energy savings
For this activity savings are based on measurements of losses before and after the activity which provides a high degree of credibility to the calculated energy savings. Two climate zones have been used to account for regional differences in heating and cooling demands.
6. Provides scope for objective, cost effective and practical auditing
Auditing is relatively straight forward to undertake via a visual inspection of the installed product as well as an inspection of the space conditioning unit itself (to determine output capacity). The one area of potential difficulty relates to auditing of the performance of the pre-existing ductwork, however the specifications require that this aspect be pre-determined by an independent body.
7. Good practice Activities are typically undertaken by qualified installers. Installed materials are required to comply with relevant Australian standards. Australian standards also dictate safe installation methods as do, to a lesser degree, manufacturer’s instructions.
8. Harmonisation (as far as practical)
This activity is available in the Victorian scheme and the ACT scheme but in each of those schemes the activity is limited only to ducted gas heating and does not include a measurement and verification process. This activity provides some scope for inter jurisdictional alignment, however the proprietary nature of the measurement software used to verify the savings presents limitations on the widespread application of the activity.

R E V I E W O F E N E R G Y E F F I C I E N C Y A C T I V I T I E S U N D E R T H E S A R E E S S C H E M E
R Final Report, Prepared for DSD by EES, BA and Common Capital, July 2014 124
Principle Assessment
9. Safety and minimising overall risk
Activities are typically undertaken by qualified installers. Products are required to comply with relevant standards and safe installation methods are set out in relevant Australian standards and to a lesser degree in manufacturer’s instructions.
Energy Savings - Review Overview of methodology The estimate of energy savings that are expected to be realised from this activity are based on simulated (AccuRate) thermal load estimates for South Australia. Those thermal loads were then applied to a space conditioning stock model for South Australia (ducted reverse cycle only). The varying duct efficiencies for the measured base case and the upgraded cases were then applied to the loads in order that end use energy savings by fuel type could be derived. Finally the estimated state average household input energy saving is constrained to take account of three limiting factors:
Limitations on the additionality of the activity (if any)
The impact of “free riders”
The impact of any rebound The modelling method used in this study is based on that used in the study Energy Use in the Australian Residential Sector 1986-2020 (EES 2008). A schematic of that model is shown in Figure 38 . This is believed to be the most comprehensive “bottom up” model of residential energy use available and has been verified against top down (BREE) data. Further details regarding the methodology are contained in Appendix 3 - Thermal Modelling Method. The installed ductwork (R1.5) was assumed to have an efficiency of 83%. This value was derived from estimates undertaken by Pitt and Sherry for the Department of Climate Change and Energy Efficiency in the study Pathway to 2020 for Increased Stringency in New Building Energy Efficiency Standards (DCCEE 2012) The underlying assumptions used as the basis for the calculation of energy savings in this study are detailed in Table 61.
Table 61: Energy Savings Estimate – Underlying Key Assumptions (Ductwork Replacement)
Parameter Value Basis / Comment
Energy Service Levels Space Heating and Cooling service including heating and cooling availability, time of use, zoning constraint and thermostat settings
State Weighted Average for particular end uses
Refer to Appendix 3 - Thermal Modelling Method for details
Base Case Assumptions Building Stock State
Weighted Average
State average housing stock Refer to Appendix 3 - Thermal Modelling Method for details
Space Heating Equipment installed
Reverse cycle ducted
State average stock efficiencies– refer to Appendix 3 - Thermal Modelling Method for details

R E V I E W O F E N E R G Y E F F I C I E N C Y A C T I V I T I E S U N D E R T H E S A R E E S S C H E M E
R Final Report, Prepared for DSD by EES, BA and Common Capital, July 2014 125
Parameter Value Basis / Comment Climate Zones BCA 4 and 5
BCA 6 As agreed with DSD
Weather file type AccuRate TMY
Assumed Performance of pre-existing ductwork
Losses = 40%
Refer to Appendix 3 - Thermal Modelling Method for details
REES Activity Assumptions
Performance of Ductwork to be installed
R 1.5
Lifetime and persistence
Product lifetime 14 years As used in Victoria (represents the life of the space conditioning unit)
Product persistence 14 years As per lifetime
Adjustment Factors
Additionality discount factor 1.0 Covered under “free riders”
Free rider discount 0.8 Unknown – assume that 20% of owners would have upgraded ductwork in any case
Rebound discount factor 0.95 Rebound is expected to be minimal given that the householder already expects I high standard of comfort and there is limited scope for increasing the conditioned floor area
Compliance discount factor 0.95 There is no available research data on this aspect so the default value of 0.95 is assumed. This discount would relate mainly to poor installation in terms of leakage prevention.
Total Discount factor 0.72 Product of individual factors
Climatic Adjustments
Adjustments required Yes Different deeming values are applied according to the climate zone. Either BCA Zone 4 & 5, or BCA zone 6
Energy Savings Calculation Using the methodology and assumptions as detailed in the preceding sections, an estimate of energy savings associated with the installation of higher performance ductwork was undertaken. The detailed analysis can be found in the MS Excel spreadsheet delivered with this report (File Name REES 2014 Review - Ductwork V01). A summary of the estimated energy savings by fuel type over the assumed lifetime for a product installation in 2016 can be found in Table 62 below.

R E V I E W O F E N E R G Y E F F I C I E N C Y A C T I V I T I E S U N D E R T H E S A R E E S S C H E M E
R Final Report, Prepared for DSD by EES, BA and Common Capital, July 2014 126
Table 62: Energy Savings Estimate – (Ductwork Replacement)
Activity default energy savings The total Gigajoule equivalent energy (GJe) saved attributed to this activity per residential premises is
equal to: Activity Energy Savings = (Savings Factor (as per table below) x The rated output of the space conditioning to which the ductwork is attached in kW*)
Activity Electricity (GJ saved/ kW
capacity)
Gas (GJ saved/ kW Capacity)
Firewood (GJ saved/ kW
Capacity)
BCA Zones 4&5 30% min. reduction in duct losses
1.75 0 0
BCA Zone 6 30% min. reduction in duct losses
2.45 0 0
BCA Zones 4&5 40% min. reduction in duct losses
2.33 0 0
BCA Zone 6 40% min. reduction in duct losses
3.26 0 0
* In the case of reverse cycle air-conditioners the products rating in heating mode shall be used.
Potential Compliance Issues The main concern relates to the fact that the initial assessment process is typically undertaken by the installer, which means that there is no independent assessment of the pre-existing systems performance. Potentially this means that even though the software may be accurate the system could be rorted by an unscrupulous installer who could falsely inflate the pre-existing system losses. Furthermore, because the pre-existing system is removed and disposed of at the end of the process, the pre-existing condition cannot be checked once the activity is completed. This aspect could be dealt with by requiring that the assessment process be undertaken by a third party separate from the installer, ideally holding some form of accreditation and subject to random audit.
Recommended Specification The proposed specification (see following pages) is based largely on the existing specification for Activity in the REES scheme except that benefits are now based on the output capacity of the space conditioning unit. The current specification was developed in consultation with the University of South Australia and generally includes similar provisions to those used in the ACT and Victoria (plus some additional provisions).

R E V I E W O F E N E R G Y E F F I C I E N C Y A C T I V I T I E S U N D E R T H E S A R E E S S C H E M E
R Final Report, Prepared for DSD by EES, BA and Common Capital, July 2014 127
Replace ductwork with an enhanced ductwork system Activity No.
HC3B
1. Activity Specific Definitions
Thermally efficient ductwork means flexible ductwork that is certified by an accredited body or approved laboratory as complying with AS/NZS 4859.1:2002 and is insulated using bulk insulation that achieves a minimum R value of R1.5 when measured in a flat plate test in accordance with AS/NZS 4859.1:2002
2. Activity Description (Summary)
Replacement of an existing flexible ductwork system for a reverse cycle air-conditioner with a new flexible ductwork system (including all fittings)
3. Activity Eligibility Requirements
1. The space conditioning unit to which the thermally efficient ductwork is to be attached must be located in a residential premises and must be a reverse cycle ducted air conditioner.
2. The relevant ductwork must be flexible ductwork and be installed within a roof space or between a floor and the natural ground.
3. The installation of thermally efficient ductwork must not be otherwise required by law, for example as condition of a development approval under the Development Act 1993.
4. Prior to engaging in this activity, the obliged retailer must: a. have provided the Commission with an application for the approval of:
i. a software tool to assess the performance of the pre-existing ductwork system and the replacement ductwork system which verifies a specified percentage reduction in duct losses as outlined in Table 1; and
ii. the assessment process for which independent testing will be undertaken on the flexible ductwork system to ensure verifiability;
b. receive the written approval of the Commission to: i. install the flexible ductwork system; and ii. assign that system to an appropriate class as set out in Table 1.
4. Installed Product Requirements
The installed product must : 1. be thermally efficient ductwork as defined above. 2. have a thickness of the insulation as installed in the ducting that matches the design insulation
thickness as specified by the insulation manufacturer 3. be certified by an accredited body or approved laboratory as having an insulation conductivity and
thickness such that the TRUE radial R value defined by equation 4 in AS 4508-2009, section 3.2.3, is greater than or equal to 1.3 K/W based on a one metre length of 300 mm internal diameter duct (i.e. ri = 0.15 m). Furthermore, all other duct sizes used in the installation shall use the same insulation (conductivity and thickness) as that used in the 300mm internal diameter ducting
4. be longitudinally labelled at intervals of not more than 1.5 metres, in characters that are clearly legible and at least 18mm high stating: i. the duct manufacturer’s or duct assembler’s name; and ii. the diameter of the duct core; and iii. the R-value of the bulk insulation; and iv. whether the ductwork complies with AS 4254.1-2012;
5. use fittings that achieve at least the R-value specified by Table 3.12.5.2 of the Building Code of Australia (BCA2013). All dampers must be positive seal dampers to prevent leakage
6. have a warranty of at least 20 years. 7. comply with any product safety or other product performance requirements in a relevant code of
practice or other relevant legislation applying to the activity 8. Be fit for the purpose for which it is intended to be used

R E V I E W O F E N E R G Y E F F I C I E N C Y A C T I V I T I E S U N D E R T H E S A R E E S S C H E M E
R Final Report, Prepared for DSD by EES, BA and Common Capital, July 2014 128
5. Minimum Installation Requirements
For every installation, the flexible ductwork system must be independently tested using the system and process approved by the Commission prior to the installation being undertaken and again after the installation is completed. This testing must be conducted on site using the actual measurements for the installation and demonstrate a reduction in duct losses of a percentage outlined in Table 1 after the installation is completed compared to before the installation is undertaken. When installing the flexible ductwork system, the installer shall, at a minimum: 1. Undertake the installation in accordance with manufacturer’s instructions 2. Install and support the system in accordance with the requirements set out in AS 4254.1-2012; 3. use silicone to seal around both the supply and return air starters to the indoor fan coil; 4. ensure that the fan noise into the house be minimised with either 6 metres of return air duct or 3
metres of acoustically lined duct from the return air box to the indoor fan coil; 5. mechanically fix the ducting to prevent openings at joins over time; 6. duct tape the inner liner to the collar and ensure the insulation is pulled up over the collar before the
outer is duct taped and mechanically fixed to minimize heat loss at the collar join; 7. ensure, where possible, that the air flow is balanced by using similar duct runs and bends after Y
pieces. If manual damper blades are to be installed, they should be left in the fully open position and only adjusted where necessary, minimizing pressure loss in the system
8. connect motorised dampers directly to collar Ys with at least 4 screws and duct tape must be placed over the joins, preventing air leakage in the future;
9. where possible, make the duct runs as short as possible to maximise airflow. There should be no kinks in the flexible duct and all duct should be hung by strapping where needed i.e.: over timbers etc.;
10. use curved duct supports such as flexright fittings on all outlets where possible, to minimize pressure losses at outlets as well as maximize throw of air; and
11. tape any small tears/holes in the outer or inner sleeve using foil tape for the outer sleeve and duct tape for the inner sleeve. Taping of any significant tears of more than one quarter of the circumference of the duct may not last and therefore that section of duct is no longer suitable and should be replaced.
12. ensure the activity is completed and certified in accordance with any relevant code or codes of practice and other relevant legislation applying to the activity, including any licensing, registration, statutory approval, activity certification, health, safety, environmental or waste disposal requirements;
6. Activity default energy savings The total Gigajoule equivalent energy (GJe) saved attributed to this activity per residential premises is
equal to: Activity Energy Savings = (Savings Factor (as per table below) x The rated output of the space conditioning to which the ductwork is attached in kW*)
Activity Electricity (GJ saved/ kW
capacity)
Gas (GJ saved/ kW Capacity)
Firewood (GJ saved/ kW
Capacity)
BCA Zones 4&5 30% min. reduction in duct losses
1.75 0 0
BCA Zone 6 30% min. reduction in duct losses
2.45 0 0
BCA Zones 4&5 40% min. reduction in duct losses
2.33 0 0
BCA Zone 6 40% min. reduction in duct losses
3.26 0 0
* In the case of reverse cycle air-conditioners the products rating in heating mode shall be used.
7. Guidance Notes (Informative only – not mandatory)

R E V I E W O F E N E R G Y E F F I C I E N C Y A C T I V I T I E S U N D E R T H E S A R E E S S C H E M E
R Final Report, Prepared for DSD by EES, BA and Common Capital, July 2014 129
Replace or upgrade water heater - WH1
Technical Assessment – WH1
Replace or upgrade water heater
REES Activity Reference: WH1 REES Activity title: Replace or upgrade water heater Target product: water heaters Savings: Activity saves energy directly in the target product Pre-conditions: Specified existing water heater types, SA Water Heater Installation Requirements

R E V I E W O F E N E R G Y E F F I C I E N C Y A C T I V I T I E S U N D E R T H E S A R E E S S C H E M E
R Final Report, Prepared for DSD by EES, BA and Common Capital, July 2014 130
Current REES Activity Description This activity currently forms part of the REES scheme code8 . The current summary description within the REES scheme code is as follows: “Install or replace a water heater” This activity covers the installation of any water heater in a house. It can cover water heaters installed in new houses and replacement of existing water heaters in new homes. Currently there are a range of cases envisaged under REES:
WH1 – early replacement of an existing water heater <5 years old
WH2a – replacement of a broken water heater where a low emission water heater IS NOT required
WH2b – replacement of a broken water heater where a low emission water heater IS required
WH2c – installation of a water heater in a new home where a low emission water heater IS NOT required.
The credits provided depend on the case above and the water heater selected. For case WH1 (existing system electric) credits range from 15.7 to 20.4 CO2-e. For WH2a where the existing system is electric credits range from 23.5 to 30.6 CO2-e.For WH2a where the existing system is gas credits range from 1.9 to 8.3 CO2-e.For WH2b the credit is 6.3 CO2-e.For WH2c credits range from 1.9 to 23.5 CO2-e. Minimum performance specifications are set out for each option of water heater. For gas systems the star rating must be greater than or equal to 5 stars. For solar systems (solar electric, solar gas and heat pump), the system must earn a minimum number of STCs (RECs), depending on tank size as follows:
Tanks size ≤ 220 litres: ≥ 17 RECS
220 litres < Tank size ≤ 400 litres: ≥ 27 RECS
400 litres < Tank size ≤ 700 litres: ≥ 38 RECS The SA Water Heater Installation Requirements (as revised) require all Class 1 dwellings with a mains gas connection to have a low emission water heater (DMITRE 2013). All new dwellings are also required to have a low emissions water heater (irrespective of gas connection). This complements REES and sets out a base for the calculation of energy savings.
Proposed REES Activity Description The proposed summary description for the REES scheme code is as follows: “Install or replace a water heater” This activity can cover the installation of any water heater in a residential dwelling. It can cover water heaters installed in new dwellings and replacement of existing water heaters in existing dwellings. There are two main cases covered by this activity:
8 RESIDENTIAL ENERGY EFFICIENCY SCHEME CODE REESC/07 February 2014

R E V I E W O F E N E R G Y E F F I C I E N C Y A C T I V I T I E S U N D E R T H E S A R E E S S C H E M E
R Final Report, Prepared for DSD by EES, BA and Common Capital, July 2014 131
Case 1: where a Class 1 residential premises IS NOT required to install a low emission water heater under the SA Water Heater Installation Requirements and all Class 2 residential premises.
Case 2 where a Class 1 residential premises IS required to install a low emission water heater under the SA Water Heater Installation Requirements.
The activity defines requirements for water heaters that are significantly more efficient than the minimum under the SA Water Heater Installation Requirements. Performance requirements for water heaters to be eligible to be installed under this REES activity are:
For gas systems the star rating must equal to 6 stars.
Solar electric and gas boosted solar systems with a tank size ≤ 220 litres shall earn ≥ 17 STCs
Solar electric and gas boosted solar systems 220 < tank size ≤ 400 litres shall earn ≥ 27 STCs and shall be rated as medium or large when assessed under AS/NZS4234 for Zone 3.
Solar electric and gas boosted solar systems 400 < tank size ≤ 700 litres shall earn ≥ 38 STCs and shall be rated as medium or large when assessed under AS/NZS4234 for Zone 3.
Heat pump water heaters shall earn ≥ 27 STCs when assessed under AS/NZS4234 for Zone 3 and ≥ 26 STCs when assessed under AS/NZS4234 for Zone 4.
The default energy savings depend on the individual Case applicable to the household. Activity Description – type installed Electricity
(GJ saved) Gas
(GJ saved)
Case 1: 6 star gas * 97 -116 Case 1: Solar electric 113 Case 1: Solar gas 141 -23 Case 1: Heat pump 103 Case 2: 6 star gas -1 15 Case 2: Solar electric * -35 196 Case 2: Solar gas -7 173 Case 2: Heat pump -45 196 Notes: Items marked * are new options under this proposed REES Activity. The base case for Case 1 is a small electric resistance water heater, hence any gas consumption appears as a negative saving. The base case for Case 2 is a 5 star gas water heater, hence any electricity consumption appears as a negative saving. See Appendix 4 for technical background.
Key Specification Changes The key changes from the current specification are:
A simplification of the requirements into two categories –where a low emission water heater IS NOT required under the SA Water Heater Installation Requirements (Case 1) and where a low emission water heater IS required under the SA Water Heater Installation Requirements (Case 2).
The previous specification requirements regarding the operational state of the water heater have been removed. Changing a water heater type is a major event and this requires careful planning. Waiting until a water heater has failed will almost certainly result in a replacement of like for like and represents a missed opportunity for a system change to a more efficient water heater type.

R E V I E W O F E N E R G Y E F F I C I E N C Y A C T I V I T I E S U N D E R T H E S A R E E S S C H E M E
R Final Report, Prepared for DSD by EES, BA and Common Capital, July 2014 132
The minimum performance requirements for gas water heaters has been upgraded to 6 stars, as under the SA Water Heater Installation Requirements Case 2 mandates a minimum of 5 star gas.
Performance requirements for solar electric and solar gas systems are largely unchanged, except that for tank sizes >220 litres, the systems must also qualify as medium or large under AS/NZS4234.
Performance requirements for heat pump systems have been modified by eliminating any requirement for tank size and specifying a minimum STC (REC) requirement in AS/NZS4234 Zone 3 and 4. This is to ensure that heat pump systems maintain good performance in the colder parts of the state that are close to or in Zone 4 and avoids conflicts with SA Water Heater Installation Requirements.
Supporting analysis for the changes to the solar and heat pump performance specifications are included in Appendix 4.
The savings by fuel have been revised based on the base assumption for Case 1 (80 litre electric water heater9) and Case 2 (5 star gas water heater) as set out in the SA Water Heater Installation Requirements. Case 1 has also been used for Class 2 dwellings as these are not covered by the SA Water Heater Installation Requirements.
The assumed hot water demand has been revised to be based on the latest and best available data for hot water demand. This has resulted in an adjustment of energy savings by fuel.
The default savings are now expressed in terms of equivalent GJ saved by fuel.
Potential refinements to the activity could be developed around scaling the energy savings based on the size of the product (on the basis that larger systems will usually be installed in larger homes) and scaling the energy savings based on the STCs (RECs) earned (better performing models should save more energy in normal use). It would then be necessary to scale all savings relative to system size (capability) and predicted share of installations by system size to ensure that the overall hot water delivered across all houses approximates the average values expected. As illustrated in Appendix 4, the total energy consumed by water heaters is not linear with hot water load, so this type of change will require further investigation and better data on hot water consumption as a function of demographics.
Scheme Review – Other jurisdictions The following jurisdictions also include a water heaters replacement activity within their schemes:
Victoria: VEET Schedule 1 – replace electric storage water heater with: o 1A Gas or LPG gas storage water heater o 1B Gas or LPG instantaneous water heater o 1C Electric boosted solar or heat pump water heater (old standard) o 1D Gas or LPG boosted solar water heater (old standard) o 1E Electric boosted solar or heat pump water heater (new standard) o 1F Gas or LPG boosted solar water heater (new standard)
Victoria: VEET Schedule 2 – solar retrofit kit on an electric storage water heater
9 SA Water Heater Installation Guidelines allow up to 250 litre electric for Class 1 dwellings
that are not required to install a low emissions water heater. However, smaller electric storage systems will be common in Class 2 dwellings. The smaller system provides a slightly lower energy baseline (reference) for the calculation of default energy savings factors.

R E V I E W O F E N E R G Y E F F I C I E N C Y A C T I V I T I E S U N D E R T H E S A R E E S S C H E M E
R Final Report, Prepared for DSD by EES, BA and Common Capital, July 2014 133
Victoria: VEET Schedule 3 - replace gas or LPG water heater with: o 3A Gas or LPG boosted solar water heater (old standard) o 3B Gas or LPG boosted solar water heater (new standard)
Victoria: VEET Schedule 4 - Solar Pre-Heater
NSW – no activity covers this product
ACT Part 3.1: Decommission and replace electric resistance water heater with gas or solar gas water heater
ACT Part 3.2: Decommission a gas or LPG water heater and install a gas or LPG boosted solar water heater
Water heaters are an exceptionally complex activity and it is difficult to provide direct comparisons across the states. In particular, each state takes a different approach to the calculation of credits and savings. After detailed analysis, the key differences between the states are summarised below:
Victoria allows existing electric or gas systems to be replaced with gas, solar electric, heat pump or solar gas and are the most flexible with the largest number of options. This also includes solar retrofit kits and solar pre-heaters, but these are rarely used (based on the activities undertaken to date).
ACT only allow: electric to gas or solar gas; or low efficiency gas to solar gas.
SA REES currently allows electric or gas systems to be replaced with gas, solar electric, heat pump or solar gas. This is restricted to only solar gas where a low emission water heater is required (most Class 1 dwellings with a gas connection and all new dwellings) – solar electric and heat pump are not included in REES where a low emission heater is required (even though they are classified as low emission heaters).
Victoria and ACT both specify different credits based on system size10. In contrast SA only specifies a single credit for each water heater before/after combination.
Victoria and ACT both specify AS/NZS 4234 climate Zone 4 (even though ACT is in Zone 3) while SA specify Zone 3 (most of SA is in Zone 3).
Victoria and ACT both specify 60% solar contribution for solar systems under AS/NZS 4234 Zone 4 while SA specifies minimum RECS (STCs) by system size. Note that AS/NZS 4234 already requires at least 60% energy saving relative to the reference water heater in Zone 3 using the same boost fuel and the same load in order to qualify for RECS (STCs) under that standard, so this requirement is already specified.
ACT and SA specify current versions of AS/NZS2712 and AS/NZS4234 while Victoria sets out different credits for the old and new versions of these standards. Victoria offers different credits for small or large solar systems as rated under AS4234-1994 (noting that large under that standard is equivalent to medium under AS/NZS4234).
Each state has different existing regulatory requirements regarding the types of water heaters that can be installed in homes. These have not been examined in detail. SA Water Heater Installation Requirements set out specific requirements for new and existing homes which need to be taken into account when examining requirements for South Australia and define a clear basis for additionality.
Table 63 below provides a comparison of the key elements of water heater replacement in each jurisdiction.
10
Detailed analysis of data in Victoria for DPI has revealed that larger systems dominate VEET installations for all water heater types and therefore the savings are somewhat overestimated based on the assumed household sizes.

R E V I E W O F E N E R G Y E F F I C I E N C Y A C T I V I T I E S U N D E R T H E S A R E E S S C H E M E
R Final Report, Prepared for DSD by EES, BA and Common Capital, July 2014 134
Table 63: State Scheme Summary – Comparative table for water heaters
Parameter SA – REES Scheme (current)
VIC – VEET Scheme NSW – ESS Scheme ACT – EEIS Scheme SA – REES Scheme (proposed)
Working Title Install or replace a water heater
Water Heater Solar Retrofit Kit Solar Water Heater Solar Pre-heater
No activity Replace electric water heater Decommission a gas or LPG water heater and install a gas or LPG boosted solar water heater
Install or replace a water heater
Activity Reference Number
N/A Schedules 1, 2, 3, 4 N/A Parts 3.1, 3.2 WH1
Required pre-condition (existing water heater)
WH1 Electric (early retirement) WH2 Electric or gas (LEWH not required) WH2 Other situations not specified
Schedule 1 – electric (any) Schedule 3 – gas (any)
3.1 – electric resistance 3.2 – gas <5 stars
SA WH Installation Requirements Case 1: low emission water heater IS NOT reqd Case 2: low emission water IS required
Replacement options Gas, solar, solar gas or heat pump (1)
Gas, solar, solar gas or heat pump
3.1 – gas or solar gas 3.2 – gas solar
Gas, solar electric, solar gas or heat pump
Performance requirements
Gas 5 star, RECS (STCs) for solar systems by tank size (2)
Gas 5 star, 60% solar contribution Zone 4 (Melbourne)
Gas 5 star, 60% solar contribution Zone 4 (Melbourne)
Gas 6 star, STCs (RECs) for solar systems by tank size (2), heat pump ≥ 27 STCs in Zone 3 & 4
Deemed savings per replacement
Complex – tables of values, fixed value by existing and replacement water heater type
Complex – gas as a function of size, solar as a function of size, Bs and Be (4)
Complex – gas as a function of size, solar as a function of size, Bs and Be (3) (4)
Complex – tables of values, fixed value by Case and replacement water heater type
Replacement product warranty requirements
Nil Nil Nil Nil
Referenced Standards AS/NZS2712 AS/NZS4234 (Zone 3)
AS/NZS2712 AS/NZS4234 (Zone 4)
AS/NZS2712 AS/NZS4234 (Zone 4) (3)
AS/NZS2712 AS/NZS5125.1 AS/NZS4234 (Zone 3 & 4)
Notes: Requirements are very complex have been simplified for this table. (1) The only eligible option under current REES where a low emission water heater is required by law is solar gas (2) AS/NZS 4234 requires an energy saving of >60% in Zone 3 to qualify for STCs and capacity (3) ACT specifies water heater Zone 4 under AS/NZS4234 even though it is located in Zone 3. (4) Bs and Be are values determined in accordance with AS/NZS 4234 and relate to boost (heater) energy and auxiliaries (pumps and controls). As ACT and Victoria both use emissions, the factors for the same water heaters are somewhat different.

R E V I E W O F E N E R G Y E F F I C I E N C Y A C T I V I T I E S U N D E R T H E S A R E E S S C H E M E
R Final Report, Prepared for DSD by EES, BA and Common Capital, July 2014 135
Scheme Review - Potential of the activity (overview) ABS4602 data shows that electric water heaters still make up over 40% of all water heaters in South Australia, so there is a massive potential to reduce energy consumption through the installation of more efficient hot water systems. Figure 11: Trends in water heater ownership in South Australia
Source: ABS4602 (2011) and author estimates
However, various data sources (GWA 2013, ESCOSA survey of water heaters in 2011) suggest that there may be a rapid move away from electric systems in recent years due to the new requirements under the SA Water Heater Installation Requirements (last data point above is 2011 and historical trends have been projected by the authors). Nevertheless, there is still a very large potential. There are at least 200,000 electric water heaters in South Australia and current REES activity levels are less than 1,000 per year, so there is great potential. Low emission water heaters such as solar electric, heat pump and solar gas can save large amounts of energy and can reduce consumption by as much as 80% from conventional systems. Given that water heating is a major end use in the home, these savings are very significant. Because gas and electricity are commonly used for water heating, the emission impacts are more complex to calculate where there is a fuel change, but there is no doubt that the main types covered by REES will have positive net emission benefits. However, investment in a new water heater involves significant capital expenditure. So the potential energy savings come at a cost and this provides a significant barrier to low income households. Households in rental accommodation are subject to landlord discretion regarding investment in a new water heater (households in Class 1 dwellings and connected to mains gas would at least be required to have a 5 star gas water heater installed if the system requires replacement).
0.0
0.1
0.2
0.3
0.4
0.5
0.6
1990
1993
1996
1999
2002
2005
2008
2011
2014
2017
2020
Ow
ners
hip
Year
Summary for South Australia: Water Heater Scenario 1
WaterheatElectric
Waterheat Gas
WaterheatOther
Waterheat Solar
Actual Projected

R E V I E W O F E N E R G Y E F F I C I E N C Y A C T I V I T I E S U N D E R T H E S A R E E S S C H E M E
R Final Report, Prepared for DSD by EES, BA and Common Capital, July 2014 136
Assessment Against Scheme Principles This activity aligns with all major policy objectives, except there is limited scope for participation for low income households (due to capital costs and/or investment by landlords).
Table 64: Alignment with Policy Objective – water heaters
Policy Objective Reduces household and/or business energy use Provides a focus on low income households ×
Associated Objectives: Provides greenhouse gas emission benefits
Provides energy cost benefits
The following table provides an assessment of the activity against the new principles proposed for REES code. Table 65: Activity Alignment with REES General Principles - water heaters
Principle Assessment
1. Provides evidence based energy savings
Every household has a water heater and these use significant energy. This activity is technically capable of broad implementation and uptake by households within South Australia. There will be lower rates of the adoption of solar systems in low income households (capital investment) and rental households (split incentives).The basis for energy savings associated with this activity is well evidenced. The reduction in energy consumption from an efficient water heater is well established. The performance characteristics of replacement products are listed on the CER website (solar) or are registered for MEPS with the federal regulator (gas) and are therefore easily accessed for the purposes of verification.
2. Energy savings are additional to base case (BAU) and minimises free riders
Given the current requirements of the SA Water Heater Installation Requirements, there are two main cases to be considered when calculating additionality of REES activities. For houses that are already required to install a low emission water heater (new Class 1 houses and existing Class 1 houses connected to gas), the base case for consideration is a 5 star gas water heater. For houses that are NOT required to install a low emission water heater, the base case is a small electric storage water heater (MEPS compliant). Even though federal MEPS are only at 4 stars, this base case consideration is not relevant in the SA context. Solar and heat pump water heaters eligible for REES also earn RECS (STCs) under the federal Small Scale Technology Certificates (STCs) (Renewable Energy (Electricity) Regulations, 2001). Under the current arrangements, the value of REES credits and STCs together generally make up less than 50% of the total capital cost of a new solar water heater. Together they provide a significant incentive to drive installation of these systems. If either REES or STC incentives were withdrawn, there would likely be very little uptake of solar systems under normal market conditions. These schemes need to be considered synergistic and complementary rather than duplicative.
3. Reward best practice in relation to product performance
Performance thresholds (in terms of RECS or star rating) are defined in order to be eligible under REES. While there is some variation in performance of solar systems (in particular), most of the energy savings will be set by the system type selected, rather than the differences in performance within a system type. While some refinements to reward higher performance products could be introduced, there are many complicating factors like household size and system size that need to be taken into account and there is insufficient data to do this at this time.

R E V I E W O F E N E R G Y E F F I C I E N C Y A C T I V I T I E S U N D E R T H E S A R E E S S C H E M E
R Final Report, Prepared for DSD by EES, BA and Common Capital, July 2014 137
Principle Assessment
4. Provides a means for ensuring quality assurance and participant satisfaction
Water heaters are subjected to a range of performance and safety standards to ensure that they provide satisfactory service and are of suitable efficiency.
5. Credible approach for the calculation of energy savings
Data on performance of systems is readily available from the Clean Energy Regulator (for solar systems) and the Australian Gas Association (for has systems).
6. Provides scope for objective, cost effective and practical auditing
Installation of equipment as part of the activity is simple and easy to audit.
7. Good practice Old products are to be recycled and installation should be by professional installers such as plumbers, Installation standards are also specified such as AS/NZS3500.
8. Harmonisation (as far as practical)
This activity is available in ACT and Victoria (not NSW). Both of these jurisdictions use the same modelling approach as SA (AS/NZS4234) but specify a different climate (Zone 4). Other jurisdictions use complex approaches to apportion credits based on systems size and performance. Given the strong base requirements of the SA Water Heater Installation Requirements, which effectively set SA specific base conditions for REES, this activity is not well suited for inter jurisdictional alignment.
9. Safety and minimising overall risk
Activities must be undertaken by qualified professionals. Products are required to comply with relevant safety standards. Installations have to meet a range of Australian Standards.
Energy Savings - Review Overview of methodology The methodology for water heaters is quite complex so this has been included separately as Appendix 4. Effectively the energy consumption for each type of water heater is estimated based on measured characteristics determined under test then using a simulation tool to examine different load profiles and climates as specified in AS/NZS 4234. On review of the available data, it would appear that estimates of the amount of hot water actually used in an average home is generally less than values used to develop energy policy. This is an area where there is relatively poor data. However, a range of credible sources suggest that actual hot water use in South Australia is around 20 MJ/day on average. This is important, as hot water consumption drives the total energy consumption of water heaters, which in turn impacts on the energy that is likely to be saved from the installation of a more efficient water heater. Key Assumptions The underlying assumptions used as the basis for the calculation of energy savings in this study are detailed in Table 66.
Table 66: Energy Savings Estimate – Underlying Key Assumptions (water heaters)
Parameter Value Basis / Comment
Energy Service Levels Hot water demand 27 MJ/day Winter peak as per AS/NZS4234. Average
annual of 22 MJ/day, 48 litres/person per day in winter.
Base Case Assumptions Cold water temperature AS/NZS4234

R E V I E W O F E N E R G Y E F F I C I E N C Y A C T I V I T I E S U N D E R T H E S A R E E S S C H E M E
R Final Report, Prepared for DSD by EES, BA and Common Capital, July 2014 138
Hot water temperature AS/NZS4234
Ambient temperature AS/NZS4234 Typical mean year
Hot water profile AS/NZS4234 Daily and seasonal
Climate AS/NZS4234 Zone 3
Zone 4 used to assess heat pump system qualification
Ownership 1.0 household A few percent of households known to have 2 water heaters
No. persons per household 2.41 As per ABS3236 for South Australia with trends. Given slow change over time, assume static for this review.
REES Activity Assumptions
Ownership * * As per base case
Water heater profile * * As per base case
Lifetime and persistence
Product lifetime 15 years
Assume systems with copper or stainless steel tanks will have a life of 15 years. It is assumed that this will also apply to steel tanks. However, where water quality is poor and anodes are not changed regularly, life may be shorter.
Product persistence Same as life
Adjustment Factors
Additionality discount factor 1.0 Not applicable as base case is specified
Free rider discount 0.95 Some small crossover effects from STCs running in parallel, but generally effect will be small for solar systems
Rebound discount factor 1.0 No evidence of rebound on installation of low energy water heater. Some anecdotal evidence that instantaneous gas systems may result in more hot water use
Compliance discount factor 0.95 There is no available research data on this aspect so the default value of 0.95 is assumed
Total Discount factor 0.9025 Product of individual factors
Climatic Adjustments
Adjustments required? No All of South Australia is practically covered by single zone in AS/NZS4234
Energy Savings Calculation Basis for Estimating Savings Previously, REES defined several cases:
Early retirement and replacement of an existing electric water heater (<5 years old) (it appears that the SA Water Heater Installation Requirements was not applied to this case).
Replacement of a broken water heater where a low emission water heater is NOT required.
Replacement of a broken water heater where a low emission water heater was IS required.
New water heater where a low emission water heater was is NOT required. South Australia’s current Water Heater Installation Requirements commenced in July 2008, with the full Requirements applying from July 2009. Under the Requirements, plumbers are required in many situations to install low-emission water heaters, such as high efficiency gas, solar or electric heat pump systems. These requirements were

R E V I E W O F E N E R G Y E F F I C I E N C Y A C T I V I T I E S U N D E R T H E S A R E E S S C H E M E
R Final Report, Prepared for DSD by EES, BA and Common Capital, July 2014 139
reviewed and revised requirements were released in October 2013 (DMITRE 2013) and came into effect in January 2014. The revised requirements have been considered as the base case for this review. Effectively, the SA Water Heater Installation Requirements (as revised) require all Class 1 dwellings with a mains gas connection to install a low emission water heater (new or replacement). All new Class 1 dwellings are also required to have a low emissions water heater (irrespective of gas connection). The base case for this is a 5 star gas system (lowest capital cost). Given that this is now the regulatory base in South Australia, a 5 star gas system provides a sound base for the calculation of additionality. The SA Water Heater Installation Requirements effectively allow electric storage systems (≤250 litres) to be used in existing Class 1 dwellings where there is no mains gas connection (this more or less forces operation on continuous tariff for larger families, which may drive them to solar options). There are no specific requirements specified for Class 2 dwellings in the Water Heater Installation Requirements. In practical terms, many of these will continue to use small electric storage water heaters (solar and gas options can be difficult to install in many cases). Federal proposals to ban electric storage systems have been shelved (effectively states have to implement any requirements themselves). While there is some discussion of a future round of MEPS for electric storage water heaters, there are no concrete proposals at this stage. So a reasonable baseline into the future is the reference electric water heater for houses without a mains gas connection. For the case of electric, the reference water heater in AS/NZS 4234 for medium and large loads is a 315 litre storage system that complies with MEPS. The small reference storage water heater (80 litre) is normally used to assess smaller loads like the energy delivery being considered to determine REES savings. The total input energy for the smaller system is slightly lower that the large system. Although this was not recorded in 2011, ABS4602 recorded in 2008 that almost 90% of electric water heaters used off peak electricity. This suggests that the larger system would be a reasonable base for estimating savings. However, the SA Water Heater Installation Requirements now restricts that maximum tank size to ≤250 litres in Class 1 dwellings without a mains gas connection. This suggests that the small electric storage reference heater would be a more appropriate reference for calculation of energy savings in these cases. Previously, REES provided some credits for the installation of a 5 star gas water heater system. With the current revision to the SA Water Heater Installation Requirements, any Class 1 dwelling with a mains gas connection is required to install a low emission water heater (which could be a 5 star gas system). Given the relatively high cost of LPG per MJ (generally similar to general domestic), in most cases it does not make economic sense to install a dedicated gas water heater that runs off LPG where there is no mains gas connection (in comparison, LPG boosted solar gas has a moderate operating cost due to the low gas input). However, cost effectiveness will depend on the user's hot water demand and it is a matter for each participant to make a judgement as to whether an LPG fired gas water heater is cost effective for them, or not. The use of LPG in gas water heaters is not excluded under the REES proposals. The only case where a household has a mains gas connection but would not be required to install at least a 5 star gas heater would be in Class 2 dwellings. This case would result in a saving of 10.9MJ/year of electricity with an increase in gas consumption of 14.5GJ/year. This clearly will have some cost and emission benefits,

R E V I E W O F E N E R G Y E F F I C I E N C Y A C T I V I T I E S U N D E R T H E S A R E E S S C H E M E
R Final Report, Prepared for DSD by EES, BA and Common Capital, July 2014 140
but the applicable cases are likely to be very limited. So the option for 5 star case where there is no requirement for a low emission water heater has been eliminated. Table 67 shows estimated annual energy and the savings for a reference electric storage and low energy options for a hot water delivery of 24.4 MJ/day (27MJ/day winter peak) for a dwelling where a low emission water heater IS NOT required. For each option the energy savings are calculated from the reference water heater. The reference case is a small electric resistance water heater, hence any gas consumption appears as a negative saving for that fuel. Table 67: Lifetime savings from replacement of an electric storage water heater – low emission water heater is not required
Type
Electric
MJ/year
Gas
MJ/year
Electric
Savings
MJ/year
Gas
Savings
MJ/year Life
Electric
Savings
GJ
Gas
Savings
GJ
Electric reference (80L) (ref) 10900
5 star gas & 14498 10900 -14498 10 109 -145
6 star gas 120 12849 10780 -12849 10 108 -128
Solar electric 2568 8332 0 15 125 0
Solar gas 501 1728 10399 -1728 15 156 -26
Heat pump 3316 7584 0 15 114 0
Note 1: Low emission water heaters are not required in existing Class 1 dwellings without a mains gas connection or in Class 2 dwellings under the SA Water Heater Installation Requirements. & 5 star gas option is recommended for deletion. Totals do not include program factors. Note 2: “Gas” refers to either natural gas or LPG boosted systems.
Coming back to the case where a low emission water heater is required. Gas water heaters are regulated for MEPS (using the AGA rating system) at 4 stars minimum (except for a few special cases). However, as noted above, the SA Water Heater Installation Requirements specify 5 star minimum under the AGA labelling system for houses that are required to have a low emission water heater. So installation of a 5 star gas heater does not provide any additional savings above the regulatory base case in most cases. ESCOSA survey data suggests that a majority of the gas water heaters installed in South Australia are instantaneous types. There are few models that rate less than 4 stars on the AGA system and the average star rating of products on the market as at December 2013 was 5.7 stars (80 models achieve 6 stars). In contrast, many of the mainstream storage systems rate 5 stars, but there are a range of legacy products with lower star ratings available to cover specific MEPS exemptions. There is a case for including a 6 star option for the case where a low emission water heater is required (noting that this would only be available to instantaneous systems as now 6 star storage systems are on the market). Currently the only option under the current REES where a low emission heater is required is gas solar. However, it should also be possible to install a solar electric or heat pump system in these cases – these types of installations would be permitted under the SA Water Heater Installation Requirements and there is no reason why they should not be permitted under REES. Some houses where a low emission water heater is not required (e.g. new Class 1 dwellings) may not have a mains gas connection, so solar electric or heat pump may be a more attractive option over solar gas. Table 68 shows estimated annual energy for a 5 star gas storage and and the savings low energy options for a hot water delivery of 24.4 MJ/day (27MJ/day winter peak) for a dwelling where a low emission water heater IS required. For each option
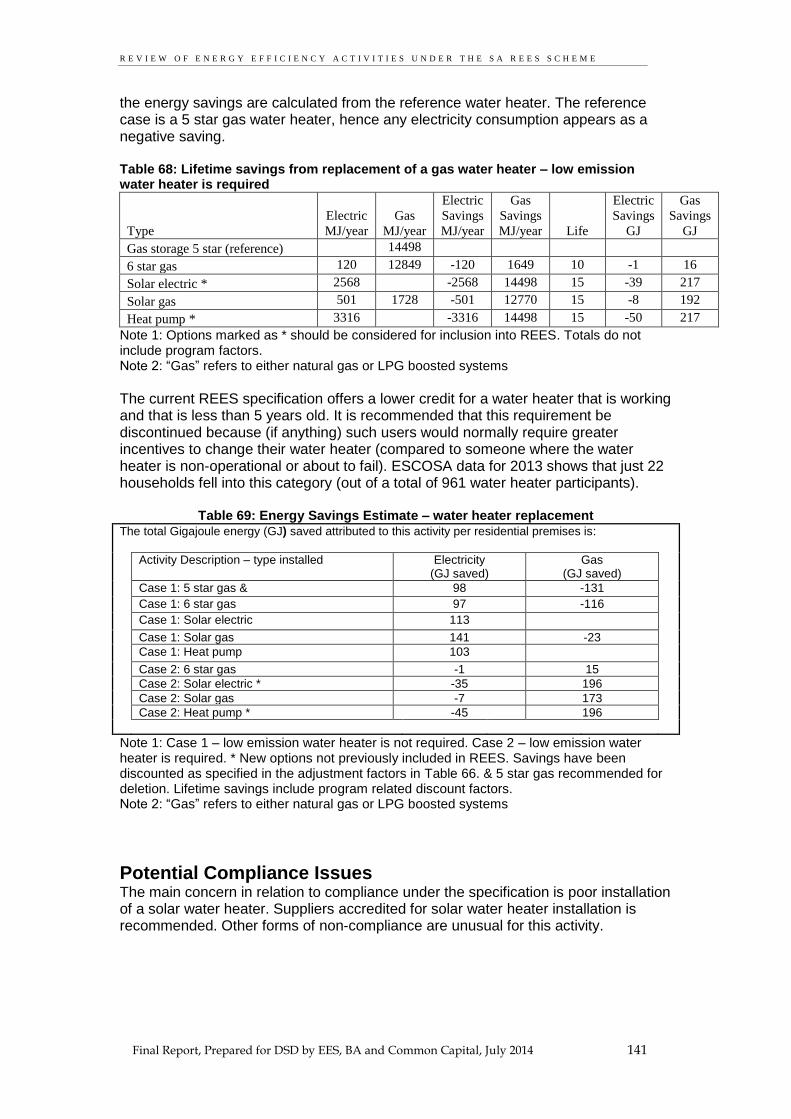
R E V I E W O F E N E R G Y E F F I C I E N C Y A C T I V I T I E S U N D E R T H E S A R E E S S C H E M E
R Final Report, Prepared for DSD by EES, BA and Common Capital, July 2014 141
the energy savings are calculated from the reference water heater. The reference case is a 5 star gas water heater, hence any electricity consumption appears as a negative saving. Table 68: Lifetime savings from replacement of a gas water heater – low emission water heater is required
Type
Electric
MJ/year
Gas
MJ/year
Electric
Savings
MJ/year
Gas
Savings
MJ/year Life
Electric
Savings
GJ
Gas
Savings
GJ
Gas storage 5 star (reference) 14498
6 star gas 120 12849 -120 1649 10 -1 16
Solar electric * 2568 -2568 14498 15 -39 217
Solar gas 501 1728 -501 12770 15 -8 192
Heat pump * 3316 -3316 14498 15 -50 217
Note 1: Options marked as * should be considered for inclusion into REES. Totals do not include program factors. Note 2: “Gas” refers to either natural gas or LPG boosted systems
The current REES specification offers a lower credit for a water heater that is working and that is less than 5 years old. It is recommended that this requirement be discontinued because (if anything) such users would normally require greater incentives to change their water heater (compared to someone where the water heater is non-operational or about to fail). ESCOSA data for 2013 shows that just 22 households fell into this category (out of a total of 961 water heater participants).
Table 69: Energy Savings Estimate – water heater replacement The total Gigajoule energy (GJ) saved attributed to this activity per residential premises is:
Activity Description – type installed Electricity (GJ saved)
Gas (GJ saved)
Case 1: 5 star gas & 98 -131
Case 1: 6 star gas 97 -116
Case 1: Solar electric 113
Case 1: Solar gas 141 -23
Case 1: Heat pump 103
Case 2: 6 star gas -1 15
Case 2: Solar electric * -35 196
Case 2: Solar gas -7 173
Case 2: Heat pump * -45 196
Note 1: Case 1 – low emission water heater is not required. Case 2 – low emission water heater is required. * New options not previously included in REES. Savings have been discounted as specified in the adjustment factors in Table 66. & 5 star gas recommended for deletion. Lifetime savings include program related discount factors. Note 2: “Gas” refers to either natural gas or LPG boosted systems
Potential Compliance Issues The main concern in relation to compliance under the specification is poor installation of a solar water heater. Suppliers accredited for solar water heater installation is recommended. Other forms of non-compliance are unusual for this activity.

R E V I E W O F E N E R G Y E F F I C I E N C Y A C T I V I T I E S U N D E R T H E S A R E E S S C H E M E
R Final Report, Prepared for DSD by EES, BA and Common Capital, July 2014 142
Replace or upgrade water heater Activity No.
WH1
1. Activity Specific Definitions
Low emission water heater is required means a situation where only a low-emission water heater can be installed under SA’s Water Heater Installation Requirements in Class 1 dwellings Low emission water heater is NOT required means a situation where certain water heaters other than
a low-emission water heater can be installed under SA’s Water Heater Installation Requirements in Class 1 dwellings Gas or gas boosted in relation to a water heater means a water heater that has a primary or boost fuel
source of natural gas (methane) or LPG
2. Activity Description (Summary)
Install or replace a water heater
3. Activity Eligibility Requirements
Any residential household in South Australia where the installed product requirements and minimum installation requirements can be met. This can include new or replacement systems. The options available under this specification are subject to whether the residential premises are required to install a low emission water heater or not under the SA Water Heater Installation Requirements.
4. Installed Product Requirements
1. Only gas, solar electric, solar gas or heat pump water heaters are included in the specification. 2. Gas water heaters shall be rated at 6 stars in accordance with AS4552 and listed in the Directory of
AGA Certified Products. 3. Solar electric and gas boosted solar systems shall be listed on the register of the Clean Energy
Regulator and shall comply with AS/NZS 2712 and have STCs assessed under AS/NZS4234 Zone3.
4. Heat pump shall be listed on the register of the Clean Energy Regulator and shall comply with AS/NZS 5125.1 and have STCs assessed under AS/NZS4234 Zone 4.
5. Solar electric and gas boosted solar systems with a tank size ≤ 220 litres shall earn ≥ 17 STCs 6. Solar electric and gas boosted solar systems 220 < tank size ≤ 400 litres shall earn ≥ 27. 7. Solar electric and gas boosted solar systems 400 < tank size ≤ 700 litres shall earn ≥ 38 STCs. 8. Heat pump water heaters shall earn ≥ 27 STCs when assessed under AS/NZS4234 for Zone 3 and
shall earn ≥ 26 STCs when assessed under AS/NZS4234 for Zone 4.
5. Minimum Installation Requirements
1. The water heater must be installed in accordance with relevant installation standards (both electrical and gas) including, but not limited, to AS/NZS 3500:2003 (plumbing and drainage standards); AS/NZS3500.4 (Plumbing and drainage - Heated water services), AS 4552:2005 (gas hot water systems); AS/NZS 60335.2.21:2002 (electric storage water heaters); AS/NZS 60335.2.35:2004 (instantaneous water heaters).
2. All products shall be installed in accordance with the manufacturers’ installation instructions and specifications.
3. Any replaced water heater must be removed from the premises. 4. The person undertaking this activity in a residential customer’s premises must satisfy the REES
Code mandatory safety training requirements. Registered Plumbers, Gas Fitters, Electricians and Building Work Supervisors are exempt from this requirement.
5. The activity must be completed and certified in accordance with any relevant code or codes of practice and other relevant legislation applying to the activity, including any licensing, registration, statutory approval, activity certification, health, safety, environmental or waste disposal requirements. A certificate of compliance must be supplied as part of this activity.

R E V I E W O F E N E R G Y E F F I C I E N C Y A C T I V I T I E S U N D E R T H E S A R E E S S C H E M E
R Final Report, Prepared for DSD by EES, BA and Common Capital, July 2014 143
6. Activity default energy savings Case 1 default energy savings apply where a Class 1 residential premises IS NOT required to install a
low emission water heater under the SA Water Heater Installation Requirements and all Class 2 residential premises. Case 2 default energy savings apply where a Class 1 residential premises IS required to install a low
emission water heater under the SA Water Heater Installation Requirements. The total Gigajoule energy (GJe) saved attributed to this activity per residential premises is:
Activity Description – type installed Electricity (GJ saved)
Gas (GJ saved)
Case 1: 6 star gas (natural or LPG) * 97 -116
Case 1: Solar electric 113
Case 1: Solar gas (natural or LPG) 141 -23
Case 1: Heat pump 103
Case 2: 6 star gas (nwatural or LPG) -1 15
Case 2: Solar electric * -35 196
Case 2: Solar gas (natural or LPG) -7 173
Case 2: Heat pump -45 196
* Indicates new options under REES.
7. Guidance Notes (Informative only – not mandatory)
1. This activity is to encourage households to exceed, where applicable, water heater installation requirements where they would not otherwise be required to do so. These requirements are given effect by the South Australian Water Heater Installation Requirements document issued as part of the Plumbing Standard published by the Technical Regulator pursuant to sections 66 and 67 of the Water Industry Act 2012. This document is available at http://sa.gov.au/otrplumbing. Class 2 dwellings generally have no specific requirements regarding water heater types. See also http://www.sa.gov.au/topics/water-energy-and-environment/energy/saving-energy-at-home/household-appliances-and-other-energy-users/water-heating/water-heater-installation-requirements
2. There may be restrictions on the use of roof mounted systems that use ethelyne glycol (or other anti-freeze agents) where roof water is collected for human consumption.
3. Products listed by the Clean Energy Regulator can be found on http://ret.cleanenergyregulator.gov.au/
4. All reasonable endeavours should be used to recycle removed water heaters 5. Main gas, LPG and other gas systems are permitted under this specification.
R E V I E W O F E N E R G Y E F F I C I E N C Y A C T I V I T I E S U N D E R T H E S A R E E S S C H E M E
R Final Report, Prepared for DSD by EES, BA and Common Capital, July 2014 144
Replace an inefficient showerhead with an efficient showerhead - WH2
Technical Assessment – WH2
Replace an inefficient showerhead with an efficient showerhead
REES Activity Reference: WH2 REES Activity title: Replace an inefficient showerhead with an efficient showerhead Target: Reduced hot water consumption Savings: Activity saves energy indirectly by reducing the household hot water demand and thereby reduce the required energy input to the water heater Pre-conditions: Pre-existing showerhead to be other than an “efficient” showerhead

R E V I E W O F E N E R G Y E F F I C I E N C Y A C T I V I T I E S U N D E R T H E S A R E E S S C H E M E
R Final Report, Prepared for DSD by EES, BA and Common Capital, July 2014 145
Scheme Review – REES CURRENT REES ACTIVITY DESCRIPTION This activity currently forms part of the REES scheme code11 . The current summary description within the REES scheme code is as follows: “Replace an inefficient showerhead with an efficient showerhead” The activity involves the removal from the site and disposal of what is termed an “inefficient shower head” (defined as a shower head with a flow rate greater than 9 litres per minute12) with what is termed an “efficient showerhead” (defined as a showerhead with a minimum 3 star water efficiency rating when assessed and labelled against AS/NZS 6400:2005). Within the current REES specification for an “efficient showerhead” two levels of performance are identified (attracting different deemed abatement values). Those showerheads with a flow rate greater than 6 litres per minute up to a maximum of 9 litres per minute (which shall be referred to for the purposes of this review as “efficient showerheads”) and those with a flow rate of 6 litres per minute or less (which shall be referred to for the purposes of this review as “super efficient showerheads”). Efficient showerheads currently attract a deemed CO2-e value of 1.3 tonnes. Super efficient showerheads currently attract a deemed CO2-e value of 3.3 tonnes. PROPOSED REES ACTIVITY DESCRIPTION The proposed activity is fundamentally the same as the current activity, that is: “Remove and dispose of existing inefficient showerheads from a residential premises and replace with efficient showerheads” It is proposed however to only allow replacement showerheads that have a flow rate of no more than 6 litres/minute (previously 9 litres/minute). KEY SPECIFICATION CHANGES The proposed key specification changes from the current REES activity description are as follows:
The terms “inefficient” and “efficient showerheads” are now defined terms.
An inefficient showerhead is now defined as either. o a showerhead that has a flow rate ≥ 9 litres/minute. This aligns with
the in-use findings made in the Yarra Valley Future Water: Residential Water Use Study Volume 1 and 2. (YVW 2011 and YVW 2012) in relation to inefficient showerheads; or
o a showerhead that has a flow rate ≥ 15 litres per minute (high flow).
There is now a requirement that the product carries a minimum 2 year warranty (this aligns with the draft ESS scheme).
The default savings are now expressed in terms of equivalent GJ saved by fuel type.
11
RESIDENTIAL ENERGY EFFICIENCY SCHEME CODE REESC/07 February 2014 12
The flow rate of the pre-existing showerhead is measured on-site using a bucket and a watch

R E V I E W O F E N E R G Y E F F I C I E N C Y A C T I V I T I E S U N D E R T H E S A R E E S S C H E M E
R Final Report, Prepared for DSD by EES, BA and Common Capital, July 2014 146
The flow rate assessment for the pre-existing showerheads has been revised to require that the hot water tap be open fully and the cold water tap set so as to provide a typical showering temperature. This change better reflects the conditions under which showerheads are rated and avoids the incorrect classification of showerheads as “efficient” (and therefore not requiring upgrade) due to an overly low supply pressure (ie hot tap only partially open).
There are 2 options suggested for implementation. o Option A requires that all inefficient showerheads in a residential
premises be replaced. o Option B requires that any number of inefficient showerheads in a
residential premises be replaced and that default savings are adjusted according to the number of showerheads replaced.
The proposed new draft specification for this activity (including full details of proposed changes) can be found at the end of this section.
Scheme Review – Other jurisdictions The following jurisdictions also include a showerhead replacement activity within their schemes:
Victoria (VEET schedule No 17 – Low flow shower rose)
NSW (ESS activity No E9 - Replace An Existing Showerhead With An “Ultra Low Flow” Showerhead)
ACT (EEIS activity No. 3.3 - Replace an existing shower fixture outlet with a low shower fixture outlet)
Table 70 below provides a comparison of the key elements of each jurisdictions showerhead replacement scheme.
Scheme Review - Potential of the activity (overview) The activity involves the replacement of an “inefficient” showerhead with a more efficient showerhead. The efficiency of the showerhead relates to the flow rate of water through the rose when tested in accordance with AS/NZS 6400 and AS 3662. Historically, an adequate energy service was ensured by designing showers to deliver relatively high flow rates of warm water (typically more than 12 litres per minute, often significantly more13) which ensured adequate washing and warmth. More recently, in an endeavour to reduce both energy and water consumption, showers with reduced flow rates have been produced. Whilst the flow rates have been reduced, the intent has been to maintain an acceptable “showering experience” for the user. To maintain comfort the shower must provide an adequate water distribution (mean spray spread angle), the spray profile must be such that it does not result in excessive cooling of the water between the showerhead and the user (temperature drop test, shall not exceed 3oC) and the spray velocity should not be so high as to cause discomfort to the user.
13
ESCOSA data from field measurements indicates that on average the flow rate of replaced showerheads was just under 13 litres/minute

R E V I E W O F E N E R G Y E F F I C I E N C Y A C T I V I T I E S U N D E R T H E S A R E E S S C H E M E
R Final Report, Prepared for DSD by EES, BA and Common Capital, July 2014 147
Table 70: State Scheme Summary – Comparative table (Showerheads) Note: Red text under the proposed REES parameter indicates a change
Parameter SA – REES Scheme (Current)
VIC – VEET Scheme *
NSW – ESS Scheme (Published May 2014)
ACT – EEIS Scheme
SA – REES Scheme (Proposed)
Working Title Install efficient showerhead
Low flow shower rose Replace An Existing Showerhead With An Ultra Low Flow Showerhead
Replace an existing shower fixture outlet with a low shower fixture outlet
Showerhead Replacement
Activity Reference Number
N/A 17 E9 3.3 WH2
Required pre-condition 1 (existing showerhead)
Pre-existing “inefficient showerhead” (> 9 L/min)
Pre-existing non “Low flow shower rose” (> 9 L/min)
No pre-condition Pre-existing non “Shower fixture outlet” (> 9 L/min)
Pre-existing “inefficient showerhead” (> 8.5 L/min)
Required pre-condition 2 (existing Hot water heater)
No pre-condition No pre-condition electric resistance WH electrically boosted solar WH or electric heat pump WH
No pre-condition No pre-condition
Limitation on number of replacements per household
No limitation stated 2 maximum No limitation stated ( 1 replacement per shower)
2 maximum No limitation
Replacement unit performance options
3 star rated minimum (AS/NZS 6400 : 2005) Option 1 >6L/min – 9 L/min Option 2 ≤ 6 L/min
3 star rated minimum (AS/NZS 6400 : 2005) ie ≤ 9 L/min
3 star rated minimum (AS/NZS 6400 : 2005) and ≤ 6 L/min
3 star rated minimum (AS/NZS 6400 : 2005) ie ≤ 9 L/min
3 star rated minimum (AS/NZS 6400 : 2005) and ≤ 6 L/min
Deemed savings per replacement
Option 1 = 1.3 t CO2-e Option 2 = 3.3 t CO2-e Savings are per showerhead
2.14 t CO2-e Savings are per showerhead
Elec. Resistance WH = 1.9 MWh Solar WH = 1.1 MWh Heat Pump WH = 1.1 MWh Savings are per showerhead
1.96 t CO2-e Savings are per showerhead
Based on GJ saved by fuel type (see detailed specifications below)
Regional multipliers of the deemed values
None Metropolitan = 0.85 (1.82) Non metropolitan = 1.4 (3.0)
None None None
Replacement product warranty requirements
Nil Nil 2 years Nil 2 years
Referenced Standards AS/NZS 6400 : 2005 AS3552
AS/NZS 6400 : 2005 AS3552
AS/NZS 6400 : 2005 AS3552
AS/NZS 6400 : 2005 AS3552
AS/NZS 6400 : 2005 AS3552
* All VEET specifications have different emission factors for metropolitan versus regional installations – not listed in most schedules.

R 148
Provided that adequate service levels are maintained, a reduced flow rate will result in reduced water consumption per shower and in particular a reduced hot water consumption. By reducing hot water consumption, savings in energy needed to heat the water are achieved and this then also translates into greenhouse gas emission abatement. The activity is also relatively inexpensive to undertake.
Assessment Against Scheme Principles This activity aligns with all major policy objectives and consequently is recommended for continued inclusion in the REES scheme.
Table 71: Alignment with Policy Objectives for Ceiling insulation
Policy Objective Reduces household and/or business energy use Provides a focus on low income households
Associated Objectives: Provides greenhouse gas emission benefits
Provides energy cost benefits
The following table provides an assessment of the activity against the new principles proposed for REES code. Table 72: Activity Alignment with REES General Principles – Ceiling insulation
Principle Assessment
1. Provides evidence based energy savings
The basis for energy savings associated with this activity is well evidenced. The reduction in water flow rates is supported by both Australian standards and a national rating scheme and is relatively easy to measure. Evidence from other jurisdictions (particularly the Yarra Valley Water studies carried out in Victoria – YVW2011-2012) in the form of surveys and monitoring also supports the case for water and energy savings in relation to this activity. The performance characteristics of replacement products are all listed on the WELS on-line database and are therefore easily accessed for the purposes of verification. Finally, this activity does not rely on particular human behaviours or accurate use by the household to realise the expected benefits.
2. Energy savings are additional to base case (BAU) and minimises free riders
At present no regulations mandate the retrofit of super high efficiency showerheads to pre-existing showers. SA Water heater installation requirements do however require that a 9 litre/minute or better showerhead be installed to all outlets serviced by a newly installed water heater. Analysis of WELS registration data (not sales weighted) indicates that the average newly purchased showerhead exhibits a flow rate of 8.7 litres per minute. This means that in relation to the first tier of showerheads (6 – 9 litres/minute) offered under the current activity description there is now somewhat limited additionality to be realised. Significant additionality is achieved in relation to the second tier of showerheads (<6 litres/minute) offered under the proposed revised activity specification and consequently it is recommended that only the second tier (<6 litres/minute) showerheads continue to be offered under the scheme.
3. Reward best practice in relation to product performance
The proposed activity (<6 litres/minute) effectively meets best practice levels currently available. Significantly lower flows are technically possible but are unlikely to offer an acceptable level of service in the view of most householders.
4. Provides a means for ensuring quality assurance and participant satisfaction
Pre-existing Australian standards set performance requirements to ensure that the activity maintains its performance throughout its expected lifetime and meets consumer expectations.

R 149
Principle Assessment
5. Credible approach for the calculation of energy savings
Default savings factors provide a robust approach to the calculation of average energy savings across a wide range of household types. Whilst it is true that actual savings will vary according to a number of factors such as number of householders, user behaviour and water heater type, the relatively low cost of the activity does not warrant detailed accounting for these factors (which are in any case subject to variation over time).
6. Provides scope for objective, cost effective and practical auditing
Auditing simply requires the inspection of replacement showerheads. The flow rate of the replacement showerhead can be determined via reference to the publicly available WELS registration database, or alternatively where the brand and model of the showerhead is not evident, a test method is provided in the specification to facilitate on-site measurement of the flow rate of the replacement showerhead. No auditing options in relation to the performance of the replaced showerhead are set out in the current specification. The only way to manage this would be to require the activity provider to tag and retain the replaced unit for a period of say 12 months before disposal with a requirement that they make the replaced unit available on request. This is however a relatively onerous requirement and consequently has not been included within the draft specification.
7. Good practice Activities are required under the current and proposed specifications to be undertaken by competent installers. Installed materials are required to comply with relevant Australian standards. Australian standards also dictate safe installation methods as do, to a lesser degree, manufacturer’s instructions. The proposed installation requirements include a provision that “All reasonable endeavours should be used to recycle removed showerheads”
8. Harmonisation (as far as practical)
This activity is available in all other jurisdictions. Each jurisdiction includes similar elements within their specifications for this activity although some of the details in relation to performance options and deemed savings do vary. This activity provides good scope for inter jurisdictional alignment (Also see previous section - Scheme Review – Other jurisdictions)
9. Safety and minimising overall risk
Activities are typically undertaken by qualified installers. Products are required to comply with relevant standards and safe installation methods are generally set out in manufacturer’s instructions, noting that this product type presents a low risk in terms of safety considerations
Energy Savings - Review Overview of methodology The estimate of energy savings that are expected to be realised from this activity are based on the assumed hot water savings associated with an average household. Those savings are derived from reductions in required energy input into the household’s water heater which is assumed to use either electricity or gas as its fuel (or its “boosting” fuel in the case of solar water heaters). The energy savings in homes with solar systems will be lower than for water heaters that use only gas or electricity. Energy savings are based on the difference in the hot water flow rate between a stock average showerhead (measured on site to ensure a minimum qualifying flow rate) and the replacement showerhead (of known performance and maximum flow rate). The difference in flow rate is multiplied by the average duration for a shower, the average number of showers taken per day by a householder and the average number of householders per household to determine the daily savings in hot water (litres). Annual household savings in hot water usage (litres) is simply 365 time the daily savings. Note that the shower duration estimates include the time it takes for hot water to reach the shower rose, so this already includes hot water distribution losses in the house.
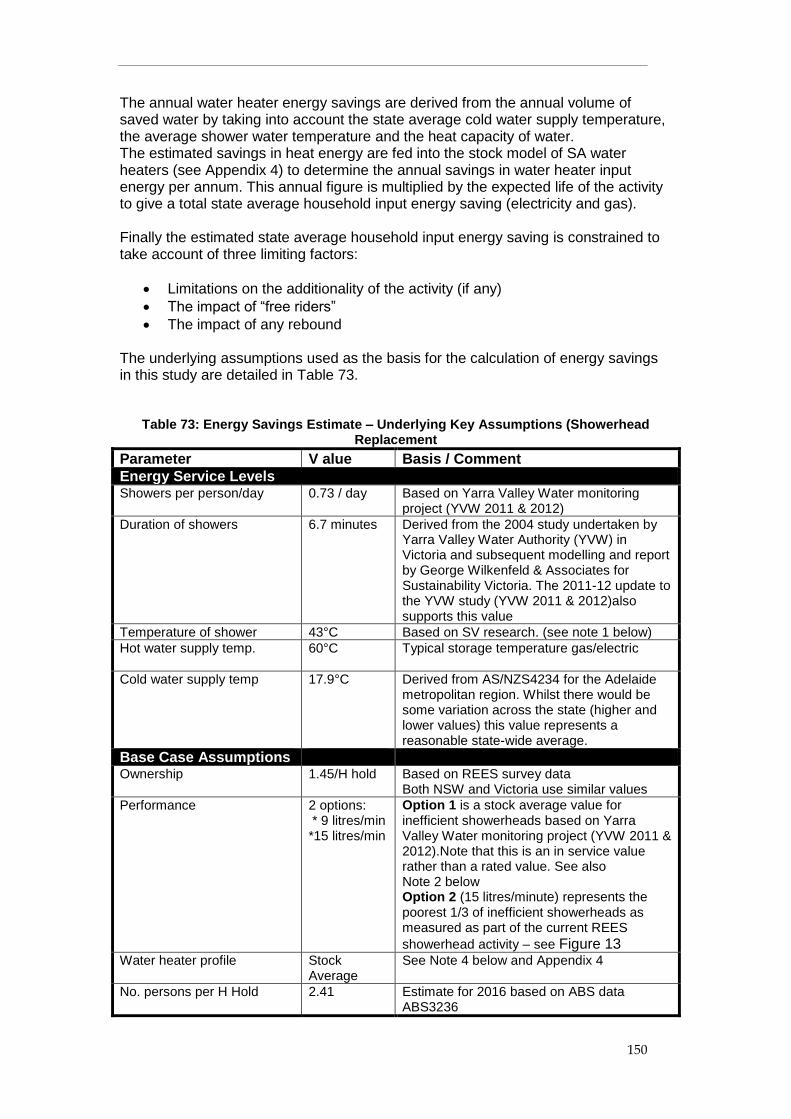
R 150
The annual water heater energy savings are derived from the annual volume of saved water by taking into account the state average cold water supply temperature, the average shower water temperature and the heat capacity of water. The estimated savings in heat energy are fed into the stock model of SA water heaters (see Appendix 4) to determine the annual savings in water heater input energy per annum. This annual figure is multiplied by the expected life of the activity to give a total state average household input energy saving (electricity and gas). Finally the estimated state average household input energy saving is constrained to take account of three limiting factors:
Limitations on the additionality of the activity (if any)
The impact of “free riders”
The impact of any rebound The underlying assumptions used as the basis for the calculation of energy savings in this study are detailed in Table 73.
Table 73: Energy Savings Estimate – Underlying Key Assumptions (Showerhead Replacement
Parameter V alue Basis / Comment
Energy Service Levels Showers per person/day 0.73 / day Based on Yarra Valley Water monitoring
project (YVW 2011 & 2012)
Duration of showers 6.7 minutes Derived from the 2004 study undertaken by Yarra Valley Water Authority (YVW) in Victoria and subsequent modelling and report by George Wilkenfeld & Associates for Sustainability Victoria. The 2011-12 update to the YVW study (YVW 2011 & 2012)also supports this value
Temperature of shower 43°C Based on SV research. (see note 1 below)
Hot water supply temp. 60°C Typical storage temperature gas/electric
Cold water supply temp 17.9°C Derived from AS/NZS4234 for the Adelaide metropolitan region. Whilst there would be some variation across the state (higher and lower values) this value represents a reasonable state-wide average.
Base Case Assumptions Ownership 1.45/H hold Based on REES survey data
Both NSW and Victoria use similar values
Performance 2 options: * 9 litres/min *15 litres/min
Option 1 is a stock average value for inefficient showerheads based on Yarra Valley Water monitoring project (YVW 2011 & 2012).Note that this is an in service value rather than a rated value. See also Note 2 below Option 2 (15 litres/minute) represents the poorest 1/3 of inefficient showerheads as measured as part of the current REES
showerhead activity – see Figure 13
Water heater profile Stock Average
See Note 4 below and Appendix 4
No. persons per H Hold 2.41 Estimate for 2016 based on ABS data ABS3236

R 151
Parameter V alue Basis / Comment Daily usage (min. / H hold) 11.79 min /
day Calculated value ie No persons/H Hold x showers/person/day x duration of showers
REES Activity Assumptions
Ownership As per base case
Performance (In service flow rate)
5.4 litres/min. Based on a rated performance value requirement of ≤ 6 litres / minute discounted to 90% (see note 3 below)
Water heater profile Stock Average
See Appendix 4
Lifetime and persistence
Product lifetime 10 years As used in Vic and SA
Product persistence 7 years As used in NSW
Adjustment Factors
Additionality discount factor 0.9 2013 model weighted data from the WELS site suggests < 10% of models are < 7 litres / minute see Figure 12). A discount for additionality of 0.9 could be considered conservative
Free rider discount 0.95 There is little evidence that showerheads are changed routinely by householders unilaterally and existing systems could be expected to have a long life. Assuming that for the average installed showerhead on average 50% of its life remains and that 10% of those changes would have been to high efficiency showerheads (< 6 litres/minute) in any case, this then suggests a free rider discount of 5% (ie 50% * 10%) or a factor of 0.95
Rebound discount factor 0.97 A rebound of approximately 3% is based on the Yarra Valley Water monitoring project (YVW 2012) that found that households with efficient showerheads took an average of 6.9 minute long showers compared to those with standard showerheads at 6.7 minutes
Compliance discount factor 0.95 There is no available research data on this aspect so the default value of 0.95 is assumed
Total Discount factor 0.7875 Product of individual factors
Climatic Adjustments
Adjustments required? No See appendix 4
Note 1: Data from a state government website (http://www.dier.tas.gov.au/energy/using_energy_efficiently_and_minimising_costs/appropriate_choice_of_energy_source/cost_of_a_shower?SQ_DESIGN_NAME=printer_friendly) suggests that the water temperature delivered to the shower head is 42°C. This is higher than the often quoted value of 40°C but represents the temperature of the water leaving the shower head which consequently cools significantly as the water travels through the air. Several US websites suggest that water temperatures for showers are 107.5°F, which is 41.9°C. In addition, as the heat loss from the water heater to the shower rose also needs to be taken into account the temperature of the supply water is estimated to be a further 1°C higher. The total of 43°C is the most recent value adopted under the VEET scheme Note 2: Previously, savings calculations have assumed that the WELS rated flow rate for the product represents the actual flow rate used for that product in service. A recent study by Yarra Valley Water casts some doubt on this assumption. This recent

R 152
study “Yarra Valley Future Water: Residential Water Use Study Volume 1 and 2” (YVW 2011 and YVW 2012) showed that “59% of shower events in the “standard shower households” (i.e. households with non low-flow shower heads, anything rated above 9 L/min) had an average flow rate under 9 L/min (average = 8.5 L/min) This suggests that by adjusting the taps, householders are using flow rates less than the rated values for their shower roses and this casts some doubt on the validity of the current assumptions. Note 3: As detailed in note 2 above the in service flow rate of a 6 litre/ minute showerhead would be expected to be less than the rated value. A review was undertaken of the 2013 registration data for shower roses (sourced from the WELS website) and the distribution of flow rates for 3 star rated shower roses was found to be as per Figure 12. From this data, the average flow rate for a 3 star rated shower rose was found to be 8.6 litres per minute (model weighted, noting that this is not a sales weighted value, which was not readily available). In the YVW study the average in service flow rate of “efficient” showers (ie 3 star rated products) was just 6.4 L/min which is 75% of the non-sales weighted average of WELS 3 star models available in 2013 (ie 75% of 8.6 litres per minute). Using the same discount factor (75%) it might be expected that the in service flow rate of a 6 litre/minute rated shower head would be 4.5 litres (ie 75% of 6 litres per minute), however it is reasonable to expect that the more efficient the shower head the lesser the discount that is likely to apply consequently a more conservative figure of 5.4 litres per minute has been adopted (ie 90% of the rated value)
Figure 12: Distribution of WELS registered showerhead flow rates–2013 (WELS)
Note 4: The estimates of actual energy saved were based on the analysis undertaken in Appendix 4 of this report. From that analysis the marginal MJ input requirements
per MJ of heat output as reported in Table 74 along with the estimated stock share
for each type of Water heater was used in the calculation.
Table 74: SA Water Heater Stock profile and Marginal Efficiency
Type Fuel Marginal MJ input/MJ heat
Estimated stock share in 2016
Electric storage Electricity 0.999 0.410
Solar electric Electricity 0.506 0.048
Solar gas Gas 0.388 0.020
Heat pump Electricity 0.284 0.012
Gas storage 5* Gas 1.159 0.128
Gas instant 5* Gas 1.251 0.383
0
1
2
3
4
5
6
7
8
9
10
1
201
401
601
801
1001
1201
1401
1601
1801
2001
2201
2401
2601
2801
3001
3201
3401
3601
3801
4001
flo
w r
ate
(li
tres p
er
min
ute
)

R 153
Figure 13: Distribution of measured inefficient showerhead flow rates (REES 2014)
Energy Savings Calculation Using the methodology and assumptions as detailed in the preceding sections, an estimate of energy savings associated with the replacement of an inefficient showerhead with an efficient showerhead in a typical SA household was undertaken. A key consideration in relation to the design of the activity and the expected savings relates to the fact that a proportion of households have more than 1 showerhead. However, there is no known correlation between the number of showerheads in a household and the number of householders in that household. This means in theory that in a household with say 2 showerheads it would be necessary to ensure that both showerheads met the activity specification in order that the expected total household savings could be realised. In many cases one of the showerheads is likely to get more use than the other and this could in theory receive the lion’s share of the deemed value but in reality this would be difficult to determine and even harder to verify. Considering the uncertainties in relation to how credits should be attributed two alternative approaches are suggested for consideration: Option 1 - award a credit per showerhead replaced. The credit equalling the estimated total household credit (ie all showers converted from inefficient to efficient) divided by the state-wide average number of showerheads installed per household (1.4514) This would mean however that one shower households would tend to get less than the average deemed savings (about 70%), two shower households would
14
REES survey data
0%
5%
10%
15%
20%
25%
30%
35%
40%
10 11 12 13 14 15 16 17 18 19 20 >20
Litres/minute
Flow Rates of Pre-existing showerheads

R 154
get more than the average deemed savings (about 140%) and 3 shower households more than double the deemed savings of an average household. Overall across the entire scheme the credits should still match the savings but one shower households (which probably include more low income households) would be less attractive to activity providers. To deal with the one shower household issue it is proposed to provide a credits as follows: A default saving of 100% of average household savings if there is only one showerhead in the residential premises, or in households with more than one showerhead default savings of 70% of average household savings per showerhead replaced (up to a maximum of 3 showerheads per residential premises) Option 2 - Award a credit per household upgraded. That is, irrespective of the number of showers in the household the same credit would apply (provided all inefficient showerheads in the household are replaced with a minimum of one showerhead required to be replaced to qualify). This approach removes the incentive for unnecessary replacement of pre-existing efficient showerheads by unscrupulous operators and would also tend to favour single shower households (which probably include more low income households). The potential downside is that an unscrupulous operator could elect to upgrade only one of 2 pre-existing inefficient showerheads and claim the full credit. In this case however (unlike cases 1 and 2 above) the risk of enforcement action is much greater because the evidence of rorting will remain in the dwelling in the form of the remaining inefficient showerhead. The detailed analysis can be found in the MS Excel spreadsheet delivered with this report (File Name REES 2014 Energy Savings – Showerheads V01.XLS). A summary of the estimated energy savings by fuel type over the assumed lifetime for a product installation in 2016 can be found in Table 75(option 1) and Table 76 (option 2).
Table 75: Energy Savings Estimate – (Showerhead Replacement – Option 1) Activity default energy savings The total Gigajoule equivalent energy (GJe) saved attributed to this activity per showerhead replaced
(maximum of 3 per residential premises) is:
Application Electricity (GJ saved)
Gas (GJ saved)
Firewood (GJ saved)
Residential premises with one shower only with a flow rate >9 litres and < 15 litres per minute
3.4 4.9 0
Residential premises with one shower only with a flow rate ≥ 15 litres per minute
6.2 8.9 0
Residential premises with more than one shower. Savings per replaced showerhead with a flow rate >9 litres and < 15 litres per minute
2.4 3.4 0
Residential premises with more than one shower. Savings per replaced showerhead with
a flow rate ≥ 15 litres per minute
4.3 6.2 0

R 155
Table 76: Energy Savings Estimate – (Showerhead Replacement – Option 2)
Activity default energy savings The total Gigajoule equivalent energy (GJe) saved attributed to this activity per residential premises is:
Application Electricity (GJ saved)
Gas (GJ saved)
Firewood (GJ saved)
Residential premises with an average flow rate of all pre-existing inefficient showerheads of >9
litres and < 15 litres per minute
3.4 4.9 0
Residential premises with an average flow rate of all pre-existing inefficient showerheads of ≥
15 litres per minute
6.2 8.9 0
Potential Compliance Issues The main concerns in relation to compliance are: Under option 1 a false claim that a pre-existing showerhead that is replaced is an inefficient showerhead when in fact it is an efficient showerhead. Under option 2 a false claim by an activity provider that a pre-existing showerhead that is not replaced as part of the activity is in fact an inefficient showerhead and should have been replaced. This form of non-compliance is however easily checked on site post activity as the evidence of non-compliance remains on site
Proposed Specification The proposed revised specification for this activity can be found below on the following pages. Note that 2 specifications are provided as per option 1 and option 2 above.

R 156
OPTION 1
Showerhead Replacement Activity No.
WH2
1. Activity Specific Definitions
Inefficient showerhead means a showerhead, in its current use, that has a flow rate greater than 9 litres per minute. (see also section 3 below for details of on-site measurement methods) Efficient showerhead means a showerhead that achieves a maximum flow rate of 6 litres per minute and a minimum water efficiency rating of 3 stars when assessed and labelled in accordance with AS/NZS 6400
2. Activity Description (Summary)
Remove and dispose of existing inefficient showerhead/s from a residential premises and replace with efficient showerhead/s
3. Activity Eligibility Requirements
1. A residential premises subject to this activity must contain at least one operational pre-existing inefficient showerhead.
2. The flow rate of each pre-existing showerhead shall be measured with a simple bucket test with the hot water tap open fully and the cold water tap set so as to provide a typical showering temperature (approx.. 40C). Hold a bucket under the running shower for 15 seconds. Measure the quantity of water captured and multiply by 4 to ascertain the per minute flow rate.
3. A minimum of one existing inefficient showerheads within a residential premises must be replaced; and credits can only be claimed for a maximum of 3 showerheads replaced per residential premises
4. The installation of an efficient showerhead must not be otherwise required by law, for example as condition of a development approval under the Development Act 1993 or in compliance with requirements under the Water Industry Act 2012
4. Installed Product Requirements
The installed product must be an efficient showerhead, including flow restrictor and any other components integral to and supplied with the fixture that— 1. complies with the requirements of the effective version of AS/NZS 3662; and 2. complies with any product safety or other product performance requirements in a relevant code of
practice or other relevant legislation applying to the activity. 3. comes with a minimum 2 year product warranty
5. Minimum Installation Requirements
1. An efficient showerhead which is installed must be tested to ensure it is correctly installed, does not leak, and is operating correctly at a typical showering temperature.
2. An efficient showerhead must not be installed where it would be incompatible with the operation of the hot water service currently installed. Where a replaced showerhead causes the hot water system to no longer operate (i.e. fails to heat water to a standard temperature), the installer must either reinstall the original showerhead at the request of the householder, or install a new showerhead of equivalent flow rate and quality of the original showerhead (where available), where such a request is made within 20 business days of the installation of the efficient showerhead.
3. An inefficient showerhead which is replaced must be removed from the premises. 4. The person undertaking this activity in a residential customer’s premises must satisfy the REES
Code mandatory safety training requirements. Registered Plumbers, Gas Fitters, Electricians and Building Work Supervisors are exempt from this requirement.
5. The activity must be completed and certified in accordance with any relevant code or codes of practice and other relevant legislation applying to the activity, including any licensing, registration, statutory approval, activity certification, health, safety, environmental or waste disposal requirements;
6. All reasonable endeavours should be used to recycle removed showerheads.
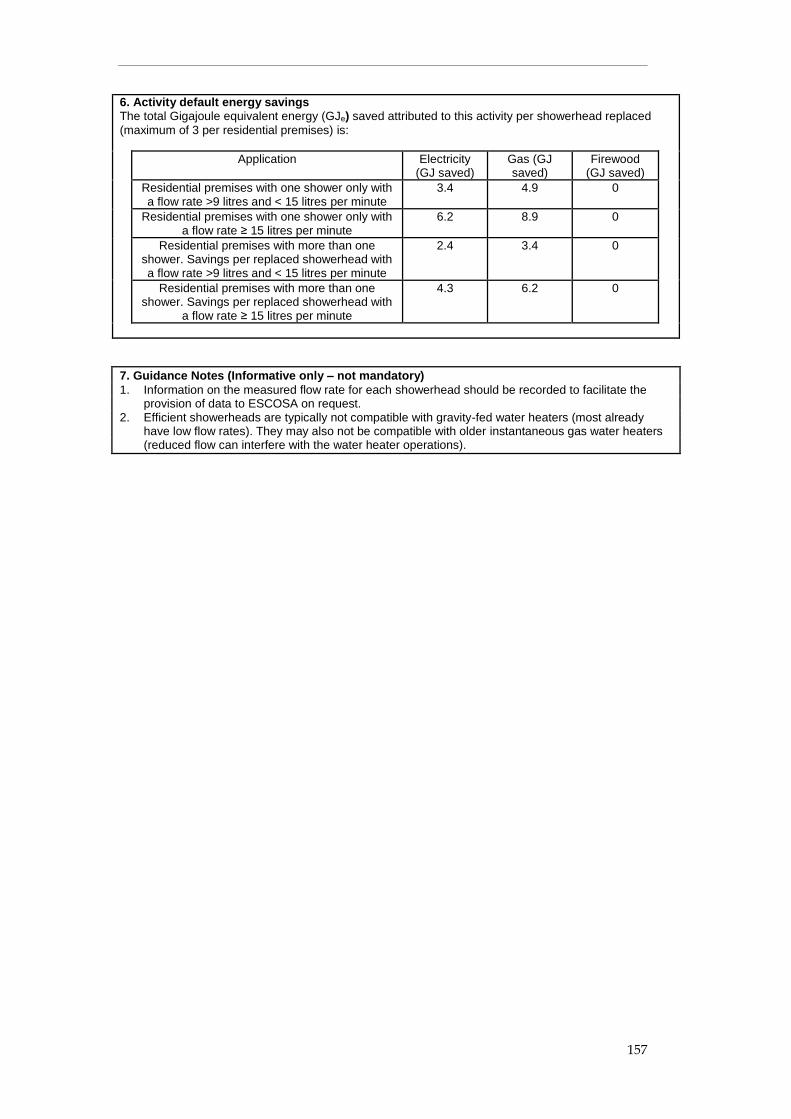
R 157
6. Activity default energy savings The total Gigajoule equivalent energy (GJe) saved attributed to this activity per showerhead replaced
(maximum of 3 per residential premises) is:
Application Electricity (GJ saved)
Gas (GJ saved)
Firewood (GJ saved)
Residential premises with one shower only with a flow rate >9 litres and < 15 litres per minute
3.4 4.9 0
Residential premises with one shower only with a flow rate ≥ 15 litres per minute
6.2 8.9 0
Residential premises with more than one shower. Savings per replaced showerhead with a flow rate >9 litres and < 15 litres per minute
2.4 3.4 0
Residential premises with more than one shower. Savings per replaced showerhead with
a flow rate ≥ 15 litres per minute
4.3 6.2 0
7. Guidance Notes (Informative only – not mandatory)
1. Information on the measured flow rate for each showerhead should be recorded to facilitate the provision of data to ESCOSA on request.
2. Efficient showerheads are typically not compatible with gravity-fed water heaters (most already have low flow rates). They may also not be compatible with older instantaneous gas water heaters (reduced flow can interfere with the water heater operations).
R 158
OPTION 2
Showerhead Replacement Activity No.
WH2
1. Activity Specific Definitions
Inefficient showerhead means a showerhead, in its current use, that has a flow rate greater than 9 litres per minute. (see also section 3 below for details of on-site measurement methods) Efficient showerhead means a showerhead that achieves a maximum flow rate of 6 litres per minute and a minimum water efficiency rating of 3 stars when assessed and labelled in accordance with AS/NZS 6400
2. Activity Description (Summary)
Remove and dispose of all existing inefficient showerheads from a residential premises and replace with efficient showerheads
3. Activity Eligibility Requirements
1. A residential premises subject to this activity must contain at least one operational pre-existing inefficient showerhead
2. The flow rate of each pre-existing showerhead shall be measured with a simple bucket test with the hot water tap open fully and the cold water tap set so as to provide a typical showering temperature (approx.. 40C). Hold a bucket under the running shower for 15 seconds. Measure the quantity of water captured and multiply by 4 to ascertain the per minute flow rate.
3. All existing inefficient showerheads within a residential premises (minimum of 1)must be replaced; and
4. The installation of an efficient showerhead must not be otherwise required by law, for example as condition of a development approval under the Development Act 1993 or in compliance with requirements under the Water Industry Act 2012
4. Installed Product Requirements
The installed product must be an efficient showerhead, including flow restrictor and any other components integral to and supplied with the fixture that— 1. complies with the requirements of the effective version of AS/NZS 3662; and 2. complies with any product safety or other product performance requirements in a relevant code of
practice or other relevant legislation applying to the activity. 3. comes with a minimum 2 year product warranty
5. Minimum Installation Requirements
1. An efficient showerhead which is installed must be tested to ensure it is correctly installed, does not leak, and is operating correctly at a typical showering temperature.
2. An efficient showerhead must not be installed where it would be incompatible with the operation of the hot water service currently installed. Where a replaced showerhead causes the hot water system to no longer operate (i.e. fails to heat water to a standard temperature), the installer must either reinstall the original showerhead at the request of the householder, or install a new showerhead of equivalent flow rate and quality of the original showerhead (where available), where such a request is made within 20 business days of the installation of the efficient showerhead.
3. An inefficient showerhead which is replaced must be removed from the premises. 4. The person undertaking this activity in a residential customer’s premises must satisfy the REES
Code mandatory safety training requirements. Registered Plumbers, Gas Fitters, Electricians and Building Work Supervisors are exempt from this requirement.
5. The activity must be completed and certified in accordance with any relevant code or codes of practice and other relevant legislation applying to the activity, including any licensing, registration, statutory approval, activity certification, health, safety, environmental or waste disposal requirements;
6. All reasonable endeavours should be used to recycle removed showerheads.

R 159
6. Activity default energy savings The total Gigajoule equivalent energy (GJe) saved attributed to this activity per residential premises is:
Application Electricity (GJ saved)
Gas (GJ saved)
Firewood (GJ saved)
Residential premises with an average flow rate of all pre-existing inefficient showerheads of >9
litres and < 15 litres per minute
3.4 4.9 0
Residential premises with an average flow rate of all pre-existing inefficient showerheads of ≥
15 litres per minute
6.2 8.9 0
7. Guidance Notes (Informative only – not mandatory)
1. Information on the measured flow rate for each showerhead should be recorded to facilitate the provision of data to ESCOSA on request.
2. Efficient showerheads are typically not compatible with gravity-fed water heaters (most already have low flow rates). They may also not be compatible with older instantaneous gas water heaters (reduced flow can interfere with the water heater operations).

R 160
Install CFL or LED general purpose lamp - L1
Technical Assessment - L1
Install CFL or LED general purpose lamp
REES Activity Reference: L1 REES Activity title: Install CFL or LED General Purpose lamp Target product: General purpose lamps Savings: Activity saves energy directly through improved lamp efficacy Pre-conditions: Pre-existing product must be incandescent or halogen lamp

R 161
Current REES Activity Description The current activity is for CFLs (LEDs not currently included) and forms part of the REES scheme code15. The current summary description within the REES scheme code is as follows: “Install CFLs” Description of activity: Remove a reflector or non-reflector halogen or incandescent lamp and replace it with a compact fluorescent lamp (CFL). Specification: Each activity must comply with the following, as minimum: 1. The CFL model installed shall comply with AS/NZS4847.2:2010 and shall have a
current, approved registration in the MEPS registration system (www.energyrating.gov.au).
2. The CFL model installed shall have a measured median lamp life of 10,000 hours or more, verified by test reports.
3. The CFL shall be installed at the time of removal of the incandescent/halogen lamp.
4. A person or entity undertaking this activity shall use best endeavours to ensure any replacements are targeted at high usage lamp fittings in the first instance.
5. The rated power of each incandescent/halogen lamp replaced shall be classed according to Table CFL1 (non-directional lamps) or Table CFL2 (directional lamps), using column B for incandescent and column C for halogen lamps (fit to next lowest rated power if required). The CFL replacement model shall have a measured average initial luminous flux (verified by test report) of at least the corresponding value in column D, for the same class of replaced lamp.
6. The rated colour temperature of any CFL installed shall not exceed 3000 Kelvin, unless otherwise authorised by the occupant of the premises.
7. A CFL shall not be installed or connected to a dimmer switch, timer, motion sensor, daylight switch or other automated switch or control, unless specified by the manufacturer as being compatible with such a device.
8. All incandescent/halogen lamps that are replaced must be in working order immediately prior to removal.
9. All incandescent/halogen lamps that are replaced shall be removed from the premises. They shall not be re-used.
10. The number of individual replacements in any one premises shall not exceed 20. Premises at which up to 8 CFLs were installed in Stage 1 of the Scheme (1 January 2009 – 31 December 2011) will be permitted to have up to an additional 20 replacement CFLs installed from 1 January 2012 provided that all other aspects of activity specification and Code requirements are met.
11. The person undertaking this activity in a residential customer’s premises must satisfy the REES Code mandatory safety training requirements. Registered Plumbers, Gas Fitters, Electricians and Building Work Supervisors are exempt from this requirement.
The deemed values for energy saving are divided into two categories: non-directional and directional lamps. Within each of these there is a table of energy savings values, which vary depending on the size of the existing/replacement lamp.
15
RESIDENTIAL ENERGY EFFICIENCY SCHEME CODE REESC/07 February 2014

R 162
The guidance notes then state that all reasonable endeavours should be used to recycle removed lamps and that when reading the tables the deemed value to be applied is based on the lamp being removed (Column B of each table).
Proposed REES Activity Description The proposed summary description for the REES scheme code is as follows. “Install CFL or LED general purpose lamp” This activity involves replacing a mains voltage incandescent or halogen lamp (non-directional or directional) with a compact fluorescent integral lamp (CFL) or light emitting diode integral lamp (LED). There are a number of categories of replacement lamp:
Non-directional: o CFL integral lamp o Standard (std) LED integral lamp o HE (high efficiency) LED integral lamp
Directional: o CFL integral lamp o Standard (std) LED integral lamp o HE (high efficiency) LED integral lamp
Within each of these six categories, the energy savings are based upon the size (power / light output) of the lamp being replaced/installed. Default savings factors are set out in tables.
Key Specification Changes The key changes from the current specification are:
No changes are recommended for the current CFL specification except for warranty.
All installed products must provide a minimum 2 years replacement warranty.
The following categories and specifications have been added for LED integral lamps:
o Standard (std) LED integral lamp: Meets current US Energy Star specification.
o HE (high efficiency) LED integral lamp: Meets current US Energy Star specification, and Efficacy ≥ 80 lm/W.
There is currently no publicly available data regarding how many products available on the Australian market might meet the US Energy Star specification. There are likely to be a small number, and this will increase as the NSW ESS16 and REES require this specification. Alternatively, products can be submitted (with test reports) to show that they meet the Energy Star specification (see below) if they don’t wish to seek US certification. One further approach is for products to be sought from the US which are already certified. Note that small changes may be required to the power
16
Refer list of ESS Accepted Lighting Products: http://www.ess.nsw.gov.au/Projects_and_equipment/Lighting_Technologies

R 163
supply to adapt the voltage from 120V (US) to 240V (Australia) but these should not affect product performance. Note also that EECA in New Zealand also certify Energy Star products including lamps17. Notes:
An integral lamp means that the power supply electronics are integrated into the lamp housing allowing direct connection to existing mains power supply (typically using a bayonet or Edison screw fitting).
LED integral lamps shall demonstrate compliance with either of the following US Energy Star specifications:
o Current at time of writing: Integral LED Lamps V1.4 - https://www.energystar.gov/ia/partners/product_specs/program_reqs/Integral_LED_Lamps_Program_Requirements.pdf?6dd1-7c3d or
o Planned to be replaced by Energy Star Lamps specification V1.0 in September 2014: https://www.energystar.gov/products/specs/lamps_specification_version_1_0_pd
Demonstration of compliance shall be by either: o Provision of proof of current Energy Star certification, or o Provision of test reports from a NATA
18 or Energy Star recognised laboratory
demonstrating that the LED model meets the current Energy Star specification (test procedures as required by current US Energy Star specification).
Important note regarding safety and EMC: There are safety and electromagnetic compatibility (EMC) issues associated with the installation of CFLs and LEDs, both with the products themselves and with the operation of these products once connected to existing circuitry such as dimmers and transformers. These issues are outside the scope of this study, which is to assess the energy saving aspects of CFLs and LEDs. DMITRE and ESCOSA should seek advice from the appropriate SA Government departments (these products are subject to state-specific safety regulations and practices) as to the suitability of various safety and EMC requirements for application to these products and to their installations. The proposed performance specifications in this report do not address safety and EMC of products or installations. They do however address compatibility with existing circuitry (from the point of view that the installed products should operate satisfactorily, not that they will be safety and EMC compliant once installed). The VEET scheme requires that all products installed meet state regulations, and also undertakes independent safety testing of VEET certified products19. The VEET scheme has also recently introduced requirements to ensure that an electrician is present during certain lighting installation activities20. In the NSW ESS, the scheme administrator has examined safety issues and released a risk assessment report21. The NSW ESS website also mentions a Lighting Technologies Requirements Guide which will cover EMC, electrical safety, power consumption, lifetime and performance requirements. However at the time of
17
Refer: http://www.energywise.govt.nz/energy-star 18
NATA = National Association of Testing Authorities. Laboratory can be NATA-accredited or NATA-recognised by Mutual Recognition Agreements within APLAC (www.aplac.org/aplac_mra.html) or ILAC (www.ilac.org/ilacarrangement.html) 19
Refer: https://www.veet.vic.gov.au/Public/Pub.aspx?id=346 20
Refer: https://www.veet.vic.gov.au/Public/Pub.aspx?id=355 21
Refer: http://www.ess.nsw.gov.au/For_Accredited_Certificate_Providers/Safety_issues_in_the_Energy_Savings_Scheme

R 164
writing, this was not yet published22. The previous requirements are available on the ESS website23.
Scheme Review – Other jurisdictions The following jurisdictions also include a similar activity within their schemes:
Victoria - VEET schedule No 21A and 21B – mains voltage lamp replacement.
NSW - ESS activities E3 for replacement of PAR lamp with efficient luminaire and/or lamp, and E1 (down-lights) for replacement of mains voltage 50W halogen reflector lamp.
ACT – EEIS Part 9 clause 71(a) and (b) - install low energy general lighting service lamps and reflector lamps.
Table 77 below provides a comparison of the key elements of the general purpose lamp replacement scheme in each jurisdictions.
22
Refer: http://www.ess.nsw.gov.au/Projects_and_equipment/Lighting_Technologies 23
http://www.ess.nsw.gov.au/files/7d3cd021-a1ac-4644-ada8-9fb700ac476c/elt_requirements_table_v7_Jan_2014.pdf

R 165
Table 77: State Scheme Summary – Comparative table (general purpose lamps)
Parameter SA – REES Scheme (current)
VIC – VEET Scheme NSW – ESS Scheme ACT – EEIS Scheme SA – REES Scheme (proposed)
Working Title Install CFLs Mains voltage lamp replacement
Replace PAR lamp / mains voltage 50W halogen reflector.
Install low energy general lighting service lamp / reflector lamp.
Install CFL or LED general purpose lamp
Activity Reference Number
N/A 21A and 21B E3 / E1 Clause 71(a) and 71(b) L1
Sectors Residential Residential and commercial Residential Residential and commercial Residential
Required pre-condition (existing lamp)
Tungsten incandescent or halogen Must be in working order
Tungsten incandescent or halogen Non-reflector ≥ 18/25W
PAR lamp 80-150W / Mains voltage 50W halogen reflector Must be in working order
Tungsten incandescent or halogen Non-reflector ≥ 18/25W Reflector ≥ 35W
Tungsten incandescent or halogen Must be in working order
Replacement options
Directional / non-directional Various wattage options
Directional / non-directional Various efficacy and lifetime options
Various wattage options Directional / non-directional Efficacy and lifetime options
Directional / non-directional CFL or LED Various wattage options
Performance requirements
CFL MEPS registered Equivalent light output. Meets AS/NZS 4847.2 Minimum efficacy Compatibility with existing circuitry ≥ 8000hr life Warm white (2700K to 3500K) or cool white (3500K to 4000K)
LED 240V Self Ballasted or CFLi or LED Luminaire CFL ≥ 10000 hrs Consistent beam angle
Equivalent light output. Meets AS/NZS 4847.2 Minimum efficacy Compatibility with existing circuitry ≥ 8000hr life Warm white (2700K to 3500K) or cool white (3500K to 4000K)
CFL MEPS registered LED Energy Star compliant
Deemed savings per replacement
0.10 - 0.89 t CO2e 0.25 - 0.86 abatement factor
0.23 - 1.20 MWh 0.26 - 0.55 t CO2e 0.35 - 4.48 GJ
Replacement product warranty requirements
Nil Nil 2 years Nil 2 years
Referenced Standards
AS/NZS 4847.2 AS/NZS 4847.2 Certified by 3rd
party or test reports
AS/NZS 4847.2 Energy Star specifications

R 166
Assessment Against Scheme Principles This activity aligns with all major policy objectives. Most lighting activities are suitable for low income households, but those that require installation by an electrician (luminaire replacement = L2B, L2C, L3 and L4) may be less attractive to low income households and rental households. Note that this assessment against policy objectives and scheme principles is not included again in the Technical Assessments for Activities L2, L3 or L4. Table 78: Alignment with Policy Objectives – All lighting activities
Policy Objective Reduces household and/or business energy use Provides a focus on low income households
Associated Objectives: Provides greenhouse gas emission benefits
Provides energy cost benefits
The following table provides an assessment of all lighting activities (L1 to L4) against the new principles proposed for REES code. Table 79: Activity Alignment with REES General Principles – All lighting activities
Activity Level Principle Objective
1. Provides evidenced based energy savings
The proposed lighting upgrades provide verifiable equipment power savings which are well evidenced. Lower power lamps and luminaires are typically used in the same manner as the replaced equipment and thus inherently save energy.
2. Energy savings are additional to base case (BAU) and minimises free riders
At present no regulations mandate the sale of fluorescent or LED lamps or luminaires. For mains voltage non-directional lamps, MEPS and market forces have caused a significant market shift from tungsten incandescent lamps to mains voltage halogen and CFL lamps. This shift is accounted for in the baseline calculations for activity L1 and the result is that this activity remains a viable source of energy savings. For the other activities (L2-L4) there are no regulatory actions likely to mandate a shift to fluorescent or LED technology in future, although some shift will occur naturally over the next few years. For this reason the time horizon over which energy savings are accrued has been limited to 10 years. Beyond this there is expected to be a significant market shift to LED lighting (for installed stock, not just for equipment sales).
3. Reward best practice in relation to product performance
This has been embodied in activity L1 - LEDs are granted a higher persistence factor than CFLs. High efficiency LEDs are rewarded with greater energy savings. L2 has also removed the option of CFL down-lights which are technically inferior to LED for down-light applications. The other activities (L2-L4) all involve best practice technologies - LED and T5 fluorescent. There are no grounds to reward one technology over another with respect to performance. Products are rewarded on the basis of their established efficiency.
4. Provides a means for ensuring quality assurance and participant satisfaction
For all lighting activities, requirements have been included in the minimum installation requirements in order to ensure customer satisfaction. In activities L1-L4 LEDs are also subject to significant quality assurance requirements, utilising long-running US-based quality programs.
5. Credible approach for the calculation of energy savings
The lighting activities rely on Australian MEPS registration (where available) and on long-running US-based quality programs in order to ensure energy savings (e.g. verification of equipment efficacy)

R 167
Activity Level Principle Objective
6. Provides scope for objective, cost effective and practical auditing
Auditing of equipment installed is straightforward. Auditing of equipment removed is more difficult, and suggestions have been made as to how this can be achieved (e.g. GPS-stamped photos, etc.).
7. Good practice The specifications include a requirement to ensure that all reasonable endeavours are undertaken to recycle removed equipment.
8. Harmonisation (as far as practical)
Alignment with other schemes has been undertaken as far as is possible. The lighting activities rely on Australian MEPS registration (where available) and on long-running US-based quality programs in order to ensure energy savings (e.g. verification of equipment efficacy), so build on existing regulatory and voluntary frameworks.
9. Safety and minimising overall risk
All lighting activities include requirements for compatibility and installation quality assurance. It is however recommended that the South Australian Government review safety and EMC requirements in order to ensure these are appropriate and in line with South Australian regulations and practice.
Energy Savings - Review Overview of current methodology Currently, this REES activity only covers CFLs. The key REES assumptions for energy savings calculations from this activity for CFLs are as follows:
Energy savings based on power differences between the incumbent lamp (lamp being replaced) and the CFL installed as part of the REES.
CFL lifetime of 10,000 hours.
Assumed persistence of 1.0.
Baseline assumptions: o Incumbent lamp (the lamp being replaced by a CFL - note this overview
covers the current REES code which does not allow LEDs for this activity):
Non-directional: a halogen lamp with 2000 hour life (1000 hours left to run before failure).
Directional: a tungsten incandescent lamp with 2000 hour life (1000 hours left to run before failure). Note MEPS has not been applied to directional lamps and thus these remain largely tungsten incandescent.
o At the end of its life, the incumbent lamp would have been replaced with (as part of business as usual):
Non-directional: 50% CFL and 50% halogen. Directional: 10% CFL and 90% halogen.
There is not a strong case to change these assumptions for CFLs. The only aspect that has changed in recent years is that MEPS for directional (reflector) lamps has been postponed indefinitely, meaning that baseline energy consumption for directional lamps is likely to be slightly higher (lm/W – less efficient) than previously expected. A counter-balance to this is that LEDs are expected to take an increasing market share, particularly for directional lamps, to which they are better suited (due to rearward heat dissipation requirements for LEDs). Thus for CFLs it is not recommended to significantly change the current calculations for energy savings; however a reduction factor for persistence should be applied (discussed below). LEDs are now starting to become more widely available as a replacement for mains voltage general purpose lamps, albeit at a considerable cost. For example, a major retailer now stocks a recognised brand of GLS-style LEDs for around $20. The

R 168
proposed activity has therefore been expanded to cover an LED option as an alternative to the existing CFL. The Energy Star requirements for CFLs and LEDs (Program Requirements Product Specification for Lamps Version 1.024) requires both CFL and LED efficacy as shown in Table 80.
Table 80: Energy Star requirements for CFLs and LEDs (Program Requirements Product Specification for Lamps Version 1.0 )
Lamp type Lamp rated Power
(W) Minimum Efficacy
(lm/W)
Omnidirectional <15 55
≥15 65
Directional <20 40
≥20 50
For non-directional (omnidirectional) lamps, these efficacy requirements are not significantly different from the current Australian CFL MEPS requirements, upon which the current REES energy saving estimates are based. Thus there is currently no significant efficacy advantage (over CFLs) from installing non-directional LEDs, unless these are very efficient (e.g. 80+ lm/W). Figure 14 shows the market increase in efficacy of US non-directional LED lamps over the past few years25. Figure 14: Efficacy of US non-directional LED lamps (source: US DoE 2013)
Based on the figure above, one option would be to allow very high efficiency LEDs (say 80+ lm/W) to attract higher energy savings in the REES than those that just comply with Energy Star. Directional LEDs however have significant efficacy advantages over CFLs, and this should be included in a separate part of the specification. Energy Star requires LED lumen maintenance (life) of at least 15,000 hours. For high use areas of a home (e.g. 3 hours per day) this represents a life of around 15
24
https://www.energystar.gov/products/specs/lamps_specification_version_1_0_pd 25
US DoE 2013, Caliper Snapshot for Light Bulbs featuring LED Omnidirectional Lamps, October 2013.

R 169
years. Within this timeframe it is likely that the business-as-usual scenario would involve the fitting of LEDs in many lighting sockets (probably of higher efficacy than the current market offerings), thus it is not proposed to extend the energy savings horizon beyond 10,000 hours. Thus the only suggested changes to the current REES activity would be as follows:
Apply a persistence factor of 0.9 for CFLs (but not for LEDs).
Products must provide a minimum 2 years replacement warranty (note that this will likely require currently available products to extend their warranty period, although the warrenty period of 2 years is in line with the NSW ESS).
Allow LED integral lamps to be installed: o Standard LED integral lamp (Energy Star minimum efficacy) - to
attract same level of energy savings as CFLs but with persistence factor of 1.0.
o HE (high efficiency) LED integral lamp – same as Standard LED but with increased energy savings based on their efficacy (same life).
Taking these changes into account, the underlying assumptions used as the basis for the calculation of energy savings in this study are detailed in Table 81. Table 81: Energy Savings Estimate – Underlying Key Assumptions (Install CFL or LED
general purpose lamp)
Parameter Assumption
Baseline lamps - mix of “pre-MEPS” and “post-MEPS” lamps
Incumbent lamp (the lamp being replaced by a CFL or LED): o Non-directional: a halogen lamp with 2000 hour life
(1000 hours left to run before failure). o Directional: an incandescent lamp with 2000 hour life
(1000 hours left to run before failure). At the end of its life, the incumbent lamp would have been replaced with (based on current market share):
o Non-directional: 50% CFL and 50% halogen. o Directional: 10% CFL and 90% incandescent (note that
directional CFL efficacy is around half that of non-directional CFL due to reflector inefficiency coupled with large light source).
Efficacy and savings Based on rated lamp values (direct savings – replacement)
Total energy savings lifetime
10,000 hours
Assumed usage N/A - energy savings horizon is assumed to be lamp life, to a maximum of 10,000 hours.
Free riders N/A - taken into account within baseline assumptions
Compliance /Persistence
Assume 10% will remove CFL due to dissatisfaction (0.90). Note that this does not relate to product failure leading to a warranty claim, it relates to personal dissatisfaction with CFLs. None will remove LED (1.00).
Lifetime 10,000 hours
Energy Savings Calculation The energy savings are based on the assumptions discussed above and the following:
First baseline period (“BaU #1”) = 1000 hours (remaining life of incumbent lamp)
Second baseline period (“BaU #2”) = 9000 hours (assumes incumbent lamp is replaced with lamp types as discussed above).

R 170
For non-directional lamps, the calculations are summarised in Table 82. Energy savings results (GJ) are shown in yellow highlighted cells. Table 82: Non-directional lamp energy savings
Installed lamp:
minimum luminous
flux (lumens)
BaU #1 (1000 hrs)
BaU #2 (9000 hrs)
Install CFL / Std LED (10000 hours)
Install HE LED (10000 hrs)
Power (W)
Energy (MWh)
Av. power
(W)
Energy (MWh)
Efficacy (lm/W)
Power (W)
Energy (MWh)
CFL GJ Saving
(persistence 0.9)
Std LED GJ Saving (persistence
1.0)
Efficacy (lm/W)
Power (W)
Energy (MWh)
HE LED GJ Saving
(persistence 1.0)
350 28 0.03 18.0 0.16 43.2 8.1 0.08 0.35 0.39 80 4.4 0.04 0.53
650 42 0.04 27.4 0.25 50.7 12.8 0.13 0.52 0.58 80 8.1 0.08 0.75
850 53 0.05 34.4 0.31 54.0 15.8 0.16 0.66 0.74 80 10.6 0.11 0.92
1,150 70 0.07 45.0 0.40 57.5 20.0 0.20 0.89 0.99 80 14.4 0.14 1.19
1,800 105 0.11 66.9 0.60 62.7 28.7 0.29 1.36 1.51 80 22.5 0.23 1.73
For directional lamps, the calculations are summarised in Table 83. Table 83:Directional lamp energy savings
Installed lamp:
minimum luminous
flux (lumens)
BaU #1 (1000 hrs)
BaU #2 (9000 hrs)
Install CFL (10000 hours)
Install Std LED (10000 hours)
Install HE LED (10,000 hours)
Power (W)
Energy (MWh)
Av. power
(W)
Energy (MWh)
Efficacy (lm/W)
Power (W)
Energy (MWh)
CFL GJ Saving
(persistence 0.9)
Efficacy (lm/W)
Power (W)
Energy (MWh)
Std LED GJ Saving (persistenc
e 1.0)
Efficacy (lm/W)
Power (W)
Energy (MWh)
HE LED GJ Saving (persistenc
e 1.0)
250 40 0.04 37.2 0.33 21.6 11.6 0.12 0.84 50 5.0 0.05 1.17 80 3.1 0.03 1.24
350 50 0.05 46.5 0.42 23.5 14.9 0.15 1.03 50 7.0 0.07 1.43 80 4.4 0.04 1.53
460 60 0.06 55.8 0.50 25.4 18.1 0.18 1.23 50 9.2 0.09 1.69 80 5.8 0.06 1.82
600 75 0.08 69.7 0.63 27.0 22.2 0.22 1.56 50 12.0 0.12 2.10 80 7.5 0.08 2.26
810 100 0.10 92.8 0.84 28.8 28.2 0.28 2.12 50 16.2 0.16 2.78 80 10.1 0.10 3.00
990 120 0.12 111.4 1.00 30.0 33.7 0.34 2.55 50 20.2 0.20 3.31 80 12.6 0.13 3.59
1,260 150 0.15 139.0 1.25 31.3 40.2 0.40 3.24 50 25.2 0.25 4.14 80 15.8 0.16 4.48
For comparison, the final ESS savings factors (activity E3 - PAR lamps) are reproduced in Table 84 below (note that these are in MWh). Table 84: NSW ESS savings factors for PAR lamps (MWh per PAR lamp replaced)
Existing lamp power P (W)
Light output of new lamp
Lamp power of replacement lamp (W)
<15W <25W <30W <40W
80≤ P<100 ≥ 1,200lm 0.60 - - -
100≤P<120 ≥ 1,500lm 0.80 0.75 - -
120≤P<140 ≥ 1,900lm 1.00 0.95 0.90 -
140≤P<160 ≥ 2,300lm 1.20 1.15 1.10 1.00
For the purpose of comparison, a 1300 lm standard-efficacy directional PAR LED lamp:
Proposed REES: 4.14 GJ o Approximate calculation: (~140W to 25W) x 10,000hrs o = 1.15 MWh = 4.14 GJ
Final ESS: 2.16 GJ o Assumed calculation: (80W to 15W) x 10,000hrs o = 0.65 MWh (0.6 in Rule) = 2.16 GWh

R 171
The key difference between these approaches is the efficacy of the incumbent lamp - the proposed REES assumes a 150W incandescent lamp is replaced (i.e. 8 lm/W). The ESS presumes that an 80W incandescent lamp is replaced (i.e. 15 lm/W). This assumed efficacy is far higher than expected in practice. The resulting REES energy savings estimates shown in the above tables differ from the current REES calculations in the following ways:
Non-directional: o CFLs have persistence 0.9. o Added category for Std LED, with same efficacy as CFL, persistence
1.0. o Added category for HE LED, with efficacy 80 lm/W, persistence 1.0.
Directional: o CFLs have persistence 0.9. o Added category for Std LED, with efficacy 50 lm/W, persistence 1.0. o Added category for HE LED, with efficacy 80 lm/W, persistence 1.0. o Added “50W” lamp category to suit 240V 50W reflector lamps (e.g. as
installed in mains voltage down-lights). Note that all energy savings are from changes in electricity used by the lamps.
Potential Compliance Issues The key compliance issue is ensuring that the replaced equipment (type and wattage, etc.) are as claimed. There are two possible approaches to this issue. Firstly, requiring a GPS and time-stamped photograph. Secondly, auditing the collected stockpiles of equipment removed. Both of these are likely to have some administrative cost for the installer (mainly related to tracking and storing photographs).

R 172
Install CFL or LED general purpose lamp Activity No.
L1
1. Activity Specific Definitions
Integral referring to a lamp means that the power supply electronics are integrated into the lamp housing allowing direct connection to the existing power supply.
Standard LED (“Std LED”) means an integral LED lamp meeting the US Energy Star specification
Integral LED Lamps V1.4 or Energy Star Lamps specification V1.0.
High Efficiency LED (“HE LED”) means an integral LED lamp with initial efficacy of not less than 80 lm/W, and meeting the US Energy Star specification Integral LED Lamps V1.4 or Energy Star Lamps specification V1.0.
2. Activity Description (Summary)
Replace a mains voltage incandescent or halogen lamp (non-directional or directional) with a compact fluorescent integral lamp (CFL) or light emitting diode integral lamp (LED).
3. Activity Eligibility Requirements
1. The number of individual replacements in any one premises shall not exceed 20.
2. All equipment that is replaced must be in working order immediately prior to removal.
3. Replaced equipment (lamp) shall have rated power according to Table L1A (non-directional lamps) or Table L1B (directional lamps). Refer column B for tungsten incandescent and column C for halogen lamps. If required, intermediate values of rated power are referenced to the next lower rated power.
4. Installed Product Requirements
The installed product (both CFL and/or LED) shall—
1. Be installed at the time of removal of the existing equipment.
2. Have a rated colour temperature not exceeding 3000 Kelvin, unless otherwise authorised by the occupant of the premises.
3. Have a measured average initial luminous flux (verified by test report - for CFLs test procedure AS/NZS 4847.1 or IEC 60969; for LEDs test procedure as required by one of the programs described below) of at least the corresponding* value in column D of Table L1A (non-directional lamps) or Table L1B (directional lamps). *Note that this should correspond to the class of replaced lamp.
4. Provide a minimum 2 years replacement warranty.
The installed product (if CFL) shall:
5. Have a measured median lamp life of 10,000 hours or more, verified by test report (test procedure AS/NZS 4847.1 or IEC 60969).
6. Comply with AS/NZS4847.2:2010 and shall have a current, approved registration in the MEPS registration system (www.energyrating.gov.au).
The installed product (if LED) shall—
7. Demonstrate compliance with either Energy Star Integral LED Lamps V1.4 or Energy Star Lamps V1.0 by providing current proof of Energy Star program certification or by providing test reports from a NATA
26 or Energy Star recognised laboratory demonstrating that the LED model meets the one of
the above Energy Star specifications (test procedures as required by relevant Energy Star specification). Alternatively, the LED model can be approved by the NSW ESS scheme.
8. In addition, HE LEDs shall provide test reports (in addition to above) from a NATA or Energy Star recognised laboratory demonstrating that the LED has a minimum initial efficacy of not less than 80 lm/W (test procedures as required by relevant US Energy Star specification).
26
NATA = National Association of Testing Authorities. Laboratory can be NATA-accredited or NATA-recognised by Mutual Recognition Agreements within APLAC (www.aplac.org/aplac_mra.html) or ILAC (www.ilac.org/ilacarrangement.html)

R 173
5. Minimum Installation Requirements
1. A person or entity undertaking this activity shall use best endeavours to ensure that any replacements are targeted at high usage luminaires in the first instance.
2. All equipment replaced shall be removed from the premises and not re-used.
3. Installed equipment shall not be connected to a transformer, dimmer, timer, motion sensor, daylight switch or other automated switch or control (or combination thereof) unless specified by the manufacturer as being compatible with such device or combinations of devices.
4. If connected to a dimmer, the installer shall test the equipment through its full dimming range to ensure that the equipment works to the satisfaction of the customer.
5. Where installed equipment causes sub-optimal operation, the installer shall either reinstall the original equipment (or equivalent replacement) or replace any components of the equipment that are causing the installation not to operate, at no expense to the resident. Such a request for reinstatement must be acted upon if made within 20 business days of the installation of the new equipment.
6. The person undertaking this activity in a residential customer’s premises must satisfy the REES Code mandatory safety training requirements.
6. Activity default energy savings
The total Gigajoule energy (GJ - electricity) saved attributed to this activity per residential premises is:
Table L1A: Non-Directional Lamps
A B C D E F G
Class
Removed lamp: typical rated
incandescent lamp power (W)
Removed lamp: typical rated
halogen lamp
power (W)
Installed lamp:
minimum luminous
flux (lumens)
CFL Energy Savings
(GJ)
Std LED Energy Savings
(GJ)
HE LED Energy Savings
(GJ)
1 40 28 350 0.35 0.39 0.53
2 60 42 650 0.52 0.58 0.75
3 75 53 850 0.66 0.74 0.92
4 100 70 1,150 0.89 0.99 1.19
5 150 105 1,800 1.36 1.51 1.73
Table L1B: Directional Lamps
A B C D E F G
Class
Removed lamp: typical rated
incandescent lamp power (W)
Removed lamp: typical rated
halogen lamp
power (W)
Installed lamp:
minimum luminous
flux (lumens)
CFL Energy Savings
(GJ)
Std LED Energy Savings
(GJ)
HE LED Energy Savings
(GJ)
1 40 28 250 0.84 1.17 1.24
1a 50 35 350 1.03 1.43 1.53
2 60 42 460 1.23 1.69 1.82
3 75 53 600 1.56 2.10 2.26
4 100 70 810 2.12 2.78 3.00
4a 120 84 990 2.55 3.31 3.59
5 150 105 1,260 3.24 4.14 4.48
7. Guidance Notes (Informative only – not mandatory)
All reasonable endeavours should be undertaken to recycle removed equipment.

R 174
Install LED Down-light Lamp or LED Down-light Luminaire - L2
Technical Assessment - L2
Install LED Down-light Lamp or LED Down-light Luminaire
REES Activity Reference: L2 REES Activity title: Install LED Down-light Lamp or LED Down-light Luminaire L2A - ELV down-light bulb replacement L2B - ELV down-light luminaire replacement L2C - ELV down-light luminaire replacement + ceiling insulation reinstatement Target product: Down-lights Savings: Activity saves energy directly through improved lamp/luminaire efficacy, plus some indirect space conditioning benefits for L2C Pre-conditions: Pre-existing product must be a halogen down-light

R 175
Current REES Activity Description The current activity (for CFLs and LEDs) forms part of the current REES scheme code27 . The current summary description within the REES scheme code is as follows: “Install efficient extra low voltage down lights” Description of activity: Three variations of installation of high efficiency down light lamps, all of which involve replacing the existing lamps or parts of the lighting system with a more efficient alternative. The code specification currently requires the following: each activity must comply with the following, as minimum: 1. The lamp model installed shall have an average downward initial luminous flux of
500 lumens or more, verified by test report. 2. The lamp model installed shall have a median lamp life of 5,000 hours or more,
verified by test report. 3. The lamp model installed shall have an average lumen maintenance of 80% or
more, after 2,000 hours of operation, verified by test report. 4. The lamp installed shall have a minimum beam angle of 35 degrees. 5. The CFL model installed shall comply with AS/NZS4847.2:2010 and shall have a
current, approved registration in the MEPS registration system (www.energyrating.gov.au).
6. The LED model installed shall be: a. certified with the Lighting Council Australia SSL scheme
(http://www.lightingcouncil.com.au/ssl/overview.php); or b. as otherwise approved by the Commission for installation under REES.
7. The lamp shall be installed at the time of removal of the incandescent/halogen lamp.
8. A person or entity undertaking this activity shall use best endeavours to ensure any replacements are targeted at high usage lamp fittings in the first instance.
9. The rated colour temperature of any lamp installed shall not exceed 3000 Kelvin, unless otherwise authorised by the occupant of the premises.
10. A lamp shall not be installed or connected to a dimmer switch, timer, motion sensor, daylight switch or other automated switch or control, unless specified by the manufacturer as being compatible with such device. If a lamp is to be connected to a dimmer switch, the installer shall test it through its full dimming range to ensure that the lamp works to the satisfaction of the customer.
11. A lamp must not be installed where it would be incompatible with the operation of the transformer and dimmer switch (if applicable) currently installed. Where a replaced lamp causes the light fitting to no longer operate, the installer must either reinstall the original lamp (or an equivalent replacement) at the request of the householder, or replace any components of the light fitting that are causing the replaced lamp not to operate, at no expense to the resident. Such a request must be made within 3 months of the installation of the new lamp.
12. Other than for simple exchange of lamps for an existing fitting, installation required by a licenced electrician.
13. All lamps, transformers and luminaires that are replaced shall be removed from the premises. They shall not be re-used.
27
RESIDENTIAL ENERGY EFFICIENCY SCHEME CODE REESC/07 February 2014

R 176
14. The person undertaking this activity in a residential customer’s premises must satisfy the REES Code mandatory safety training requirements. Registered Plumbers, Gas Fitters, Electricians and Building Work Supervisors are exempt from this requirement.
The deemed values for energy saving are divided into three categories: replace 50W ELV lamp, replace 50W ELV lamp and magnetic-electronic transformer, and replace entire lighting unit. Within each of these there is a table of energy savings values, which vary depending on the size and lifetime of the replacement lamp. The guidance notes state that all reasonable endeavours be used to recycle lamps.
Proposed REES Activity Description The proposed summary description for the REES scheme code is as follows. “Install LED Down-light Lamp or LED Down-light Luminaire” This activity involves:
Activity L2A: replacing a 35-50W extra low voltage (ELV) halogen lamp with an integral ELV LED lamp (for clarity, this is a “plug-and-play” lamp which allows the existing transformer and fitting to be retained); or
Activity L2B: replacing a 35-50W ELV luminaire (remove halogen lamp, remove transformer, removal of fitting is optional) with an integral mains voltage (MV) LED lamp or MV LED down-light luminaire; or
Activity L2C: if an MV LED down-light luminaire is installed (L2B), there is an option to reinstate the ceiling insulation around the down-light and where permitted by the relevant standards, over the new replacement down-light.
Notes:
“Integral ELV LED lamp” means a lamp with power supply electronics integrated into the lamp housing allowing direct connection to existing 12V power supply.
“Integral MV LED lamp” means a lamp with power supply electronics integrated into the lamp housing allowing direct connection to existing mains power supply.
Key Specification Changes The key changes from the current specification are:
The option of installing CFL down-lights has been removed, for the following reasons:
o Directional lamps, which use lenses and reflectors to direct light into a beam, require a point source of light (or close to it). CFLs employ a tube, which is not a point source of light. Thus the light output from a CFL down-light is not directional, although this is not a major problem when these lights are used for general purpose illumination.
o When used as a down-light in a confined light fixture, CFLs suffer from heat build-up. The result of this is that the design of these CFLs results in them taking a long time to run up.
o Down-lights in houses are often on a dimmer, and CFLs are inherently un-dimmable.
o It is difficult for a CFL to be able to produce the quantity of light required for a down-light, given the space restrictions - e.g. halogen down light lamps are 50mm diameter and a CFL of this size cannot produce sufficient light.

R 177
o LEDs do not suffer significantly from these problems, and in recent years have developed sufficiently to allow them to be a viable option for down-lights - both as a lamp-only replacement and as an entire lighting fixture.
“Option 2” of replacing lamp and magnetic transformer with electronic transformer has been removed. This option was included when a 35W halogen lamp and electronic transformer was the best available option for down-lights. As discussed above, LEDs have recently become a viable option for down-lights. In addition, MEPS has now mandated 35W lamps in place of 50W lamps.
For LEDs, the majority of performance requirements have been kept but the required specification has been changed to:
o An integral ELV LED lamp or integral MV LED lamp shall meet current US Energy Star specification* for integral lamps (see below).
o An MV LED down-light luminaire shall meet US Energy Star specification for luminaires V1.228.
An additional credit for re-instatement of ceiling insulation around (and where permitted over) the down-light has been incorporated.
All installed products shall provide a minimum 2 years replacement warranty. There is currently no publicly available data regarding how many products available on the Australian market might meet the US Energy Star specification. There are likely to be a small number, and this will increase as the NSW ESS29 and REES require this specification. Alternatively, products can be submitted (with test reports) to show that they meet the Energy Star specification (see below) if they don’t wish to seek US certification. One further approach is for products to be sought from the US which are already certified. Note that small changes may be required to the power supply to adapt the voltage from 120V (US) to 240V (Australia) but these should not affect product performance. Note also that EECA in New Zealand also certify Energy Star products including lamps30. Notes:
Integral ELV LED lamps and integral MV LED lamps shall demonstrate compliance with either of the following US Energy Star specifications:
o Current at time of writing: Integral LED Lamps V1.4 - https://www.energystar.gov/ia/partners/product_specs/program_reqs/Integral_LED_Lamps_Program_Requirements.pdf?6dd1-7c3d or
o This is planned to be replaced by Energy Star Lamps specification V1.0 in September
2014: https://www.energystar.gov/products/specs/lamps_specification_version_1_0_pd
Demonstration of compliance with all Energy Star requirements shall be by either: o Provision of proof of current Energy Star certification, or o Provision of test reports from a NATA
31 or Energy Star recognised laboratory
demonstrating that the LED model meets the current Energy Star specification (test procedures as required by current US Energy Star specification for LED Integral lamps).
28
http://www.energystar.gov/certified-products/detail/501/partners?fuseaction=products_for_partners.showLightFixRes 29
Refer list of ESS Accepted Lighting Products: http://www.ess.nsw.gov.au/Projects_and_equipment/Lighting_Technologies 30
Refer: http://www.energywise.govt.nz/energy-star 31
NATA = National Association of Testing Authorities. Laboratory can be NATA-accredited or NATA-recognised by Mutual Recognition Agreements within APLAC (www.aplac.org/aplac_mra.html) or ILAC (www.ilac.org/ilacarrangement.html)

R 178
Important note regarding safety and EMC: There are safety and electromagnetic compatibility (EMC) issues associated with the installation of CFLs and LEDs, both with the products themselves and with the operation of these products once connected to existing circuitry such as dimmers and transformers. These issues are outside the scope of this study, which is to assess the energy saving aspects of CFLs and LEDs. DMITRE and ESCOSA should seek advice from the appropriate SA Government departments (these products are subject to state-specific safety regulations and practices) as to the suitability of various safety and EMC requirements for application to these products and to their installations. The proposed performance specifications in this report do not address safety and EMC of products or installations. They do however address compatibility with existing circuitry (from the point of view that the installed products should operate satisfactorily, not that they will be safety and EMC compliant once installed). The VEET scheme requires that all products installed meet state regulations, and also undertakes independent safety testing of VEET certified products32. The VEET scheme has also recently introduced requirements to ensure that an electrician is present during certain lighting installation activities33. In the NSW ESS, the scheme administrator has examined safety issues and released a risk assessment report34. The NSW ESS website also mentions a Lighting Technologies Requirements Guide which will cover EMC, electrical safety, power consumption, lifetime and performance requirements. However at the time of writing, this was not yet published35. The previous requirements are available on the ESS website36.
Scheme Review – Other jurisdictions The following jurisdictions also include a down-light activity within their schemes:
Victoria - VEET schedule No 21C and 21D – lamp and down-light replacement.
NSW - ESS activity E1 (down-lights).
ACT - Part 9 clause 71(c) and (d) - install lamp / down-light. Table 85 provides a comparison of the key elements of each jurisdictions general purpose lamp replacement scheme. Note that no other schemes currently include down-light covers as an activity.
32
Refer: https://www.veet.vic.gov.au/Public/Pub.aspx?id=346 33
Refer: https://www.veet.vic.gov.au/Public/Pub.aspx?id=355 34
Refer: http://www.ess.nsw.gov.au/For_Accredited_Certificate_Providers/Safety_issues_in_the_Energy_Savings_Scheme 35
Refer: http://www.ess.nsw.gov.au/Projects_and_equipment/Lighting_Technologies 36
http://www.ess.nsw.gov.au/files/7d3cd021-a1ac-4644-ada8-9fb700ac476c/elt_requirements_table_v7_Jan_2014.pdf

R 179
Table 85: State Scheme Summary – Comparative table (LED down-light)
Parameter SA – REES Scheme (current)
VIC – VEET Scheme NSW – ESS Scheme ACT – EEIS Scheme SA – REES Scheme (proposed)
Working Title Install LED down-light Lamp and down-light replacement
Down-lights Lamp and down-light replacement
Install LED Down-light Lamp or LED Down-light Luminaire
Activity Reference Number
N/A 21C and 21D E1 Clause 71(c) and 71(d) L2 (L2A, L2B, L2C)
Sectors Residential Residential and commercial Residential Residential and commercial Residential
Required pre-condition (existing lamp)
Tungsten incandescent or halogen
12V. ≥ 35W
Halogen 240V or 12V multifaceted reflector lamp, 35W or 50W Must be in working order
12V. ≥ 35W
ELV lamp
Replacement options Lamp, lamp & transformer, entire unit Various wattage options
Various efficacy and lifetime options
Various options depending on lamp / luminaire installed
Various efficacy and lifetime options
Lamp, lamp & transformer, entire luminaire Various wattage options
Performance requirements
Colour temperature ≤ 3000K ≥ 500lm ≥ 5000hrs Lumen maintenance ≥ 80% @ 2,000hrs Minimum beam angle 35 degrees CFL MEPS registered LED certified with Lighting Council Australia Compatible with dimmer
≥ 350lm Meets AS/NZS 4847.2 Minimum efficacy Compatibility with existing circuitry ≥ 8000hr life Warm white (2700K to 3500K) or cool white (3500K to 4000K) Minimum beam angle 36 degrees
LED lamp+driver, CFLi, LED luminaire or LED Lamp Life ≥ 10,000 hours Light Output ≥ 500lm Beam angle consistent with original lamp Must be certified by approved scheme or supply test reports
Same as Victoria Colour temperature ≤ 3000K ≥ 500lm Comply Energy Star or test reports Down-light thermal barrier where used - comply with AS/NZS 5110
Deemed savings per replacement
0.03 - 0.32 tCO2e 0.2 - 0.9 abatement factor 0.23 - 0.45 MWh 0.21 - 0.4 tCO2e 0.83 – 1.1 GJ lamp plus cover space conditioning savings where used
Replacement product warranty requirements
Nil Nil 2 years Nil Minimum 2 years replacement warranty
Referenced Standards AS/NZS4847.2 AS/NZS4847.2 Certified by 3rd
party or test reports
AS/NZS4847.2 AS/NZS4847.2 Energy Star

R 180
Assessment Against Scheme Principles For this lighting activity, an assessment against the scheme objectives and principles is provided in Activity L1 (refer Table 78 and Table 79).
Energy Savings - Review Overview of methodology Currently, the key assumptions for energy savings calculations from this activity are as follows:
Replacement of a 50W ELV halogen lamp with a lower power lamp: o First part - to end of BaU life of incumbent 50W lamp:
On average over the period 2012-2014, the incumbent 50W lamps have a remaining BaU life of 1923 hours.
Abatement in first part (tCO2-e) = 0.935 x 1923 x (50 - P) / (0.865 x 10^6).
o Second part - from end of BaU life of 50W lamp to end of life of REES-installed efficient lamp (BaU case is that a 35W lamp is installed in this period):
Abatement in second part (tCO2-e) = 0.935 x (Life - 1923) x (35 - P) / (0.865 x 10^6)
o Where 0.935 = greenhouse gas intensity (kg/kWh) Life = rated median lamp life of lamp being installed, verified by
test report (maximum used for equation is 10,000 hours) P = average measured power of lamp being installed, verified by
test report 50 = incumbent lamp power 35 = power of BaU lamp under MEPS from April 2012 0.865 = av electronic/magnetic transformer efficiency
Replacement of a 50W ELV halogen lamp and magnetic transformer with a lower power lamp together with an electronic transformer
o First part - to end of BaU life of incumbent 50W lamp: Abatement in first part (tCO2-e) = 0.935 x 1923 x (50/0.8 - P/0.93) /
10^6 o Second part - from end of BaU life of 50W lamp to end of life of REES-
installed efficient lamp (BaU case is that a 35W lamp is installed in this period):
Abatement in second part (tCO2-e) = 0.935 x (Life - 1923) x (35/0.8 - P/0.93) / 10^6
o Third part - from end of life of REES-installed efficient lamp to end of life of REES-installed transformer (10,000 hour life)
Abatement in third part (tCO2-e) = 0.935 x (10,000 - Life) x (35/0.8 - 35/0.93) / 10^6
o Where: 0.935 = greenhouse gas intensity (kg/kWh) Life = rated median lamp life of lamp being installed, verified by
test report (maximum used for equation is 10,000 hours) P = average measured power of lamp being installed, verified by
test report 50 = incumbent lamp power 35 = power of BaU lamp under MEPS from April 2012

R 181
0.8 = magnetic transformer efficiency 0.93 = magnetic transformer efficiency.
Replacement of a 50W ELV halogen lamp and transformer with a lower power lighting unit
o First part - to end of BaU life of incumbent 50W lamp: Abatement in first part (tCO2-e) = 0.935 x 1923 x (50/0.865 - Pc) /
10^6 o Second part - from end of BaU life of 50W lamp to end of life of REES-
installed efficient unit (BaU case is that a 35W lamp is installed in this period):
Abatement in second part (tCO2-e) = 0.935 x (Life - 1923) x (35/0.865 - Pc) / 10^6
o Where: 0.935 = greenhouse gas intensity (kg/kWh) Life = rated median lamp life of lamp being installed, verified by
test report (maximum used for equation is 10,000 hours) Pc = average measured total circuit power of lamp and driver for
unit being installed, verified by test report 50 = incumbent lamp power 35 = power of BaU lamp under MEPS from April 2012 0.865 = av electronic/magnetic transformer efficiency.
The key change to the baseline that has occurred in recent years is that 35W lamps now dominate sales of down-light lamps, due to MEPS. Thus the calculation changes to the existing methodology are as follows. For replacement of a halogen lamp with an ELV LED lamp, the calculation becomes:
Saving (MWh) = LED lifetime x (35W - LED power) / (0.865*10^6) Where 0.865 = av electronic/magnetic transformer efficiency. Replacement of a 50W ELV halogen lamp and magnetic transformer with a lower power lamp together with an electronic transformer becomes irrelevant (due to MEPS mandating 35W lamps) and it is recommended that this be deleted as an activity. Replacement of a 50W ELV halogen lamp and magnetic transformer with an mains voltage LED lamp or mains voltage LED down-light:
Saving (MWh) = LED lifetime x (35W / 0.865 - LED power) / 10^6 Where 0.865 = av electronic/magnetic transformer efficiency. Energy Star requires LED lumen maintenance (life) of at least 15000 hours. For high use areas of a home (e.g. 3 hours per day) this represents a life of 15 years. Within this time it is likely that the business-as-usual scenario would involve the fitting of LEDs in many lighting sockets, thus it is not proposed to the extend energy savings horizon beyond 10,000 hours. Taking these changes into account, the underlying assumptions used as the basis for the calculation of energy savings in this study are detailed in Table 86.

R 182
Table 86: Energy Savings Estimate – Underlying Key Assumptions (LED down-light)
Parameter Assumption
Baseline lamps 35W
Efficacy and savings Based on rated lamp values (direct savings – replacement). Average electronic/magnetic transformer efficiency of 0.865 (assumed 50% magnetic and 50% electronic with efficiency of 0.8 and 0.93 respectively)
Total energy savings lifetime
10,000 hours
Assumed usage N/A - energy savings horizon is assumed to be lamp life, to a maximum of 10,000 hours.
Free riders N/A - taken account of in baseline assumptions
Compliance/Persistence Assume none will remove LED (1.00)
Lifetime 10,000 hours
Energy Savings Calculation The energy savings are based on the assumptions discussed above and the following: For replacing a 35-50W ELV halogen lamp with an ELV LED lamp, the calculations become:
Saving (MWh) = LED lifetime x (35W - LED power) / (0.865*10^6) Where 0.865 = av electronic/magnetic transformer efficiency. For two discrete LED power levels, savings in GJ are as follows:
LED with rated power ≤10W: 1.04 GJ
LED with rated power 11-15W: 0.83 GJ For replacing a 35-50W ELV halogen lamp and transformer with a mains voltage LED lamp or mains voltage LED down-light luminaire:
Saving (MWh) = LED lifetime x (35W/0.865- LED power)/*10^6 Where 0.865 = average electronic/magnetic transformer efficiency. For two discrete LED power levels, savings in GJ are as follows:
LED with rated power ≤10W: 1.10 GJ
LED with rated power 11-15W: 0.92 GJ Note that all energy savings are from electricity. In addition, for the full down-light activity, where the entire luminaire is replaced, the ceiling insulation that typically will have been removed around the fitting (typically 0.25m2) can be re-instated (provided certain conditions are met). This, and associated energy savings, were the subject of a previous report for ESCOSA. Up until the start of 2013 the electrical wiring regulations (AS/NZS 3000) required that ceiling insulation must be kept 200mm clear of halogen type down-light fittings. This effectively meant that a 500mm x 500mm area of ceiling around the down-light fitting had to be kept free of insulation37 . Under a recent amendment to this standard the required minimum clearance between a down-light and insulation has been reduced to 50mm which means that the area needed to be kept clear of insulation has been reduced from 500mm square
37
A typical down-light is approximately 100mm diameter. This means that with a 200mm clearance all around a circle having a diameter of 500mm (200 + 100 + 200) must be kept clear of insulation. As they are more difficult to undertake, circular cut outs are however rarely made and most installers will opt for a square cut-out the minimum size being 500mm square (sometimes larger).

R 183
(0.25m2) to just 200mm square (0.04m2) a reduction of approximately 85%. This change in regulation presents an opportunity at the time of down-light replacement to also improve the thermal performance of the ceiling. The absence of insulation around the down-light fitting promotes increased (conductive) heat loss in winter and heat gain in summer compared to insulated sections of the ceiling. Ceiling insulation re-instatement therefore offers potential savings in space conditioning energy by reducing conductive and in some cases convective heat losses/gains from spaces serviced by the down-light. Estimates of potential energy savings have been determined through the use of thermal simulation modelling as described in detail in Appendix 3 of this report. The re-instatement can either be “partial” or “full”:
Partial - Maintains the minimum specified separation distance between the down-light and the surrounding insulation as specified in AS/NZS 3000 (min 50mm around perimeter), or
Full - Fully covers the down-light or down-light in combination with a down-light thermal barrier38 in circumstances where the particular assembly is certified by the manufacturer as being suitable for operation when covered by thermal insulation material as permitted under AS/NZS 3000.
Full re-instatement attracts an increased benefit because not only is the reinstatement of ceiling insulation to a larger area but also full coverage means infiltration (convective) losses/gains through the down-light fitting are reduced Anything that will limit the heat dissipation from the back of a down-light (eg insulation and or thermal barriers) can in some cases adversely affect its performance (eg lifetime) and in the worst case scenario present a safety (fire) risk. Consequently the full re-instatement option is NOT suitable for application to existing down-lights or new down-lights (or down-light/thermal barrier combinations) that are not certified by the manufacturer in accordance with AS/NZS 3000 as being suitable for operation when covered by thermal insulation material.
Potential Compliance Issues The key compliance issue is ensuring that the replaced equipment (type and wattage, etc.) are as claimed. There are two possible approaches to this issue. Firstly, requiring a GPS and time-stamped photograph. Secondly, auditing the collected stockpiles of equipment removed. Both of these are likely to have some administrative cost for the installer (mainly related to tracking and storing photographs).
38
In cases where down-light thermal barriers are used they must only be installed with compatible downlight thermal barriers (as specified by the downlight supplier) and must comply comply with AS/NZS 5110

R 184
Install LED Down-light Lamp or LED Down-light Luminaire Activity No.
L2
1. Activity Specific Definitions
Integral ELV LED lamp means a lamp with power supply electronics integrated into the lamp housing
allowing direct connection to existing 12V power supply.
Integral MV LED lamp means a lamp with power supply electronics integrated into the lamp housing
allowing direct connection to existing mains power supply.
Mains voltage (MV) LED down-light luminaire means a mains voltage LED light fixture incorporating
light source, power supply electronics and luminaire housing that does not rely on any existing components of the replaced equipment in order to operate.
ELV means extra low voltage, which in this context means nominal 12V a.c. or d.c.
Luminaire means apparatus which distributes, filters or transforms the light transmitted from one or
more lamps and which includes, except the lamps themselves, all the parts necessary for fixing and protecting the lamps and, where necessary, circuit auxiliaries together with the means for connecting them to the electricity supply.
Partial re-instatement of insulation means reinstatement of ceiling insulation around the down-light,
only maintaining the minimum specified separation distance between the down-light and the surrounding insulation (50mm) as specified in AS/NZS 3000.
Full re-instatement of insulation means complete reinstatement of ceiling insulation around and over
the down-light (where permitted)
2. Activity Description (Summary)
L2A Replace ELV halogen lamp with an integral ELV LED lamp
L2B Replace ELV halogen lamp and transformer with an integral MV LED lamp or MV LED down-light luminaire.
L2C Optional with L2B - re-instate ceiling insulation.
3. Activity Eligibility Requirements
1. The number of individual replacements in any one premises shall not exceed 20.
2. All equipment that is replaced must be in working order immediately prior to removal.
4. Installed Product Requirements
The installed product shall—
1. Be installed at the time of removal of the existing equipment.
2. Have a rated colour temperature not exceeding 3000 Kelvin, unless otherwise authorised by the occupant of the premises.
3. Have a measured average initial luminous flux (verified by test report - test procedure as required by one of the programs described below) of at least 500 lumens.
4. Provide a minimum 2 years replacement warranty.
5. Integral ELV LED lamp or integral MV LED lamp shall demonstrate compliance with either Energy Star Integral LED Lamps V1.4 or Energy Star Lamps V1.0 by providing current proof of Energy Star program certification or by providing test reports from a NATA
39 or Energy Star recognised
laboratory demonstrating that the LED model meets the one of the above Energy Star specifications (test procedures as required by relevant US Energy Star specification). Alternatively, the LED model can be approved by the NSW ESS scheme.
6. Mains voltage LED down-light luminaire shall meet US Energy Star specification for luminaires V1.2 by providing current proof of Energy Star program certification or by providing test reports from a NATA or Energy Star recognised laboratory demonstrating that the model meets the above Energy Star specification (test procedures as required by relevant US Energy Star specification). Alternatively, the LED model can be approved by the NSW ESS scheme.
7. Re-instatement of ceiling insulation - the activity can only be undertaken as part of a down-light fitting replacement activity under REES.
39
NATA = National Association of Testing Authorities. Laboratory can be NATA-accredited or NATA-recognised by Mutual Recognition Agreements within APLAC (www.aplac.org/aplac_mra.html) or ILAC (www.ilac.org/ilacarrangement.html)

R 185
8. Re-instatement of ceiling insulation - where a down-light thermal barrier is used it must comply with AS/NZS 5110.
9. Re-instatement of ceiling insulation - different levels of credit are available depending on whether or not it is a partial or a full re-instatement of the ceiling insulation
10. Down-light thermal barriers – where used, any barrier that is used around and or over a light fitting must be one that is approved for use with the particular light fitting by the manufacturer in their product literature and must not adversely affect any aspect of the performance of the light fitting or any form of lamp that may be fitted to that fitting.
11. Where the full re-instatement of thermal insulation option is used, the down-light or down-light in combination with a down-light thermal barrier must be certified by the manufacturer in accordance with AS/NZS 3000 as being suitable for operation when covered by thermal insulation material.
5. Minimum Installation Requirements
1. A person or entity undertaking this activity shall use best endeavours to ensure that any replacements are targeted at high usage luminaires in the first instance.
2. All equipment replaced shall be removed from the premises and not re-used.
3. Installed equipment shall not be connected to a transformer, dimmer, timer, motion sensor, daylight switch or other automated switch or control (or combination thereof) unless specified by the manufacturer as being compatible with such device or combinations of devices.
4. If connected to a dimmer, the installer shall test the equipment through its full dimming range to ensure that the equipment works to the satisfaction of the customer.
5. Where installed equipment causes sub-optimal operation, the installer shall either reinstall the original equipment (or equivalent replacement) or replace any components of the equipment that are causing the installation not to operate, at no expense to the resident. Such a request for reinstatement must be acted upon if made within 20 business days of the installation of the new equipment.
6. Other than for simple exchange of lamps within an existing fitting, installation is required by a licenced electrician (note an electrician may be required to be present for LED down-light lamp installation - this is under consideration).
7. The person undertaking this activity in a residential customer’s premises must satisfy the REES Code mandatory safety training requirements.
8. Re-instatement of ceiling insulation - the activity is only applicable to ceiling spaces already fitted with ceiling insulation of at least R1.5 and where the insulation around the pre-existing down-light does not already meet the requirements of “partial re-instatement”. The insulation used for re-instatement purposes must have an R value equal to or greater than the pre-existing ceiling insulation (minimum = R1.5)
9. Re-instatement of ceiling insulation - the activity can only be undertaken in ceilings that abut roofs (i.e. not internal ceilings such as between a ground floor and an upper floor of a two storey dwelling).

R 186
6. Activity default energy savings
The total Gigajoule energy (GJ) saved by fuel attributed to this activity per unit installed is:
Option Electricity (GJ saved)
Gas (GJ saved)
Firewood (GJ saved)
L2A1: Replacing a 35-50W ELV halogen lamp with an integral ELV LED lamp with rated power ≤10W
1.04
L2A2: Replacing a 35-50W ELV halogen lamp with an integral ELV LED lamp with rated power 11-15W
0.83
L2B1: Replacing a 35-50W ELV halogen lamp and transformer with an integral mains voltage LED lamp or mains voltage LED down-light luminaire with rated power ≤10W
1.10
L2B2: Replacing a 35-50W ELV halogen lamp and transformer with an integral mains voltage LED lamp or mains voltage LED down-light luminaire with rated power 11-15W
0.92
L2C1: Partial re-instatement of insulation (BCA Zones 4 & 5) (additional savings, only with L2B1 or L2B2)
0.07 0.09 0.18
L2C2: Full re-instatement of insulation (BCA Zones 4 & 5) (additional savings, only with L2B1 or L2B2)
0.12 0.16 0.32
L2C3: Partial re-instatement of insulation (BCA Zone 6) (additional savings, only with L2B1 or L2B2)
0.08 0.16 0.32
L2C4: Full re-instatement of insulation (BCA Zone 6) (additional savings, only with L2B1 or L2B2)
0.13 0.3 0.61
Options L2C1, L2C2, L2C3 & L2C4 are additional space conditioning savings that are added to the applicable lamp replacement Option L2B1 or L2B2 savings. Options L2C1 to L2C4 are NOT available with Options L2A1 or L2A2.
7. Guidance Notes (Informative only – not mandatory)
All reasonable endeavours should be undertaken to recycle removed equipment.

R 187
Replace Halogen Floodlight Luminaire - L3
Technical Assessment - L3
Replace Halogen Floodlight Luminaire
REES Activity Reference: L3 REES Activity title: Replace Halogen Floodlight Luminaire Target product: Halogen floodlights Savings: Activity saves energy directly through improved luminaire efficacy Pre-conditions: Pre-existing product must be halogen floodlight luminaire

R 188
Current REES Activity Description There is no current REES activity - this is a new activity.
Proposed REES Activity Description This activity involves replacing a halogen floodlight luminaire with an LED luminaire. Note that a linear halogen floodlight utilises a linear halogen lamp similar to Figure 15 below.
Figure 15: example of linear halogen lamp
Key Specification Changes Nil - this is a new activity. Important note regarding safety and EMC: There are safety and electromagnetic compatibility (EMC) issues associated with the installation of CFLs and LEDs, both with the products themselves and with the operation of these products once connected to existing circuitry such as dimmers and transformers. These issues are outside the scope of this study, which is to assess the energy saving aspects of CFLs and LEDs. DMITRE and ESCOSA should seek advice from the appropriate SA Government departments (these products are subject to state-specific safety regulations and practices) as to the suitability of various safety and EMC requirements for application to these products and to their installations. The proposed performance specifications in this report do not address safety and EMC of products or installations. They do however address compatibility with existing circuitry (from the point of view that the installed products should operate satisfactorily, not that they will be safety and EMC compliant once installed). The VEET scheme requires that all products installed meet state regulations, and also undertakes independent safety testing of VEET certified products40. The VEET scheme has also recently introduced requirements to ensure that an electrician is present during certain lighting installation activities41.
40
Refer: https://www.veet.vic.gov.au/Public/Pub.aspx?id=346 41
Refer: https://www.veet.vic.gov.au/Public/Pub.aspx?id=355
- N
DL
S S
TA
GE
6 R
EV
IEW
- FIN
AL
RE
PO
RT
-
13
Fig
ure 5
. Wall lu
min
aire
6 with
R7s la
mps a
nd cla
ss C la
mp lo
ck
-in effect
Fig
ure 6
. G9 la
mp lo
ck-in
effect an
d efficie
nt retro
fit lam
p restrictio
ns fro
m L
ED
i GU
9
(left, len
gth
MV
HL
G9
(left, length
68
mm
, dia
meter 2
8 m
m, w
eig
ht 3
2 g
, 460 lm
) versus
MV
HL
G9 (rig
ht, len
gth
43 m
m, d
iam
eter 14 m
m, 2
20 lm
)
Fig
ure 7
. R7s la
mp lo
ck-in
effe
ct an
d e
fficient re
trofit la
mp restrictio
ns fro
m C
FL
R7s (left,
length
) LE
Di R
7s(m
iddle) v
ersus M
V H
L R
7s (rig
ht)
6 Erg
o-le
uch
ten
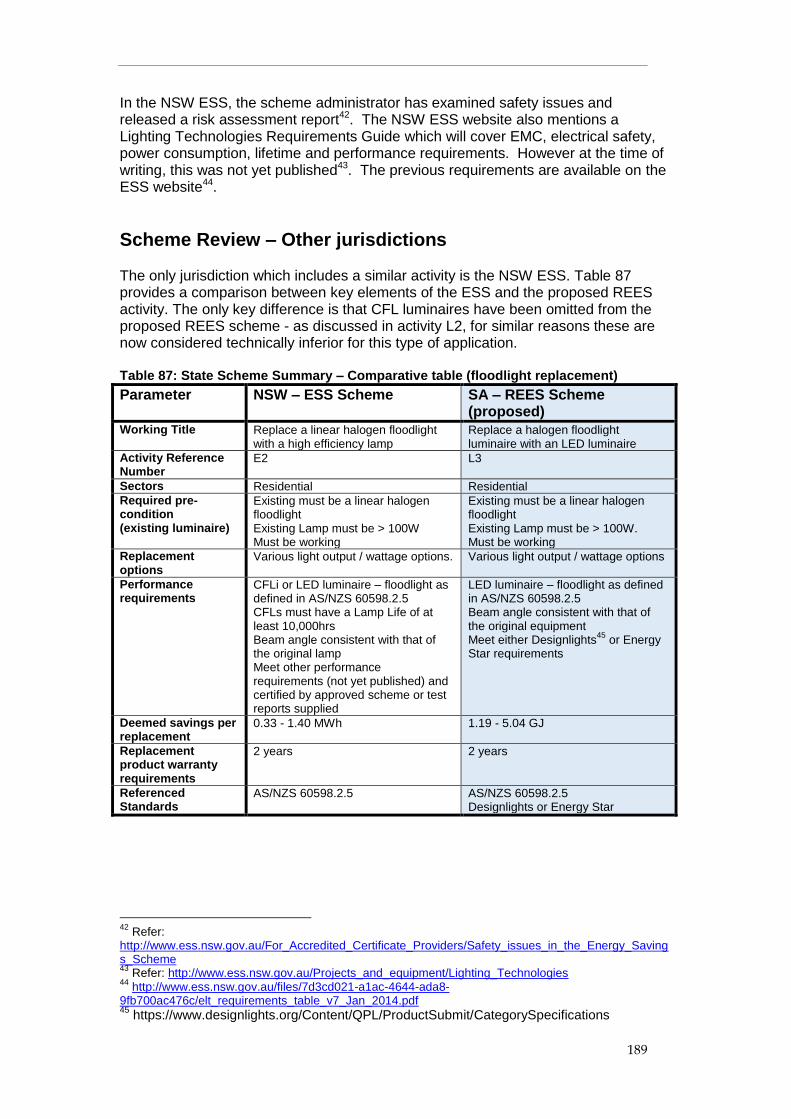
R 189
In the NSW ESS, the scheme administrator has examined safety issues and released a risk assessment report42. The NSW ESS website also mentions a Lighting Technologies Requirements Guide which will cover EMC, electrical safety, power consumption, lifetime and performance requirements. However at the time of writing, this was not yet published43. The previous requirements are available on the ESS website44.
Scheme Review – Other jurisdictions The only jurisdiction which includes a similar activity is the NSW ESS. Table 87 provides a comparison between key elements of the ESS and the proposed REES activity. The only key difference is that CFL luminaires have been omitted from the proposed REES scheme - as discussed in activity L2, for similar reasons these are now considered technically inferior for this type of application. Table 87: State Scheme Summary – Comparative table (floodlight replacement)
Parameter NSW – ESS Scheme SA – REES Scheme (proposed)
Working Title Replace a linear halogen floodlight with a high efficiency lamp
Replace a halogen floodlight luminaire with an LED luminaire
Activity Reference Number
E2 L3
Sectors Residential Residential
Required pre-condition (existing luminaire)
Existing must be a linear halogen floodlight Existing Lamp must be > 100W Must be working
Existing must be a linear halogen floodlight Existing Lamp must be > 100W. Must be working
Replacement options
Various light output / wattage options. Various light output / wattage options
Performance requirements
CFLi or LED luminaire – floodlight as defined in AS/NZS 60598.2.5 CFLs must have a Lamp Life of at least 10,000hrs Beam angle consistent with that of the original lamp Meet other performance requirements (not yet published) and certified by approved scheme or test reports supplied
LED luminaire – floodlight as defined in AS/NZS 60598.2.5 Beam angle consistent with that of the original equipment Meet either Designlights
45 or Energy
Star requirements
Deemed savings per replacement
0.33 - 1.40 MWh 1.19 - 5.04 GJ
Replacement product warranty requirements
2 years 2 years
Referenced Standards
AS/NZS 60598.2.5 AS/NZS 60598.2.5 Designlights or Energy Star
42
Refer: http://www.ess.nsw.gov.au/For_Accredited_Certificate_Providers/Safety_issues_in_the_Energy_Savings_Scheme 43
Refer: http://www.ess.nsw.gov.au/Projects_and_equipment/Lighting_Technologies 44
http://www.ess.nsw.gov.au/files/7d3cd021-a1ac-4644-ada8-9fb700ac476c/elt_requirements_table_v7_Jan_2014.pdf 45
https://www.designlights.org/Content/QPL/ProductSubmit/CategorySpecifications

R 190
Assessment Against Scheme Principles For this lighting activity, an assessment against the scheme objectives and principles is provided in Activity L1 (refer Table 78 and Table 79).
Energy Savings Calculation The ESS savings factors are broadly reasonable. These are based on the power of the incumbent light and the lighting installed, using (estimated) lifetime operating hours of 3650 (365 hours per annum over 10 years). Using these same inputs, the underlying assumptions used as the basis for the calculation of energy savings in this study are detailed in Table 88. Table 88: Energy Savings Estimate – Underlying Key Assumptions (Replace Floodlight
Luminaire)
Parameter Assumption
Baseline luminaire Floodlight: rated lamp power (no control gear)
Efficacy and savings Based on rated values (direct savings – replacement)
Total energy savings lifetime
3650 hours
Assumed usage See above.
Free riders N/A - likely to be very low
Compliance Assume none will remove (1.00)
Lifetime 3,650 hours
Energy savings in GJ are given in Table 89.
Table 89: GJ savings from replacement of halogen floodlight with LED luminaire
P = power of existing luminaire (W)
Initial light output of new luminaire (lm)
Rated power of installed luminaire
<30W <45W <60W <90W <150W
100 < P < 150W > 1,500 1.19
150 ≤ P < 200W ≥ 2,500 1.98 1.67
200 ≤ P < 300W ≥ 3,500 2.45 2.20
300 ≤ P < 500W ≥ 5,700 3.78 3.17
500 ≤ P ≥ 10,000 6.30 5.04
Note that all energy savings are from electricity.
Potential Compliance Issues The key compliance issue is ensuring that the replaced equipment (type and wattage, etc.) are as claimed. There are two possible approaches to this issue. Firstly, requiring a GPS and time-stamped photograph. Secondly, auditing the collected stockpiles of equipment removed. Both of these are likely to have some administrative cost for the installer (mainly related to tracking and storing photographs).

R 191
Replace Halogen Floodlight Luminaire Activity No.
L3
1. Activity Specific Definitions
Luminaire means apparatus which distributes, filters or transforms the light transmitted from one or
more lamps and which includes, except the lamps themselves, all the parts necessary for fixing and protecting the lamps and, where necessary, circuit auxiliaries together with the means for connecting them to the electric supply
2. Activity Description (Summary)
Replace a halogen floodlight luminaire with an LED luminaire. Note that lamp-only replacements and
modifications to existing luminaires are not included.
3. Activity Eligibility Requirements
4. All equipment that is replaced must be in working order immediately prior to removal.
5. Replaced equipment must be a linear halogen floodlight.
6. Replaced equipment must not be a portable floodlight - it shall be hard-wired into the premises.
7. Replaced equipment (lamp) must be rated > 100W.
4. Installed Product Requirements
The installed product shall—
6. Be installed at the time of removal of the existing equipment.
7. Have a measured average initial luminous flux of at least the corresponding* value in column 2 of the table below (verified by test report utilising test procedures as required by one of the programs below). *Note that this should correspond to the class of replaced luminaire.
8. Provide a minimum 2 years replacement warranty.
9. Meet either US Energy Star specification for luminaires V1.2 or Designlights46
Technical Requirements Table v2.1 by providing current proof of program certification or by providing test reports from a NATA
47 or Energy Star recognised laboratory demonstrating that the model meets
the requirements of one of the above specifications (test procedures as required by the relevant program). Alternatively, the LED luminaire can be approved by the NSW ESS scheme.
5. Minimum Installation Requirements
5. A person or entity undertaking this activity shall use best endeavours to ensure that any replacements are targeted at high usage luminaires in the first instance.
6. All equipment replaced shall be removed from the premises and not re-used.
7. Installed equipment shall not be connected to a transformer, dimmer, timer, motion sensor, daylight switch or other automated switch or control (or combination thereof) unless specified by the manufacturer as being compatible with such device or combinations of devices.
8. If connected to a dimmer, the installer shall test the equipment through its full dimming range to ensure that the equipment works to the satisfaction of the customer.
9. Where installed equipment causes sub-optimal operation, the installer shall either reinstall the original equipment (or equivalent replacement) or replace any components of the equipment that are causing the installation not to operate, at no expense to the resident. Such a request for reinstatement must be acted upon if made within 20 business days of the installation of the new equipment.
10. Installation is required by a licenced electrician.
11. The person undertaking this activity in a residential customer’s premises must satisfy the REES
Code mandatory safety training requirements.
46
https://www.designlights.org/Content/QPL/ProductSubmit/CategorySpecifications 47
NATA = National Association of Testing Authorities. Laboratory can be NATA-accredited or NATA-recognised by Mutual Recognition Agreements within APLAC (www.aplac.org/aplac_mra.html) or ILAC (www.ilac.org/ilacarrangement.html)

R 192
6. Activity default energy savings
The total Gigajoule energy (GJ - electricity) saved attributed to this activity per unit installed is:
P = power of existing luminaire (W)
Replacement luminaire (light output and rated power)
Minimum luminaire light
output (lm) ≤30W ≤45W ≤60W ≤90W ≤150W
100 < P < 150W 1,500 1.19
150 ≤ P < 200W 2,500 1.98 1.67
200 ≤ P < 300W 3,500 2.45 2.20
300 ≤ P < 500W 5,700 3.78 3.17
500 ≤ P 10,000 6.30 5.04
7. Guidance Notes (Informative only – not mandatory)
All reasonable endeavours should be undertaken to recycle removed equipment.

R 193
Replace Linear Fluorescent Luminaire - L4
Technical Assessment - L4
Replace Linear Fluorescent Luminaire
REES Activity Reference: L4 REES Activity title: Replace Linear Fluorescent Luminaire Target product: Linear Fluorescent (T8/T12) luminaires Savings: Activity saves energy directly through improved luminaire efficacy Pre-conditions: Pre-existing product must be linear fluorescent luminaire

R 194
Current REES Activity Description There is no current REES activity - this is a new activity.
Proposed REES Activity Description This activity involves replacing a T8 or T12 fluorescent luminaire with a T5 fluorescent luminaire or LED luminaire.
Key Specification Changes Nil - this is a new activity. Broadly based on ESS (NSW) specification. Important note regarding safety and EMC: There are safety and electromagnetic compatibility (EMC) issues associated with the installation of CFLs and LEDs, both with the products themselves and with the operation of these products once connected to existing circuitry such as dimmers and transformers. These issues are outside the scope of this study, which is to assess the energy saving aspects of CFLs and LEDs. DMITRE and ESCOSA should seek advice from the appropriate SA Government departments (these products are subject to state-specific safety regulations and practices) as to the suitability of various safety and EMC requirements for application to these products and to their installations. The proposed performance specifications in this report do not address safety and EMC of products or installations. They do however address compatibility with existing circuitry (from the point of view that the installed products should operate satisfactorily, not that they will be safety and EMC compliant once installed). The VEET scheme requires that all products installed meet state regulations, and also undertakes independent safety testing of VEET certified products48. The VEET scheme has also recently introduced requirements to ensure that an electrician is present during certain lighting installation activities49. In the NSW ESS, the scheme administrator has examined safety issues and released a risk assessment report50. The NSW ESS website also mentions a Lighting Technologies Requirements Guide which will cover EMC, electrical safety, power consumption, lifetime and performance requirements. However at the time of writing, this was not yet published51. The previous requirements are available on the ESS website52.
48
Refer: https://www.veet.vic.gov.au/Public/Pub.aspx?id=346 49
Refer: https://www.veet.vic.gov.au/Public/Pub.aspx?id=355 50
Refer: http://www.ess.nsw.gov.au/For_Accredited_Certificate_Providers/Safety_issues_in_the_Energy_Savings_Scheme 51
Refer: http://www.ess.nsw.gov.au/Projects_and_equipment/Lighting_Technologies 52
http://www.ess.nsw.gov.au/files/7d3cd021-a1ac-4644-ada8-9fb700ac476c/elt_requirements_table_v7_Jan_2014.pdf

R 195
Scheme Review – Other jurisdictions The only jurisdiction which includes a similar activity is the NSW ESS. Table 90 provides a comparison between key elements of the ESS and the proposed REES activity. Table 90: State Scheme Summary – Comparative table (linear fluorescent luminaire replacement)
Parameter NSW – ESS Scheme SA – REES Scheme (proposed)
Working Title Replace a T8 or T12 luminaire with a T5 luminaire or LED luminaire.
Replace Linear Fluorescent Luminaire
Activity Reference Number
E4 and E5 L4
Sectors Residential Residential
Required pre-condition (existing luminaire)
Must be an existing 2 foot, 3 foot, 4 foot, or 5 foot T8 or T12 Luminaire Must be working
Must be an existing 2-foot or 4-foot T8 or T12 fluorescent luminaire Must be working
Replacement options
Various lamp length / light output / wattage options.
Luminaire replacement only Various lamp length / light output / wattage options Allows twin lamp replacement with single lamp where feasible T5 Adaptor kits or retrofit T5/LED lamps are not permitted
Performance requirements
T5 or LED linear fluorescent luminaire. Not T5 Adaptor kit or retrofit T5/LED. Length consistent with existing luminaire, lamp Life ≥ 20,000hrs. Meet other performance requirements (not yet published) and certified by approved scheme or test reports supplied.
T5 or LED linear fluorescent luminaire Length consistent with existing luminaire LED and T5 luminaire: demonstrated equivalent light output to the luminaire being replaced LED luminaire: meet Designlights
53
requirements Fluorescent lamps must have a rated life of at least 20,000 hours.
Deemed savings per replacement
0.1 - 0.26 MWh 0.4 - 2.09 GJ
Replacement product warranty requirements
2 years 2 years
Referenced Standards
Designlights, AS/NZS4782.2
Assessment Against Scheme Principles For this lighting activity, an assessment against the scheme objectives and principles is provided in Activity L1 (refer Table 78 and Table 79).
Energy Savings Calculation The ESS savings factors are broadly reasonable. These are based on the power of the incumbent luminaire and the luminaire installed, using (estimated) lifetime operating hours of 10,000 hours (1,000 hours per annum over 10 years). Using these same inputs, the underlying assumptions used as the basis for the calculation of energy savings in this study are detailed in Table 91.
53
https://www.designlights.org/Content/QPL/ProductSubmit/CategorySpecifications

R 196
Table 91: Energy Savings Estimate – Underlying Key Assumptions (Replace Linear
Fluorescent Luminaire)
Parameter Assumption
Baseline luminaire Fluorescent: rated lamp power + magnetic ballast losses (rated)
Efficacy and savings Based on rated values (direct savings – replacement)
Total energy savings lifetime
10,000 hours
Assumed usage See above.
Free riders N/A - likely to be very low
Compliance Assume none will remove (1.00)
Lifetime 10,000 hours
The proposed REES activity differs slightly from the ESS activity, in that it allows single-lamp luminaires to replace twin-lamp luminaires, where feasible. Another difference is that NSW also covers 3 foot and 5 foot lamps, whereas the proposed REES specification only covers 2 foot and 4 foot lamps. In practical terms, it is expected that there will be negligible stock of 3 foot and 5 foot lamps in the residential sector, so removal of these options simplifies the requirements. Total luminaire power for each luminaire is calculated from AS/NZS 4783.2. T8 lamps are used as the basis for calculations (i.e. not T12) in order to reduce the complexity of having a separate category for T12. Power values used are as follows:
2-foot luminaires: o Single-lamp T8/T12 (600mm): 26W o Twin-lamp T8/T12 (600mm): 52W o Single-lamp T5 (550mm): 15W o Twin-lamp T5 (550mm): 30W
4-foot luminaires: o Single-lamp T8/T12 (1200mm): 44W o Twin-lamp T8/T12 (1200mm): 88W o Single-lamp T5 (1150mm): 30W o Twin-lamp T5 (1150mm): 60W
The results are shown in Table 92 for 2-foot luminaires and Table 93 for 4-foot luminaires.
Table 92: Energy savings (GJ) from replacement with T5/LED luminaire (2-foot)
Replacement 2-foot Luminaire
Existing 2-foot Luminaire
Minimum luminous
flux
≤ 10W ≤ 15W ≤ 20W ≤ 25W ≤ 30W ≤ 35W
Single-lamp T8/T12 (~26W) 1,000 0.58 0.40 - - - -
Twin-lamp T8/T12 2,000 - 1.33 1.15 0.97 0.79 0.61

R 197
Table 93: Energy savings (GJ) from replacement with T5/LED luminaire (4-foot)
Replacement 4-foot Luminaire
Existing 4-foot Luminaire
Minimum luminaire
light output
≤ 20W
≤ 25W
≤ 30W
≤ 35W
≤ 40W
≤ 45W
≤ 50W
≤ 55W
≤ 60W
Single-lamp T8/T12
2,200 0.86 0.68 0.50 - - - - - -
Twin-lamp T8/T12
4,400 - - 2.09 1.91 1.73 1.55 1.37 1.19 1.01
Note that all energy savings are from electricity.
Potential Compliance Issues The key compliance issue is ensuring that the replaced equipment (type and wattage, etc.) are as claimed. There are two possible approaches to this issue. Firstly, requiring a GPS and time-stamped photograph. Secondly, auditing the collected stockpiles of equipment removed. Both of these are likely to have some administrative cost for the installer (mainly related to tracking and storing photographs).

R 198
Replace Linear Fluorescent Luminaire Activity No.
L4
1. Activity Specific Definitions
Luminaire means apparatus which distributes, filters or transforms the light transmitted from one or
more lamps and which includes, except the lamps themselves, all the parts necessary for fixing and protecting the lamps and, where necessary, circuit auxiliaries together with the means for connecting them to the electric supply
2. Activity Description (Summary)
Replace a T8 or T12 fluorescent luminaire with a T5 fluorescent luminaire or LED luminaire. Note that lamp-only replacements and modifications to existing luminaires (such as T5 adaptor kits or retrofit T5/LED lamps) are not included.
3. Activity Eligibility Requirements
1. All equipment that is replaced must be in working order immediately prior to removal.
2. Replaced equipment must be a 2-foot or 4-foot T8 or T12 fluorescent luminaire.
4. Installed Product Requirements
The installed product shall—
1. Be installed at the time of removal of the existing equipment.
2. Have a measured average initial luminous flux of at least the corresponding* value in column 2 of the table below (verified by test report utilising test procedures as required by one of the programs below). *Note that this should correspond to the class of replaced luminaire.
3. Provide a minimum 2 years replacement warranty.
4. LED luminaires shall meet the Designlights54
Technical Requirements Table v2.1 by providing current proof of program certification or by providing test reports from a NATA
55 or Energy Star
recognised laboratory demonstrating that the model meets the requirements of the above specification (test procedures as required by the program). Alternatively, the LED luminaire can be approved by the NSW ESS scheme.
5. Fluorescent lamps shall have a rated life of at least 20,000 hours.
5. Minimum Installation Requirements
1. A person or entity undertaking this activity shall use best endeavours to ensure that any replacements are targeted at high usage luminaires in the first instance.
2. All equipment replaced shall be removed from the premises and not re-used.
3. Installed equipment shall not be connected to a transformer, dimmer, timer, motion sensor, daylight switch or other automated switch or control (or combination thereof) unless specified by the manufacturer as being compatible with such device or combinations of devices.
4. If connected to a dimmer, the installer shall test the equipment through its full dimming range to ensure that the equipment works to the satisfaction of the customer.
5. Where installed equipment causes sub-optimal operation, the installer shall either reinstall the original equipment (or equivalent replacement) or replace any components of the equipment that are causing the installation not to operate, at no expense to the resident. Such a request for reinstatement must be acted upon if made within 20 business days of the installation of the new equipment..
6. Installation is required by a licenced electrician.
7. The person undertaking this activity in a residential customer’s premises must satisfy the REES Code mandatory safety training requirements.
54
https://www.designlights.org/Content/QPL/ProductSubmit/CategorySpecifications 55
NATA = National Association of Testing Authorities. Laboratory can be NATA-accredited or NATA-recognised by Mutual Recognition Agreements within APLAC (www.aplac.org/aplac_mra.html) or ILAC (www.ilac.org/ilacarrangement.html)

R 199
6. Activity default energy savings
The total Gigajoule energy (GJ - electricity) saved attributed to this activity per unit installed is:
GJ savings from replacement of with T5/LED luminaire (2-foot)
Replacement luminaire (light output and rated power)
Existing 2-foot Luminaire
Minimum luminaire
light output (lm)
≤ 10W ≤ 15W ≤ 20W ≤ 25W ≤ 30W ≤ 35W
Single-lamp T8/T12 1,000 0.58 0.40 - - - -
Twin-lamp T8/T12 2,000 - 1.33 1.15 0.97 0.79 0.61
GJ savings from replacement of with T5/LED luminaire (4-foot)
Existing 4-foot Luminaire
Replacement luminaire (light output and rated power)
Minimum luminaire
light output (lm)
≤ 20W
≤ 25W
≤ 30W
≤ 35W
≤ 40W
≤ 45W
≤ 50W
≤ 55W
≤ 60W
Single-lamp T8/T12
2,200 0.86 0.68 0.50 - - - - - -
Twin-lamp T8/T12
4,400 - - 2.09 1.91 1.73 1.55 1.37 1.19 1.01
7. Guidance Notes (Informative only – not mandatory)
All reasonable endeavours should be undertaken to recycle removed equipment.

R 200
Standby Power Controllers - SPC1 & SPC2
Technical Assessment – SPC1 and SPC2
SPC1 Install Standby Power Controllers - Audio Visual (AV)
SPC2 Install Standby Power Controllers – Information Technology (IT)
REES Activity Reference: SPC1 REES Activity title: Install Standby Power Controllers - Audio Visual (AV) Target product: any audio visual products Savings: Activity saves energy indirectly by reducing energy in products connected to the SPC Pre-conditions: None
REES Activity Reference: SPC2 REES Activity title: Install Standby Power Controllers – Information Technology (IT) Target product: any information technology products Savings: Activity saves energy indirectly by reducing energy in products connected to the SPC Pre-conditions: None

R 201
Current REES Activity Description While there are significant differences between AV and IT SPCs, they are reviewed together as there are many common components. This activity currently forms part of the REES scheme code56 . The current summary description within the REES scheme code is as follows: “Install a standby power controller to automatically reduce the standby energy consumption of residential audio visual equipment (standby power controller (AV)).” “Install a standby power controller to automatically reduce the standby energy consumption of residential information technology equipment (standby power controller (IT)).” For an AV SPC, this activity covers the installation of a standby power controller (SPC) in a situation where two or more audio visual devices can be controlled by the SPC. For an IT SPC, this activity covers the installation of a standby power controller (SPC) in a situation where two or more information technology devices can be controlled by the SPC. This activity covers the installation of new equipment (SPCs) that saves energy in other devices (while consuming some energy itself to do so). So the energy savings are indirect and depend on the characteristics of the devices that are controlled and the associated user interaction with those devices. Minimum performance specifications are set out for SPCs in the REES code. These cover compliance with relevant Australian Standards (none are specifically referenced), can control up to 4 appliances, can operate for 50,000 switching cycles, consumes less than 1 W of power, automatically disconnects and reconnects power either as master/slave (normal for IT) or on the basis of infra-red signals (normal for advanced AV), works with all remote controls and does not require manual setting of power thresholds. Installation requirements in the current REES Code state:
At least 2 devices must be controlled at the time of installation
No more than 4 SPCs can be installed (under REES) in any one premises (AV and IT SPCs combined)
Can be reinstalled if there are new occupants
Best endeavours are required to target higher usage applications first. Credits earned are dependent on the level of savings listed by the Essential Services Commission (Victoria) and range from 0.6 tonnes CO2-e to as much as 5.4 tonnes CO2-e. These savings are assessed by the result of field trials with the results adjusted by an algorithm to normalise the results. The majority of AV SPCs earn 2.7 or 3.6 tonnes CO2-e while the majority of IT SPCs earn 1.8 tonnes CO2-e.
Proposed REES Activity Description The proposed activity description is as follows:
56
RESIDENTIAL ENERGY EFFICIENCY SCHEME CODE REESC/07 February 2014

R 202
“Install a standby power controller to automatically reduce the standby energy consumption of residential audio visual equipment (standby power controller (AV)).” “Install a standby power controller to automatically reduce the standby energy consumption of residential information technology equipment (standby power controller (IT)).” For an AV SPC, this activity covers the installation of a standby power controller (SPC) in a situation where two or more audio visual devices can be controlled by the SPC. For an IT SPC, this activity covers the installation of a standby power controller (SPC) in a situation where two or more information technology devices can be controlled by the SPC. This activity covers the installation of new equipment (SPCs) that saves energy in other devices (while consuming some energy itself to do so). So the energy savings are indirect and depend on the characteristics of the devices that are controlled and the associated user interaction with those devices. Minimum performance requirements are set out in the activity specification. These cover compliance with relevant Australian Standards (none are specifically referenced), can control up to 4 appliances, can operate for 50,000 switching cycles, consumes less than 1 W of power, automatically disconnects and reconnects power either as master/slave (normal for IT) or on the basis of infra-red signals (normal for advanced AV), works with all remote controls and does not require manual setting of power thresholds. Installation requirements are as follows:
At least 2 devices must be controlled at the time of installation
A maximum of 1 IT SPC may installed in any one premises
Not more than 3 SPCs can be installed (under REES) in any one premises (AV and IT SPCs combined)
Can be reinstalled if there are new occupants
Best endeavours are required to target higher usage applications first. Table 94: Default Energy Savings – standby power controllers Activity Description – type installed Electricity (GJ saved)
Advanced AV SPC installed on the main television 2.0 Advanced IT SPC installed in a personal computer 2.0 Advanced SPC (any type) installed on any other equipment not specified above
1.5
Simple SPC installed on any equipment type 1.0 Notes: An advanced AV SPC shall meet the current requirements of Class 2A, 2B, 3A, 3B, 4A, 4B, 5A, 5B, 6A or 6A An advanced IT SPC shall meet the current requirements of Class 2A, 2B, 3A, 3B, 4A, 4B, 5A, 5B, 6A or 6A A simple SPC shall meet the current requirements of Class 1A, 1B or 1C Abatement levels referenced are prior to VEET adjustments applied on 7 October 2013.
Key Specification Changes After detailed analysis and review, some major changes are recommended regarding the specifications for standby power controllers. The most significant change recommended is a revision to the energy savings credits earned through their installation. Most other aspects of the specification remain in place with a few small adjustments.

R 203
Many aspects of the specification should remain unchanged, specifically:
Current design and performance specification should remain unchanged;
SPCs must be connected to at least 2 controlled appliances at the time of installation;
A person or entity undertaking this activity shall use best endeavours to ensure any installations are targeted at high usage applications in the first instance.
Changes are proposed for:
A maximum of 1 IT SPC may installed in any one premises (previously up to 4 could be installed)
Not more than 3 SPCs can be installed (under REES) in any one premises (AV and IT SPCs combined) (previously up to 4 could be installed).
The default energy savings factors are significantly reduced from the current levels to reflect more accurately the likely savings in an average household during normal use.
Scheme Review – Other jurisdictions The following jurisdictions also include SPC activity within their schemes:
Victoria: VEET Schedule 29A – Standby power controllers (IT SPCs) in residential premises (also covers business premises)
Victoria: VEET Schedule 29B – Standby power controllers (AV SPCs) in residential premises (also covers business premises)
NSW – no activity covers this product
ACT Part 5.5: Install a standby power controller (covers AV and IT SPCs) Both South Australia and ACT both mirror the Victorian VEET requirements for standby power controllers in broad terms. The Victorian and ACT schemes cover business premises as well as residential while REES only covers residential. The Victorian scheme (VEET) specifies a default abatement for a complying product (1 tonne). For products that can demonstrate at least 1.5 tonnes of abatement to the satisfaction of the Essential Services Commission of Victoria (ESC) through field trials and standardisation of the results, abatement of up to 6 tonnes is permitted. The Victorian ESC explains that the deemed abatement for each specific brand/model of advanced SPC is determined using the following steps:
1. Analysing the energy saving results of the specific SPC in a field trial (using a methodology approved by the ESC)
2. Normalising the field trial results to account for variation in the appliance use of trial participants compared to the average appliance penetration and usage in Victorian homes, and
3. Applying an algorithm which calculates the normalised deemed energy savings to lifetime emission abatement per SPC.
The exact normalisation process and algorithm is not in the public domain and the results of the algorithm is an area of some debate. Issues regarding these points will be examined below in the analysis of this activity. ACT (EEIS) more or less mirrors the Victorian requirements, except that the base abatement is 0.8 tonnes (reflecting the lower greenhouse intensity in the ACT) but it

R 204
also allows for abatement demonstrated by field trials from 1.5 to 6 tonnes (this is then adjusted by 0.8 when applied to the ACT – this is not explicitly noted in the determination). This has to be demonstrated to satisfaction of the ACT Administrator (ACT accept Victoria ESC approvals without further review). This is effectively the same as the Victorian abatement but with an abatement adjustment of 0.8 to reflect ACT emission intensity. To date there have been no ACT field trials conducted. South Australia (REES) has the same specifications as Victoria but they explicitly cede approval of the SPC credits to be those specified by the Victorian ESC. The credits are scaled down slightly to reflect the difference in emission intensity between South Australia and Victoria. Given that the Victorian Government has announced its intention to close VEET by the end of 2015, this is an operational issue that needs to be addressed by ACT and South Australia if this activity is to continue. As part of a review of VEET savings to date in 2013, EES undertook a detailed review of the energy calculations used for several schedules in VEET including SPCs (Schedule 29A and 29B) (EES 2013b). Following this review, the Victorian ESC issued a memorandum on 20 September 2013 regarding an adjustment to the SPC abatement factors under VEET (ESC 2013). The changes detailed formally commenced on Monday 7 October 2013. In summary, the abatement factors for SPCs were adjusted as follows:
Advanced AV SPCs are to be scaled by 0.55 of the current value;
Advanced IT SPC are to be scaled by 0.62 of the current value. This is an important change as SPCs made up almost 75% of all VEET credits in recent years (and 70% of REES credits in 2013). These changes to SPC credits have already been reflected in the REES requirements for South Australia. ACT are phasing a downgrade of SPC credits as follows: • To 30 June 2014 the original abatement factors will continue to apply; • From 1 July 2014 to 31 December 2014, adjustment factors of 0.66 for AV
SPCs and 0.905 for IT SPCs will be applied to existing abatement factors; • From 1 January 2014, adjustment factors of 0.55 for AV SPCs and 0.62 for IT
SPCs will be applied to existing abatement factors (same as VEET adjustments).
Table 95 below provides a comparison of the key elements of standby power controller installation in each jurisdiction.

R 205
Table 95: State Scheme Summary – Comparative table for standby power controllers
Parameter SA – REES Scheme (current)
VIC – VEET Scheme *
NSW – ESS Scheme
ACT – EEIS Scheme SA – REES Scheme (proposed)
Working Title Install standby power controllers – audio visual (AV) environment, install standby power controllers – information technology (IT) environment
Installing a standby power controller
No activity Install a standby power controller
Install standby power controllers – audio visual (AV) environment install standby power controllers – information technology (IT) environment
Activity Reference Number
N/A Schedule 29A (IT) Schedule 29B (AV)
N/A Parts 5.5 SPC1, SPC2
Required pre-condition None None None None
Installation requirements ≥2 devices connected per SPC maximum of 4 SPCs per house
≥2 devices connected per SPC maximum of 4 SPCs per house
≥2 devices connected per SPC maximum of 4 per house (1)
≥2 devices connected per SPC maximum of 3 SPCs per house Maximum one SPC (IT) per house
Performance requirements
Controls up to 4 appliances operates for 50,000 cycles consumes less than 1 W master/slave or IR works with all remote controls doesn’t require threshold setting
Controls up to 4 appliances operates for 50,000 cycles consumes less than 1 W master/slave or IR works with all remote controls doesn’t require threshold setting
Controls up to 4 appliances operates for 50,000 cycles consumes less than 1 W master/slave or IR works with all remote controls doesn’t require threshold setting
Controls up to 4 appliances operates for 50,000 cycles consumes less than 1 W master/slave or IR works with all remote controls doesn’t require threshold setting
Deemed savings per replacement
Default base 0.7 t, up to 5.5 t if demonstrated by field trials (as per VIC ESC)
Default base 1.0 t, up to 6 t if demonstrated by field trials (ESC algorithm)
Default base 0.8 t, up to 6 t if demonstrated by field trials (how not specified) (2)
Default energy savings of 2 GJ electricity for advanced SPC installed on a main TV or PC, 1.5 GL for an advanced SPC installed on any other equipment, 1 GJ for a simple SPC (qualified by field trials (as per VIC ESC)
Replacement product warranty requirements
Nil Nil Nil Nil
Referenced Standards None relevant None relevant None relevant None relevant
Notes: Requirements are very complex have been simplified for this table. * All VEET specifications have different emission factors for metropolitan versus regional installations (1) ACT regulations do not state this maximum, but this has been confirmed with ACT administrators. (2) ACT appear to accept Victorian ESC approved abatement levels adjusted for ACT emission intensity.

R 206
Scheme Review - Potential of the activity (overview) Standby Power Controllers are an intermediate device that is installed in the home or in other places to save power in an appliance and associated devices when the main appliance is not in use. They do not save any energy directly (in fact they consume small amounts of energy themselves), but they can reduce standby power in all connected devices and in some cases can reduce on mode power waste as well. Audio visual standby power controllers (AV SPCs) work in two main ways. Firstly, they eliminate standby power of a main appliance when it is not in use as well as the standby power of any associated devices that are also connected to the board. This works best if the associated devices are only used when the main device is operated (i.e. the associated devices are not normally used independently). Secondly, in the case of advanced AV SPCs, they examine infra-red signals associated with remote control activity. This can be anything such as a change of channel, volume change, mute or any other signal. Most are configured to operate so that where there has been no infra-red signal for 1 hour, then it flashes a light to warn the user that the main device is about to be disconnected. If there is no infra-red signal within a defined period (few minutes) the main appliance and associated devices are disconnected by the standby power board. One supplier of AV SPCs (Embertec) provides a board that has an adjustable time-out setting (1, 2 or 3 hours). Information technology standby power controllers (IT SPCs) also work in two main ways. Firstly, they eliminate standby power of a computer when it is not in use as well as the standby power of any associated devices that are also connected to the board. This works best if the associated devices are only used when the main device is operated (i.e. the associated devices are not normally used independently). Advanced boards are able to turn off peripherals when the computer enters sleep mode – obviously, power to the computer has to be maintained during sleep. Very advanced boards claim to be able to turn off peripherals when the computer is in idle mode (on but not performance any active functions). Under the VEET requirements, a simple board is assumed to save a relatively low amount of power because they only reduce standby of the main appliance and the associated devices. To establish the performance of more advanced AV SPCs that track infra-red traffic, the Victorian Essential Services Commission requires field trials to benchmark field performance. The results of the field trials are then put through an algorithm to correct the energy savings back to standard usage conditions as well as a standard number and type of devices attached. The main part of the energy savings for more advanced boards is the reduction of so called “idle” time – operation of the main appliance (normally a television) that is operated for longer than 1 hour without any remote infra-red activity – this is assumed to be energy that can be saved. The same overall principles apply to IT SPCs, except the savings are somewhat less as the power to the computer cannot be disconnected when in sleep or idle mode, so only power to associated peripherals can be saved in advanced boards. The potential of this activity is large, in that standby power is a significant part of total household energy in Australian homes, making up around 80W per average house in 2010 (EES 2011). In Victoria, AV and IT SPCs have been installed in more than 1.2 million homes (out of a total of 2.2 million homes in Victoria) (around 80% of all boards installed in Victoria have been AV SPCs). AV SPCs have been installed at an average rate of almost 2 boards per house in the period 2011 to 2013 inclusive (calendar years) and IT boards at around 1.1 per house (VEET 2014). The rate of

R 207
installation in South Australia has also been very high, with 78,000 AV SPCs and 25,000 IT SPCs installed in 2012 and 2013 (ESCOSA 2014) out of a total of around 700,000 households in South Australia. Historically, this activity has tended dominate the REES activities provided by service providers, possibly to the detriment of other activities (as this activity is relatively quick and inexpensive to provide). SPCs in total (AV and IT types) made up about 70% of all credits earned in South Australia in 2013 (comparable to the share of all activity in Victoria). The installation of SPCs has dominated total activity and savings in Victoria and South Australia for the past few years, so it is important that the underlying assumptions and calculations be appraised.
Assessment Against Scheme Principles This activity aligns with all major policy objectives.
Table 96: Activities Alignment with Policy Objective - standby power controllers
Policy Objective Reduces household and/or business energy use Provides a focus on low income households
Associated Objectives: Provides greenhouse gas emission benefits
Provides energy cost benefits
The following table provides an assessment of the activity against the new principles proposed for REES code. Table 97: Alignment with REES General Principles - standby power controllers
Principle Assessment
1. Provides evidence based energy savings
The basis for energy savings associated with this activity are usually established via field trials. The energy savings associated with this activity have been adjusted down based on a full appraisal of available data. The devices are suitable for installation in a wide range of households and can save some energy.
2. Energy savings are additional to base case (BAU) and minimises free riders
SPCs are likely to save energy in other equipment when installed compared to an absence of SPCs. SPCs are unlikely to exist in the market without incentives from programs like REES. No other programs encourage their installation. There are no regulatory requirements mandating SPCs. So all savings are additional to the base case and there are no free riders.
3. Reward best practice in relation to product performance
These devices all work using similar principles. Field trials differentiate advanced SPCs through the measured savings achieved in practice and these are rewarded with higher default savings factors.
4. Provides a means for ensuring quality assurance and participant satisfaction
Specifications set performance requirements. Further work is required to establish ongoing participant satisfaction and persistence of the devices in the field.
5. Credible approach for the calculation of energy savings
Field trials establish the basic performance of the devices. Energy savings have been adjusted to be in line with typical configurations across a range of houses. Further research could establish more reliable data in this respect.
6. Provides scope for objective, cost effective and practical auditing
Installation of equipment as part of the activity is simple and easy to audit (even has the potential for telephone audits).
7. Good practice Specifications set out guidelines for installation.

R 208
Principle Assessment
8. Harmonisation (as far as practical)
This activity is available in ACT and Victoria (not NSW). Both of these jurisdictions use the same requirements as REES. Victoria and South Australia have recently downgraded the credits for SPCs following a review in Victoria in 2013. ACT is downgrading their credits in 2014 to match the Victorian levels by 2015. So the three jurisdictions are largely in terms of installation and performance. REES defaults savings are now lower than other states.
9. Safety and minimising overall risk
As an intermediate device, SPCs pose a low safety risk if installed in accordance with specifications and guidelines. They do not change the safety characteristics of connected devices.
Energy Savings - Review Overview of methodology The first element of analysis is to understand the current requirements for SPCs and to critique the approach used to estimate the current energy savings and emission credits. A range of data sources are cited in order to assess the current assumptions. The second part of the analysis pulls together the best available data sources in order to reassess the likely savings from SPCs in a number of different situations in a normal home. Referenced data sources are provided. The underlying assumptions used as the basis for the calculation of energy savings in this study are detailed in Table 98.
Table 98: Energy Savings Estimate – Underlying Key Assumptions (SPCs)
Parameter Value Basis / Comment
Energy Service Levels No assumptions regarding existing equipment is required
N/A
Base Case Assumptions Devices per SPC 2.5 Minimum specification is 2 (includes master)
Power of devices connected 4.7 W for AV 2.9 W for IT
Based on intrusive survey (EES 2011). Lower values used for televisions
TV idle time 1.3 h/day Assumptions set out in analysis (0.3 h/day for secondary televisions)
TV on time 5.5 h/day Includes idle time, main TV, 1.5 h/day for secondary televisions
TV on power 110 W Stock average, falling rapidly
PC use per day 1.5 h/day Decline in desktop ownership, increase in use of laptops and tablets
PC power on mode 115 W
SPC parasitic power 1 W Based on measurements of various models, specification is max 1 W
REES Activity Assumptions
Ownership 2 AV/house 1.2 IT/house
Based on installation activity in Victoria and South Australia
Lifetime and persistence
Product lifetime 7 years
Probably optimistic given the rate of changeover in AV and IT equipment in a normal home, but retain for modelling purposes

R 209
Product persistence 0.8 AV 0.95 IT
Strong evidence to suggest a significant proportion of AV SPCs are removed by some users after some time. Values broadly based on Victorian survey data. SPCs are relatively easy to remove.
Adjustment Factors
Additionality discount factor 1.0 Not applicable there are no existing requirements covering the use or application of SPCs
Free rider discount 1.0 Not applicable as product would not be installed in the absence of REES
Rebound discount factor 1.0 Not applicable – energy services levels of controlled equipment likely to be unchanged or reduced by SPC
Compliance discount factor 0.95 Victorian survey data suggests that around 5% of boards are left as spares and may not be installed correctly
Total Discount factor 0.76 AV 0.9025 IT
Product of individual factors
Climatic Adjustments
Adjustments required? No Not applicable
Energy Savings Calculation Basis for Estimating Savings Assumptions used by ESC to calculate SPC abatement The concept of the Standby Power Controller is that the overall energy consumption is reduced as follows: Advanced AV SPC • A television is connected to the AV SPC – this is the master device; • A selection of other associated products that normally operate with the
television (e.g. set top box or DVD player) are connected to the SPC – these are slave devices;
• When the television is not in use, the SPC disconnects power from the television and the slave devices, thus eliminating standby power for all connected devices;
• When the television is on and there has been no remote control activity for one hour, the SPC turns the power off to the television and the slave devices – this is called the elimination of “idle” time. The assumption is that all idle time usage can be saved because the householder is not present and/or is not watching the television.
Advanced IT SPC • Depending on the configuration of the IT SPC, the board can disconnect
power to computer peripherals when the PC enters sleep mode; • Some boards claim to be able to disconnect power to computer peripherals
when the PC enters idle mode. The savings from the field trials are calculated as the reduction in total energy for the AV (or IT) equipment connected to the SPC site is made up of the reduction in standby power for all devices. For the AV SPCs the energy savings from reducing the time that the television spends in idle mode (TV on but is not being watched) is also counted towards the savings putting the television into idle mode. It is important

R 210
to note that the lion’s share of all boards installed are advanced SPCs with quite high credits. The ESC normalisation algorithm has the following assumptions: • Annual AV and IT energy use in the average household – 1,060 kWh/yr (AV)
and 346 kWh/yr (IT); • Total of 5.2 AV devices connected to boards and 4.5 IT devices connected to
boards in a standard house; • An average house will have 1.35 AV SPCs and 1.1 IT SPCs installed; • For AV units they increase the estimate by 5% to account for projected
increase in AV annual TV use (e.g. shift to larger screen TVs) and also discount by 2.6% to account for standby power regulations (yet to be implemented).
• For IT units they discount the savings by 1.5% to take into account future regulations (regulations for computers and monitors were introduced in 2013).
• The % savings from the field trial are applied to these figures to estimate the total annual energy savings in the average household;
• Television use without an SPC is assumed to be 8 hours per day, made up of 5 hours active viewing and 3 hours of “idle” time per day (on time where the SPC can turn off the television without affecting user energy service provision);
• The total energy savings are divided by the estimated average number of SPCs installed per house – 1.35 (AV) and 1.1 (IT) to estimate the annual energy savings per SPC.
The review of SPCs is broken into: • Number of devices connected to SPCs; • Base assumptions of AV and IT energy use; • Savings from field trials; • Idle time for AV devices. There is a large volume of information that has been examined for this review. The main issue to consider is the number of products with standby power, the likely standby power attributes of those products, and in practical terms how many of those products could reasonably be connected to standby power controllers in various situations. The savings from idle time for televisions is also carefully examined. Number of devices connected and their attributes The ESC normalisation algorithm assumes that there are an average of 1.35 AV SPCs per house and 5.2 devices connected per board. It also assumes 1.1 IT SPCs per house and 4.5 devices per board. This implies that an average house has about 7 AV devices in an average home that could be connected to an AV SPC and about 5 IT devices in an average home that could be connected to an IT SPC. EES examined data from the DCCEE standby audit of homes (EES 2011), which includes a complete inventory and power measurements on all appliances in 150 homes in 2010 (covering 10,000 appliances). The appliances found were classified by type and their standby attributes were measured. Based on a review of this data, it is estimated that the total number of devices per home that could be connected to a SPC is about 3 to 3.5 for both AV and IT equipment types (including televisions for AV SPCs) in an average home. It is unclear how the original ESC estimates of devices per SPC were made (or total devices per house), but this appears to be an overestimate based on available average household data (the ESC algorithm was

R 211
prepared before this survey was published). The assumed number of devices tends to overstate the energy consumed and that could be saved by all of these devices. Table 99: Summary of Data by Product Type from DCCEE Audit of Standby Power 2010
Type of Product Contribution
to Total
Standby W*
% Number of
Items per
Household
Average
Watts per
Item
Home Entertainment 26.1 31.9 5.5 4.7
Computer and Peripherals 25.6 31.3 5.2 4.9
Major Appliances 10.5 12.8 4.9 2.2
Monitoring and Continuous Appliances 9.5 11.6 5.0 1.9
Office and Communication Equipment 6.1 7.5 2.0 3.0
Other Items with a Standby Mode 3.5 4.3 1.5 2.4
External Power Supplies 0.5 0.6 1.5 0.3
Products using 0 Watts in Standby Mode** 12.6
Products Unplugged** 24.6
Products with no Standby Mode** 4.0
Total 81.8 66.8
Notes: Source EES 2011
* The numbers in this column show the contribution that each appliance category provides to the total standby
consumption of an average house. Only appliances that were found in a standby mode and that are using power are
included.
** Although appliances in these categories do not contribute to the standby consumption of an average house, the
table above shows their ownership – unplugged products are not included in the product category for connected
products.
There are some important caveats that need to be stated about the 2010 standby audit data in the table above. Firstly, there is currently rapid change in the market for some of these types of equipment and the data from 2010 will already be somewhat out of date. In particular, there is rapid change in the television market and also there is a strong decline in the use of desktop computers – these are being replaced to some extent laptops and tablets and to a lesser extent smart phones. So the following analysis needs to be considered in that context. The 2010 audit data suggests that at an absolute maximum, the standby energy per year for home entertainment equipment (more or less equivalent to Audio Visual under REES) is 229 kWh/year, and for computers and peripherals (more or less equivalent to Information Technology under REES) is 224 kWh/year. However, this has to be noted as a maximum possible value for standby power as this assumes that the equipment is in standby mode for the whole year (8760 hours). While this is a reasonable approximation for many infrequently used products, it does somewhat overstate the standby energy for some items that are used for significant periods (most notably televisions and to a lesser extent computers) because the hours in standby in any one year is 8760 minus the hours of use. As televisions and computers are usually the master control device for AV and IT standby power controllers (respectively), the hours of use of these products will define the maximum possible standby savings across all the connected products. A review of available data in EES (2008) showed that estimated hours of watching a television are around 2600 hours per year (7 hours per day or 29% of the year). If this value was accurate , this means that potential AV savings would be available 6160 hours per year, or about 0.7 of the above value (about 160 kWh/year). However, a wide range of field data collected for televisions suggests that an average use of around 5.5 hours per day is more typical (see below for more detail). There is another important consideration in terms of the appliances that could be connected to a SPC. For AV equipment (home entertainment) there were some 5.5 items per average house that were connected to mains power at the time of the audit with a standby power of 4.7 Watts per item (totalling 26.1W). Almost one third of the

R 212
home entertainment items are in fact related to stereos or other sound systems that are not connected to the television operation. Some of these audio devices could be included on a separate SPC if there was a suitable master device, but it would not make any sense to include them on the television SPC as the listening to the stereo would mean that the television would have to remain on. With audio, there is often no master device, so this is problematic. In the home entertainment area, about 0.7 devices (per average home) was a device that was designed to record video as programmed by the user: these account for 5W (20% of the total AV standby power). These types of devices have to remain connected to mains power at all times and cannot be included as slave devices on an SPC because they need to enter recording mode at predetermined times when the television may be off. These can include various hard disk (PVR) and DVD recorders, some pay TV set top boxes and media centres. Another issue is that not all AV equipment in a house is located in the same room. Some items (especially additional televisions and associated equipment) will be distributed across several rooms so cannot be connected to a single board. Based on this data, it is estimated that a maximum of 3.5 AV devices per home would be practical to attach to an SPC (including audio equipment) (using multiple boards). For computers and peripherals, in the 2010 audit there were again about 5.5 items per house (about 1 was disconnected from the mains). In terms of computers, there were about 2 items in addition to the computer that could normally be connected to an SPC with an average standby power of about 4 Watts, giving a potential controlled load of about 7.5W (including the computer). This includes monitors, computer speakers, external hard drives (in some cases) and printers. As with AV equipment, there is a raft of network equipment (modems, routers, switches, WiFi access points) than cannot normally be switched with the computer (except in cases where there is only one desktop computer and no other computer or network devices on the house, which would now be rare). Importantly, laptops are not normally well suited for attachment to an SPC (even though the requirements state that an SPC should be suitable for use with a laptop) – they need to charge the battery when connected (even when not in use) and they are often used in different locations around the house so are frequently connected to different power outlets (it is not m=normally practical to move an IT SPC around with a laptop). Assuming some households are configured so that these end uses are normally connected, the maximum number of IT items per house that could be connected is around 4 devices per average house (using multiple boards). It is important to note that ownership of desktop computers in the home is now in sharp decline (ABS4602-2011) with an increase in laptop ownership (which are a much more efficient technology in any case) and rapid penetration of various tablet technologies (these were rare in the last household audit in 2010 years ago but the energy consumption is generally relatively small). So there is a strong trend in substitution for portable screen based technologies which will be driving down overall energy (and potential energy savings that can be achieved by IT SPCs). So, based on the analysis of primary field measurements on the average stock values for standby, it is estimated that the following values would provide reasonable estimates for the standby that could be controlled by an SPC: • Main television: 9 W total controlled load (AV SPC1); • Audio and related equipment (with a master device): 7W total controlled load
(AV SPC2); • AV un-switchable: 10 W of AV load that cannot be switched off or is
distributed around the house and/or not part of a master slave arrangement;
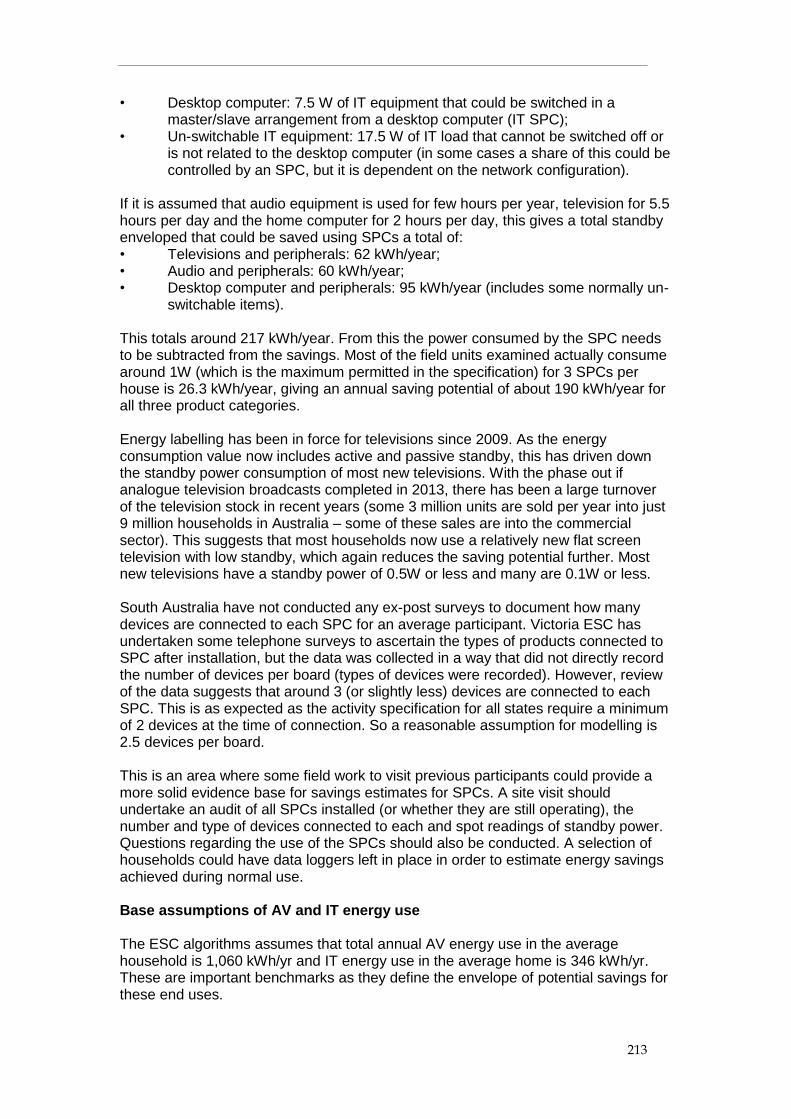
R 213
• Desktop computer: 7.5 W of IT equipment that could be switched in a master/slave arrangement from a desktop computer (IT SPC);
• Un-switchable IT equipment: 17.5 W of IT load that cannot be switched off or is not related to the desktop computer (in some cases a share of this could be controlled by an SPC, but it is dependent on the network configuration).
If it is assumed that audio equipment is used for few hours per year, television for 5.5 hours per day and the home computer for 2 hours per day, this gives a total standby enveloped that could be saved using SPCs a total of: • Televisions and peripherals: 62 kWh/year; • Audio and peripherals: 60 kWh/year; • Desktop computer and peripherals: 95 kWh/year (includes some normally un-
switchable items). This totals around 217 kWh/year. From this the power consumed by the SPC needs to be subtracted from the savings. Most of the field units examined actually consume around 1W (which is the maximum permitted in the specification) for 3 SPCs per house is 26.3 kWh/year, giving an annual saving potential of about 190 kWh/year for all three product categories. Energy labelling has been in force for televisions since 2009. As the energy consumption value now includes active and passive standby, this has driven down the standby power consumption of most new televisions. With the phase out if analogue television broadcasts completed in 2013, there has been a large turnover of the television stock in recent years (some 3 million units are sold per year into just 9 million households in Australia – some of these sales are into the commercial sector). This suggests that most households now use a relatively new flat screen television with low standby, which again reduces the saving potential further. Most new televisions have a standby power of 0.5W or less and many are 0.1W or less. South Australia have not conducted any ex-post surveys to document how many devices are connected to each SPC for an average participant. Victoria ESC has undertaken some telephone surveys to ascertain the types of products connected to SPC after installation, but the data was collected in a way that did not directly record the number of devices per board (types of devices were recorded). However, review of the data suggests that around 3 (or slightly less) devices are connected to each SPC. This is as expected as the activity specification for all states require a minimum of 2 devices at the time of connection. So a reasonable assumption for modelling is 2.5 devices per board. This is an area where some field work to visit previous participants could provide a more solid evidence base for savings estimates for SPCs. A site visit should undertake an audit of all SPCs installed (or whether they are still operating), the number and type of devices connected to each and spot readings of standby power. Questions regarding the use of the SPCs should also be conducted. A selection of households could have data loggers left in place in order to estimate energy savings achieved during normal use. Base assumptions of AV and IT energy use The ESC algorithms assumes that total annual AV energy use in the average household is 1,060 kWh/yr and IT energy use in the average home is 346 kWh/yr. These are important benchmarks as they define the envelope of potential savings for these end uses.

R 214
It is unclear how these estimates were derived. A range of end use measurements conducted by Sustainability Victoria over the period 2011 to 2013 put AV energy consumption at around 530 kWh per year (noting that this excludes measurements on some relevant equipment types) and IT energy consumption at around 330 kWh/year (DPI 2013). EES has an integrated end use model which separately estimates energy consumption for some 65 end uses in the home (EES 2008). This model (which is now somewhat dated) put total AV energy at 790 kWh/year. But this is known to be substantially too high for several reasons. First it assumes that primary and secondary televisions are both used 7 hours per day, but more recently field measurements show this to be more like 5.5 hours per day for primary televisions and 1.1 hours per day for secondary televisions (sample of 200 long term field measurements). Second, the energy characteristics of televisions have been declining spectacularly since energy labelling was introduced in 2009, with an average annual improvement of some 20% per annum for the past few years (EES 2011b – see also the analysis conducted for new televisions in this review). So the on mode power of new televisions is dramatically declined. This suggests that total AV energy consumption in 2014 is likely to be of the order of 500 kWh/year and declining (driven by television on mode power reductions). This is broadly in line with Sustainability Victoria estimates. Note that a number of AV end uses are not suitable for attachment to an SPC, so the saving potential envelope is somewhat smaller. The ESC algorithm and stock modelling in EES (2008) assume an ongoing increase in television watching hours of use over time. This trend is no longer clear, as there are now typically many devices that can be used to watch on line content (such as tablets, laptops and computers) as an alternative to televisions. However, many televisions can now watch on line content, so this may maintain on mode hours to some extent. Field measurements are not really suitable to establish longitudinal trends in viewing habits as the house to house variation is generally very large (and the day to day variation is also large). This may be best established by agencies such as Oztam, which track viewing habits for commercial televisions as the basis for advertising revenue charges. We are not aware of anyone purchasing and analysis this type of data, but it should be available. For IT equipment, the EES stock model assumes energy consumption of around 250 kWh/year, but this can be considered broadly consistent with the SV estimates and the ESC base case (330 kWh/year). Again there is some uncertainty on future usage patterns (declining use of desktop PCs, increasing use of tablets and laptops, significant proportion of IT equipment that is not suitable for connection to an SPC). Number of boards per house As noted above, the ESC algorithm assumes that there are an average of 1.35 AV SPCs per house and 1.1 IT SPCs per house. VEET activity data shows that in 2013 there SPCs installed in some 300,000 homes and total VEEC earned was 7.5 per house. Previous internal breakdowns put this at 1.96 AV boards per house and 1.15 IT boards per house for Victoria (DPI 2013). In South Australia, ESCOSA report that around 92,000 boards were installed in 50,000 households in 2013. The weighted average abatement per IT board was 1.8 and for per AV board was 3.6. Given that 85% of all SPCs installed were the AV type and these earned on average twice the credits of IT boards, AV SPCs earned 92% of total credits under REES in 2013.

R 215
For reference, the weighted average abatement factor provided for AV SPC boards in Victoria is 3.92 (through to December 2012), which roughly translates into savings of around 407 kWh/year for each AV SPC. This could represent 80% of total AV energy consumption in an average home per board. As there are on average 2 boards installed per house, the savings are possibly 50% more than total AV energy use in an average home. The weighted average abatement factor in Victoria provided for IT SPC boards is 2.189, which roughly translates into savings of around 227 kWh/year for each SPC. Given there are 1.1 boards per house, this represents a saving of 75% of total IT energy consumption. These values suggest that the original values used in Victoria are substantially overestimated. Even after the 2013 downward revision (ESC 2013), the AV savings are likely to be significantly overstated. These values will be relevant for South Australia as well as REES use ESC figures adjusted for emission intensity. Television characteristics and idle time One of the key assumptions in the ESC algorithm is that television use in an average home without an SPC is assumed to be 8 hours per day, made up of 5 hours active viewing time and 3 hours of “idle” time per day (on time where the SPC can turn off the television without affecting user energy service provision). The ESC algorithm also assumes that 0.21 of televisions per house are plasma at 250W, 0.8 televisions per house are LCD at 150W and 1.05 televisions per house are CRT at 80W. The same hours of usage are assumed to apply to all televisions. These assumptions are quite important as they mean that the majority of AV SPC energy savings are accrued from the elimination of so called television “idle” time. It is assumed that all television watching where there is no remote infra-red activity for 1 hour or more can be counted as saved energy. There are many assumptions that need to be reviewed within the base algorithm and updated with latest data. These are examined in turn below. Hours of use: Review of field trial data in around 120 homes suggests average on time is about 5.5 hours per day. Long term field data measured by EES for some 150 televisions puts average use at around 5.1 hours per day. Of course these are averages, and individual household usage will vary considerably from this value from as low as zero to as much as 13 hours per day. But there is a growing body of evidence that average usage is in the range 5 to 6 hours per day. This is considerably lower than the assumption in the ESC algorithm and that assumption will result in an overestimate of the SPC savings. Idle time of 3 hours per day: It is important to understand how this value is determined in field trials. The field trial SPCs disable the function that turns the television off after 1 hour where there is no remote control (IR or infra-red activity) - all television on time after 1 hour without IR activity is counted as idle time (i.e. 100% can be counted as energy savings on the assumption that nobody is watching the television). Householders are told to ignore any flashing light or clicking sounds (activation of the idle mode for the monitoring system in the field trials) in the disabled boards, even though they may be watching the television. Field trial data reviewed by EES and BA showed the measured idle time ranged from 4% to 9% across 4 separate trials covering 80 houses. The measured idle time seems to be roughly correlated with average on time (as expected – higher use will mean more chance where the television could be on for longer periods where there is no activity with the remote control). The average idle time observed in field trials (7%) (1.7 hours per

R 216
day) is much lower that the ESC algorithm (12.5%) (3 hours per day).The other aspect is whether all of the idle time measured in this way should be counted as estimated savings against the AV SPC. As far as we are aware, there has been no ex post evaluation monitoring of user behaviour with the idle off function active. This would involve data logging in the field with SPCs that actually turn the television off after 1 hour of no remote control activity (as per a normal SPC operation) and assess the proportion of cases where the idle off is activated and the television is switched back on again shortly afterwards because someone was actually watching. There is some evidence that some users must still be watching the television after 1 hour of no remote control activity because one main supplier (Embertec) has supplied to market a user adjustable idle time out that can be set to 2 or 3 hours (up from the base of 1 hour). Presumably they did this because some customers complained that 1 hour was too short (i.e. often they were actually watching the television when idle off is activated after 1 hour). An ESC Survey of May 2012 found that about 50% of households with adjustable idle time out settings were left at 1 hour, 15% were set to 2 hours and 35% were set to 3 hours (DPI 2013). The veracity of this data is not known, but it would suggest that it would be reasonable to discount at least some of the savings attributable to the television idle mode because users would not adjust the idle time out period if all idle off events were periods when the television was not being watched. Figure 16: Distribution of Idle Time Events and Length of Idle Time Events in a Field Trial
This figure illustrates that there are a large number of short idle periods but these represent about 20% of total idle time (in excess of the 1 hour base). Idle periods of up to 1 hour represent 30% of all idle time (in excess of the 1 hour base). An idle time of up to 2 hours represent 40% of the total idle time savings. Note that an idle time of 2 hours represents a time-out setting of 3 hours on the controller, and it would be reasonable to expect that most, if not all of these idle savings are likely to be real. An
0.0%
20.0%
40.0%
60.0%
80.0%
100.0%
120.0%
0
20
40
60
80
100
120
0.5 1 1.5 2 2.5 3 3.5 4 4.5 5 6 6.5 7 7.5 8 8.5 10 13
Cu
mu
lati
ve Id
le T
ime
Gre
ate
r th
an o
r Eq
ual
to
Idle
Tim
e E
ven
t
Co
un
t o
f Ev
en
ts
Idle Time Hours (note some missing intervals)
Idle Events - 20 houses x 2 weeks
Count of events
Cum Time
Note: Idle time for this trial set at 1 hour -idle time below is in excess of this 1 hour

R 217
optimistic view of this data would put idle time savings as follows (from a base of 7% or 1.7 hours per day): • 80% of energy beyond a 1 hour SPC time out (=1.3 hours per day) • 90% of energy beyond a 2 hour SPC time out (=1.1 hours per day) • 100% of energy beyond a 3 hour SPC time out (=1.0 hour per day). This would be a significant downward adjustment from the currently assumed idle time value of 3 hours a day. It also suggests that SPCs with variable time out controls should be given slightly lower savings credits due to lower idle time savings. However, such boards may be more acceptable for consumers and may be less likely to be removed due to user annoyance, which may translate to higher persistence for these models. So there is not a strong case for penalising boards with adjustable idle time settings as the energy savings are only modestly affected. Ownership: The ESC data correctly shows that there are around 2 televisions per house in Australia. The technology breakdown given in their algorithm is now quite out of date. Almost all CRT televisions will be analogue and will be out of normal use. However, in a general sense, this is not terribly important. What is important is that the usage of secondary televisions in a house is not well documented but is likely to be much lower than the main television. EES field data suggests that usage of around 1.3 hours per day is typical for secondary televisions (DPI 2013). The ESC algorithm assumes all televisions are watched equally and that the idle time savings for each are the same. This is a large overestimate of potential savings. Again this value will vary by house – some will use secondary televisions a considerably amount and many will rarely use them at all. Television power characteristics: The ESC algorithm puts the average stock power for LCD at 150W. This may have been a reasonably estimate from 5 years ago, but many of the installed televisions installed now are considerably lower power than this. The most common flat screen size is now 108cm (42”) and 90% of models are now LCD (LED). MEPS levels that came into force in 2013 now limit this size to around 140W and the average new product at this size is now around 60W. This suggests that the baseline for main televisions is falling rapidly and the associated energy savings from SPCs should also be revised down. As noted above, sales of televisions are around 3 million per year into 9 million homes, so main televisions can be expected to be on average just a few years old.
Updated Energy Savings Estimates To illustrate that current assumptions used for SPCs, a reference case has been included below to illustrate the values currently assumed. Table 100: SPC installed on main television – existing reference case
Parameter Value Notes
TV standby W 2 Higher than average
Other devices per SPC 3 Max that can be connected
Standby per other device W 5 Higher than average
Hours TV on mode h/day 8 60% higher than average
Hours idle (within on mode) 3 Overly optimistic
TV on mode power W 250 All televisions are plasma
SPC parasitic load W 1 Lifetime years 10 Overly optimistic

R 218
Parameter Value Notes
Discount 1 No discounts
Case without SPC TV on mode energy kWh/y 730.0
TV standby energy kWh/y 11.7 Other device energy kWh/y 131.4 Assumes 8760h standby - no use
Total energy kWh/y 873.1 Case with SPC
TV on mode energy kWh/y 456.3 Reduced due to idle time saving
TV standby energy kWh/y 0 Assume no standby If controlled by SPC
Other device energy kWh/y 27.4 Standby only during TV on time, no other use
SPC parasitic load kWh/y 8.8 Total energy kWh/y 492.4 Total Savings kWh/year 380.7 Lifetime savings GJ 13.7 No discounts
Even under this rather extreme set of assumptions (all televisions are plasmas and all are watched 8 hours a day currently and 3 hours of viewing every day is idle time), the annual savings from an SPC is 380 kWh/year. This assumes no use of connected peripherals that are controlled by the SPC. These savings under these assumption are even lower than the highest rating advanced boards being installed at the moment (prior to the ESC 2013 adjustment). On the basis of the above review of the best available data, the following energy savings estimates have been developed for SPCs as part of this review. These are recommended to implementation in a revised REES. These have been set out in detail for 4 mains cases as follows: • Advanced AV SPC installed on main television • Advanced AV SPC installed on secondary television • Advanced AV SPC installed on audio equipment • Advanced IT SPC installed in desktop computer. Table 101: Advanced AV SPC installed on main television – recommended savings
Parameter Value Notes
TV standby W 1 Most products are <1W
Other devices per SPC 1.5 2.5 total for the SPC
Standby per other device W 4.7 Based on EES 2011
Hours TV on mode h/day 5.5 Field estimates
Hours idle (within on mode) 1.3 Assumes all idle time saved
TV on mode power W 110 Most new products lower, falling quickly
SPC parasitic load W 1 Typical value for most boards
Lifetime years 7 Discount 0.76 Case without SPC
TV on mode energy kWh/y 220.8 TV standby energy kWh/y 6.8
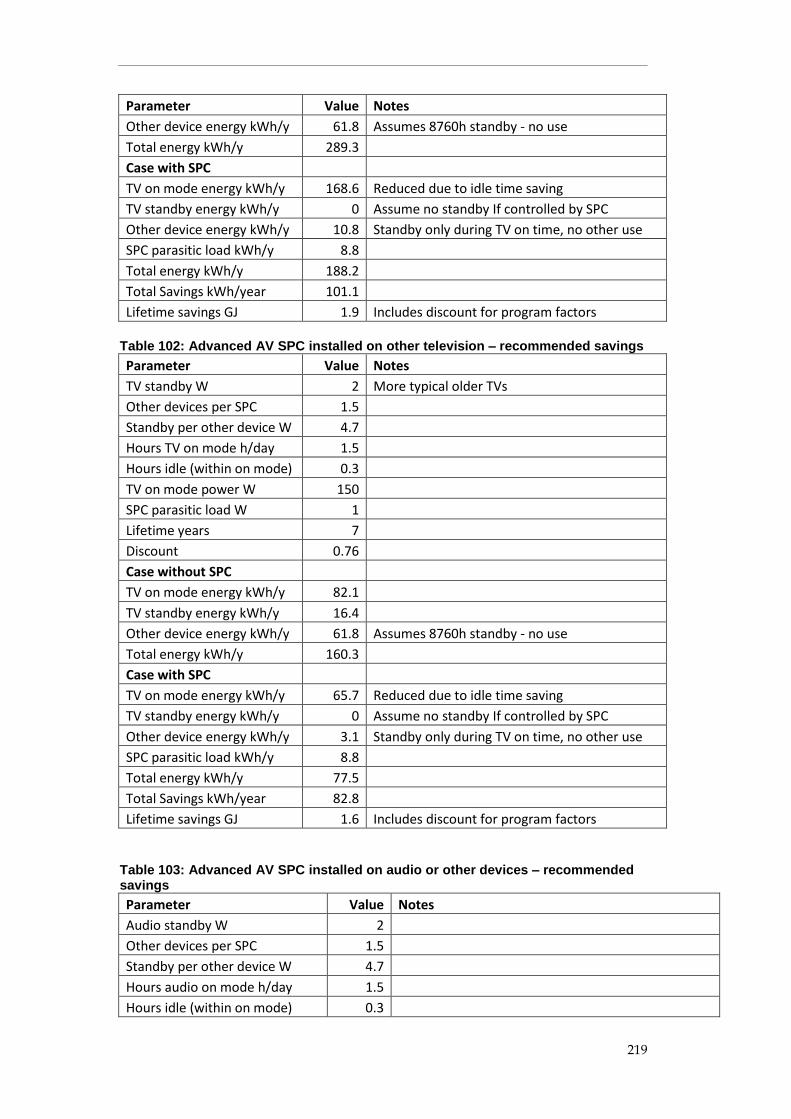
R 219
Parameter Value Notes
Other device energy kWh/y 61.8 Assumes 8760h standby - no use
Total energy kWh/y 289.3 Case with SPC
TV on mode energy kWh/y 168.6 Reduced due to idle time saving
TV standby energy kWh/y 0 Assume no standby If controlled by SPC
Other device energy kWh/y 10.8 Standby only during TV on time, no other use
SPC parasitic load kWh/y 8.8 Total energy kWh/y 188.2 Total Savings kWh/year 101.1 Lifetime savings GJ 1.9 Includes discount for program factors
Table 102: Advanced AV SPC installed on other television – recommended savings
Parameter Value Notes
TV standby W 2 More typical older TVs
Other devices per SPC 1.5 Standby per other device W 4.7 Hours TV on mode h/day 1.5 Hours idle (within on mode) 0.3 TV on mode power W 150 SPC parasitic load W 1 Lifetime years 7 Discount 0.76 Case without SPC
TV on mode energy kWh/y 82.1 TV standby energy kWh/y 16.4 Other device energy kWh/y 61.8 Assumes 8760h standby - no use
Total energy kWh/y 160.3 Case with SPC
TV on mode energy kWh/y 65.7 Reduced due to idle time saving
TV standby energy kWh/y 0 Assume no standby If controlled by SPC
Other device energy kWh/y 3.1 Standby only during TV on time, no other use
SPC parasitic load kWh/y 8.8 Total energy kWh/y 77.5 Total Savings kWh/year 82.8 Lifetime savings GJ 1.6 Includes discount for program factors
Table 103: Advanced AV SPC installed on audio or other devices – recommended savings
Parameter Value Notes
Audio standby W 2 Other devices per SPC 1.5 Standby per other device W 4.7 Hours audio on mode h/day 1.5 Hours idle (within on mode) 0.3

R 220
Parameter Value Notes
Audio on mode power W 20 SPC parasitic load W 1 Lifetime years 7 Discount 0.76 Case without SPC
Audio on mode energy kWh/y 11.0 Audio standby energy kWh/y 16.4 Other device energy kWh/y 61.8 Assumes 8760h standby - no use
Total energy kWh/y 89.1 Case with SPC
Audio on mode energy kWh/y 8.8 Reduced due to idle time saving
Audio standby energy kWh/y 0 Assume no standby If controlled by SPC
Other device energy kWh/y 3.1 Standby only during audio on time, no other use
SPC parasitic load kWh/y 8.8 Total energy kWh/y 20.6 Total Savings kWh/year 68.5 Lifetime savings GJ 1.3 Includes discount for program factors
Table 104: Advanced IT SPC installed on main computer – recommended savings
Parameter Value Notes
PC standby W 4.9 Other devices per SPC 1.5 Standby per other device W 4.9 Hours PC on mode h/d 2 Hours sleep (within on mode) 0.5 PC on mode power W 115 SPC parasitic load W 1 Lifetime years 7 Discount 0.9025 Case without SPC
PC on mode energy kWh/y 84.0 PC standby energy kWh/y 39.3 Other device energy kWh/y 64.4 Assumes 8760h standby - no use
Total energy kWh/y 187.7 Case with SPC
PC on mode energy kWh/y 84.0 No change to PC during idle/sleep time saving - can only save in other devices
PC standby energy kWh/y 0 Assume no standby If controlled by SPC
Other device energy kWh/y 4.0 Standby only during IT on time, no other use
SPC parasitic load kWh/y 8.8 Total energy kWh/y 96.7 Total Savings kWh/year 90.9 Lifetime savings GJ 2.1 Includes discount for program factors

R 221
On the basis of these revised estimates, the default energy savings for various configurations have been revised and simplified:
Advanced AV SPC on a main television: 2 GJ electricity
Advanced IT SPC on a main PC: 2 GJ electricity
Advanced SPC on any other devices: 1.5 GJ electricity
Simple SPC on any devices: 1 GJ electricity
Potential Compliance Issues SPCs are normally installed by service providers as a part of a package of low cost measures targeted at residential households. There is no reason to think that this is done incorrectly, or will be in the future. However, the final rule and specification changes will need to be clearly communicated and some verification auditing undertaken to ensure that these are being implemented correctly.
Specific Recommendations for this Activity In order to obtain a better understanding of field performance of these products, it is recommended that the following projects be undertaken:
Ex-post site survey of a significant number of previous participants to ascertain:
o Number and type of products connected to each SPC o Standby and on mode characteristics of connected products o Survey of participants regarding their use and satisfaction with the
SPCs and their use of the products that are connected to the SPC.
Undertake ongoing monitoring (energy data logging) of selected SPC sites in order to more accurately quantify the likely longer term energy savings achieved under a range of different participants, usage levels and equipment configurations.
Purchase of longitudinal television viewing data from Oztam to establish television viewing trends.
Given that REES currently relies on equipment approved by the Essential Services Commission of Victoria and that in May 2014 the Victorian Government announced its intention to cease the operation of VEET by the end of 2015, ESCOSA will need to make alternative arrangements for the listing of these products under the REES Code (irrespective of any changes implemented as a result of this review). Liaison with the ACT may provide beneficial with respect to a joint transition approach.

R 222
Install Standby Power Controllers - Audio Visual (AV) Activity No.
SPC1
1. Activity Specific Definitions
Approved laboratory test is a test approved by the Commission, and in the absence of the Commission specifying an approved laboratory test a test that meets the Essential Services Commission of Victoria published testing requirements. The Essential Services Commission of Victoria laboratory testing requirements are provided in the document “Explanatory Note- Laboratory Tests for Standby Power Controllers”, Version 1.1 – 29 August 2011, as amended from time to time, available at: https://www.veet.vic.gov.au/Public/Public.aspx?id=Publications Mains power switching device means a relay or other device that switches the power to the controlled
appliances on or off Master/slave arrangement means an arrangement where the standby power controller is connected to an uncontrolled master appliance, whose current or power is solely used to control the electrical input to controlled appliances connected to the standby power controller Main television means the television indicated by the householder as the one that is most frequently viewed. Any other equipment means any secondary television or other AV equipment (such as audio) and associated AV equipment that is connected to an AV SPC. Advanced SPC means a product that meets the installed product requirements; and does not operate solely on the basis of a master/slave arrangement; and has been demonstrated to the satisfaction of the Essential Services Commission of Victoria to be capable of achieving abatement of at least 3 tonnes of carbon dioxide equivalents over a 10 year period; and has been subjected to a field trial approved by the Essential Services Commission of Victoria. Simple SPC means a product that meets the installed product requirements.
2. Activity Description (Summary)
Install a standby power controller to automatically reduce the standby energy consumption of residential audio visual equipment (standby power controller (AV))
3. Activity Eligibility Requirements
Any residential household in South Australia where the minimum installation requirements can be met.
4. Installed Product Requirements
The standby power controller (AV) must meet the requirements of any applicable Australian Standard in force in respect of standby power controllers. In the absence of any applicable Australian Standard the standby power controller (AV) must, when tested by an approved laboratory in accordance with an approved laboratory test, be determined to be suitable for use in an audio visual environment and demonstrated to: 1. Be capable of controlling the power of at least 4 appliances (whether directly or indirectly); 2. Be fitted with a mains power switching device that is rated to a minimum of 50,000 switching cycles; 3. Have an electric power consumption of not more than 1 watt when tested in accordance with the
laboratory test; 4. Automatically disconnect mains power from controlled appliances: (a) In the case of a product that
relies on a master/slave arrangement – when the master appliance is turned off; (b) In the case of a product that relies on sensing infra-red signals from the remote controls of controlled appliances – after a period of time specified in the laboratory test when the product does not detect infra-red signals from those remote controls that are triggered by a user.
5. Automatically reconnect mains power to the controlled appliances only when: (a) in the case of a product that relies on a master/slave arrangement – when the master appliance is turned on; (b) in the case of a product that relies on sensing infra-red signals from the remote controls of controlled appliances – when any of the controlled appliances are operated by a user.
6. Be able, at the time of installation, to disconnect mains power from or reconnect mains power to controlled appliances without having to be set up to have those functions assigned to the operation of an existing appliance remote control; and
7. Not require manual setting of a current or power threshold.
5. Minimum Installation Requirements
1. The standby power controller must be connected to at least 2 controlled appliances at the time of installation.
2. No more than 3 standby power controllers (AV) may be installed in one premises provided that, where more than 1 standby power controller (AV) is or is to be installed at premises at which 1 standby power controller (IT) (refer separate REES activity) is also installed, the total number of installed standby powers controllers (IT and AV) must not exceed 3.

R 223
3. Where it can be demonstrated that the occupants have changed at premises where standby power controllers were installed for the purposes of REES, a maximum of 3 further standby power controllers (IT and AV) may be installed at that premises.
4. The Commission must approve the manner of installation, and the form and manner of training (including on-going support) that must be provided to the residential customer, prior to the activity being undertaken.
5. A person or entity undertaking this activity shall use best endeavours to ensure any installations are targeted at high usage applications in the first instance.
6. Activity default energy savings The total Gigajoule energy (GJ) saved attributed to this activity per residential premises is:
Activity Description – type installed Electricity (GJ saved)
Advanced AV SPC installed on the main television 2.0
Advanced SPC (any type) installed on any other equipment 1.5
Simple SPC installed on any equipment type 1.0
Notes: An advanced AV SPC shall meet the current requirements of Class 2A, 2B, 3A, 3B, 4A, 4B, 5A, 5B, 6A or 6A A simple SPC shall meet the current requirements of Class 1A, 1B or 1C
7. Guidance Notes (Informative only – not mandatory)
Abatement levels referenced in 6. are prior to VEET adjustments applied on 7 October 2013.

R 224
Install Standby Power Controllers –Information Technology (IT) Activity No.
SPC2
1. Activity Specific Definitions
Approved laboratory test is a test approved by the Commission, and in the absence of the Commission specifying an approved laboratory test a test that meets the Essential Services Commission of Victoria published testing requirements. The Essential Services Commission of Victoria laboratory testing requirements are provided in the document “Explanatory Note- Laboratory Tests for Standby Power Controllers”, Version 1.1 – 29 August 2011, as amended from time to time, available at: https://www.veet.vic.gov.au/Public/Public.aspx?id=Publications Mains power switching device means a relay or other device that switches the power to the controlled
appliances on or off. Master/slave arrangement means an arrangement where the standby power controller is connected to an uncontrolled master appliance, whose current or power is solely used to control the electrical input to controlled appliances connected to the standby power controller. Active state in relation to a computer, means a state in which the computer is carrying out useful work in response to prior or concurrent (a) user input; or(b) Instruction over a network. Off mode in relation to a computer, means a low power state that the computer is capable of entering automatically after a period of inactivity or by manual selection. Main PC means the desktop or laptop indicated by the householder as the one that is used most frequently used. It does not include tablets or mobile phones. Any other equipment means any secondary PC (laptop or desktop) and associated IT equipment that is connected to a IT SPC. Advanced SPC means a product that meets the installed product requirements; and is capable of
automatically disconnecting mains power to controlled appliances when the master computer enters Sleep Mode; and has been demonstrated to the satisfaction of the Essential Services Commission of Victoria to be capable of achieving abatement of at least 3 tonnes of carbon dioxide equivalents over a 10 year period; and has been subjected to a field trial approved by the Essential Services Commission of Victoria. Simple SPC means a product that meets the installed product requirements.
2. Activity Description (Summary)
Install a standby power controller to automatically reduce the standby energy consumption of residential information technology equipment (standby power controller (IT))
3. Activity Eligibility Requirements
Any residential household in South Australia where the minimum installation requirements can be met.
4. Installed Product Requirements
The standby power controller (IT) must meet the requirements of any applicable Australian Standard in force in respect of standby power controllers. In the absence of any applicable Australian Standard must, when tested by an approved laboratory in accordance with an approved laboratory test, be determined to be suitable for use in an information technology environment and demonstrated to: 1. Be suitable for use with desktop and notebook computers that are not more than 2 years old; 2. Be capable of controlling the power of at least 4 appliances (whether directly or indirectly); 3. Be fitted with a mains power switching device that is rated to a minimum of 50,000 switching cycles; 4. Have an electric power consumption of not more than 1 watt when tested in accordance with the
laboratory test; 5. Automatically disconnect mains power from controlled appliances when the master computer is
switched to Off Mode; 6. Automatically reconnect mains power to the controlled appliances when the master computer
enters Active State; 7. Not be reliant on a universal serial bus connection to determine the operating mode of the
computer; 8. Be able, at the time of installation, to disconnect mains power from or reconnect mains power to
controlled appliances without having to be set up to have those functions assigned to the operation of an existing appliance remote control; and
9. Not require manual setting of a current or power threshold.
5. Minimum Installation Requirements
1. The standby power controller must be connected to at least 2 controlled appliances at the time of installation.
2. A maximum of 1 standby power controllers (IT) may be installed in one premises. The total number of installed standby powers controllers (IT and AV) must not exceed 3.

R 225
3. Where it can be demonstrated that the occupants have changed at premises where standby power controllers were installed for the purposes of REES, one standby power controller (IT) may be installed with a maximum of 3 standby power controllers (IT and AV) installed at that premises.
4. The Commission must approve the manner of installation, and the form and manner of training (including on-going support) that must be provided to the residential customer, prior to the activity being undertaken.
5. A person or entity undertaking this activity shall use best endeavours to ensure any installations are targeted at high usage applications in the first instance.
6. Activity default energy savings The total Gigajoule energy (GJ) saved attributed to this activity per residential premises is:
Activity Description – type installed Electricity (GJ saved)
Advanced IT SPC installed on the main PC (laptop or desktop) 2.0
Advanced SPC (any type) installed on any other equipment 1.5
Simple SPC installed on any equipment type 1.0
Notes: An advanced IT SPC shall meet the current requirements of Class 2A, 2B, 3A, 3B, 4A, 4B, 5A, 5B, 6A or 6A A simple SPC shall meet the current requirements of Class 1A, 1B or 1C
7. Guidance Notes (Informative only – not mandatory)
Abatement levels referenced are prior to VEET adjustments applied on 7 October 2013.

R 226
Purchase a High Efficiency Appliances - APP1
Technical Assessment – APP1
APP1A Purchase a high efficiency new refrigerator APP1B Purchase a high efficiency new freezer
APP1D Purchase a high efficiency new clothes dryer APP1F Purchase a high efficiency new television
REES Activity Reference: APP1 REES Activity title: Purchase a high efficiency new appliances (various) APP1A Purchase a High Efficiency new refrigerator APP1B Purchase a High Efficiency new freezer APP1C Clothes washer (not recommended) APP1D Purchase a High Efficiency new clothes dryer APP1E Dishwasher (not recommended) APP1F Purchase a High Efficiency new television Target product: specified new appliances Savings: Activity saves energy directly by encouraging the purchase of a new product that is better than average efficiency Pre-conditions: None
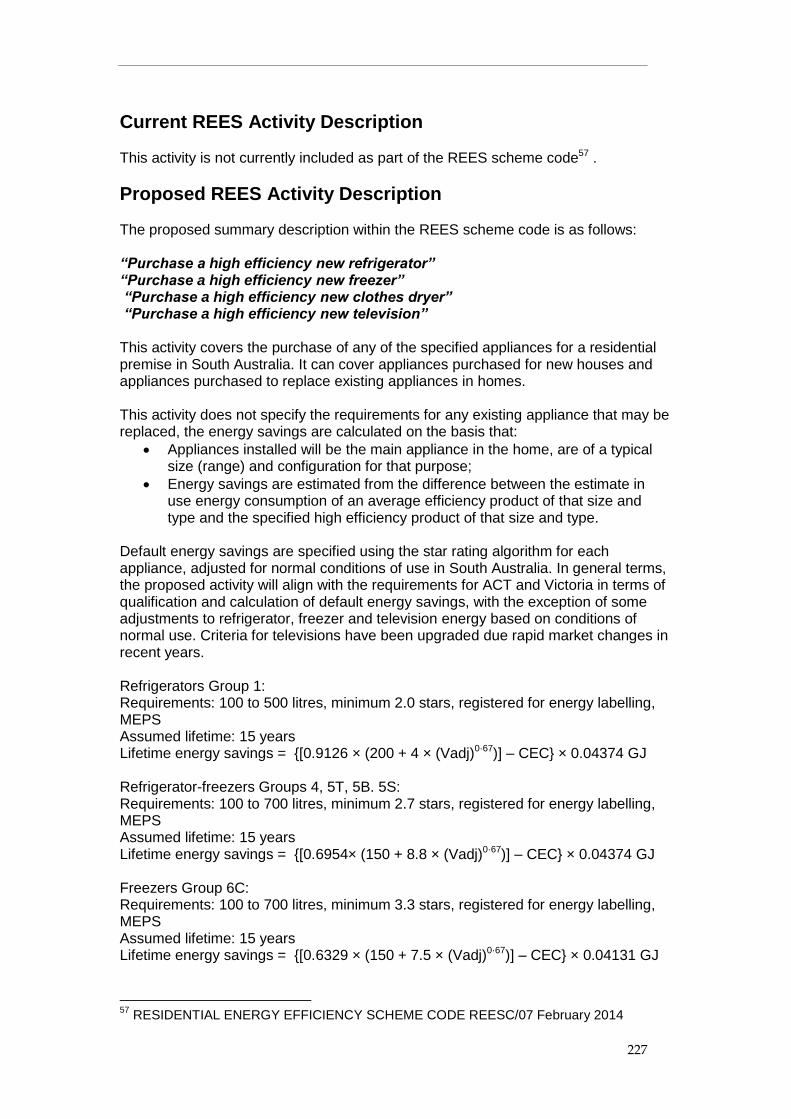
R 227
Current REES Activity Description This activity is not currently included as part of the REES scheme code57 .
Proposed REES Activity Description The proposed summary description within the REES scheme code is as follows: “Purchase a high efficiency new refrigerator” “Purchase a high efficiency new freezer” “Purchase a high efficiency new clothes dryer” “Purchase a high efficiency new television” This activity covers the purchase of any of the specified appliances for a residential premise in South Australia. It can cover appliances purchased for new houses and appliances purchased to replace existing appliances in homes. This activity does not specify the requirements for any existing appliance that may be replaced, the energy savings are calculated on the basis that:
Appliances installed will be the main appliance in the home, are of a typical size (range) and configuration for that purpose;
Energy savings are estimated from the difference between the estimate in use energy consumption of an average efficiency product of that size and type and the specified high efficiency product of that size and type.
Default energy savings are specified using the star rating algorithm for each appliance, adjusted for normal conditions of use in South Australia. In general terms, the proposed activity will align with the requirements for ACT and Victoria in terms of qualification and calculation of default energy savings, with the exception of some adjustments to refrigerator, freezer and television energy based on conditions of normal use. Criteria for televisions have been upgraded due rapid market changes in recent years. Refrigerators Group 1: Requirements: 100 to 500 litres, minimum 2.0 stars, registered for energy labelling, MEPS Assumed lifetime: 15 years Lifetime energy savings = {[0.9126 × (200 + 4 × (Vadj)0·67)] – CEC} × 0.04374 GJ Refrigerator-freezers Groups 4, 5T, 5B. 5S: Requirements: 100 to 700 litres, minimum 2.7 stars, registered for energy labelling, MEPS Assumed lifetime: 15 years Lifetime energy savings = {[0.6954× (150 + 8.8 × (Vadj)0·67)] – CEC} × 0.04374 GJ Freezers Group 6C: Requirements: 100 to 700 litres, minimum 3.3 stars, registered for energy labelling, MEPS Assumed lifetime: 15 years Lifetime energy savings = {[0.6329 × (150 + 7.5 × (Vadj)0·67)] – CEC} × 0.04131 GJ
57
RESIDENTIAL ENERGY EFFICIENCY SCHEME CODE REESC/07 February 2014

R 228
Freezers Group 6C and 7: Requirements: 100 to 400 litres, minimum 2.5 stars, registered for energy labelling, MEPS Assumed lifetime: 15 years Lifetime energy savings = {[0.77 × (150 + 7.5 × (Vadj)0·67)] – CEC} × 0.04131 GJ Clothes washers – inclusion into REES not recommended due to very low savings Clothes Dryers Requirements: Not combination washer-dryer, minimum 5 stars, registered for energy labelling, rated capacity of not less than 5kg Assumed lifetime: 10 years Lifetime savings = (48.08× rated capacity – CEC)× 0.0324 GJ Dishwashers – inclusion into REES not recommended due to very low savings Televisions sold in calendar 2015 Minimum 6.5 stars (2013), current and valid registration for energy labelling and MEPS (Tier 2 – 2013) Assumed lifetime: 10 years Where the registered screen area is less than or equal to 7221cm2 Lifetime energy savings in GJ = {[0.3664 × (SA × 0·09344 + 64.41)] – CEC} × 0.001782 Where the registered screen area is greater than 7221cm2 Lifetime energy savings in GJ = {270.8 – CEC} × 0.001782 Televisions sold in calendar 2016 Minimum 7.0 stars (2013), current and valid registration for energy labelling and MEPS (Tier 2 – 2013) Assumed lifetime: 10 years Where the registered screen area is less than or equal to 7221cm2 Lifetime energy savings in GJ = {[0.3277 × (SA × 0·09344 + 64.41)] – CEC} × 0.001782 Where the registered screen area is greater than 7221cm2 Lifetime energy savings in GJ = {242.2 – CEC} × 0.001782 Televisions sold in calendar 2017 Minimum 7.5 stars (2013), current and valid registration for energy labelling and MEPS (Tier 2 – 2013) Assumed lifetime: 10 years Where the registered screen area is less than or equal to 7221cm2 Lifetime energy savings in GJ = {[0.2931 × (SA × 0·09344 + 64.41)] – CEC} × 0.001782 Where the registered screen area is greater than 7221cm2 Lifetime energy savings in GJ = {216.6 – CEC} × 0.001782
Key Specification Changes This is a new category of activities under REES so all aspects are new. However, it is useful to note the following differences with the existing state schemes:
APP1A Refrigerators – aligned with Victoria and ACT
APP1B Freezers – aligned with Victoria and ACT
APP1C Clothes Washers - not recommended for inclusion after review

R 229
APP1D Clothes Dryers – aligned with Victoria and ACT
APP1E Dishwashers - not recommended for inclusion after review
APP1F Television – the approach is broadly aligned with Victoria and ACT, but the qualification and savings base has been updated to reflect current and likely market trends over the period 2015-2017.
All proposed activities are expressed savings in lifetime GJ electricity saved (compared with emissions saved in Victoria and ACT). The key elements of this new specification are:
Appliances have not been previously included with REES so these are new specifications for South Australia.
It is critical that all specifications include a requirement that products be registered for energy labelling (and MEPS where applicable) and that the registration is valid at the time of sale (this precludes cancelled or contested registrations from claiming credits).
Credits should be available directly to retailers rather than through service providers or end users.
These energy credits should not be restricted to residential sector. A significant proportion of some appliance sales are to the commercial sector and tracing the ultimate destination of the appliances is very difficult and is not warranted. None of the other states limit their activities to the residential sector.
For appliances where new specifications are recommended, the general approach used by Victoria and ACT is recommended as this is considered to be the most flexible, robust and transparent approach. While the approach used in NSW has been carefully examined for all appliances, generally this is not recommended for adoption in South Australia.
It is recommended that assumptions such as lifetime and specification of the savings base be explicitly stated in the notes to assist with future review and updating.
For refrigerators and freezers, the Victorian and ACT specification is recommended for adoption with some overall adjustments to take into account in use energy adjustments and conversion to lifetime GJ. It needs to be noted that these appliances will be subjected to major changes over the coming 3 years, so a watching brief needs to be maintained.
For electric clothes dryers, the Victorian and ACT specification is recommended for adoption with an overall adjustment to take into account conversion to lifetime GJ. As an additional safeguard, a requirement for a rated capacity of not less than 5kg has been included.
For dishwashers, the NSW specification is not recommended because the energy savings during normal use are likely to be very small and would not be attractive enough, in consideration of the transaction costs.
For clothes washers, the NSW specification is not recommended because the energy savings during normal use are likely to be very small and would not be attractive enough, in consideration of the transaction costs. Many of the savings occur in water heaters, which reduces further the value of the overall savings.
For televisions, the Victorian and ACT conceptual approach is recommended, but with major adjustments to all the parameters to take into account the latest market trends and data. There are also overall adjustments to take into account in use energy adjustments and conversion to lifetime GJ. It needs to be noted that televisions efficiency in particular (and technology evolution in general) have been changing very rapidly since labelling began in 2009 and
R 230
so a dynamic savings base that changes each year from 2015 to 2017 is recommended, with an annual review well before the commencement of each calendar year.
Scheme Review – Other jurisdictions The following jurisdictions currently include activities that cover high efficiency appliances within their schemes:
Victoria: VEET Schedule 22 – high efficiency refrigerators and freezers (22A=Group 1, 22B=Groups 4/5T/5B/5S, 22C=Group 6C, 22D=Group 6U/7)
Victoria: VEET Schedule 24 – high efficiency television
Victoria: VEET Schedule 25A – high efficiency electric clothes dryer
Victoria: VEET Schedule 25B – high efficiency gas clothes dryer
NSW: ESS Part B1 – Purchase a high efficiency clothes washing machine
NSW: ESS Part B2 – Purchase a high efficiency clothes dryer
NSW: ESS Part B3 – Purchase a high efficiency dishwasher
NSW: ESS Part B4 – Purchase a high efficiency 1 door refrigerator
NSW: ESS Part B5 – Purchase a high efficiency 2 door refrigerator
NSW: ESS Part B6 – Purchase a high efficiency chest freezer or upright freezer
NSW: ESS Part B7 – Purchase a high efficiency television
ACT: EEIS Part 5.2 – Purchase of high efficiency refrigerator or freezer
ACT: EEIS Part 5.3 – Purchase of high efficiency gas clothes dryer
ACT: EEIS Part 5.4 – Purchase of high efficiency electric clothes dryer
ACT: EEIS Part 5.6 – Purchase of high efficiency television. In general terms, Victoria and ACT are generally quite similar with respect to many of the specifications. ACT uses a different overall adjustment factor to take into account the different emission intensity of electricity supply. ACT and Victoria define specifications for a more limited range of types and sizes for refrigerators and freezers. NSW allows any type or size of a product where there is a specification for refrigerators and freezers. ACT and Victoria include specifications for a gas dryer, which is not covered in NSW. The title of the ACT activity is called “purchase of high efficiency gas clothes dryer”. The specification references AS 4554, but this standard does not define energy consumption measurements nor does it define energy efficiency thresholds. The ACT and Victorian specifications do not set out any energy related requirements. Given that these appliances are rarely used and are difficult to install, and in consideration that dryer use in Australian homes is generally low to modest, this specific activity has not being subjected to any detailed analysis as part of the REES review. It could however be included (mirroring the ACT and Victorian specifications) if required. Only 2 dryers have been purchased under the current VEET requirements to the end of 2013, so there would be significant administrative costs for a likely low level of participation if it were to be included. NSW is the only state to define specifications for clothes washers and dishwashers. ACT and Victoria tend to define savings reference base on an equation, which reflects the star rating algorithm for the specific appliance. This provides a continuous function of savings by size and type, which is generally desirable, and meets the high level REES principles to reward products based on their characteristics. In contrast,

R 231
NSW tends to define savings in a lookup table as a function of star rating, split into 2 or 3 size categories. Sometimes the size categories are quite coarse. All states appear to allow the purchase of high efficiency appliances into any sector (no restriction to residential sector). In practical terms, a significant share of refrigerators, freezers and televisions (at least) will be sold into the commercial sector and it would be difficult to limit credits to the residential sector alone if credits are assigned at the point of sale. Product specific observations are:
NSW allows refrigerator Groups 2 and 3 (bar refrigerators) whereas ACT and Victoria do not;
All states do not allow combination washer-dryers to qualify as a dryer;
NSW requirements allow some credits for relatively low efficiency dryers which scale with star rating, whereas ACT and Victoria have a stronger qualifying threshold (5 stars);
Victoria and ACT define television requirements as 5.5 stars under the Tier 1 requirements, which is now very weak given the changes in the market in recent years. NSW define requirements from 4 stars under Tier 2 (2013) which is a more realistic base. ACT and Victoria cap energy (label CEC) at 450 kWh/y.
Other general observations are that there is variation in all state requirements about registration for energy labelling (this is usually stated for most products in most states, but not always), Victoria and ACT usually require products be included on the relevant register (but not always) and there is some variation in the standards that are referenced (ACT tend not to date standard references, NSW and Victoria tend to date these, sometimes both parts are cited, sometimes not). Table 105 to Table 109 below provide a comparison of the key elements for new efficient appliances in each jurisdiction.

R 232
Table 105: State Scheme Summary – Comparative table for new efficient appliances (refrigerators and freezers)
Parameter SA – REES Scheme (current)
VIC – VEET Scheme *
NSW – ESS Scheme ACT – EEIS Scheme SA – REES Scheme (proposed)
Working Title No activity High efficiency refrigerators and freezers
Purchase a high efficiency 1 door refrigerator Purchase a high efficiency 2 door refrigerator Purchase a high efficiency chest freezer or upright freezer
Purchase of high efficiency refrigerator or freezer
Purchase of high efficiency refrigerator or freezer
Activity Reference Number
N/A Schedule 22A to 22D Parts B4, B5 and B6 Parts 5.2 APP1A, APP1B
Required pre-condition Residential or business Not stated (any) Residential or business Residential and commercial (1)
Replacement options Group 1: 100-500 litres Group 4/5T/5B/5S: 100-700 litres Group 6C: 100-700 litres Group 6U/7: 100-400 litres
Group 1, 2 or 3: any size Group 4/5T/5B/5S: any size Group 6C/6U/7: any size
Group 1: 100-500 litres Group 4/5T/5B/5S: 100-700 litres Group 6C: 100-700 litres Group 6U/7: 100-400 litres
Group 1: 100-500 litres Group 4/5T/5B/5S: 100-700 litres Group 6C: 100-700 litres Group 6U/7: 100-400 litres
Performance requirements (minimum)
Group 1: 2 stars Group 4/5T/5B/5S: 2.7 stars Group 6C: 3.3 stars Group 6U/7: 2.5 stars
Group 1: 2 stars Group 4/5T/5B/5S: 2.5 stars Group 6C: 3.3 stars Group 6C/6U/7: 2.5 stars
Group 1: 2 stars Group 4/5T/5B/5S: 2.7 stars Group 6C: 3.3 stars Group 6U/7: 2.5 stars
Group 1: 2 stars Group 4/5T/5B/5S: 2.7 stars Group 6C: 3.3 stars Group 6U/7: 2.5 stars
Other requirements ESC register (registration implied)
Registered for energy labelling
Activity register None
Deemed savings per replacement
Formula based on volume, energy and group to estimate energy savings – mirrors star rating equation (emissions)
Complex – lookup table based on star rating, 2 size bins for Groups 1/2/3, 3 size bins for other groups (MWh)
Same as Victoria with different overall adjustment factor (emissions)
Equation based on energy labelling algorithm adjusted for in use energy consumption and program factors (GJ electricity)
Referenced Standards AS/NZS 4474.1-2007 (and 1997), AS/NZS 4474.2-2009
AS/NZS 4474.1-2007 AS/NZS 4474.2-2009
AS/NZS 4474.1 (undated) AS/NZS 4474.2 (undated)
AS/NZS 4474.1 AS/NZS 4474.2
Notes: Requirements are complex have been simplified for this table. * All VEET specifications have different emission factors for metropolitan versus regional installations. (1) Recommended that appliance purchases in South Australia intended for residential and commercial use be permitted. Group 2 or 3 not included.
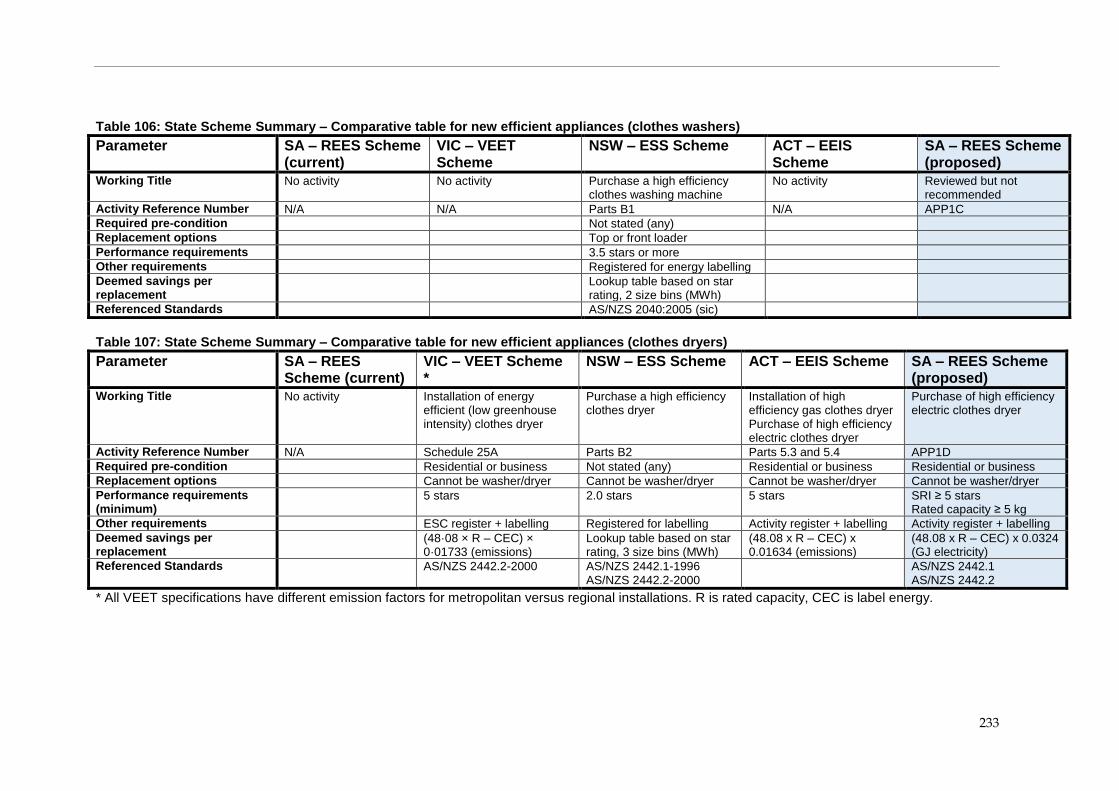
R 233
Table 106: State Scheme Summary – Comparative table for new efficient appliances (clothes washers)
Parameter SA – REES Scheme (current)
VIC – VEET Scheme
NSW – ESS Scheme ACT – EEIS Scheme
SA – REES Scheme (proposed)
Working Title No activity No activity Purchase a high efficiency clothes washing machine
No activity Reviewed but not recommended
Activity Reference Number N/A N/A Parts B1 N/A APP1C
Required pre-condition Not stated (any)
Replacement options Top or front loader
Performance requirements 3.5 stars or more
Other requirements Registered for energy labelling
Deemed savings per replacement
Lookup table based on star rating, 2 size bins (MWh)
Referenced Standards AS/NZS 2040:2005 (sic)
Table 107: State Scheme Summary – Comparative table for new efficient appliances (clothes dryers)
Parameter SA – REES Scheme (current)
VIC – VEET Scheme *
NSW – ESS Scheme ACT – EEIS Scheme SA – REES Scheme (proposed)
Working Title No activity Installation of energy efficient (low greenhouse intensity) clothes dryer
Purchase a high efficiency clothes dryer
Installation of high efficiency gas clothes dryer Purchase of high efficiency electric clothes dryer
Purchase of high efficiency electric clothes dryer
Activity Reference Number N/A Schedule 25A Parts B2 Parts 5.3 and 5.4 APP1D
Required pre-condition Residential or business Not stated (any) Residential or business Residential or business
Replacement options Cannot be washer/dryer Cannot be washer/dryer Cannot be washer/dryer Cannot be washer/dryer
Performance requirements (minimum)
5 stars 2.0 stars 5 stars SRI ≥ 5 stars Rated capacity ≥ 5 kg
Other requirements ESC register + labelling Registered for labelling Activity register + labelling Activity register + labelling
Deemed savings per replacement
(48·08 × R – CEC) × 0·01733 (emissions)
Lookup table based on star rating, 3 size bins (MWh)
(48.08 x R – CEC) x 0.01634 (emissions)
(48.08 x R – CEC) x 0.0324 (GJ electricity)
Referenced Standards AS/NZS 2442.2-2000 AS/NZS 2442.1-1996 AS/NZS 2442.2-2000
AS/NZS 2442.1 AS/NZS 2442.2
* All VEET specifications have different emission factors for metropolitan versus regional installations. R is rated capacity, CEC is label energy.

R 234
Table 108: State Scheme Summary – Comparative table for new efficient appliances (dishwashers)
Parameter SA – REES Scheme (current)
VIC – VEET Scheme NSW – ESS Scheme ACT – EEIS Scheme SA – REES Scheme (proposed
Working Title No activity No activity Purchase a high efficiency dishwasher
No activity Reviewed but not recommended
Activity Reference Number N/A N/A Parts B3 N/A APP1E
Required pre-condition Not stated (any)
Replacement options Any
Performance requirements 3.0 stars or more
Other requirements Registered for energy labelling
Deemed savings per replacement
Lookup table based on star rating, 3 size bins (MWh)
Referenced Standards AS/NZS 2007:2005 (sic)
Table 109: State Scheme Summary – Comparative table for new efficient appliances (televisions)
Parameter SA – REES Scheme (current)
VIC – VEET Scheme *
NSW – ESS Scheme ACT – EEIS Scheme SA – REES Scheme (proposed)
Working Title No activity Installation of high efficiency television
Purchase a high efficiency television
Purchase of a high efficiency television
Purchase of a high efficiency television
Activity Reference Number N/A Schedule 25A Parts B7 Part 5.6 APP1F
Required pre-condition Residential or business Not stated (any) Residential or business Residential or business
Replacement options Any Any Any Any
Performance requirements (minimum)
5.5 stars, CEC ≤ 450 kWh/y (Tier 1)
4.0 stars (2013 Tier 2) 5.5 stars, CEC ≤ 450 kWh/y (Tier 1)
6.5 stars in 2016, 7.0 stars in 2016, 7.5 stars in 2017 (Tier 2)
Other requirements Registered for energy labelling
Registered for energy labelling
Registered for energy labelling
Registered for energy labelling
Deemed savings per replacement
[0·512 × (SA × 0·1825 + 127·5) – CEC] × 0·01079 (emissions)
Lookup table based on star rating, 3 size bins (MWh)
[0·512 × (SA × 0·1825 + 127·5) – CEC] × 0·00762 (emissions)
Dynamic baseline based on calendar year set to reflect current and likely market trends
Referenced Standards AS/NZS 62087.1:2010 AS/NZS 62087.2.2:201
AS/NZS 62087.1:2010 AS/NZS 62087.2.2:2011
AS/NZS 62087.2.2 (undated)
AS/NZS 62087.2.2
* All VEET specifications have different emission factors for metropolitan versus regional installations. SA is surface area, CEC is label energy.

R 235
Scheme Review - Potential of the activity (overview) ABS4602 data shows that there is a large stock of the covered appliances in South Australia, so there is a large potential to reduce energy consumption through the installation of more efficient appliances. Figure 17: Trends in appliance ownership in South Australia
Source: ABS4602 (2011) and author estimates
All of the appliances under consideration are currently regulated for energy labelling (this has effectively been in place since the 1980’s and has been updated several times, depending on the appliance). All of the appliances being examined have minimum non-energy performance requirements defined in the relevant standards. The current regulatory status by product is as follows:
Refrigerators and freezers: label regrade in 2010, MEPS levels in 2005 (equivalent levels reaffirmed in 2010), new MEPS and revised basis for energy labelling proposed for 2017.
Clothes washers: label regrade in 2000, mandatory water labelling from 2006.
Clothes dryers: label regrade in 2000.
Dishwashers: label regrade in 2000, mandatory water labelling from 2006.
Televisions: labelling and MEPS commenced in 2009, label re-grade and new MEPS in 2013.
Because all of these appliances have been regulated for some time, there is generally good information on the range of efficiency on the market. For many of these products, sales weighted data has been obtained and analysed for many years, so there is good data on sales weighted trends as well (EES 2010a). This is important for the establishment of a business as usual case for each product and the estimation of energy savings over and above the business as usual case for an appliance that is significantly better than average. While all of these products have been regulated for some time and the energy consumption under standardised conditions is well documented, it is important to understand the
0.0
0.2
0.4
0.6
0.8
1.0
1.2
1.4
1.6
1990
1993
1996
1999
2002
2005
2008
2011
2014
2017
2020
Ow
ners
hip
Year
Summary for South Australia
Refrigerator Clothes Washer Freezer Clothes Dryer Dishwasher
Actual
Projected

R 236
differences between the energy value determined in the test laboratory and reported on the energy label and the energy consumption that is expected in the field under a range of normal use conditions. In some cases, these can be very different. The main objective for REES is to save energy during use, so it is necessary to make adjustments to the likely energy savings so they better reflect typical usage conditions. Detailed discussion on the types and magnitude of adjustments required are set out in Section 2.5 of Greening Whitegoods (EES 2010a) and also EES (2008).
Assessment Against Scheme Principles This activity aligns with all major policy objectives, except that the potential for low income households might be lower than the general population (although this segment still require new appliances from time to time).
Table 110: Activities Alignment with Policy Objective - Efficient Appliances
Policy Objective Reduces household and/or business energy use Provides a focus on low income households
Associated Objectives: Provides greenhouse gas emission benefits
Provides energy cost benefits
The following table provides an assessment of the activity against the new principles proposed for REES code. Table 111: Activity Alignment with REES General Principles (Efficient Appliances)
Principle Assessment
1. Provides evidence based energy savings
The basis for energy savings associated with this activity is well evidenced. All products are registered for energy labelling (and MEPS where applicable) and there is a well- established system of verification and enforcement in place for these products.
2. Energy savings are additional to base case (BAU) and minimises free riders
As there is no requirement for an existing appliance in this specification, the additionality can be clearly defined as the difference between the business as usual case (without REES) and the efficiency level of the appliance selected. For this to be effective, it is important to have credible and reliable data on which to establish an accurate business as usual case. Generally this data is available for the target products (both registration data and sales). New appliances will be purchased in any case and the specification leverages on these purchases to encourage the selection of high efficiency appliances. Some free riders will exist, but accounted for through energy saving discounts. Another important consideration is the regulatory context for these products. For televisions, revised energy labelling thresholds and Tier 2 MEPS levels were introduced in 2013. These need to be considered in any business as usual case. Television efficiency has been improving at a rapid rate since energy labelling commenced in 2009, with around a 20% increase in energy efficiency per year over the period to date. This is an order of magnitude faster than most appliances and it means that a more dynamic business as usual case is justified. A range of new technologies may also enter the market in this period, which could further drive down energy consumption. For refrigerators and freezer, stringent new MEPS levels are proposed for 2017 (still subject to regulation impact assessment processes). This is likely to have a significant impact on the energy consumption of products offered on the market from 2016 (of the order of a 30% reduction in energy over a 2 year period). The basis of energy labelling is also likely to change in 2017 as the test method is moved to the new global IEC standard. These changes at the end of the period of analysis for this review, but these impacts need to be considered. But scheme stability is also an important consideration. All of the wet appliances (washers, dryers and dishwashers) are also scheduled to move to IEC test methods in the period 2017 to 2020, but this should not create too many difficulties in the time frame being considered.

R 237
Principle Assessment
3. Reward best practice in relation to product performance
Energy savings are scaled on the basis of individual model performance and efficiency, providing higher savings for more efficient models. Savings are mapped to energy labelling algorithms but adjusted to normal conditions of use.
4. Provides a means for ensuring quality assurance and participant satisfaction
All products are covered by performance standards that set out energy and non-energy requirements to ensure satisfactory energy services are delivered. Purchase of these products is routine. Pre-existing defined standards and government rating schemes already support the quality assurance and performance of these products.
5. Credible approach for the calculation of energy savings
Energy saving can be readily calculated from publicly available data. A wide range of field data has been used to ensure that energy savings are adjusted back to typical conditions of use.
6. Provides scope for objective, cost effective and practical auditing
Purchase of the equipment as part of the activity can be audited through retailer sales records and ledgers.
7. Good practice As this activity is targeted at retail sales, so the installation and removal of old products is up to the purchaser (not directly covered by the activity).
8. Harmonisation (as far as practical)
This activity is available in NSW, ACT and Victoria, although the products covered and the specifications do vary somewhat (NSW in particular takes a somewhat different approach). While there is potential for alignment with existing state schemes, it is important that a sound business as usual case be established (based on the latest and best data sets) and the current regulatory context also be considered. Alignment is recommended with Victoria and ACT for refrigerators, freezers and dryers. Updated requirements are recommended for televisions as all schemes are out of date. No requirements are recommended for clothes washers and dishwashers.
9. Safety and minimising overall risk
The process of appliance replacement is common and routine. All products have to comply with relevant safety standards. All installations should be in accordance with manufacturer’s instructions. Installation of a high efficiency system (over a standard system) presents no additional risk to participants.
Energy Savings - Review Overview of methodology For all of the products covered by efficient new appliances, the methodology used to establish energy savings can be broadly summarised as follows:
Establish the current average energy consumption by product size and type under the energy labelling scheme (2014 where possible).
Take into account historical trends in energy, efficiency and size of products in recent years in order to project an estimated energy consumption over the target period for REES in 2015 to 2017. Consider whether a static or dynamic base is warranted.
Take into consideration any recent or proposed regulatory changes to the target products (in particular MEPS for primary refrigerators, freezers and televisions).
Identify the best available products on the market and a reasonable minimum efficiency premium over the business as usual case before REES energy savings are eligible to be counted.
Examine other state specifications and consider how these can be aligned and/or adapted for South Australia.
Look at the adjustments that are required to convert energy determined in accordance with the relevant standard (energy label value) back to energy consumption that is expected during normal use (specifically with respect to operating conditions, usage, loading and other settings that impact on energy).
Registration data and a range of published analysis of sales weighted trends will be considered wherever this is available. Data on usage and key settings from published reports will be used wherever possible.

R 238
The underlying assumptions used as the basis for the calculation of energy savings in this study are detailed in Table 112.
Table 112: Energy Savings Estimate – Underlying Key Assumptions (efficient appliances)
Parameter Value Basis / Comment
Energy Service Levels Refrigerator and freezers Climate
factors As per EES (2008)
Clothes washers 312 loads/y As per EES (2008), field data
Clothes dryers 60 loads/y As per EES (2008), close to energy label
Dishwashers 175 loads/y As per EES (2008), field data
Televisions 5.5 hours/d Field data (cf label = 10 hours per day)
Base Case Assumptions Cold water temperature 20°C As per wet product standards
Program Labelling Washers also include cold or cooling washing
Ownership Various As per ABS4602
REES Activity Assumptions
Ownership * * As per base case (sales stream not used in setting of specifications)
Performance
As per standards
Same requirements for BAU and high efficiency
Lifetime and persistence
Product lifetime Refrigerators and freezers Wet products Televisions
15 years 10 years 10 years
Actual life will be longer, assumed life for calculation of energy savings for REES, lifetimes align with stated value for ESS (NSW 12 years for refrigeration)
Product persistence Same as life Unlikely to be scrapped before assumed lifetime
Adjustment Factors
Additionality discount factor 1.0 Not applicable as additional impact is specifically quantified in methodology
Free rider discount 0.90 Some free riders who would have purchased very high efficiency appliances in any case
Rebound discount factor 1.0 Not relevant as base case and high efficiency case will be equivalent energy service
Compliance discount factor 1.0 Appliances will normally be installed correctly
Total Discount factor 0.90 Product of individual factors
Climatic Adjustments
Adjustments required? Refrigeration Climate factors required for South Australia with respect to adjustment of energy consumption for refrigerators and freezer to covert standard values to typical in use values
Energy Savings Calculation Basis for Estimating Savings – Refrigerators and Freezers The regulatory context for refrigerators and freezers is that mandatory energy labelling has been in force since the 1980s and there was an algorithm change in 2000. MEPS were first introduced in 1999 and were upgraded in 2005 to align with US levels. There was an algorithm change again in 2010 and a minor change in test method in 2010 (there was also a MEPS definition change, but the levels remained technically equivalent to 2005 levels). Government proposals for stringent new MEPS levels in 2017 (to align with US 2014 levels) have been in discussion since 2011. If implemented, most groups will be subjected to a 30% reduction in energy consumption by 2017. As part of this regulatory change, it is proposed to

R 239
move to the new IEC global test method for refrigerators and a rebase of energy labelling values to more accurately reflect typical energy during normal use. So there are a lot of changes that could be occurring in the period covered by this REES review (2015-2017). Victoria, ACT and NSW all have activity specifications for refrigerators and freezers. Victoria and ACT use a function that mirrors the star rating algorithm, while NSW specifies savings by size and star rating. NSW allow Group 2 and 3 products (typically small bar refrigerators) to be selected, while Victoria and ACT do not. Victoria and ACT have some size restrictions for different groups, while NSW does not. As with all appliance specifications, NSW sets out savings in the form of a table, which is split into size ranges and star ratings. This appears to have some underlying adjustments to correct for perceived size bias (or other factors not stated). The star rating algorithm for refrigerators and freezers have been carefully developed using a surface area (equivalent) function in order to minimise size bias in the star ratings. So an energy savings calculation that mirrors that star rating algorithm will be more preferable, robust and flexible than the table approach set out in NSW. The energy labelling approach for refrigerators and freezers is the same as used for all appliances (except for air conditioners). A 1 star line is defined (this is known as the Base Energy Consumption or BEC) and star band are defined as a defined energy reduction per additional star. This is called the Energy Reduction Factor (or ERF). The generic energy labelling equation is given as:
SRI =
ERF
BEC
CEC
1log
log
1e
e
Where: SRI is the star rating index (fractional star rating) CEC is the comparative energy consumption (energy that appears on the energy label) BEC is the base energy consumption – the equation for a product with an SRI of 1.0 ERF is the energy reduction factor – reduction in CEC for each additional star While this equation looks complex, it is very simple in practice. For refrigerators and freezers, the ERF is 0.23, so this means each time the energy is reduced by 23%, an extra star is earned. So star bands can easily be defined from the 1 star line as:
2 stars = BEC × 0.77
3 stars = BEC × 0.77× 0.77 (0.5929)
4 stars = BEC × 0.77× 0.77× 0.77 (0.4565) and so on This equation also allows half star bands to be accurately defined. Note that the size of each star band is smaller (in absolute kWh) for each additional star, but the percentage reduction from the previous star rating band is the same. Refrigerators and freezers are more complex than other whitegoods as the BEC line is defined as a curve (based on volume to the power of 0.67, which reflects relative surface area and which dictates heat loads into the compartments).
BEC = Cf + (Cv (Vadj tot)0.67)

R 240
There are 10 different groups for refrigerators and freezers. For energy labelling, these are grouped into 3 categories of products that provide similar energy services: 1 door refrigerators, 2 door refrigerator-freezers and separate freezers. The coefficients for each Group are set out in the following table. Table 113: Energy labelling coefficients for refrigerators and freezers
Appliance
group
Group description Fixed
allowance factor
(Cf)
kWh/year
Variable
allowance factor
(Cv)
kWh/year/L
Energy
Reduction
Factor
(ERF)
1 All refrigerator 200 4.0 0.23
2 Refrigerator with ice maker 200 4.0 0.23
3 Refrigerator with short term
freezer
200 4.0 0.23
4 Refrigerator with long term
freezer
150 8.8 0.23
5T Top mounted frost free
refrigerator-freezer
150 8.8 0.23
5B Bottom mounted frost free
refrigerator-freezer
150 8.8 0.23
5S Sideside frost free
refrigerator-freezer
150 8.8 0.23
6C Chest freezer 150 7.5 0.23
6U Manual defrost vertical
freezer
150 7.5 0.23
7 Frost free vertical freezer 150 7.5 0.23
Notes: Source AS/NZS4474.2. Groups 1, 5 and 7 are fully automatic defrost. Groups 2, 3, 4 and 6 have manual defrost freezer.
In contrast to energy labelling, each group has its own separate MEPS level. These are on the basis of straight lines, so do not always align with the energy labelling star bands (but this is of little consequence consumers do not see MEPS lines nor are they aware of their impact). However, these need to be considered when setting base levels for energy savings calculations. The Victorian and ACT activity specifications for each Group are considered in detail below. Generally, the overall scaling factor is ignored as this converts annual electricity savings to a state based lifetime emission estimate, so is less relevant for REES. Impact of MEPS in 2017 There are well developed proposals to introduce stringent new MEPS levels for refrigerators and freezers in 2017. These are to be based on upgraded US MEPS levels being introduced in 2014. A range of reports analyse the potential impacts in detail. EES 2012b sets out the likely energy impact by Group (see Table 8 of that report). Typically, MEPS will reduce energy of most Groups by about 30% (MEPS is a maximum permitted energy – products have to lie below the MEPS energy line). While there is still some uncertainty regarding the timing for implementation, it would appear fairly likely that these requirements will be implemented, possibly during the end of the current REES review period 2015-2017. The effect of MEPS will be to very quickly drive

R 241
down market average energy values. This means that the base efficiency values use to calculate energy savings are likely to become out of date during this period. For information, the indicative MEPS levels in 2017 are shown on the following figures for each group (in terms of current AS/NZS energy). It is important to note that this is only approximate and a different test method will be used for regulatory purposes at that time, so the absolute values will be different. The general recommendation regarding this issue is that a watching brief on market changes for refrigerators and freezers should be maintained during the current period and if necessary, adjustments should be made to the savings baseline for some or all Groups. All of the following analysis is assessed against the 2010 labelling algorithm. Group 1 Victoria and ACT requirements: 100 to 500 litres, minimum 2 stars Annual energy savings [0⋅9126 × (200 + 4 × (Vadj)0·67)] – CEC This savings equation uses the star rating approach. The factor 0.9126 equates to a base star rating for the calculation of saving of 1.35 stars. Latest market average data for Group 1 is 1.9 stars. Figure 18: Group 1 distribution of models – current records
While there are numerous small products, these have relatively few sales. Victorian and ACT requirements are somewhat out of date. However, the existing specification could be adopted is alignment is seen as critical. Otherwise recommended adjustments for Group 1 are:
0
100
200
300
400
500
600
700
0 200 400 600 800 1000 1200
Ener
gy (
kWh
/yr)
Total Adjusted Volume (L)
Group 1
CEC
MEPS 2010
MEPS 2017
1 Star
2 Star
3 Star
4 Star
5 Star
Current market average

R 242
Minimum star rating 2.5
Savings base adjusted to 1.9 stars ( current market average) = 0.7904
Retain Victorian and ACT size limits. On balance, adoption of the Victoria and ACT requirements is recommended to maximise interstate alignment (even though these are somewhat out of date for this group). Group 2 and 3 Requirements: Not covered by Victoria and ACT, permitted in NSW (see Table B4). Figure 19: Group 2 distribution of models – current records
Many Group 2 and 3 products are very small bar type products used in hotels and offices. Some are used in residential. There are some models that are moderately efficient (around 3 stars). There is probably not a strong case to include these products within REES. They could be included using the same savings equation as Group 1 products. If this were the case, some relaxation of the lower volume limit (to say 80 litres) could be considered. Given that these are not used as main household refrigerators, there is no strong case for their inclusion. Groups 4, 5T, 5B and 5S There have been long term trends in these Groups which need be understood. Group 4 has few models and sales. Group 5T makes up about half of sales but this continuing to decline (down to around 42% in 2013). Group 5S was increasing until about 2009 (15%) but is slowly declining. Group 5B is growing in share and is now over 25% (due to the popularity of French door models). Victoria and ACT requirements: 100 to 700 litres, minimum 2.7 stars
0
100
200
300
400
500
600
700
0 200 400 600 800 1000 1200
Ener
gy (
kWh
/yr)
Total Adjusted Volume (L)
Group 2
CEC
MEPS 2010
MEPS 2017
1 Star
2 Star
3 Star
4 Star
5 Star
Current market average

R 243
Annual energy savings [0.6954× (150 + 8.8 × (Vadj)0·67)] – CEC This savings equation uses the star rating approach. The factor 0.6954 equates to a base star rating for the calculation of saving of 2.39 stars. Latest market average data for each Group is:
Group 4 is 2.61 stars
Group 5T is 2.60 stars
Group 5B is 2.34 stars
Group 5S is 2.09 stars Figure 20: Group 4 distribution of models – current records
Figure 21: Group 5T distribution of models – current records
0
200
400
600
800
1000
1200
0 200 400 600 800 1000 1200
Ener
gy (
kWh
/yr)
Total Adjusted Volume (L)
Group 4
CEC
MEPS 2010
MEPS 2017
1 Star
2 Star
3 Star
4 Star
5 Star
Current market average

R 244
Figure 22: Group 5B distribution of models – current records
Note: Some products appear above MEPS as these will have features that attract allowance such as ice makers and additional doors – these are not include in the MEPS line
Figure 23: Group 5S distribution of models – current records
0
200
400
600
800
1000
1200
0 200 400 600 800 1000 1200
Ener
gy (
kWh
/yr)
Total Adjusted Volume (L)
Group 5T
CEC
MEPS 2010
MEPS 2017
1 Star
2 Star
3 Star
4 Star
5 Star
Current market average
0
200
400
600
800
1000
1200
0 200 400 600 800 1000 1200 1400
Ener
gy (
kWh
/yr)
Total Adjusted Volume (L)
Group 5B
CEC
MEPS 2010
MEPS 2017
1 Star
2 Star
3 Star
4 Star
5 Star
Current market average

R 245
Note: Some products appear above MEPS as these will have features that attract allowance such as ice makers and additional doors – these are not include in the MEPS line
Victorian and ACT requirements appear to be a compromise base line efficiency that covers all Groups. The current base line is roughly equal to average Group 5B and somewhat less than average Group 5T. However, the existing specification could be adopted if alignment is seen as critical. Otherwise recommended adjustments for Groups 4, 5T, 5B and 5S are:
Minimum star rating 3.0
Savings base adjusted to 2.5 stars = 0.6757
Retain Victorian and ACT size limits. On balance, adoption of the Victoria and ACT requirements is recommended to maximise interstate alignment. Groups 6U, 6C and 7 For many years the share of sales by Group has been fairly stable. Group 6C has about 45% share, Group 7 17% share and Group 6U 38% share. Sizes are also stable. Victoria and ACT requirements: Chest freezers Group 6C: 100 to 700 litres, minimum 3.3 stars Upright freezers Groups 6U and 7: 100 to 400 litres, minimum 2.5 stars Annual energy savings chest [0.6329 × (150 + 7.5 × (Vadj)0·67)] – CEC Annual energy savings upright [0.77 × (150 + 7.5 × (Vadj)0·67)] – CEC This savings equation uses the star rating approach. The factor 0.6329 for chest freezers equates to a base star rating for the calculation of saving of 2.75 stars. The factor 0.77 for
0
200
400
600
800
1000
1200
0 200 400 600 800 1000 1200 1400
Ener
gy (
kWh
/yr)
Total Adjusted Volume (L)
Group 5S
CEC
MEPS 2010
MEPS 2017
1 Star
2 Star
3 Star
4 Star
5 Star
Current market average

R 246
upright freezers equates to a base star rating for the calculation of saving of 2.0 stars. Latest market average data for each group is:
Group 6U is 2.26 stars
Group 7 is 1.59 stars
Group 6C is 2.74 stars Victorian and ACT requirements are satisfactory for freezers and should be adopted for REES. Summary of findings and recommendations The following table summarises that market average for each Group examined for this review and existing baselines and criteria for calculation of energy savings in Victoria and ACT. Table 114: Summary of data for all refrigerator and freezer Groups
Energy by Star Group 1 Group 2 Group 4 Group
5T Group
5B Group
5S Group
6U Group 7 Group
6C
Representative Vadj litres 343 101 298 425 614 761 198.4 465.6 348.8
1 399.9 288.1 550.1 657.6 799.5 899.9 409.7 609.9 529.0
1.5 350.9 252.8 482.7 577.0 701.5 789.7 359.5 535.2 464.2
2 307.9 221.8 423.6 506.3 615.6 692.9 315.4 469.6 407.3
2.5 270.2 194.7 371.7 444.3 540.2 608.0 276.8 412.1 357.4
3 237.1 170.8 326.2 389.9 474.0 533.6 242.9 361.6 313.6
3.5 208.0 149.9 286.2 342.1 415.9 468.2 213.1 317.3 275.2
4 182.5 131.5 251.2 300.2 365.0 410.8 187.0 278.4 241.5
4.5 160.2 115.4 220.4 263.4 320.3 360.5 164.1 244.3 211.9
5 140.6 101.3 193.4 231.2 281.0 316.3 144.0 214.4 185.9
5.5 123.3 88.9 169.7 202.8 246.6 277.6 126.4 188.1 163.2
6 108.2 78.0 148.9 178.0 216.4 243.6 110.9 165.1 143.2
Market Av Energy 315 246 361 433 563 677 295 523 336
Market Av SRI 1.91 1.60 2.61 2.60 2.34 2.09 2.26 1.59 2.74
Vic/ACT Base for Savings (SRI) 1.35 N/A 2.39 2.39 2.39 2.39 2.00 2.00 2.75
Vic/ACT Eligibility (SRI) 2.0 N/A 2.7 2.7 2.7 2.7 2.5 2.5 3.3
Apart from Group 1, which appears to be somewhat out of line with the current market, it appears that the current Victoria and ACT requirements are generally satisfactory. The method is fairly transparent and it is recommended that eligibility and base for the calculation of energy savings be defined as a function of the star rating algorithm, as currently the case. Pragmatically, it is probably most useful to align South Australian REES for this new activity with existing Victorian and ACT requirements, despite some minor issues (Group 1). Major changes are on the horizon, so there is little point in setting up a new, separate system for South Australia as, at best, this will only be relevant for a few years. It would be useful, once the impact of MEPS 2017 becomes clearer, it would make sense for all states that are operating similar schemes to review the market and set uniform specifications as far as possible.

R 247
Overall Adjustments to Estimate Savings During Normal Use for Refrigerators and Freezers Refrigerators and freezers are tested in a hot room (32°C ambient) at defined internal temperatures in order to determine energy consumption. There is no user interaction and no loads to cool. This is obviously not very representative of normal use. However, the test procedure does not really record information about energy and performance that allows the energy during normal use to be estimated. This situation will be dramatically improved with the introduction of the new IEC test method, which will quantify a range of different conditions that will allow a better estimate of in use energy to be made. There is not that much information on factors to adjust test laboratory energy back to normal use conditions. There is extensive research being undertaken on this issue at present, but the outputs will not be published for some time. In the meantime, the adjustment factors have been used for a number of studies such as EES (2008) and are based on review of available data from a range of sources. For South Australia, the climate adjustment is 0.90 for refrigerators and 0.85 for separate freezers (see Table 17 in EES 2008). These factors have been broadly confirmed through more recent end use monitoring, although adjustments for individual households and specific refrigerator models will always vary from this mean adjustment. Calculation of Lifetime Savings for Refrigerators and Freezers Once the annual savings are calculated from the assume base line for each group, these savings are then adjusted by the in use factor and summed over the assumed product life. For refrigerators and freezers, the assumed life for REES savings should be 15 years. The average life of these products is somewhat longer than 15 years, but this is a reasonable base for the calculation of REES savings credits. To covert annual electricity savings from the algorithm calculation (in kWh/year), the values are multiplied by 0.0486 for refrigerators and 0.0459 for freezers to get lifetime GJ electricity savings during normal use (includes factor to adjust standard values to normal use). A further program factor of 0.9 should be applied to these values to account for free riders (see assumptions), giving overall factors of 0.04374 for refrigerators and 0.04131 for freezers to get lifetime GJ electricity savings during normal use The following table sets out sample calculations for some of the most efficient products currently on the market in Australia for each group. These have been selected to be close to the representative size for each group as far as possible (so they may not be the product with the highest SRI).

R 248
Table 115: Sample energy savings calculations for refrigerators and freezers – most efficient current models
Group
Base Savings Factor
Fixed Cf kWh/y
Variable Cv
kWh/y Brand Model CEC
kWh/y Vadj litres Stars
Baseline energy kWh/y
REES Savings kWh/y
In use adjust
REES lifetime
saving GJ
Group 1 0.9126 200 4 LIEBHERR KP4260 200 405 3.5 386 186 0.9 9.1
Group 4 0.6954 150 8.8 Smeg FAB28*1 246 272 3.5 366 120 0.9 5.8
Group 5T 0.6954 150 8.8 ELECTROLUX ETM4200SC 318 478 4.0 486 168 0.9 8.2
Group 5B 0.6954 150 8.8 LG GN-W450UPL 341 543 4.0 520 179 0.9 8.7
Group 5S 0.6954 150 8.8 ELECTROLUX ESE7007SC 525 848 3.0 665 140 0.9 6.8
Group 6U 0.7700 150 7.5 GRAM FS 3105-90 193 163 3.5 291 98 0.85 4.5
Group 7 0.7700 150 7.5 MIELE FN 12827 S 310 486 3.5 480 170 0.85 7.8
Group 6C 0.6329 150 7.5 Vestfrost SW321 256 510 4.5 404 148 0.85 6.8
Notes: Sample products selected from current registrations and are illustrative only. Other products may have higher SRI. Volume selected to be close to typical volumes for each group to give indicative upper estimated of REES savings. Base savings factors from Victoria/ACT as recommended for REES. Lifetime savings in GJ DO NOT include additional program factor of 0.9.

R 249
Basis for Estimating Savings – Clothes Washers The regulatory context for clothes washers is that mandatory energy labelling has been in force since the 1980s and there was a labelling algorithm change in 2000. A change is proposed to the IEC test method, but this will not be until at least 2018. Some proposals to include part load testing and cooler washing energy into the label have been on the table for some years but this has not been progressing in recent times. Any such change is likely to be bundled with the test method change. Clothes washers are subjected to mandatory water labelling and are now also subject to mandatory water efficiency standards (WELS). From 2000 front loaders increased their market share from 12% to around 50% in 2013. NSW is the only state that defines clothes washer requirements. Savings credits earned are set out in the following table, which has been reproduced from ESS Activity Definition B1. Table 116: NSW ESS Deemed savings for clothes washers by size and star rating - MWh
Star Rating 4-8 kg >8kg
3.5 0.4 0.9
4.0 1.1 1.7
4.5 1.6 2.5
5.0 2.1 3.1
5.5 2.6 3.6
6.0 2.9 4.1
For a standard sized clothes washer (7 kg), this suggests a base line reference in NSW for the calculation of savings of around 3.0 stars, with the first savings earned at 3.5 stars or more. 4 stars earns 1.1 MWh, which translates to 110 kWh per year (over an assumed 10 year life). It is important to understand how the clothes washer rating system works in some detail. The 1 star line for clothes washers (BEC) is as follows: BEC = 115 × rated capacity with an energy reduction factor of 0.27 (per star). The star rating algorithm for clothes washers is more complex than for other products as it assumes some energy associated with remaining moisture content in the load after spinning for clothes drying.
SRI =
27.01log
log
1e
eErefBEC
EmCEC
Em and Eref are implied energy associated with dryer usage. This is not included in the comparative energy consumption on the label, but a machine with a better spin performance will get a better star rating (for the same energy). Most machines now have a spin performance in the range 0.5 to 0.80 so a typical value is around 0.65 (sales weighted average in 2009). As actual spin performance does vary by machine, it is difficult to take the precise effect into account in the star

R 250
rating. However, empirical analysis of all registration data shows that Em tends to improve roughly at the same rate as energy down to around 3 stars. In the current market, 3 stars is a good machine and many of these have good spin performance. In order to achieve better than 3.5 stars, manufacturers have had to lower the CEC energy even more because they have tended to reach the limit of achievable spin performance. Table 117: Label energy for various star ratings – 7kg washer
Stars
CEC (no spin)
kWh/year
CEC adjusted
kWh/year
1 805 805
1.5 688 688
2 588 588
2.5 502 502
3 429 429
3.5 367 348
4 313 282
4.5 268 227
5 229 183
5.5 195 146
6 167 117 Note: No spin (column 2) assumes that Em scales with star rating in proportion to ERF with increasing stars. Beyond around 3.5 stars, an ongoing decrease in spin performance is not technically possible. So suppliers have to reduce CEC to earn extra stars. The adjusted values in (column 3) approximately reflect the market based energy break points for each star rating band.
Effectively the better spin performance of most washers allows their energy to be worse for a low star rating, because of the implied energy consumed in some dryers when used to dry the load at completion. However, as the star rating improves, the CEC has to be better as there are technical limits on spin performance. The above data suggests that the NSW assumption is that the market average washer is around 3.1 stars as the base and they assume something similar to the adjusted CEC to calculate direct energy savings. In policy terms, using the adjusted CEC is a better indicator of the energy reductions in washers by star rating. It is very important to understand the conditions used for testing of clothes washers compared to typical conditions of use. Firstly, the labelling algorithm assumes 365 loads per year. Field data suggests that an average usage level of around 300 to 310 loads per year is typical (EES 2008). This would mean an adjustment to the label value of around 0.85. The next important factor is wash temperature. It is well documented, through surveys conducted by Choice and ABS4602, that a majority of householders use cooler wash temperatures then the warm wash specified on the energy label (EES 2011c). There has been a strong trend towards cooling washing for many years. While there is some variation at a state level and some uncertainty regarding average wash temperatures, in simple terms around 60% of washes are in cooler water and 40% are in warm water (almost no washes are conducted at hotter temperatures). This is now complicated somewhat by the dominance of front loading machines, as the coolest program option on many of these machines is 30°C (or sometimes lower). So this trend is likely to be pushing the share of warm washes up

R 251
slightly. The current best estimate is that 50% of washes are cold and 50% are warm. The wash temperature is a critical element as, under the energy labelling test conditions, around 80% of the total energy is used to heat water to the required warm wash temperature. A machine that uses say 360 kWh/year on a warm wash, would only use 70 kWh/year on a cold wash. An intermediate wash temperature could have energy of around 200 kWh/year (depending on the exact setting). This means that label energy values need to be adjusted by around 0.6 to more accurately reflect in use energy consumption with typical wash temperatures. The third critical factor in normal use is loading. While there has been a long term increase in the average load capacity of all washer types (from 5.2kg in 1993 to 7kg in 2011), there is little evidence that load sizes that consumers place in their machines is changing much. In fact, three separate and completely independent surveys (see EES 2011c for details) show that average load sizes in the home are around 3.5kg and that this is fairly independent of washer capacity. Most machines have load sensing capability, so the energy and water consumed in normal use would usually be somewhat less than the values measured in the standard (although this impact is currently not assessed for the purposes of energy labelling, but an option to do so is proposed). The best available data suggests that a reduction in energy to around 0.75 of the standard value would be a reasonable adjustment for loads during normal use that are on average much lower than rated capacity. The test conditions for AS/NZS2040 assume air and water temperatures of 20°C. Annual average temperature data for 5 years (based on daily maximum and minimum data from the Bureau of Meteorology puts average Adelaide temperatures at about 18°C. In any case, air temperatures have only a very small impact on clothes washer energy so this can be ignored. Cold water temperatures (according to AS/NZS4234 for Zone 3) are about 17.7°C average during the year (published data from Water Services Association of Australia puts measured annual data for Adelaide at 17.9°C, so this is broadly representative). An efficient 4 star clothes washer (8 kg) uses around 20 litres of heated water. The energy impact of 18°C versus 20°C cold water for 20 litres per cycle is 46 Wh in a total energy per cycle of around 300 Wh (15%). This should be included as a separate adjustment factor. In order to get a more accurate of estimate, the following adjustment factors need to be applied to the energy labelling values:
Adjustment to reflect mix of cold and warm wash: 0.6
Adjustment to reflect loading less than rated capacity: 0.75
Adjustment to reflect colder water for South Australia: 1.15
Overall adjustment: 0.52 Since 2009, the market average capacity has increased slightly from 6.9kg to 7.2kg and the energy has declined around 7% from 410 kWh/year to 383 kWh/year (internal review of recent GfK data). Average energy for drum types has increased slightly, while average energy for top loads has been steady. The slight decrease in average energy has resulted from a small increase in market share of drum machines from 45.5% in 2009 to 50% in 2013. This represents a market average star rating in 2013 of 3.4 stars.

R 252
Figure 24: Clothes washer registrations 2012 to 2014
It is useful to consider that there are currently very few products that rate at 5 stars or more (currently 9 models). So the savings base beyond that market average is somewhat limited. If we consider the base efficiency at 3.5 stars and examine the savings that would accrue from products that achieve 4.5 stars, this would be an energy reduction on the energy label from 348 kWh/year to 227 kWh/year (using adjusted CEC values in Table 117), a saving of 121 kWh/year. However, this energy estimate is for tests conducted at the energy labelling conditions to AS/NZS2040, so the adjustments noted above have to be applied to these savings. An overall adjustment of 0.52 brings this annual saving down to 63 kWh/year. Over an assumed 10 year life, this would represent 630 kWh or 2.3 GJ of energy. Some of this energy will be associated with gas and solar hot water systems (all top loaders and around 40% of front loaders will use external hot water for warm washes, so the energy intensity of hot water needs to be applied to the majority of the energy savings). So the energy benefits from the installation of efficient clothes washers are very modest indeed. This analysis has illustrated that the NSW energy saving credits appears to be overestimated for washers by a factor of 2.5 (smaller) or 4 (larger). In light of this analysis, it is not recommended that purchase of efficient clothes washers be included into REES as a new activity as the savings are quite low, there are few products on the market with high star ratings and many of the savings will be associated with hot water, which has a relatively low cost and greenhouse impact.
0
200
400
600
800
1000
1200
1400
4 5 6 7 8 9 10
Ener
gy (
kWh
/yr)
Capacity (kg)
CEC
1 Star
2 Star
3 Star
4 Star
5 Star
Sales weighted average 2013

R 253
Basis for Estimating Savings – Clothes Dryers The regulatory context for clothes dryers is that mandatory energy labelling has been in force since the 1980s and there was an algorithm change in 2000. A change is proposed to the IEC test method, but this will not be until at least 2017. Historically, most dryers have used resistive heaters and there has been little practical difference in efficiency between models (a small notional difference in autosensing models). Heat pump dryers, which use around half the energy of conventional have become more available in the past few years and provide an opportunity for significant energy reductions. Victoria, ACT and NSW all have activity specifications for electric clothes dryers. Victoria and ACT use a function that mirrors the star rating, while NSW specifies savings by size and star rating (table). Clothes dryers labelling uses the same general approach as other appliances by defining a one star line. This is defined as 53 × rated capacity. The energy reduction factor (per additional star) is exceptionally small for dryers at 15% energy reduction per additional star. This was in part because all dryers that use resistance heaters are more or less similar efficiency. In 2000, heat pump dryers had been developed in prototype, but no commercial models were available (they did not really reach the market until 2010). The current star rating has a slight size bias built into the algorithm. In 2000 the algorithm was adjusted to better reflect known usage patterns in homes. Previously, it was assumed that 150 loads per year at rated capacity were undertaken. This was adjusted down to 52 loads per year in 2000. In fact, review of field data suggests that a lot more than 52 loads per year are usually done, but that typical loading is normally a lot lower than the rated capacity (similar to washers – see previous discussion), so the net effect of 52 loads at rated capacity appears to be a more or less typical reflection of average field energy use. A dryer will be partly less efficient at drying a small load versus a large load, but this effect is much smaller than the direct effect of the load size itself. The dryer market has been very stable at about 300,000 units per year since 2005 (EES 2010). Based on an analysis of the current market, in 2013 the average capacity of all dryers was 5kg and the average energy was 235 kWh/year – this equates to a star rating of 1.8 stars (almost the same as in 2009). All parameters for dryers have been relative stable for some years. In 2011, just 0.5% of sales were heat pump dryers. This sales share climbed to 1% in 2012 and 2.5% in 2013. Early indications in 2014 are that these account for 4% of sales. Heat pumps have the potential to reduce energy significantly for dryers (to around 50% of a conventional dryer), but these come with a substantial price premium ($500 for conventional dryers compared to well over $2000 for heat pumps). Heat pump dryers currently have a capacity in the range 6kg to 9kg, which is significantly larger than conventional dryers and the average star rating is around 8 stars (maximum shown on the energy label is currently 6 stars). Table 118: Label energy for various star ratings – clothes dryers
Stars CEC 5kg CEC 7 kg
1 265 371
1.5 244 342
2 225 315
2.5 208 291
3 191 268
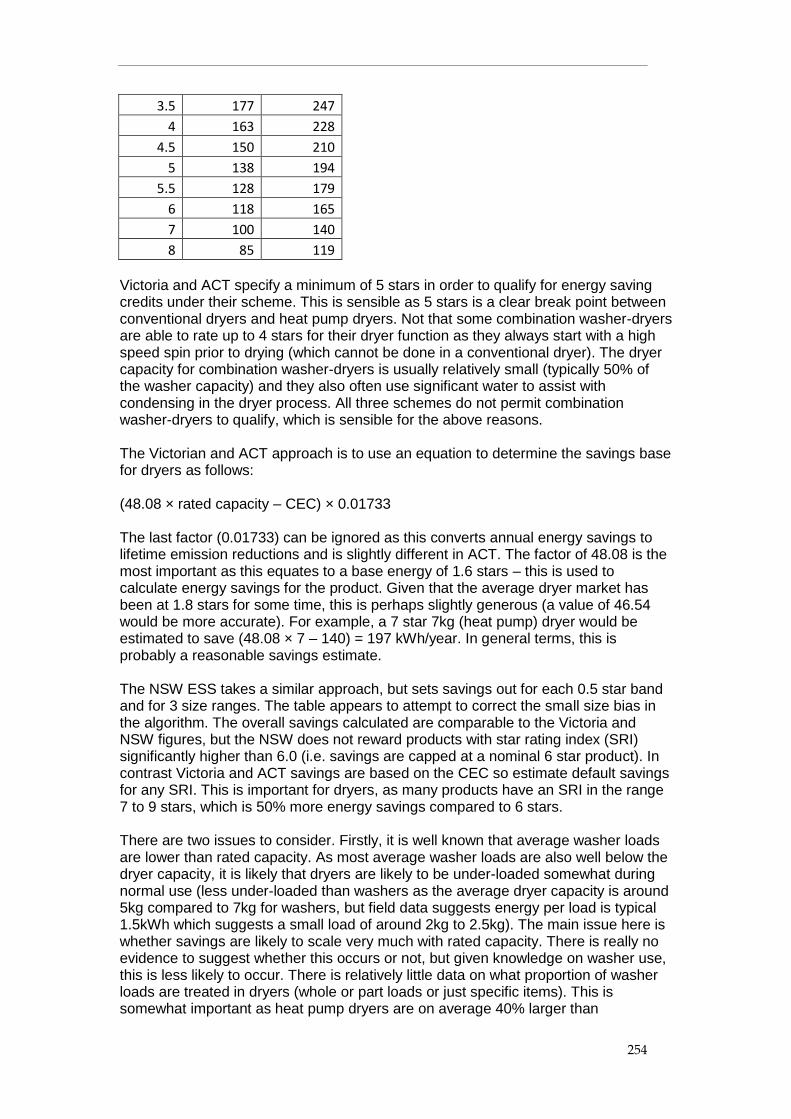
R 254
3.5 177 247
4 163 228
4.5 150 210
5 138 194
5.5 128 179
6 118 165
7 100 140
8 85 119
Victoria and ACT specify a minimum of 5 stars in order to qualify for energy saving credits under their scheme. This is sensible as 5 stars is a clear break point between conventional dryers and heat pump dryers. Not that some combination washer-dryers are able to rate up to 4 stars for their dryer function as they always start with a high speed spin prior to drying (which cannot be done in a conventional dryer). The dryer capacity for combination washer-dryers is usually relatively small (typically 50% of the washer capacity) and they also often use significant water to assist with condensing in the dryer process. All three schemes do not permit combination washer-dryers to qualify, which is sensible for the above reasons. The Victorian and ACT approach is to use an equation to determine the savings base for dryers as follows: (48.08 × rated capacity – CEC) × 0.01733 The last factor (0.01733) can be ignored as this converts annual energy savings to lifetime emission reductions and is slightly different in ACT. The factor of 48.08 is the most important as this equates to a base energy of 1.6 stars – this is used to calculate energy savings for the product. Given that the average dryer market has been at 1.8 stars for some time, this is perhaps slightly generous (a value of 46.54 would be more accurate). For example, a 7 star 7kg (heat pump) dryer would be estimated to save (48.08 × 7 – 140) = 197 kWh/year. In general terms, this is probably a reasonable savings estimate. The NSW ESS takes a similar approach, but sets savings out for each 0.5 star band and for 3 size ranges. The table appears to attempt to correct the small size bias in the algorithm. The overall savings calculated are comparable to the Victoria and NSW figures, but the NSW does not reward products with star rating index (SRI) significantly higher than 6.0 (i.e. savings are capped at a nominal 6 star product). In contrast Victoria and ACT savings are based on the CEC so estimate default savings for any SRI. This is important for dryers, as many products have an SRI in the range 7 to 9 stars, which is 50% more energy savings compared to 6 stars. There are two issues to consider. Firstly, it is well known that average washer loads are lower than rated capacity. As most average washer loads are also well below the dryer capacity, it is likely that dryers are likely to be under-loaded somewhat during normal use (less under-loaded than washers as the average dryer capacity is around 5kg compared to 7kg for washers, but field data suggests energy per load is typical 1.5kWh which suggests a small load of around 2kg to 2.5kg). The main issue here is whether savings are likely to scale very much with rated capacity. There is really no evidence to suggest whether this occurs or not, but given knowledge on washer use, this is less likely to occur. There is relatively little data on what proportion of washer loads are treated in dryers (whole or part loads or just specific items). This is somewhat important as heat pump dryers are on average 40% larger than

R 255
conventional dryers and the above algorithm assumes larger average loads. In the absence of more detailed research, it is suggested that the assumption that savings scale with capacity should be retained. The second issue is that the average use ascribed to dryers in the energy labelling algorithm is quite low (equivalent of 52 loads at rated capacity per year). During normal use, the average use per household varies considerably. Many houses rarely use their dryers, while a small proportion of houses use their dryers quite a lot. The following figure (from BRANZ 2000) is quite old, but is broadly reflective of observed dryer use in the field that has been subsequently collected. It covers 146 dryers in NSW over a 1 year period. This data set also shows that dryer use over winter is double the dryer use over summer. Figure 25: Cumulate energy versus number of appliances – NSW (after Pacific Power, 1994)
Source: BRANZ 2000
This figure illustrates that 50% of the total energy consumption for dryers is consumed by the top 15% of dryer users. The lowest 20% of users almost never use their dryer. By undertaken further analysis of the data, the implied distribution of dryer energy use can be estimated across all households.

R 256
Figure 26: Estimated distribution of annual dryer energy for 100 households
The conundrum here is that two thirds of typical users will use less energy (and therefore save less) than the energy label calculations would suggest (average line above). However, heavy users would use more energy and would save more with an efficient dryer. Heavy users, although few, can use a lot of dryer energy. This presents a difficult issue when calculating default energy saving factors. Clearly heat pumps should be targeted at heavy dryer users. Heavy users would save more than a default savings factor would suggest. But for an average user, default savings factors are a substantial overestimate of likely savings. However, given the high capital cost premium for heat pump dryers, it is hoped that heat pumps will be more likely to be considered by heavy dryer users rather than your average casual dryer user. Given the modest impact of any REES credit, it is hoped that heavy users will self- select heat pump dryers. There is little chance of REES providing adverse market signals. Dryers are recommended for inclusion into REES. The recommended approach is to calculate a default energy savings based on the Victoria and ACT approach. As an additional safeguard, a requirement for a rated capacity of not less than 5.0 kg should be included. REES lifetime savings = (48.08× rated capacity – CEC)× 0.036 × 0.9 GJ Where: 48.08 is a market average dryer of 1.6 stars (used in Victoria and ACT) Rated capacity is in accordance AS/NZS2442.1 in kg CEC is the annual energy registered for energy labelling and determined in accordance with AS/NZS2442.2 0.036 is a factor that converts annual kWh savings to lifetime GJ savings for electricity over an assumed 10 year life.
0
200
400
600
800
1000
1200
1400
1 3 5 7 9
11
13
15
17
19
21
23
25
27
29
31
33
35
37
39
41
43
45
47
49
51
53
55
57
59
61
63
65
67
69
71
73
75
77
79
81
83
85
87
89
91
93
95
97
99
Dry
er
en
erg
y kW
h/y
ear
Households
Implied dryer energy distribution
Distribution
Average

R 257
0.9 is a program related factor to account for free riders. A sample calculation for a heat pump dryer 7kg heat pump dryer with a CEC of 140 kWh/year would be: REES lifetime savings = (48.08× 7 – 140)× 0.036 × 0.9 GJ = 197 × 0.036 × 0.9 = 6.4 GJ of electricity saved It is recommended that the value of 48.08 be retained to retain full alignment with Victoria and ACT. The NSW approach is not recommended for REES. A factor of 46.54 could be used for REES to more accurately reflect the market average for dryers (1.8 stars) – this results in slightly lower lifetime savings for the above example of 6.0 GJ of electricity. However, a slightly more generous savings estimate (for users that are likely to be heavier than average) and alignment with other states outweighs any advantage of advantage of adopting a REES specific requirement. Other requirements for the activity should be retained (exclusion of combination washer-dryers, registered for energy labelling, retain at least 5 stars in order to qualify). Basis for Estimating Savings – Dishwashers The regulatory context for dishwashers is that mandatory energy labelling has been in force since the 1980s and there was an algorithm change in 2000. A change is proposed to the IEC test method, but this will not be until at least 2017 (current AS/NZS2007 is already very similar to the IEC test method in any case). Dishwashers are subjected to mandatory water labelling (WELS). The overwhelming majority (around 90%) of dishwashers sold are standard sizes in the range 12 to 14 place settings. NSW is the only state that defines dishwasher requirements. Savings credits earned are set out in the following table, which has been reproduced from ESS Activity Definition B3. Table 119: NSW ESS Deemed savings for dishwashers by size and star rating - MWh
Star Rating < 9 place settings 9-12 place settings >12 place settings
3.0 0.1 0.4 0.0
3.5 0.4 0.9 0.1
4.0 0.6 1.3 0.6
4.5 0.8 1.6 0.9
5.0 1.0 1.9 1.2
5.5 1.1 2.1 1.5
6.0 1.2 2.3 1.7
For a standard sized dishwasher (12 place settings), this suggests a base line reference in NSW for the calculation of savings of 2.5 stars, with the first savings earned at 3.0 stars or more. 4 stars earns 1.3 MWh, which translates to 130 kWh per year (over an assumed 10 year life). The star rating algorithm for dishwashers is as follows: BEC (1 star) = 48 x place settings. The energy reduction per additional star is 30%. For a 12 place setting product (for reference), the energy consumption for each star rating level is shown in the following table. Also shown is the annual energy saved from a base of 2.5 stars

R 258
and the lifetime energy saved – NSW appear to have scaled this by a factor of 0.9 (effectively assumes 365 x 0.9 uses per year = 329). The last column matches closely to the deemed savings in the EES schedule, except for very high star ratings (5 and higher). Effectively there are no products currently on the market at that star rating. Table 120: Label energy for various star ratings – 12 place setting dishwasher
Stars CEC label kWh/y
Annual Saving kWh/y
LifetimeMWh (label*0.9)
1 576 1.5 482 2 403 2.5 337 3 282 55 0.50
3.5 236 101 0.91
4 198 140 1.26
4.5 165 172 1.55
5 138 199 1.79
5.5 116 222 1.99
6 97 241 2.16 Notes: CEC as per energy label and AS/NZS2007 – assumed 365 uses per year, savings are calculated from base of 2.5 stars, assumed 10 year life.
AS/NZS2007.2 states that 365 uses per year are assumed for the comparative energy consumption on the energy label (1 load per day). Review of a range of field measurements for dishwashers suggests that this is quite a lot more frequent that average use. EES (2008) sets the number of uses per year at 175 (about once every second day). Recent field measurement conducted by EES found this to be broad representative (actual use varies from 0 to 400 times a year). So the energy label savings need to be adjusted down to reflect the lower frequency of use on the field. The recommended adjustment for usage is 175/365 = 0.48. The test conditions for AS/NZS2007 assume air and water temperatures of 20°C. Annual average temperature data for 5 years (based on daily maximum and minimum data from the Bureau of Meteorology puts average Adelaide temperatures at about 18°C. In any case, air temperatures have only a very small impact on dishwasher energyso this can be ignored. Cold water temperatures (according to AS/NZS4234 for Zone 3) are about 17.7°C average during the year (published data from Water Services Association of Australia puts measured annual data for Adelaide at 17.9°C, so this is broadly representative). An efficient 4 star dishwasher (12 place settings) use around 12 to 15 litres of water and half would be heated (say 6 litres). The energy impact of 18°C versus 20°C cold water for 6 litres of heat fill per cycle is 13 Wh in a total energy per cycle of 560 Wh (2%). Within the range of certainty of these estimates, this could be considered negligible. A cold water adjustment and usage adjustment together can be rounded to an overall adjustment of the energy label value of 0.5. Review of the latest market data for 2013 shows that sales weighted average number of place settings is 13 and the energy consumption is 272, effectively around 3.3 stars. The average energy has declined around 10% from 2009 to 2013.

R 259
Figure 27: Dishwasher registrations 2012 to 2014
An important observation from this figure is that the market average is already at the more efficient end of the market. Also there appears to be a slight reverse size bias where 14 and 15 place setting models are able to achieve an overall better energy consumption value and 12 place setting models (and therefore achieve a higher star rating). Currently there are only about 17 models on the market (many of these are in fact variations of the same models) that can achieve 4 stars or more. So this suggests that there is a limited scope for specifying models that are significantly more efficient than average under REES. On the basis of an improvement in the market average (3.5 stars) to the best rating (4 stars), for an average 13 place settings would be an equivalent in label CEC reduction from 256 kWh/year to 214 kWh/year, a saving of 42 kWh/year. To these savings, an in-use adjustment of 0.50 needs to be applied to reflect the lower number of loads undertaken during normal use, so this equates to savings of 21 kWh/year. While most of this will be electricity (few new dishwashers are connected to hot water and it makes little sense to do so), the lifetime energy savings over 10 years are 210 kWh or around 0.76 GJ. This analysis has illustrated that the NSW energy saving credits appears to be overestimated for dishwashers by a factor of 5, because the baseline has been set too low and because frequency of use in the field is likely to be much lower than assumed for energy labelling. In light of this analysis, it is not recommended that purchase of efficient dishwashers be included into REES as a new activity as the savings are very low and there are few products on the market with star ratings that are significantly above the market average.
0
100
200
300
400
500
600
700
800
900
4 6 8 10 12 14 16
Ener
gy (
kWh
/yr)
Capacity (Place Settings)
CEC
1 Star
2 Star
3 Star
4 Star
5 Star
Sales weighted average 2013
R 260
Basis for Estimating Savings – Televisions The approach to energy labelling and MEPS for televisions is relatively well established. The algorithm defines a 1 star line (which is equal to MEPS) and a product earns an addition star for each 20% reduction in energy from the 1 star (MEPS) line. There are two important issues to consider with respect to televisions. Firstly, new (Tier 2) MEPS levels were introduced in 2013. This change also meant that all television star ratings were downgraded by 3 stars (new MEPS = new 1 star = old 4 star). So care is required in the specification of a requirement in terms of star rating. ACT and Victoria have set requirements in terms of the old (Tier 1) system while NSW has referenced the new Tier 2 system (although this is somewhat unclear). The other issue with televisions is that since energy labelling was introduced in 2009, there has been an extremely rapid decline in energy consumption. The market has primarily moved to LCD(LED) technology, with CRTs and plasma eliminated. Just a few current standard LCD products remain on the market. The overall effect is that energy consumption for new televisions has decreased at a rate of around 20% per annum over the past 5 years, a rate that is around 6 to 10 times faster than for other appliances. There are a range of low energy technologies about the enter the market, so this trend appears likely to continue for some years. This means that consideration of a more dynamic base for the calculation of savings may be warranted. Firstly, it is useful to benchmark the current requirements in Victoria and ACT which is defined by the following equation: [0•512 × (SA × 0.1825 + 127.5) – CEC] × 0.01079 The final factor (0.01079) can be ignored for this analysis as this converts the energy savings to lifetime emissions and also embodies a state based emission intensity factor. The core of the equation ((SA × 0.1825 + 127.5) is in fact the 1 star line (BEC) as defined in Tier 1 from 2009 (and was also equal to MEPS in 2009) in terms of kWh/year (on the energy label). The factor 0.512 defines the reference efficiency beyond which savings for the specific product are calculated. In this case, 0.512 represents 4 stars on the old labelling scale (the energy reduction factor is 0.2 per star, so 0.8xBEC =2 stars, 0.64xBEC=3 stars and 0.512xBEC=4 stars). While 4 stars (old scale) is the base line (or business as usual) against which to calculate savings, a product has to achieve 5.5 stars before it is eligible to earn credits. The requirements also cap the CEC energy consumption at 450 kWh/year. Under that scheme, this effectively means that there is an implied size limit of 120cm at a star rating of 5.5 stars under the old rating system. Larger televisions are eligible, but they just have to be more efficient in order to qualify. However, once a larger television does qualify, the savings base is still calculated on the energy consumption of the model. This is perhaps a debatable approach in the specification. There is no doubt that this approach is quite practical, easy to understand and integrates well with labelling and MEPS for televisions. The problem is that the reference points are hopelessly out of date. The base line for calculation of savings is now equal to the MEPS line – all products must now be better than this reference. This is no longer suitable as the base case as it is now a regulatory minimum. What needs to be established is a benchmark for the current market in 2014, the likely trend of energy over the period 2015 to 2017 and the efficiency threshold required to

R 261
qualify for credits. For reference, the VEET requirement set a minimum star rating of 5.5 stars (Tier 1) in order to qualify, but calculated savings from a reference base of 4 stars (presumably the market average at some point) – this is quite sensible as it does not provide credits for products at 4.5 or 5 stars, as these are not “significantly more efficient” that the market average. In contrast to the Victorian and ACT requirements, NSW define 3 size ranges and provide an estimate of energy savings (in MWh) as a function of star rating. Conceptually the approach is similar, but it defined in discrete steps (the same approach is used in NSW for all products and generally this is less transparent). The implied base line for the calculation of energy savings is 2.5 stars under Tier 2 requirements and saving are awarded for star ratings of 4 or more under Tier 2 (1.5 star threshold required to earn any credits). This is exactly the same approach used by ACT and Victoria, but in a different format. As noted above, televisions are a difficult product for a scheme such as REES as the market is changing so quickly. For this review, registration data for televisions from 2009 (when regulations began) has been analysed. The first major observation is that LCD (LED) televisions are now dominating the market (from a low base in 2009). Figure 28: Trends in share of registrations by television technology
The next observation is that the efficiency of all technologies has been climbing very quickly over the period since regulation commenced. LCD and Plasma technologies have increased by 3 stars and LCD (LED) have increase by 4.2 stars over the period. Given that this is effectively over a period of about 4 years (regulation did not commence until late 2009 and the data examined only covers registrations to May 2014), this equates to 15% to 20% energy reduction in new products per year.
0%
10%
20%
30%
40%
50%
60%
70%
80%
90%
100%
2009 2010 2011 2012 2013 2014
Shar
e o
f R
egi
stra
tio
ns
by
Tech
no
logy
Year
Plasma
LCD (LED)
LCD

R 262
Figure 29: Trends in registered SRI by television technology
Note: Revised MEPS levels are set at 1 star in 2013
Figure 30: Trends in registered size (cm) by television technology
Average sizes of televisions has been increasing over time from around 90cm in 2009 to 120cm in 2014. Note that this is model weighted and not sales weighted. It is apparent that plasmas have all but left the market and that larger LCD (LED) units are taking their place.
-1.0
0.0
1.0
2.0
3.0
4.0
5.0
6.0
2009 2010 2011 2012 2013 2014
Ave
rage
SR
I (2
01
3)
for
regi
stra
tio
ns
by
year
Year
LCD (LED)
Average
LCD
Plasma
0
20
40
60
80
100
120
140
160
2009 2010 2011 2012 2013 2014
Ave
rage
siz
e c
m f
or
regi
stra
tio
ns
by
year
Year
LCD (LED)
Average
LCD
Plasma

R 263
The change in efficiency of new registrations is illustrated by the following table. Table 121: Registered SRI (2013) by year of registration
Star Rating (Tier 2) 2009 2010 2011 2012 2013 2014
-1.5 5 9 2
-1 8 8 9
-0.5 29 45 14 1
0 82 109 38 11 1
0.5 62 68 33 17 2
1 77 108 86 51 9
1.5 56 82 68 34 9
2 16 108 107 38 6 2
2.5 8 63 80 88 22 5
3 10 83 90 98 53 14
3.5 3 27 65 79 75 19
4 1 20 72 119 116 30
4.5
7 32 91 100 45
5
3 7 74 118 41
5.5
5 31 78 41
6
14 70 61
6.5
2 9 17
7
1 4 10
7.5
2
8
1
Grand Total 357 740 708 750 672 287
Note: Registration did not commence until late 2009. 2014 only covers to May. MEPS in 2013 was set at 1 star in accordance with the Tier 2 labelling requirements.
The trend for registrations by size, energy and year is illustrated in the following figure.

R 264
Figure 31: Trend is registrations by year for televisions
Note: Some registrations are larger than 10,000 cm
2 (largest is 25,000cm
2 = 260cm or 104”). 10,000cm
2
is equivalent to about 160cm or 64”. Star bands shown are for Tier 2 in 2013.
In order to benchmark energy savings for televisions, it is useful to consider the market in 2014. Figure 32: Registrations in 2014
0
100
200
300
400
500
600
700
800
900
1000
0 1000 2000 3000 4000 5000 6000 7000 8000 9000 10000
Ener
gy (
kWh
/yr)
Screen Size (cm^2)
CEC 2009
CEC 2010
CEC 2011
CEC 2012
CEC 2013
CEC 2014
1 Star
2 Star
3 Star
4 Star
5 Star
6 Star
7 Star
0
100
200
300
400
500
600
0 1000 2000 3000 4000 5000 6000 7000 8000 9000 10000
Ener
gy (
kWh
/yr)
Screen Size (cm^2)
CEC
1 Star
2 Star
3 Star
4 Star
5 Star
6 Star
7 Star
Registration average in 2014 (to date)

R 265
This data illustrates that there are very few 3 star products (even under the newly regraded Tier 2 levels in 2013). Most products lie in the range 4 stars to 6 stars, with some products even achieving 7 stars. There appears to be no strong size bias in the ratings (perhaps a very slight size bias towards larger models, but this is perhaps because much of the development of new products occurs in this size range, so energy reductions are introduced here first). Trend data suggests an average size of around 6000cm2 and a star rating of 5.22 in 2014. The distribution of registered sizes in 2014 are likely to be skewed to some extent because large LCD (LED) units are displacing plasma types, which have traditionally been at the larger end. Average size sold is more likely to be around 5000cm2, which equates to a screen size of around 86cm (34”). This suggests a savings base of 5.5 stars for the calculation of savings. To qualify, it is suggested that a full star above the savings base be used to ensure that only models that are significantly better than the market average are permitted to claim savings. This would be at 6.5 stars. Given the very rapid change in energy and star ratings over the past 5 years, it is suggested that this be adjusted annually for the period of this REES review. TVs sold in 2015 – require 6.5 stars (Tier 2 2013), calculate savings from 5.5 stars TVs sold in 2016 – require 7.0 stars (Tier 2 2013), calculate savings from 6.0 stars TVs sold in 2017 – require 7.5 stars (Tier 2 2013), calculate savings from 6.5 stars Given the historical rate of change, this may not be dynamic enough. However, it is likely to be in the correct ball park. These levels should be reviewed mid-way through each calendar year to review current market trends and assess whether adjustments in the subsequent year need to be applied. The original VEET specification had a cap on CEC energy of 450 kWh/year in order to be eligible. As noted above, this was effectively a size limitation of 120cm in order to qualify. From a policy perspective, the argument goes that consumers can have any size of television they wish, but as energy is in proportion to screen area (square of the diagonal), a screen that is double the area will have 4 times the energy for the same star rating. So for a scheme like REES, which is focused on energy savings, putting a cap on size makes a lot of sense. This does not stop consumers from selecting very large televisions, but they just do not receive any energy savings credits when they do so. As noted above, the VEET requirement sets the CEC cap to 450kWh/year for eligibility, but did not apply this cap to the savings earned for larger televisions that were able to meet the requirement for 450 kWh/year. This effectively allowed larger television to claim the full savings credit as long as they met the cap. It is not clear whether that was the intention. Under the current market and size, a television that is 170cm and about the market average star rating (5.5 under 2013 system), would be able to claim full VEET credits. The most sensible way to deal with this issue is to put a fixed energy value for screen sizes above a specified limit (say 130cm). This would apply to be eligibility and the calculation of credits. So recommended requirements for televisions are: SA is registered screen area in the relevant registration Televisions sold in calendar 2015

R 266
Minimum 6.5 stars (2013), current and valid registration for energy labelling and MEPS (Tier 2 – 2013) Assumed lifetime: 10 years Where screen area is less than or equal to 7221cm2 Annual energy savings = [0.3664 × (SA × 0·09344 + 64.41)] – CEC Where screen area is greater than 7221cm2 Annual energy savings = 270.8 – CEC Televisions sold in calendar 2016 Minimum 7.0 stars (2013), current and valid registration for energy labelling and MEPS (Tier 2 – 2013) Assumed lifetime: 10 years Where screen area is less than or equal to 7221cm2 Annual energy savings = [0.3277 × (SA × 0·09344 + 64.41)] – CEC Where screen area is greater than 7221cm2 Annual energy savings = 242.2 – CEC Televisions sold in calendar 2017 Minimum 7.5 stars (2013), current and valid registration for energy labelling and MEPS (Tier 2 – 2013) Assumed lifetime: 10 years Where screen area is less than or equal to 7221cm2 Annual energy savings = [0.2931 × (SA × 0·09344 + 64.41)] – CEC Where screen area is greater than 7221cm2 Annual energy savings = 216.6 – CEC The television standards AS/NZS62087.1 and AS/NZS62087.2.2 set out a range of requirements regarding assumed usage, standby power and active standby. The energy consumption value used on the energy label is totally dominated by the assumed hours in on mode, which is defined as 10 hours per day. This tends to put very strong emphasis on the one mode power and provides a strong driver to reduce this value through improvements in on mode efficiency. While this is fine from an energy policy perspective, 10 hours a day is not reflective of average television use (it is very much at the heavy user end). As set out in the section on standby power controllers, a wide range of data suggests that average television hours of use for main televisions are around 5.5 hours per day. This means that any energy savings estimated from the energy labelling values need to be scaled down by 0.55 (approximately) in order to have an accurate estimate of average savings during normal use (while there is some energy associated with passive and active standby power in the overall CEC value, this tends to be of the order of a few percent of total energy, so a reasonable approximation is to scale the CEC in proportion to hours of use, at least within the limits proposed where there is still substantial on mode energy). For reference, the NSW approach appears to use a baseline of about 4.0 stars (2013 Tier 2), which is about 1.5 stars behind the current market average in 2014. The NSW ESS use of 3 size ranges also effectively provides a cap on savings for products over 120cm (same concept as set out above but implemented in a different manner). The NSW savings calculation does not appear to adjust the energy label values down to reflect average viewing patterns, so the values are significantly overestimated. In order to calculate lifetime savings, an assumed lifetime is required. Most schemes current use 10 years, so this is recommended for REES.

R 267
So annual energy savings above are multiplied by 10 and multiplied by 0.55 and 0.0036 to get lifetime GJ savings of electricity (an overall factor of 0.00198). An overall program factor of 0.9 also needs to be applied to account for free riders, giving an overall factor of 0.01782. As an example, an efficient new television (LG47LY340C-TA) has a CEC energy 160 kWh/year. This has a rating of 7 stars (2013). The screen area is 6080.2cm2 (119cm). The savings under the proposed requirements would be: 2015 Base = 231.8kWh/y Savings = 71.8 kWh/y, Lifetime savings = 1.28 GJ electricity 2016 Base = 207.3kWh/y Savings = 47.3 kWh/y, Lifetime savings = 0.84 GJ electricity 2017 Would not qualify (Lifetime savings = 0.45 GJ electricity if it did qualify) As second example, an efficient new television (SonyKDL-55W800B) has a CEC energy 199 kWh/year. This has a rating of 7 stars (2013). The screen area is 8228cm2 (139cm). The savings under the proposed requirements would be: 2015 Base = 270.8kWh/y Savings = 71.8 kWh/y, Lifetime savings = 1.28 GJ electricity (1.89 GJ without a cap) 2016 Base = 242.2kWh/y Savings = 43.2 kWh/y, Lifetime savings = 0.77 GJ electricity (1.32 GJ without a cap) 2017 Would not qualify (Lifetime savings = 0.31 GJ electricity if it did qualify)(0.81 GJ without a cap) A third example is a Panasonic TH-L39EM5Z with a screen area of 8369 cm2 (140cm) qualifies as 8 stars and would earn: 2015 Base = 270.8kWh/y Savings = 93.8 kWh/y, Lifetime savings = 1.67 GJ electricity (2.37 GJ without a cap) 2016 Base = 242.2kWh/y Savings = 65.2 kWh/y, Lifetime savings = 1.16 GJ electricity (1.79 GJ without a cap) 2017 Base = 216.6kWh/y Savings = 39.6 kWh/y, Lifetime savings = 0.71 GJ electricity (1.27 GJ without a cap)
Potential Compliance Issues There are no significant concerns regarding the purchase and installation of efficient appliances. All products are normally covered by supplier warranties. As this is normally a major investment, users will ensure that new products are operating correctly. There is a small chance that a product operation could be faulty and not detected by the user, but this applies equally to all new appliances (not just ones eligible under this proposed specification).

R 268
Purchase an Efficient New Refrigerator or Refrigerator-freezer Activity No.
APP1A
1. Activity Specific Definitions
Refrigerator means a refrigerating appliance registered for energy labelling and MEPS under standard AS/NZS4474.2 classified as Group 1, 4, 5T, 5B or 5S CEC is the Comparative Energy Consumption shown on the energy label and entered in the product
registration in kWh/year Gross volume is the total gross volume of all compartments as determined in accordance with AS/NZS4474.1 in litres Adjusted volume (Vadj) is the adjusted volume determined in accordance with AS/NZS4474.2 and
entered in the product registration in litres
2. Activity Description (Summary)
Purchase an efficient new refrigerator or refrigerator-freezer
3. Activity Eligibility Requirements
Any compliant product sold in a retail outlet in South Australia for use in a residential or commercial premise in South Australia.
4. Installed Product Requirements
1. A Group 1 product shall have a total gross volume in the size range 100 to 500 litres and shall achieve a star rating index of not less than 2.0 in accordance with AS/NZS4474.2;
2. A Group 4, 5T, 5B or 5S product shall have a total gross volume in the size range 100 to 700 litres and shall achieve a star rating index of not less than 2.7 in accordance with AS/NZS4474.2.
3. The product shall have a valid registration with an Australian or New Zealand energy regulator at the time of sale.
4. The refrigerating appliance shall not have a designation of cooled appliance under AS/NZS4474.1. 5. The refrigerating appliance shall not be a wine storage appliance or have any compartment that is
intended exclusively for wine or beverage storage.
5. Minimum Installation Requirements
None.
6. Activity default energy savings The total Gigajoule energy (GJ) saved attributed to this activity per appliance purchased is:
Group 1 Savings GJ = {[0⋅9126 × (200 + 4 × (Vadj)
0·67)] – CEC} × 0.04374
Group 4, 5T, 5B, 5S Savings GJ = {[0.6954 × (150 + 8.8× (Vadj)
0·67)] – CEC} ×0. 04374
Default energy savings are in GJ of electricity
7. Guidance Notes (Informative only – not mandatory)
Information on registration data for current models can be obtained from http://reg.energyrating.gov.au/comparator/product_types/28/search/ - see Download CSV.

R 269
Purchase an Efficient New Freezer Activity No.
APP1B
1. Activity Specific Definitions
Freezer means a refrigerating appliance registered for energy labelling and MEPS under standard
AS/NZS4474.2 classified as Group 6C, 6U or 7. CEC is the Comparative Energy Consumption shown on the energy label and entered in the product registration in kWh/year Gross volume is the total gross volume of all compartments as determined in accordance with
AS/NZS4474.1 in litres Adjusted volume (Vadj) is the adjusted volume determined in accordance with AS/NZS4474.2 and entered in the product registration in litres
2. Activity Description (Summary)
Purchase an efficient new (separate) freezer
3. Activity Eligibility Requirements
Any compliant product sold in a retail outlet in South Australia for use in a residential or commercial premise in South Australia.
4. Installed Product Requirements
1. A Group 6C product shall have a total gross volume in the size range 100 to 700 litres and shall achieve a star rating index of not less than 3.3 in accordance with AS/NZS4474.2;
2. A Group 6U or 7 product shall have a total gross volume in the size range 100 to 400 litres and shall achieve a star rating index of not less than 2.5 in accordance with AS/NZS4474.2.
3. The product shall have a valid registration with an Australian or New Zealand energy regulator at the time of sale.
4. The refrigerating appliance shall not have a designation of cooled appliance under AS/NZS4474.1. 5. The refrigerating appliance shall not be a wine storage appliance or have any compartment that is
intended exclusively for wine or beverage storage.
5. Minimum Installation Requirements
None.
6. Activity default energy savings The total Gigajoule energy (GJ) saved attributed to this activity per appliance purchased is:
Group 6C Savings GJ = {[0.6329 × (150 + 7.5 × (Vadj)
0·67)] – CEC} × 0.04131
Group 6U and 7 Savings GJ = {[0.77 × (150 + 7.5 × (Vadj)
0·67)] – CEC} × 0.04131
Default energy savings are in GJ of electricity
7. Guidance Notes (Informative only – not mandatory)
Information on registration data for current models can be obtained from http://reg.energyrating.gov.au/comparator/product_types/28/search/ - see Download CSV

R 270
Purchase an Efficient New Electric Clothes Dryer Activity No.
APP1D
1. Activity Specific Definitions
Electric clothes dryer means a rotary clothes dryer (tumble dryer) registered for energy labelling under standard AS/NZS2442.2 and classified as a vented or condensing type. CEC is the Comparative Energy Consumption shown on the energy label and entered in the product
registration in kWh/year Rated capacity is the rated capacity of the appliance as determined in accordance with AS/NZS2442.1 and entered in the product registration in kg
2. Activity Description (Summary)
Purchase an efficient new electric clothes dryer
3. Activity Eligibility Requirements
Any compliant product sold in a retail outlet in South Australia for use in a residential or commercial premise in South Australia.
4. Installed Product Requirements
1. The electric clothes dryer shall achieve a star rating index of not less than 5.0 in accordance with AS/NZS2442.2.
2. The electric clothes dryer shall have a rated capacity of not less than 5.0 kg in accordance with AS/NZS2442.1.
3. The product shall have a valid registration with an Australian or New Zealand energy regulator at the time of sale.
4. The electric clothes dryer shall not be part of a combination washer-dryer.
5. Minimum Installation Requirements
None.
6. Activity default energy savings The total Gigajoule energy (GJ) saved attributed to this activity per appliance purchased is:
Savings GJ = (48.08 × rated capacity – CEC) × 0.0324
Default energy savings are in GJ of electricity
7. Guidance Notes (Informative only – not mandatory)
Information on registration data for current models can be obtained from http://reg.energyrating.gov.au/comparator/product_types/35/search/ - see Download CSV

R 271
Purchase an Efficient New Television Activity No.
APP1F
1. Activity Specific Definitions
Television means a television registered for energy labelling and MEPS under standard AS/NZS62087.2.2. CEC is the Comparative Energy Consumption shown on the energy label and entered in the product
registration in kWh/year Screen area is the rated screen area of the appliance as determined in accordance with AS/NZS62087.1 and entered in the product registration in square centimetres.
2. Activity Description (Summary)
Purchase an efficient new television
3. Activity Eligibility Requirements
Any compliant product sold in a retail outlet in South Australia for use in a residential or commercial premise in South Australia.
4. Installed Product Requirements
1. For appliances sold in calendar year 2015, a television shall achieve a star rating index of not less than 6.5 in accordance with AS/NZS62087.2 (Tier 2 2013) and shall have a CEC of ≤ 270 kWh/y
2. For appliances sold in calendar year 2016, a television shall achieve a star rating index of not less than 7.0 in accordance with AS/NZS62087.2 (Tier 2 2013) and shall have a CEC of ≤ 242 kWh/y
3. For appliances sold in calendar year 2017, a television shall achieve a star rating index of not less than 7.5 in accordance with AS/NZS62087.2 (Tier 2 2013) and shall have a CEC of ≤ 216 kWh/y
4. The product shall have a valid registration with an Australian or New Zealand energy regulator at the time of sale.
5. Minimum Installation Requirements
None.
6. Activity default energy savings The total Gigajoule energy (GJ) saved attributed to this activity per appliance purchased is:
For a product sold in calendar year 2015 with a registered screen are of not more than 7221 cm
2
Savings GJ = [0.3664 × (screen area × 0.09344 + 64.41) – CEC] × 0.001782 For a product sold in calendar year 2015 with a registered screen are of 7221 cm
2 or more
Savings GJ = [270.8 – CEC] × 0.001782 For a product sold in calendar year 2016 with a registered screen are of not more than 7221 cm
2
Savings GJ = [0.3277 × (screen area × 0.09344 + 64.41) – CEC] × 0.001782 For a product sold in calendar year 2016 with a registered screen are of 7221 cm
2 or more
Savings GJ = [242.2 – CEC] × 0.001782 For a product sold in calendar year 2017 with a registered screen are of not more than 7221 cm
2
Savings GJ = [0.2931 × (screen area × 0.09344 + 64.41) – CEC] × 0.001782 For a product sold in calendar year 2017 with a registered screen are of 7221 cm
2 or more
Savings GJ = [216.6 – CEC] × 0.001782
Default energy savings are in GJ of electricity
7. Guidance Notes (Informative only – not mandatory)
A screen area of 7221cm2 is a nominal diagonal size of 130 cm (approximate size of 52 inches),
however, the product registration needs to be checked to ascertain the registered screen area. Information on registration data for current models can be obtained from http://reg.energyrating.gov.au/comparator/product_types/32/search/ - see Download CSV

R 272
Remove and destroy an unwanted household refrigerator or freezer - APP2
Technical Assessment – APP2
Remove and destroy an unwanted household (style) refrigerator or freezer
REES Activity Reference: APP2 REES Activity title: Remove and destroy an unwanted household (style) refrigerator or freezer Target product: Older and/or unwanted refrigerators and freezers Savings: Activity saves energy directly by encouraging the early removal and destruction of a working refrigeration appliance Pre-conditions: None

R 273
Current REES Activity Description This activity is currently included as part of the REES scheme code58 . The summary description within the REES scheme code is as follows: “Remove and destroy a secondary refrigerator or freezer” This activity covers the removal of a secondary refrigerator or freezer in a residential household (although this restriction is not specifically stated). The REES requirements for this activity are currently:
A secondary refrigerator or freezer is an additional appliance that is not providing the primary refrigeration or freezer services to the household.
The refrigerator or freezer must be manufactured before 1996.
The refrigerator or freezer must be in working order.
The refrigerator must have an internal volume greater than 250 litres.
The freezer must have an internal volume greater than 100 litres.
The refrigerator or freezer must be removed from the premises and decommissioned. This includes removal and disposal of refrigerants and any other scheduled substances in accordance with the Australian and New Zealand refrigerant handling code of practice as established under the Ozone Protection and Synthetic Greenhouse Gas Management Act 1989.
The size requirements are taken to mean that the total volume of a refrigerator or a freezer must meet the size requirements (not the compartments within an appliance). Default savings to dispose of a secondary refrigerator or freezer are 1.9 t CO2-e.
Proposed REES Activity Description The summary description of the revised REES activity is as follows: “Remove and destroy an unwanted household (style) refrigerator or freezer” This activity covers the removal of a primary or secondary household style refrigerator or freezer in a residential premises. The proposed requirements for this activity are:
A secondary refrigerator or freezer is an additional appliance that is not providing the primary refrigeration or freezer services to the household or business (i.e. a main appliance must remain after removal of the secondary appliance).
A primary refrigerator or freezer provides the main refrigeration or freezer services to the household or business.
Products that could be classified as household refrigeration within the scope of AS/NZS4474 or AS1430 are eligible and must operate on mains power.
Products must be in working order to be eligible.
There is no size restriction on eligible products.
The volume of the product, based on the external dimensions, in cubic metres, must be measured and each dimensions for each product recorded in the activity schedule.
58
RESIDENTIAL ENERGY EFFICIENCY SCHEME CODE REESC/07 February 2014

R 274
Where possible, the type of refrigerant used in the product shall be established from markings on the product and recorded in the activity schedule.
The refrigerator or freezer must be removed from the premises and decommissioned. This includes removal and disposal of refrigerants and any other scheduled substances in accordance with the Australian and New Zealand refrigerant handling code of practice as established under the Ozone Protection and Synthetic Greenhouse Gas Management Act 1989.
Under this activity there are four different specifications, depending on the product characteristics and its current use. Case 1 Current use: secondary refrigerator – a main refrigerator must remain after its removal Refrigerant: R12 (CFC) Lifetime electricity savings: 25.6 × EV (GJ) Where EV is the external volume (based on external measurements) in cubic metres Case 2 Current use: secondary refrigerator – a main refrigerator must remain after its removal Refrigerant: cannot be established or is a refrigerant other than R12 (CFC) Lifetime electricity savings: 14.2 × EV (GJ) Where EV is the external volume (based on external measurements) in cubic metres Case 3 Current use: main refrigerator Refrigerant: R12 (CFC) Lifetime electricity savings: 15.1 × EV (GJ) Where EV is the external volume (based on external measurements) in cubic metres Case 4 Current use: main refrigerator Refrigerant: cannot be established or is a refrigerant other than R12 (CFC) Lifetime electricity savings: 7.6 × EV (GJ) Where EV is the external volume (based on external measurements) in cubic metres
Key Specification Changes The requirements in other state schemes (NSW, Victoria and ACT) for this activity have been reviewed and a range of recommendations regarding revisions to this activity for REES in South Australia have been set out. All of the existing state schemes have major shortcomings, in that they do not recognise the impact that the volume of a removed product is likely to have a major impact on its energy consumption. New analysis for this report has set out the basis for a new approach for this activity. Some elements used in other states have been adapted. The key changes in this specification are:
All of the state specifications were found to be inadequate, in that they did not recognise the relationship between volume, age and energy of older refrigerators and freezers. New work undertaken for this review has resulted in a fully revised set of requirements for REES. It is hoped that these requirements could be adopted by other states in due course.

R 275
It is recommended that eligibility be limited to household style refrigeration products (no significant change).
Many of the existing specification requirements have been retained (product must be in working order, refrigerants are disposed of in accordance with legal requirements).
The previous REES size restriction has been removed and replaced with a variable energy credit calculation based on the size of the product.
Product size is determined from external dimensions, which can be readily determined on site from simple measurements.
A new set of cases have been added – removal of a main refrigerator or freezer (as per NSW specification) and differentiation of products with R12 (CFC) refrigerant and those without (or where the refrigerant cannot be ascertained). Products that can be established to have R12 refrigerant will be manufactured prior to 1996 (this was the year where R12 was phased out of local production), so these products will be offered higher savings credits as their energy consumption will be higher than products without R12 refrigerant.
The overall energy savings have been determined after the application of a range of factors as set out in the following analysis. The savings for key cases is substantially larger than the current REES default value (which itself is much lower than all other states).
It is recommended that the assumption for lifetime be reviewed, subject to better data sources.
While not included in the specification at this stage, it is recommended that eventually this activity be expanded so that the source of eligible products include residential or commercial premises in South Australia.
Scheme Review – Other Jurisdictions The following jurisdictions currently include activities that cover removal of an existing secondary refrigerator or freezer within their schemes:
Victoria: VEET Schedule 19 – Destruction of pre-1996 refrigerator or freezer
NSW: ESS Part C1 – Remove a spare refrigerator or freezer
NSW: ESS Part C2 – Remove a primary refrigerator or freezer
ACT: EEIS Part 5.1 – Decommissioning and disposal of pre-1996 refrigerator or freezer.
All schemes offer a fixed credit for the disposal of a secondary refrigerator or freezer. NSW, Victoria and ACT specifically state that residential and businesses are eligible for the activity. This is also recommended for REES (not currently stated). All schemes require the existing appliance to be working order and for the appliance to be de-gassed in accordance with Ozone Protection and Synthetic Greenhouse Gas Management Act 1989 (except NSW). In general terms, Victoria and ACT are generally quite similar with respect to this specification. ACT uses a different overall adjustment factor to take into account the different emission intensity of electricity supply. Victoria and ACT are very similar to the general requirements of REES. Victoria and ACT put no qualifications with respect to size and type of refrigerator or freezer but provide different credits for 1 and 2 door appliances. Victoria and ACT (along with REES South Australia) require the refrigerator or freezer to be pre-1996. NSW is somewhat different to the other states in several respects. Firstly, the appliances must fall within the scope of AS/NZS4474 (an appliance designed for

R 276
household type use, even though it may be installed in commercial or other premises). Secondly, the appliance must be larger than 200 litres in order to qualify. The other states do not qualify size limits (but Victoria and ACT do have different credits for 1 and 2 door products). Thirdly, NSW require that there is another (main) refrigerator at the site (i.e. the owner just does not say it is spare – the service provider has to verify that there is in fact another refrigerator there when the secondary one is removed). Fourthly, NSW have removed the requirement for the product to be manufactured before 1996. And lastly, NSW restricts the activity to the residential sector, does not require refrigerant disposal and states lifetime of 7 years. In general terms, some of the NSW requirements make the scheme somewhat more robust and cover a larger range of products. The requirement that the product complies was designed in accordance with AS/NZS4474 (or its predecessor AS1430) is not very onerous and it eliminates possible abuse by trying to scrap commercial refrigeration systems (for example). A volume qualifier is more difficult. NSW only provide credits for a larger product >200 litres. Victoria and ACT provide different credits for single door and two door products. This is an easy attribute to confirm by inspection. Determining the volume of an old product can be difficult as many will have no markings or legible nameplate. The only practical alternative to volume is using external dimensions, which can be readily measured. Having no credit for small products means that many secondary refrigerators (which still consume significant energy), will not be eligible. The same comments apply to South Australia, which specifies size limits for refrigerators (250 litres) and freezers (100 litres). The NSW requirement is to verify that there is another main refrigerator at the site is a sensible part of the specification (it avoids main refrigerators being passed off as secondary refrigerators, although this is easy to do if a new main refrigerator is purchased first). However, it will only stop the most obvious rorting. NSW have excluded the requirement for the refrigerator to be built prior to 1996. The origin of the 1996 requirement is likely to be that this was the year where federal laws banned the use of R12 (CFC) as a refrigerant as part of the global strategy to protect the Ozone layer (Montreal Protocol). So products prior to 1996, for the most part, would have used R12 as a refrigerant and products from 1996 would have used R134a (a hydro-fluoro-carbon with low Ozone Depletion Potential but with significant Global Warming Potential). For reference, most current products use R600a (iso-butane), which has low ODP and GWP. So the original motivation for the 1996 specification is likely to be an unrelated co-benefit of ozone layer protection. However, none of the state schemes take this co-benefit directly into account (as it is unrelated to energy or greenhouse emissions). It is understood that this has been an area of significant difficulty in ACT, Victoria and South Australia – the year of manufacture is very difficult to establish (although the refrigerant used should be fairly easy to establish, which should establish the break point). So destruction of R12 is an important co-benefit that needs to be retained. NSW also have a specification for the replacement of a main refrigerator or freezer (C2). This has the same specification as replacement of a secondary refrigerator except the default savings are lower. NSW allow that activity to be undertaken in conjunction with purchase of an efficient new refrigerator or freezer (Activities B4, B5 or B6). Table 122 below provides a comparison of the key elements for removal of a secondary refrigerator or freezer.

R 277
Table 122: State Scheme Summary – Comparative table for remove refrigerator or freezer
Parameter SA – REES Scheme (current)
VIC – VEET Scheme *
NSW – ESS Scheme ACT – EEIS Scheme SA – REES Scheme (proposed)
Working Title Remove and destroy a secondary refrigerator or freezer
Destruction of pre-1996 refrigerator or freezer
Remove a spare (main) refrigerator or freezer
Decommissioning and disposal of pre-1996refrigerator or freezer
Remove and destroy an unwanted household (style) refrigerator or freezer
Activity Reference Number
N/A Schedule 19 Parts C1 (C2) Part 5.1 APP2
Sector Not stated Residential or business Residential only Residential or business Residential or business
Required pre-condition Not primary appliance Manufactured before 1996 Must be working Refrigerator must be >250 litres Freezer must be >100 litres Removed and decommissioned
Not primary appliance Manufactured before 1996 Must be working Any size Removed and decommissioned
Not primary appliance No date specified Must be working Refrigerator or freezer >200 l Removed and decommissioned
Not primary appliance Manufactured before 1996 Must be working Any size Removed and decommissioned
Household style (AS1430, AS/NZS4474) Must be working Any size (must measure external dimensions) Removed and decommissioned
Replacement options N/A N/A N/A N/A N/A
Other requirements Disposal of refrigerants under the Ozone Protection and Synthetic Greenhouse Gas Management Act 1989
Disposal of refrigerants under the Ozone Protection and Synthetic Greenhouse Gas Management Act 1989
No requirements regarding refrigerant disposal
Disposal of refrigerants under the Ozone Protection and Synthetic Greenhouse Gas Management Act 1989
Disposal of refrigerants under the Ozone Protection and Synthetic Greenhouse Gas Management Act 1989
Deemed savings per replacement
1.9 t CO2e (all appliances) 1 door 3.25 t CO2e 2 door 5.82 t CO2e
5.2 MWh (spare) 2.4 MWh (main)
1 door 2.76 t CO2e 2 door 4.93 t CO2e
Four options based on refrigerant (R12 or other/unknown) and secondary or primary appliance. Energy savings calculated on the basis external volume (dimensions)
Referenced Standards None None AS/NZS 4474 – product must fall within scope of standard
None None
Notes: Requirements are complex have been simplified for this table. * All VEET specifications have different emission factors for metropolitan versus regional installations.

R 278
Scheme Review - Potential of the activity (overview) ABS4602 data shows that there is a large stock of secondary refrigerators (and to some extent freezers) in the home. Table 123: Households with Secondary Refrigerators in South Australia, 2011
Number of Appliances
Refrigerators ‘000
Freezers ‘000
One only 444.6 214.1
Two 197.8 30
Three or more 21.7 * 2.8
None 1.0 * 417.2
Notes: Source ABS4602-2011, * Indicates author estimate.
The above data suggests that there are around 280,000 secondary household refrigeration appliances in South Australia that could be eligible for this REES activity (some will naturally be excluded due to the current size limitations and many will still be required for use). 2014 ownership for refrigerators in South Australia is estimated to be 1.46 per household while for freezers it is 0.417 per household. Both of these values are above the national average of 1.387 and 0.381 respectively in 2014. The concept for this activity is that the incentive is enough to encourage users with secondary and unwanted appliances to have them removed and properly decommissioned. The energy savings attributable to the activity are based on the likely energy consumption of the removed appliance multiplied by the difference in time between when the activity occurs and when the appliance would have been retired or decommissioned in the absence of REES. This activity is different to most others as it takes an existing energy service (secondary refrigerator or freezer) and replaces it with nothing (on the basis that the service is no longer needed and that users are too lazy to dispose of unwanted appliances). Of course, many secondary appliances could be sold or passed on, so they can persist in the stock for many years. Modelling work for EES (2011) suggests that refrigerators in households last for at least 17 years (probably more) and freezers last at least 21 years on average. Individual units of course can remain in the stock for very long periods (a few products from the 1950’s are still in service today, mostly as secondary refrigerators). A few products from the late 1970s and 1980s are certainly in service as main refrigerators. This is an area where there is relatively poor data on the age of appliance that leave the stock (in the absence of incentives to do so). Because these appliances have been regulated since the mid 1980s, there is reasonably good information on the energy consumption trends over time. While refrigerators and freezers have been regulated for some time and the energy consumption under standardised conditions is well documented, it is important to understand the differences between the energy values determined in the test laboratory and reported on the energy label and the energy consumption that is expected in the field under a range of normal use conditions. This is discussed on the previous section on new appliances. Given that that target appliances will mostly be very old, there may be some degradation in performance as well.

R 279
Assessment Against Scheme Principles This activity aligns with all major policy objectives.
Table 124: Activities Alignment with Policy Objective - remove refrigerator or freezer
Policy Objective Reduces household and/or business energy use Provides a focus on low income households
Associated Objectives: Provides greenhouse gas emission benefits
Provides energy cost benefits
The following table provides an assessment of the activity against the new principles proposed for REES code. Table 125: Alignment with REES General Principles - remove refrigerator or freezer
Principle Assessment
1. Provides evidence based energy savings
The basis for energy savings associated with this activity reasonably well understood but not very well documented. Some energy consumption measurements have been undertaken on removed appliances but this is not in laboratory conditions so careful interpretation is required.
2. Energy savings are additional to base case (BAU) and minimises free riders
The additionality for this activity is the removal of the old appliance now, compared to it continuing to operate for some time until its natural disposal in the absence of REES. Some free riders will exist, but accounted for through energy saving discounts.
3. Reward best practice in relation to product performance
Not applicable to this activity, although the proposed approach does scale energy savings on the basis of size, which is a large improvement over existing approaches.
4. Provides a means for ensuring quality assurance and participant satisfaction
Participants volunteer, so this not a major consideration.
5. Credible approach for the calculation of energy savings
The date of manufacture for very old products was always difficult to establish, so a revised approach based on refrigerant has been developed. Old appliances naturally will be less efficient – energy of new refrigerators and freezer today is around 30% of the energy of new appliances from the 1980s. However, some old appliances will be operating quite well while some will be faulty and may be using a lot of energy (even though they meet the requirement of being “operational”). Secondary appliances will be used less and are more likely to be installed in unconditioned space, so their energy consumption will be somewhat less than for main refrigeration appliances. Best available historical data has been used for develop energy saving factors.
6. Provides scope for objective, cost effective and practical auditing
Removal of equipment as part of the activity is simple and easy to audit through disposal and degassing records.
7. Good practice Old products are to be recycled and degassed by accredited professionals in accordance with the specification.
8. Harmonisation (as far as practical)
This activity is available in NSW, ACT and Victoria, although the products covered and the specifications do vary somewhat (NSW in particular takes a somewhat different approach). All state schemes have limitations, so a generic new approach has been developed, which has potential for application in all states.
9. Safety and minimising overall risk
Appropriate levels of training are required for service providers. Removal of old appliances from households presents a low risk to service providers and participants.

R 280
Energy Savings - Review Overview of methodology Conceptually, the energy savings from this activity can be established with the establishment of just two variables:
Establish the current energy consumption of old refrigeration products that are suitable for removal from the stock under this activity.
Establish the difference in time between when it would have been retired in any case and the present (how much longer would it have been left operating in the absence of REES).
Having stated that simple basis for estimating energy reductions, there are a considerable number of complications in establishing those two parameters. Key Assumptions The underlying assumptions used as the basis for the calculation of energy savings in this study are detailed in Table 126.
Table 126: Energy Savings Estimate – Underlying Key Assumptions (remove refrigerator or freezer)
Parameter Value Basis / Comment
Energy Service Levels Refrigerator and freezers Climate
factors Assume labelling values will be adjusted by 0.80 for refrigerators and freezers as user interaction will be (secondary appliances) and many will run in unconditioned space (cooler)
Refrigerator and freezers Age deterioration
A proportion of older products will run less efficiently. US data suggests 20% increase in energy
Base Case Assumptions Energy consumption AS/NZS4474 Trends in laboratory energy, adjusted for
size and use as set out as above
REES Activity Assumptions
Ownership * * As per base case (data not used in setting of specifications)
Lifetime and persistence
Product lifetime Refrigerators and freezers
7 years
Difference between “natural” retirement of appliance and retirement from REES (defined in NSW)
Product persistence Same as life Unlikely to be scrapped before assumed lifetime
Adjustment Factors
Additionality discount factor 1.0 Not applicable as additional impact is specifically quantified in methodology
Free rider discount 0.90 Some free riders who would have disposed of old refrigerators in any case or where the secondary refrigerator or freezer works but is not normally plugged in
Rebound discount factor 0.98 Not relevant as old appliance will be removed. Could be very small increase in use of main appliance (negligible)

R 281
Parameter Value Basis / Comment Compliance discount factor 0.9 Concern is that some households naturally
acquire a replacement secondary appliance after participation in the activity. This many not be planned or intentional, but many households will subsequently replace their main appliance and may elect to keep their old main appliance
Total Discount factor 0.794 Product of individual factors
Climatic Adjustments
Adjustments required? Refrigeration Climate factors required for South Australia with respect to adjustment of energy consumption for refrigerators and freezers as stated above, adjusted for secondary appliances where applicable
Energy Savings Calculation Basis for Estimating Savings – Removal of Old Refrigerators and Freezers In order to establish the likely energy savings from this activity, it is necessary to examine historical trends in energy consumption of relevant appliances. Probably the most detailed and comprehensive review of historical energy trends in Australia was undertaken by EES in 2010 (EES 2010c). In particular, Appendix 5 give estimates of the average energy consumption by group back to the 1970s. This adequately covers the period of interest for this review of REES. Data is provided in terms of total average energy consumption and also as a kWh/litre (energy intensity). The latter parameter is more useful as it reduces (but does not eliminate) the influence volume. Average energy is problematic where average sizes change from year to year (or trend larger or smaller over a longer period). Energy intensity values are also of more interest if a sized based approach was to be considered. The energy values depicted in Figure 33 are as determined in accordance with AS/NZS4474 (or its predecessor AS1430). As set out in the assumptions, during normal use, this could be expected to be 20% lower. However, many appliances from the 1980s will exhibit deteriorating performance, so the reduced energy associated with lower use (of secondary appliances) and their location in unconditioned spaces will be partly offset by higher energy due to wear and tear, dirty condensers, leaking gaskets, insulation deterioration and in some cases, loss of refrigerant (although this usually means failure of the appliance). The problem is that an appliance that is covered by the activity could have an energy consumption ranging from 500 kWh/year to over 2000 kWh/year, depending on the type, size and vintage. This presents a very high level of variability when attempting to set default saving factors. Attempting to calculate default energy savings without any reference to the volume of the appliance is not recommended.
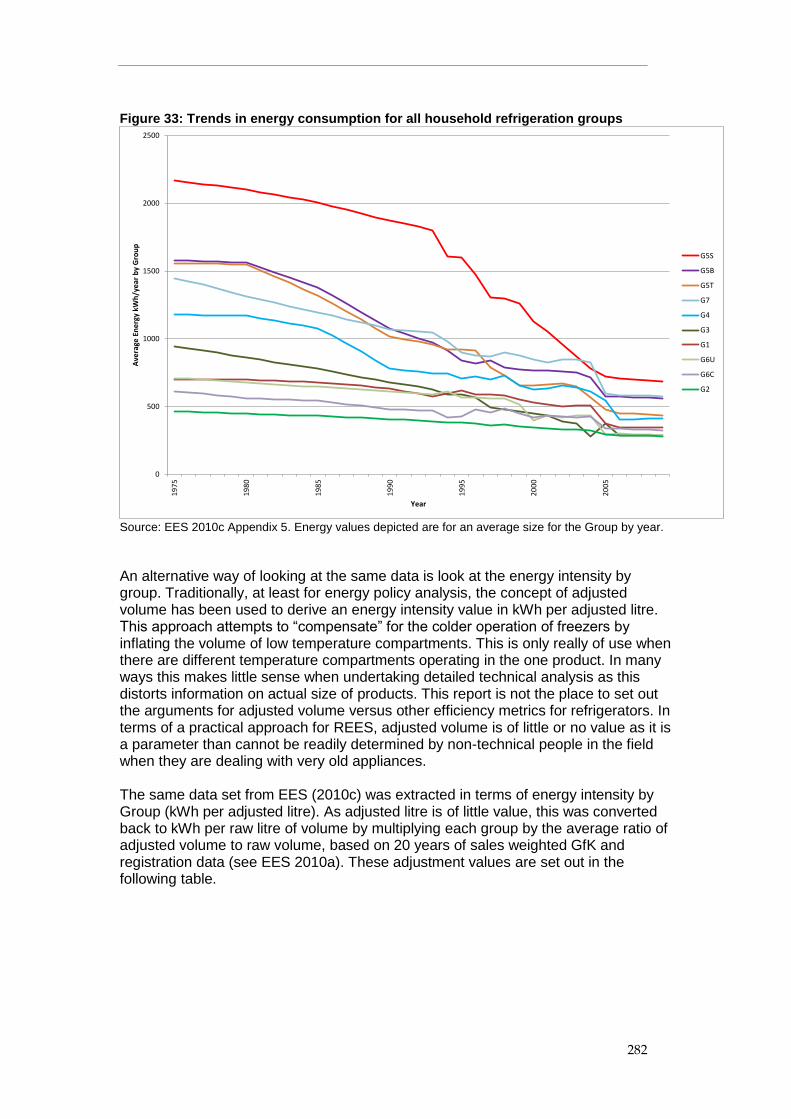
R 282
Figure 33: Trends in energy consumption for all household refrigeration groups
Source: EES 2010c Appendix 5. Energy values depicted are for an average size for the Group by year.
An alternative way of looking at the same data is look at the energy intensity by group. Traditionally, at least for energy policy analysis, the concept of adjusted volume has been used to derive an energy intensity value in kWh per adjusted litre. This approach attempts to “compensate” for the colder operation of freezers by inflating the volume of low temperature compartments. This is only really of use when there are different temperature compartments operating in the one product. In many ways this makes little sense when undertaking detailed technical analysis as this distorts information on actual size of products. This report is not the place to set out the arguments for adjusted volume versus other efficiency metrics for refrigerators. In terms of a practical approach for REES, adjusted volume is of little or no value as it is a parameter than cannot be readily determined by non-technical people in the field when they are dealing with very old appliances. The same data set from EES (2010c) was extracted in terms of energy intensity by Group (kWh per adjusted litre). As adjusted litre is of little value, this was converted back to kWh per raw litre of volume by multiplying each group by the average ratio of adjusted volume to raw volume, based on 20 years of sales weighted GfK and registration data (see EES 2010a). These adjustment values are set out in the following table.
0
500
1000
1500
2000
2500
19
75
19
80
19
85
19
90
19
95
20
00
20
05
Ave
rage
En
erg
y kW
h/y
ear
by
Gro
up
Year
G5S
G5B
G5T
G7
G4
G3
G1
G6U
G6C
G2

R 283
Table 127: Adjustment factor from total volume to adjusted volume
Group
Ratio of Adjusted Volume to total volume
Group 1 1
Group 2 1.03
Group 3 1.04
Group 4 1.16
Group 5T 1.16
Group 5B 1.2
Group 5S 1.22
Group 6U 1.6
Group 6C 1.6
Group 7 1.6
Notes: This factor takes into account the average share of freezer volume and the freezer adjustment factor applied in each Group to get adjusted volume.
After these factors have been applied, it is possible to plot long term trends in average energy intensity in terms of kWh/litre of total (raw) volume/year. Figure 34: Trends in refrigerating appliance energy intensity
Source: EES 2010c with factors in Table 127 applied
While there is still some variation in energy intensity at a Group level, in general terms this only varies from around 2 to 3 for appliances from the 1990s and 3.5 to 4 for appliances from the 1970s. This does narrow the range of likely energy consumption that will be encountered if the approximate volume of the appliance can be established. This is quite important as a 100 litre bar refrigerator has a very similar energy intensity to a 600 litre side by side refrigerator freezer. But clearly the
0.00
0.50
1.00
1.50
2.00
2.50
3.00
3.50
4.00
4.50
5.00
19
75
19
80
19
85
19
90
19
95
20
00
20
05
Ave
rage
En
erg
y In
ten
sity
kW
h/r
aw li
tre
/ye
ar b
y G
rou
p
Year
G6U
G6C
G7
G4
G5B
G5T
G5S
G2
G3
G1

R 284
absolute energy will be 6 times larger for the side by side. So it is strongly recommended that a volume based function be developed for this activity. It is proposed that a default energy intensity of 1.5 kWh/litre of total volume be assumed for all secondary appliances that are removed from the stock. Where it can be established that the product is pre-1996, primarily though verification that the refrigerant gas is R12, then an intensity of 2.25 kWh/litre could be used. Much older refrigerators are likely to have an even higher energy intensity than these values, but they are likely to be closer to the end of their normal operating life, so their savings will occur over a shorter period. Establishing the age of a refrigerator with any accuracy and without a lot of research can be quite problematic. This then allows a relaxation of the age requirement (in general terms) and offers a higher default savings where the age can be established as pre-1996. Removal of CFC refrigerants is also an important co-benefit. It would also be possible to extend this general arrangement to replacement and removal of a main appliance. In this case, it is necessary to take off the credit the likely energy consumption of the new appliance that is being put into its place. While being fairly generous, offering a net default energy intensity of 0.75 kWh/litre for the replacement of a new product would make it reasonably consistent and would expand the scope of appliances covered somewhat. Similarly, this could be increased to 1.25 kWh/litre where it can be established that the refrigerant is R12 and/or the product is pre-1996. If removal of a primary refrigerator or freezer is to be included, it has to be said that it is fairly easy to “rort” (or get around the restriction) in that if a participant wants a new refrigerator, they buy this first and then claim the full credit for the disposal of a secondary refrigerator after the new product is installed (rather than the reduced credit for the replacement of a main refrigerator). So there is some debate as to whether having a separate specification for replacement of a main appliance (as set out in NSW) is needed. It is understood that practical experience in dealing with the recovery of old refrigerators has revealed that it is often difficult to determine the internal volume, as often there is no nameplate or other markings that will provide information about the volume. Locally produced products should have this data available, but it is by no means universal. One way to overcome this is to use external dimensions of the appliance in order to obtain a proxy for the internal volume. Field measurements of some 150 refrigerators of various ages and sizes were reviewed where data on the external dimensions and the rated volume were accurately known. This suggests that the rated internal volume can be reasonably predicted by the external volume divided by 1.688. Measuring the external dimensions of a refrigerator or freezer is not onerous and this can be clearly verified and checked during an audit. The final piece of data that needs to be established is how to estimate the how long the refrigerator (being removed) would have operated in the stock without any further intervention. This is a difficult area and there is not likely to be a lot of documentation on the topic. There is no doubt that in the absence of encouragement to remove old refrigerators, many will just remain in the stock and operating. Some people keep secondary refrigerators unplugged and only operate these when required (or not at all), so these types of participants could be regarded as free riders. This has been included in the overall adjustment factor for this parameter.

R 285
Figure 35: Rated volume versus external volume for various refrigerators in the stock
Source: EES field measurements
As Victoria removed about 8,000 refrigerators per year at the moment under the VEET scheme, it may be possible to do some new primary research work with service providers in that state in order to improve estimates of this parameter. NSW explicitly state a life of this activity of 7 years for both secondary and primary refrigerator removal. The savings credits are somewhat lower for the main refrigerator on the basis that this will be replaced by a new refrigerator (and possibly also due to a lower implied energy intensity for main refrigerators that are being replaced, that should be younger than secondary refrigerators). However, the assumed lifetime of 7 years for both suggests that operating time in the absence of the scheme is the same for main and secondary refrigerators. For this initial review, an assumed lifetime of 7 years is being adopted, pending more robust information. Overall Adjustments to Estimate Savings During Normal Use for Refrigerators and Freezers As set out in the section on new refrigerators and freezers, these products are tested in a hot room (32°C ambient) at defined internal temperatures in order to determine energy consumption. There is no user interaction and no loads to cool. This is obviously not very representative of normal use. As secondary refrigerators are likely to have lower user interaction than main refrigerators and because that are more likely to be located in unconditioned parts of the house, the overall adjustment to the estimated energy should be lower than the values assumed for a main refrigerator. For this analysis, it is proposed that lower values for climate adjustment of 0.80 for refrigerators for the removal of second
y = 1.6886xR² = 0.9347
0
200
400
600
800
1000
1200
1400
0 100 200 300 400 500 600 700 800
Exte
rnal
vo
lum
e li
tre
s
Rated volume litres

R 286
refrigerators (see section on new refrigerators for full references) and 0.85 for main refrigerators. Separate freezers have lower interaction in any case (compared to refrigerators) and many main freezers are located in unconditioned spaces, so no change to the freezer climate factors are necessary for a secondary freezer (so a common factor is used for all secondary products). For the sake of simplicity, it is proposed to use the same climate adjustment factor for main freezers and main refrigerators (on the basis that most main appliances removed will be refrigerators). Many old refrigerators and freezers are known to have worse performance compared to when they are new. This is due to a range of reasons such as wear and tear, deteriorating seals, poor air flow over the condensers and so forth. Another important factor is the gradual migration of the foam blowing agent out of the polyurethane, which gradually decreases it efficacy over time. This effect is well understood but not very well documented. Another effect that can occur in old products with manual defrost (cold wall evaporators) is the ingress of moisture into the foam where it may accumulate around the evaporator inside the wall of the product (direct cooling products). This reduced the heat transfer and conduction to the evaporator reduces overall efficiency. It is not possible to assess this effect without destroying the product. While many old products will be performing satisfactorily, there is some published material from the USA that suggests that products that are more than 20 years old perform significantly worse that their new specification would suggest (Duemling 2008, Calwell 2013 and Greenblatt et al 2013). On average, very old products appeared to use 20% more energy than otherwise expected in the field (noting that house to house use is highly variable in any case). So it is recommended that a factor of 1.2 is be applied to products that can be established as being older than 1996 (this effectively largely counteracts the overall climate adjustments for older products). Calculation of Lifetime Savings for Refrigerators and Freezers The annual savings for each type of product can be calculated from the assumed energy intensity base line for each case, the volume and the associated adjustment factors. The four main cases are set out below. A specific size of product is included for illustrative purposes. Table 128: Sample calculations for removal of secondary refrigerator with R12 refrigerant
Parameter Value Units and comment
Volume external 0.7 m3
Volume internal 415 litres
Pre-1996 intensity 2.25 kWh/raw litre
Lifetime of activity 7 years
Overall program adjustments 0.794 Free riders, rebound, compliance
Climate adjustment 0.8 Low use, unconditioned
Energy deterioration of older 1.2 US references
Second Pre-1996 savings 933 kWh/y (not adjusted)
Second Pre-1996 savings 4978 kWh lifetime
Second Pre-1996 savings 17.9 GJ lifetime
Notes: Removal of secondary refrigerator assumes all energy reductions are savings

R 287
Table 129: Sample calculations for removal of other secondary refrigerator
Parameter Value Units and comment
Volume external 0.7 m3
Volume internal 415 litres
Other intensity 1.5 kWh/raw litre
Lifetime of activity 7 years
Overall program adjustments 0.794 Free riders, rebound, compliance
Climate adjustment 0.8 Low use, unconditioned
Energy deterioration of older 1 No adjustment for newer products
Second other savings 622 kWh/y (not adjusted)
Second other savings 2766 kWh lifetime
Second other savings 10.0 GJ lifetime
Notes: Removal of secondary refrigerator assumes all energy reductions are savings
Table 130: Sample calculations for removal of main refrigerator with R12 refrigerant
Parameter Value Units and comment
Volume external 0.7 m3
Volume internal 415 litres
Pre-1996 intensity 1.25 kWh/raw litre
Lifetime of activity 7 years
Overall program adjustments 0.794 Free riders, rebound, compliance
Climate adjustment 0.85 Normal use (assume same for freezers)
Energy deterioration of older 1.2 US references
Main Pre-1996 savings 518 kWh/y (not adjusted)
Main Pre-1996 savings 2939 kWh lifetime
Main Pre-1996 savings 10.6 GJ lifetime
Notes: Removal of main refrigerator assumes difference between old and new are savings. Assume common climate adjustment factor for refrigerators and freezers for simplicity.
Table 131: Sample calculations for removal of other main refrigerator
Parameter Value Units and comment
Volume external 0.7 m3
Volume internal 415 litres
Other 0.75 kWh/raw litre
Lifetime of activity 7 years
Overall program adjustments 0.794 Free riders, rebound, compliance
Climate adjustment 0.85 Normal use (assume same for freezers)
Energy deterioration of older 1 No adjustment for newer products
Main other savings 311 kWh/y (not adjusted)
Main other savings 1469 kWh lifetime
Main other savings 5.3 GJ lifetime
Notes: Removal of main refrigerator assumes difference between old and new are savings. Assume common climate adjustment factor for refrigerators and freezers for simplicity.

R 288
Potential Compliance Issues It is important that old refrigerators are removed and correctly degassed to ensure that refrigerant is not vented to the atmosphere. This needs to be undertaken by an authorised agent under the Ozone Protection and Synthetic Greenhouse Gas Management Act 1989. Establishing the external volume is simple and this can be easily audited. Establishing the refrigerant used is usually fairly simple and this can be easily audited. There is a significant incentive to ascertain whether the product has R12 refrigerant. Where this is the case, there are strong co-benefits through the correct removal of ozone depleting substances.

R 289
Remove and dispose of an unwanted Refrigerator or Freezer Activity No.
APP2
1. Activity Specific Definitions
Refrigerator means a refrigerating appliance that could be classified as Group 1, 2, 3, 4, 5T, 5B or 5S under standard AS/NZS4474.2 (or under AS1430). Freezer means a refrigerating appliance that could be classified as Group 6C, 6U or 7 under standard
AS/NZS4474.2 (or under AS1430). Secondary refrigerator means, after the removal of the target appliance, a main refrigerator remains installed and operating Secondary freezer means, after the removal of the target appliance, a main freezer remains installed
and operating Depth means the measured external depth of the refrigerating appliance from the rear plane of the cabinet (excluding any condenser coil) to the front (including the door where applicable) in metres Width means the measured external width of the refrigerating appliance from the left wall of the cabinet
to the front right wall of the cabinet in metres Height means the measured external height of the refrigerating appliance from the lowest part of the cabinet wall or door (excluding any clearance or air gap to the floor) to the top of the appliance in metres External volume is the calculated volume in cubic metres of the refrigerating appliance from measured values of depth × width × height
2. Activity Description (Summary)
Remove and dispose of an existing refrigerator or freezer from a residential or commercial premise
3. Activity Eligibility Requirements
Any residential premise in South Australia where the installed product requirements can be met.
4. Installed Product Requirements
1. Products must be in working order. 2. The appliance shall operate on single phase mains power (nominally 230V, 50Hz). 3. The product shall be a household type of refrigeration appliance that could be classified under
AS/NZS4474 or AS1430. 4. The refrigerating appliance shall use the vapour compression cycle (absorption and piezoelectric
types are not eligible). 5. The refrigerating appliance shall not be a wine storage appliance. 6. Portable, camping or appliances installed in caravans are not eligible.
5. Minimum Removal Requirements
1. The refrigerator or freezer must be removed from the premises and decommissioned. 2. Removed refrigerators and freezers shall have refrigerants and any other scheduled substances
disposed of in accordance with the Australian and New Zealand refrigerant handling code of practice as established under the Ozone Protection and Synthetic Greenhouse Gas Management Act 1989.
3. Where possible, the type of refrigerant used in the product shall be established from markings on the product and recorded in the activity schedule.
4. The measured external dimensions for depth, width and height for each product and the calculated external volume of the product shall be recorded in the activity schedule.
6. Activity default energy savings The total Gigajoule energy (GJ) saved attributed to this activity per appliance purchased is:
Secondary refrigerator or secondary freezer with R12 (CFC) refrigerant Savings GJ = 25.6 × external volume in m
3
Secondary refrigerator or secondary freezer with unknown or other refrigerant Savings GJ = 14.2 × external volume in m
3
Other refrigerator or other freezer with R12 (CFC) refrigerant Savings GJ = 15.1 × external volume in m
3
Other refrigerator or other freezer with unknown or other refrigerant Savings GJ = 7.6 × external volume in m
3
Default energy savings are in GJ of electricity
7. Guidance Notes (Informative only – not mandatory)
There is no size restriction on eligible products. All reasonable endeavours should be used to recycle other components of removed appliances.

R 290
Installation of a High Efficiency Pool Pump - APP3
Technical Assessment – APP3
Installation of a High Efficiency Pool Pump
REES Activity Reference: APP3 REES Activity title: Installation of a High Efficiency Pool Pump Target product: new or replacement pool pumps and related systems Savings: Activity saves energy directly by encouraging the purchase of a new product that is better than average efficiency Pre-conditions: None

R 291
Current REES Activity Description This activity currently forms part of the REES scheme code59 . The current summary description within the REES scheme code is as follows: “Install upgraded high energy efficient pool pump” The activity involves the installation of a high efficiency pool pump. There are a number of requirements for this pump:
The pool pump must be purchased for the use in a residential pool or spa;
If the installation requires an electrical compliance certificate, one is provided and lodged with the Office of the Technical Regulator;
The pool pump is required to: o Be a single phase pump; o Have an input power between 300 Watts and 1500 Watts when tested
in accordance with AS 5102.1:2009; o Be listed as part of the Equipment Energy Efficiency Committee’s
Voluntary Energy Rating Labelling Program for Swimming Pool Pump units;
o Have a minimum star rating of 3 as determined by AS 5102.1:2009; o As a proclaimed product in South Australia, meet the safety
requirements of AS/NZS 3350.2.41:1997 or AS/NZS 60335.2.41:2004. This activity currently attracts a deemed CO2-e value given by the following equation: Deemed value = 0.00003 x Q x (1,622 – PAEC) x 0.9 Where: Q = flow rate in litres/minute of the pump PAEC (Projected Annual Energy Consumption) = 18,250 / {9 x e[LN(1.25) x (SRI – 1)]} SRI = star rated index of the high efficiency pump being installed Deemed value is in tonnes of CO2e saved. Calculated values are rounded to the whole tonne of CO2e.
Proposed REES Activity Description The proposed activity description is as follows: “Installation of a High Efficiency Pool Pump” The activity involves the installation of a high efficiency pool pump. There are a number of requirements for this pump:
The pool pump must be purchased for the use in a residential pool or spa;
The pool pump shall be single phase;
If the installation requires an electrical compliance certificate, one is provided and lodged with the Office of the Technical Regulator;
The pool pump is required to: o Be a single phase pump; o Have an input power between 100 Watts and 1500 Watts when tested
in accordance with AS 5102.1:2009;
59
RESIDENTIAL ENERGY EFFICIENCY SCHEME CODE REESC/07 February 2014

R 292
o Be listed as part of the Equipment Energy Efficiency Committee’s Voluntary Energy Rating Labelling Program for Swimming Pool Pump units;
o Have a minimum star rating of 3 as determined by AS 5102.1:2009; o As a proclaimed product in South Australia, meet the safety
requirements of AS/NZS 3350.2.41:1997 or AS/NZS 60335.2.41:2004. For pool pumpa installed from calendar year 2016, pool pumps shall comply with: AS/NZS 4755.3.2:2012 Demand response capabilities and supporting technologies for electrical products - Interaction of demand response enabling devices and electrical products - Operational instructions and connections for devices controlling swimming pool pump-units Default savings= ]1622[00009.0 CECQ
Where: Q is the rated flow rated in litres per minute (as per AS5102) 1622 is the 2 star CEC under the energy labelling scheme AS5102 in kWh/year CEC is the comparative energy consumption of the product under the voluntary labelling scheme in kWh/year Default savings are over the product lifetime in GJ of electricity.
Key Specification Changes The following elements remain unchanged in this specification:
Products shall be registered for energy labelling and the registration is valid at the time of sale.
The minimum star rating of qualifying units remains at 3 stars, noting that many units are available which very high star ratings. Current baseline of 2 stars has been maintained. Both of these parameters should be reviewed if better market data comes to hand.
Pool pumps are restricted to single phase.
Electrical safety requirements remain unchanged.
The calculation of energy savings remains largely unchanged, but the units have been converted to GJ electricity saved.
Energy savings are restricted to residential sector. The following elements have changed in this specification:
Credits should be available directly to retailers rather than through service providers or end users.
Input power ranges have been adjusted to account for very efficient products and to align with ACT and Victoria (100W to 1500W).
A requirement to comply with AS/NZS 4755.3.2:2012 (demand response) is recommended after consultation with stakeholders and a suitable sunrise period (from 2016 recommended).
The following information needs to be documented where possible:
E3 should be encouraged to publish rated flow rate data on the website (this is shown on the energy label).
Data on typical flowrates should be reviewed to ensure that the revised REES specification is in line with expected overall savings.

R 293
It is recommended that assumptions such as lifetime and specification of the savings base be explicitly stated in the notes to assist with future review and updates.
Scheme Review – Other jurisdictions The following jurisdictions also include the installation of a high efficiency pool pump activity within their schemes:
Victoria: VEET Schedule 26 – Installation of high efficiency pool pump
NSW: ESS Activity D5 – Replace an existing pool pump with a high efficiency pool pump
ACT: EEIS Part 5.7 – Installation of a high efficiency swimming pool pump Table 133 below provides a comparison of the key elements of the requirement in each jurisdiction for high efficiency pool pumps.
Scheme Review - Potential of the activity (overview) The activity involves the installation of a high efficiency pool pump. A pool pump is an essential component of the equipment that is necessary to keep the water contained in a pool or spa circulated and free of contaminants. Pool pumps are often found working in concert with filters and chlorinators, and generally operate via a timer. Unless the pool or spa has been decommissioned for a period of non-use (i.e. the winter months), the pool pump will be active at least daily, with the timer possibly working during off peak tariffs. Due to this regular activity, the energy usage and associated monetary costs of running the pool pump can be high. Although pool pumps are not regulated for efficiency at this stage, the Australian Department of Industry and E3 do run a voluntary labelling program, which currently lists a range of products.
Assessment Against Scheme Principles This activity aligns with all major policy objectives, except that is does not provide a focus on low income households.
Table 132: Activity Alignment with Policy Objective – HE pool pump
Policy Objective Reduces household and/or business energy use Provides a focus on low income households ×
Associated Objectives: Provides greenhouse gas emission benefits
Provides energy cost benefits

R 294
Table 133: State Scheme Summary – Comparative table (Install High Efficiency Pool Pump)
Parameter SA – REES Scheme (Current)
VIC – VEET Scheme *
NSW – ESS Scheme ACT – EEIS Scheme SA – REES Scheme (Proposed)
Working Title Promote the installation of high efficiency pool pumps
Installation of high efficiency pool pump
Replace an existing pool pump with a high efficiency pool pump
Installation of a high efficiency swimming pool pump
Installation of a high efficiency swimming pool pump
Activity Reference Number N/A 26 D5 Part 5.7 APP3
Required pre-conditions
For a residential pool or spa
For a domestic pool or spa
For a domestic pool or spa, with the existing pool pump must be in working order at the time of replacement
For an eligible residential or domestic premises
For a residential premises
Replacement unit performance options
Minimum star rating of 3 Minimum star rating of 3 Minimum star rating of 5.5 Minimum star rating of 6 (although 3 star is also stated)
Minimum star rating of 3
Deemed Values per replacement
0.00003 x Q x (1,622 – PAEC) x 0.9 t CO2-e / m
2
(split into product classes according to expected formula results)
0.00674 x (1,622 – PAEC) t CO2-e / m
2
Complex lookup table – based on flow rate and star rating
0.00571 x (1,622 – PAEC) t CO2-e / m
2
0.00009 x Q x (1,622 – PAEC) in GJ electricity
Replacement product warranty requirements
Nil Nil 5 years Nil Nil
Referenced Standards Product – AS 5102.1:2009 Safety – AS/NZS3350.2.41:1997 or AS/NZS60335.2.41:2004
Product – AS 5102.1:2009
Product - AS 5102.1:2009 AS 5102.2:2009
Product – AS 5102.1, AS 5102.2 Safety – AS 3000
Product – AS 5102.1:2009 Safety – AS/NZS3350.2.41:1997 or AS/NZS60335.2.41:2004
Other requirements Product is required to be: Single phase Have an input power between 300 and 1500 Watts Be listed as part of the E3 pool pump labelling scheme Meet the appropriate SA safety requirements
Product is required to be: Single phase Single/dual/multiple/variable speed Have an input power between 100 and 1500 Watts Be listed as part of the E3 pool pump labelling scheme
Product is required to be: Single phase, Single/dual/ multiple/variable speed, Have an input power between 300 and 2500 Watts, Be listed as part of the E3 pool pump labelling scheme, Meet the appropriate NSW safety requirements, The decommissioned pool pump must be removed in accordance with the relevant safety standards and legislation
Product is required to be: Single phase Single/dual/multiple/variable speed Have an input power between 100 and 1500 Watts Be listed as part of the E3 pool pump labelling scheme Meet the appropriate ACT safety requirements
Product is required to be: Single phase Have an input power between 100 and 1500 Watts Be listed as part of the E3 pool pump labelling scheme Meet the appropriate SA safety requirements From 2016 comply with AS/NZS 4755.3.2:2012
Notes: * All VEET specifications have different emission factors for metropolitan versus regional installations.

R 295
The following table provides an assessment of the activity against the new principles proposed for REES code. Table 134: Alignment with REES General Principles - High Efficiency Pool Pumps
Principle Assessment
1. Provides evidence based energy savings
The basis for energy savings associated with this type of activity is well evidenced. Products are registered for energy labelling currently on a voluntary basis (which may change in the future), and there is a well-established system of testing and measurement to establish the product claims. Technical and labelling requirements are set out in an Australian Standard. This activity is technically capable of limited implementation and uptake by households within South Australia, restricted to households with or installing a pool or spa (around 10% of households).
2. Energy savings are additional to base case (BAU) and minimises free riders
The additionality can be clearly defined as the difference between the business as usual case (standard efficiency appliance) and the efficiency level of the appliance selected. For this to be effective, it is important to have credible and reliable data on which to establish an accurate business as usual case. New appliances will be purchased in any case and the specification leverages on these purchases to encourage the selection of high efficiency appliances. New appliances will be purchased in any case and the specification leverages on these purchases to encourage the selection of high efficiency appliances. Some free riders will exist, but accounted for through energy saving discounts.
3. Reward best practice in relation to product performance
The activity recognises the efficiency of the pool system under the relevant standard and energy savings are scaled in accordance with the measured efficiency. All data is readily available and credible.
4. Provides a means for ensuring quality assurance and participant satisfaction
Pool pump systems are specified by system providers and these have to be designed to operate correctly in the long term – this is independent of system efficiency.
5. Credible approach for the calculation of energy savings
Energy savings are scaled in proportion to flow rate and system efficiency and this data is in accordance with the relevant standard.
6. Provides scope for objective, cost effective and practical auditing
Installation of equipment as part of the activity is simple and easy to audit.
7. Good practice Old products are to be recycled and installation should be by professional installers who follow standard design rules.
8. Harmonisation (as far as practical)
This activity is available in the Victorian, NSW and ACT schemes. Each jurisdiction that lists this activity includes similar elements within their specifications, although some of the details do vary. This activity provides good scope for inter jurisdictional alignment but will require dialogue to resolve existing differences. Current REES approach is considered to be the most superior.
9. Safety and minimising overall risk
Typically, the activity is undertaken by qualified professionals. Products are required to comply with relevant safety standards. Installation of a high efficiency system (over a standard system) presents no additional risk to service providers and participants.
Energy Savings - Review Overview of methodology The methodology used to establish energy savings can be broadly summarised as follows:
Establish the current average energy consumption under the voluntary energy labelling scheme.
Identify the best available products on the market and a reasonable minimum efficiency premium over the business as usual case before REES energy savings are eligible to be counted.

R 296
Examine other state specifications and consider how these can be aligned and/or adapted for South Australia.
Look at the adjustments that are required to convert energy determined in accordance with the relevant standard (energy label value) back to energy consumption that is expected during normal use (specifically with respect to operating conditions, usage, loading and other settings that impact on energy).
Registration data and data on usage and key settings from published reports have been used wherever possible. Key Assumptions The underlying assumptions used as the basis for the calculation of energy savings in this study are detailed in Table 135.
Table 135: Energy Savings Estimate – Underlying Key Assumptions (High Efficiency Pool Pump)
Parameter Value Basis / Comment
Energy Service Levels Pool Pumps One pool
exchange per day
AS5102 - actual pool size varies (base assumption is 50,000 litres)
Base Case Assumptions Program Labelling Basis for calculation of parameters as per
AS5102
Ownership * About 10%, (sales stream not used in setting of specifications)
REES Activity Assumptions
Performance
As per standards
Same requirements for BAU and high efficiency
Lifetime and persistence
Product lifetime 12 years As used in NSW
Product persistence 12 years As used in NSW
Adjustment Factors
Additionality discount factor 1.0 Not applicable as additional impact is specifically quantified in methodology
Free rider discount 0.90 Some free riders who would have purchased very high efficiency appliances in any case
Rebound discount factor 1.0 Not relevant as base case and high efficiency case will provide equivalent energy service
Compliance discount factor 1.0 Appliances will normally be installed correctly
Total Discount factor 0.90 Product of individual factors
Climatic Adjustments
Adjustments required? NA No adjustments required
Energy Savings Calculation The regulatory context for high efficiency pool pumps is that a voluntary energy labelling scheme has been in force since 2010. Victoria, ACT and NSW all have activity specifications for pool pumps. Victoria uses the same star rating requirements as currently used in South Australia, setting a minimum 3 star rating to qualify. NSW specifies a minimum of 5.5 stars, while the ACT is contradictory in its specification states 6 stars minimum but also 3 stars minimum in order to qualify. NSW differs

R 297
from the other schemes in that it requires the high efficiency pool pump to be a replacement for an existing working pump. There are no other requirements in any scheme. Pool pumps use significant amounts of energy. Typical systems (historically) are 1200W to 2400W input power and annual energy consumption, based on a range of field measurements over several decades, is of the order of 1500 to 2000 kWh/year. Prior to detailed analysis of the approaches used in each state, it is useful to set out some background on how AS5102 determines the values that are used for the energy labelling scheme. Table 136 shows the pool pump CEC by star rating. Table 136: Pool Pump Annual Energy by Star Rating
Star Rating CEC kWh/y
Efficiency L/Wh
1 2028 9 2 1622 11 3 1298 14 4 1038 18 5 831 22 6 664 27 7 532 34 8 425 43 9 340 54 10 272 67
Note: CEC is the Comparative Energy Consumption shown on the energy label in kWh/year. Efficiency is defined as litres of pool water pumped per Wh of pump input energy.
Table 136 shows for each star rating, the energy consumption of a pump operated in accordance with AS5102. The standard determines a pumping efficiency metric, which is measured in litres pumped per Wh of energy input into the pump. The pumping efficiency for each star rating is also shown. AS5102 assumes a standard pumping task of 50,000 litres pumping per day (one exchange of a medium sized pool). The base pumping efficiency is assumed to be 9 L/Wh and this increases by 25% for each additional star. The way the standard is designed, the CEC is completely independent of the size of the pump. For a given star rating (and pumping efficiency), a smaller pump has to run for longer to complete 1 turnover of the standard sized pool. A larger pump runs for a shorter period. The result is the CEC in accordance with the standard is fixed for a given pumping efficiency. While this is useful for comparing pumps and their relative performance, it does not necessarily give an accurate indication of likely energy consumption of a pump installed in normal use. In reality, smaller pools should have smaller pumps installed while larger pools should have larger pumps. Therefore input power and flow rate is likely to scale with pool size, at least to some extent. The other consideration is that AS5102 intensely focuses manufacturers on the efficiency of the pumping task. This naturally puts strong downward pressure on flow rates, as head losses are a function of the square of water velocity in the pipe. The standard also shows the strong benefits in the increase of pipe size in reducing head losses. As the labelling scheme is currently voluntary, there is no definitive way to determine the average market efficiency of new pool pumps supplied to market. However, discussions with consultants who have developed the current scheme believe that
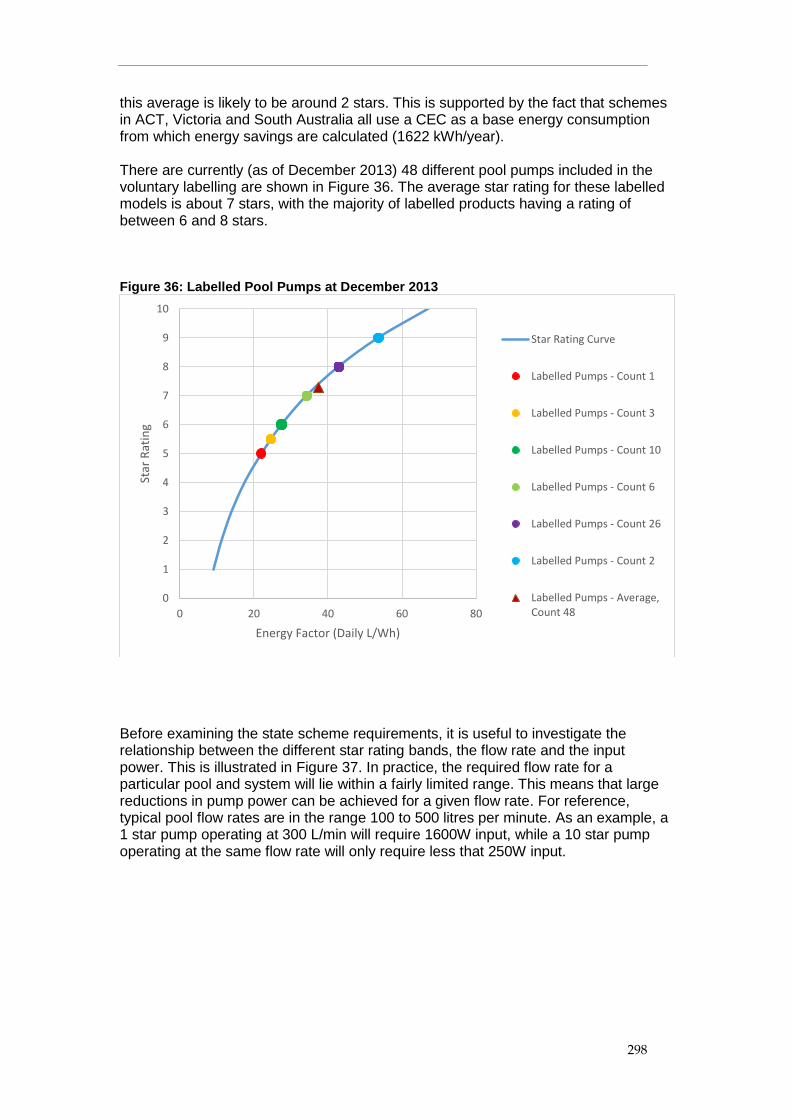
R 298
this average is likely to be around 2 stars. This is supported by the fact that schemes in ACT, Victoria and South Australia all use a CEC as a base energy consumption from which energy savings are calculated (1622 kWh/year). There are currently (as of December 2013) 48 different pool pumps included in the voluntary labelling are shown in Figure 36. The average star rating for these labelled models is about 7 stars, with the majority of labelled products having a rating of between 6 and 8 stars. Figure 36: Labelled Pool Pumps at December 2013
Before examining the state scheme requirements, it is useful to investigate the relationship between the different star rating bands, the flow rate and the input power. This is illustrated in Figure 37. In practice, the required flow rate for a particular pool and system will lie within a fairly limited range. This means that large reductions in pump power can be achieved for a given flow rate. For reference, typical pool flow rates are in the range 100 to 500 litres per minute. As an example, a 1 star pump operating at 300 L/min will require 1600W input, while a 10 star pump operating at the same flow rate will only require less that 250W input.
0
1
2
3
4
5
6
7
8
9
10
0 20 40 60 80
Star
Rat
ing
Energy Factor (Daily L/Wh)
Star Rating Curve
Labelled Pumps - Count 1
Labelled Pumps - Count 3
Labelled Pumps - Count 10
Labelled Pumps - Count 6
Labelled Pumps - Count 26
Labelled Pumps - Count 2
Labelled Pumps - Average,Count 48

R 299
Figure 37: Input power and flow rate by star rating
The first point to note is that the approach used in Victoria and ACT uses the star rating and CEC only and does not consider the size of the pump or its flow rate. This means that the energy savings estimated for those schemes are independent of the pump size. In reality, this is not likely to be such an accurate reflection of the likely energy consumption of the pump, as the size of the pump should scale with pool size. The approach used in REES is to reference the 2 star CEC as the basis for calculating energy savings but to scale the energy savings in proportion to the pump flow rate (Q). If this is calibrated correctly, this should provide a better estimate of energy savings for different sized pumps. NSW ESS uses a lookup table that covers three flow rate ranges and deemed energy savings by star rating. To allow comparison of the state schemes, the deemed savings have been compared. For South Australia deemed saving for each of the state schemes for a 240 L/min pump. The middle flow rate range (that covers 240 L/min) has been selected for NSW. Table 137 shows that, for a standard sized pool pump, deemed savings for South Australia, Victoria and ACT are all comparable. This is not that surprising given the common origins. However, the assumed lifetime in each state could create some differences. A pool pump moving from 2 stars to 6 stars should reduce energy consumption to about one third of the 2 star value. Based on field measurements, this should result in savings of around 1000 kWh/year. With program related adjustments and an assumed life of about 10 years, the current approach appears to give about the correct order of likely savings.
0
100
200
300
400
500
600
700
800
900
1000
200 400 600 800 1000 1200 1400 1600 1800 2000 2200 2400
Flo
w R
ate
(L/
Min
)
Input Power (Watts)
10 Star
9 Star
8 Star
7 Star
6 Star
5 Star
4 Star
3 Star
2 Star

R 300
Table 137: Pool Pump Deemed Savings by Star Rating by State
Star Rating SA (t CO2-e / m2) VIC (t CO2-e / m
2) NSW (MWh) ACT (t CO2-e / m
2)
1 -2.6 -2.7 -2.3 2 0.0 0.0 0.0 3 2.1 2.2 1.9 4 3.8 3.9 3.3 5 5.1 5.3 4.5 6 6.2 6.5 2.1 5.5 7 7.1 7.3 3.6 6.2 8 7.7 8.1 4.7 6.8 9 8.3 8.6 5.6 7.3 10 8.8 9.1 6.3 7.7
The requirements for NSW have been examined. The concept of providing different savings for different sized pumps (three flow rate ranges are provided) appears to be a technically sensible approach. However, the NSW scheme appears to calculate savings from a base of 4 stars (or 4.5 stars). It is not clear how this was set as a basis for calculating energy savings. The NSW scheme is restricted to replacing an existing, operating pool pump, so this may influence the savings. The different flow rate ranges in NSW were also examined: the savings are broadly consistent with the scaling of flow rate, which broadly aligns with the REES approach. In consideration of the available data, it would appear that the general approach currently being used in South Australia is providing the best available basis for estimating energy savings. Other states should be engaged to see if consensus can be reached on a flow rate based approach (like REES) can be used for all states. Agreement on the baseline efficiency should also be agreed if possible (where better data can be obtained). The current website that lists pool pump models (see http://www.energyrating.gov.au/products-themes/other/swimming-pool-pumps/voluntary-labelling/) only provides the star rating. Given the users will want to correctly size their system, data on rated flow rate (and input power) should also be included on the website (this data is included on the energy label so is in the public domain). At this stage, no significant change to the REES approach is proposed. Data on the range of flow rates in the market place should be reviewed to check that the current approach, changed to energy savings, provides reasonable energy savings estimates. As a reference point, the energy consumption of a 2 star system at 360 L/min is assumed to equal the CEC value of 1622 kWh/year. This is close to the baseline assumed in current approach. If a 10 year life is assumed and program factors of 0.9 applied, energy savings can be calculated as:
Default savings= 1000360
]1622[6.39.010
CECQ
Where: Q is the rated flow rated in litres per minute (as per AS5102)

R 301
10 is the assumed lifetime in years 0.9 are program related factors (see assumptions) 3.6 is a factor to convert MWh to GJ 1000 is a factor to convert kWh to MWh 1622 is the 2 star CEC under the energy labelling scheme AS5102 in kWh/year CEC is the comparative energy consumption of the product under the voluntary labelling scheme in kWh/year Default savings are over the product lifetime in GJ of electricity. As an example, a 6 star pump with a CEC of 662 kWh/year has a flow rated of 360 L/min. The default savings are:
Default savings= 1000360
]6621622[6.39.010360
= 31.0 GJ lifetime electricity savings A pump with the same rating at: 240 L/min = 20.7 GJ lifetime electricity savings 120 L/min = 10.3 GJ lifetime electricity savings As noted above, care is required to check that this default flow rate is set at representative value, especially considering that many high efficiency pumps now tend to have lower flow rates (and will operate for longer periods). As noted in Table 133, there are a number of other differences and similarities in the state schemes. All state schemes restrict this activity to the residential sector. This should be maintained. Single phase: All states specify this requirement – this should be retained. NSW, ACT and Victoria all list various types of controls (single speed, variable speed, multi-speed etc). This seems to be unnecessary as the labelling scheme defines the permitted pump types. All states specify a permitted input power range. ACT and Victoria are 100W to 1500W, SA is 300W to 1500W and NSW is 300W to 2500W. Given that energy efficiency for pool pumps will effectively have strong downward pressure on input power (while reducing slightly or maintaining flow rates), it would seem the upper limit of 1500W is reasonable (some historical pumps will be at this limit or higher, but that is of little concern). Very high efficiency pumps could easily have an input power of less than 300W so it recommended that SA REES requirements align with Victoria and ACT to a minimum input power of 100W. All states require that the product be listed as part of the E3 pool pump labelling scheme in order to be eligible – this requirement should be retained. Each state references their own appropriate safety requirements – REES should continue to reference SA safety requirements.

R 302
Victoria and South Australia specify a minimum of 3 stars in order to qualify for energy savings calculations. Savings are referenced back to a 2 star baseline. Until better data on the market average is available, these requirements should be retained. ACT mentions 3 stars and 6 stars to qualify, but reference the same baseline as Victoria and South Australia (2 stars). NSW provide credits from 5.5 stars (effectively the minimum qualification) and appear to use a very different base. NSW also restricts participants to replacement of a working pump, which is a different approach to the other states. On this basis, alignment with NSW does not appear possible in the short term. Pool pumps often operate during the day and they can contribute to peak loads during extreme weather events. Many are operated on time clocks at normal general domestic tariffs, so there is no price inventive to avoid system peaks. Given their significant input power and high degree of discretion about when they can operate, they are an ideal load for load control. In 2012, a standard that specifies a standard interface for a demand response control for pool pumps was released. AS/NZS 4755.3.2:2012 Demand response capabilities and supporting technologies for electrical products - Interaction of demand response enabling devices and electrical products - Operational instructions and connections for devices controlling swimming pool pump-units This standard effectively allows utilities to interrupt the operation of a pool pump during periods of extreme demand on the power system. While this is not strictly an energy saving measure, it does provide greater flexibility to system operators and security of supply to all end users if there was widespread implementation of these controls. Given their relatively rare use, they should not detract from the energy service provided. It is recommended that compliance with AS/NZS 4755.3.2:2012 should be required after a consultation with key stakeholders and after a suitable transition (sunrise) period.
Potential Compliance Issues The main concern in relation to compliance under the proposed specification is the voluntary nature of the DI labelling scheme. Providing this scheme either continues in its current form or is made into a mandatory program, then adherence to the minimum star requirements should be relatively simple. It is unclear how much verification of the claims made under the scheme is undertaken at present. Given that the scheme is used by all states, some collaborative verification and enforcement work may be warranted.

R 303
Installation of a High Efficiency Pool Pumps Activity No.
APP3
1. Activity Specific Definitions
Pool pump means a circulating pump for use with a residential pool or spa. Rated flow rate (Q) means the maximum rated flow rated in litres per minute that the pump can achieve under AS5102
2. Activity Description (Summary)
Installation of a high efficiency pool pump
3. Activity Eligibility Requirements
Any residential household in South Australia where the installed product requirements and minimum installation requirements can be met.
4. Installed Product Requirements
1. The pool pump shall be listed as part of the E3 pool pump labelling scheme and shall achieve a star rating of not less than 3 stars.
2. The pool pumps shall be tested and rated in accordance with AS5102.1 and AS5012.2 3. The pool pump shall operate on single phase mains power. 4. The pool pump shall have an input rating of not less than 100W and not more than 1500W. 5. As a proclaimed product in South Australia, any pool pump shall meet the safety requirements of
AS/NZS 60335.2.41:2004 6. From 1 January 2016, pool pumps shall be fitted with demand response controllers in accordance
with AS/NZS 4755.3.2:2012 Demand response capabilities and supporting technologies for electrical products - Interaction of demand response enabling devices and electrical products - Operational instructions and connections for devices controlling swimming pool pump-units
5. Minimum Installation Requirements
If the installation requires an electrical compliance certificate, one shall be provided and lodged with the Office of Technical Regulator.
6. Activity default energy savings The total Gigajoule energy (GJ) saved attributed to this activity per appliance purchased is:
Savings GJ = ]1622[00009.0 CECQ
Q is the rated flow rated in litres per minute (measured as per AS5102) 1622 is the 2 star CEC under the energy labelling scheme AS5102 in kWh/year CEC is the comparative energy consumption of the product under the voluntary labelling scheme in kWh/year Default savings are in GJ of electricity.
7. Guidance Notes (Informative only – not mandatory)
All reasonable endeavours should be used to recycle removed systems.

R 304
Aggregate Metered Baseline Method (AMB)
Technical Assessment – AMB
AMB Aggregate Metered Baseline Methodology (new)
REES Activity Reference: AMB (FLEX1) REES Calculation method title Aggregate Metered Baseline Methodology Target product: Behaviour change and other low cost activities not suitable for deemed default savings factors Savings: Calculated ex-post based on measured changes in energy consumption Pre-conditions: None

R 305
Current REES Activity Description At present all the REES code prescribes that calculation of energy savings for all activities are based on deemed default savings factors. This review recommends introducing a broader range of calculation methods into REES. This is required to deliver the REES Review recommendations to allow behaviour change type activities, and to bring REES in line with international best practice. Proposed REES Activity Description It is proposed that REES include a new calculation method to allow recognition of savings from behaviour change and a range of other activities that are not suitable for default savings factors. As discussed in section Error! Reference source not found., this report ecommends adapting the NSW ESS Aggregated Metered Baseline method to the REES policy and regulatory framework. The AMB method can be used for any activity, provided that it is an energy savings activity, consistent with the scheme rules and principles. However, it is particularly designed for energy savings activities where:
the energy savings are small on a site by site basis; and/or
the energy savings can vary greatly from site to site; and/or
there are a large to very large number of potential participants;
there is insufficient evidence that the energy saving activity will not be reversed.
Examples of the types of activities that may be suitable for the AMB method include:
“how-to” websites
direct mail campaigns
community engagement
household assessments
energy bill benchmarking
innovative pricing structures
installing in-home displays. In simple terms, AMB works as follows. A project proponent must first select a group of households (a “population”). Then the population must be divided in a non-biased way (e.g. random) into a “control group” and a “treatment group”60. Without intervention, two groups will be statistically equivalent and have the same mean energy consumption over time. The proponent then provides the treatment group access to the activity (or a range of approved activities). If these activities save energy, the treatment group’s average energy consumption will be lower than the control group. The aggregate savings for the treatment will be awarded as energy savings credits. In practice, AMB has three different sub-options for statistically determining the difference in energy consumption between the two groups. It also
60
The proponent must have the right to access these customers’ energy data. Therefore project proponents would most likely be an energy retailer of distribution network service provider.
R 306
has rules to prevent gaming and double counting of savings with activities already funded by the scheme. The recommended calculation steps for each sub-method, and overarching REES code requirements for all sub-methods are set out below. Scheme Review – Other jurisdictions The NSW ESS is the only retailer energy efficiency obligation scheme in Australia that currently includes any non-default savings factor calculation methodologies. As of 1 July 2014 the ESS rule included the AMB method. NSW AMB is for electricity only, due to the single fuel nature of the Scheme. However, the NSW Government has consulted on expanding the ESS, and its methodologies, to include natural gas.61 The Australian Government is currently developing an adapted version of the NSW AMB method to measure abatement across multiple fuels in the proposed Emissions Reduction Fund. Moreover, randomised control trial (RCT) methods like AMB are commonly used for determining energy savings in many jurisdictions in the United State of America. A review of these energy savings calculation methodologies for behaviour change programs in America identified this type of RCT method as best practice.62
61
NSW Government (February, 2014) Review of the Energy Savings Scheme Issues Paper 62
State and Local Energy Efficiency Action Network (May 2012) Evaluation, Measurement, and Verification (EM&V) of Residential Behavior-Based Energy Efficiency Programs: Issues and Recommendations

R 307
Table 138: State Scheme Summary – Comparative table for Aggregate Metered Baseline Method (AMB)
Parameter SA – REES Scheme (current)
VIC – VEET Scheme * NSW – ESS Scheme ACT – EEIS Scheme SA – REES Scheme (proposed)
Working Title N/A N/A Aggregate Metered Baseline Method
N/A Aggregate Metered Baseline Method
Activity Reference Number
N/A N/A Part 8.9 N/A AMB (FLEX1)
Sectors N/A N/A Any (best suited to residential and small business)
N/A Any (best suited to residential and small business)
Required pre-condition N/A N/A Metering arrangements and allocation to control and treatment group to occur without bias prior to commencement of activity
N/A Metering arrangements and allocation to control and treatment group to occur without bias prior to commencement of activity
Target Energy Service N/A N/A Any N/A Any
Replacement options N/A N/A Any N/A Any
Performance requirements
N/A N/A Consistent with existing regulatory requirements for the activity/activities in question
N/A Consistent with existing regulatory requirements for the activity/activities in question
Deemed savings per replacement
N/A N/A N/A Savings recognised ex-post based on ongoing measurement
N/A N/A Savings recognised ex-post based on ongoing measurement
Replacement product warranty requirements
N/A N/A N/A N/A N/A
Referenced Standards N/A N/A N/A N/A N/A

R 308
Assessment Against Scheme Principles This activity aligns with all major policy objectives. It is well suited to low cost household and business energy savings programs that would be highly effective but are otherwise unsuited to default savings factor methods. This makes the methodology particularly well suited for low income households.
Table 139: Alignment with Policy Objectives for AMB
Policy Objective
Reduces household and/or business energy use
Provides a focus on low income households
Associated Objectives
Provides greenhouse gas emission benefits
Provides energy cost benefits
The following table provides an assessment of the activity against the new principles proposed for REES code. Table 140: Activity Alignment with REES General Principles - AMB
Principle Assessment
1. Provides evidence based energy savings
Savings are calculated by directly measuring the savings for every household using actual energy meter data and comparing it against a baseline of statistically equivalent houses. Suitable for use in other sectors.
2. Energy savings are additional to base case (BAU) and minimises free riders
Free riding is virtually eliminated. Savings that would have occurred without the REES funded activity are statistically as likely to occur in both the treatment and control groups. Since savings are measured as the difference between the two groups, these BAU savings do not show up as savings.
3. Reward best practice in relation to product performance
By awarding credits based on actual measured savings, AMB provides a strong incentive to obligated retailers to innovate and maximise savings for every house or business, rather than rely on averages.
4. Provides a means for ensuring quality assurance and participant satisfaction
The method only recognises actual savings, based on ongoing measurement. This provides a very strong incentive to ensure persistence, customer satisfaction and quality. If products fail or are uninstalled, savings cease.
5. Credible approach for the calculation of energy savings
AMB is one of the most robust methods for calculating savings under retailer obligation schemes.
6. Provides scope for objective, cost effective and practical auditing
The AMB statistical calculations and specifications are objectively auditable by trained statisticians. This is cost effective because the method is designed to be used for thousands or tens of thousands of customers at a time.
7. Good practice Specifications require good practice.
8. Harmonisation (as far as practical)
The proposed method has been adapted from the NSW scheme with only minimal changes required to suit administrative infrastructure and the duel fuel framework of REES.
9. Safety and minimising overall risk
Specifications require compliance with relevant safety standards.

R 309
Aggregate Metered Baseline Method (AMB) Activity No.
FLEX1
Draft Activity Specification
1 Proposed AMB Energy Savings Calculation Method
Energy Savings for eligible activities specified in Clause 0 shall be calculated using the method specified in this Clause. Energy savings shall then be applied in accordance the activity specification set out in Clause 2.
1.1 Calculation of Energy Savings under the Aggregated Metered Baseline method
Step (1) – For each Population, adjust the Control Group and the Treatment Group for Attrition at the end of each Implementation Period, in accordance with clause 2.2. The number of Sites in the Treatment and Control Groups will be designated NT and NC respectively. Step (2) – Calculate the Observed Energy Savings, , in GJ final energy consumption, over the Implementation Period using one of the following methods:
(a) Option 1 (Time-Aggregated Energy Consumption During the Implementation Period) as detailed in clause 1.2; or
(b) Option 2 (Time-Aggregated Energy Consumption During the Implementation and Pre-Implementation Periods - Difference in Differences) as detailed in clause 1.3; or
(c) Option 3 (Regression Modelling) as detailed in clause 1.4.
Step (3) – Calculate Counted Energy Savings, , over the Implementation Period using the Method detailed in clause 1.5.
For Sites with Measured Energy Consumption data for part of an Implementation Period due to Attrition, the date of Attrition is considered the last date of the Implementation Period for those given Sites.
Step (4) - Calculate final Energy Savings in GJ of final energy consumption, by subtracting the effect of Counted Energy Savings from the Observed Energy Savings, ensuring the result is non-negative:
( )
1.2 Step 2 Option 1 Calculation of Observed Energy Savings from Time-Aggregated Energy Consumption During the Implementation Period
Step (1) - Calculate the mean daily energy use of the Treatment Group ( ) over the Implementation Period:

R 310
where:
s indexes over Sites in the Treatment Group
Es is the Measured Energy Consumption for Site (s) in the Treatment Group over the Implementation Period, measured in accordance with clause 2.3; and
is number of days of Measured Energy Consumption at Site (s) in the Treatment Group over the Implementation Period
Step (2) - Calculate the mean daily energy use of the Control Group ( ) over the Implementation Period:
where:
s indexes over Sites in the Control Group
is the Measured Energy Consumption for Site (s) in the Control Group over the Implementation Period, measured in accordance with clause 2.3; and
is number of days of Measured Energy Consumption at Site (s) in the Control Group over the Implementation Period
Step (3) - Using the Treatment Group measurements, the Control Group measurements and the standard error for the Control Group mean, perform the following hypothesis test:
Calculate ( ) ( √
)⁄
Reject (and accept ) if ( )
where:
sd is the standard deviation calculated on the Control Group
( ) is the value from standard T tables with ( ) degrees of freedom. For
degrees of freedom exceeding 2400 use the value of 1.6449. Note that 0.95 values of the T statistic are from the upper 5% points of the distribution;
is an optional finite population correction for estimating the Population mean from the Control Group, where:
o if used ( ) ( ); or o if not used ; and
is an optional finite population correction for estimating the Population mean from the Treatment Group, where:
o if used ( ) ( ); or o if not used , and

R 311
N is the number of sites in the Population.
If able to reject , proceed to step (4). Otherwise, is taken to be less than or equal to and is taken to be zero.
Step (4) - Calculate the Observed Energy Savings, , in GJ final energy consumption, over the Implementation Period:
where:
s indexes over Sites in the Treatment Group; and
is number of days of Measured Energy Consumption at Site (s) in the Treatment Group over the Implementation Period
1.3 Step 2 Option 2 - Calculation of Observed Energy Savings from Time-Aggregated Energy Consumption During the Implementation and Pre-Implementation Periods – Difference in Differences
Step (1) - Calculate the change in mean daily energy use ( ) between the Implementation Period and the Pre-Implementation Period for each Site in the Population:
where:
is the Measured Energy Consumption for each Site (s) over the Implementation
Period, measured in accordance with clause 2.3;
is the Measured Energy Consumption at each Site (s) over the Pre-
Implementation Period, measured in accordance with clause 2.3;
is the number of days of Measured Energy Consumption at Site (s) over the
Implementation Period; and
is the number of days of Measured Energy Consumption across Site (s) over
the Pre-Implementation Period and must cover the same period of time in a previous year as .
Step (2) - Calculate the mean change in energy use of the Treatment Group ( ) between the Implementation Period and the Pre-Implementation Period:
where:
s indexes over Sites in the Treatment Group; and
is number of Sites in the Treatment Group.

R 312
Step (3) - Calculate the mean change in energy use of the Control Group ( ) between the Implementation Period and the Pre-Implementation Period as follows:
where:
s indexes over Sites in the Control Group; and
is number of Sites in the Control Group
Step (4) - Using the Treatment Group measurements, the Control Group measurements and the standard error for the Control Group mean difference, perform the following hypothesis test:
Calculate ( ) ( √
)⁄
Reject (and accept ) if ( )
where:
sd is the standard deviation calculated on the change in daily energy consumption between the Implementation Period and the Pre-Implementation Period for each Site in the Control Group;
( ) is the value from standard T tables with ( ) degrees of freedom. For
degrees of freedom exceeding 2400 use the value of 1.6449. Note that 0.95 values of the T statistic are from the upper 5% points of the distribution;
is an optional finite population correction for estimating the Population mean from the Control Group, where:
o if used ( ) ( ); or o if not used ; and
is an optional finite population correction for estimating the Population mean from the Treatment Group, where:
o if used ( ) ( ); or
o if not used , and
N is the number of sites in the Population.
If able to reject , proceed to step (5). Otherwise, is taken to be less than or equal to and is taken to be zero
Step (5) – Calculate the Observed Energy Savings, , in GJ final energy consumption, over the Implementation Period:
R 313
where:
s indexes over Sites in the Treatment Group; and
is the number of days of Measured Energy Consumption at Site (s) in the Treatment Group over the Implementation Period.
1.4 Step 2 Option 3 - Calculation of Observed Energy Savings from Regression Modelling
Step (1) - Calculate the mean daily energy use ( ) for each Site in the Population for
the Implementation Period:
⁄
where:
is the Measured Energy Consumption for Site (s) over the Implementation
Period, measured in accordance with clause 2.3; and
is the number of days of Measured Energy Consumption at Site (s) over the
Implementation Period
Step (2) - Calculate the mean daily energy use ( ) for each Site in the Population for
the Pre-Implementation Period:
⁄
where:
is the Measured Energy Consumption for each Site (s) over the Pre-
Implementation Period, measured in accordance with clause 2.3; and
is the number of days of Measured Energy Consumption at Site (s) over the
Pre-Implementation Period.
Step (3) - Create the evaluation data set consisting of one observation for each Site in the
Population containing , , and other appropriate explanatory variables, where:
is a variable taking the value 1 if a Site (s) is in the Treatment Group and 0 if it is in the Control Group; and
is the vector of other appropriate explanatory variables.
Step (3B) – For cases where there are Sites with Measured Energy Consumption data for part of an Implementation Period due to Attrition, create another variable , where:
is a variable taking the value 1 if the Site (s) is still in the Treatment Group
during time period m and 0 otherwise. m = 1 … NTP; and
NTP is the number of non-overlapping and exhaustive time periods for the implementation.
The time periods are to be allocated so that each time period has (as close as is

R 314
possible) the same number of Sites subject to Attrition during that period.
Step (4) - Estimate the average treatment effect per day by estimating the following
regression via Weighted Least Squares (WLS) and weighting by Ds,i:
where:
is the intercept;
is the treatment effect;
is the impact of Pre-Implementation Period energy consumption;
accounts for time period (m) variation;
is the effect of the kth other explanatory variable; and
is the error term.
Step (5) – Using the estimated treatment effect (denoted as ) and its standard error
perform the following hypothesis test:
Calculate
Reject (and accept ) if ( )
where:
is the standard error of ; and
T(p=0.05) is the value from the standard T table with ( ) degrees of
freedom. For degrees of freedom exceeding 2400 use the value of . Note that 0.05 values of the T statistic are from the lower 5% points of the distribution.
A negative value for indicates a reduction in energy usage. Therefore, if able to reject H0,
proceed to step (6). Otherwise, is taken to be non-negative and is taken to be
zero.
Step (6) – Calculate the Observed Energy Savings, , in GJ final energy
consumption, over the Implementation Period:
where:
s indexes over Sites in the Treatment Group; and
is the number of days of Measured Energy Consumption at Site (s) in the
Treatment Group over the Implementation Period.

R 315
1.5 Estimation of Counted Energy Savings
Step (1) – Estimate the Lifetime Energy Savings, , from each Other Activity (a)
implemented in each Site (s) in the Population, within the Implementation Period.
Where:
Other Activity (a) means any energy savings activity offered to the treatment group for which REES credits are claimed under another method by the Obligated Retailer in accordance with the provisions of clause 2.2.1(j).
Step (2) – Calculate the Energy Savings, , for each Site s due to each Other Activity a
during the Implementation Period:
(
)
where:
in years, is the Lifetime of the Energy Savings for each Other Activity (a); and
in years, is the length of time of the Implementation Period that overlaps with the Lifetime of the Energy Savings for each Other Activity (a).
If the Other Activity (a) had one or more Energy Savings calculated using the Metered Baseline Method, then the Lifetime of the Energy Savings is the length of the Measurement Period of that calculation.
The calculation of the duration of overlap must take account of Attrition of Sites.
Step (3) - Calculate the average Energy Savings, and
, due to all Other Activities (a) for all Sites in the Treatment Group and
Control Group respectively, over the Implementation Period:
and
where:
The summation is over all Sites (s) in the Treatment Group (for )
and Control Group (for ), respectively, and all Other Activities that
overlap with the Implementation Period; and
The and are the number of Sites in the Treatment Group and Control Group respectively for Implementation Period.
Step (4) - Calculate the Counted Energy Savings, , from Other Activities due to participation in the program:

R 316
( )
Step (5) – Ensure the Counted Energy Savings, , are non-negative:
( )
2 Proposed AMB Method Specification Energy Savings for eligible activities shall be calculated using the method specified in Clause 1. Energy savings shall then be applied in accordance with the activity specification set out in this Clause.
2.1 Activities for which savings can be calculated using this method
2.1.1 Energy savings can be determined for Activity or Activities aimed at reducing end-use energy consumption, which meet the following conditions:
(a) Activity or Activities for which energy savings are to be calculated using this method, known as the Treatment, are to be offered exclusively to sites in a Treatment Group.
(b) The Treatment cannot include activities that reduce measured energy use without reducing end-use energy consumption, including but not limited to:
i. Installation of solar PV;
ii. Changes in metering arrangements;
iii. Load shifting that does not result in net end use energy savings;
iv. Fuel switching that does not result in net end use energy savings (e.g. from natural gas to LPG); and
(c) Fuel switching that does reduce net end use energy but does not provide associated energy cost reductions and/or greenhouse gas emission benefits.
2.2 Selection and management of Sites where activities are offered
2.2.1 A number of Sites must be identified and assigned to a Population, and every Site in that Population must be allocated to either a Treatment Group or a Control Group prior to the Implementation Date. Additionally:
(a) a Site may choose to join the Population, but once in the Population, must be allocated to the Treatment Group or the Control Group using an Unbiased Selection method;
(b) An Unbiased Selection Method is any method in which each site has an equal chance of being allocated to either the treatment or control group, including but not limed to random selection;
(c) persons at Sites must not be informed explicitly that they have been allocated to the Treatment Group or the Control Group;
(d) once a Site has been allocated to the Treatment Group and the Implementation Date has occurred, energy customers at that Site may be

R 317
offered a choice as to whether they wish to receive the goods and services component of the Treatment;
(e) if a Site chooses not to receive the goods and services component of the Treatment, that Site must be retained in the Treatment Group for measurement purposes, except where clauses 2.2.1 (g) and 2.2.1 (h) apply;
(f) the Population should not be targeted with the offer of goods and services aimed at increasing energy use with the intent of creating a greater difference in Measured Energy Consumption between the Control Group and Treatment Group;
(g) a Site must be removed from the Population, and hence Treatment Group or Control Group, if no Measured Energy Consumption data are available for that Site during the Implementation Period;
(h) all Sites with Measured Energy Consumption data for only part of an Implementation Period due to Attrition, must be:
(i) removed from the Population; or
(ii) included in the Population until the last date Measured Energy Consumption data are available for a given Site; and
(i) if data for a Pre-Implementation Period are used, the Obliged Retailer must specify prior to the Implementation Date a period for which the data are available for the total Population.
(j) the treatment group may be offered activities for which credits are claimed under another REES method, only if:
(i) Such activities are declared to the Commission; and
(ii) The annualised savings from these activities are excluded from savings determined under this method, in accordance with calculation step 3.
2.3 Measured Energy Consumption
2.3.1 Measurement Energy Consumption data for electricity consumption means the metered amount of electricity used by a Site:
(a) as determined by the metering data held by the Electricity Retailer or Network Service Provider for that Site, pro-rated across the period, as measured and estimated in accordance with the provisions of the National Energy Retail Rules under the National Energy Retail Law, and in accordance with the provisions of the Electricity (General) Regulations 2012 (SA); or
(b) from a metering arrangement compliant with the accuracy requirements of National Measurement Institute document M6 (Electricity Meters), or another metering benchmark accepted by the Commission, provided that:
(i) all metering devices are installed without bias as to whether that Site is in the Treatment Group or Control Group, and by parties who have no knowledge of whether each Site is part of the Treatment Group or Control Group; and
(ii) the reading of metering devices and checking, measurement, estimation and pro-rating of data is done without bias as to whether that Site is in the Treatment Group or Control Group, and by parties

R 318
who have no knowledge of whether each Site is part of the Treatment Group or Control Group.
2.3.2 Measurement Energy Consumption data for onsite natural gas consumption means the metered amount of gas used by a Site:
(a) as determined by the metering data held by the Energy Retailer or Network for that Site, pro-rated across the period, as measured and estimated in accordance with the provisions of the National Energy Retail Rules under the National Energy Retail Law, and in accordance with the provisions of Gas Regulations 2012 (SA); or
(b) from a metering arrangement compliant with the accuracy requirements of National Measurement Institute as set out in document R137 (Gas Meters) or another metering benchmark accepted by the Commission provided that:
(i) all metering devices are installed without bias as to whether that Site is in the Treatment Group or Control Group, and by parties who have no knowledge of whether each Site is part of the Treatment Group or Control Group; and
(ii) the reading of metering devices and checking, measurement, estimation and pro-rating of data is done without bias as to whether that Site is in the Treatment Group or Control Group, and by parties who have no knowledge of whether each Site is part of the Treatment Group or Control Group.
2.3.3 If a Treatment promotes (implicitly or explicitly) switching from electricity to gas or gas to electricity at Sites, then Measured Energy Consumption data must include both electricity and natural gas for those sites for the Implementation Period.
2.3.4 For the purposes of calculating Energy Savings, the Measured Electricity Consumption for a given Population must be recorded over one or more Measurement Periods, where:
(a) Implementation Periods and Pre-Implementation Periods are both Measurement Periods;
(b) the Implementation Period and the Pre-Implementation Period do not have to be immediately sequential in time;
(c) Measurement Periods must not overlap; and
(d) each Implementation Period must be at least 3 months and no more than 15 months in length.
2.4 General Requirements
2.4.1 The Obliged Retailer can only modify the methods for subsequent Implementation Periods.
2.4.2 The Implementation Date is the start date of the Implementation Period.
2.4.3 The activity should, wherever reasonable, offer options to use good practice such as recycling and compliance with best practice installation guidelines

R 319
2.4.4 Activities should be designed and implemented in a way that minimises risks to service providers and participants, including but not limited to:
(a) Any equipment offered or installed must comply with appropriate quality and safety standards; and
(b) Any installations must be conducted in accordance with relevant installation standards, guidelines and/or manufacturer’s instructions.
2.5 Record Keeping
2.5.1 The records that must be kept of the method, data and assumptions used to calculate Energy Savings must include:
(a) the Addresses of the Sites in the Population and whether they are allocated to the Treatment Group or the Control Group;
(b) evidence that Sites were assigned to the Population and were allocated to the Treatment Group and Control Group in accordance with clause 2.2.1;
(c) evidence that energy consumption was measured in accordance with clause 2.3;
(d) details of the Treatment offered to the Treatment Group, and evidence that is a compliant with clause 2.1;
(e) Details of explanatory variables; including any interactions between them
have been documented (if Calculation method 1.4 regression modelling
method is used);
(f) Evidence that Measurement Periods, including Implementation Periods
and the Pre-Implementation Periods (if applicable) are compliant with
these specifications;
(g) information on Sites removed from the Population in accordance with clauses 2.2.1 (g) and 2.2.1 (h), including reasoning for each Site’s removal;
(h) documentation of reproducible steps and log files for the calculations performed; and
(i) any additional requirements as may be Published by the Commission from time to time.
2.5.2 For the purposes of Schedule 8 of the Code, Energy Savings for each Implementation are taken to have occurred on the last date of that Implementation Period.
2.5.3 Activity records under Schedule 5 of the code are not required for this method.
2.5.4 Where required, the Energy Savings for the Implementation will be the sum of estimated Energy Savings for all Sites in a Treatment Group for each Implementation Period.
Potential Compliance Issues The calculation steps and specifications are designed to prevent gaming and ensure a high level of statistical rigour in the measurement of savings. The compliance risks

R 320
for activities for which savings are calculated using this method are incorrect calculation or non-compliance with specifications. These risks can be mitigated by requiring independent audit statements to accompany obliged retailers reports on savings calculated using AMB. Provided that auditors are required to engage accredited statisticians, these risks can be effectively mitigated.

R 321
Appendix 3 - Thermal Modelling Method
Appendix 3
Thermal Modelling Method

R 322
Overview
In this study the method for modelling household energy use (with and without the particular building shell activity applied) is based on that used in the study Energy Use in the Australian Residential Sector 1986-2020 (EES 2008). A schematic of the model is shown in Figure 38. This is believed to be the most comprehensive “bottom up” model of residential energy use available and has been verified against top down (BREE) data.
Figure 38: Schematic of EES End Use Model
The modelling consisted of taking a representative sample of dwellings in terms of type, construction and features and modelling those dwellings using thermal performance simulation software (AccuRate). For the purposes of making estimates of energy impacts the default assumptions within the AccuRate software (i.e. in rating mode) relating to occupancy of the dwelling and the operation of thermostats within the dwelling were then varied to more closely match reality (this process is detailed later in this Appendix).
APPLIANCE
ATTRIBUTES BY
YEAR
APPLIANCE
OWNERSHIP BY
STATE AND YEAR
END USE STOCK
MODEL
USAGE
PARAMETERS
APPLIANCE
MODULE
COOKING
MODULE
WATER
HEATER
MODULE
SPACE HEAT
AND COOL
MODULE
HOUSING
STOCK MODEL
THERMAL
SIMULATION
MODEL
TOTAL ENERGY
BY
YEAR, STATE, FUEL TYPE AND
END USE

R 323
The dwellings were modelled as two different cases; a base case without the energy savings measure and an improved case with the energy savings measure.
Modelling was undertaken in a range of representative climates zones (not all
relevant to SA) and the results fed into the housing stock model used in the study
Energy Use in the Australian Residential Sector 1986-2020 (EES 2008). Further
details regarding the methodology can be found in that report.
Stock Model of Dwellings
Overview
In order that estimates of space conditioning load potential can be made, thermal performance simulation modelling is required to be undertaken on a representative sample of the residential building stock. It is therefore necessary to define the stock in terms of the key parameters that form the inputs into the thermal performance modelling tool used in this study ie AccuRate. The major stock related inputs required for AccuRate that affect performance are as follows:
Spatial details - floor plan data, ceiling heights, floor areas etc.
Orientation.
Basic construction types - floor, wall and roof construction combinations.
Insulation.
Glazing - area, type, shading.
Level of infiltration (air leakage). Clearly there would be, within the existing stock, an almost infinite number of variations and combinations of the above factors. It was therefore necessary to select a sample of combinations and variations that could adequately represent the actual range of combinations and variations known to be in existence. In carrying out this process particular regard was given to those factors that were likely to significantly affect thermal performance.
Stock Numbers and Characteristics
The housing stock model used in this study is based upon that developed by EES for their study entitled Energy Use in the Australian Residential Sector 1986-2020 (EES 2008). This model draws upon available data to establish a profile of housing in each Australian state and territory over a period of 20 years with projections into the future. The available data allowed dissagregation of the stock as follows:
By Housing type (Detached, Semi Detached, Low rise flats, High rise flats).
By Wall construction (Lightweight, Brick Veneer and Heavyweight).
By floor type (suspended timber or concrete).
By insulation (none, ceiling only and both ceiling and wall). The housing stock model was constructed in 3 steps. Firstly a “base year” data set was established based on ABS survey data. This base year 1986, coincided with the last major survey of housing characteristics undertaken by the ABS. From the base year (end of financial year 1985-86) to end of financial year 2004-05 annual ABS data on new building activity was used in conjunction with many secondary data sources to establish stock levels in each of the intervening years. Finally, projections

R 324
of housing stock numbers and profile were compiled until 2020 based on a “business as usual” case. The housing stock model used is summarised in Figure 39. The actual housing stock model is relatively complex. For full details of the structure of the model refer to the study, Energy Use in the Australian Residential Sector 1986-2020 – section 7 (EES 2008). The proportions of each dwelling type and construction format on a State-by-State basis were derived from the data files developed in the study Energy Use in the Australian Residential Sector 1986-2020 (EES 2008) In line with the method used in the study, Energy Use in the Australian Residential Sector 1986-2020 – section 7 (EES 2008), all dwellings modelled were modelled facing each of the four ordinal orientations and results were then averaged across those orientations.
Figure 39: Schematic of Housing Stock Model
Climates Modelled
South Australia includes a total of 8 NatHERS climate zones (see Table 141) of which only 4 are of any significance in terms of the proportion of the States households they represent. These are:
16 Adelaide
Stock Number
1986
(ABS)
Stock Area
1986
(NEIR)
New Stock
Entering
Population
Retirements
(Demolition) Of
Existing Stock
Conversion
(Renovation)
Of Existing
Stock
Adjustment
(eg Vacancy)
Augmentation
of Floor Area
(Extensions)
Time Series
Stock Numbers
Disaggregated
By
*State
*Type
*Construction
Time Series
Stock Area
Disaggregated
By
*State
*Type
*Construction

R 325
27 Mildura
59 Mt Lofty
61 Mt Gambier Table 141: Percentage of Households by SA climate Zones (EES 2008)
AccuRate Climate Zone Proportion of South Australian Households Estimated to be located
within the climate zone
8-Moree MO 0.13%
16-Adelaide (Kent Town) 80.69%
27-Mildura AMO 4.73%
43-Oodnadatta Airport 0.24%
45-Woomera Aerodrome 1.43%
53-Ceduna 1.75%
59-Mount Lofty 6.10%
61-Mount Gambier AMO 4.92%
South Australia is also divided into 3 BCA climate zones:
BCA Zone 4
BCA Zone 5
BCA Zone 6 As noted in the main report, practically all residences in SA are located in BCA climate zones 5 and 6. Climate zone 4 represents the hotter north and west of the state, which is largely unpopulated (approximately 0.2% of the population only). There is no BCA climate zone 7 in the state, but in reality the areas of Mt Gambier and particularly Mt Lofty, which account for approximately 11% of the state, can be considered to match the climatic profile of BCA climate zone 7 (for comparison BCA climate zone 7 includes locations such as Canberra in the ACT and Ballarat in Victoria). In terms of population, there are only two main climate zones in SA:
A warm temperate climate (BCA climate zone 5) such as Adelaide and coastal areas to the west of Adelaide and;
A mild temperate climate (BCA climate zone 6) such as the South East region the Adelaide Hills and Kangaroo Island.
For simplicity and because climate zone 4 is so insignificant in terms of population in SA this zone is proposed to be integrated with BCA climate zone 5. Generally63, in the modelling process undertaken for this study NatHERS climate zone 16 (highest concentration of population) has been used as representative of
63
In some cases due to time limitations pre-existing thermal performance simulation modelling based on alternative NatHERS climates zones similar to those nominated for this study were used. For example, in some cases NatHERS climate zone 24 was used as a proxy for NatHERS climate zone 61 (Mt Gambier). Climate zone 24 provides slightly higher

R 326
BCA climate zone 5 (as well as for BCA zone 4 as noted above) and NatHERS climate zone 61 (Mount Gambier) has been used as representative of BCA climate zone 5. The other contender to represent climate Zone 6 was Mt Lofty (NatHERS zone 59) however this climate zone appears to be at the extreme end of the spectrum in terms of heating load whereas Mt Gambier appears to be more representative of the states areas of mild temperate climate
Modelling Software
Overview
The AccuRate building assessment software used in this study was developed by the CSIRO and is the successor to the first generation Nationwide House Energy Rating (NatHERS) software on which several key building thermal performance assessment tools in Australia were based. AccuRate is an enhanced version of the NatHERS software. It is a rating tool that assigns a star rating to a residential building (a detached or semi-detached house, unit, townhouse, or apartment) based on its calculated annual heating and cooling energy requirements (not energy consumption, i.e. the efficiency of heating and cooling equipment is not taken into account). Several assumptions in the form of AccuRate program settings also had to be made for the purposes of undertaking thermal simulation modelling. These included such things as ceiling heights, glazing systems, window coverings, overshadowing, natural and mechanical ventilation, levels of building sealing and so on. The settings for these parameters in this study are the same as those adopted in the study Energy Use in the Australian Residential Sector 1986-2020 (EES 2008) - see chapter 8.8 To make estimates of actual energy use (as distinct from determining a star rating in rating mode), the default assumptions within the AccuRate software (i.e. in rating mode) relating to occupancy of the dwelling and the operation of thermostats within the dwelling were varied to more closely match reality. Settings as adopted in AccuRate in rating mode whilst adequate for comparative rating purposes were not considered adequate for the purposes of estimating actual space heating and cooling loads expected to prevail in an average household. These adjustments in relation to user behaviour were undertaken on the basis of research undertaken in the study, Energy Use in the Australian Residential Sector 1986-2020 (EES 2008) and primarily affect occupancy and thermostat settings and are detailed below in the following two subsections
Adjustments for Occupancy
The default settings for occupancy (ie hours of occupation) used in AccuRate assume that the dwelling is to be occupied 24 hours a day (although not all zones within the dwelling are assumed to be continuously occupied e.g. Living spaces 7am until Midnight, bedroom spaces 4pm until 9am). These default settings are reflected in the stringency levels for the star bands ie the target load for a particular star rating assumes that this 24 hour occupancy profile will prevail.
heating loads compared to climate zone 61 but lower than climate zone 59 (Mt Lofty). Naturally, the space conditioning profiles applied to the heating and cooling loads derived for climate zone 24 were those applicable to South Australia and not those applicable to climate zone 24 (such as the ACT).

R 327
In the study Energy Use in the Australian Residential Sector 1986-2020 (EES 2008) – see Figure 40 it was found that householders will occupy their dwellings somewhat less than the hours of occupancy assumed in the default settings embodied in AccuRate. The impact of this lower occupancy will be to reduce the expected space conditioning load and thereby any savings that may be derived from the application of an improvement measure. More realistic occupancy settings were achieved by manipulating the scratch files in AccuRate to reflect the profile as described in Figure 40. Full details of the methodology can be found in section 8.4 of the study Energy Use in the Australian Residential Sector 1986-2020 (EES 2008).
Figure 40: Residential Occupancy Profile – 1992 and 1997 (averaged) (EES 2008)
Adjustments for Thermostat Operation
The default settings for thermostat operation (i.e. at what temperature is it assumed that an occupant shall initiate and at what temperature shall they maintain their heating or cooling) used in AccuRate are detailed in the AccuRate user guide. These default settings are reflected in the stringency levels for the star bands i.e. the target load for a particular star rating assumes that householders will behave in accordance with those assumptions. For this study it has been assumed that the thermostat settings for heating operation are realistic and therefore valid. However, in terms of cooling operation it has been postulated on the basis of some survey evidence that householders, following initiation of cooling, will on average expect a higher level of comfort than that adopted as the default in AccuRate. This is particularly apparent in the warmer climates. The impact of this higher comfort standard in cooling mode will be to increase the expected space cooling load and thereby increase the abatement stemming from the application of an improvement measure such as those examined in this study. For this study an alternative cooling thermostat operation in line with that as detailed in section 8.6 of the study Energy Use in the Australian Residential Sector 1986-2020 (EES 2008) was used.

R 328
Space Conditioning Equipment Examined
Overview
An assessment of the benefits that accrue from the range of energy savings measures examined in this study is dependent to a significant degree upon the ownership and attributes of the stock of space conditioning equipment used by householders to meet their thermal comfort requirements. The space conditioning model used in this study is based on that used in the study Energy Use in the Australian Residential Sector 1986-2020 (EES 2008) – see section 6. Output from the AccuRate thermal performance model is in terms of potential heating and cooling loads. To determine actual estimated energy demand experienced by the householder, the potential space conditioning load was processed through a stock model of space conditioning equipment. That model covers both ownership and attributes of the stock of space conditioning equipment. This process is detailed graphically in Figure 38 and in more detail in section 6 of the study Energy Use in the
Australian Residential Sector 1986-2020 (EES 2008)64
. The effect of the space conditioning stock model is to constrain the space conditioning load predicted by AccuRate to more realistic levels.
For this study the following range of space conditioning equipment types were
included in the analysis:
1. Resistive electric heating 2. Room Reverse Cycle heating 3. Ducted Reverse Cycle heating 4. Room Gas heating 5. Ducted Gas heating 6. LPG Gas heating 7. Wood Closed Combustion heating 8. Wood Open Combustion heating 9. Room Reverse Cycle cooling 10. Room Cooling Only cooling 11. Ducted cooling 12. Evaporative cooling.
Note that the savings estimates in relation to LPG heating were aggregated with
those for the other (natural) gas heating technologies. LPG gas represents a very
small proportion of heater use in South Australia and its environmental impacts
(greenhouse gas intensity) is almost identical to that of Natural gas. The main
difference between the two types of gas is the significantly higher cost associated
with LPG gas. This means that if the cost of the fuel is to be accounted for in any
weighting process that might be applied when determining a default savings
factor for gas then that weighting should either be based on the cost of natural
gas alone (making it a slightly conservative estimate of financial benefit) or
alternatively the weighting should factor in the cost of both natural and LP gas
(weighted appropriately).
64
Noting that the original 2008 model has been updated with the latest ABS appliance survey data and the performance characteristics of air-conditioners have been updated to account for the latest (2011) MEPS requirements.

R 329
Space Conditioning Equipment ownership
Ownership levels for the various forms of space conditioning equipment in South
Australia was based on data derived from the study Energy Use in the Australian
Residential sector 1986-2020 (EES 2008) updated with the latest ABS data. The
ownership levels used are detailed in Table 142. Beyond 2020 the levels were
assumed to remain static at the 2020 levels
Table 142 Space conditioning Ownership SA (2014 – 2020)
End Use 2014 2015 2016 2017 2018 2019 2020
Heating
Mains Gas non-ducted 0.184 0.178 0.172 0.166 0.160 0.154 0.148
LPG Gas non-ducted 0.022 0.021 0.020 0.019 0.017 0.016 0.015
Mains Gas ducted 0.030 0.029 0.029 0.028 0.028 0.027 0.027
Resistive Electric 0.073 0.064 0.055 0.046 0.037 0.027 0.017
Reverse Cycle AC non-ducted 0.282 0.289 0.295 0.302 0.308 0.314 0.321
Reverse Cycle AC ducted 0.182 0.191 0.201 0.211 0.221 0.231 0.242
Wood Closed Combustion 0.140 0.142 0.143 0.144 0.146 0.147 0.149
Wood Open Fires 0.002 0.002 0.002 0.002 0.002 0.002 0.002
Cooling
Non ducted Reverse Cycle 0.369 0.372 0.374 0.377 0.380 0.383 0.385
Non ducted Cooling only 0.087 0.085 0.083 0.080 0.078 0.076 0.073
Ducted Cooling 0.227 0.230 0.233 0.236 0.239 0.242 0.244
Evaporative cooling 0.239 0.238 0.238 0.238 0.237 0.237 0.237
Space Conditioning equipment Performance
Efficiencies for the various forms of space conditioning equipment in South
Australia were based on data derived from the study Energy Use in the
Australian Residential sector 1986-2020 (EES 2008) updated with the latest data
relating to the impact of performance regulations introduced post 2008. The
efficiency levels used are detailed in Table 143. Beyond 2020 the levels were
assumed to remain static at the 2020 levels. In relation to ducted space
conditioners the cited values include for a duct efficiency of 70%.
Zoning Constraint
Zoning is the tendency of some householders to limit space conditioning to selected areas of their dwellings. This strategy limits the amount of energy required by the household for space conditioning compared to householders who choose to space condition their entire dwelling. In some cases, zoning occurs because the output of the relevant heating or cooling equipment is of insufficient capacity to heat or cool the whole dwelling. But many householders consciously limit active space conditioning to living areas (which is more typical in Australia than in more severe climates in North America or Europe, for example) with only limited heating or cooling in bedroom areas.

R 330
Table 143 Space conditioning Efficiency SA (2014 – 2020)
End Use 2014 2015 2016 2017 2018 2019 2020
Heating
Mains Gas non-ducted 76% 77% 77% 78% 79% 79% 80%
LPG Gas non-ducted 76% 77% 77% 78% 79% 79% 80%
Mains Gas ducted* 52% 52% 52% 52% 52% 52% 52%
Resistive Electric 100% 100% 100% 100% 100% 100% 100%
Reverse Cycle AC non-ducted 389% 391% 394% 396% 398% 400% 402%
Reverse Cycle AC ducted* 262% 262% 263% 264% 265% 265% 266%
Wood Closed Combustion 52% 52% 53% 53% 54% 54% 54%
Wood Open Fires 14% 14% 14% 14% 14% 14% 14%
Cooling
Non ducted Reverse Cycle 363% 365% 368% 370% 373% 375% 378%
Non ducted Cooling only 352% 354% 356% 358% 359% 361% 363%
Ducted Cooling* 236% 237% 238% 238% 239% 240% 240%
Evaporative cooling 1500% 1500% 1500% 1500% 1500% 1500% 1500%
* Ducted values include a discount for assumed duct losses (assumed duct efficiency = 70%)
The default settings in AccuRate limit space conditioning from 7am until midnight in living spaces and 4pm until 9am in bedroom spaces. This means that effectively these spaces are partially zoned by virtue of the fact that they are assumed to be unoccupied and therefore unconditioned for certain portions of the day (although in reality some householders may choose to condition unoccupied spaces). The issue of how occupancy limits space conditioning use is dealt with earlier in this section. This section deals with limitations on the areas of the dwelling that can be heated and or cooled if desired by the householder. In reality there is a very wide range of voluntary or imposed zoning regimes adopted by different householders, ranging from whole house heating and cooling to no heating or cooling at all. Primarily, zoning strategies are understood to be driven by the particular space conditioning technology installed by the householder. A householder with only a single room heater in their living room cannot choose to heat the entire house or for that matter cool any of their dwelling whereas a householder with a ducted reverse cycle air-conditioner can choose to heat or cool their entire dwelling (if the system is of sufficient capacity). For the purposes of this study it was assumed that each of the various space conditioning technologies known to be installed in Australian households (as noted above) will impose on average a specific “zoning factor” that will constrain the actual space heating and cooling energy consumption estimated by AccuRate under the standard zoning assumptions. The zoning factors as determined in the study Energy Use in the Australian Residential Sector 1986-2020 (EES 2008) were adopted for this study (see Table 144).
Ductwork - Base case assumption
The base case for heating applications was based on a study by Graham Palmer
from the School of Aerospace, Mechanical and Manufacturing Engineering RMIT
University entitled Field study on gas ducted heating systems in Victoria
(September 2008). This study surveyed the efficiency of installed ductwork in 10

R 331
different dwellings ranging from 9 to 33 years old. The results of that analysis are
plotted in Figure 41. From these results it can be seen that duct efficiencies can
vary considerably from over 80% to as low as 50% with a clear trend towards
declining efficiency with age of installation (in this analysis “efficiency” refers to
the % of heating or cooling output from the space conditioning unit that is actually
delivered to the internal spaces).
In this analysis it is assumed that replacements will be undertaken to ductwork
that is 15 or more years old (the shaded area in Figure 41). In this shaded area
the trend line ranges from 70% efficiency to just below 60% efficiency.
Table 144: Zoning Factors by Space Conditioning Technologies and State (EES 2008)
Equipment NSW VIC QLD SA WA TAS NT ACT
Resistive Heating 0.25 0.25 0.2 0.2 0.2 0.2 0.2 0.35
Reverse Cycle Room - Heating
0.3 0.3 0.3 0.3 0.3 0.3 0.3 0.35
Ducted heaters Reverse Cycle
0.7 0.7 0.7 0.7 0.7 0.7 0.7 0.7
Room Gas Heaters* 0.25 0.6 0.25 0.35 0.3 0.5 0.25 0.3
Ducted Gas Heaters*
0.6 0.8 0.6 0.7 0.65 0.7 0.6 0.65
LPG Gas Room Heaters
0.3 0.5 0.3 0.3 0.3 0.5 0.3 0.5
Wood Heaters Closed
0.9 0.9 0.9 0.9 0.9 0.9 0.9 0.9
Wood Heaters Open
0.3 0.3 0.3 0.3 0.3 0.3 0.3 0.3
Room Reverse Cycle – Cooling
0.3 0.3 0.3 0.3 0.3 0.3 0.25 0.3
Room Cooling Only 0.3 0.3 0.3 0.3 0.3 0.3 0.25 0.3
Central Ducted Cooling
0.7 0.7 0.7 0.7 0.7 0.7 0.7 0.7
Evaporative 0.9 0.9 0.9 0.9 0.9 0.9 0.9 0.9
*Note: Room gas is projected to rise to 0.4 in SA and 0.35 in WA by 2020 and Ducted Gas is
projected to rise to 0.8 in SA and 0.7 in WA by 2020
For the cooling mode efficiencies reference was made to a study undertaken by
the University of South Australia entitled Development of an Evaluation Process
for In Situ Measurement of the Impact of Ducting on Air Conditioning Systems
(UNSA 2012). That study found that the replacement of older ducting with new
R1.5 ducting resulted in an average reduction in energy consumption of 45%.
This value of 45% suggests an existing duct efficiency of approximately 50%65
which is on par with the lowest field measured values found in the Victorian
study. It should be noted that the Victorian study was focused on gas heating
which in Victoria is most often underfloor whereas the SA study was focused on
65
This was in fact confirmed with the author of the report

R 332
reverse cycle air-conditioning which is predominantly ducted through ceiling
spaces.
Taking all of these studies into account it was determined to adopt an assumed
pre-existing duct efficiency of 60% (ie 40% losses). Whilst this might be
considered conservative in view of the findings from the University of SA field
study (which suggests an average closer to 50%), this value was used such that
a default level of savings (ie at 30% reduction) equated to the expected
performance from a reasonably well specified and installed R1.5 duct system.
This assumption means that the predicted savings are slightly downgraded
(typically between 5 and 10%) in circumstances where the pre-existing duct
losses exceed 40% but this is considered to be reasonable as it represents a
conservative approach
Figure 41: Heating Duct Efficiency by Year of Installation (Palmer 2008)
Down-light Thermal Barriers – Methodology
Down-light thermal barriers come in two main forms, ventilated and unventilated. Both ventilated and unventilated barriers are designed to permit the extension of ceiling insulation up to the perimeter of the cover (or even over the cover provided that such an approach did not adversely affect the performance of the fitting66). For many down-light fittings (particularly the ubiquitous quartz halogen type), in the absence of a suitable cover, current regulations require that ceiling insulation must
66
Naturally this would not be acceptable practice in the case of the ventilated down-light cover where the ventilation holes would be effectively blocked by the overlying insulation. Such an approach may be suitable for the unventilated covers provided that the performance of the light fitting was not adversely affected by the added insulative effect of the overlying insulation..
30%
40%
50%
60%
70%
80%
90%
0 5 10 15 20 25 30 35
Age of System (Years)
Ove
rall
Du
ct
Eff
icie
nc
y
Trendline

R 333
be kept 200mm clear of the down-light fitting (to avoid fire risk). For most down-light fittings this effectively means that a 500mm x 500mm area of ceiling around the down-light fitting must be kept free of insulation67 . The absence of insulation around the down-light fitting promotes increased (conductive) heat loss in winter and heat gain in summer compared to insulated sections of the ceiling. In the case of the unventilated covers, when partnered with a compatible down-light fitting the down-light thermal barrier acts to limit infiltration (convective) losses/gains through the down-light fitting. Benefits in terms of the reduction in conductive losses/gains were assessed using the modelling approach noted earlier in this section. In the absence of thermal barriers it was assumed that no ceiling insulation was fitted around the down-light (0.25m2) and in the case where thermal barriers were fitted it was assumed that a minimum of R1.5 ceiling insulation was present around the fitting. The modelling assumed a total of 6 down-light covers were installed. Either 6 in living spaces only (scenario 1), 6 in non-living spaces only (scenario 2) or 3 in living and 3 in non-living spaces (scenario 3). Per down-light barrier conductive benefits were estimated by dividing the difference in performance result (ie with and without covers fitted) by six. Because there was not a significant difference in the results obtained for the three different scenarios the more generalised scenario 3 was used to assess benefits. Benefits in terms of the reduction in convective losses/gains (unventilated barriers only) were simply assessed by utilizing the down-light modelling facility available in AccuRate. This facility accounts for convective losses only (ie it makes no account for any conductive losses associated with the removal of insulation around the perimeter of the down-light, such losses are required to be separately accounted for as described above. Period of Assumed Benefit The down-light barrier having no moving parts and not being in an exposed location is likely to last for a considerable period of time. Of course the product will only deliver benefits as long as the down-light fitting it covers remains in service, this means the likely service life of the product is difficult to determine. For this study, given that the fitting of the barrier will be associated with the fitting of a completely new luminaire it was assumed that the period of the benefit would be 20 years.
Rebound effect or comfort creep
The “rebound effect” or “comfort creep” is the perceived tendency of householder to increase their minimum comfort requirements following the application of building shell improvement measures. Such improvements in comfort requirements could take the form of changed thermostat settings and or an increase in actual conditioned floor area. For the householder, “comfort creep” (if it occurs) is not an issue, for this indicates that the householder is valuing improvements taken in comfort above the potential financial savings that could be realised if their comfort requirements were left unchanged following the application of the improvement measure. For government
67
A typical down-light is approximately 100mm diameter. This means that with a 200mm clearance all around a circle having a diameter of 500mm (200 + 100 + 200) must be kept clear of insulation. As they are more difficult to undertake, circular cut outs are however rarely made and most installers will opt for a square cut-out the minimum size being 500mm square (sometimes larger).

R 334
however it is less straight forward. From a government perspective a key outcome of the scheme is a reduction in greenhouse gas emissions for those dwellings that participate in the scheme. Where comfort creep does occur the energy savings predicted for the energy efficiency measures will not be realised in full. Unfortunately there is little Australian data in the form of post occupancy surveys that support an estimate of the likely impact of this phenomenon. What has been found is the following:
Gas and Fuel Corporation Gas Demand Management Project -
Victoria
The Gas and Fuel Corporation undertook a number of significant studies of residential energy use in the 1980’s and early 1990’s. The Gas Demand Management Discussion Paper No. 9 released in December 1991 analyses the saving in gas heating due to the installation of ceiling insulation. This was a longitudinal survey of 300 houses households. It analysed the winter energy consumption of these households before and after they had installed ceiling installation. The project also surveyed these households to determine the type of heating, the extent of use in terms of rooms heated and times of operation and whether the occupants had changed the way they heat their houses after the installation of insulation. The study found that ceiling insulation did result in statistically significant energy savings The Gas and Fuel also asked a number of questions to determine whether people had changed the way they used their heaters after the installation of insulation. Table 145 below presents these results.
Table 145: Changes in Use of Heaters after the Installation of Insulation (Gas and Fuel 1991)
User Behavior Affected
% of Centrally Heated Homes % of Space Heated Homes
Increase No Change
Decrease Increase No Change
Decrease
Hours of Use 11 45 44 5 60 35
Heating Thermostat 7 60 33 5 50 45
Area Heated 17 76 7 21 71 8
The table above demonstrates that after installing insulation the majority of the sample did not change the way they used heating. For those households which did change most of them:
reduced their thermostat setting: the better heat distribution afforded by insulation meant that the house could be heated to a lower temperature and still remain comfortable,
reduced the hours of use: the ceiling insulation meant that the house did not cool down as quickly and so maintained comfortable conditions without heating for longer, and
around 1 in 5 households increased the area heated.

R 335
The first two factors listed should act to reduce energy use while the increase in area heated will increase energy use. Taken together these changes to user behaviour suggested that there was little or no rebound effect that could be associated with the installation of insulation.
UK Energy Research Centre Study
In a UK study entitled “The Rebound Effect: an assessment of the evidence for economy-wide energy savings from improved energy efficiency (Sorrell 2007) prepared for the UK Energy Research Centre in London it was concluded following the review of a number of studies that the level of shortfall is typically in the order of 10 to 30% for heating in developed countries following thermal performance upgrades.
Study of Public Housing in Tasmania
In this project, a sample of around 140 houses was fitted with meters which measured the energy use of individual appliances: off peak heating, auxiliary heating, hot water, lighting, cooking and general power for a period of 21 months. Meters were read on the same day for each house at monthly intervals. Householders were interviewed about the extent of their energy use and their understanding of and attitudes toward energy use. The sample was selected to include only a handful of house design types and only two types off peak heaters were used. This limited the variability of the sample in terms of heater type, area of house, design features and construction materials. Further the use of public housing tenants reduced the socio-demographic variability of the sample. This study found that houses with wall and ceiling insulation used 12% less energy than houses with ceiling insulation only. This is close to the full theoretical value which again indicated that there is little rebound effect.
Evaluation of the Home Energy Advisory Service in Victoria
The Home Energy Advisory Service was established in Victoria to provide energy saving advice and retrofitting for Commonwealth Health Card holders. To ensure the program was effective the energy use before and after receiving the service was analysed for 3000 clients. Having a large sample allowed the researchers to ensure that the comparison of energy use eliminated other extraneous variables while still providing samples of sufficient size to ensure statistical significance. The phase 2 report (DITR, 1985) showed that households who received ceiling insulation had 9.2% lower gas usage and 7.6% lower electricity usage indicating that supplementary heating using fans heaters etc. was also reduced. The full theoretical saving for a space heated home (not centrally heated) will be in the order of 12%, this represents a rebound of approximately 25% This is a particularly important finding for if any sample is likely to be under-heating - and would therefore show potential for rebound - it would be those with lower incomes such as the clients of this service.
Impact of Retrofit Wall Insulation in the ACT
The ACT Government offers a rebate to those who install Cavity Wall Insulation. This product is a loose fill insulation which can be blown into existing walls. The ACT government engaged consultants to examine the impacts of the retrofit wall insulation on the energy use of a sample of households (Beckman, 2003). Over the 72 houses in the sample a total energy saving including gas and electricity was 15%. While this

R 336
is less than the ACT Greenhouse plan forecast, it is in line with the theoretical savings that simple heat flow calculations would indicate.
Study for Energy Efficiency Conservation Authority – NZ
The New Zealand study entitled “Home Energy Rating Scheme : Cost benefit analysis “(Energy Consult April 2009), included a component that covered the retrofit of insulation to existing dwellings. For that component the authors estimated the potential rebound effect at 25%. The basis of this estimate is unknown.
Conclusion
Determination of an appropriate rebound factors for application in the various jurisdictions within Australia are hampered by a lack of available data. Studies from Victoria and the ACT as well as further a field tend to place the rebound effect somewhere in the range of 0 – 30% noting that this is likely to vary depending on factors such as the socio-economic status of the household and the severity of the local climate. Considering the results of these various studies it was decided in consultation with DSD that an assumed rebound effect of 15% would be appropriate for this study (ie the midpoint of the identified range). That is, it is assumed that following the application of improvement measures only 85% of the theoretical space conditioning energy savings are likely to be realised.

R 337
Appendix 4 - Water Heater Modelling Method
Appendix 4
Water Heater Modelling Method

R 338
Water Heater Modelling Method Introduction Water heating is a major energy end-use in the home and an important component of REES. Under the REES activity specification, certain specified water heaters can be replaced with low energy water heaters in order to calculate energy savings. The estimated energy consumption and any subsequent energy savings, from a change in water heater technology are heavily dependent on estimated average hot water use in the home. While standards such as AS4552, AS/NZS4692 and AS/NZS4234 define the performance and energy consumption for water heaters, it is important that these energy values are adjusted to reflect actual hot water consumption under typical use conditions. This is an area where REES has been subjected to close review. As a general observation, data on residential hot water consumption is generally poor. In contrast, modelling tools for hot water are generally very good (TRNSYS and AS/NZS 4234). So it is important to ensure that simulations under AS/NZS 4234 are calibrated to be more reflective of actual hot water use when being used to estimate program energy savings. Consideration also needs to be given to the additionality of this activity in the case of solar and heat pump water heaters and the Renewable Energy Target (Small Scale Technology Certificates, formerly RECS). There are also risks for consumers from promoting a shift to gas water heating, in the context of anticipated gas price rises. Overview of STC calculation Federal regulations set out the requirements for the calculation of Small Scale Technology Certificates (STCs) (Renewable Energy (Electricity) Regulations, 2001). This regulation references AS/NZS 4234 (2008). The standard defines important parameters such as:
Cold water temperatures (by month);
Ambient temperatures (by month);
Typical mean year for solar and ambient conditions for simulation. AS/NZS 4234 was amended in 2011 to include air source heat pump systems. A detailed software package called TRNSYS is used to simulate hourly data for a year. The performance of individual water heaters (determined from outdoor testing) is used to set a range of performance parameters for the simulation. The parameters defined are:
Supply times for controlled electricity;
Hourly climate data for 4 climate zones in Australia (5 zones for heat pumps) – most of South Australia is covered by Zone 3;
Hot water peak demand (in MJ/day) for small, medium and large systems – for Zone 3 these are 22.5 MJ/day, 38 MJ/day and 57 MJ/day (note that a very small system size is proposed for inclusion in Amendment 3 in 2014 at 15 MJ/day);
Daily load profile is specified;
Seasonal hot water load pattern is specified by month (1.0 in winter down to 0.7 in January);

R 339
Cold water inlet temperatures by month and climate zone. The small reference electric system is 80 litres (1.73 kWh/day heat loss) and the medium and large reference electric system is 315 litres (2.92 kWh/day heat loss). The reference gas water heater is a 170 litre, 3 star system. Table 146: Reference Energy Consumption for Gas and Electric Water Heaters AS/NZS4234, Zone 3
Water heater Load MJ/day winter
Annual Input Energy MJ/year
Electric small 22.5 9270
Electric medium 38 15260
Electric large 57 21100
Gas small 22.5 16410
Gas medium 38 22690
Gas large 57 30400 Source: AS/NZS4234 Table A10
Similar requirements are also specified for New Zealand climates (Zones 5 and 6). For water heaters, an STC (REC) is effectively 1 MWh of savings relative to the reference water heater over a 10 year period. Thus, 30 STCs is 30 MWh over 10 years, or 3000 kWh/year savings relative to the reference heater of the same fuel, for the same hot water delivery. To qualify as a large or medium system, a solar water heater has to achieve at least 60% energy saving relative to the reference water heater in Zone 3 using the same boost fuel and the same load. It is important to note that STCs are a measure of the capability of the water heater (its saving potential on small, medium or large hot water delivery), rather than an estimate of the energy savings based on its likely use. Water heaters are always rated at their largest possible size. Likely Hot Water Load in Houses Actual hot water use is generally poorly documented in Australia. There are just a handful of studies that monitor hot water consumption in the home (directly or indirectly). These include SECV (1971) 70 houses, Pacific Power (1994) 300 houses, Guthrie and Kimpton (1987) (10 houses), DCCEE REMP monitoring in 2010 (5 homes), University of South Australia (2013) 12 houses. These studies have been conducted for a range of reasons, sometimes focusing on issues other than, or in addition to, water heating. Two relatively recent studies showed that hot water was quite variable per household (DCCEE (2010) and University of South Australia (2013)), but the general findings were that hot water use was somewhat lower than generally estimated for policy purposes. The DCCEE study in particular found that there were a large number of small hot water events during normal use. This may adversely impact on the operation of instantaneous gas water heaters, for instance. Despite the lack of dedicated end use metering data for water heaters, there is a large body of controlled load data for electric storage water heaters, as these systems have been very prevalent for a long time in Australia. From the 1970s to the 1990s, the typical average off peak energy consumption for electric storage water heaters was 3200 to 3500 kWh/year in NSW and Victoria (noting that individual houses varied a lot from the mean) and somewhat less in Queensland due to climate

R 340
influences. Pacific Power (1994) reported that non-off peak hot water consumption was 2900 kWh/year in 1994 (these systems are commonly found in flats and therefore relate to smaller than average household sizes). Controlled load tariffs were overwhelmingly used for electric storage water heating. In recent years that have been some other load types connected to these tariffs and a modest increase in solar water heaters and heat pump water heaters (which appear as a reduced electrical energy demand). However, all utilities have been experiencing a decline in controlled tariff energy sales for the past 15 years. This is likely to be due to introduction of water heater storage MEPS in 1999, improvements in water efficiency (low flow shower heads) and increased penetration of front loading washers, which mostly use cold water and internally heat this for when washing (this is a load shift from hot water to clothes washing). Loads other than water heaters are sometimes connected to these controlled loads (e.g. dryers). A proportion of the energy decline is likely due to the increase prevalence of solar water heaters68, although these have very modest penetration and growth in all states, including South Australia. Some controlled load channels are left connected with no loads and appear as zero energy consumption, which pushes down the average. In recent years NSW controlled tariff sales have declined to around 2500 kWh/year (EES 2013), although conventional water heaters still appear to be around 2900 kWh/year. In 2012, AUSGRID released a sample of interval data for 1 year for 300 homes. Data included 30 minute load for general domestic, controlled load (off peak) and solar generation (PV) (AUSGRID 2012). From this data it was possible to identify conventional electric water heaters and solar water heaters. This can be compared with selected utility data for controlled loads in SA and NSW. Figure 42: Comparison of controlled load data from various utility sources
68
Solar water heaters operating on off peak tend to require greater input energy compared to continuously boosted systems (as for off peak systems the volume of water heated overnight has to be larger). This means that off peak systems earn fewer STCs so this is a non-favoured configuration.
-
50
100
150
200
250
300
350
jul 07 aug 07 sep 07 oct 07 nov 07 dec 07 jan 08 feb 08 mar 08 apr 08 may 08 jun 08
Ele
ctri
city
Co
nsu
mp
tio
n k
Wh
/mo
nth
NSW - water heaters
NSW OP1
NSW OP2
SA Tariff 116

R 341
Source: AUSGRID 2012 and utility sources.
This suggests that the SA data is consistently lower than data in Sydney (around 50 kWh/month for most of the year). This may be partly because SA have more solar water heaters connected to Tariff 116 when compared to NSW (solar water heaters on average use around 1000 to 1200 kWh/year – about one third of the energy of a conventional system, so even 10% of connections will reduce the average). The stronger than expected seasonal impact supports this thesis. Data from Lochiel Park suggests the seasonal impact for gas water heaters is similar with a summer demand at about 0.6 of the winter demand (University of South Australia 2013), which closely reflects data from other sources. A study by University of SA found that for a small sample of homes, average hot water use in summer was around 40 litres per person per day (University of SA 2013). A composite monthly energy value has been prepared from the various sources as being representative of total energy input into electric water heaters in South Australia – this totals 2,960 kWh/year (including hot water use and heat losses). Taking into account heat losses from electric storage water heaters (about 2.4kWh per day on average - with in use adjustments to take into account tank storage temperatures and reduced losses when operating on off peak) as well as changes in cold water temperatures throughout the year in Adelaide, this implies hot water use is around 2250 kWh/year or about 22 MJ/day year round average. This is a bit more than the “small” size under AS/NZS4234, which equates to 22.5 MJ/day winter peak load (or about 19 MJ/day year round average). The utility data suggests that the seasonal impact of water heaters is 0.6 for energy (summer over winter and 0.8 in terms of actual hot water volume). AS/NZS4234 assumes a summer ratio of 0.7 in hot water use, which translates to about 0.55 in energy use on a seasonal basis, so this matches most of the data sources. Note that actual usage will vary from year to year depending on weather. Figure 43: Composite data representative of South Australia hot water use
-
20
40
60
80
100
120
140
160
180
200
0
5
10
15
20
25
30
jul 07 aug 07 sep 07 oct 07 nov 07 dec 07 jan 08 feb 08 mar 08 apr 08 may 08 jun 08
Imp
lied
ho
t w
ate
r u
sage
Lit
res/
day
Imp
lied
ho
t w
ate
r u
sage
MJ/
day
Hot water energy
Hot water litres

R 342
Source: Composite data from several sources to provides estimated hot water consumption for SA
University of South Australia found the cold water temperatures and other modelling assumptions in AS/NZS 4234 broadly representative of AS/NZS 4234 data (University of South Australia 2013). All this data suggests that AS/NZS 4234 is a reasonable tool for estimating energy consumption, but the outputs need to be scaled to give more realistic hot water demand values in order to calculate likely savings from a change in water heater under REES. This is especially the case for solar thermal water heaters, where the relative total energy consumption is quite sensitive to the assumed hot water loads (other system types are generally much less sensitive to changes in their marginal energy consumption as a function of hot water demand). An average hot water demand of around 22MJ/day AS/NZS 4234 is likely to give a reasonable estimate of the savings in South Australia for a change in water heater type. To account for the slightly higher seasonal effects in South Australia, a winter peak hot water demand of 27 MJ/day has been used under AS/NZS4234 to match typical hot water consumption observed in South Australia. Energy Modelling to AS/NZS 4234 On the basis that AS/NZS4234 provides a reasonable estimate of in-situ energy consumption once the hot water demand has been adjusted, it is then possible to compare water heater technologies in order to estimate the energy savings. Figure 44: Annual energy consumption for different water heater types
Reference daily winter hot water delivery energy in AS/NZS4234-2008 for small, medium and large systems are 22.5 MJ/day, 38 MJ/day and 57 MJ/day respectively (winter peak demand) in Zone 3. Where the unit can meet the solar contribution requirement in Zone 3 (60%) for a particular load size, this value is then used to assess the capability of the water heater and define the STC (REC) credits earned. It is important to note that Victoria still references AS4234-1994 and that this standard
0
5000
10000
15000
20000
25000
30000
35000
0 20 40 60
Inp
ut
en
erg
y M
J/ye
ar
Winter Peak Hot Water Demand MJ/day
Total Energy Input by System Type - AS/NZS4234 Zone 3
Gas storage (3* ref)
Gas storage (4* ref)
Gas storage (5* ref)
Gas Instant 5*
Gas storage 5*
Electric Storage (ref large)
Electric Storage (ref small)
Solar thermal
Gas in-line-solar
Heat Pump

R 343
only defines two load sizes: small (equal to the small in AS/NZS4234-2008) and large (equal to the medium in AS/NZS4234-2008). It is understood that many of the existing electric storage systems installed South Australia will be larger off peak storage systems (typically 315 litres or 400 litres). However, under the SA Water Heater Installation Guidelines, Class 1 dwellings that are NOT required to install a low emissions water heater can install a new electric storage system up to 250 litres in capacity (larger systems like those current installed cannot be replaced). So the average size of electric water heaters in the stock can be expected to decline over time. Class 2 dwellings (flats) that use electric storage systems will tend to smaller sizes in any case, although these are less common in South Australia (around 10% of electric water heaters in 2008 – ABS4602). For electric resistance water heaters, the marginal efficiency of the system is close to 100% (98% conversion efficiency is assumed). So for a given hot water load, the energy input to cover the hot water use will be the same, irrespective of tank size. The only difference between different tank sizes is the expected heat loss. Heat losses in Australia for electric storage water heaters have been regulated (MEPS) since 1999. Heat losses for a mains pressure 80 litre system are 1.53 kWh/day, and for a 315 system are 2.72 kWh/day (AS/NZS4692.2 using test method AS/NZS4692.1). For modelling purposes, the 80 litre system is assumed to be on a continuous tariff while the 315 litre system is on off peak. When there is no hot water use, the heat losses for each system mirror the measured heat loss in accordance with AS/NZS4692.1. However, as the hot water load increases, the heat loss for the 80 litre system remains fairly constant while the heat loss for the off peak system decreases. This is because under an off peak energisation profile, the tank fills with cold water as hot water is used throughout the day – this results in lower total daily heat losses. The larger the hot water demand, the smaller the overall heat losses. Figure 45: Impact of hot water demand of annual heat losses for peak and off peak water heater
Notes: Off peak 315 litre, continuous 80 litre, both MEPS compliant, modelling to AS/NZS4234 Zone 3.
0
500
1000
1500
2000
2500
3000
3500
4000
0 20 40 60
An
nu
al H
eat
Lo
ss Z
on
e 3
(M
J/ye
ar)
Daily Hot Water Demand to AS/NZS4234 (MJ/day winter peak)
Offpeak
Continuous

R 344
This data shows that for a typical hot water demand in South Australia, the difference in annual heat losses for a peak and a large off peak electric storage water heater are likely to be around 800 MJ/year, or around 220 kWh/year. This equates to an error of around 7% of total energy consumption. This is at the highest possible heat loss difference as the modelling used assumes that thermostats are set at 75°C, which is the maximum possible for enamel lined steel tanks. However, it is important to note that the maximum size system that can be installed under the SA Water Heater Installation Requirements (during replacement) is 250 litres, so the above analysis also overestimates the differences in heat loss by about 30% when on off peak, meaning that heat losses for the maximum systems size permitted is 150 kWh/year. Lower in-use thermostat setting will mean even smaller differences in heat loss on average. A range of water heater types, connection tariffs and household sizes are likely to participate in REES and the exact mixture of eligible existing water heater types cannot be accurately predicted. However, the regulated maximum size for a new electric water heater is now 250 litres (probably on off peak), so in terms of additionality, this is ceiling for the calculation of heat losses. Given that some smaller electric systems will also participate in REES, it is proposed to use the characteristics of a continuous tariff 80 litre electric water heater as the baseline case for all electric water heaters (i.e. where a low emissions water heater is not required) with only a small error. This slightly underestimates the savings where a large storage system is replaced, but provides a slightly conservative and defendable baseline for the current regulatory position in South Australia. In terms of providing benchmarks for energy savings, for electric products, a small electric storage system that is on continuous tariff and that just meets MEPS is assumed. For a gas product, a 5.0 star gas storage system is assumed. The specifications for the water heaters modelled are set out below. Electric off peak: Tank volume 300 litres, standing heat loss 2.72 kWh/d, Thermostat set temperature 75°C. Electric continuous: Tank volume 85 litres, standing heat loss1.53 kWh/d, thermostat set temperature 75°C. Gas storage: Star rating 5, Tank volume 170 litres, thermal efficiency 89%, maintenance rate 0.5 MJ/h, thermostat set temperature 60°C. Gas instantaneous: Star rating 5, thermal efficiency 80%, thermostat set temperature 60°C, start-up heat loss 0.5 MJ, electric power during standby 7 W, electric power for peak flow 40W. Solar water heater, flat plate-standard efficiency, electric auxiliary, solar configuration close coupled thermosiphon, boost energy electric continuous, tank volume 300 litres, thermostat temperature 60°C, auxiliary heated volume 100 litres, collector aperture area 3.9 m2
Flat plate collector efficiency =G
TT
G
TT awaw
2][00047.0
][63.7825.0

R 345
Solar water heater: flat plate-standard, gas instantaneous auxiliary, solar configuration pumped circulation, boost energy in-series gas instantaneous, tank volume 300 litres, collector aperture area 3.9 m2, booster thermal efficiency 80%, booster thermostat set temperature 60°C, start-up heat loss 0.5 MJ, electric power during standby 7 W, electric power for peak flow 40 W, flat plate collector efficiency as above. Air source heat pump: Tank volume 300 litres, standing heat loss 2.71 kWh/d, thermostat set temperature 60°C, nominal compressor electric power 750W, COP = 5 for 20°C ambient and 20°C water, COP = 2 for 20°C ambient and 60°C water. Review of Solar Water Heater Performance Qualifications for REES Current REES requirements set performance benchmarks for various solar water heaters depending on their size in terms of the minimum number of STCs earned. This is a sensible requirement. It is important to note that the SA Water Heater Installation Requirements also set out similar qualifications for low emission water heaters. There is currently no differentiation of the likely savings for different sized water heaters installed (the type of replacement dictates the savings, independent of system size). In practice, it is likely that larger systems may be installed (on average) in larger homes. However, just providing a single energy credit irrespective of system size is in keeping with the overall principles of calculating credits for an average household. Victoria and the ACT scale the savings based on system size. However, if this approach is considered, the estimated savings (based on STCs) need to be adjusted and scaled to the likely hot water demand of small, medium or large system sizes and the sales share by system size. In Victoria, the majority of systems installed have been larger sizes. The sales share by system size was not known when the scheme was first designed so the estimated VEET savings were probably ended up too high because of the assumed household size (and hot water use) for large, medium and small systems did not match the average household size (and overall average hot water use). A move to a size based system of calculating energy credits would require considerably more data on existing systems, new systems and household sizes before a robust approach could be developed. Under the current REES scheme, the following performance requirements are specified for solar water heaters to be eligible under REES. These requirements apply to solar thermal (electric boost), solar thermal (gas boost) and heat pump systems. Tanks size ≤ 220 litres: ≥ 17 RECS 220 litres < Tank size ≤ 400 litres: ≥ 27 RECS 400 litres < Tank size ≤ 700 litres: ≥ 38 RECS In order to review the veracity of these performance benchmarks, data from the Clean Energy Regulator (CER) in RECs earned by climate zone was reviewed. This can be obtained from http://ret.cleanenergyregulator.gov.au/Hot-Water-Systems/Eligible-Solar-Water-Heaters/eligible-swhs

R 346
The CER list of all qualified water heaters provides the STCs (RECs) earned for each of the specified climate zones in AS/NZS4234. However, the CER listing does not provide any details on tank size (as currently specified in the current REES requirements). Fortunately, data from the Essential Service Commission for VEET water heaters does list details on their tank size (see https://www.veet.vic.gov.au/Public/ProductRegistrySearch.aspx ). Using this listing is was possible to cross match around 1200 solar thermal models with data from the CER register (about 20% of all models) to give data on tank size versus RECs earned in AS/NZS 4234 Zone 3. Figure 46 shows the VEET data and the current REES thresholds. Figure 46: Tanks size versus RECs for small and large solar thermal systems
Note: Large systems in this figure is as designated by VEET, which is assessed under AS/NZS4234-1994 and is equivalent to medium in AS/NZS4234-2008.
Figure 46 shows that the REES specification lies in the middle to lower end of the solar water heaters currently listed by VEET. In the absence of other data, this may suggest that the REES levels may be somewhat weak. However, when the VEET water heater data are examined in the context of all solar water heaters listed by the CER, it appears that the VEET water heaters are better than average. This is because VEET, like REES, also have qualification criteria for acceptance of solar systems. Figure 47 confirms that the solar water heaters listed by VEET are, for the most part, restricted to the top 50% of all solar waters listed by the Clean Energy Regulator. In this context, the current REES requirements provide a good minimum performance benchmark for inclusion into the scheme. Note that this data includes all solar thermal types, including flat plate, evacuated tube, remote storage and close coupled systems. The only reservation is that the REES requirement sets no benchmark on system capability by tank size. Many products that can only qualify as small (i.e. can only meet 60% energy savings with a peak hot water winter demand of 22.5 MJ/day
0
10
20
30
40
50
60
0 100 200 300 400 500 600 700 800
REC
S Z
on
e 3
Tank size litres
Solar-small
Solar-large
REES

R 347
in Zone 3) but have a 300 litre tank – these can still be included in REES. One refinement would be to require that tank sizes over 220 litres also qualify as capable of meeting medium hot water delivery in Zone 3 (38 MJ/day winter peak with a 60% solar contribution). This would affect some lower performing systems by excluding them from REES eligibility. Figure 47: VEET solar water heaters in the context of all CER solar water heaters
A separate analysis has been done on heat pump systems. These are quite different to solar thermal systems in terms of their performance. For solar thermal systems, solar contribution decreases somewhat with increasing hot water loads as the proportion of boost energy increases. This means that for solar thermal systems, the marginal energy input per MJ increase of hot water load increases with hot water load. This is why it is estimating the total hot water load with some accuracy is important for solar thermal systems. In contrast to solar systems, for most other water heater types examined (including heat pumps), the marginal energy input per MJ increase of hot water load is relatively constant with increases in hot water load (tank heat losses can be seen as a fixed loss that is fairly independent on load, although this does depend on the energisation profile). So it is likely that a different specification for REES qualification for heat pump systems may be warranted. CER list some 172 models of heat pump water heater that qualify for STCs (RECs). All of these qualify for RECs in Zone 3 and 157 qualify for RECs in Zone 4. For the most part, these will qualify as medium sized systems under AS4235-2008. One of the concerns of all policy makers is that some heat pump systems appear to perform poorly in colder climates. In order to assess this element (and also given some parts of South Australia lie within or on the margins of the colder Zone 4 under AS/NZS4234-2008), it is possible to examine the relative performance of heat pumps in Zone 3 and Zone 4 using CER data.
0
10
20
30
40
50
60
70
80
11
63
32
54
87
64
98
11
97
31
13
51
29
71
45
91
62
11
78
31
94
52
10
72
26
92
43
12
59
32
75
52
91
73
07
93
24
13
40
33
56
53
72
73
88
94
05
14
21
34
37
54
53
74
69
94
86
15
02
35
18
55
34
75
50
95
67
15
83
35
99
56
15
76
31
96
48
16
64
36
80
56
96
77
12
97
29
17
45
37
61
57
77
77
93
98
10
18
26
38
42
58
58
78
74
9
REC
S Zo
ne
3
Models sorted by RECS
VEET
All CER models

R 348
The first observation from Figure 48 is that most of the CER listed heat pump water heaters perform better in Zone 4 than in Zone 3 (in terms of RECs earned). A small handful of systems have quite poor performance in Zone 4. The solid green line shows where performance is equal in Zone 3 and Zone 4 (in terms of RECs earned). While this does seem counter-intuitive, it comes from the reduced heat losses for heat pump systems (actual heat loss over the system COP) compared to a convention system and the fact that most heat pumps are affected little by modest changes in climatic conditions. So the relative savings are slightly larger for most systems in Zone 4 (when compared to a conventional system). Figure 48: Heat pump water heater performance in Zone 3 and Zone 4
The following table shows the number of models that meet different levels for RECs for Zone 3 and Zone 4. Table 147: Heat Models on CER Register that exceed RECs by Zone
Minimum RECS Count Zone 3 Count Zone 4 Both Zone 3 & 4
≥ 25 RECs 163 147 147
≥ 26 RECs 144 147 138
≥ 27 RECs 89 139 84
As noted above, some 15 models do not have any rating in Zone 4. It is very important to note that 4 of the 15 models that are not rated for RECs in Zone 4 achieve 27 RECs in Zone 3 (another model achieves 29 RECs in Zone 3 and only 17 in Zone 4). The remaining 10 models achieve 25 or 26 RECs in Zone 3. This suggests that a few products rate quite well in Zone 3, but for whatever reason, they are not rated in Zone 4 (or rate poorly in Zone 4). There is therefore some risk under the current specification that REES participants may select a complying Zone 3 water heater that is not suitable for use in colder parts of the state. This could generate
0
5
10
15
20
25
30
35
40
45
0 5 10 15 20 25 30 35 40 45
STC
s (R
ECs)
Zo
ne
4
STCs (RECs) Zone 3
CER database
Z3=Z4

R 349
some dissatisfaction by participants and could result in poor energy savings achieved in some cases and undermine the credibility of the scheme. There are currently 89 heat pump systems that exceed the current REES requirement of ≥27 RECs for Zone 3 (green cell in the table above) (this requirement is also specified in the SA Water Heater Installation Requirements). However, there are 139 water heaters that can achieve ≥27 RECs for Zone 4 (noting that most heat pump water heaters earn more RECs in Zone 4 than in Zone 3). If there was a requirement that ≥27 RECs had to be earned in Zone 3 AND Zone 4, there would be 84 models that qualify. This appears to be sensible safeguard for the REES scheme that results in little reduction in the available models (when compared to current requirements). The SA Water Heater Installation Requirements set heat pump requirements as ≥27 RECs for Zone 3 and these align with the current REES requirements. However, as an alternative, the SA Water Heater Installation Requirements also permit solar water heaters to earn ≥26 RECs for Zone 4. This is somewhat weaker than the requirement for Zone 3 (as most heat pump systems earn more RECs in Zone 469). The best solution for a revised REES specification would be to add the requirement for Zone 4 on top of the current requirement for Zone 3 for heat pumps. This will result in the elimination of only 5 models out of 89 under the current listing and will provide good protection for consumer in that all units installed have good performance in cooler climates. In turn, this will ensure that energy savings are achieved and that the credibility of the scheme remains intact, but will have no material negative impact on the performance of these systems in other parts of the state or the range of products available. The other element of the current specification is the size restriction for heat pumps. While most heat pump systems will have a storage tank is the range 220 litres to 400 litres, there are certainly some models outside of this range. The CER database does not list tank size, although many model numbers do provide some clue as to the tank size. However, the VEET water heater database does list tank size for heat pumps. Data in Figure 49 shows that RECs earned reduces with tank size (due to increased heat losses). Given that most systems are earning in the range 25 to 33 RECs in Zone 3, they are all qualifying as medium systems under AS/NZS4234. This shows that the current REES requirements based on tank size poorly matches to the available performance data. On this basis it is recommended that the current requirement for RECs based on tank size be replaced with a flat requirement for all sizes.
69
A more sensible technical requirement would be to require 27 RECs in Zone 4 and 26 RECs in Zone 3, but this would create too many conflicts with the current SA Water Heater Installation Requirements.

R 350
Figure 49: VEET Heat Pump Water Heaters – tanks size versus RECs in Zone 3
Summary of Proposed Changes for REES Qualification – Solar Water Heaters Solar thermal systems – no change to current requirement for RECs by tank size with the exception that tank sizes above 220 litres shall qualify as medium or large under AS4234-2008. The requirement for heat pump systems should be revised so that all heat pumps must earn 27 RECs or more in Zone 3 and 26 RECs or more in Zone 4 under AS/NZS4234-2008 (both requirements should apply) for all system sizes. The current requirements based on tank size should be removed for heat pump systems. All qualifying heat pump and solar water heaters are listed by the Clean Energy Regulator for each zone at http://ret.cleanenergyregulator.gov.au/Hot-Water-Systems/eligible-swhs erial Protocol
15
20
25
30
35
40
0 50 100 150 200 250 300 350 400 450
REC
s e
arn
ed
in Z
on
e 3
Heat Pump Tank Storage Size - litres
VEET HP
REES HP