r d o f e dvca board of education retirement system t a io ... · • managements discussion and...
TRANSCRIPT

Comprehensive Annual Financial Reportof the Qualified Pension Plan and the
Tax Deferred Annuity Program
For the Years Ended June 30, 2016 and June 30, 2015
BOAR
D OF EDVCATION
CIT
Y OF N E W YORK
Board of Education Retirement Systemof the City of New YorkA Fiduciary Fund of the City of New York
REACH THEIR RETIREMENT GOALS
AT BERS WE HELP OUR MEMBERS

BOAR
D OF EDVCATION
CIT
Y OF N E W YORK
Board of Education Retirement Systemof the City of New YorkA Fiduciary Fund of the City of New York
Comprehensive Annual Financial Reportof the Qualified Pension Plan and theTax Deferred Annuity Program
For the Fiscal Years Ended June 30, 2016 and June 30, 2015
Prepared bySanford R. Rich, Executive DirectorPatrick (Rick) Hederman, Director of Fiscal Operations
State of New York

This page is intentionally left blank
New York City Board of Education Retirement System
ii

PAGE INTRODUCTORY SECTION 1
• Letter of Transmittal 3• Board of Trustees 10 • Organization Chart 11 • Consulting and Professional Services 12• CertificateofAchievementforExcellenceinFinancialReporting 13
FINANCIAL SECTION 15• INDEPENDENT AUDITORS’ REPORT 17• MANAGEMENT’S DISCUSSION AND ANALYSIS (UNAUDITED) 19• COMBINED FINANCIAL STATEMENTS • CombiningStatementofFiduciaryNetPosition 21 • CombiningStatementofChangesinFiduciaryNetPosition 27 • NotestotheCombinedFinancialStatements 31• REQUIRED SUPPLEMENTARY INFORMATION (UNAUDITED) • Schedule1-ChangesinEmployers’NetPensionLiability&RelatedRatios 61 • Schedule2-Employers’Contributions 62 • Schedule3-InvestmentReturns 64• ADDITIONAL SUPPLEMENTARY INFORMATION • ScheduleofInvestmentExpenses 65 • ScheduleofDirectPaymentstoConsultants 68 • ScheduleofAdministrativeExpenses 69
INVESTMENT SECTION 71• ReportonInvestmentActivity 72• AssetsAllocationFixed 75• InvestmentSummaryFixedandVariable 77• ScheduleofInvestmentReturnsFixed 78• LargestEquityHoldingsFixed 79• LargestBondsHoldingsFixed 80• LargestInternationalEquityHoldingsFixed 81• LargestEuropeAustralasiaFarEast(“EAFE”)HoldingsFixed 82• LargestEmergingMarket(“EM”)HoldingsFixed 83• LargestTreasuryInflationProtectedSecurities(“TIPS”)HoldingsFixed 84• LargestEconomicallyTargetedInvestmentsFixed 85• LargestDomesticEquityHoldings“VariableA”Program 86• ScheduleofPaymentsofCommissionstoBrokers 87
ACTUARIAL SECTION 93• Actuary’sCertificationLetter 95• SummaryofActuarialAssumptionsandMethods 100• ScheduleofActiveMemberValuationData 108• FundedStatusbasedonEntryAgeActuarialCostMethod 109• ComparativeSummaryofActuarialValuesandPercentages coveredbyActuarialValueofAssets(SolvencyTest) 110• ScheduleofRetirantsandBeneficiaries 112• ScheduleofStatutoryvs.ActuarialContributions 113• SummaryofPlanProvisions 114
STATISTICAL SECTION 133• Introduction 135• ScheduleofRevenueBySource-QPP 136• ScheduleofExpensesByType-QPP 138• ScheduleofRefundsByType-QPP 140• ScheduleofChangesInNetPosition-QPP 142• ScheduleofChangesInNetPosition-TDA 142• ScheduleofBenefitExpensesByType-QPP 146• ScheduleofRetiredMembersbyTypeofBenefits-QPP 147• ScheduleofSummaryofActivitiesbyAgeandService-QPP 150• ScheduleofAnnualAverageBenefitPaymentAmounts-QPP 153• ScheduleofParticipatingEmployers-QPP 154
iii
TABL
E O
F CO
NTE
NTS
New York City Board of Education Retirement System
Comprehensive Annual Financial Report

New York City Board of Education Retirement System
This page is intentionally left blank
iv
INTR
OD
UCT
OR
Y
This page is intentionally left blank

New York City Board of Education Retirement System
1
INTR
OD
UCT
OR
Y
INTRODUCTORY• Letter of Transmittal 3• Board of Trustees 10 • Organization Chart 11 • Consulting and Professional Services 12• CertificateofAchievementforExcellenceinFinancialReporting 13

New York City Board of Education Retirement System
2
INTR
OD
UCT
OR
Y
This page is intentionally left blank

New York City Board of Education Retirement System
3
INTR
OD
UCT
OR
Y
December 15th, 2016
Board of TrusteesBoard of Education Retirement SystemCity of New York65CourtStreet,16thFloorBrooklyn, NY 11201
Ladies and Gentlemen:
I am pleased to present the Comprehensive Annual Financial Report (CAFR) of the New York City Board ofEducation Retirement System (BERS) for the fiscal years ended June 30, 2016 and June 30, 2015. BERSadministerstheBERSQualifiedPensionPlan(the“QPP”)andtheBERSTaxDeferredAnnuityProgram(the“TDAProgram”). In2014,asaresultofananalysisperformedbytheCity’smanagement,adecisionwasmadetopresent thefinancialstatementsof theNewYorkCityBoardofEducationRetirementSystemonacombinedbasisforpresentationpurposes.
TheQPPisacostsharing,multipleemployerPublicEmployeeRetirementSystem(PERS)thatwascreatedonAugust 31st, 1921. The QPP provides pension benefits to non-pedagogical employees of the Department ofEducationandcertainotherspecificschoolsandcertainemployeesoftheNewYorkCitySchoolConstructionAuthority.TheQPPcombinesfeaturesofadefinedbenefitpensionplanwiththoseofadefinedcontributionplanandfunctionsinaccordancewithexistingStatestatutesandCitylaws.
TheTDAProgrambecameoperationalonFebruary1st, 1970 and is administered pursuant to the Internal Revenue CodeSection403(b)andexistingStatestatutesandCitylaws.CertainmembersoftheQPPhavetheoptiontoparticipateintheTDAProgram,whichprovidesameansofdeferringincometaxpaymentsontheirvoluntarytax-deferredcontributionsuntiltheperiodafterretirementoruponwithdrawalofcontributions.ContributionstotheTDAProgramaremadebythemembersonly.TheTDAProgramismaintainedasaseparateplan.
The responsibility for the accuracy of the data, and the completeness and fairness of the presentation, including alldisclosures,restswithBERS.AlldisclosuresnecessarytoenablethereadertogainanunderstandingoftheSystem'sfinancialactivitieshavebeenincluded.AnalysisofthechangesthataffectedBERSfiduciarynetpositionispresentedintheManagement’sDiscussionandAnalysissectionofthisreport.
BOARD OF EDUCATION RETIREMENT SYSTEMOF THE CITY OF NEW YORK
65 COURT STREET - ROOM 1603BROOKLYN, NEW YORK 11201- 4965
718-935-5400OUTSIDE NEW YORK STATE
1-800-843-5575
SANFORD R. RICHEXECUTIVE DIRECTOR
DANIEL D. MILLERDEPUTY EXECUTIVE DIRECTOR

New York City Board of Education Retirement System
4
INTR
OD
UCT
OR
Y
MAJOR LEGAL INITIATIVES - JULY 1, 2015 THROUGH JUNE 30, 2016
Chapter510of2015(S5692/A7834) – Plan Year for Tier 6 MembersThisactamendstheRetirementandSocialSecuritylawinrelationtothedefinitionofwagesearnedfrommultipleemployersandofplanyearfortheNewYorkCityRetirementSystems.FormembersofaNewYorkCityorStateRetirementSystem,afterApril1,2012,thedefinitionofwageswillnotinclude,incaseswhereemployeesreceivewages from three or more employers in a twelve month period, the wages paid by the third and each additional employer.ForTier6membersofNYCERS,TRS,andBERS,thecalendaryear(January1toDecember31)shallbeusedforthepurposeofcalculatingmembercontributions.
Chapter41of2016(S7160/A9531) – Military Service CreditThisactexpandstherightsofmembersofNewYorkStateandCitypublicretirementsystems,includingBERS,topurchasecreditformilitaryserviceperformedbeforetheyjoinedtheirretirementsystem.
FUNDING
The financial objective of the QPP is to fundmembers’ retirement benefits during their active service. TheEmployer contributes amounts that, together with member contributions and investment income, would ultimately besufficient toaccumulateassets topaybenefitswhendue.TheOfficeof theActuaryestablishesemployercontributionrateswhich,expressedasapercentageofannualizedcoveredpayroll,remainapproximatelylevelfromyeartoyear.Anadequatefundinglevelprovidesassuranceandsecurityforpaymentoffuturebenefits.Infiscalyear2016,BERSsoughttomaintainaleveloffundingwithintheestablishedguidelinesoftheGovernmentAccountingStandardsBoard(GASB).Thechartbelowsummarizesthecontributionfundingsourcesforfiscalyear2016fortheQPP.
Funding Sources Funds Percentage Contribution (In thousands)
MemberContributions 8.24% $38,581
EmployerContributions 56.71% $265,532
InvestmentIncome 35.05% $164,144
Total 100.00% $468,257
FUNDING SOURCES CHART
Member Contributions
Employer Contributions
Investment Income
56.71%
35.05%
8.24%

New York City Board of Education Retirement System
5
INTR
OD
UCT
OR
Y
ContributionstotheTDAprogramaremadeonavoluntarilybasisbycertainmembersoftheQPP.TDAMemberswhoelecttoparticipateinafixedreturnfundinvestmentprogramaccountsarecreditedwiththestatutoryannualrateofinterest,currently7%formembersrepresentedbytheUnitedFederationofTeachersand8.25%forallothermembers.Memberscanalsoelecttoparticipateinavariablereturnfundprogram.
INVESTMENTS
Investment SummaryTheSystem’sassetsareinvestedintwoinvestmentprograms.Thesearethefixedreturnfund,whichismanagedbyBERS,andthevariablereturnfundconsistingprimarilyofequitysecurities,whichismanagedbytheTeachers’RetirementSystem(TRS).
BERSinvestmentswithinthefixedreturnfund(the“Fund”) increasedinvalueforthefiscalyearendingJune2016withareturnof0.17%comparedto0.75%fortheBoardofEducationPolicyBenchmark,againstwhichitismeasured.Performanceforthefiscalyearrankedinthethirdquartileofapeergroupofpublicfunds.ThevalueofthefixedinvestmentsattheendofFY2016,excludingcollateralsecuritylendingsreached$4.5billioncomparedto$4.4billioninFY2015.Overthe10-yeartimeperiodtheFundremainsaheadofthebenchmark,witha6.31%averageannualreturnversus6.10%forthebenchmark.Duringthefiscalyear,theallocationtoUSandnonUSstockswereadragonperformance. AsofJune2016,thevariableinvestmentsexcludingvariablecollateralsecuritylendings,heldatTRSdecreasedto$452.27millionfrom$465.77millioninFY2015,ora-2.90%decline.DuringFY2016,thevariablereturnfundperformancewas-0.50%versus4.82%duringFY2015.
Investment Description1
AssetallocationisexpectedtobeamajorcontributortotheBERS’fundtotalreturn.TheTrusteesestablishatargetassetmixafterconsideringthelong-termgrowthprospectsofadiversifiedportfolioofinvestmentsandtheexpectedcostsoftheplanparticipants’benefits.DuringFY2016,arevisedinvestmentpolicywasapprovedthat increasedtheallocationtoPrivateEquity,RealEstateand Infrastructurewhile reducingUSequitiesanddevelopedmarketnonUSequities.Thesearelongtermcommitmentsexpectedtoimprovetheriskandreturnprofile of the Fund.We expect that theywill be phased in over several fiscal years as attractive investmentopportunitiesareapproved.TheFund’snewtargetassetmixgoing forwardwillbe72%Equity (including thePrivateandPublicequities,RealEstateandInfrastructure)and28%FixedIncome.Overthelong-terminvestmentfuture,weexpectourrevisedequityallocationtooutperformfixedincomebyasignificantmargin.
ForthefiscalyearendingJune2016,thetotalFixedIncomereturnof4.5%outperformedtheU.S.andnon-US.publicequityreturns.TotalEquityreturnswere-1.6%inFY2016andwereparticularlyresponsiblefortheFund’sunderperformanceversusexpectations.TheFundisprimarilyinvestedinindexfundsfortheU.S.equityallocation,whichhelpedrelativeperformance.TheactiveUSandnonUSequitymanagersdidnotaddtheexpectedlevelsof
1 Michael Wright, Segal Rogerscasey, Report on Investment Activity page 2

New York City Board of Education Retirement System
6
INTR
OD
UCT
OR
Y
outperformanceduringFY2016.Aspartofourongoingmonitoring,wereviewthemanagercontributionsandthestructureoftheFundinordertoachievetheexpectedlevelsofreturns.TheFund’scurrentlevelofdiversificationintoalternativeassetsdidhelpperformance inFY2016as thePrivateEquity,RealEstateand InfrastructureinvestmentsperformedwellfortheFund.However,thecurrentallocationtothosesectorsisnotlargeenoughtooffsettheunderperformanceelsewhereintheportfolio.
Theexpectationisthatglobalgrowthwillbeinconsistentacrossmarketsectorsandcertaingeographicareas.Wewillbeimplementingtheapproveddiversificationsandrebalancingthefundtomitigatethevolatilityfromthesedislocationsandimprovetheconsistencyofoutcomesforthefund.Marketconditionsandfundperformancewillbecloselymonitoredtoaccomplishthegoalofprovidingthebenefitsaspromisedtoparticipants.
Investment PolicyBERS’investmentpolicystatement,ratifiedbytheBoardofTrusteesinJanuary2009andamendedinOctober2011,January2013,February2015andinJune2016addressesinvestmentobjectives,investmentphilosophyand strategy, monitoring and evaluating performance, risk management, security lending protocol and rebalancing investmentmix.Theinvestmentpolicyisavailableuponrequest.
Investment ValuationInvestmentsarereportedatfairvalue.Securitiespurchasedpursuanttoagreementstoresellarecarriedatthecontractprice,exclusiveof interest,atwhichthesecuritieswillberesold.Fairvalueisdefinedasthequotedmarketvalueonthelasttradingdayoftheperiod,exceptfortheInternationalInvestmentFunds(the“IIF”)andAlternativeInvestmentFunds(the“ALTINVF”).TheIIFareprivatefundsofpubliclytradedsecuritieswhicharemanagedbyvariousinvestmentmanagersonbehalfofBERS.FairvalueisdeterminedbyBERSmanagementbasedoninformationprovidedbythevariousinvestmentmanagers.TheinvestmentmanagersdeterminefairvalueusingthelastavailablequotedpriceforeachsecurityownedadjustedbyanycontributionstoorwithdrawalsfromtheFundduringtheperiod.TheALTINVFare investmentsforwhichexchangequotationsarenotreadilyavailableandarevaluedatestimatedfairvalueasdeterminedingoodfaithbytheGeneralPartner(GP).Theseinvestmentsareinitiallyvaluedatcostwithsubsequentadjustmentsthatreflectthirdpartytransactions,financialoperatingresultsandotherfactorsdeemedrelevantbytheGP.FairvalueisdeterminedbyplanmanagementbasedoninformationprovidedbythevariousGP’safterreviewbyanindependentconsultantandthecustodianbankfortheFund.
Noinvestmentinanyonesecurityrepresents5%ormoreofBERSnetpositionheldintrustforbenefits.
ECONOMIC AND MARKET COMMENT2
BERSfiscalyearwasmarkedbyslowgrowthandlowinterestrates.TheFederalReservedidnotraiseinterestratesinFY2016despiteexpectationsatthebeginningoftheyear.TheFederalFundsRateremainedbetween0.25%and0.50%.TheEuropeanCentralBankhelditstargetrefinancingrateat0%,itsmarginallendingrate
2 Michael Wright, Segal Rogerscasey, Report on Investment Activity page 3

New York City Board of Education Retirement System
7
INTR
OD
UCT
OR
Y
at0.25%anditsdepositrateat-0.40%.TheBankofJapanmaintaineditsquantitativeandqualitativeeasingpolicyofpurchasingJapanesegovernmentbondswiththegoalof increasingthemonetarybaseandtolowertheirrates. RealU.S.GDPgrewatanannualizedrateof1.2%throughJune30,2016.PositivecontributorstoGDPincludedpersonal consumption expenditures (PCE) and exports. Inflation remained below the Federal Reserve's 2%objectiveduetodecreasedenergypricesandlower-pricednon-energyimports.TheheadlineseasonallyadjustedConsumerPriceIndex(CPI)*wasup0.84%inQ2,andincreased1.05%onayearoveryearbasis.SeasonallyadjustedCoreCPI,whichexcludesfoodandenergyprices,rose0.58%inQ2,bringingtheyearoveryearcoreCPIincreaseto2.23%.Onanunadjusted12-monthbasisendingJune2016,theenergycomponentfellthemostat-9.4%.Commoditieslessfoodandenergycommoditieswerealsoslightlynegative.Foodandserviceslessenergyserviceswerebothpositive.
AtitsJunemeeting,inadditiontoanannouncementonlowinflation,theFederalOpenMarketCommittee(FOMC)stated the following: a) Economicactivityhasbeenexpandingatanacceleratedpace;b) Thelabormarkethasslowedwithdiminishingemploymentgains;c) Householdspendinghasincreased;andd) Tomaintainanaccommodativepolicy,theFedwillcontinuereinvestingprincipalpaymentsfromholdings
ofagencydebtandagency-mortgage-backedsecurities,andwillkeeprollingovermaturingTreasurysecuritiesatauction.
Inaddition tovariousuncertaintiesabout theUSelections,BrexitandEuropefiscal concerns, theeconomicenvironmentwasnotfavorableforstrongportfolioperformance.TheUSandnonUSstockmarketswerenotasstrongasinprioryears.TheUSstockmarket,asmeasuredbytheRussell3000stockindex,returned2.14%,wellbelowthestrongreturnsinthepriortwofiscalyears.Internationalequityperformancecontinuedinthenegativeterritory forFY2016,as theMSCIEAFEposteda lossof -9.7%.This isnot surprisinggiven theirmoredirectvulnerabilitytofiscalconcernsinEuropeandthepotentialforeconomicinstabilityinAsia.Fixedincomereturnswerepositiveas interestrateshavegenerallydeclinedwiththeBarclaysAggregateIndex,whichrepresentsaproxyofinvestment-gradebonds,returning6.0%forthefiscalyear.
OTHER INFORMATION
Internal ControlTheExecutiveDirector is responsible forestablishingandmaintainingan internal control structuredesignedtoprovidereasonableassurancethattheassetsoftheSystemaresafeguardedandtoensurethatadequateaccountingdataarecompiledtoallowforthepreparationoffinancialstatementsinconformitywithgenerallyaccepted accounting principles. The system’s internal control practices are designed to provide reasonableassurancethattheseobjectivesaremet.

New York City Board of Education Retirement System
8
INTR
OD
UCT
OR
Y
Theconceptofreasonableassurancerecognizesthatthecostofacontrolshouldnotexceedthebenefitslikelytobederivedandthatthevaluationofcostsandbenefitsrequiresestimatesandjudgmentsbymanagement.
Accounting and ReportingThisCAFRhasbeenpreparedinconformitywithprinciplesofgovernmentalaccountingandreporting,promulgatedbytheGovernmentalAccountingStandardsBoard(GASB),andaccordingtoguidelinesadoptedandpublishedbytheGovernmentFinanceOfficersAssociationoftheUnitedStatesandCanada(GFOA).
The QPP, as well as the TDA Program, use the accrual basis of accounting where the measurement focus is on aflowofeconomicresources.Revenuesarerecognizedintheaccountingperiodinwhichtheyareearnedandexpensesarerecognizedintheperiodincurred.Contributionsfrommembersarerecognizedwhenrespectiveemployers make payroll deductions from the QPP members and the TDA Program participants. Employercontributions to the QPP are recognized when due, and the employer has made a formal commitment to provide thecontributions.BenefitsandrefundsarerecognizedwhendueandpayableinaccordancewiththetermsofgoverningtheQPPandtheTDAProgram.
In fiscal year 2015, BERS adopted Governmental Accounting Standards Board (“GASB”) Statement No. 72,Fair Value Measurement and Application.GASB72requirestheSystemtousevaluationtechniqueswhichareappropriateunderthecircumstancesandareeitheramarketapproach,acostapproachoranincomeapproach.TherewasnomaterialimpactontheSystem’sfinancialstatementsasaresultoftheimplementationofGASB72.
Independent AuditThefivemajor retirementsystemsof theCityofNewYorkarerequiredtoundergoanannualauditbyafirmofcertifiedpublicaccountants, inaccordancewithgenerallyacceptedauditingstandards.MarksPanethLLP,whoseopinionispresentedintheFinancialSectionofthisreport,conductedtheauditofthefinancialstatementsofBERSforthefiscalyearendedJune30,2016.ThefiveNewYorkCityretirementsystemsalsoundergoafiveyearauditconductedbytheNewYorkStateDepartmentofFinancialServices.Duringfiscalyear2015,BERSwentthroughanauditcoveringfiscalyear2009thrufiscalyear2014.
Professional ServicesSegal Rogerscasey is a consultant retained by the Retirement Board to perform professional services that are essentialtotheeffectiveandefficientoperationsoftheBERS.
BERS is going through the process of installing Enterprise Resource Planning software, known as the ComprehensivePensionManagementSystem(CPMS).ItisamultiyearprojectandtheservicesofVitechSystemsGroupIncorporated,GTJZConsulting,andKPMGLLPhavebeenretainedtoguideBERS.
TheChiefActuaryprovidesactuarialservicesforthefivemajorpensionsystemsmaintainedbytheCity.TheChiefActuary’sactuarialreportandcertificationareincludedinthisannualreport.TheNewYorkCityComptrollerand

New York City Board of Education Retirement System
9
INTR
OD
UCT
OR
Y
theTeachers’RetirementSystemretaininvestmentmanagerstoassistintheexecutionofinvestmentpolicyinaccordancewithstatutoryauthority,RetirementBoarddecisionsandstandardgoverningfiduciarypractices.
AwardsTheGFOAawardedaCertificateofAchievementforExcellenceinFinancialReportingtotheBERSforitsCAFRforthefiscalyearendedJune30,2015.TheCertificateofAchievementisaprestigiousnationalaward,recognizingconformancewiththehigheststandardsforpreparationofastateandlocalgovernmentfinancereports.
Inorder tobeawardedaCertificateofAchievement,agovernmentunitmustpublishaneasily readableandefficientlyorganizedcomprehensiveannualfinancialreport,whosecontentsconformtoprogramstandards.TheCAFRmustsatisfybothgenerallyacceptedaccountingprinciplesandapplicablelegalrequirements.
ACertificateofAchievementisvalidforaperiodofoneyearonly.BERShasreceivedaCertificateofAchievementoverthelasttwentynineconsecutiveyears.WebelieveourcurrentreportcontinuestoconformtotheCertificateofAchievementprogramrequirementsanditwillbesubmittedtotheGFOA.
AcknowledgmentsThededicatedserviceofthemanagersandstaffofBERSmadethepreparationofthisCAFR,onatimelybasis,possible.Inaddition,ourappreciationisextendedtothosemembersofthestaffsoftheBureausofAccountancyandAssetManagementoftheNewYorkCityComptroller’sOfficeandtheOfficeoftheActuarywhoworkedcloselywiththeBERSpersonnelinthecompilationofthisreport.WehopethatthemembersoftheRetirementBoard,officialsoftheBoardofEducationoftheCityofNewYork,ourmembersandthecitizensoftheCitywillfindthisreportinformativeandhelpful.
Respectfully submitted,
SanfordR.RichExecutiveDirector
BOAR
D OF EDVCATION
CIT
Y OF N E W YORK
New York City Board of Education Retirement System
10
INTR
OD
UCT
OR
Y
New York City Board of EducationRetirement SystemFortheFiscalYearEndedJune30,2016
BOARD OF TRUSTEES
HON.FREDBAPTISTEHON.ISAACCARMIGNANI HON.GENEALCHACONHON.T.ELZORACLEVELANDHON.JOSEPHD’AMICOHON.DEBORAHDILLINGHAMHON.CARMENFARIÑAHON.VANESSALEUNGHON.GARYLINNENHON.KAMILLAHPAYNE-HANKSHON.LORIPODVESKERHON.MILAGROSRODRIGUEZHON.BENJAMINSHULDINERHON.STEPHANIESOTOHON.LAURAZINGMONDHON.MIGUELINAZORRILLA-ARISTY
Prepared By:SanfordR.Rich,ExecutiveDirectorPatrick(Rick)Hederman,DirectorofFiscalOperations
Actuary:SherryS.ChanChief Actuary
Custodian of the Funds:ScottM.Stringer,Comptroller of the City of New York
Headquarters Address:Board of Education Retirement SystemCity of New York65CourtStreet,16thFloorBrooklyn, New York 11201

DirectorFiscal
OperationsPatrick Hederman
DirectorInformationTechnology
Steve Sebili
RecordsManagement
Board of Trustees
Executive DirectorSanford R. Rich
General Counsel (Acting)Alexander Kazazis
Assistant to CounselSharon Koppula
Executive AssistantKaren Wong
Project Management (CPMS)Daniel D. Miller
DirectorAdministration
& Policy (Acting)John Cahalin
DirectorMembership
ServicesMaria Cepin
Directorof
OperationsJohn Cahalin
InternalAuditor
Oleg Aminov
BOAR
D OF EDVCATION
CIT
Y OF N E W YORK
New York City Board of Education Retirement System
11
INTR
OD
UCT
OR
Y
New York City Board of EducationRetirement SystemFortheFiscalYearEndedJune30,2016
ORGANIZATION CHART

BOAR
D OF EDVCATION
CIT
Y OF N E W YORK
New York City Board of Education Retirement System
12
INTR
OD
UCT
OR
Y
New York City Board of EducationRetirement SystemFortheFiscalYearEndedJune30,2016
CONSULTING AND PROFESSIONAL SERVICES
ActuaryOfficeoftheActuary75 Park Place, 9th FloorNewYork,NY10013-6301
AuditorsMarks Paneth, LLP685ThirdAvenueNew York, NY 10017
CPMS ConsultantsGaryTunnicliffe&JackZiegler,LLC KPMGLLP321UnionStreet,#4A 345ParkAvenueBrooklyn,NY11231 NewYork,NY10154
VitechSystemsGroup,Inc. WinmillSoftware401ParkAvenueSouth,12th Floor P.O.Box4595New York, NY 10016 New York, NY 10163
Custodians of FundsOfficeoftheComptroller TeachersRetirementSystem1 Centre Street 55 Water StreetNewYork,NY10007 NewYork,NY10041
Investment ConsultantBuck Consultants, LLC Segal Rogerscasey 485LexingtonAvenue 333West34thStreetNew York, NY 10017 New York, NY 10001

New York City Board of Education Retirement System
INTR
OD
UCT
OR
Y
13

New York City Board of Education Retirement System
This page is intentionally left blank
New York City Board of Education Retirement System
14
FIN
ANCI
AL

New York City Board of Education Retirement SystemNew York City Board of Education Retirement System
15
FIN
ANCI
AL
FINANCIAL• INDEPENDENT AUDITORS’ REPORT 17• MANAGEMENT’S DISCUSSION AND ANALYSIS (UNAUDITED) 19• COMBINING FINANCIAL STATEMENTS • CombiningStatementsofFiduciaryNetPosition 21 • CombiningStatementsofChangesinFiduciaryNetPosition 27 • NotestotheCombiningFinancialStatements 31• REQUIRED SUPPLEMENTARY INFORMATION (UNAUDITED) • ScheduleofChangesinEmployer’sNetPensionLiability and Related Ratios 61 • ScheduleofEmployers’Contributions 62 • ScheduleofInvestmentReturns 64• ADDITIONAL SUPPLEMENTARY INFORMATION • ScheduleofInvestmentExpenses 65 • ScheduleofDirectPaymentstoConsultants 68 • ScheduleofAdministrativeExpenses 69

New York City Board of Education Retirement System
16
FIN
ANCI
AL
This page is intentionally left blank
Headline 1 Headline 2 Headline 3
New York City Board of Education Retirement System
17
FIN
ANCI
AL
Marks Paneth LLP New York 685 Third Avenue New Jersey New York, NY 10017 Pennsylvania P 212.503.8800 Washington, DC F 212.370.3759 markspaneth.com
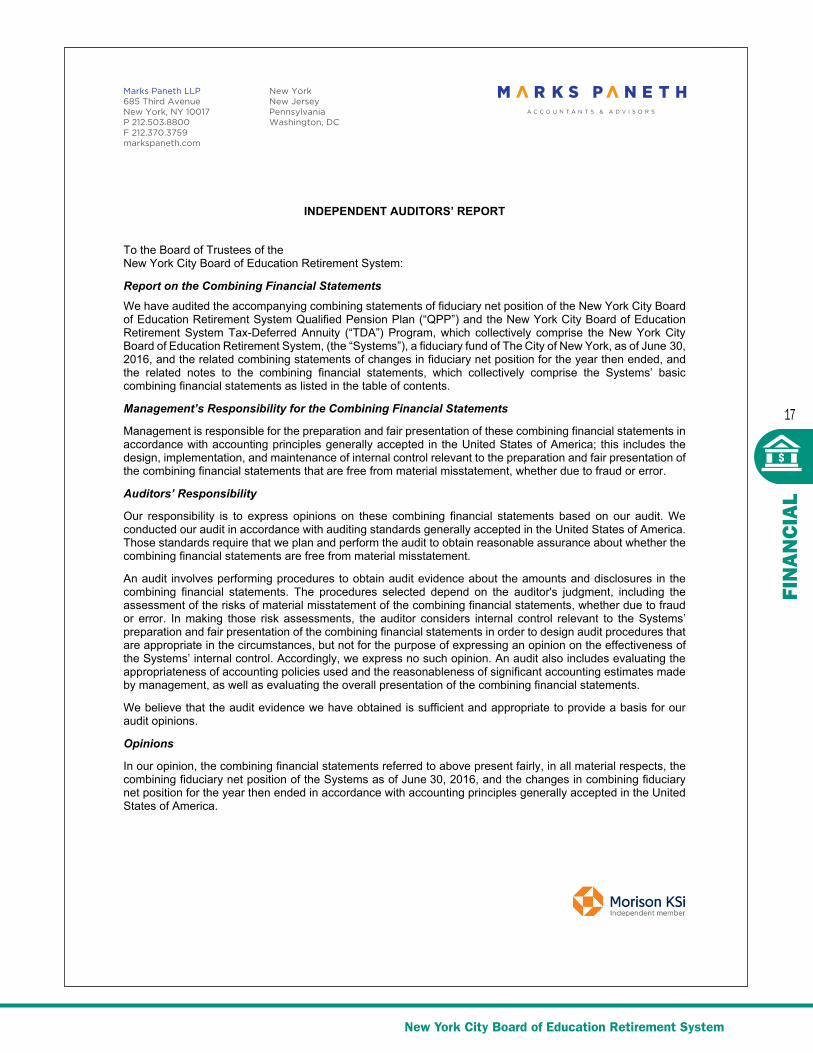
INDEPENDENT AUDITORS’ REPORT
To the Board of Trustees of the New York City Board of Education Retirement System:
Report on the Combining Financial Statements We have audited the accompanying combining statements of fiduciary net position of the New York City Board of Education Retirement System Qualified Pension Plan (“QPP”) and the New York City Board of Education Retirement System Tax-Deferred Annuity (“TDA”) Program, which collectively comprise the New York City Board of Education Retirement System, (the “Systems”), a fiduciary fund of The City of New York, as of June 30, 2016, and the related combining statements of changes in fiduciary net position for the year then ended, and the related notes to the combining financial statements, which collectively comprise the Systems’ basic combining financial statements as listed in the table of contents.
Management’s Responsibility for the Combining Financial Statements
Management is responsible for the preparation and fair presentation of these combining financial statements in accordance with accounting principles generally accepted in the United States of America; this includes the design, implementation, and maintenance of internal control relevant to the preparation and fair presentation of the combining financial statements that are free from material misstatement, whether due to fraud or error.
Auditors’ Responsibility
Our responsibility is to express opinions on these combining financial statements based on our audit. We conducted our audit in accordance with auditing standards generally accepted in the United States of America. Those standards require that we plan and perform the audit to obtain reasonable assurance about whether the combining financial statements are free from material misstatement.
An audit involves performing procedures to obtain audit evidence about the amounts and disclosures in the combining financial statements. The procedures selected depend on the auditor's judgment, including the assessment of the risks of material misstatement of the combining financial statements, whether due to fraud or error. In making those risk assessments, the auditor considers internal control relevant to the Systems’ preparation and fair presentation of the combining financial statements in order to design audit procedures that are appropriate in the circumstances, but not for the purpose of expressing an opinion on the effectiveness of the Systems’ internal control. Accordingly, we express no such opinion. An audit also includes evaluating the appropriateness of accounting policies used and the reasonableness of significant accounting estimates made by management, as well as evaluating the overall presentation of the combining financial statements.
We believe that the audit evidence we have obtained is sufficient and appropriate to provide a basis for our audit opinions.
Opinions
In our opinion, the combining financial statements referred to above present fairly, in all material respects, the combining fiduciary net position of the Systems as of June 30, 2016, and the changes in combining fiduciary net position for the year then ended in accordance with accounting principles generally accepted in the United States of America.

Headline 1 Headline 2 Headline 3
New York City Board of Education Retirement System
18
FIN
ANCI
AL
Prior Period Combining Financial Statements The combining financial statements of the System as of June 30, 2015, were audited by other auditors whose report dated October 29, 2015, expressed unmodified opinions on those combining financial statements. As discussed in Note 9 to the combining financial statements, the System has adjusted its 2015 combining financial statements to retrospectively apply the change in accounting for the allocation of investments between the QPP and TDA.
As part of our audit of the 2015 combining financial statements, we also audited the adjustments to the 2015 combining financial statements to retrospectively apply the change in accounting as described in Note 9. In our opinion, such adjustments are appropriate and have been properly applied. We were not engaged to audit, review, or apply any procedures to the System’s 2015 combining financial statements other than with respect to the adjustments and, accordingly, we do not express an opinion or any other form of assurance on the 2015 combining financial statements as a whole.
Other Matters Required Supplementary Information
Accounting principles generally accepted in the United States of America require that the Management’s Discussion and Analysis, Schedule 1, Schedule 2, and Schedule 3, as listed in the table of contents, be presented to supplement the basic combining financial statements. Such information, although not a part of the basic combining financial statements, is required by the Governmental Accounting Standards Board who considers it to be an essential part of the financial reporting for placing the basic combining financial statements in an appropriate operational, economic, or historical context. We have applied certain limited procedures to the required supplementary information in accordance with auditing standards generally accepted in the United States of America, which consisted of inquiries of management about the methods of preparing the information and comparing the information for consistency with management’s responses to our inquiries, the basic combining financial statements, and other knowledge we obtained during our audit of the basic combining financial statements. We do not express an opinion or provide any assurance on the information because the limited procedures do not provide us with sufficient evidence to express an opinion or provide any assurance.
Other Supplementary Information
Our audit was conducted for the purpose of forming an opinion on the basic combining financial statements. The Introductory Section, Additional Supplementary Information, Investment Section, Actuarial Section, and Statistical Section, as listed in the foregoing table of contents, are present for the purpose of additional analysis and are not a required part of the basic combining financial statements.
The Additional Supplementary Information Schedule 4, Schedule 5 and Schedule 6, as listed in the table of contents, is the responsibility of management and was derived from and relates directly to the underlying accounting and other records used to prepare the basic combining financial statements. Such information has been subjected to the auditing procedures applied in the audit of the basic combining financial statements and certain additional procedures, including comparing and reconciling such information directly to the underlying accounting and other records used to prepare the basic combining financial statements or to the basic combining financial statements themselves, and other additional procedures in accordance with auditing standards generally accepted in the United States of America. In our opinion the Additional Supplementary Information is fairly stated, in all material respects, in relation to the 2016 basic combining financial statements taken as a whole.
The Introductory Section, Investment Section, Actuarial Section, and Statistical Section have not been subjected to the auditing procedures applied in the audit of the basic combining financial statements and, accordingly, we do not express an opinion or provide any assurance on them.
October 31, 2016 (except for the Other Supplementary Information, as to which the date is December 22, 2016)

New York City Board of Education Retirement System
19
FIN
ANCI
AL
Management’s Discussion and Analysis (Unaudited)
For the Years Ended June 30, 2016 and 2015
This narrative discussion and analysis of the New York City Board of Education Retirement Systems (“BERS”orthe“System”)financialperformanceprovidesanoverviewoftheSystem’scombiningfinancialactivitiesfortheFiscalYearsendedJune30,2016and2015.ItismeanttoassistthereaderinunderstandingtheSystem’scombiningfinancialstatementsbyprovidinganoverallreviewofthecombiningfinancialactivitiesduringtheyears,theeffectsofsignificantchanges,andacomparisonoftheprioryears’activitiesandresults.ThisdiscussionandanalysisisintendedtobereadinconjunctionwiththeSystem’scombiningfinancialstatements.TheSystemadministerstheBERSQualifiedPensionPlan(the“QPP”)andtheBERSTax-DeferredAnnuityProgram(the“TDAProgram”).
OVERVIEW OF BASIC COMBINING FINANCIAL STATEMENTS
ThefollowingdiscussionandanalysisisintendedtoserveasanintroductiontotheSystem’sbasiccombiningoffinancialstatements.Thebasiccombiningfinancialstatements,whicharepreparedinaccordancewithGovernmentalAccountingStandardsBoard(“GASB”)pronouncementsandincludethefinancialstatementsoftheQPPandtheTDAProgram,areasfollows:
• The Combining Statements of Fiduciary Net Position —presentsthefinancialpositionoftheSystematfiscalyear-end.Itprovidesinformationabout:thenatureandamountsofresourceswithpresentservicecapacitythattheSystempresentlycontrols(assets);consumptionofnetassetsbytheSystemthatisapplicabletoafuturereportingperiod(deferredoutflowofresources);presentobligationstosacrificeresourcesthattheSystemhaslittleornodiscretiontoavoid(liabilities);andacquisitionofnetassetsbytheSystemthatisapplicabletoafuturereportingperiod(deferredinflowofresources)withthedifferencebetweenassets/deferredoutflowofresourcesandliabilities/deferredinflowofresourcesbeingreportedasnetposition.Investmentsareshownatfairvalue.Allotherassetsandliabilitiesaredeterminedonanaccrualbasis.
• The Combining Statements of Changes in Fiduciary Net Position — presents the results of activitiesduringthefiscalyear.Allchangesaffectingtheassets/deferredoutflowandliabilities/deferredinflowoftheSystemarereflectedonanaccrualbasiswhentheactivityoccurred,regardlessofthetimingoftherelatedcashflows.Inthatregard,changesinthefairvaluesofinvestmentsareincludedintheyear’sactivityasnetappreciation(depreciation)infairvalueofinvestments.
• The Notes to Combining Financial Statements — provide additional information that is essential toafullunderstandingofthedataprovidedinthecombiningfinancialstatements.ThenotespresentinformationabouttheSystem’saccountingpolicies,significantaccountbalancesandactivities,materialrisks,obligations,contingencies,andsubsequentevents,ifany.
• Required Supplementary Information—asrequiredbyGASBincludesthemanagementdiscussionandanalysisandinformationpresentedafterthenotestothecombiningfinancialstatements.

New York City Board of Education Retirement System
20
FIN
ANCI
ALManagement’s Discussion and Analysis (Unaudited) For the Years Ended June 30, 2016 and 2015 (Cont’d)
New York City Board of Education Retirement System
FINANCIAL HIGHLIGHTS
DuringFiscalYear2016,theSystemadoptedcertainchangestotheaccountingpracticestoenhancetheutilityofthefinancialstatements.Thesechangeswereadoptedasaresultofacomprehensiveanalysisof the TDA Program of the System based on a reallocation of investments between the QPP and the TDA Program.Asaresultofthesechanges,FiscalYear2015financialstatementswererestated.TheimpactofthechangespriortoFiscalYear2015hasbeenreportedasapriorperiodadjustmenttothebeginningnetassetsofFiscalYear2015.
QPP Fiduciary Net Position
DuringFiscalYear2016,QPP’snetpositionheldintrustforbenefitsstoodat$3.42billion,adecreaseof1.09%fromFiscalYear2015.ThedecreaseinthenetpositionduringFiscalYear2016wasprimarilydue to lower member contributions and investment returns, combined with the increases in the interests duetomembersofthefixedprogramofTDAProgramoftheSystem,benefitpaymentsandadministrativeexpenses.Membercontributionsandinvestmentreturnsdecreasedby2.48%and7.35%respectively.InterestduetothemembersofthefixedprogramoftheTDAProgramincreasedby11.38%.Benefitpaymentsandadministrativeexpensesincreasedby7.83%and17.00%respectively.
OpeningnetassetsforFiscalYear2015havebeenrestatedtoreflecttheimpactofprioryearchangesasdiscussedaboveanddisclosedinthenotestothefinancialstatements.DuringFiscalYear2015,theQPP’snetpositionheldintrustforbenefitsincreasedto$3.45billion,anetincreaseof$174.74millionor5.33%fromFiscalYear2014.TheincreaseinnetpositionduringFiscalYear2015wasduetoincreasesinmembercontributions,employercontributionsandthefairvalueofinvestments.Themembercontributions, employer contributions and fair value of investments including the collateral security lending, increasedby6.37%,20.28%,and0.87%,respectively.TheQPP’sfairvalueofinvestmentsincludingcollateralsecuritylendingwas$4.78billion,anetincreaseof$41.38million.

New York City Board of Education Retirement System
21
FIN
ANCI
AL
Management’s Discussion and Analysis (Unaudited) For the Years Ended June 30, 2016 and 2015
(Cont’d)
Totalreceivablesincreasedfrom$95.75millioninFiscalYear2015to$166.06millionatthecloseofFiscalYear2016.Theincreaseinthereceivablesisprimarilycausedbytheincreaseinthereceivablesforinvestmentwhichwentupby$68.22million.AlsoincludedinthesereceivablesareQPPmember’soutstandingloansforFiscalYear2016andFiscalYear2015whichwereat$46.75millionand$44.68millionrespectively.Otherassetsincreasedto$124.03millioninFiscalYear2016,from$106.25millioninFiscalYear2015,a16.73%increase.IncludedintheotherassetsisaliabilityfromtheTDAprogramtowardstheQPP,whichstoodat$96.15millionandat$83.90millionforFiscalYears2016and2015respectively.TheliabilitiesrepresentstheadjustmentsmadetotheTDAProgramastheresultoftheaccountingchangesadoptedwithinthecomprehensiveanalysisoftheTDAProgramoftheSystem.TheQPP’sreceivablesandpayablesforinvestmentsareprimarilygeneratedthroughthetimingdifferencesbetweenthetradeandsettlementdatesforinvestmentsecuritiespurchasedorsold.
“TDAProgram’sinterestinthefixedreturnfund”representsaliabilitytotheTDAprogram.Theliabilityof$1.28billionisanobligationoftheCityofNewYorkthroughtheQPP.TheliabilityincludestheTDAmember’saccountbalancesinvestedinthefixedreturnfundandtheTDAProgram’sfixedandvariableannuitants.
QPP Fiduciary Net Position as of June 30, 2016, 2015, and 2014 (In thousands) 2016 2015 (Restated)1 2014
Assets:
Cash $ 327 $ 16,143 $ 8,903
Receivables 166,060 95,756 223,667
Investments,atfairvalue 4,526,973 4,479,080 4,327,245
Collateralfromsecuritieslending 477,623 302,135 412,592
Other 124,031 106,254 14,150
Total assets 5,295,014 4,999,368 4,986,557
Liabilities:
Accountspayable 6,907 6,199 14,783
OtherLiability - - -
Payableforinvestmentspurchased 103,213 86,747 273,978
Accruedbenefitspayable 7,357 5,461 6,816
TDAProgram'sinterestinthefixedreturnfund 1,283,481 1,144,817 999,123
Payables for securities lending 477,623 302,135 412,592
Total liabilities 1,878,581 1,545,359 1,707,292
Netpositionheldintrustforbenefits $3,416,433 $3,454,009 $ 3,279,265 1Restated from prior year

New York City Board of Education Retirement System
22
FIN
ANCI
ALManagement’s Discussion and Analysis (Unaudited) For the Years Ended June 30, 2016 and 2015 (Cont’d)
Changes in QPP Fiduciary Net Position
DuringFiscalYear2016,theQPPmembercontributionsslightlydecreasedto$38.58million,adecreaseof2.48%fromFiscalYear2015contributionof$39.56million.
InFiscalYear2015,themembercontributionsincreasedto$39.56million,a6.37%increasefromthe2014contributionamountof$37.19million.
Changes in QPP Fiduciary Net Position Years Ended June 30, 2016, 2015, and 2014 (In thousands) 2016 2015 (Restated)1 2014Additions: Membercontributions $ 38,581 $ 39,564 $ 37,193 Employercontributions 265,532 258,099 214,590 Netinvestmentincome 160,828 174,503 874,539 Netsecuritieslendingincome 3,316 2,663 914TDAProgram'sinterestincomeinthefixedreturnfund (94,789) (85,104) (206,615)Other — payments to other retirement systems & otherrevenues/expenses (157,499) (52,021) (70,916) Total additions 215,969 337,704 849,705 Deductions: Benefitpaymentsandwithdrawals 240,727 223,244 214,315 Administrativeexpenses 12,818 10,956 9,776 Total deductions 253,545 234,200 224,091 Netincrease(decrease)innetposition (37,576) 103,504 625,614 Netpositionheldintrustforbenefits: Beginningofyear(aspreviouslyreported) - 3,279,265 2,653,651 Prioryearadjustments - 71,240 - Beginning of year balance restated 3,454,009 3,350,505 2,653,651 End of year $ 3,416,433 $ 3,454,009 $ 3,279,2651 Restated from prior year
EmployercontributionsreceivedfortheQPPfortheFiscalYears2016and2015wereat$265.53millionand$258.10million,anincreaseof2.88%.TheemployercontributionforFiscalYear2015increasedby20.28%fromFiscalYear2014.TheFiscalYear2016increaseisprimarilyduetoachangeinthepost-retirement mortality rates, an increase in the amortization payment of the 2010 initial unfunded liability andanetactuarialloss.Theincreaseintheemployercontributionsareprimarilyduetothenetresultofactuarialgainsandlosses.EmployercontributionsaremadeonastatutorybasisbasedontheOne-YearLagmethodology.

New York City Board of Education Retirement System
23
FIN
ANCI
AL
Management’s Discussion and Analysis (Unaudited) For the Years Ended June 30, 2016 and 2015
(Cont’d)
Theinvestmentincomewhichincludesthesecuritylendingincome,decreasedby7.35%inFY2016.InteresttotheTDAProgram’sfixedreturnfundrepresentsaguaranteeof8.25%interestand7%forUFTmembers,DuringFiscalYear2016,theinteresttotheTDAProgram’sfixedreturnfundstoodat$94.79million.
Thebenefitpaymentsandwithdrawalsslightlyincreasedby7.83%inFiscalYear2016,from$223.24millionto$240.73million.DuringFiscalYear2015,planbenefitsandwithdrawalsincreasedby4.17%,from$214.32millionto$223.24million.TheincreaseinFiscalYears2016and2015wasprimarilyduetoanincreaseinthepensionbenefitstoretirees,whichwentup6.12%and4.68%respectively.
Administrativeexpensesaccountshowedanincreaseof17.00%and12.07%inFiscalYears2016and2015.Theincreasewasprimarilyduetohigherpersonnelexpenseswhichincreasedby28.75%and12.46%respectively.
TDA Program Fiduciary Net Position
DuringFiscalYear2016,theTDAProgram’snetpositionheldintrustforbenefitsincreasedto$1.63billion,anetincreaseof$118.72millionor7.85%fromFiscalYear2015.TheincreaseinFiscalYear2016wasprimarilyduetoanincreaseinmembercontributions,whichincreasedby3.43%.
TDA Program Fiduciary Net Position June 30, 2016, 2015, and 2014 (In thousands) 2016 2015 (Restated)1 2014Assets: Cash $ 205 $ 122 $ 2,902 Receivables 40,455 41,264 39,102 TDAProgram'sinterestincomeinthefixedreturnfund 1,283,481 1,144,817 999,123 Investments,atfairvalue 409,776 419,530 403,176 Collateralfromsecuritieslending 15,642 29,607 16,940 Other - - 3,619 Total assets 1,749,559 1,635,340 1,464,862 Liabilities: Accountspayable - - 42 Otherliability 96,156 83,901 - Payableforinvestmentspurchased 902 4,428 3,668 Accruedbenefitspayable 6,783 6,045 6,750 Securitieslendingtransactions 15,642 29,607 16,940 Total liabilities 119,483 123,981 27,400 Netpositionheldintrustforbenefits $ 1,630,076 $ 1,511,359 $ 1,437,4621Restated from prior year

New York City Board of Education Retirement System
24
FIN
ANCI
ALManagement’s Discussion and Analysis (Unaudited) For the Years Ended June 30, 2016 and 2015 (Cont’d)
DuringFiscalYear2015,theTDAProgram’snetpositionheldintrustforbenefitsincreasedto$1.51billion,anetincreaseof$73.89millionor5.14%fromFiscalYear2014.TheincreaseinFiscalYear2015was due to an increase in member contributions and the fair value of investment, which increased by 17.44%and6.91%respectively.
AttheendofFiscalYear2016,theTDAProgram’sfairvalueofvariableinvestmentincludingcollateralsecuritylendingstoodat$425.42million,adecreaseof5.28%fromFiscalYear2015.ReceivablesfromtheQPPtowardstheTDAProgramincreasedby12.11%inFiscalYear2016;from$1.14billionforFiscalYear2015to$1.28billioninFiscalYear2016.
Totalreceivableswentfrom$41.26millioninFiscalYear2015to$40.46millionattheendofFiscalYear2016.TheTDAProgram’smemberloansoutstandingwhichareincludedinthesereceivables,wentfrom$36.51millionatthecloseofFiscalYear2015to$38.92millionatthecloseofFiscalYear2016,a6.61%increase.
TheTDAProgram’sreceivablesandpayablesareprimarilygeneratedthroughthetimingdifferencesbetween the trade and settlement dates for investment securities purchased or sold within the variable returnfund.
OtherliabilityrepresentsaliabilityfromtheTDAProgramtowardstheQPP,whichstoodat$96.15millionandat$83.90millionforfiscalyears2016and2015respectively.Itrepresentstheadjustmentsmadetothe TDA Program as the result of the accounting changes adopted within the comprehensive analysis of theTDAProgramoftheSystem.
Changes in TDA Program Fiduciary Net Position
DuringFiscalYear2016,membercontributionstotheTDAProgramincreasedto$77.46million,a3.43%increasefromthe$74.89millioncontributedinFiscalYear2015.MembercontributionstotheTDAProgramincreasedto$74.89millionduringFiscalYear2015,a17.44%increasefromthe$63.77millioncontributedinFiscalYear2014.

New York City Board of Education Retirement System
25
FIN
ANCI
AL
Management’s Discussion and Analysis (Unaudited) For the Years Ended June 30, 2016 and 2015
(Cont’d)
Changes in TDA Program Fiduciary Net PositionYears Ended June 30, 2016, 2015, and 2014(In thousands)
2016 2015 (Restated)1 2014Additions: Membercontributions $ 77,459 $ 74,890 $ 63,767 Netinvestmentincome 855 22,769 82,136 Netsecuritieslendingincome 194 181 87 TDAProgram'sinterestincomeinthefixedreturnfund 94,789 85,104 206,615 Other — payments to other retirement systems & otherrevenues/expenses (3,541) 4,448 (110,273) Total 169,756 187,392 242,332
Deductions: Benefitpaymentsandwithdrawals 50,189 39,222 40,410 Administrativeexpenses 850 3,033 2,530 Total deductions 51,039 42,255 42,940
Netincreaseinnetposition 118,717 145,137 199,392 Netpositionheldintrustforbenefits: Beginningofyear(aspreviouslyreported) - 1,437,462 1,238,070 Prior year adjustments - (71,240) - Beginning of year balance restated 1,511,359 1,366,222 1,238,070 End of year $ 1,630,076 $ 1,511,359 $ 1,437,4621Restated from prior year
Thebenefitpaymentsandwithdrawalsexperienceda$10.97millionor(27.96%)increasefromJune30,2015toJune30,2016.Thechangewasprimarilyduetoanincreaseindeathbenefitsfrom$4.13millioninFiscalYear2015to$13.29millioninFiscalYear2016.
Thebenefitpaymentsandwithdrawalsexperienceda$1.19million(2.94%)decreasefromJune30,2014toJune30,2015;thedecreaseinFiscalYear2015wasmostlyduetoadecreaseindeathbenefitsof55.28%to$4.13million.

New York City Board of Education Retirement System
26
FIN
ANCI
ALManagement’s Discussion and Analysis (Unaudited) For the Years Ended June 30, 2016 and 2015 (Cont’d)
Investment Summary
InvestmentsheldbyBERS’QPPandTDAProgram(forboththefixedreturnfundandthevariablereturnfund),includingcollateralfromsecuritieslendingtransactionsfrombothprograms,arelistedaccordingtotheirinvestmentclassificationinthefollowingtable:
Investment Summary as of June 30, 2016, 2015, and 2014 (In thousands) Fair Value 2016 2015 2014
ShortTermInvestments $ 113,900 $ 215,612 $ 157,989DebtSecurities 890,152 861,891 791,282U.S.EquitySecurities 726,951 784,214 907,430AlternativeInvestments 506,922 385,819 280,168CollectiveTrustFunds 2,698,824 2,651,074 2,593,552PromissoryNotes - - -Security Lending Transactions 493,265 331,742 429,532 Total $ 5,430,014 $ 5,230,352 $ 5,159,953
BecausetheQPP’sliabilitiesareofalong-termnature,theassetsoftheQPPandtheTDAProgramareinvestedwithalong-terminvestmenthorizon.Assetsareinvestedinadiversifiedportfolioofcapitalmarketsecurities.Investmentsintheseassetsareexpectedtoproducehigherreturns,butarealsosubjecttogreatervolatilityandmayproducenegativereturns.TheSystem’sinvestmentsincreasedby3.82%inFY2016,increasedby1.36%inFiscalYear2015andincreasedby18.29%inFiscalYear2014.In2016and2015greatervolatilityinthemarketsloweddownthereturnoninvestment.In2014,astrongmarketperformancewasthereasonbehindtheseincreases.
CONTACT INFORMATION
ThisfinancialreportisdesignedtoprovideageneraloverviewofTheNewYorkCityBoardofEducationRetirementSystem’sfinances.Questionsconcerninganydataprovidedinthisreportorrequestsforadditional information should be directed to the Chief Accountant, New York City Board of Education Retirement System, 65 Court Street, 16thFloor,andBrooklyn,NewYork11201

New York City Board of Education Retirement System
27
FIN
ANCI
AL
Combining Statements Of Fiduciary Net Position June 30, 2016 (In thousands)
QPP TDA Program Eliminations TotalASSETS: Cash $ 327 $ 205 $ - $ 532 Receivables: Investment securities sold 119,062 908 - 119,970 Accruedinterestanddividends 247 626 - 873 Memberloans 46,748 38,921 - 85,669 Other 3 - - 3 Total receivables 166,060 40,455 - 206,515 Investments — at fair value Fixedreturnfunds: Short term investments: Commercialpaper 71,888 - - 71,888 Short-terminvestmentfund 35,933 - - 35,933 Discountnotes - - - - Debtsecurities 879,762 - - 879,762 Equitysecurities 291,144 - - 291,144 AlternativeInvestments 506,922 - - 506,922 CollectiveTrustFunds Internationalequity 924,911 - - 942,911 DomesticEquity 1,401,665 - - 1,401,665 Mortgagedebtsecurity 28,956 - - 28,956 TreasuryInflationprotectedsecurities 218,608 - - 218,608 FixedIncome 106,684 - - 106,684 Collateralfromsecuritieslending 476,001 - - 476,001 Variablereturnfunds: Shortterminvestments 571 5,508 - 6,079 Debtsecurities 976 9,414 - 10,390 Equities 40,953 394,854 - 435,807 Collateral from securities lending 1,622 15,642 - 17,264 Total investments 5,004,596 425,418 - 5,430,014 TDAProgram'sinterestinthefixedreturnfund - 1,283,481 (1,283,481) - Other assets 124,031 - (96,156) 27,875 Total assets 5,295,014 1,749,559 (1,379,637) 5,664,936 LIABILITIES: Accountspayable 6,907 - - 6,907 Otherliability - 96,156 (96,156) - Payableforinvestmentsecuritiespurchased 103,213 902 - 104,115 Accruedbenefitspayable 7,357 6,783 - 14,140 TDAProgram'sinterestinthefixedreturnfund 1,283,481 - (1,283,481) - Securities lending 477,623 15,642 - 493,265 Total liabilities 1,878,581 119,483 (1,379,637) 618,427 NETPOSITIONHELDINTRUSTFORBENEFITS: BenefitstobeprovidedbyQPP 3,416,433 - - 3,416,433 BenefitstobeprovidedbyTDAProgram - 1,630,076 - 1,630,076 TOTALNETPOSITIONHELDINTRUSTFORBENEFITS: $ 3,416,433 $ 1,630,076 $ - $5,046,509
Theaccompanyingnotesareanintegralpartofthesefinancialstatements.

New York City Board of Education Retirement System
28
FIN
ANCI
ALCombining Statements Of Fiduciary Net Position June 30, 2015 (As Restated) (In thousands)
QPP TDA Program Eliminations TotalASSETS: Cash $ 16,143 $ 122 $ - $ 16,265 Receivables: Investmentsecuritiessold 50,839 4,165 - 55,004 Accruedinterestanddividends 239 590 - 829 Memberloans 44,675 36,509 - 81,184 Other 3 - - 3 Total receivables 95,756 41,264 - 137,020 Investments — at fair value Fixedreturnfunds: Short term investments: Commercialpaper 148,449 - - 148,449 Short-terminvestmentfund 35,597 - - 35,597 Discountnotes 25,996 - - 25,996 Debtsecurities 851,577 - - 851,577 Equitysecurities 334,325 - - 334,325 AlternativeInvestments 385,819 - - 385,819 CollectiveTrustFunds Internationalequity 969,838 - - 969,838 DomesticEquity 1,432,065 - - 1,432,065 Mortgagedebtsecurity 23,862 - - 23,862 TreasuryInflationprotectedsecurities 139,367 - - 139,367 FixedIncome 85,942 - - 85,942 Collateralfromsecuritieslending 298,872 - - 298,872 Variablereturnfunds: Shortterminvestments 553 5,017 - 5,570 Debtsecurities 1,024 9,290 - 10,314 Equities 44,666 405,223 - 449,889 Collateral from securities lending 3,263 29,607 - 32,870 Total investments 4,781,215 449,137 - 5,230,352 TDAProgram'sinterestinthefixedreturnfund - 1,144,817 (1,144,817) - Other assets 106,254 - (83,901) 22,353 Total assets 4,999,368 1,635,340 (1,228,718) 5,405,990 LIABILITIES: Accountspayable 6,199 - - 6,199 Payableforinvestmentsecuritiespurchased 86,747 4,428 - 91,175 Accruedbenefitspayable 5,461 6,045 - 11,506 TDAProgram'sinterestinthefixedreturnfund 1,144,817 - (1,144,817) - Otherliability - 83,901 (83,901) - Securities lending 302,135 29,607 - 331,742 Total liabilities 1,545,359 123,981 (1,228,718) 440,622 NETPOSITIONHELDINTRUSTFORBENEFITS: BenefitstobeprovidedbyQPP 3,454,009 - - 3,454,009 BenefitstobeprovidedbyTDAProgram - 1,511,359 - 1,511,359 TOTALNETPOSITIONHELDINTRUSTFORBENEFITS: $3,454,009 $ 1,511,359 $ - $4,965,368
Theaccompanyingnotesareanintegralpartofthesefinancialstatements.

New York City Board of Education Retirement System
29
FIN
ANCI
AL
Combining Statement Of Changes In Fiduciary Net Position Year Ended June 30, 2016
(In thousands)
QPP TDA Program TotalADDITIONS: Contributions Membercontributions $ 38,581 $ 77,459 $ 116,040 Employer contributions 265,532 - 265,532 Total contributions 304,113 77,459 381,572
Investment income Interestincome 44,782 3,340 48,122 Dividendincome 51,328 5,988 57,316 Net appreciation in fair value of investments 79,014 (7,771) 71,243
Totalinvestmentincome 175,124 1,557 176,681 Less—investmentexpenses (14,296) (702) (14,998)
Net investment income before securities lending transactions 160,828 855 161,683
Securities lending transactions Securitieslendingincome 3,547 216 3,763 Securities lending fees (231) (22) (253) Net securities lending income 3,316 194 3,510
Net investment income 164,144 1,049 165,193
Other — payments to other retirement systems &otherrevenues/expenses (157,499) (3,541) (161,040) TDAProgram'sinterestinthefixedreturnfund (94,789) 94,789 - Total additions 215,969 169,756 385,725 DEDUCTIONS: Benefitpaymentsandwithdrawals 240,727 50,189 290,916 Administrativeexpenses 12,818 850 13,668
Total deductions 253,545 51,039 304,584
NETINCREASEINNETPOSITION (37,576) 118,717 81,141
NETPOSITIONHELDINTRUSTFORBENEFITS:
Beginning of year 3,454,009 1,511,359 4,965,368 End of year $ 3,416,433 $ 1,630,076 $ 5,046,509 Theaccompanyingnotesareanintegralpartofthesefinancialstatements.

New York City Board of Education Retirement System
30
FIN
ANCI
AL Year Ended June 30, 2015 (As Restated) (In thousands)
QPP TDA Program TotalADDITIONS: Contributions Member contributions $ 39,564 $ 74,890 $ 114,454 Employer contributions 258,099 - 258,099 Total contributions 297,663 74,890 372,553 Investment income Interest income 36,898 3,111 40,009 Dividend income 46,207 5,607 51,814 Net appreciation in fair value of investments 101,496 14,804 116,300
Total investment income 184,601 23,522 208,123
Less—investmentexpenses (10,098) (753) (10,851)
Net investment income before securities lending transactions 174,503 22,769 197,272
Securities lending transactions Securitieslendingincome 2,849 201 3,050 Securities lending fees (186) (20) (206) Net securities lending income 2,663 181 2,844
Net investment income 177,166 22,950 200,116
Other — payments to other retirement systems &otherrevenues/expenses (52,021) 4,448 (47,573) TDA Program’sinterestinthefixedreturnfund (85,104) 85,104 - Total additions 337,704 187,392 525,096 DEDUCTIONS: Benefitpaymentsandwithdrawals 223,244 39,222 262,466 Administrativeexpenses 10,956 3,033 13,989
Total deductions 234,200 42,255 276,455
NET INCREASE IN NET POSITION 103,504 145,137 248,641
NETPOSITIONHELDINTRUSTFORBENEFITS:
Beginningofyear(aspreviouslyreported) 3,279,265 1,437,462 4,716,727 Prior year adjustments 71,240 (71,240) - Beginning of year balance restated 3,350,505 1,366,222 4,716,727 End of year $3,454,009 $ 1,511,359 $ 4,965,368 Theaccompanyingnotesareanintegralpartofthesefinancialstatements.

New York City Board of Education Retirement System
31
FIN
ANCI
AL
Notes to Combining Financial Statements
Years Ended June 30, 2016 and 2015
1. SYSTEM DESCRIPTION
TheCityofNewYork(the“City”)maintainsanumberofpensionsystemsprovidingbenefitsforemployeesofitsvariousagencies(asdefinedwithinNewYorkState(“State”)statutesandCitylaws).TheCity’sfivemajoractuarially-fundedpensionsystemsaretheNewYorkCityBoardofEducationRetirementSystem(“BERS”orthe“System”),theNewYorkCityEmployees’RetirementSystem(“NYCERS”),theTeachers’RetirementSystemoftheCityofNewYork(“TRS”),theNewYorkCityPolicePensionFund(“POLICE”),andtheNewYorkFiredepartmentpensionFund(“FIRE”).EachpensionsystemisaseparatePublicEmployeeRetirementSystem(“PERS”)withaseparateoversightbodyandisfinanciallyindependentoftheother
BERSadministerstheBERSQualifiedPensionPlan(the“QPP”)andtheBERSTax-DeferredAnnuityProgram(the“TDAProgram”).BERSisthefiduciaryfortheQPPandtheTDAProgram,whichareincludedunderBERSinthePensionandOtherEmployeeBenefitTrustFundssectionoftheCity’sComprehensiveAnnualFinancialReport(“CAFR”).
TheQPPisacost-sharing,multiple-employerPERS.TheQPPprovidespensionbenefitsfornon-pedagogicalemployeesoftheDepartmentofEducationandcertainotherspecificschoolsandcertainemployeesoftheNewYorkCitySchoolConstructionAuthority(collectively,the“Employer”).Substantially,allDepartmentofEducationnon-pedagogicalpermanentemployees,otherthanmembersofTRS,becomemembersoftheQPPonthefirstdayofpermanentemployment.Employeesclassifiedasnoncompetitive,exemptorprovisionalbyCivilServiceareeligibletoenrollintheQPPvoluntarily.Membershipdateisgovernedbythedateoffiling.
TheQPPfunctionsinaccordancewithexistingStatestatutesandCitylaws,whichestablishandamendthebenefittermsandtheemployerandmembercontributionrequirements.Itcombinesfeaturesofadefinedbenefitpensionplanwiththoseofadefinedcontributionpensionplanbutisconsideredadefinedbenefitpensionplanforfinancialreportingpurposes.Contributionsaremadebytheemployerandthemembers.
AtJune30,2014andJune30,2013,thedatesoftheQPP’smostrecentcompletedactuarialvaluations, the QPP membership consisted of:
2014 2013 Retireesandbeneficiariesreceivingbenefits 15,995 15,455 Terminatedvestedmembersnotyetreceivingbenefits 195 182 Otherinactives* 4,005 4,127 Active members receiving salary 25,182 25,848 Total 45,377 45,612
*Representsmemberswhoarenolongeronpayrollbutnototherwiseclassified.

New York City Board of Education Retirement System
32
FIN
ANCI
ALNotes to Combining Financial Statements Years Ended June 30, 2016 and 2015 (Cont’d)
BERSisafiduciarycomponentunitoftheCity,andisreportedandisincludedintheCity’sComprehensiveAnnualFinancialReportasaPensionandOtherEmployeeBenefitTrustfund.
The TDA Program was created and is administered pursuant to the Internal Revenue Code Section 403(b)andexistingStatestatutesandCitylaws.CertainmembersoftheQPPhavetheoptiontoparticipateintheTDAProgram,whichprovidesameansofdeferringincometaxpaymentsontheirvoluntarytax-deferredcontributionsuntiltheperiodafterretirementoruponwithdrawalofcontributions.ContributionstotheTDAProgramaremadebythemembersonly.TheTDAProgramismaintainedasaseparateplan.
AtJune30,2014andJune30,2013,theTDAProgramparticipantsconsistedof:
2014 2013 Contributingmembers 14,938 14,400 RetiredmemberswithTDAbalances 5,369 4,197 %ofQPPmemberscontributingtoTDA 27% 27%
Summary of Benefits
QPP Benefits
The State Constitution provides that pension rights of public employees are contractual and shall not bediminishedorimpaired.In1973,1976,1983,and2012,significantamendmentsmadetotheStateRetirementandSocialSecurityLaw(“RSSL”)modifiedcertainbenefitsforemployeesjoiningtheQPPonoraftertheeffectivedateofsuchamendments.Assuch,benefitsundertheQPPfallintovariouscategoriesbasedontheyearwhenanemployeejoinedtheQPP.Abriefoverviewfollows:
• MemberswhojoinedpriortoJuly1,1973(“Tier1”)areentitledtoserviceretirementbenefitsof55%of“finalsalary”(asdefinedwithinStatestatutesandCitylaws)after25yearsofqualifyingserviceandattainmentofage55,aportionofwhichisprovidedfrommembercontributions.Additionalbenefitsequaltoaspecifiedpercentageperyearofserviceof“finalsalary”arepayableforyearsinexcessofthe25yearminimum.Theseadditionalbenefitsareincreased,whereapplicable,byanannuityattributabletoaccumulatedmembercontributionsinexcessoftheminimumrequiredbalanceandbyanybenefitsattributabletotheIncreased-Take-HomePay(“ITHP”)contributionsaccumulatedafterthe25thyearofmemberqualifyingservice.ITHPrepresentsamountscontributedbytheCityinlieuofmembers’owncontributions.Theseamounts reduce the contributions that members would have to make to the QPP during their serviceandtherebyincreasetheirtake-homepay.MembershavethechoiceofwaivingtheirITHPreduction,whichwouldreducetheirtake-homepay,butprovidethemwithincreasedbenefitsuponretirement.Tier1memberscontributeonthebasisofanormalrateofcontributionwhichis assigned by the QPP at membership, and which is dependent upon age and actuarial tables in effectatthetimeofmembership.

New York City Board of Education Retirement System
33
FIN
ANCI
AL
Notes to Combining Financial Statements Years Ended June 30, 2016 and 2015
(Cont’d)
• Inaddition,thesesamememberscouldelectaserviceretirementbenefitwithnominimumservicerequirementwhichprovidesanannualbenefitforeachyearofserviceequaltoaspecifiedpercentage(asdescribedwithinStatestatutesandCitylaws)of“finalsalary”,payableuponattainmentofage55.Thisbenefitisincreased,whereapplicable,byanannuityattributabletothemembercontributionsandITHPcontributions.
• ForallmemberswhoenrolledintheQPPpriortoJuly27,1976,ITHPcontributionsmadeontheirbehalfaswellastheirowncontributionsareinvested,attheirelection,ineitherthefixedreturnfundorthevariablereturnfund,or50%ofsuchcontributionsineach.Theseinvestmentelectionscanbechangedeverytwoyears.TheQPPguaranteeda7.5%returnonmembercontributionsorITHPcontributionstothefixedreturnfunduntilJune30,1982,increasedtheguaranteedreturnto8%asofJuly1,1982,andto8.25%asofJuly1,1988,formemberswhoenrolledintheQPPpriortoJuly27,1976(5%onmembercontributionsformembersenrolledonorafterJuly27,1976).ThevariablereturnfundincludesonlymembercontributionsandITHPcontributionsmadeontheirbehalfasdescribedaboveandisexpressedintermsofunits,whicharevaluedmonthly,basedoninvestmentexperience.
• Certain members of Tier 1 and Tier 2 have the right to make voluntary member contributions (“VoluntaryContributions”)inexcessoftheirrequiredmembercontributions(“RequiredContributions”).TheinvestmentoftheVoluntaryContributionsandtheRequiredContributionsisdirectedbyeachmember.Amembermayinvest:(1)intheQPP’sfixedreturnfund,whichiscreditedwithinterestattheStatutoryInterestRate(currently8.25%(7.0%forUFTmembers)),and/or(2)intheQPP’svariablereturnfund.Atthetimeofretirementorrefundofcontributions,amember’saggregatebalanceofactualRequiredContributionsandVoluntaryContributions,including the actual accumulated earnings thereon, less the outstanding balance of any memberloans(“NetActualContributions”),mayexceed(“ExcessofContributions”)orfallshortof(“DeficiencyofContributions”)themember’sExpectedBalance.TheExpectedBalanceisthesumoftheRequiredContributionswhichamembershouldhavemadeduringhisorhercredited service, plus the earnings that would have accumulated thereon at the Statutory Interest rate.Theamountofthemember’sretirementannuityortherefundofcontributionsthatheorsheisentitledtoisincreasedbyanyExcessofContributionsorreducedbyanyDeficiencyofContributions.Thetotalvalueofmembers’ExcessofContributions,netofallDeficienciesofContributions,is$8.98millionand$9.27million,fortheyearsendedJune30,2016and2015,respectively.ActuarialestimatesoftheimpactsofExcessesandDeficienciesareincorporatedintocalculationoftheQPP’snetpensionliability(seeNote5).
• MemberswhojoinedafterJuly1,1973andbeforeJuly27,1976(“Tier2”)haveprovisionssimilartoTier1,exceptthattheeligibilityrequirementsforretirementandthesalarybaseforbenefitsaredifferentandtherewasalimitationontheirmaximumbenefit.ThismaximumbenefitlimitationwassubsequentlyeliminatedunderChapter574oftheLawsof2000forallTier2memberswhoretiredafterDecember8,2000.Tier2memberscontributeonthebasisofanormalrateofcontribution which is assigned by the QPP at membership, and which is dependent upon age and actuarialtablesineffectatthetimeofmembership.

New York City Board of Education Retirement System
34
FIN
ANCI
ALNotes to Combining Financial Statements Years Ended June 30, 2016 and 2015 (Cont’d)
• MemberswhojoinedtheQPPonorafterJuly27,1976andpriortoSeptember1,1983(“Tier3”)wereoriginallyentitledtoaretirementbenefituponthecompletionoftenyearsofserviceatage62.Theformulaforthisbenefitwas1.67%of“FinalAverageSalary”(“FAS”)peryearofcreditedserviceformemberswithlessthan20yearsofservice,or2%ofFASperyearofserviceformemberswith20to30yearsofservice.Tier3benefitswerereducedbyonehalfoftheprimarySocialSecuritybenefitattributabletoservicewiththeemployer,andprovidedanannualcost-of-livingescalatorinpensionbenefitsofnotmorethan3%.Tier3requiredmembercontributionsof3%ofsalaryforaperiodnottoexceed30years.AfterSeptember1,1983,allTier3membersweremandatedintotheTier4plan.However,thesemembersretaintheirTier3rights.EffectiveOctober1,2000,Tier4memberswithTier3rights,likeotherTier4members,arenotrequiredtomakecontributionsoncethetenthanniversaryoftheirmembershipdatehaspassed, or upon completion of 10 years of credited service, whichever is earlier, and are eligible forapensionuponthecompletionoffiveyearsofcreditedserviceatage62.
• MemberswhojoinedtheQPPonorafterSeptember1,1983andpriortoApril1,2012(“Tier4”)areeligibleforapensionuponthecompletionoffiveyearsofcreditedserviceatage62.Theannualbenefitis1.67%ofFASperyearofserviceformemberswithlessthan20yearsofservice,or2%ofFASperyearofserviceformemberswith20to30yearsofservice,plusanadditionof1.5%ofFASperyearofserviceforserviceinexcessof30yearsofservice.Tier4memberswereoriginallyrequiredtomakecontributionsof3%ofsalaryuntilterminationofservice.AsofOctober1,2000,thesemembersarenotrequiredtomakecontributionsafterthetenthanniversaryoftheir membership date or upon completion of ten years of credited service, whichever is earlier (Chapter126ofLawsof2000).Certainmembersretiringpriortotheageof62experienceanage-reductionfactorintheirretirementallowance.
• EffectiveJune28,1995,activeTier2andTier4members,excludingthosewhoholdapositionrepresentedbytherecognizedteacherorganizationforcollectivebargainingpurposes(currently,theUnitedFederationofTeachersor“UFT”),wereeligibletoenrollinanearlyretirementprogrampermittingthemtoretireatage55with25yearsofcreditedservice(“55/25”),withnoagereduction factor to their retirement allowance, or at age 50 with 25 years of credited service in aphysicallytaxingposition(Chapter96oftheLawsof1995).Additionally,Tier4membersinnon-UFTpositionswhojoinedBERSonorafterJune28,1995andbeforeApril1,2012weremandated into an early retirement program permitting them to retire at age 57 with 5 years of creditedservice(“57/5”),withnoagereductionfactortotheirretirementallowance,oratage50with25yearsofcreditedserviceinaphysicallytaxingposition.Participantsinthe55/25and57/5earlyretirementprogramsarerequiredtoremitadditionalcontributionsof1.85%,or3.83%forphysicallytaxingpositions.
• EffectiveFebruary27,2008,activeTier4memberswhoholdapositionrepresentedbytherecognizedteacherorganizationforcollectivebargainingpurposes(currently,UFT)wereeligibletoenroll in an early retirement program permitting them to retire at age 55 with 25 years of credited service(“55/25UFT”),withnoagereductionfactortotheirretirementallowance(Chapter19of

New York City Board of Education Retirement System
35
FIN
ANCI
AL
Notes to Combining Financial Statements Years Ended June 30, 2016 and 2015
(Cont’d)
theLawsof2008).Thosechoosingtheage55retirementoptionarerequiredtomakeadditionalcontributionsof1.85%ofsalaryfromFebruary28,2008untilJune29,2008,oruntiltheyhaveaccumulated25yearsofcreditedservice,whicheverislater.UFTmembersincoveredtitleswhojoinedafterFebruary27,2008butbeforeDecember10,2009,wereautomaticallyenrolledina55retirementageminimumand27creditedyearsofserviceretirementprogram(“55/27UFT”).Thesemembersarerequiredtomakeadditionalplancontributionsof1.85%ofsalaryuntiltheyhaveaccumulated27yearsofcreditedservice.
• UFTmembersincoveredtitleswhojoinedtheQPPafterDecember10,2009andpriortoApril1,2012arecoveredby55/27UFT,butarerequiredtomakecontributionsof4.85%ofsalaryuntiltheyhave27yearsofcreditedservice,andcontributionsof1.85%ofsalarythereafter(Chapter504oftheLawsof2009).Additionally,QPPbenefitsforthispopulationvestin10years,ratherthan5years,asforotherTier4members.
• MemberswhojointheQPPonorafterApril1,2012aresubjecttotheprovisionsofChapter18oftheLawsof2012(“Chapter18/12”),alsoknownas“Tier6”.BERSmembersinTier6areeligibleforapensionuponthecompletionoftenyearsofcreditedserviceatage63.Theannualbenefitis1.67%ofFASforthefirst20yearsofcreditedservice,plusanadditionof2%ofFASperyearofserviceforserviceinexcessof20yearsofservice.Additionally,theFASperiodis5years,ratherthan3,andacapisimposedonthemaximumpermissibleFAS.Tier6membersarerequiredtomakeBasicMemberContributions(“BMC”)untiltheyseparatefromserviceoruntiltheyretire.TheBMCrateisdependentonannualwagesearnedduringaplanyearandrangesfrom3%forsalarieslessthan$45,000to6%forsalariesgreaterthan$100,000.Tier6membersbecomevestedaftertenyearsofservice.
• Under all service retirement categories, annuities attributable to member contributions are reduced on an actuarial basis for any loans with unpaid balances outstanding at the date of retirement.
• Subjecttocertainconditions,membersbecomefullyvestedastoQPPbenefitsuponthecompletionoffiveyearsofcreditedservice,ortenyearsofcreditedserviceforTier455/27UFTmemberswhojoinedafterDecember10,2009andforTier6members.
• TheQPPprovidesdeathbenefitsandretirementbenefitsontheoccurrenceofaccidentalorordinarydisability.
• During the spring 2000 session, the State Legislature approved and the State Governor (“Governor”)signedlawsthatprovideautomaticCost-of-LivingAdjustments(“COLA”)forcertainretireesandbeneficiaries(Chapter125oftheLawsof2000).Italsoprovidesadditionalservicecredits for certain Tier 1 and Tier 2 members and reduced member contributions for certain Tier 3 andTier4members(Chapter126oftheLawsof2000).
New York City Board of Education Retirement System
36
FIN
ANCI
ALNotes to Combining Financial Statements Years Ended June 30, 2016 and 2015 (Cont’d)
TDA Program Benefits
ContributionstotheTDAProgramaremadebytheparticipantsonly,andarevoluntary.InordertocontributetotheTDAProgram,certainactivemembersoftheQPParerequiredtosubmitasalaryreductionagreementandTDAenrollmentrequest.Aparticipantmayelecttoexcludeanamountofhisorhercompensationfromcurrenttaxableincome(withinthemaximumallowedbytheInternalRevenueService)bycontributingittotheTDAProgram.Thebasiccontributionlimit,asof2016,is$18,000certainparticipantsarepermittedtomakeadditionalcontributions,basedonageoryearsofservice.Theadditionalcontributionlimitfor2016is$6,000.Additionally,participantscanelecttoinvesttheircontributionsineitherthefixedreturnfundorthevariablereturnfund.
BenefitsprovidedundertheTDAProgramarederivedfromparticipants’accumulatedcontributionsandearningsonthosecontributions.Nocontributionsareprovidedbytheemployer.
A participant may withdraw all or part of the balance of his or her account at the time of retirement, terminationofemployment,orundercertainhardshipconditions.BeginningJanuary1,1989,thetaxlaws restricted withdrawals of TDA contributions and accumulated earnings thereon for reasons other thanretirementortermination.
ContributionsmadeafterDecember31,1988,andinvestmentearningscreditedafterthatdate,mayonlybewithdrawnbyactiveparticipantsuponattainmentofage59½orforreasonsofhardship(asdefinedbyInternalRevenueServiceregulations).Hardshipwithdrawalsarelimitedtocontributionsonly.
ContributionsmadeonorbeforeDecember31,1989,andearningscreditedonorbeforethatdate,maybewithdrawnbyactiveparticipantsevenbeforeage59½.AmemberwhohasreceivedawithdrawalmaynotcontributetotheTDAProgramfortheremainderofthecurrentyear.
If a member dies in active service, or after retirement while his or her TDA account is in deferral, the fullvalueofhisorheraccountatthedateofdeathispaidtothemember’sbeneficiary(ies)orestate.
When a member resigns before attaining vested rights under the QPP, he or she may withdraw the valueofhisorherTDAProgramaccount,orleavethefundsintheaccountforaperiodofuptofiveyearsafterthedateofresignation.IfamemberresignsafterattainingvestedrightsundertheQPP,heor she may leave his or her funds in the TDA Program account, accruing earnings until reaching the ageatwhichminimumdistributionsarerequiredbyIRSregulations.Onceamemberwithdrawsfromthe QPP, participation in the TDA Program will cease, and the member will receive a refund of the value ofhisorheraccountintheTDAProgram.

New York City Board of Education Retirement System
37
FIN
ANCI
AL
Notes to Combining Financial Statements Years Ended June 30, 2016 and 2015
(Cont’d)
When a TDA Program participant applies to retire from the QPP and has a positive TDA Program account balance, the participant has three options:
a. Theparticipantmaywithdrawthetotalbalance,eitherbyreceivingitasataxabledistributionorbyrollingitoverintoanIndividualRetirementAccount(IRA);
b. Theparticipantmaydeferdistributionoftheaccount;orc. Theparticipantmayelecttoreceivethebalanceoftheaccountasalifeannuity.Theavailable
benefitoptionsdependonthemember’sTier.
2. SUMMARY OF SIGNIFICANT ACCOUNTING POLICIES AND SYSTEM ASSET MATTERS
Basis of Accounting — The QPP as well as the TDA Program use the accrual basis of accounting wherethemeasurementfocusisonaflowofeconomicresources.Revenuesarerecognizedintheaccountingperiodinwhichtheyareearnedandexpensesarerecognizedintheperiodincurred.Contributions from members are recognized when respective employers make payroll deductions fromtheQPP’smembersandtheTDAProgramparticipants.EmployercontributionstotheQPParerecognizedwhendue,andtheemployerhasmadeaformalcommitmenttoprovidethecontributions.BenefitsandrefundsarerecognizedwhendueandpayableinaccordancewiththetermsofgoverningtheQPPandtheTDAProgram.
Investment Valuation —Investmentsarereportedatfairvalue.Securitiespurchasedpursuanttoagreementstoresellarecarriedatthecontractprice,exclusiveofinterest,atwhichthesecuritieswillberesold.Fairvalueisdefinedasthequotedmarketvalueonthelasttradingdayoftheperiod,exceptfortheShort-TermInvestmentfund(“STIF”)(amoneymarketfund),InternationalInvestmentfunds(“IIF”)andAlternativeInvestmentfunds(“ALTINVF”).TheIIFareprivatefundsofpubliclytradedsecuritieswhicharemanagedbyvariousinvestmentmanagersonbehalfofBERS.Fairvalueis determined by BERS management based on information provided by the various investment managers.Theinvestmentmanagersdeterminefairvalueusingthelastavailablequotedpriceforeachsecurityownedadjustedbyanycontributionstoorwithdrawalsfromthefundduringtheperiod.TheALTINVFareinvestmentsforwhichexchangequotationsarenotreadilyavailableandarevaluedatestimatedfairvalueasdeterminedingoodfaithbytheGeneralPartner(“GP”).Theseinvestmentsareinitiallyvaluedatcostwithsubsequentadjustmentsthatreflectthirdpartytransactions,financialoperatingresultsandotherfactorsdeemedrelevantbytheGP.FairvalueisdeterminedbyBERSmanagementbasedoninformationprovidedbythevariousGP’safterreviewbyanindependentconsultantandthecustodianbankforthefund.
Purchasesandsalesofsecuritiesarereflectedonthetradedate.Dividendincomeisrecordedontheex-dividenddate.Interestincomeisrecordedasearnedonanaccrualbasis.
Noinvestmentinanyonesecurityrepresents5%ormoreofQPP’snetpositionheldintrustforbenefits.

New York City Board of Education Retirement System
38
FIN
ANCI
ALNotes to Combining Financial Statements Years Ended June 30, 2016 and 2015 (Cont’d)
Investment Programs—TheSystem’sassetsareinvestedintwoinvestmentprograms.Thesearethefixedreturnfund,whichismanagedbyBERS,andthevariablereturnfundconsistingprimarilyofequitysecurities,whichismanagedbyTRS.
Underthefixedreturnprogram,members’TDAProgramaccountsarecreditedwiththestatutoryrateofinterest,currently7%forUFTmembersand8.25%forallothermembers.TDAProgrammembersandcertainTier1and2QPPmembersmaytransfertheirbalancesbetweenthefixedreturnfundandthevariableinvestmentfundonaquarterlybasis.
TheQPP’sassetswithinthevariablereturnfundareco-investedwiththoseassetsoftheTDAProgramthatareearmarkedforthevariablereturnfund.ThesefinancialstatementsreflecttheQPPinvestmentactivityinthefixedreturnfund;aswellasthevariablereturnfund.
Income Taxes —IncomeearnedbytheQPPandtheTDAProgramisnotsubjecttofederalincometaxuntilitisnormallydistributed.Othertaxesapplyincaseofprematuredistributions.
Accounts Payable—Accounts payable is principally comprised of amounts owed by BERS for overdrawn bankbalances.BERS’spracticeistofullyinvestcashbalancesinmostbankaccountsonadailybasis.Overdrawnbalancesresultprimarilyfromoutstandingbenefitchecksthatarepresentedtothebanksforpaymentonadailybasisandthesebalancesareroutinelysettledeachday.
TDA Program’s interest income in the fixed return fund — The statutory interest credited on the TDA Programmemberaccountbalancesinvestedinthefixedreturnfundisreportedasthe“TDAprogram’sinterestincomeinthefixedreturnfund”.
Securities Lending Transactions — State statutes and Board policies permit the System to lend itsinvestmentstobroker-dealersandotherentitiesforcollateral,forthesamesecuritiesinthefuture with a simultaneous agreement to return the collateral in the form of cash, treasury and U.S.Governmentsecurities.TheSystem’sagentlendsthefollowingtypesofsecurities:shorttermsecurities,commonstocks,long-termcorporatebonds,U.S.GovernmentandU.S.Governmentagencybonds,asset-backedsecurities,andinternationalequitiesandbondsheldincollectiveinvestmentfunds.Inreturn,theSystemreceivescollateralintheformofcash,U.S.TreasuryandU.S.Governmentagencysecuritiesat100%to105%oftheprincipalplusaccruedinterestforreinvestment.AtJune30,2016and2015,managementbelievesthattheSystemhadnocreditriskexposuretoborrowersbecausetheamountstheSystemowedtheborrowersequaledorexceededtheamountstheborrowersowedtheSystem.ThecontractswiththeSystem’sCustodianrequiretheSecuritiesLendingAgenttoIndemnifytheSystem.Inthesituationwhenaborrowergoesintodefault,theAgentwillliquidatethecollateraltopurchasereplacementsecurities.AnyshortfallbeforethereplacementsecuritiescostandthecollateralvalueiscoveredbytheAgent.AllSecuritiesloanscanbeterminatedondemandwithinaperiodspecifiedineachagreementbyeithertheSystemortheborrowers.CashcollateralisinvestedbythesecuritieslendingagentusingapprovedLender’sInvestmentguidelines.Theweightedaveragematurityis46.37days.

New York City Board of Education Retirement System
39
FIN
ANCI
AL
Notes to Combining Financial Statements Years Ended June 30, 2016 and 2015
(Cont’d)
The securities lending program in which the System participates only allows pledging or selling securitiesinthecaseofborrowerdefault.
GASBStatementNo.28,Accounting and Financial Reporting for Securities Lending Transactions, requiresthatsecuritiesloanedasassetsandrelatedliabilitiesbereportedinthestatementsofplannetposition.Cashreceivedascollateralonsecuritieslendingtransactionsandinvestmentsmadewiththatcasharereportedasassets.Securitiesreceivedascollateralarealsoreportedasassetsifthegovernmententityhastheabilitytopledgeorsellthemwithoutaborrowerdefault.Accordingly,the System recorded the investments purchased with the cash collateral as collateral from securities lendingwithacorrespondingliabilityforsecuritieslending.Securitiesonloanarecarriedatfairvalue,thevaluesreportedbytheQPPasofJune30,2016and2015are$463.29millionand$302.14million,respectively.Asofnetpositiondate,thematuritiesoftheinvestmentsmadewithcashcollateralonaverageexceedthematuritiesofthesecuritiesloansbyapproximately30days.
New Accounting Standards Adopted — inFiscalYear2015,BERSadoptedGovernmentAccountingStandardsBoard(“GASB”)StatementNo.72, Fair Value Measurement and Application. GASB 72 requirestheSystemtousevaluationtechniqueswhichareappropriateunderthecircumstancesandareeitheramarketapproach,acostapproachorincomeapproach.GASB72establishesahierarchyofinputsusedtomeasurefairvalueconsistingofthreelevels.Level1inputsarequotedpricesinactivemarketsforidenticalassetsorliabilities.Level2inputsareinputs,otherthanquotedpricesincludedwithinLevel1thatareobservablefortheassetorliability,eitherdirectlyorindirectly.Level3inputsareunobservableinputs,andtypicallyreflectmanagement’sestimatesofassumptionsthatmarketparticipantswoulduseinpricingtheassetorliability.GASB72alsocontainsnotedisclosurerequirementsregardingthehierarchyofvaluationinputsandvaluationtechniquesthatwasusedforthefairvaluemeasurements.TherewasnomaterialimpactontheSystem’sfinancialstatementsasaresultoftheimplementationofGASB72.
3. INVESTMENTS AND DEPOSITS
TheComptrolleroftheCityofNewYork(the“Comptroller”)actsasaninvestmentadvisortoBERS.Inaddition,BERSemploysanindependentinvestmentconsultantasaninvestmentadvisor.BERSutilizesseveralinvestmentmanagerstomanagethelong-termdebtandequityportfolios.Themanagersare regularly reviewed, with regard to both their investment performance and their adherence to investmentguidelines.
TheBERSinvestmentpolicystatementwasratifiedbytheBoardofTrusteesinJanuary2009andamendedinOctober2011January2013,February2015andJune2016.Itaddressesinvestmentobjectives, investment philosophy and strategy, monitoring and evaluating performance, risk management,securitylendingprotocol,andrebalancinginvestmentmix.Assetsmaybeinvestedinfixedincome,equityandothervehiclesaspermittedbyNewYorkStateRSSL§176-178(a)andBankingLaw§235,theNewYorkCityAdministrativeCode,andtheLegalInvestmentsforNewYorkSavingsBankslistaspublishedbytheNewYorkStateBankingDepartment.However,investmentsupto25%oftotalSystemassetsmaybemadeininstrumentsnotexpresslypermittedbytheRSSL.

New York City Board of Education Retirement System
40
FIN
ANCI
ALNotes to Combining Financial Statements Years Ended June 30, 2016 and 2015 (Cont’d)
The System does not possess an investment risk policy statement, nor does it actively manage its assetstospecifiedrisktargets.Rather,investmentriskmanagementisaninherentfunctionoftheSystem’sassetallocationprocess.QPPandTDAProgramassetsarediversifiedoverabroadrangeofassetclassesandencompassmultipleinvestmentstrategiesaimedatlimitingconcentrationrisk.
StateStreetBankandTrustCompanyistheprimarycustodianforthefixedreturnfund.ThevariablereturnfundassetsareheldincustodyatChaseBank.
CashdepositsareinsuredbytheFederalDepositInsuranceCorporationforupto$250,000permemberoftheSystemandare,therefore,fullyinsured.
Concentration of Credit Risk — The System does not have any investments in any one entity that represent5%ormoreoftheSystem’snetpositionheldintrustforbenefits.
ThelegalrequirementsfortheSystem’sinvestmentsareasfollows:
A. Fixedincome,equityandotherinvestmentsmaybemadeaspermittedbyNewYorkStateRSSL§§176-178(a)andBankingLaw§235,theNewYorkCityAdministrativeCode,andtheLegal Investments for New York Savings Banks list as published by The New York State Banking Department,subjecttoNote3(b).
b. Investmentsupto25%oftotalpensionfundassetsmaybemadeininstrumentsnotexpresslypermittedbytheStateRSSL.
TheinformationreflectedinthecreditratingsandintheYearstoMaturityisderivedfromtheCustodian’sRiskandPerformanceAnalyticsReportingSystem.SuchinformationispreparedasaresultoftheCustodian’sRiskManagementAnalysis.

New York City Board of Education Retirement System
41
FIN
ANCI
AL
Notes to Combining Financial Statements Years Ended June 30, 2016 and 2015
(Cont’d)
S&P Quality Ratings Investment Type* CCC & Not June 30, 2016 AAA AA A BBB BB B Below Rated Total
U.S.Government - % - % - % - % - % - % - % - % - %Corporatebonds 2.23 3.27 13.13 24.35 14.67 15.67 6.52 4.58 84.42Short term:Commercialpaper - - - - - - - 11.47 11.47Pooledfund - - - - - - - 4.11 4.11Discount notes andT-bills - - - - - - - - -
Portfolio 2.23% 3.27% 13.13% 24.35% 14.67% 15.67% 6.52% 20.16% 100.00% S&P Quality Ratings Investment Type* CCC & Not June 30, 2015 AAA AA A BBB BB B Below Rated Total
U.S.Government - % - % - % - % - % - % - % - % - %Corporatebonds 1.82 2.23 11.64 20.17 11.76 14.41 4.61 3.53 70.17Short term:Commercialpaper - - - - - - - 22.03 22.03Pooledfund - - - - - - - 3.94 3.94Discount notes andT-bills - - - - - - - 3.86 3.86
Portfolio 1.82% 2.23% 11.64% 20.17% 11.76% 14.41% 4.61% 33.36% 100.00%
* U.S.Treasurybonds,notesandtreasury-inflationprotectedsecuritiesareobligationsoftheU.S.governmentorexplicitlyguaranteedby theU.S.governmentandthereforenotconsideredtohavecreditriskandarenotincludedabove.
Credit Risk —PortfoliosotherthanU.S.Governmentandrelatedportfolioshavecreditratinglimitations.InvestmentgradeportfoliosarelimitedtomostlyratingsofBBBandaboveexceptthattheyarealsopermitteda10%maximumexposuretoBB&Bratedsecurities.Whilenon-investmentgrademanagersareprimarilyinvestedinBB&Bratedsecurities,theycanalsoinvestupto7%oftheirportfolioinsecuritiesratedCCC.Nonratedsecurities,excludingshort-termsecurities,areconsideredtobenon-investmentgrade.Thequalityratingsofinvestmentsofthefixedreturnfund,bypercentageoftheratedportfolio,asdescribedbynationallyrecognizedstatisticalratingorganizations,atJune30,2016 and 2015 are as follows:

New York City Board of Education Retirement System
42
FIN
ANCI
ALNotes to Combining Financial Statements Years Ended June 30, 2016 and 2015 (Cont’d)
S&P Quality Ratings Investment Type* CCC & Not Variable Funds AAA AA A BBB BB B Below Rated Total June 30, 2016
Government - % - % - % - % - % - % - % - % - %Corporatebonds 2.35 1.37 6.82 12.40 5.94 2.81 - 19.43 51.12Yankeebonds - - - - - - - 0.06 0.06Municipalbonds - 0.24 - - - - - - 0.24U.S.Agencies - 1.37 - - - - - - 1.37Short-term:MoneyMarketFunds - - - - - - - 47.21 47.21
Percent of ratedPortfolio 2.35% 2.98% 6.82% 12.40% 5.94% 2.81% 0.00% 66.70% 100.00%
S&P Quality Ratings Investment Type* CCC & Not Variable Funds AAA AA A BBB BB B Below Rated Total June 30, 2015
Government - % - % - % - % - % - % - % - % - %Corporatebonds 1.83 1.95 10.93 12.57 5.69 2.66 0.32 15.67 51.62Yankeebonds - 0.45 - 0.06 - - - - 0.51Municipalbonds - 0.03 0.20 - - - - - 0.23U.S.Agencies - 0.50 - - - - - - 0.50Short-term:MoneyMarketFunds - - - - - - - 47.14 47.14
Percent of ratedPortfolio 1.83% 2.93% 11.13% 12.63% 5.69% 2.66% 0.32% 62.81% 100.00%
* U.S.Treasurybonds,notesandtreasury-inflationprotectedsecuritiesareobligationsoftheU.S.governmentorexplicitlyguaranteedby theU.S.governmentandthereforenotconsideredtohavecreditriskandarenotincludedabove.
Custodial Credit Risk — Depositsareexposedtocustodialcreditriskiftheyareuninsuredanduncollateralized.Custodialcreditriskistheriskthat,intheeventofafailureofthecounterparty,the System will not be able to recover the value of its investment or collateral securities that are in thepossessionofanoutsideparty.Investmentsecuritiesareexposedtocustodialcreditriskifthesecurities are uninsured, are not registered in the name of the System, and are held by either the counterpartyorthecounterparty’strustdepartmentoragentbutnotintheSystem’sname.
ConsistentwiththeSystem’sinvestmentpolicy,theinvestmentsareheldbytheSystem’scustodianandregisteredintheSystem’sname.
AlloftheSystem’sdepositsareinsuredandarecollateralizedbysecuritiesheldbyafinancialinstitutionseparatefromtheSystem’sdepositoryfinancialinstitution.
AlloftheSystem’ssecuritiesareheldbytheSystem’scustodialbankintheSystem’sname.
Thequalityratingsofinvestmentsofthevariablereturnfund,bypercentageoftheratedportfolio,asdescribedbynationallyrecognizedstatisticalratingorganizations,atJune30,2016and2015,areasfollows:

New York City Board of Education Retirement System
43
FIN
ANCI
AL
Notes to Combining Financial Statements Years Ended June 30, 2016 and 2015
(Cont’d)
Interest Rate Risk — Interest rate risk is the risk that the fair value of investments could be adversely affectedbythechangeininterestrates.Durationlimitsareusedtocontroltheportfoliosexposuretointerestratechanges.IntheinvestmentgradecoreFixedIncomeportfoliosdurationislimitedtoarangeofoneyearshorterthanthebenchmarkdurationto0.75yearslongerthanthedurationofthebenchmarkindices.Durationrangeisameasureoftheoverallportfolio,whilestatementsofthestatedmaturityreflectthespecificmaturitiesoftheindividualsecuritiesheld.TheSystemhasnoformalriskpolicy.Thelengthsofinvestmentmaturitiesforfixedreturnfund(inyears),asshownbythepercentoftheratedportfolio,atJune30,2016and2015areasfollows:
Years to Maturity Investment Maturities Investment Type Fair Less Than One to Five Six to Ten More ThanJune 30, 2016 Value One Year Years Years Ten Years
U.S.Government 35.90% 0.09% 2.11% 6.62% 27.08%Corporatebonds 54.11 1.60 15.70 20.93 15.88Short term: Commercialpaper 7.36 7.36 - - - Pooledfund 2.63 2.63 - - - DiscountnotesandT-bills - - - - - Percent of rated portfolio 100.00% 11.68% 17.81% 27.55% 42.96%
Years to Maturity Investment Maturities Investment Type Fair Less Than One to Five Six to Ten More Than June 30, 2015 Value One Year Years Years Ten Years
U.S.Government 35.99% 1.21% 4.44% 5.25% 25.09%Corporatebonds 44.91 1.62 11.25 18.72 13.32Short term: Commercialpaper 14.10 14.10 - - - Pooledfund 2.52 2.52 - - - DiscountnotesandT-bills 2.48 2.48 - - - Percent of rated portfolio 100.00% 21.93% 15.69% 23.97% 38.41%

New York City Board of Education Retirement System
44
FIN
ANCI
ALNotes to Combining Financial Statements Years Ended June 30, 2016 and 2015 (Cont’d)
Thelengthsofinvestmentmaturities(inyears)ofthevariablereturnfund,asshownbythepercentoftheratedportfolio,atJune30,2016and2015areasfollows:
Years to Maturity Investment Maturities Investment Type Fair Less Than One to Five Six to Ten More ThanJune 30, 2016 Value One Year Years Years Ten Years
U.S.Government 24.27% 0.14% 23.53% 0.60% -%Corporatebonds 38.71 2.23 26.60 5.14 4.74YankeeBonds 0.05 - 0.05 - -MunicipalBonds 0.18 0.16 0.02 - -U.S.Agencies 1.04 - 1.04 - -Short term: Money Market 35.75 35.75 - - - Percent of rated portfolio 100.00% 38.28% 51.24% 5.74% 4.74%
Years to Maturity Investment Maturities Investment Type Fair Less Than One to Five Six to Ten More Than June 30, 2015 Value One Year Years Years Ten Years
U.S.Government 20.22% 0.22% 19.93% 0.07% -%Corporatebonds 41.12 2.49 25.56 7.07 6.00YankeeBonds 0.41 - 0.26 0.15 -MunicipalBonds 0.18 - 0.18 - -U.S.Agencies 0.51 0.13 0.38 - -Short term: Money Market 37.56 37.56 - - - Percent of rated portfolio 100.00% 40.40% 46.31% 7.29% 6.00%

New York City Board of Education Retirement System
45
FIN
ANCI
AL
Notes to Combining Financial Statements Years Ended June 30, 2016 and 2015
(Cont’d)
Foreign Currency Risk —Foreigncurrencyriskistheriskthatchangesintheexchangerateswilladverselyimpactthefairvalueofaninvestment.Currencyriskispresentinunderlyingportfoliosthatinvestinforeignstockand/orbonds.Thecurrencymarketshaveproventobegooddiversifiersinatotalportfoliocontext;therefore,theSystemhasnumerousmanagersthatinvestglobally.Ingeneral,currencyexposureisviewedasabenefitforitsdiversificationreasonsandnotasaninherentriskwithintheportfolio.TheSystemhasnoformalriskpolicy.
Inaddition,theSystemhasinvestmentsinforeignstocksand/orbondsdenominatedinforeigncurrencies.TheSystem’sforeigncurrencyexposuresasofJune30,2016and2015inthefixedreturnfundareasfollows(amountsinthousandsofU.S.dollars):Trade Currency 2016 2015AustralianDollar $ 13,121 $ 16,352BrazilianReal 23,754 25,734BritishPndSterling 112,906 119,481CanadianDollar 16,420 14,451ColombianPeso 275 -DanishKrone 19,128 14,668EgyptianPound 438 646EuroCurrency 165,129 181,382HongKongDollar 85,205 92,496HungarianForint 94 803IndianRupee 32,811 30,616IndonesianRupiah 8,079 5,742Israeli Shekel 596 573 JapaneseYen 123,143 119,093MalaysianRinggit 7,958 6,683MexicanNuevoPeso 7,085 10,081Moroccan Dirham 1 1 NewTaiwanDollar 21,844 31,208NewZealandDollar 1,868 1,673NorwegianKrone 11,699 12,341Pakistan Rupee 7 6 PhilippinesPeso 1,848 1,557PolishZloty 5,483 6,354RenminbiYuan 553 (2)QatariRial 2,416 2,858SingaporeDollar 18,414 16,994SouthAfricanRand 19,462 21,136SouthKoreanWon 50,175 40,982SwedishKrona 29,410 31,624SwissFranc 49,253 51,270ThaiBaht 14,555 12,165TurkishLira 9,535 8,022UAE Dirham 927 50
Total $ 853,592 $ 877,040

New York City Board of Education Retirement System
46
FIN
ANCI
ALNotes to CombiningFinancial Statements Years Ended June 30, 2016 and 2015 (Cont’d)
TheforeigncurrencyexposuresofthevariablereturnfundsasofJune30,2016and2015areasfollows(amountsinthousandsofU.S.dollars):
Trade Currency 2016 2015AustralianDollar $ 946 $ 1,031BrazilianReal 973 -BritishPndSterling 4,859 7,399Canadian Dollar 1,039 1,191 ChileanPeso 1 -DanishKrone 178 245EgyptianPound 6 -EuroCurrency 8,081 10,573HongKongDollar 959 1,412HungarianForint - 23IndianRupee 2,415 -IsraeliShekel 164 241JapaneseYen 4,767 6,625MalaysianRinggit 496 -MexicanNuevoPeso 427 -NewZealandDollar 15 -NorwegianKrone 255 494PhillipinesPeso 76 -PolishZloty 158 -Singapore Dollar 776 923 South African Rand 1,227 260 SouthKoreanWon 3,683 -SwedishKrona 360 643SwissFranc 2,803 3,583TaiwanDollar 2,351 -ThaiBaht 305 -TurkishLira 456 -Uae Dirham 120 -
Total $ 37,896 $ 34,643

New York City Board of Education Retirement System
47
FIN
ANCI
AL
Not
es to
Com
bini
ng F
inan
cial
Sta
tem
ents
Ye
ars
Ende
d Ju
ne 3
0, 2
016
and
2015
(C
ont’d
)
Secu
ritie
s Le
ndin
g Tr
ansa
ctio
ns:
Cred
it R
isk —ThequalityratingsofinvestmentsheldascollateralforSecuritiesLendingareasfollows:
Inve
stm
ent T
ype
and
Fair
Valu
e - F
ixed
Ret
urn
Fund
Secu
ritie
s Le
ndin
g Tr
ansa
ctio
ns
S&P
Qua
lity
Rat
ings
(In th
ousa
nds)
CCC
&
Shor
t
N
ot
Ju
ne 3
0, 2
016
AA
A
AA
A
BB
B
BB
B
B
elow
Te
rm
Rat
ed
Tota
lU.S.Governm
ent
$-
$
-$
-$
-$
-$
-$
-$
-
-$
-Corporatebonds
-
-
-
-
-
-
-
-
-
-Yankeebonds
-
-
-
-
-
-
-
-
-
-Sh
ort t
erm
:
Commercialpaper
-
-
-
-
-
-
-
-
-
-
Mutualfunds
-
-
-
-
-
-
-
-
-
-
Moneymarket
35,129
-
-
-
-
-
-
-
-
35,129
Banknotes
-
-
-
-
-
-
-
-
2,181
2,181
U.S.Agency
-
-
-
-
-
-
-
-
-
-
Reverserepurchaseagreements
-
-
-
-
-
-
-
-
391,721
391,721
Repurchaseagreements
-
-
-
-
-
-
-
-
-
-
Certificatesofdeposit
-
-
-
-
-
-
-
-
-
-
Certificatesofdeposit—floaters
-
-
-
-
-
-
-
-
-
-
Timedeposit
-
-
-
-
-
-
-
-
-
-
Cash
-
-
-
-
-
-
-
-
46,408
46,408
Ot
her
-
-
-
-
-
-
-
-
56
1
56
1
Tota
l $
35,129
$
- $
- $
- $
- $
- $
- $
- $
440,871
$
476,000
Perc
ent o
f sec
uriti
es le
ndin
g po
rtfo
lio
7.38%
-%
-%
-%
-%
-%
-%
-%
92.62%
100.00%
Inve
stm
ent T
ype
and
Fair
Valu
e - F
ixed
Ret
urn
Fund
Secu
ritie
s Le
ndin
g Tr
ansa
ctio
ns
S&P
Qua
lity
Rat
ings
(In th
ousa
nds)
CCC
&
Shor
t
N
ot
Ju
ne 3
0, 2
015
AA
A
AA
A
BB
B
BB
B
B
elow
Te
rm
Rat
ed
Tota
lU.S.Governm
ent
$-
$
-$
-$
-$
-$
-$
-$
-$
-$
-Corporatebonds
-
-
-
-
-
-
-
-
-
-Yankeebonds
-
-
-
-
-
-
-
-
-
-Sh
ort t
erm
:
Commercialpaper
-
-
-
-
-
-
-
-
-
-
Mutualfunds
-
-
-
-
-
-
-
-
-
-
Moneymarket
37,068
-
-
-
-
-
-
-
-
37,068
Banknotes
-
-
-
-
-
-
-
-
24,465
24,465
U.S.Agency
-
-
-
-
-
-
-
-
-
-
Reverserepurchaseagreements
-
-
-
-
-
-
-
-
208,353
208,353
Repurchaseagreements
-
-
-
-
-
-
-
-
-
-
Certificatesofdeposit
-
-
-
-
-
-
-
-
-
-
Certificatesofdeposit—floaters
-
-
-
-
-
-
-
-
-
-
Timedeposit
-
-
-
-
-
-
-
-
-
-
Cash
-
-
-
-
-
-
-
-
28,986
28,986
Ot
her
-
-
-
-
-
-
-
-
-
-
Tota
l $
37,068
$
- $
- $
- $
- $
- $
- $
- $
261,804
$
298,872
Perc
ent o
f sec
uriti
es le
ndin
g po
rtfo
lio
12.40%
-%
-%
-%
-%
-%
-%
-%
87.60%
100.00%

New York City Board of Education Retirement System
48
FIN
ANCI
AL
Not
es to
Com
bini
ng F
inan
cial
Sta
tem
ents
Ye
ars
Ende
d Ju
ne 3
0, 2
016
and
2015
(C
ont’d
)
Inve
stm
ent T
ype
and
Fair
Valu
e
Varia
ble
Ret
urn
Fund
Secu
ritie
s Le
ndin
g Tr
ansa
ctio
ns
S&P
Qua
lity
Rat
ings
(In th
ousa
nds)
CCC
&
Shor
t
N
ot
Ju
ne 3
0, 2
016
AA
A
AA
A
BB
B
BB
B
B
elow
Te
rm
Rat
ed
Tota
l
U.S.Governm
ent
$-
$
4,84
4$
-$
-$
-$
-$
-$
-
-$
4,84
4Corporatebonds
-
-
-
-
-
-
-
-
-
-Yankeebonds
-
-
-
-
-
-
-
-
-
-Sh
ort t
erm
:
Commercialpaper
-
-
-
-
-
-
-
-
-
-
Mutualfunds
-
-
-
-
-
-
-
-
-
-
Moneymarket
-
-
-
-
-
-
-
-
-
-
Banknotes
-
-
-
-
-
-
-
-
-
-
U.S.Treasury
-
-
-
-
-
-
-
-
-
-
U.S.Agency
-
-
-
-
-
-
-
-
-
-
Reverserepurchaseagreements
-
-
-
-
-
-
-
-
-
-
Repurchaseagreements
9,496
2,922
-
-
-
-
-
-
-
12,418
Certificatesofdeposit
-
-
-
-
-
-
-
-
-
-
Certificatesofdeposit—floaters
-
-
-
-
-
-
-
-
-
-
Timedeposit
-
-
-
-
-
-
-
-
-
-
Cash
-
-
-
-
-
-
-
-
-
-
Adjustmenttocustodialreports
-
-
-
-
-
-
-
-
-
-
Othe
r
-
-
-
-
-
-
-
-
2
2 To
tal
$9,496
$
7,766
$
- $
- $
- $
- $
- $
- $
2 $
17,264
Perc
ent o
f sec
uriti
es le
ndin
g po
rtfo
lio
55.01%
44
.98%
-%
-%
-%
-%
-%
-%
0.01%
10
0.00%
Inve
stm
ent T
ype
and
Fair
Valu
e
Varia
ble
Ret
urn
Fund
Se
curit
ies
Lend
ing
Tran
sact
ions
S&
P Q
ualit
y R
atin
gs
(In
thou
sand
s)
CC
C &
Sh
ort
Not
June
30,
201
5
AAA
AA
A
B
BB
B
B
B
Bel
ow
Term
R
ated
To
tal
U.S.Governm
ent
$-
$
15,106
$
-$
-$
-$
-$
-$
-
-$
15,106
Corporatebonds
-
-
-
-
-
-
-
-
-
-Yankeebonds
-
-
-
-
-
-
-
-
-
-Sh
ort t
erm
:
Commercialpaper
-
-
-
-
-
-
-
-
-
-
Mutualfunds
-
-
-
-
-
-
-
-
-
-
Moneymarket
-
-
-
-
-
-
-
-
-
-
Banknotes
-
-
-
-
-
-
-
-
-
-
U.S.Treasury
-
1,316
-
-
-
-
-
-
-
1,316
U.S.Agency
-
-
-
-
-
-
-
-
-
-
Reverserepurchaseagreements
-
-
-
-
-
-
-
-
-
-
Repurchaseagreements
8,752
7,738
-
-
-
-
-
-
-
16,490
Certificatesofdeposit
-
-
-
-
-
-
-
-
-
-
Certificatesofdeposit—floaters
-
-
-
-
-
-
-
-
-
-
Timedeposit
-
-
-
-
-
-
-
-
-
-
Cash
-
-
-
-
-
-
-
-
-
-
Adjustmenttocustodialreports
(41)
(1)
-
-
-
-
-
-
-
(42)
Ot
her
-
-
-
-
-
-
-
-
-
-To
tal
$8,711
$
24,159
$
- $
- $
- $
- $
- $
- $
- $
32,870
Perc
ent o
f sec
uriti
es le
ndin
g po
rtfo
lio
26.50%
73.50%
-%
-%
-%
-%
-%
-%
-%
10
0.00%

New York City Board of Education Retirement System
49
FIN
ANCI
AL
Notes to Combining Financial Statements Years Ended June 30, 2016 and 2015
(Cont’d)
Interest Rate Risk—Thelengthsofinvestmentmaturities(inyears)ofthecollateralforSecuritiesLending are as follows:
Years to MaturityFixed Return Fund Investment Maturities (In thousands) Fair Less Than One to Five Six to Ten More ThanJune 30, 2016 Value One Year Years Years Ten Years
U.S.Government $ - $ - $ - $ - $ -Corporatebonds - - - - -Yankeebonds - - - - -Short term: Commercialpaper - - - - - Mutualfund - - - - - Moneymarket 35,129 35,129 - - - Banknotes 2,181 2,181 - - - U.S.Treasury - - - - - U.S.Agency - - - - - Reverserepurchaseagreements 391,721 391,721 - - - Repurchaseagreements - - - - - Certificatesofdeposit - - - - - Certificatesofdeposit—floaters - - - - - Timedeposit - - - - - Cash 46,408 46,408 - - - Adjustmenttocustodialreports - - - - - Other 562 562 - - -Total $ 476,001 $ 476,001 $ - $ - $ - Percent of securities lending portfolio 100.00% 100.00 % - % - % - %
Years to MaturityFixed Return Fund Investment Maturities (In thousands) Fair Less Than One to Five Six to Ten More ThanJune 30, 2015 Value One Year Years Years Ten Years
U.S.Government $ - $ - $ - $ - $ -Corporatebonds - - - - -Yankeebonds - - - - -Short term: Commercialpaper - - - - - Mutualfund - - - - - Moneymarket 37,068 37,068 - - - Banknotes 24,465 24,465 - - - U.S.Treasury - - - - - U.S.Agency - - - - - Reverserepurchaseagreements 208,353 208,353 - - - Repurchaseagreements - - - - - Certificatesofdeposit - - - - - Certificatesofdeposit—floaters - - - - - Timedeposit - - - - - Cash 28,986 28,986 - - - Adjustmenttocustodialreports - - - - - Other - - - - -Total $ 298,872 $ 298,872 $ - $ - $ - Percent of securities lending portfolio 100.00% 100.00 % - % - % - %

New York City Board of Education Retirement System
50
FIN
ANCI
ALNotes to Combined Financial Statements Years Ended June 30, 2016 and 2015 (Cont’d)
Years to MaturityQPP & TDA Program - Variable Return Fund Investment Maturities (In thousands) Fair Less Than One to Five Six to Ten More ThanJune 30, 2016 Value One Year Years Years Ten Years
U.S.Government $ 4,844 $ 1,266 $ 1,573 $ 1,101 $ 904Corporatebonds - - - - -Yankeebonds - - - - -Short term: Commercialpaper - - - - - Mutualfund - - - - - Moneymarket - - - - - Banknotes - - - - - U.S.Treasury - - - - - U.S.Agency - - - - - Reverserepurchaseagreements - - - - - Repurchaseagreements 12,418 12,418 - - - Certificatesofdeposit - - - - - Certificatesofdeposit—floaters - - - - - Timedeposit - - - - - Cash - - - - - Adjustmenttocustodialreports - - - - - Other 2 2 - - -Total $ 17,264 $ 13,686 $ 1,573 $ 1,101 $ 904 Percent of securities lending portfolio 100.00% 79.27 % 9.11 % 6.38 % 5.24 %
Years to MaturityQPP & TDA Program - Variable Return Fund Investment Maturities (In thousands) Fair Less Than One to Five Six to Ten More ThanJune 30, 2015 Value One Year Years Years Ten Years
U.S.Government $ 15,106 $ - $ 6,341 $ 5,211 $ 3,554Corporatebonds - - - - -Yankeebonds - - - - -Short term: Commercialpaper - - - - - Mutualfund - - - - - Moneymarket - - - - - Banknotes - - - - - U.S.Treasury 1,316 1,316 - - - U.S.Agency - - - - - Reverserepurchaseagreements - - - - - Repurchaseagreements 16,490 16,490 - - - Certificatesofdeposit - - - - - Certificatesofdeposit—floaters - - - - - Timedeposit - - - - - Cash - - - - - Adjustmenttocustodialreports - - - - - Other (42) (42) - - -Total $ 32,870 $ 17,764 $ 6,341 $ 5,211 $ 3,554 Percent of securities lending portfolio 100.00% 54.04 % 19.29 % 15.86 % 10.81 %
FortheyearsendedJune30,2016and2015,theannualmoney-weightedrateofreturnontheSystem’sfixedreturnfundinvestments,netofinvestmentexpenseontheSystem’sfixedreturnfund,

New York City Board of Education Retirement System
51
FIN
ANCI
AL
Notes to Combining Financial Statements Years Ended June 30, 2016 and 2015
(Cont’d)
was0.20%and3.15%.Themoney-weightedrateofreturnexpressesinvestmentperformance,netofinvestmentexpenseadjustedforthechangingamountsactuallyinvested.
InFiscalYear2015,theSystemadoptedGASBStatementNo.72(“GASB72”),Fair Value Measurement and Application. GASB72wasissuedtoaddressaccountingandfinancialreportingissuesrelatedtofairvaluemeasurements.
The System categorizes its fair value measurements within the fair value hierarchy established by GenerallyAcceptedAccountingPrinciples(“GAAP”).Thehierarchyisbasedonthevaluationinputsusedtomeasurethefairvalueoftheasset.Level1inputsarequotedpricesinactivemarketsforidenticalassets;Level2inputsaresignificantotherobservableinputs;Level3inputsaresignificantunobservableinputs.TheSystemhasthefollowingrecurringfairvaluemeasurementsasofJune30,2016andJune30,2015:Fixed Return Funds 2016 GASB 72 Disclosure Level Level Level (In thousands) One Two Three Total INVESTMENTS—Atfairvalue Short-terminvestments: Commercialpaper $ - $ 71,888 $ - $ 71,888 Short-terminvestmentfund - 35,933 - 35,933 Discountnotes - - - - Debtsecurities - 873,890 5,872 879,762 Equitysecurities 291,144 - - 291,144 Alternativeinvestments - - 506,922 506,922 Collective trust funds: Internationalequity 926,562 16,349 - 942,911 Fixedincome 1,682 8,047 96,955 106,684 Domesticequity 1,401,395 270 - 1,401,665 Mortgagedebtsecurity - 6,213 22,743 28,956 Treasuryinflationprotectedsecurities - 218,608 - 218,608 Collateral from securities lending - 476,001 - 476,001Total investments $ 2,620,783 $1,707,199 $ 632,492 $ 4,960,474
Fixed Return Funds 2015 GASB 72 Disclosure Level Level Level (In thousands) One Two Three Total
INVESTMENTS—Atfairvalue Short-terminvestments: Commercialpaper $ - $ 148,449 $ - $ 148,449 Short-terminvestmentfund - 35,597 - 35,597 Discountnotes - 25,996 - 25,996 Debtsecurities - 847,566 4,011 851,577 Equitysecurities 334,078 247 - 334,325 Alternativeinvestments - - 385,819 385,819 Collective trust funds: Internationalequity 969,838 - - 969,838 Fixedincome - - 85,942 85,942 Domesticequity 1,432,065 - - 1,432,065 Mortgagedebtsecurity - 23,862 - 23,862 Treasuryinflationprotectedsecurities - 139,367 - 139,367 Collateral from securities lending - 298,872 - 298,872Total investments $ 2,735,981 $1,519,956 $ 475,772 $ 4,731,709

New York City Board of Education Retirement System
52
FIN
ANCI
ALNotes to Combining Financial Statements Years Ended June 30, 2016 and 2015 (Cont’d)
Equity and Fixed Income Securities —EquitysecuritiesclassifiedinLevel1ofthefairvaluehierarchyarevaluedusingpricesquotedinactivemarketsissuedbypricingvendorsforthesesecurities.DebtandequitysecuritiesclassifiedinLevel2ofthefairvaluehierarchyarevaluedusingpricesdeterminedbytheuseofmatrixpricingtechniquesmaintainedbythevariouspricingvendorsforthesesecurities.Matrixpricingisusedtovaluesecuritiesbasedonthesecurities’relationshiptobenchmarkquotedprices.DebtandequitysecuritiesclassifiedinLevel3aresecuritieswhosestatedmarketpriceisunobservable by the market place, many of these securities are priced by the issuers or industry groupsforthesesecurities.Fairvalueisdefinedasthequotedmarketvalueonthelasttradingdayoftheperiod.Thesepricesareobtainedfromvariouspricingsourcesbyourcustodianbank.DebtandequitysecuritiesheldinCollectiveTrustFundsareheldinthosefundsonbehalfofthepensionsystemandthereisnorestrictionontheuseandorliquidationofthoseassetsfortheexclusivebenefitofthefundsparticipants.
Alternative Investments —Alternativeinvestmentsincludeprivateequity,realestate,opportunisticfixedincome,andinfrastructureinvestments.Theseareinvestmentsforwhichexchangequotationsare not readily available and are valued at estimated fair value, as determined in good faith by the GeneralPartner(“GP”).Theseinvestmentsareinitiallyvaluedatcostwithsubsequentadjustmentsthatreflectthirdpartytransactions,financialoperatingresultsandotherfactorsdeemedrelevantbytheGP.TheassetsinouralternativeinvestmentprogramareclassifiedasLevel3assets.AmoredetailedexplanationoftheLevel3valuationmethodologiesfollows:
Investmentsinnon-publicequitysecuritiesarevaluedbytheGPusingoneormorevaluationmethodologiesoutlinedinAccountingStandardCodification(“ASC”)820,dependingupontheavailabilityofdatarequiredbyeachmethodology.Insomecases,theGPmayusemultipleapproachestoestimateavaluationrange.Fortheimmediatetimeperiodfollowingatransaction,thedeterminationoffairvalueforequitysecurities,inwhichnoliquidtradingmarketexists,cangenerallybeapproximatedbasedonthetransactionprice(absentanysignificantdevelopments).Thereafter,orintheinterim,ifsignificantdevelopmentsrelatingtosuchportfoliocompanyorindustryoccurwhichmay suggest a material change in value, the GP should value each investment by applying generally acceptedvaluationmethodsincluding:(1)themarketapproach(suchasmarkettransactionandcomparablepubliccompanymultiples,whicharebasedonameasurementofthecompany’shistoricalandprojectedfinancialperformancewithtypicalmetricsincludingenterprisevalue/latest12monthsEBITDAorprojectedfiscalyearEBITDA)or(2)theincomeordiscountedcashflowapproach.
In the market approach, valuation multiples that are relevant to the industry and company in the investmentsheldshouldbeconsideredandreliedupon.Valuationmultiplesshouldbeassessedandmaybeadjustedonago-forwardbasisbasedonthebusinessriskassociatedwiththesubjectcompanyinwhichtheinvestmentisheld.Inaddition,theimpliedentrymultiplesshouldbeconsideredasbenchmarksinvaluingunlistedequity.Incircumstanceswherenofinancialperformancemetricsareavailable,theGPshouldrelyonothernon-financialrelatedmetricsapplicabletorelevantprogressfromtheoriginalinvestmentdatetothevaluationdate.Intheincomeordiscountedcashflowapproach,forecastedcashflowsthatmaybegeneratedbythesubjectcompanyarediscountedto

New York City Board of Education Retirement System
53
FIN
ANCI
AL
Notes to Combined Financial Statements Years Ended June 30, 2016 and 2015
(Cont’d)
presentvalueatanappropriatediscountrate.Thesemethodologiescanbeutilizedtodetermineanenterprisevalue(“EnterpriseValuationMethodologies”)fromwhichnetdebtissubtractedtoestimateequityvalue.
The determination of fair value using these methodologies should take into consideration a range of factors,includingbutnotlimitedto,thepriceatwhichtheinvestmentwasacquired,thenatureoftheinvestment,localmarketconditions,tradingvaluesonpublicexchangesforcomparablesecurities,currentandprojectedoperatingperformanceandfinancingtransactionssubsequenttotheacquisitionoftheinvestment.Becauseofthesubjectivenatureofestimatedfairvalueoftheprivateinvestments,suchvaluemaydiffersignificantlyfromthevaluesthatwouldhavebeenusedhadareadymarketexistedfortheseinvestments.ThesefinancialinstrumentshavebeenclassifiedasLevel3inthefairvaluehierarchy.
Variable-Return Funds GASB 72 DisclosureAs of June 30, 2016 (In thousands) Level 1 Level 2 Level 3 Total Variablereturnfunds: Short-terminvestments $ - $ 6,079 $ - $ 6,079 Debtsecurities - 10,390 - 10,390 Equities 391,311 44,475 21 435,807 Collateral from securities lending - 17,264 - 17,264 $ 391,311 $ 78,208 $ 21 $ 469,540
Variable-Return Funds GASB 72 DisclosureAs of June 30, 2016 (In thousands) Level 1 Level 2 Level 3 Total Variablereturnfunds: Short-terminvestments $ - $ 5,570 $ - $ 5,570 Debtsecurities - 10,314 - 10,314 Equities 388,390 61,499 - 449,889 Collateral from securities lending - 32,870 - 32,870 $ 388,390 $ 110,253 $ - $ 498,643
DebtandequitysecuritiesclassifiedinLevel1ofthefairvaluehierarchyarevaluedusingpricesquotedinactivemarketsforthosesecurities.
EquityDebtsecuritiesclassifiedinLevel2ofthefairvaluehierarchyarevaluedusingamatrixpricingtechnique.Matrixpricingisusedtovaluesecuritiesbasedonthesecurities’relationshiptobenchmarkquotedprices.
EquitysecuritiesclassifiedinLevel3ofthefairvaluehierarchyarevaluedusingdiscountedcashflowtechniques.
4. CONTRIBUTIONS AND ACTUARIAL ASSUMPTIONS
ThefinancialobjectiveoftheQPPistofundmembers’retirementbenefitsduringtheiractiveserviceandtoestablishemployercontributionrateswhich,expressedasapercentageofannualizedcoveredpayroll,willremainapproximatelylevelfromyeartoyear.TheEmployercontributesamountsthat,togetherwithMemberContributionsandinvestmentincome,wouldultimatelybesufficienttoaccumulateassetstopaybenefitswhendue.

New York City Board of Education Retirement System
54
FIN
ANCI
ALNotes to Combined Financial Statements Years Ended June 30, 2016 and 2015 (Cont’d)
ContributionstotheTDAprogramaremadeonavoluntarilybasisbycertainmembersoftheQPP.
Member Contributions
• MemberswhojoinedtheQPPpriortoJuly1,1973(“Tier1”)contributeonthebasisofanormalrate of contribution which is assigned by the QPP at membership, and which is dependent upon ageandactuarialtablesineffectatthetimeofmembership.Tier1memberscanalsomakeIncreasedTakeHomePay(“ITHP”)contributions,forwhichtheycanreceiveanadditionalannuityafter retirement
• MemberswhojoinedafterJuly1,1973andbeforeJuly27,1976(“Tier2”)alsocontributeonthebasis of a normal rate of contribution which is assigned by the QPP at membership, and which isdependentuponageandactuarialtablesineffectatthetimeofmembership.NotethattheactuarialtablesaredifferentinTier2.Tier2memberscanalsomakeITHPcontributions,forwhichtheycanreceiveanadditionalannuityafterretirement.
• MemberswhojoinedafterJuly27,1976andbeforeApril1,2012(“Tier4”)contribute3%ofsalary until the earlier of the 10th anniversary of their membership date, or upon the completion of10yearsofcreditedservice.CertainTier4membersareenrolledinspecialearlyretirementplansandmustthereforealsomakeAdditionalMemberContributions(“AMC”),dependingonthespecificplan.
• MemberswhojoinedonorafterApril1,2012(“Tier6”)arerequiredtomakeBasicMemberContributions(“BMC”)untiltheyseparatefromserviceoruntiltheyretire.TheBMCrateisdependentonannualwagesearnedduringaplanyearandrangesfrom3%forsalarieslessthan$45,000to6%forsalariesgreaterthan$100,000.CertainTier6membersareenrolledinspecialearlyretirementplansandmustthereforealsomakeAdditionalMemberContributions(“AMC”),dependingonthespecificplan.
Employer Contributions —Statutorily-requiredcontributions(“StatutoryContributions”)totheQPP,determinedbytheSystem’sChiefActuaryoftheOfficeoftheActuary(the“Actuary”)inaccordancewithStatestatutesandCitylaws,aregenerallyfundedbytheemployerwithintheappropriatefiscalyear.

New York City Board of Education Retirement System
55
FIN
ANCI
AL
Notes to Combined Financial Statements Years Ended June 30, 2016 and 2015
(Cont’d)
5. QPP NET PENSION LIABILITY
ThecomponentsofthenetpensionliabilityoftheEmployersatJune30,2014and2013wereasfollows:
(in thousands) 2016 2015Totalpensionliability $4,800,698 $4,460,233Fiduciarynetposition* 3,416,433 3,454,009Employers’netpensionliability $1,384,265 $1,006,224Fiduciarynetpositionasapercentageof the total pension liability 71.20% 77.40%
*SuchamountsrepresentthepreliminarySystem’sfiduciarynetpositionandmaydifferfromthefinalSystem’sfiduciarynetposition.
Actuarial Methods and Assumptions
ThetotalpensionliabilityasofJune30,2016and2015weredeterminedbyactuarialvaluationsasofJune30,2014andJune30,2013,respectively,thatwererolledforwardtodevelopthetotalpensionliabilitytotherespectivefiscalyearend.Thefollowingactuarialassumptionswereappliedtoallperiods included in the measurement:
ProjectedSalaryIncreases* Ingeneral,meritandpromotionincreasesplusassumed GeneralWageIncreasesof3.0%perannum. InvestmentRateofReturn* 7.0%perannum,netofinvestmentexpenses. COLAs* 1.5%perannumforAutoCOLA2.5%perannumforescalation.
*Developedassumingalong-termConsumerPriceInflationassumptionof2.5%perannum.
MortalitytablesforServiceandDisabilitypensionersweredevelopedfromanexperiencestudyoftheQPP.Themortalitytablesforbeneficiarieswerealsodevelopedfromanexperiencereview.Pursuant to Section 96 of the New York City Charter, studies of the actuarial assumptions used tovalueliabilitiesofthefiveactuarially-fundedNewYorkCityRetirementSystems(“NYCRS”)areconductedeverytwoyears.
InOctober2015theindependentactuarialauditor,Gabriel,Roeder,Smith&Company(GRS),issuedareportontheirNYCCharter-mandatedactuarialexperiencestudiesforthefour-yearandten-yearperiodsendedJune30,2013(theGRSReport).

New York City Board of Education Retirement System
56
FIN
ANCI
ALNotes to Combined Financial Statements Years Ended June 30, 2016 and 2015 (Cont’d)
Based, in part, on the GRS Report, on published studies of mortality improvement, and on input from theCity’soutsideconsultantsandauditors,theActuaryproposed,andtheBoardsofTrusteesoftheBERSadopted,newpost-retirementmortalitytablesforuseindeterminingemployercontributionsbeginninginFiscalYear2016.Thenewtablesofpost-retirementmortalityarebasedprimarilyontheexperienceoftheBERS(theBaseTables)andtheapplicationofMortalityImprovementScaleMP-2015,publishedbytheSocietyofActuariesinOctober2015(theValuationTables).ScaleMP-2015replacedMortalityImprovementScaleAA.
Inaddition,beginninginFiscalYear2016,theActuaryrevisedtheActuarialAssetValuationMethodtoconstraintheActuarialAssetValuetobewithina20%corridoroftheMarketValueofAssets.
ThetwopreviouslycompletedstudieswerepublishedbyTheHayGroup(“Hay”)datedDecember2011andbyTheSegalCompany(“Segal”),datedNovember2006.HayanalyzedexperienceforFiscalYears 2006 through 2009 and made recommendations with respect to the actuarial assumptions andmethodsbasedontheiranalysis.SegalanalyzedexperienceforFiscalYears2002through2005and made recommendations with respect to the actuarial assumptions and methods based on their analysis.
Expected Rate of Return on Investments
Thelong-termexpectedrateofreturnonQPPinvestmentswasdeterminedusingabuilding-blockmethodinwhichbest-estimaterangesofexpectedrealratesofreturn(i.e.,expectedreturns,netofQPPinvestmentexpensesandinflation)aredevelopedforeachmajorassetclass.Theserangesarecombinedtoproducethelong-termexpectedrateofreturnbyweightingtheexpectedrealratesofreturnbythetargetassetallocationpercentageandbyaddingexpectedinflation.Thetargetasset allocation and best estimates of arithmetic real rates of return for each major asset class are summarized in the following table:
Target Long-Term Assset Expected Real Asset Class Allocation Rate of Return
U.S.publicmarketsequities 35.00% 6.60%
Internationalpublicmarketequities 17.00 7.00%
Emergingpublicmarketequities 5.00 7.90%
Privatemarketequities 6.00 9.90%
FixedIncome(Core,TIPS,Opportunistic) 30.00 2.70%
Alternatives(RealAssets,HedgeFunds) 7.00 4.00%
Total 100.00%

New York City Board of Education Retirement System
57
FIN
ANCI
AL
Notes to Combined Financial Statements Years Ended June 30, 2016 and 2015
(Cont’d)
Discount Rate—Thediscountrateusedtomeasurethetotalpensionliabilitywas7%.Theprojectionofcashflowsusedtodeterminethediscountrateassumedthatemployeecontributionswillbemadeatthe rates applicable to the current Tier for each member and that Employer contributions will be made atratesasdeterminedbytheActuary.Basedonthoseassumptions,theQPP’sfiduciarynetpositionwasprojectedtobeavailabletomakeallprojectedfuturebenefitpaymentsofcurrentactiveandnon-activeQPPmembers.Therefore,thelong-termexpectedrateofreturnonQPPinvestmentswasappliedtoallperiodsofprojectedbenefitpaymentstodeterminethetotalpensionliability.
The following presents the net pension liability of the Employers, calculated using the discount rate of7.0%,aswellaswhattheEmployers’netpensionliabilitywouldbeifitwerecalculatedusingadiscountratethatis1-percentage-pointlower(6.0percent)or1-percentage-pointhigher(8.0percent)than the current rate:
(in thousands) Current 1% Decrease Discount Rate 1% Increase (-6.0%) (7.0%) (-8.0%)
Employers’netpensionliability June30,2016
$1,948,548 $1,384,265 $911,336
6. MEMBER LOANS
MembersoftheQPParepermittedtoborrowupto75%oftheiremployeecontributionaccountbalances, including accumulated interest, subject to the limitations of Section 72 of the Internal RevenueCode.ThebalanceofQPPmemberloansreceivableatJune30,2016and2015is$46.75millionand$44.68million,respectively.WhenamemberwithdrawsfromtheQPPwithanoutstandingQPP loan balance, this outstanding QPP loan balance will be deducted from the refund of the member’scontributionbalance.WhenamemberretireswithanoutstandingQPPloanbalance,themember’sretirementbenefitwillbereducedbytheactuarialvalueoftheamountoftheoutstandingQPPloanbalance,unlessthisbalanceispaidoff.
MembersoftheTDAProgramarepermittedtoborrowupto75%oftheirTDAProgramaccountbalances, including accumulated interest, subject to the limitations of Section 72 of the Internal RevenueCode.ThebalanceofTDAProgrammemberloansreceivableatJune30,2016and2015is$38.92millionand$36.51million,respectively.
7. RELATED PARTIES
The Comptroller has been appointed by law as custodian for the assets of the QPP and the TDA Program.QPPfixedreturnfundsecuritiesareheldbycertainbanksundercustodialagreementswiththeComptroller.TheComptrolleralsoprovidescashreceiptandcashdisbursementservicestotheSystem.ActuarialservicesareprovidedtotheSystembytheNewYorkCityOfficeoftheActuary.TheCity’sCorporationCounselprovideslegalservicestotheSystem.OtheradministrativeservicesarealsoprovidedbytheCity.Costsof$1.03millionand$1.45millionwereincurredonbehalfofthe

New York City Board of Education Retirement System
58
FIN
ANCI
ALNotes to Combined Financial Statements Years Ended June 30, 2016 and 2015 (Cont’d)
SystembyotherCityagencies,primarilytheComptroller’sOfficefor2016and2015,respectively.ThefixedreturnfundassetsoftheQPPareco-investedwiththoseoftheTDAProgram.ThevariablereturnfundassetsoftheQPPareco-investedwiththoseoftheTDAProgramandTRS(seeNote2).TRSholdstheassetsofthevariablereturnfund.
8. ADMINISTRATIVE EXPENSES
InFiscalYears2016and2015,asperChapter307oftheNewYorkStateLawsof2002,ThePlanprovidedBERSwithCorpusfundingforadministrativeexpensesintheamountof$13.67millionand$13.99million,respectively.
9. CONTINGENT LIABILITIES AND OTHER MATTERS
Contingent Liabilities — The System has claims pending against it and has been named as a defendantinlawsuitsandalsohascertainothercontingentliabilities.ManagementoftheSystem,on the advice of legal counsel, believes that such proceedings and contingencies will not have a materialeffectonthenetpositionoftheSystemorchangesinthenetpositionoftheSystem.UndertheexistingStatestatutesandCitylawsthatgovernthefunctioningoftheSystem,increasesintheobligationsoftheSystemtomembersandbeneficiariesordinarilyresultinincreasesintheobligationsoftheNewYorkCityBoardofEducationtotheSystem.
Other Matters
Restatement of Fiscal Year 2015 combining financial statements —ThecombiningfinancialstatementsoftheSystemasofJune30,2015,havebeenadjustedtoretrospectivelyapplythechangein accounting for the allocation of investments between the QPP and TDA as follows:
Combining statement 2015 As Issued of Fiduciary Net Position: TDA (In thousands) QPP Program Eliminations Total Cash $ 17,933 $ 122 $ - $ 18,055Otherassets 18,074 4,279 - 22,353TDAProgram'sinterestinthefixedreturnfund - 1,152,729 (1,152,729) -TDAProgram'sinterestinthefixedreturnfund 1,152,729 - (1,152,729) -Otherliability - - - -Accountspayable 6,110 1,879 - 7,989Netposition 3,359,796 1,605,572 - 4,965,368
Combining statement 2015 As Restated of Fiduciary Net Position: TDA (In thousands) QPP Program Eliminations Total Cash $ 16,143 $ 122 $ - $ 16,265Otherassets 106,254 - (83,901) 22,353TDAProgram'sinterestinthefixedreturnfund - 1,144,817 (1,144,817) -TDAProgram'sinterestinthefixedreturnfund 1,144,817 - (1,144,817) -Otherliability - 83,901 (83,901) -Accountspayable 6,199 - - 6,199Netposition 3,454,009 1,511,359 - 4,965,368

New York City Board of Education Retirement System
59
FIN
ANCI
AL
Notes to Combined Financial Statements Years Ended June 30, 2016 and 2015
(Cont’d)
Actuarial Audit — Pursuant to Section 96 of the New York City Charter, studies of the actuarial assumptionsusedtovalueliabilitiesofthefiveactuarially-fundedNewYorkCityRetirementSystems(“NYCRS”)areconductedeverytwoyears.
RefertoNote5fortheresultsofthemostrecentactuarialauditsfortheQPP.
Revised Actuarial Assumptions and Methods — In accordance with the ACNY and with appropriate practice,theBoardsofTrusteesofthefiveactuarially-fundedNYCRSaretoperiodicallyreviewandadopt actuarial assumptions as proposed by the Actuary for use in the determination of Employer Contributions.
Based,inpart,uponareviewoftheSegalandHaystudies,theActuaryissuedaFebruary10,2012Reportentitled“ProposedChangesinActuarialAssumptionsandMethodsforDeterminingEmployerContributionsforFiscalYearsBeginningonandAfterJuly1,2011fortheNewYorkCityBoardofEducationRetirementSystem”(“February2012Report”).
TheBoardofTrusteesofBERSadoptedthosechangestoactuarialassumptionsthatrequireBoardapproval.TheStateLegislatureandtheGovernorenactedChapter3/13toprovideforthosechangestotheactuarialassumptionsandmethodsthatrequirelegislation,includingtheAIRassumptionof7.0%perannum,netofinvestmentexpenses.
InOctober2015theindependentactuarialauditor,Gabriel,Roeder,Smith&Company(GRS),issuedareportontheirNYCCharter-mandatedactuarialexperiencestudiesforthefour-yearandten-yearperiodsendedJune30,2013(theGRSReport).
Based, in part, on the GRS Report, on published studies of mortality improvement, and on input from theCity’soutsideconsultantsandauditors,theActuaryproposed,andtheBoardsofTrusteesoftheBERSadopted,newpost-retirementmortalitytablesforuseindeterminingemployercontributions
Combining statement of Changes 2015 As Issued in Fiduciary Net Position: TDA (In thousands) QPP Program Total Other —payments to other retirement systems andotherrevenues/expenses $ (115,144) 67,571 (47,573)TDAProgram'sinterestinthefixedreturnfund - (44,954) 44,954 -Netposition,beginningoftheyear 3,279,265 1,437,462 4,716,727-
Combining statement of Changes 2015 As Restated in Fiduciary Net Position: TDA (In thousands) QPP Program Total Other —payments to other retirement systems andotherrevenues/expenses $ (52,021) 4,448 (47,573)TDAProgram'sinterestinthefixedreturnfund - (85,104) 85,104 -Netposition,beginningoftheyear 3,350,505 1,366,222 4,716,727

New York City Board of Education Retirement System
60
FIN
ANCI
ALNotes to Combined Financial Statements Years Ended June 30, 2016 and 2015 (Cont’d)
beginninginFiscalYear2016.Thenewtablesofpost-retirementmortalityarebasedprimarilyontheexperienceoftheBERS(theBaseTables)andtheapplicationofMortalityImprovementScaleMP-2015,publishedbytheSocietyofActuariesinOctober2015(theValuationTables).ScaleMP-2015replacedMortalityImprovementScaleAA.
Inaddition,beginninginFiscalYear2016,theActuaryrevisedtheActuarialAssetValuationMethodtoconstraintheActuarialAssetValuetobewithina20%corridoroftheMarketValueofAssets.
New York State Legislation (only significant laws included) —Chapter18oftheLawsof2012amended portions of the Retirement and Social Security Law and Administrative Code of the City of NewYorkthataffectthecontributionsandbenefitsofmemberswhojoinaNewYorkStatepublicretirementsystem(includingBERS)onorafterApril1,2012.ThesechangesaresometimesreferredtoasTier6.
Chapter3oftheLawsof2013(“Chapter3/13”)implementedchangesintheactuarialproceduresfordeterminingEmployerContributionsbeginningFiscalYear2012.Inparticular,Chapter3/13continuedtheOYLM,employedtheEntryAgeActuarialCostMethod(“EAACM”),establishedanActuarialInterestRate(“AIR”)assumptionof7.0%perannum,netofinvestmentexpenses,continueditandotherinterestratesuntilJune20,2016,anddefinedtheamortizationofUnfundedActuarialAccruedLiabilities(“UAAL”).
Chapter489oftheLawsof2013(“Chapter489/13”)extendedtheWTCDisabilityLawstovestedmembers.

New York City Board of Education Retirement System
61
FIN
ANCI
AL
Required Supplementary Information (Unaudited) Qualified Pension Plan
Schedule 1
SCHEDULE OF CHANGES IN THE EMPLOYERS' NET PENSION LIABILITY AND RELATED RATIOS1
(In thousands)
2016 2015 (Restated)2 2014 Total pension liability: Servicecost $ 153,107 $ 147,898 $ 142,687 Interest 320,315 299,592 288,162 Changesofbenefitterms - - -Differencesbetweenexpectedandactualexperience (75,907) 50,148 - Changesofassumptions 183,677 - - Benefitpaymentsandwithdrawals (240,727) (223,244) (214,315)
Netchangeintotalpensionliability 340,465 274,394 216,534
Total pension liability – beginning 4,460,233 4,185,839 3,969,305
Totalpensionliability–ending(a) 4,800,698 4,460,233 4,185,839
Planfiduciarynetposition: Employercontributions 265,532 258,099 214,590 Membercontributions 38,581 39,564 37,193 Netinvestmentincome 164,144 177,166 875,453 PaymentofinterestonTDAprogramfixedreturnfunds (240,727) (85,104) (206,615)Benefitpaymentsandwithdrawals (12,818) (223,244) (214,315)Administrativeexpenses (94,789) (10,956) (9,776)
Other (157,499) (52,021) (70,916)
Netchangeinplanfiduciarynetposition (37,576) 103,504 625,614
Planfiduciarynetposition–beginning 3,454,009 3,350,505 2,653,652
Planfiduciarynetposition–ending(b) 3,416,433 3,454,009 3,279,266
Employer’snetpensionliability–ending(a)-(b) $ 1,384,265 $ 1,006,224 $ 906,574
Planfiduciarynetpositionasapercentageof the total pension liability 71.20% 77.40% 78.34%
Covered-employeepayroll3 $ 1,008,056 $ 1,016,822 $ 989,168
City’snetpensionliabilityasapercentage ofcovered-employeepayroll 137.30% 99.00% 91.65%
1.Post-PublicationAdjustmentstoAssetsatJune30,2014andRestatedAssetsatJune30,2015. 2.ProjectedEmployeePayrollatTime1.0underOne-YearLagMethodology. 3.InaccordancewithGASBNo.67,paragraph50,suchinformationwasnotreadilyavailableforperiodspriorto2013.

New York City Board of Education Retirement System
62
FIN
ANCI
AL
Req
uire
d Su
pple
men
tary
Info
rmat
ion
(Una
udite
d)
Qua
lified
Pen
sion
Pla
n (C
ont'd
) Sc
hedu
le 2
SCH
EDU
LE O
F EM
PLOY
ERS'
CO
NTR
IBU
TIO
NS
(In th
ousa
nds)
20
16
20
15
20
14
20
13
20
12
20
11
20
10
20
09
20
08
20
07
Actuariallydeterminedcontribution
$265,532
$258,099
$214,590$196,246$
213,651$
180,191$
147,349$134,225$
143,100$129,820
Cont
ribut
ions
in re
latio
n to
the
ac
tuar
ially
det
erm
ined
con
tribu
tion
265,
532
258,099
214,590
196,246
21
3,65
1
180,191
147,349
134,225
143,100
129,820
Contributiondeficiency(excess)
$- $
- $
- $
- $
- $
-
- $
- $
- $
-
Covered-em
ployeepayroll
$1,008,056
$1,016,822
$
989,168
$886,186
$
879,476
$880,656
$
826,782
$755,516
$
729,098
$696,422
Cont
ribut
ions
as
a pe
rcen
tage
of
covered-em
ployeepayroll
26.34%
25.38%
21.69%
22.15%
24.29%
20.46%
17.82%
17.77%
19.63%
18.64%

New York City Board of Education Retirement System
63
FIN
ANCI
AL
Req
uire
d Su
pple
men
tary
Info
rmat
ion
(Una
udite
d)
Qua
lified
Pen
sion
Pla
n (C
ont'd
) Sc
hedu
le 2
(Con
t'd)
NO
TES
TO S
CHED
ULE
OF
EMPL
OYER
S' C
ON
TRIB
UTI
ON
S
TheaboveactuariallydeterminedcontributionsweredevelopedusingaOn
e-YearLagMethodology,underwhichtheactuarialvaluationdeterminestheem
ployercontributionforthesecondfollowingfiscalyear(e.g.FiscalYear2016contri-
butionsweredeterminedusinganactuarialvaluationasofJune30,2014).Themethodsandassum
ptionsusedtodeterminetheactuariallydeterminedcontributionsareasfollows:
Valu
atio
n D
ates
Ju
ne 3
0, 2
014
June
30,
201
3 Ju
ne 3
0, 2
012
June
30,
201
1 Ju
ne 3
0, 2
010
June
30,
200
9 -
Ju
ne 3
0, 2
005
Actuarialcostm
ethod
EntryAge
EntryAge
EntryAge
EntryAge
EntryAge
FrozenInitialLiability1
Amor
tizat
ion
met
hod
for
Unfu
nded
Act
uaria
l Acc
rued
Liab
ilitie
s:
In
itial
Unf
unde
d In
crea
sing
In
crea
sing
Dol
lar
Incr
easi
ng D
olla
r In
crea
sing
Dol
lar
Incr
easi
ng D
olla
r N
A2
Post-2010Unfundeds
LevelDollar
LevelDollar
LevelDollar
LevelDollar
LevelDollar
NA2
Rem
aini
ng a
mor
tizat
ion
perio
d:
InitialUnfunded
18years(closed)
19years(closed)
20years(closed)
21years(closed)
22years(closed)
NA2
2010ERI
2years(closed)
3years(closed)
4years(closed)
5years(closed)
2011Actuarialgain/loss
12years(closed)
13years(closed)
14years(closed)
15years(closed)
NA
NA2
2012Actuarialgain/loss
13years(closed)
14years(closed)
15years(closed)
NA
NA
NA2
2013Actuarialgain/loss
14years(closed)
15years(closed)
NA
NA
NA
NA2
2014Actuarialgain/loss
15years(closed)
NA
NA
NA
NA
NA
ActuarialAssetValuation
Modifiedsix-yearm
oving
Modifiedsix-yearm
oving
Modifiedsix-yearm
oving
Modifiedsix-yearm
oving
Modifiedsix-yearm
oving
Modifiedsix-yearm
oving
(AAV)M
ethod
averageofmarketvalueswith
averageofmarketvalueswith
averageofmarketvalueswith
averageofmarketvalueswith
averageofmarketvalueswith
averageofmarketvalueswith
a"MarketValueRestart"asof
a"MarketValueRestart"asof
a"MarketValueRestart"asof
a"MarketValueRestart"asof
a"MarketValueRestart"asof
a"MarketValueRestart"asof
June30,2011.TheJune30,
June30,2011.TheJune30,
June30,2011.TheJune30,
June30,2011.TheJune30,
June30,2011.TheJune30,
June30,1999.
2010AAVisdefinedto
2010AAVisdefinedto
2010AAVisdefinedto
2010AAVisdefinedto
2010AAVisdefinedto
recognizeFiscalYear2011
recognizeFiscalYear2011
recognizeFiscalYear2011
recognizeFiscalYear2011
recognizeFiscalYear2011
investmentperformance.5
investmentperformance.
investmentperformance.
investmentperformance.
investmentperformance.
Actu
aria
l ass
umpt
ions
: A
ssum
ed ra
te o
f ret
urn3
7.0%
perannum
,netof
7.0%
perannum
,netof
7.0%
perannum
,netof
7.0%
perannum
,netof
7.0%
perannum
,netof
8.0%
perannum
,netof
investmentexpenses3
investmentexpenses3
investmentexpenses
investmentexpenses
investmentexpenses
investmentexpenses
Post-retirementm
ortality
TablesadoptedbyBoardof
TablesadoptedbyBoardof
TablesadoptedbyBoardof
TablesadoptedbyBoardof
TablesadoptedbyBoardof
TablesadoptedbyBoardof
TrusteesduringFiscalYear2012
TrusteesduringFiscalYear2012
TrusteesduringFiscalYear2012
TrusteesduringFiscalYear2012
TrusteesduringFiscalYear2012
TrusteesduringFiscalYear2006
Act
ive
serv
ice:
with
draw
al,
Tabl
es a
dopt
ed b
y Bo
ard
of
Tabl
es a
dopt
ed b
y Bo
ard
of
Tabl
es a
dopt
ed b
y Bo
ard
of
Tabl
es a
dopt
ed b
y Bo
ard
of
Tabl
es a
dopt
ed b
y Bo
ard
of
Tabl
es a
dopt
ed b
y Bo
ard
of d
eath
, dis
abili
ty, s
ervi
ce
TrusteesduringFiscalYear2012
TrusteesduringFiscalYear2012
TrusteesduringFiscalYear2012
TrusteesduringFiscalYear2012
TrusteesduringFiscalYear2012
TrusteesduringFiscalYear20064
ret
irem
ent
Sala
ry in
crea
ses3
In g
ener
al, m
erit
and
prom
otio
n
In g
ener
al, m
erit
and
prom
otio
n In
gen
eral
, mer
it an
d pr
omot
ion
In g
ener
al, m
erit
and
prom
otio
n In
gen
eral
, mer
it an
d pr
omot
ion
In g
ener
al, m
erit
and
prom
otio
n
incr
ease
s pl
us a
ssum
ed G
ener
al
incr
ease
s pl
us a
ssum
ed G
ener
al
incr
ease
s pl
us a
ssum
ed g
ener
al
incr
ease
s pl
us a
ssum
ed g
ener
al
incr
ease
s pl
us a
ssum
ed g
ener
al
incr
ease
s pl
us a
ssum
ed g
ener
al
WageIncreasesof3.0%peryear.3
WageIncreasesof3.0%peryear.3
Increasesof3.0%peryear.
Increasesof3.0%peryear.
Increasesof3.0%peryear.
Increasesof3.0%peryear.
Cost-of-LivingAdjustments
3 1.5%
perannum
forAutoCO
LA.
1.5%
perannum
forAutoCO
LA.
1.5%
perannum
forAutoCO
LA.
1.5%
perannum
forAutoCO
LA.
1.5%
perannum
forAutoCO
LA.
1.3%
perannum
2.5%
perannum
forElcalation.
2.5%
perannum
forElcalation.
2.5%
perannum
forElcalation.
2.5%
perannum
forElcalation.
2.5%
perannum
forElcalation.
1.Underthisactuarialcostm
ethod,theInitialLiabilitywasreestablishedasofJune30,1999,bytheEntryAgeActuarialCostM
ethodbutw
iththeunfundedactuarialaccruedliability(UAAL)notlessthan$0.ThefinancialresultsusingthisFrozenInitialLiabilityActuarialCost
Met
hod
arethesameasthosethatwouldbeproducedusingtheAggregateActuarialCostM
ethod.
2.InconjunctionwithChapter85oftheLawsof2000,thereisanam
ortizationmethod.However,theJune30,1999UAALfortheQPPequaled$0andnoamortizationperiodwasrequired.
3.Developedusingalong-termConsumerPriceInflationassumptionof2.5%peryear.
4IntheJune30,2009actuarialvaluation,thetablesadoptedbytheBoardofTrusteesduringFiscalYear2006weresupplementedbyadditionalassum
ptionsadoptedbytheBoardofTrusteesduringFiscalYear2011forvaluingbenefitspayabletoTier3activemem
bers.
5.AsofJune30,2014(Lag)valuation,theAAVisconstrainedtobenomorethan20%
ofM
arketValue.
Not
e:Anyfactorsthatsignificantlyaffecttrendsintheam
ountsreported(e.g.changesinbenefitterms,changesinsize
orcom
positionofmem
berpopulation,oruseofdifferentassum
ptions)alsoshouldbedisclosedwiththisschedule.

New York City Board of Education Retirement System
64
FIN
ANCI
ALRequired Supplementary Information (Unaudited) Qualified Pension Plan (Cont'd) Schedule 3
SCHEDULE OF INVESTMENT RETURNS
Thefollowingtabledisplaysannualmoney-weightedrateofreturn,netofinvestmentexpense,foreachofthepastthreefiscalyears:
Note: InaccordancewithGASBNo.67,paragraph50,suchinformationwasnotreadilyavailableforperiodspriorto2013.
Weighted Fiscal Year Ended Rate of Return
June 30, 2016 0.20%
June30,2015 3.15%
June30,2014 19.51%

New York City Board of Education Retirement System
65
FIN
ANCI
AL
Additional Supplementary Information Fiscal Year Ended June 30, 2016
(In thousands)
SCHEDULE OF INVESTMENT EXPENSES FUND MANAGER CATEGORY AMOUNT (IN $)
1 Fixed Investment Expenses:
ApolloInvestmentFdVIII AlternativeInvtEquity 206,541.42 Ardian-ASFVII AlternativeInvtEquity 13,942.00 ArdianCapital AlternativeInvtEquity 73,816.00 BridgepointAdvisorsLTD AlternativeInvtEquity 101,925.10 CarlylePtnrsVI AlternativeInvtEquity 361,502.13 Centerbridge AlternativeInvtEquity 38,655.00 CrestviewPtnrsII AlternativeInvtEquity 112,004.00 CVCCapital AlternativeInvtEquity 357,247.15 EquityVII AlternativeInvtEquity 255,221.82 Landmark AlternativeInvtEquity 6.95 MesirowPartnersFundIII AlternativeInvtEquity 2.15 MesirowPartnersFundIV AlternativeInvtEquity 47,563.18 MesirowPartnersFundV AlternativeInvtEquity 251,423.73 MillCityCapitalII AlternativeInvtEquity 18,318.76 NewMainStreamCapitalII AlternativeInvtEquity 25,355.86 NewYorkFairview AlternativeInvtEquity 268,191.58 PatriotPartnersII AlternativeInvtEquity 92,615.02 PlatinumEqCapPtnrsIII AlternativeInvtEquity 170,220.39 RaineGroupLLC AlternativeInvtEquity 160,440.00 SirisCapital AlternativeInvtEquity 40,610.00 StellexPartners AlternativeInvtEquity 89,200.00 ValorEquityPartners AlternativeInvtEquity 184,154.00 VistaEquityPartnersFundV,L.P. AlternativeInvtEquity 550,900.00 VistaEquityPartnersFundVI,L.P. AlternativeInvtEquity 20,198.00 WarburgPincusXI AlternativeInvtEquity 108,332.92 WarburgPincusXII AlternativeInvtEquity 238,256.98 WCASXII AlternativeInvtEquity 34,874.00 WebsterCapitalIII AlternativeInvtEquity 22,062.00 $ 3,843,580.14 PrudentialPrivest AlternativeInvtFI $ (4,448.13) Blackstone AlternativeInvtRealEstate 454,386.00 BlackstoneRealEstate AlternativeInvtRealEstate 169,757.00 BrookfieldAssetManagement AlternativeInvtRealEstate 25,759.87 BrookfieldInfrFdII AlternativeInvtRealEstate 107,635.31 BrookfieldStraRePtnrs AlternativeInvtRealEstate 99,804.00 CaryleRealtyPartners AlternativeInvtRealEstate 338,994.00 EmmesAssetMgmtCo AlternativeInvtRealEstate 112,912.00 FirstReserveEnergy AlternativeInvtRealEstate 154,608.00 FranklinTempletonFd AlternativeInvtRealEstate 223,021.13 GlobalInfrastructureMgmtLLC AlternativeInvtRealEstate 93,843.00 HudsonSeparateAccount AlternativeInvtRealEstate 32,961.93 IndustryFundsManagementPty AlternativeInvtRealEstate 841.61 JamestownPremierFunds AlternativeInvtRealEstate 210.03 KKRGlobalInfra AlternativeInvtRealEstate 221,811.00 LasalleUSPropertyFd AlternativeInvtRealEstate 267,493.27 RFMNYCRSSandyLLC AlternativeInvtRealEstate 227,342.75 TristanEuropeanPropertyInv AlternativeInvtRealEstate 37.32 UBSTrumbullPropertyFd AlternativeInvtRealEstate 452,245.93 $ 2,983,664.15

New York City Board of Education Retirement System
66
FIN
ANCI
ALAdditional Supplementary Information Fiscal Year Ended June 30, 2016 (In thousands) (Cont’d)
SCHEDULE OF INVESTMENT EXPENSES (CONT'D) FUND MANAGER CATEGORY AMOUNT (IN $)
AffinityInvtAdvisors Equity 86,719.78 ClarkstonSMID Equity 86,122.04 HerndonCapital/PIMATLANTALIFE Equity 36,031.83 NicholasAssetMgmt Equity 14,614.39 RedwoodInvestments Equity 89,217.15 Blackrock Equity 2,377.00 BowlingPortfolioMgmt Equity 37,335.32 ChanningSVC Equity 126,703.21 Daruma Equity 4.02 EmonTransition Equity 2.26 FIS-Eudaimonia Equity 36,275.27 HahnCapitalManagementLLC Equity 28,359.73 HighPointe Equity 29,834.52 HuberCapitalManagement Equity 28,123.01 MartinInvtMgmt Equity 89,734.01 NicholasInvPar Equity 69,062.33 NicholsSCG Equity 77,063.94 PiermontSCV Equity 128,151.29 PIMLombardiaCapitalPartners Equity 21,415.59 RiceHallSCG Equity 70,638.58 SeizartCapitalPartners Equity 35,429.08 WellingtonMgmtMCC Equity 734,677.41 Zevenbergen Equity 5.16 $ 1,827,896.92 Blackrock FixedIncome 112,858.52 LoomisSayles FixedIncome 360,088.34 PrudentialCredit FixedIncome 123,787.70 SecurityLending FixedIncome 346,747.87 Shenkman FixedIncome 374,584.53 StateStreet FixedIncome 55,584.98 TaplinCanada FixedIncome 88,110.84 $ 1,461,762.78 AcadianEAFESmallCapMTA IntlEquity 1,455,429.07 BallieGroupTrust IntlEquity 655,872.57 ConyGrpAcadian IntlEquity 305,353.23 prucegrove IntlEquity 782,300.33 $ 3,198,955.20 BlackrockR1000Growth MutualFundEquity 25,285.02 BlackrockR1000Value MutualFundEquity 27,983.71 BlackrockR2000Growth MutualFundEquity 1,133.34 BlackrockR2000Value MutualFundEquity 967.03 $ 55,369.10 BabsonBLMTA MutualFundFixedIncome $ 105,865.65 ETIII-ACS MutualFundMortgage 12,057.67 ETICCDPPAR MutualFundMortgage 0.63 AFL-CIOHousingInvTrust MutualFundMortgage 62,914.73 $ 74,973.03 PIMCOTIPSMTA TIPS 20.09 StateStreetTIPSMTA TIPS 4,767.13 $ 4,787.22
Sub total $ 13,552,406.06

New York City Board of Education Retirement System
67
FIN
ANCI
AL
Additional Supplementary Information Fiscal Year Ended June 30, 2016
(In thousands) (Cont’d)
SCHEDULE OF INVESTMENT EXPENSES (CONT'D) 2 Legal Fees
BlackstoneRealEstatePartnersVII 1,375.00 BryanCave 961.54 Cox,Castle&Nicholson 5,242.57 DarumaAssetMgtInc. 46,323.30 DayPitney 5,517.11 FosterPepper 12,560.58 MorganLewis&Bockius 4,869.07 NixonPeabody 1,438.14 PillsburyWinthropShawPittman 989.50 ReinhartBoernerVanDeuren 4,343.41 Seward&Kissel 56.76 Sub total $ 83,676.98 3 Consultant Fees BuckConsultantsLLC 85,000.00 SegalRogerscasey 94,999.98 CourtlandPartners 10,249.61 HamiltonLane 175,000.00 Prudential 165,340.00 Stepstone-Infrastructure 10,000.00 TownsendGroup 27,868.67 InstitionalShareholderServices 602.59 Abel/NoserCorp 1,638.90 GlobalTradingAnalytics 329.70 Sub total $ 571,029.45 4 Variable Investment Expenses QualifiedPensionPlan 89,013.88 Tax-DeferredAnnuity 702,328.74 Sub total 791,342.62 Invesment Expenses FY 16 $ 14,998,455.11

New York City Board of Education Retirement System
68
FIN
ANCI
ALAdditional Supplementary Information Fiscal Year Ended June 30, 2016 (In thousands) (Cont’d)
SCHEDULE OF DIRECT PAYMENTS TO CONSULTANTS
INDIVIDUAL OR FIRM NAME NATURE OF SERVICES AMOUNT
Buck Consultants, LLC InvestmentConsultation $ 85,000.00485LexingtonAvenueNew York, NY 10017
Prudential Insurance Co. InvestmentConsultation 165,340.00200 Wood Ave SouthIselin,NJ08830
Segal Rogerscasey InvestmentConsultation 94.999.98333West34thStreet New York, NY 10001
Gary Tunnicliffe & Jack Ziegler, LLC CPMSConsultants* 596,160.00321UnionStreet,#4A Brooklyn, NY 11231
Vitech Systems Group, Inc. CPMSConsultants 4,119.250.00401ParkAvenueSouth,12thFloor New York, NY 10016
Winmill Software CPMSConsultants 228,750.00P.O.Box4595 New York, NY 10163 Total Consulting Fees for FY 2016 $ 5,289,499.98
*CPMS-ComprehensivePensionManagementSystem

New York City Board of Education Retirement System
69
FIN
ANCI
AL
Additional Supplementary Information Fiscal Year Ended June 30, 2016
(In thousands) (Cont’d)
SCHEDULE OF ADMINISTRATIVE EXPENSES(In thousands)
EXPENSE TYPE AMOUNT
1 Administrative Expenses (QPP):
SalariespaidtoPlanPersonnel $ 8,249,240 Consumable Supplies and Materials 95,192 FurnitureandEquipment 326,570 GeneralServices 120,289 Contractual services 4,027,193 Sub-Total $ 12,818,483
2 Administrative Expenses (TDA):
Contractual services 850,108 Sub-Total $ 850,108
3 Miscellaneous Expenses:
RelatedPartiesAdministrativeExpenses Sub-Total $ 1,032,975
(AdmexpensesmadebytheComptrolleronourbehalf. Chargedoninvestment) Total Administrative Expenses for FY 2016 $ 14,701,566

New York City Board of Education Retirement System
This page is intentionally left blank
New York City Board of Education Retirement System
70
INVE
STM
ENT

New York City Board of Education Retirement SystemNew York City Board of Education Retirement System
71
INVE
STM
ENT
INVESTMENT• Report on Investment Activity 72• Asset Allocation 75• Investment Summary 77• ScheduleofInvestmentReturns 78• LargestEquityHoldingsFixed 79• LargestBondsHoldingsFixed 80• LargestInternationalEquityHoldingsFixed 81• LargestEuropeAustralasiaFarEast(“EAFE”)HoldingsFixed 82• LargestEmergingMarket(“EM”)HoldingsFixed 83• LargestTreasuryInflationProtectedSecurities (“TIPS”)HoldingsFixed 84• LargestEconomicallyTargetedInvestmentsFixed 85• LargestDomesticEquityHoldings“VariableA”Program 86• ScheduleofPaymentsofCommissions 87

New York City Board of Education Retirement System
72
INVE
STM
ENT
333 West 34th Street New York, NY 10001-2402 T 212.251.5061 www.segalrc.com
Michael C. Wright Senior Vice President [email protected]
Investment Solutions. Offices in the United States, Canada and Europe. Member of The Segal Group
Founding Member of the Global Investment Research Alliance
October 25, 2016 New York City Board of Education Retirement System (BERS) 65 Court Street Brooklyn, NY 11201 Re: Report on Investment Activity Dear Members of the New York City Board of Education Retirement System: Fund Summary The Board of Education Retirement System Total Fund returned +0.17%, net of fees, for the Fiscal Year (FY) ending June 2016, compared to +0.75% for the Board of Education Policy Benchmark1, against which it is measured. Performance for the FY ranked in the third quartile of a peer group of public funds. The Fund increased in value and ended the fiscal year at $4.50 billion (compared to $4.40 billion last year). Over the 10-year time period, the Fund remains ahead of benchmark, with a +6.31% average annual return versus +6.10% for the benchmark. Longer term, this 10-year performance ranks in the top quartile of a peer group. Economic and Market Comment Slow growth and low interest rates continued through this fiscal year. These conditions are not favorable for strong portfolio performance. In addition, uncertainty around the U.S. election and the vote in the UK to exit from the European Union were cited as reasons why the U.S. and non U.S. stock markets were not as strong as in prior years. On the economic front, the dramatic decline in energy prices, while a positive for consumers was a major headwind impacting both energy company capital spending and the economies of many emerging market countries.
1 The Board of Education Policy Benchmark is a custom index representing the weighted average return of the
benchmarks for each major investment program in the Plan. The Policy Benchmark as of 6/30 consisted of: 42.26% Russell 3000, 17% MSCI EAFE, 5% MSCI Emerging Markets, 2.91% Russell 3000 + 300bps, 2.83% NFI ODCE Net + 100bps, 17% NYC Core + 5 fixed income, 5% Barclays Capital US TIPS, 5.5% Citigroup BB&B Index, and 2.5% Credit Suisse Leveraged Loan Index.

New York City Board of Education Retirement System
73
INVE
STM
ENT
New York City Board of Education Retirement System (BERS) Report on Investment Activity October 25, 2016 Page 2 Real U.S. GDP grew at an annualized rate of 1.2% thru June 30, 2016. Positive contributors to GDP included personal consumption expenditures (PCE) and exports. At its June meeting, the Federal Open Market Committee (FOMC) stated the following:
Economic activity has been expanding at an accelerated pace; The labor market has slowed with diminishing employment gains; Household spending has increased; Inflation remained below the Federal Reserve (Fed)’s 2% objective due to decreased
energy prices and lower-priced non-energy imports, but is expected to rise to 2% over the medium term;
The Federal Funds Rate will remain between 0.25% and 0.50%; and, To maintain an accommodative policy, the Fed will continue reinvesting principal
payments from holdings of agency debt and agency-mortgage-backed securities, and will keep rolling over maturing Treasury securities at auction.
Despite expectations at the beginning of the year, the Fed has not raised interest rates to date in 2016. In June 2016, the European Central Bank held its target refinancing rate at 0%, its marginal lending rate at 0.25% and its deposit rate at -0.40%. The Bank of Japan (BoJ) maintained its quantitative and qualitative easing policy of purchasing Japanese government bonds (JGBs), with the goal of increasing the monetary base and to lower their rates. The headline seasonally adjusted Consumer Price Index (CPI)* was up +0.84% in Q2, and increased +1.05% on a YoY basis. Seasonally adjusted Core CPI, which excludes food and energy prices, rose 0.575% in Q2, bringing the YoY core CPI increase to 2.23%. On an unadjusted 12-month basis ending June 2016, the energy component fell the most at -9.4%. Commodities less food and energy commodities were also slightly negative. Food and services less energy services were both positive.
The U.S. stock market, as measured by the Russell 3000 stock index, returned +2.14%, well below the strong returns in the prior two fiscal years. International equity performance continued in the negative territory for the FY, as the MSCI EAFE posted a loss of -9.7%. This is not surprising given their more direct vulnerability to fiscal concerns in Europe and the potential for economic instability in Asia. Fixed income returns were positive as interest rates have generally declined with the Barclays Aggregate Index, which represents a proxy of investment-grade bonds, returning +6.0% for the fiscal year.

New York City Board of Education Retirement System
74
INVE
STM
ENT
New York City Board of Education Retirement System (BERS) Report on Investment Activity October 25, 2016 Page 3 Fund Description Asset allocation is expected to be a major contributor to the Board of Education Retirement System’s Fund total return. The Trustees establish a target asset mix after considering the long-term growth prospects of a diversified portfolio of investments and the expected costs of the plan participants’ benefits. During the FY, a revised investment policy was approved that increased the allocation to Private Equity, Real Estate and Infrastructure while reducing U.S. equities and developed market non US equities. These are long term commitments expected to improve the risk and return profile of the fund. We expect that they will be phased in over several fiscal years as attractive investment opportunities are approved. The fund’s new target asset mix going forward will be 72% Equity (including the Private and Public equities, Real Estate and Infrastructure) and 28% Fixed Income. Over the long-term investment future, we expect our revised equity allocation will outperform fixed income by a significant margin. For the FY ending June 2016, the total Fixed Income return of 4.5% outperformed the U.S. and non-U.S. public equity returns. Total Equity returns were -1.6% in FY 2016 and were particularly responsible for the Fund’s underperformance versus expectations. The fund is primarily invested in index funds for the U.S. equity allocation, which helped relative performance. The active US and non US equity managers did not add the expected levels of outperformance during the FY. As part of our ongoing monitoring we review the manager contributions and the structure of the fund in order to achieve the expected levels of returns. The Fund’s current level of diversification into alternative assets did help performance in FY 2016 as the Private Equity. Real Estate and Infrastructure investments did well for the Fund. However, the current allocation to those sectors is not large enough to offset the underperformance elsewhere in the portfolio. The expectation is that global growth will be inconsistent across market sectors and certain geographic areas. We will be implementing the approved diversifications and rebalancing the fund to mitigate the volatility from these dislocations and improve the consistency of outcomes for the fund. Market conditions and fund performance will be closely monitored to accomplish the goal of providing he benefits as promised to participants.
Sincerely,
Michael C. Wright 20071755v1/14358.001

New York City Board of Education Retirement System
75
INVE
STM
ENT
Qualified Pension Plan and Tax Deferred Annuity Program (Fixed) Asset Allocation (Fixed)
Fiscal Year Ended June 30, 2016
US Int’l Emerging Domestic Mutual Enhanced Private Equity- Private Years Equity Equity Market Fixed TIPS Yield Real Estate Equity
6/30/2007 47.90 19.30 4.50 20.40 2.80 4.40 0.00 0.70
6/30/2008 36.49 19.57 16.38 20.62 2.69 2.95 0.00 1.30
6/30/2009 34.28 20.48 11.00 26.06 2.73 3.94 0.00 1.51
6/30/2010 36.22 21.67 8.46 25.27 2.72 3.66 0.00 2.00
6/30/2011 39.97 21.51 5.37 22.63 2.62 3.43 1.66 2.81
6/30/2012 37.79 19.03 4.48 24.81 2.46 6.00 2.15 3.28
6/30/2013 42.90 17.59 4.56 20.01 3.91 5.60 2.39 3.04
6/30/2014 44.72 18.27 4.67 16.69 3.38 6.19 2.83 3.25
6/30/2015 40.15 17.06 4.94 20.67 3.16 5.48 4.47 4.07
6/30/2016 37.00 17.00 5.00 19.50 5.00 5.50 6.03 4.97
Mutual Tips5%
Enhanced Yield5%
Private Equity-Real Estate
6%
Private Equity5%
US Equity37%
Int’l Equity17%
Emerging Market5%
Domestic Fixed19%

New York City Board of Education Retirement System
76
INVE
STM
ENT
Asse
ts A
lloca
tion
(Fix
ed)
Fisc
al Y
ears
End
ed J
une
30, 2
007
- Jun
e 30
, 201
6
01020304050
Real
Ass
ets
Priv
ate
Equi
tyN
on-U
S Eq
uity
US E
quity
US F
ixed
Inco
me
2016
2015
2014
2013
2012
2011
2010
2009
2008
2007
% o
fPo
rtfo
lio

New York City Board of Education Retirement System
77
INVE
STM
ENT
Investment Summary (Fixed and Variable) Fiscal Year Ended June 30, 2016
(In thousands)
Type of Investments Fair Value Percentage
Short Term Investments $ 113,900 2.10%
Debt Securities 890,152 16.39
Promissory Notes - -
Equity Securities 726,951 13.39
Alternative Investments 506,922 9.34
Collective Trust Funds
InternationalEquity 942,911 17.36 DomesticEquity 1,401,665 25.81 MortgageDebtSecurity 28,956 0.53 TreasuryInflation-ProtectedSecurities 218,608 4.03 FixedIncome 106,684 1.96Total Collective Trust Funds 2,698,824 49.70
Collateral From Securities Lending 493,265 9.08
Total Investments $ 5,430,014 100.00%

New York City Board of Education Retirement System
78
INVE
STM
ENT
Sche
dule
of I
nves
tmen
t Ret
urns
(Fix
ed)
Annu
aliz
ed In
vest
men
ts R
esul
ts (U
naud
ited)
Fi
scal
Yea
r End
ed J
une
30, 2
016
3 M
os
6 M
os
1 Yr
3
Yrs
5 Yr
s 10
Yrs
As
sets
As
sets
Apr-1
6 Ja
n-16
Ju
l-15
Jul-1
3 Ju
l-11
Jul-0
6
$K
%
Ju
n-16
Ju
n-16
Ju
n-16
Ju
n-16
Ju
n-16
Ju
n-16
%
%
%
%
%
%
2,
199,
731
44.3
5
U.S
. Equ
ities
2.
53
3.31
1.
37
11.2
7 11
.23
7.35
Russell3000Index
2.63
3.62
2.14
12.56
11.60
7.40
94
2,91
1 19
.01
To
tal I
nter
natio
nal E
quiti
es
-0.1
4 -0
.34
-11.
25
-3.0
3 1.
22
3.79
716,811
14.45
In
t'l. E
quiti
es-D
evel
oped
Mar
kets
MSCIEAFE
-2.79
-6.65
-15.43
-5.39
0.05
0.21
22
6,10
0 4.56
In
t'l. E
quiti
es-E
mer
ging
Mar
kets
MSCIEmergingMarketsFree
0.66
6.41
-12.05
-2.19
-3.78
3.54
3,
142,
642
63.3
5
Tota
l Equ
ities
- Pu
blic
& P
rivat
e
1,23
4,01
0 24
.88
U
.S. F
ixed
Inco
me
3.05
6.
30
4.60
6.
69
4.86
6.
23
476,
001
9.60
Se
curit
ies
lend
ing
- -
- -
- -
10
7,82
1 2.
17
Shor
t-ter
m In
vest
men
ts
0.13
0.
33
0.47
0.
28
0.42
1.
67
4,96
0,47
4 10
0.00
To
tal P
ortf
olio
2.
11
3.44
0.
41
6.64
6.
99
6.31
Yielddatawereobtainedfrom
theNYCBERS
PerformanceOverviewasofJune30,2016
Thesereturnsarecalculatedusingatimeweightedrateofreturnbasedonthemarketvalueoftheportfolio,fortimeperiodsgreaterthanoneyearthereturnsareannualized.

New York City Board of Education Retirement System
79
INVE
STM
ENT
List of 50 Largest Equity Holdings (Fixed)
Fiscal Year Ended June 30, 2016
NAME OF EQUITY HOLDINGS COST FAIR VALUE1GENPACTLTDCOMMONSTOCKUSD.01 $ 2,089,763 $ 3,418,2622MARKELCORPCOMMONSTOCK 1,674,672 3,176,5693ADVANCEAUTOPARTSINCCOMMONSTOCKUSD.0001 1,262,863 3,137,5624VANTIVINCCLACOMMONSTOCKUSD.00001 1,188,071 2,951,2945EQUIFAXINCCOMMONSTOCKUSD1.25 1,034,156 2,891,8256LENNOXINTERNATIONALINCCOMMONSTOCKUSD.01 827,310 2,842,4467M&TBANKCORPCOMMONSTOCKUSD.5 2,130,518 2,806,4268WASTECONNECTIONSINCCOMMONSTOCK 2,518,410 2,770,2509IDEXCORPCOMMONSTOCKUSD.01 1,519,724 2,481,30810GLOBALPAYMENTSINCCOMMONSTOCK 1,981,959 2,465,32211NVRINCCOMMONSTOCKUSD.01 929,890 2,451,52812METTLERTOLEDOINTERNATIONALCOMMONSTOCKUSD.01 1,967,231 2,395,70013UGICORPCOMMONSTOCK 1,052,229 2,367,97814DENTSPLYSIRONAINCCOMMONSTOCKUSD.01 1,554,389 2,344,67815AKAMAITECHNOLOGIESINCCOMMONSTOCKUSD.01 2,026,042 2,208,34016TRANSUNIONCOMMONSTOCKUSD.01 1,673,323 2,181,96017VERISIGNINCCOMMONSTOCKUSD.001 1,085,350 2,060,51518TRIMBLEINCCOMMONSTOCK 2,196,595 2,033,13419NATIONALINSTRUMENTSCORPCOMMONSTOCKUSD.01 1,999,411 2,010,50220CARMAXINCCOMMONSTOCKUSD.5 1,369,056 1,938,94021FACTSETRESEARCHSYSTEMSINCCOMMONSTOCKUSD.01 1,154,745 1,918,63822ROBERTHALFINTLINCCOMMONSTOCKUSD.001 1,360,764 1,903,91723WATERSCORPCOMMONSTOCKUSD.01 1,180,700 1,885,97624FIRSTREPUBLICBANK/CACOMMONSTOCKUSD.01 866,111 1,850,53625GUIDEWIRESOFTWAREINCCOMMONSTOCKUSD.0001 1,595,756 1,833,28426HUNT(JB)TRANSPRTSVCSINCCOMMONSTOCKUSD.01 1,536,801 1,824,48627AMPHENOLCORPCLACOMMONSTOCKUSD.001 1,028,567 1,816,78828ALLEGHENYCORPCOMMONSTOCKUSD1.0 1,050,700 1,811,41629PATTERSONCOSINCCOMMONSTOCKUSD.01 1,380,424 1,766,42330WEXINCCOMMONSTOCKUSD.01 1,496,175 1,756,99631HARLEYDAVIDSONINCCOMMONSTOCKUSD.01 1,336,123 1,733,63132TRIPADVISORINCCOMMONSTOCKUSD.001 1,523,168 1,677,65133ALKERMESPLCCOMMONSTOCKUSD.01 1,124,092 1,674,77534GENESEE&WYOMINGINCCLACOMMONSTOCKUSD.01 2,465,004 1,652,84035BALLCORPCOMMONSTOCK 1,575,093 1,606,57336UNIVERSALHEALTHSERVICESBCOMMONSTOCKUSD.01 921,192 1,566,42237CDWCORP/DECOMMONSTOCKUSD.01 1,339,229 1,554,06238QEPRESOURCESINCCOMMONSTOCKUSD.01 1,538,370 1,547,98539ENERGENCORPCOMMONSTOCKUSD.01 1,963,837 1,543,73240MSCIINCCOMMONSTOCKUSD.01 920,263 1,537,07941ALLISONTRANSMISSIONHOLDINGCOMMONSTOCKUSD.01 1,158,695 1,505,36542WHITEMOUNTAINSINSURANCEGPCOMMONSTOCKUSD1.0 1,051,934 1,495,39243NORTHERNTRUSTCORPCOMMONSTOCKUSD1.667 1,472,854 1,408,88644MSCINDUSTRIALDIRECTCOACOMMONSTOCKUSD.001 1,322,386 1,360,82045NEWFIELDEXPLORATIONCOCOMMONSTOCKUSD.01 1,061,473 1,355,66346HARMANINTERNATIONALCOMMONSTOCKUSD.01 2,120,773 1,328,09547SEIINVESTMENTSCOMPANYCOMMONSTOCKUSD.01 560,082 1,276,55148AMERCOCOMMONSTOCKUSD.25 899,487 1,256,61549PATTERSONUTIENERGYINCCOMMONSTOCKUSD.01 1,119,492 1,235,28150FASTENALCOCOMMONSTOCKUSD.01 1,059,684 1,231,290
NOTE: Fulllistingofholdingscanbeobtainedat NYC Board of Education Retirement System 65 Court Street, Room 1603, Brooklyn, NY 11201

New York City Board of Education Retirement System
80
INVE
STM
ENT
List of 50 Largest Bond Holdings (Fixed) Fiscal Year Ended June 30, 2016
NAME OF BOND HOLDINGS PAR VALUE FAIR VALUE1GNMAIITBA30YR3.5JUMBOS $ 26,903,656 $ 26,989,7612FNMATBA30YR4SINGLEFAMILYMORTGAGE 23,857,804 23,888,2063GNMAIITBA30YR4JUMBOS 22,575,488 22,606,0214GNMAIITBA30YR3JUMBOS 13,208,833 13,312,1975FNMAPOOLAO2974FN05/42FIXED3.5 10,321,905 10,377,6226FNMAPOOLAS7245FN05/46FIXED3.5 10,259,833 10,296,6427FNMAPOOL890720FN07/44FIXEDVAR 9,907,792 9,949,7878FEDHMLNPCPOOLG08693FG03/46FIXED3.5 9,457,219 9,543,1319GNMAPOOL736570GN03/40FIXED4.5 7,147,122 7,288,55910USTREASURYN/B08/232.5 6,478,002 7,182,41211FNMATBA30YR4SINGLEFAMILYMORTGAGE 7,137,785 7,156,66812USTREASURYN/B05/443.375 5,962,461 7,098,97013FNMAPOOLAT2720FN05/43FIXED3 6,912,523 7,056,73114FNMAPOOLAL7521FN06/39FIXEDVAR 6,785,882 6,805,26715FNMATBA30YR3SINGLEFAMILYMORTGAGE 6,701,017 6,713,33416USTREASURYN/B08/403.875 4,185,928 5,906,17417USTREASURYN/B08/221.625 5,554,788 5,705,71518FNMAPOOLAR9195FN03/43FIXED3 5,530,524 5,645,90119FNMATBA30YR4.5SINGLEFAMILYMORTGAGE 5,495,786 5,492,73020FNMAPOOLAS6880FN03/46FIXED3.5 5,280,573 5,301,95621USTREASURYN/B05/252.125 4,624,752 4,901,18622USTREASURYN/B02/433.125 3,813,636 4,821,25123FEDHMLNPCPOOLQ38643FG02/46FIXED3.5 4,715,852 4,762,31824FHLMCTBA30YR4GOLDSINGLEFAMILY 4,695,625 4,705,27225FNMAPOOLAX2516FN10/29FIXED3.5 4,652,962 4,673,65726USTREASURYN/B08/242.375 4,061,387 4,311,02227FANNIEMAENOTES09/242.625 3,819,804 4,147,59528USTREASURYN/B10/221.875 3,693,393 3,855,06129FNMAPOOLAS1091FN11/43FIXED4 3,611,825 3,667,45530FNMAPOOLAL5611FN08/44FIXEDVAR 3,290,896 3,351,71731USTREASURYN/B02/261.625 3,172,078 3,236,00032FHLMCTBA30YR4GOLDSINGLEFAMILY 3,186,280 3,194,87533USTREASURYN/B02/222 3,056,020 3,173,68334FNMAPOOLBC4873FN03/46FIXED3.5 3,067,363 3,100,97335USTREASURYN/B12/212.125 2,928,903 3,020,45536USTREASURYN/B02/231.5 2,922,258 2,967,50037GNMAIIPOOL004113G204/38FIXED5 2,815,898 2,919,63738FNMAPOOL725423FN05/34FIXEDVAR 2,909,997 2,903,40139USTREASURYN/B05/414.375 2,384,074 2,855,78040ALCATELLUCENTUSAINCSRUNSECURED03/296.45 1,908,284 2,757,41341GNMAITBA30YR4.5SINGLEFAMILYMORTGAGE 2,736,313 2,751,15042USTREASURYN/B11/433.75 2,162,016 2,731,11743FNMAPOOLAP9726FN10/42FIXED3 2,669,048 2,728,35544FNMATBA30YR5SINGLEFAMILYMORTGAGE 2,666,438 2,666,54445FEDHMLNPCPOOLG60250FG10/45FIXED3.5 2,610,195 2,659,91946USTREASURYN/B02/404.625 1,933,862 2,646,07247STRIPPRINC11/210.00000 1,466,088 2,639,28048FREDDIEMACNOTES05/201.375 2,585,180 2,639,20849GNMAPOOL782386GN08/38FIXED5 2,556,144 2,597,22350FNMAPOOLAS2462FN05/29FIXED3 2,559,160 2,570,014
NOTE: Fulllistingofholdingscanbeobtainedat NYC Board of Education Retirement System 65 Court Street, Room 1603, Brooklyn, NY 11201

New York City Board of Education Retirement System
81
INVE
STM
ENT
List of 50 Largest International Equity Holdings (Fixed)
Fiscal Year Ended June 30, 2016
NAME OF INT'L EQUITY HOLDINGS COST FAIR VALUE1INDUSTRIADEDISENOTEXTIL $ 11,013,319 $ 17,498,2002SOFTBANKGROUPCORP 15,141,039 15,008,1183AIAGROUPLTD 9,895,923 13,906,5744M3INC 7,307,441 13,678,0805SAMSUNGELECTRONICSCOLTD 10,971,469 13,607,4176ARMHOLDINGSPLC 8,120,359 11,109,5867L'OREAL 7,153,103 10,149,1168ROLLSROYCEHOLDINGSPLC 12,417,671 9,831,6909ATLASCOPCOABASHS 7,839,298 9,717,39410TENCENTHOLDINGSLTD 1,905,437 9,534,15511TOTALSA 9,407,225 9,485,52912ROYALDUTCHSHELLPLCBSHS 10,362,542 9,281,38013NOVARTISAGREG 6,917,922 9,160,79814NESTLESAREG 6,508,841 8,663,29115RAKUTENINC 6,203,665 8,613,36516ZALANDOSE 9,158,027 7,707,29417UNITEDOVERSEASBANKLTD 8,766,248 7,505,24418ASMLHOLDINGNV 6,159,983 7,462,72319PRUDENTIALPLC 5,256,658 7,254,73620CRHPLC 5,226,745 7,248,65321CHINAMOBILELTD 6,346,202 7,139,85222JARDINEMATHESONHLDGSLTD 7,183,712 6,791,87223CHINACONSTRUCTIONBANKH 7,952,070 6,698,43224SVENSKAHANDELSBANKENASHS 5,984,681 6,497,08325KINNEVIKABB 10,168,115 6,420,90626NOVONORDISKA/SB 2,575,707 6,359,65527HSBCHOLDINGSPLC 10,804,070 6,330,12428FIATCHRYSLERAUTOMOBILESNV 4,502,715 6,250,72629HONDAMOTORCOLTD 8,406,568 6,230,27230CHINAMOBILELTD 6,467,527 6,196,40631SWATCHGROUPAG/THEBR 7,977,693 5,928,22632SMCCORP 3,884,761 5,695,97633BOSKALISWESTMINSTER 6,331,026 5,576,05434BANCOSANTANDERSA 11,100,533 5,483,94835TESCOPLC 10,865,670 5,468,43236DENSOCORP 5,776,468 5,290,84437KERING 4,946,502 5,002,86238BAYERISCHEMOTORENWERKEAG 5,108,279 4,980,33539HONHAIPRECISIONINDUSTRY 4,428,492 4,889,49840ANGLOAMERICANPLC 8,377,899 4,816,79041LAFARGEHOLCIMLTDREG 7,224,934 4,782,16442GENMABA/S 2,932,006 4,747,14043HONGKONGLANDHOLDINGSLTD 5,066,365 4,695,22044SHINETSUCHEMICALCOLTD 4,645,589 4,678,24945CIEFINANCIERERICHEMONTREG 4,326,461 4,641,33746TRAVISPERKINSPLC 5,113,169 4,592,23247TENAGANASIONALBHD 3,124,242 4,554,52048SBMOFFSHORENV 6,003,029 4,513,36049CARNIVALPLC 3,508,185 4,431,47350BANKOFNOVASCOTIA 4,729,678 4,342,253
NOTE: Fulllistingofholdingscanbeobtainedat NYC Board of Education Retirement System 65 Court Street, Room 1603, Brooklyn, NY 11201

New York City Board of Education Retirement System
82
INVE
STM
ENT
List of 50 Largest EAFE Investment Holdings (Fixed) Fiscal Year Ended June 30, 2016
NAME OF EAFE INVESTMENT HOLDINGS COST FAIR VALUE1INDUSTRIADEDISENOTEXTIL $ 11,013,319 $ 17,498,2002SOFTBANKGROUPCORP 15,141,039 15,008,1183AIAGROUPLTD 9,895,923 13,906,5744M3INC 7,307,441 13,678,0805ARMHOLDINGSPLC 8,120,359 11,109,5866L'OREAL 7,153,103 10,149,1167ROLLSROYCEHOLDINGSPLC 12,417,671 9,831,6908ATLASCOPCOABASHS 7,839,298 9,717,3949TENCENTHOLDINGSLTD 1,905,437 9,534,15510TOTALSA 9,407,225 9,485,52911ROYALDUTCHSHELLPLCBSHS 10,362,542 9,281,38012NOVARTISAGREG 6,917,922 9,160,79813NESTLESAREG 6,508,841 8,663,29114RAKUTENINC 6,203,665 8,613,36515ZALANDOSE 9,158,027 7,707,29416UNITEDOVERSEASBANKLTD 8,766,248 7,505,24417ASMLHOLDINGNV 6,159,983 7,462,72318PRUDENTIALPLC 5,256,658 7,254,73619CRHPLC 5,226,745 7,248,65320CHINAMOBILELTD 6,346,202 7,139,85221JARDINEMATHESONHLDGSLTD 7,183,712 6,791,87222CHINACONSTRUCTIONBANKH 7,952,070 6,698,43223SVENSKAHANDELSBANKENASHS 5,984,681 6,497,08324KINNEVIKABB 10,168,115 6,420,90625NOVONORDISKA/SB 2,575,707 6,359,65526HSBCHOLDINGSPLC 10,804,070 6,330,12427FIATCHRYSLERAUTOMOBILESNV 4,502,715 6,250,72628HONDAMOTORCOLTD 8,406,568 6,230,27229CHINAMOBILELTD 6,467,527 6,196,40630SWATCHGROUPAG/THEBR 7,977,693 5,928,22631SMCCORP 3,884,761 5,695,97632BOSKALISWESTMINSTER 6,331,026 5,576,05433BANCOSANTANDERSA 11,100,533 5,483,94834TESCOPLC 10,865,670 5,468,43235DENSOCORP 5,776,468 5,290,84436KERING 4,946,502 5,002,86237BAYERISCHEMOTORENWERKEAG 5,108,279 4,980,33538ANGLOAMERICANPLC 8,377,899 4,816,79039LAFARGEHOLCIMLTDREG 7,224,934 4,782,16440GENMABA/S 2,932,006 4,747,14041HONGKONGLANDHOLDINGSLTD 5,066,365 4,695,22042SHINETSUCHEMICALCOLTD 4,645,589 4,678,24943CIEFINANCIERERICHEMONTREG 4,326,461 4,641,33744TRAVISPERKINSPLC 5,113,169 4,592,23245SBMOFFSHORENV 6,003,029 4,513,36046CARNIVALPLC 3,508,185 4,431,47347FERRARINV 2,375,252 4,337,07648LLOYDSBANKINGGROUPPLC 6,677,330 4,267,01949NOKIANRENKAATOYJ 3,959,925 4,233,65650BASFSE 5,069,675 4,115,127
NOTE: Fulllistingofholdingscanbeobtainedat NYC Board of Education Retirement System 65 Court Street, Room 1603, Brooklyn, NY 11201

New York City Board of Education Retirement System
83
INVE
STM
ENT
List of 50 Largest Emerging Market Investment Holdings (Fixed)
Fiscal Year Ended June 30, 2016
NAME OF EMERGING MARKET HOLDINGS COST FAIR VALUE1SAMSUNGELECTRONICSCOLTD $ 10,971,469 $ 13,607,4172HONHAIPRECISIONINDUSTRY 4,428,492 4,889,4983TENAGANASIONALBHD 3,124,242 4,554,5204KOREAELECTRICPOWERCORP 3,204,555 4,206,0765TIGERBRANDSLTD 4,183,714 3,971,0516GAILINDIALTD 4,181,146 3,948,9147TELEKOMUNIKASIINDONESIAPER 3,174,844 3,846,9648PTTPCL/FOREIGN 4,320,157 3,835,1079STATEBANKOFINDIA 3,450,603 3,684,68610SASOLLTD 5,006,040 3,544,78511FIRSTRANDLTD 3,391,567 3,323,07212TATAMOTORSLTD 2,823,158 3,256,66313SKHYNIXINC 4,497,574 3,172,37814BHARATPETROLEUMCORPLTD 2,355,362 3,097,71315CELLTRIONINC 1,184,481 2,868,42116FUBONFINANCIALHOLDINGCO 2,198,884 2,761,51617PEGATRONCORP 2,218,130 2,727,65618GRUMAS.A.B.B 838,965 2,721,24719POLSKIKONCERNNAFTOWYORLEN 2,039,781 2,451,02520BRFSA 4,131,341 2,430,63521KIAMOTORSCORP 2,711,065 2,391,74722CJCORP 1,125,124 2,362,74923HINDUSTANPETROLEUMCORP 1,741,952 2,355,69124HINDALCOINDUSTRIESLTD 2,367,918 2,227,78025 HCL TECHNOLOGIES LTD 1,515,352 2,226,551 26LGELECTRONICSINC 2,684,860 2,167,59927JBSSA 2,449,129 2,143,13928MRFLTD 1,130,288 2,129,60629NAVERCORP 1,105,351 2,061,67430BANKNEGARAINDONESIAPERSER 2,322,434 2,052,72731BMFBOVESPASA 1,275,325 2,041,11832SASOLLTD 3,267,482 2,011,16733PTTGLOBALCHEMICALPCLFOR 2,469,315 1,934,27334INDIANOILCORPLTD 1,831,547 1,928,77435KOCHOLDINGAS 1,906,552 1,911,65236LGDISPLAYCOLTD 2,168,836 1,883,67437BRASKEMSAPREFA 2,322,725 1,753,11738RAIADROGASILSA 1,075,536 1,724,31339INNOLUXCORP 2,694,777 1,722,99140GRUPOAEROPORTDELPACIFICB 944,225 1,600,25741BANCODOBRASILS.A. 3,522,211 1,587,79342TURKIYEISBANKASIC 2,726,999 1,560,28943TIPCOASPHALTPCLFOREIGN 1,212,434 1,519,53144STANDARDBANKGROUPLTD 1,987,786 1,497,53445LOTTECHEMICALCORP 1,398,235 1,463,93246SKTELECOM 1,347,022 1,439,93147SKINNOVATIONCOLTD 1,326,714 1,437,15748BARWAREALESTATECO 2,091,794 1,412,40549THANACHARTCAPITALFOREIGN 1,425,954 1,327,81250FIBRIACELULOSESA 2,268,404 1,320,764
NOTE: Fulllistingofholdingscanbeobtainedat NYC Board of Education Retirement System 65 Court Street, Room 1603, Brooklyn, NY 11201

New York City Board of Education Retirement System
84
INVE
STM
ENT
List of Largest Tips Holdings (Fixed) Fiscal Year Ended June 30, 2016
NAME OF LARGEST TIPS HOLDINGS PAR VALUE FAIR VALUE1TIPSSTATESTREET $ 213,313,964 $ 218,588,4172TIPSPIMCO 3,979,234 19,812
NOTE: Fulllistingofholdingscanbeobtainedat NYC Board of Education Retirement System 65 Court Street, Room 1603, Brooklyn, NY 11201

New York City Board of Education Retirement System
85
INVE
STM
ENT
List of 50 Largest Economically Targeted Investment Holdings (Fixed)
Fiscal Year Ended June 30, 2016
NAME OF ECONOMICALLY TARGETED INVESTMENT HOLDINGS PAR VALUE FAIR VALUE1AFLCIOHOUSINGINVTRUST$ 15,462,258 $ 16,013,2432BOABANKOFAMERICAPPAR1% 525,603 649,3033JPMCHASE-PPAR1% 383,063 408,5854JPMCHASE-PPAR1% 302,067 337,9965CCDCITIBANKNAPPAR1% 264,918 297,2566BOABANKOFAMERICAPPAR1% 278,144 295,0547FNMAPOOLAW0982 278,460 289,4998FNMAPOOLAU1707 260,065 274,4389BOABANKOFAMERICAPPAR1% 258,681 271,67910LIIFLOWINCOMEINVESTMENTFU1% 234,833 261,77111FNMAPOOLAU7004 241,473 248,76412FNMAPOOLAV0680 213,168 221,49213GOVERNMENTNATIONALMORTGAGE 211,719 212,59414FNMAPOOL466026 207,808 210,36015FNMAPOOLAU6719 192,956 200,46316FNMAPOOLAW3604 190,247 194,88117COMMUNITYPRESERVATIONCORP. 173,434 184,13218JPMCHASE-PPAR1% 167,357 182,90819FNMAPOOLAV7745 171,021 178,78620FNMAPOOLAB7800 168,840 169,36221FNMAPOOLAW6468 161,940 167,28922GOVERNMENTNATIONALMORTGAGE 162,620 162,25623LIIFLOWINCOMEINVESTMENTFU1% 137,500 147,08424JPMCHASE-PPAR1% 128,500 145,52425CCDCITIBANKNAPPAR1% 115,664 142,90026LIIFLOWINCOMEINVESTMENTFU1% 110,313 141,16027CCDCITIBANKNAPPAR1% 115,958 140,90628CCDCITIBANKNAPPAR1% 113,704 140,47829BOABANKOFAMERICAPPAR1% 126,224 138,94430FNMAPOOLAV7090 134,162 137,57531CCDCITIBANKNAPPAR1% 112,092 136,20932JPMCHASE-PPAR1% 119,245 128,26033FNMAPOOLAV3535 115,929 119,83334FHLMCMULTIFAMILYSTRUCTUREDP 117,589 119,18735FNMAPOOLAW5048 112,804 115,81736GNMAPOOLAF9426 110,808 113,30237JPMCHASE-PPAR1% 98,912 111,81138BOABANKOFAMERICAPPAR1% 87,196 110,34139LIIFLOWINCOMEINVESTMENTFU1% 88,819 109,53640LIIFLOWINCOMEINVESTMENTFU1% 84,724 107,16141FNMAPOOL469393 105,332 105,76842FNMAPOOLAU8082 98,002 103,86743FNMAPOOLAV1504 99,095 102,51844JPMCHASE-PPAR1% 84,794 100,81945FNMAPOOLAB7476 99,546 98,51946FNMAPOOLAI3490 91,857 98,46747FNMAPOOLAO3388 92,779 93,73948COMMUNITYPRESERVATIONCORP. 84,848 91,82349FNMAPOOLAK6714 88,956 91,11550LIIFLOWINCOMEINVESTMENTFU1% 85,385 90,189
NOTE: Fulllistingofholdingscanbeobtainedat NYC Board of Education Retirement System 65 Court Street, Room 1603, Brooklyn, NY 11201

New York City Board of Education Retirement System
86
INVE
STM
ENT
Largest 50 Domestic Equity Holdings “Variable A” Program Fiscal Year Ended June 30, 2016
NAME OF DOMESTIC EQUITY HOLDINGS “VARIABLE A” PROGRAM COST FAIR VALUE1GMO-U.S.EQUITYALLOCATIONFUNDIV $ 8,235,250 $ 7,525,9812GMOINTERNATIONALEQUITYFUNDOPEN-ENDFUND 7,787,418 6,812,5313GMO-ASSETALLOCATIONBONDFUNDIII 7,785,226 6,721,8364FPACRESCENTFUNDOPEN-ENDFUND 5,919,435 6,088,2275APPLEINC 1,574,782 6,026,1666MICROSOFTCORP 3,578,565 5,463,6047EXXONMOBILCORP 3,364,394 4,243,0368JOHNSON&JOHNSON 2,430,931 4,108,4629COMCASTCORP 2,531,442 3,961,76610FACEBOOKINC 1,717,660 3,658,74911GENERALELECTRICCO 3,564,220 3,446,33512BERKSHIREHATHAWAYINC 2,147,227 3,320,47213AT&TINC 2,373,580 3,306,77914UNITEDHEALTHGROUPINC 1,531,214 3,222,75715PFIZERINC 2,290,209 3,114,50116 ALPHABET INC 1,635,120 3,091,357 17PROCTER&GAMBLECO 2,453,622 3,083,64818AMAZON.COMINC 579,317 3,043,40319ALLERGANPLC 2,504,048 3,005,77520VERIZONCOMMUNICATIONSINC 2,081,320 2,919,32421JPMORGANCHASE&CO 2,196,557 2,809,78922AMGENINC 1,897,365 2,730,33123GMOCURRENCYHEDGEDINTERNATIONALBONDFUND 2,626,795 2,687,58924WELLSFARGO&CO 2,855,536 2,668,29825ALPHABETINC 1,247,756 2,534,68526BIOGENINC 2,629,047 2,420,13727PHILIPMORRISINTERNATIONALINC 1,358,436 2,285,90828MERCK&COINC 1,647,339 2,252,55429PEPSICOINC 1,401,753 2,163,03930CHEVRONCORP 1,537,869 2,125,49231WALTDISNEYCO 941,536 2,065,89632ALTRIAGROUPINC 842,327 1,981,25633COCA-COLACO 1,157,021 1,957,21034MEDTRONICPLC 1,074,092 1,939,76135CITIGROUPINC 4,307,285 1,915,96036INTELCORP 1,311,972 1,910,98237CISCOSYSTEMSINC 1,716,662 1,878,51638VISAINC 736,349 1,864,84839HOMEDEPOTINC 677,049 1,846,06540BANKOFAMERICACORP 4,429,829 1,767,68641ORACLECORP 995,107 1,676,52442BRISTOL-MYERSSQUIBBCO 826,046 1,662,59843INTERNATIONALBUSINESSMACHINESCORP 1,188,401 1,628,09944THERMOFISHERSCIENTIFICINC 958,637 1,579,68545CELGENECORP 931,666 1,564,65346GMO-QUALITYFUND-V 1,451,910 1,454,42347WAL-MARTSTORESINC 1,019,978 1,423,40448QUALCOMMINC 1,328,678 1,396,31949GILEADSCIENCESINC 510,603 1,367,75250BROADCOMLTD 806,719 1,357,798
NOTE: Fulllistingofholdingscanbeobtainedat NYC Board of Education Retirement System 65 Court Street, Room 1603, Brooklyn, NY 11201

New York City Board of Education Retirement System
87
INVE
STM
ENT
Schedule of Payments of Commissions to Brokers
Fiscal Year Ended June 30, 2016
INDIVIDUAL OR COMMISSION COMMISSION BROKERAGE FIRM # OF SHARES PAID PER SHARE (in $)ABLENOSER 3,002 81 0.027ACADEMY SECURITIES INC 34,592 692 0.020AGORACORDETITULEVALMOB 186,384 1,545 0.008ALLEN & COMPANY LLC 3,339 134 0.040AMERICANPORTFOLIOSFINANIAL 370 19 0.050ASCENDIANTCAPITALMARKETS,LLC 1,586 48 0.030AVONDALEPARTNERSLLC 6,263 213 0.034B.RILEY&CO.,LLC 13,616 344 0.025BANCO SANTANDER CENTRAL HISPANO 3,644 204 0.056BANKJ.VONTOBELUNDCO.AG 7,554 2,610 0.346BARCLAYSBANKPLC 3,007 26 0.009BARCLAYS CAPITAL 232,013 689 0.003BARCLAYS CAPITAL INC 296 9 0.030BARCLAYSCAPITALINC./LE 2,398,573 8,938 0.004BARCLAYS CAPITAL LE 47,107 890 0.019BARRINGTON RESEARCH ASSOCIATES 1,591 48 0.030BB&T SECURITIES, LLC 14,862 470 0.032BERENBERG 5,339 160 0.030BLOOMBERGTRADEBOOKLLC 62,376 1,661 0.027BMOCAPITALMARKETS 8,336 175 0.021BNPPARIBASPRIMEBROKERAGE,INC. 3,393 102 0.030BNPPARIBASSECURITIESSERVICE 1,962,907 2,456 0.001BNPPARIBASSECURITIESSERVICES 4,516 425 0.094BNPPARIBASSECURITIESSERVICESSA 57,462 1,620 0.028BNYCONVERGEXEXECUTIONSOLUTIONSLLC 2,456,286 12,097 0.005BNYCONVERGEXLJR 354 7 0.020BREAN CAPITAL LLC 15,616 559 0.036BROADCORT CAPITAL CORP 605 12 0.020BTIG, LLC 61,356 2,114 0.034BUCKINGHAMRESEARCHGROUPINC 4,163 167 0.040BURKEANDQUICKPARTNERSLLC 183 6 0.035CABRERACAPITALMARKETS 129,869 1,896 0.015CACEISBANKDEUTSCHLANDGMBH 5,963 1,862 0.312CANACCORDGENUITYINC. 44,190 1,358 0.031CANADIANIMPERIALBANKOFCOMMERCE 51,681 1,040 0.020CANTORFITZGERALD&CO/CASTLEOAKSEC 32,881 658 0.020CANTORFITZGERALD&CO. 26,885 628 0.023CANTORFITZGERALD/CANTORCLEARINGSERV 333,357 1,000 0.003CAPITALINSTITUTIONALSVCSINCEQUITIES 27,361 1,366 0.050CHEEVERS&CO.INC. 392,574 6,676 0.017CHINAFORTUNESECURITIES.,LTD 217,896 665 0.003CHINA INTERNATIONAL CAPITAL CORPORA 23,230 27 0.001CIBCWORLDMKTSINC 8,517 264 0.031CIMBSECURITIES(HK)LTD. 18,245 39 0.002CITATION GROUP 30,344 1,515 0.050CITIBANKN.A. 23,625 915 0.039CITIBANKOFCOLOMBIA 36,546 242 0.007CITIGROUPGLOBALMARKETSINC 1,995,984 7,253 0.004CITIGROUPGLOBALMARKETSINC. 5,992,820 2,155 0.000CITIGROUPGLOBALMARKETSINDIA 95,748 323 0.003CITIGROUPGLOBALMARKETSLIMITED 1,793,527 6,658 0.004CLSA AUSTRALIA PTY LTD 369,264 1,876 0.005

New York City Board of Education Retirement System
88
INVE
STM
ENT
Schedule of Payments of Commissions to Brokers Fiscal Year Ended June 30, 2016 (Cont’d)
INDIVIDUAL OR COMMISSION COMMISSION BROKERAGE FIRM # OF SHARES PAID PER SHARE (in $)CLSASINGAPOREPTELTD. 3,587,069 6,658 0.002COMPASS POINT RESEARCH & TRADING, LLC 12,706 504 0.040CONVERGEXEXECUTIONSOLUTIONSLLC 41,615 1,248 0.030CONVERGEXLLC 6,342 221 0.035COWEN AND COMPANY, LLC 70,755 2,359 0.033CRAIG-HALLUM 66,815 1,959 0.029CREDITLYONNAISSECURITIES(USA)INC 23,519 1,062 0.045CREDIT LYONNAIS SECURITIES INDIA 1,857,083 17,690 0.010CREDITLYONNAISSECURITIES(ASIA) 15,332,858 9,200 0.001CREDIT RESEARCH & TRADING LLC 13,035 465 0.036CREDITSUISSESECSINDIAPRIVATELTD 13,090 354 0.027CREDITSUISSESECURITIES(EUROPE)LTD 868,905 5,022 0.006CREDITSUISSESECURITIES(USA)LLC 7,645,212 13,047 0.002CSIUSINSTITUTIONALDESK 8,162 286 0.035CUTTONE&CO. 900 32 0.035DAIWA SBCM EUROPE 16,124 250 0.016DAIWASECURITIES(HK)LTD. 181,862 65 0.000DAIWA SECURITIES AMERICA INC 130,127 1,693 0.013DANSKEBANKA.S. 308,752 1,051 0.003DAVIDSOND.A.&COMPANYINC. 9,057 247 0.027DAVYSTOCKBROKERS 23,931 932 0.039DBSVICKERSSECURITIES(SINGAPORE) 21,372 352 0.016DEUTSCHEBANKAGLONDON 793,386 2,871 0.004DEUTSCHEBANKSECURITIESINC 12,448,835 17,576 0.001DEUTSCHE SECURITIES ASIA LIMITED 481,965 520 0.001DOUGHERTY & COMPANY LLC 23,083 752 0.033DOUGHERTY COMPANY 10,065 299 0.030DREXEL HAMILTON LLC 37,790 1,007 0.027DSP MERRILL LYNCH LTD 442,176 1,021 0.002FBNSECURITIESINC 632 25 0.040FBRCAPITALMARKETS&CO. 7,640 254 0.033FEDERATEDMANAGEDGROWTH&INCOME17A7 275,006 2,062 0.007FIDELITYCAPITALMARKETS 2,451 49 0.020FIDELITYCLEARINGCANADAULC 76,867 1,537 0.020FIRSTANALYSISSECURITIESCORP 1,638 49 0.030GABELLI &COMPANY 4,263 171 0.040GOLDMAN SACHS & CO 8,177,179 18,022 0.002GOLDMANSACHS&COINTL. 106 8 0.076GOLDMAN SACHS INTERNATIONAL 192,156 1,733 0.009GUGGENHEIMCAPITALMARKETSLLC 14,975 524 0.035GUZMANANDCOMPANY 5,232 105 0.020HEIGHT SECURITIES, LLC 9,743 341 0.035HONGKONGANDSHAGHAIBANKINGCORPO 1,234,818 615 0.000HSBCBANKBRASILSABANCOMULTIPLO 22,692 6 0.000HSBCBANKPLC 588,756 3,229 0.005HSBC SECURITIES 1,657,334 1,640 0.001HSBCSECURITIES(USA)INC. 1,871,600 1,893 0.001HSBC SECURITIES INDIA HOLDINGS 32,497 672 0.021ICAPDOBRASILDTVMLTDA 530,228 2,515 0.005ICBCFINCLSVCS,EQUITYCLEARANCE 956 6 0.006ICICIBROKERAGESERVICES 215,937 432 0.002IMPERIAL CAPITAL LLC 3,043 91 0.030

New York City Board of Education Retirement System
89
INVE
STM
ENT
Schedule of Payments of Commissions to Brokers Fiscal Year Ended June 30, 2016
(Cont’d)
INDIVIDUAL OR COMMISSION COMMISSION BROKERAGE FIRM # OF SHARES PAID PER SHARE (in $)INDUSTRIALANDCOMMERCIALBANK 4,389 128 0.029INSTINET 516,712 6,232 0.012INSTINETAUSTRALIACLEARINGSRVCPTYLTD 327,634 741 0.002INSTINET LLC 212,797 449 0.002INSTINETPACIFICLIMITED 9,633,480 7,505 0.001INSTINETSINGAPORESERVICESPT 1,877,618 1,851 0.001INSTINETU.K.LTD 9,683,014 19,783 0.002INVESTECBANKPLC 9,022,781 1,774 0.000INVESTMENTTECHNOLOGYGROUPINC. 731,810 7,193 0.010INVESTMENTTECHNOLOGYGROUPLTD 892,766 7,158 0.008ISI GROUP INC 67,763 1,362 0.020ITG CANADA 11,648 72 0.006ITG INC 11,753 126 0.011ITGINC. 28,593 811 0.028ITGSECURITIES(HK)LTD 291,921 432 0.001JPMORGANSECURITIESINC 20,657 446 0.022J.P.MORGANCLEARINGCORP. 777,046 4,302 0.006J.P.MORGANSECURITIES(TAIWAN)LTD 2,270,344 934 0.000J.P.MORGANSECURITIESINC. 186,741 3,954 0.021J.P.MORGANSECURITIES(FAREAST)LTDSEOUL 22,506 845 0.038JANNEYMONTGOMERY,SCOTTINC 9,017 312 0.035JEFFERIES&COMPANYINC 278,306 5,306 0.019JEFFERIESINTERNATIONALLTD 169,781 315 0.002JMPSECURITIES 16,306 423 0.026JNKSECURITIESINC 8,586 279 0.032JOHBERENBERGGOSSLERANDCO 70,085 1,592 0.023JOHNSONRICE&COMPANYLLC 18,557 522 0.028JOHNSONRICE&CO 9,080 268 0.029JONESTRADINGINSTITUTIONALSERVICESLLC 121,661 2,635 0.022JPMORGANSECURITIESPLC 1,093,361 4,578 0.004JPMORGANSECURITIESSINGAPORE 53,945 46 0.001JPMORGANCHASEBANKNALONDON 16,559 79 0.005JPMORGANSECURITIES(ASIAPACIFIC)LTD 1,325,703 140 0.000KBSECURITIESNV 69,628 1,231 0.018KCGAMERICASLLC 53,043 163 0.003KEEFEBRUYETTE&WOODSINC 68,977 2,139 0.031KEPLEREQUITIESPARIS 11,837 754 0.064KEYBANCCAPITALMARKETSINC 68,579 2,343 0.034KING,CL,&ASSOCIATES,INC 333,915 6,880 0.021KINGSWAYFINANCIALSVCSGROUPLTD 254,611 541 0.002KNIGHTEQUITYMARKETSL.P. 100,867 2,076 0.021LADENBURG THALMAN & CO 5,510 144 0.026LEERINKPARTNERSLLC 30,396 1,026 0.034LIQUIDNET INC 790,794 9,456 0.012LONGBOW SECURITIES LLC 2,655 84 0.032LOOPCAPITALMARKETS 1,520,406 10,942 0.007LUMINEX TRADING AND ANALYTICS LLC 3,811 10 0.003MRAMSEYKINGSECURITIESINC 11,675 302 0.026MACQUARIEBANKLIMITED 7,453,577 3,764 0.001MACQUARIECAPITAL(USA)INC 10,926 228 0.021MACQUARIESECURITIES(USA)INC 60,810 1,731 0.028MACQUARIE SECURITIES LTD SEOUL 77,298 3,304 0.043

New York City Board of Education Retirement System
90
INVE
STM
ENT
Schedule of Payments of Commissions to Brokers Fiscal Year Ended June 30, 2016 (Cont’d)
INDIVIDUAL OR COMMISSION COMMISSION BROKERAGE FIRM # OF SHARES PAID PER SHARE (in $)MAINFIRSTBANKDE 62,487 1,688 0.027MAXIM GROUP 10,943 286 0.026MERRILL LYNCH AND CO INC 1,733,108 2,716 0.002MERRILL LYNCH INTERNATIONAL 13,232,871 8,319 0.001MERRILLLYNCHPIERCEFENNER&SMITHINC 2,411,122 19,050 0.008MERRILLLYNCHPIERCEFENNERANDS 285,953 464 0.002MERRILLLYNCHPROFESSIONALCLEARINGCORP 2,641 104 0.039MISCHLERFINANCIALGROUP,INC-EQUITIES 49,043 731 0.015MIZUHOSECURITIESUSAINC. 9,219 324 0.035MKMPARTNERSLLC 37,504 1,389 0.037MORGAN STANLEY AND CO INTERNATIONAL 22,736 1,708 0.075MORGAN STANLEY AND CO INTL TAIPEI METRO 3,957,062 2,808 0.001MORGANSTANLEYANDCO.INTERNATIONAL 2,176,174 2,584 0.001MORGAN STANLEY ASIA LTD 343,996 1,090 0.003MORGAN STANLEY CO INCORPORATED 3,221,512 12,500 0.004MORGANSTANLEYINDIACOMPANYPVTLTD 15,277 119 0.008NATIONALFINANCIALSERVICESCORP. 11,303 286 0.025NATIXIS SECURITIES 72,714 1,979 0.027NEEDHAM & COMPANY 17,544 530 0.030NEEDHAM AND COMPANY LLC 54,280 1,689 0.031NOBLEINTERNATIONALINVESTMENTSINC. 3,682 106 0.029NOMURAFINANCIALADVISORY&SECINDIA 682,927 7,178 0.011NOMURAFINANCIALANDINVESTMENT 50,997 486 0.010NOMURA SECURITIES CO LTD 377,588 204 0.001NORTH SOUTH CAPITAL LLC 42,094 1,512 0.036NORTHLANDSECURITIESINC. 7,958 300 0.038NUMIS SECURITIES LIMITED 3,400 146 0.043OPPENHEIMER&CO.INC. 19,660 614 0.031PAREL 20,230 621 0.031PAVILIONGLOBALMARKETSLTD 1,107,728 3,999 0.004PENSERRA SECURITIES 1,272,799 11,624 0.009PENSERRA SECURITIES LLC 161,014 642 0.004PERSHING LLC 2,714,529 7,726 0.003PERSHING SECURITIES LIMITED 821,745 2,552 0.003PICKERINGENERGYPARTNERS,INC 12,533 439 0.035PIPERJAFFRAY 60,530 1,940 0.032RAYMONDJAMESANDASSOCIATESINC 112,806 3,622 0.032RBCCAPITALMARKETS 75,941 1,866 0.025RBCDOMINIONSECURITIESINC. 31,029 979 0.032REDBURN PARTNERS LLP 1,172,510 5,199 0.004ROBERTW.BAIRDCO.INCORPORATE 149,377 5,045 0.034ROSENBLATT SECURITIES LLC 6,063 167 0.028ROTH CAPITAL PARTNERS LLC 5,181 155 0.030ROYALBANKOFCANADAEUROPELTD 526,131 2,242 0.004SAMSUNG SECURITIES CO LTD 2,743 197 0.072SAMUELARAMIREZ&COMPANYINC 189,182 1,419 0.007SANDLER ONEILL & PART LP 8,051 244 0.030SANDLERONEILLANDPARTNERSL.P. 4,663 147 0.031SANFORDC.BERNSTEINANDCO.LLC 774,582 418 0.001SANFORDC.BERNSTEINLTD 457,169 4,836 0.011SANFORDCBERNSTEINCOLLC 121,342 2,206 0.018SANTANDER CENTRAL HISPANO BOLSA 566,029 1,823 0.003

New York City Board of Education Retirement System
91
INVE
STM
ENT
Schedule of Payments of Commissions to Brokers Fiscal Year Ended June 30, 2016
(Cont’d)
INDIVIDUAL OR COMMISSION COMMISSION BROKERAGE FIRM # OF SHARES PAID PER SHARE (in $)SCOTIACAPITAL(USA)INC 22,854 800 0.035SEAPORT GROUP SECURITIES, LLC 17,722 581 0.033SG AMERICAS SECURITIES LLC 810,762 3,199 0.004SGSECURITIESHK 17,956,933 4,493 0.000SHENYINANDWANGUOSECURITIESCO.LTD 492,892 463 0.001SIDOTI & COMPANY LLC 56,819 1,679.15 0.030SMBCNIKKOCAPITALMARKETSLIMITED 20,926 739 0.035SOCIETE GENERALE LONDON BRANCH 1,082,709 3,816 0.004SPEAR,LEEDSANDKELLOGG 1,399 7 0.005STATESTREETGLOBALMARKETS,LLC 59,905 973 0.016STEPHENS,INC. 101,968 3,432 0.034STERNEAGEE&LEACHINC. 8,898 445 0.050STIFELNICOLAUS&COINC 177,857 5,700 0.032STRATEGAS SECURITIES LLC 31,870 797 0.025STURDIVANTANDCO.,INC. 15,290 459 0.030SUNTRUSTCAPITALMARKETS,INC. 57,801 1,798 0.031TDSECURITIES(USA)LLC 500 5 0.010TELSEYADVISORYGROUPLLC 411,195 11,478 0.028TERAMENKULDEGERLERA.S. 135,137 108 0.001THEHONGKONGANDSHANGHAIBANK 43,554 992 0.023THEVERTICALTRADINGGROUP 8,628 281 0.033TOPEKACAPITALMARKETSINC 211,130 4,680 0.022UBS AG 375,491 6,430 0.017UBS LIMITED 3,544,838 8,889 0.003UBS SECURITIES ASIA LTD 6,886,386 3,014 0.000UBS SECURITIES CANADA INC 61,533 212 0.003UBS SECURITIES LLC 188,325 2,792 0.015VANDHAMSECURITIESCORP 484 15 0.030WEDBUSH MORGAN SECURITIES INC 26,876 758 0.028WEEDEN&CO. 30,226 1,075 0.036WELLSFARGOPRIMESERVICES,LLC 496,878 3,725 0.007WELLSFARGOSECURITIESLLC 45,343 268 0.006WELLSFARGOSECURITIES,LLC 32,319 1,152 0.036WILLIAMBLAIR&COMPANYL.L.C 116,870 3,900 0.033WILLIAMSCAPITALGROUPLP(THE) 72,919 1,896 0.026WOORIINVESTMENTSECURITIES 24,820 911 0.037WUNDERLICH SECURITIES INC 3,067 89 0.029WUNDERLICHSECURITIESINC. 12,711 392 0.031XPINVESTIMENTOSCCTVMSA 178,414 1,271 0.007

New York City Board of Education Retirement System
92
ACTU
ARIA
L
This page is intentionally left blank

New York City Board of Education Retirement System
93
ACTU
ARIA
L
ACTUARIAL• Actuary’sCertificationLetter 95• Summary of Actuarial Assumptions and Methods 100• ScheduleofActiveMemberValuationData 108• FundedStatusbasedonEntryAgeActuarialCostMethod 109• ComparativeSummaryofActuarialValuesandPercentages coveredbyActuarialValueofAssets(SolvencyTest) 110• ScheduleofRetirantsandBeneficiaries 112• ScheduleofStatutoryvs.AnnualRequiredContributions 113• SummaryofPlanProvisions 114

New York City Board of Education Retirement System
94
This page is intentionally left blank
ACTU
ARIA
L

New York City Board of Education Retirement System
95
ACTU
ARIA
L
December 20, 2016
Board of Trustees New York City Board of Education
Retirement System 65 Court Street Brooklyn, NY 11201 Re: Actuarial Information for the Comprehensive Annual Financial Report (CAFR) for the Fiscal Year Ended June 30, 2016 Dear Members of the Board of Trustees:
The financial objective of the New York City Board of Education Retirement System -
Qualified Pension Plan (BERS or the Plan) is to fund members’ retirement benefits during their active service and to establish employer normal contribution rates that, expressed as a percentage of active member annualized covered payroll, would remain approximately level over the future working lifetimes of those active members and, together with member contributions and investment income, are intended to ultimately be sufficient to accumulate assets to pay benefits when due.
An actuarial valuation of the Plan is performed annually as of the second June 30
preceding each fiscal year to determine the Employer Contributions to be paid for that fiscal year (i.e., June 30, 2014 (Lag) actuarial valuation to determine Fiscal Year 2016 Employer Contributions (the Actuarial Contributions)).
Employers are required to contribute statutorily-required contributions (Statutory
Contributions) and these contributions are generally funded by Employers within the appropriate fiscal year.
For Fiscal Year 2016, the Actuarial Contributions to BERS, are equal to those
recommended by the Actuary of the New York City Pension Funds and Retirement Systems (the Actuary) and represent the Statutory Contributions.
OFFICE OF THE ACTUARY 255 GREENWICH STREET • 9TH FLOOR
NEW YORK, NY 10007 (212) 442-5775 • FAX: (212) 442-5777
SHERRY S. CHAN CHIEF ACTUARY
New York City Board of Education Retirement System
96
ACTU
ARIA
L
Board of Trustees New York City Board of Education
Retirement System December 20, 2016 Page 2
During June 2012 the Governmental Accounting Standards Board (GASB) released two new accounting standards for public pension plans, Statement No. 67 (GASB67) and Statement No. 68 (GASB68), collectively “GASB67/68.”
GASB67, Financial Reporting for Pension Plans, amends GASB Statement No. 25
(GASB25) and is effective for financial statements for fiscal years beginning after June 15, 2013 (i.e., Fiscal Year 2014 for BERS).
GASB68, Accounting and Financial Reporting for Pensions, amends GASB Statement No. 27 (GASB27) and is effective for financial statements for fiscal years beginning after June 15, 2014 (i.e., Fiscal Year 2015 for the City of New York (the City)).
On October 11, 2016, the Actuary published the, “GASB 67/68 Report for the City of New York and the New York City Retirement Systems For Fiscal Year Ended June 30, 2016” (the Fiscal Year 2016 GASB67/68 Report). Appendix C of The Fiscal Year 2016 GASB67/68 Report contains information developed in accordance with GASB67 for BERS. Actuarial Assumptions and Methods
Provided in this Actuarial Section of the CAFR is a “Summary of Actuarial Assumptions and Methods in Effect for the June 30, 2014 (Lag) Actuarial Valuation.” These actuarial assumptions and methods (2012 A&M) were first employed in the June 30, 2010 (Lag) actuarial valuation that was used to determine Fiscal Year 2012 Employer Contributions to the Plan. These 2012 A&M were developed after reviewing the results of independent actuarial studies dated December 2011 by The Hay Group (Hay) and November 2006 by The Segal Company (Segal) in accordance with Section 96 of the New York City Charter, after which the Actuary issued a February 10, 2012 Report entitled “Proposed Changes in Actuarial Assumptions and Methods for Determining Employer Contributions for Fiscal Years Beginning on and After July 1, 2011 for the New York City Board of Education Retirement System” (February 2012 Report). The Board of Trustees of the Plan adopted those changes in actuarial assumptions that require Board approval. The State Legislature and the Governor enacted Chapter 3 of the Laws of 2013 (Chapter 3/13) to provide for those changes to the actuarial assumptions and methods that require legislation, including the Actuarial Interest Rate (AIR) assumption of 7.0% per annum, net of investment expenses.
In October 2015 the independent actuarial auditor, Gabriel, Roeder, Smith & Company (GRS), issued a report on their NYC Charter-mandated actuarial experience studies for the four-year and ten-year periods ended June 30, 2013 (the GRS Report).

New York City Board of Education Retirement System
97
ACTU
ARIA
L
Board of Trustees New York City Board of Education
Retirement System December 20, 2016 Page 3
Based, in part, on the GRS Report, on published studies of mortality improvement, and on input from the City’s outside consultants and auditors, the Actuary proposed, and the Board of Trustees of BERS adopted, new post-retirement mortality tables for use in determining employer contributions beginning in Fiscal Year 2016. The new tables of post-retirement mortality are based primarily on the experience of BERS (the Base Tables) and the application of Mortality Improvement Scale MP-2015, published by the Society of Actuaries in October 2015 (the Valuation Tables). Scale MP-2015 replaced Mortality Improvement Scale AA.
In addition, beginning in Fiscal Year 2016, the Actuary revised the Actuarial Asset
Valuation Method to constrain the Actuarial Asset Value to be within a 20% corridor of the Market Value of Assets.
The 2012 A&M reflecting the above revisions is referred to as the “2016 A&M.”
These actuarial assumptions and methods (2016 A&M) used for funding purposes meet the parameters set by the Actuarial Standards of Practice (ASOPs). Benefits and Census Data
A summary of the benefits applicable to Plan members included in the June 30, 2014 (Lag) actuarial valuation is shown later in this Actuarial Section of the CAFR.
Census data is submitted by the Plan’s administrative staff and by the employers’ payroll
facilities and is reviewed by the Office of the Actuary (OA) for consistency and reasonability. A summary of the census data used in the June 30, 2014 (Lag) actuarial valuation is
included in this CAFR. A summary of the census data used in the June 30, 2013 (Lag) actuarial valuation of the Plan is available in the June 30, 2015 CAFR. Funded Status
The Funded Status of the Plan is usually expressed by the relationship of Assets to Liabilities.
With respect to the Funded Status of the Plan, included in the Actuarial Section of the CAFR is a schedule of Funded Status based on the Entry Age Actuarial Cost Method (Table 8).
Also included in the Actuarial Section of the CAFR is a Solvency Test (i.e., Comparative
Summary of Aggregate Accrued Liabilities Funded by Actuarial Value of Assets) (Table 9), as prescribed by the Government Finance Officers Association (GFOA). This Solvency Test represents an alternative approach to describing progress toward funding objectives.

New York City Board of Education Retirement System
98
ACTU
ARIA
L
Board of Trustees New York City Board of Education
Retirement System December 20, 2016 Page 4 Presentation Style and Sources of Information
The actuarial information herein is being presented in a manner believed to be consistent with the requirements of the GFOA and, where applicable, with GASB67.
The following items in the Actuarial Section of the CAFR were prepared by the OA:
Summary of Actuarial Assumptions and Methods in Effect for the June 30, 2014
(Lag) Actuarial Valuation. Active Member Valuation Data.
Summary of Plan Membership.
Funded Status Based on Entry Age Actuarial Cost Method.
Comparative Summary of Aggregate Accrued Liabilities Funded by Actuarial Value
of Assets - Solvency Test. Retirants and Beneficiaries Added to and Removed from Rolls. Statutory vs. Actuarial Contributions. Summary of Plan Provisions.
The following items in the Financial Section of the CAFR were also prepared by the OA:
Membership Data. Net Pension Liability.
Actuarial Assumptions and Methods.
Schedule of Changes in Employers’ Net Pension Liability and Related Ratios.
Schedule of Employer Contributions.
If you have any questions about any of the information in this Actuarial Section or any of the actuarial information presented elsewhere in this CAFR, please do not hesitate to contact Mr. Michael J. Samet, Mr. Edward Hue, or me.
New York City Board of Education Retirement System
99
ACTU
ARIA
L

New York City Board of Education Retirement System
100
ACTU
ARIA
L
(1) PursuanttoSection96oftheNewYorkCityCharter,studiesoftheactuarialassumptionsusedtovalueliabilitiesofthefiveactuarially-fundedNewYorkCityRetirementSystems(NYCRS)areconductedeverytwoyears.
Also,inaccordancewiththeAdministrativeCodeoftheCityofNewYork(ACNY),theBoardsofTrusteesofthefiveactuarially-fundedNYCRSaretoperiodicallyreviewandadoptactuarialassumptionsasproposedbytheActuaryforuseinthedeterminationofEmployerContributions.
ThemostrecentlycompletedstudywaspublishedbyGabrielRoederSmith&Company(GRS)datedOctober2015andanalyzedexperienceforFiscalYears2010through2013.GRSmaderecommendationswithrespecttotheactuarialassumptionsandmethodsbasedontheiranalysis.
Based, in part, on the GRS Report, on published studies of mortality improvement, and on input fromtheCity’soutsideconsultantsandauditors,theActuaryproposed,andtheBERSBoardofTrusteesofthePlanadopted,newpost-retirementmortalitytablesforuseindeterminingemployercontributionsbeginninginFiscalYear2016.Thenewtablesofpost-retirementmortalityarebasedprimarilyontheexperienceofBERS(theBaseTables)andtheapplicationofMortalityImprovementScaleMP-2015,publishedbytheSocietyofActuariesinOctober2015(theValuationTables).ScaleMP-2015replacedMortalityImprovementScaleAA.
Inaddition,beginninginFiscalYear2016,theActuaryrevisedtheActuarialAssetValuationMethodtoconstraintheActuarialAssetValuetobewithina20%corridoroftheMarketValueofAssets.
ThepreviouslycompletedstudieswerepublishedbyTheHayGroup(Hay),datedDecember2011andbyTheSegalCompany(Segal),datedNovember2006.HayanalyzedexperienceforFiscalYears 2006 through 2009 and made recommendations with respect to the actuarial assumptions andmethodsbasedontheiranalysis.SegalanalyzedexperienceforFiscalYears2002through2005 and made recommendations with respect to the actuarial assumptions and methods based ontheiranalysis.
Based,inpart,uponareviewoftheSegalandHaystudies,theActuaryissuedaFebruary10,2012Reportentitled“ProposedChangesinActuarialAssumptionsandMethodsforDeterminingEmployerContributionsforFiscalYearsBeginningonandAfterJuly1,2011fortheNewYorkCityBoardofEducationRetirementSystem”(February2012Report).
TheBoardofTrusteesofthePlanadoptedthosechangestoactuarialassumptionsthatrequireBoardapproval.TheStateLegislatureandtheGovernorhaveenactedChapter3oftheLawsof2013(Chapter3/13)toprovideforthosechangestotheactuarialassumptionsandmethodsthatrequirelegislation,includingtheActuarialInterestRate(AIR)assumptionof7.0%perannum,netofinvestmentexpenses,theEntryAgeActuarialCostMethodandtheamortizationofUnfundedActuarialAccruedLiabilities.
Summary of Actuarial Assumptions and Methods In Effect For The June 30, 2014 (Lag) Actuarial Valuation

New York City Board of Education Retirement System
101
ACTU
ARIA
L
Theinvestmentrateofreturnassumptionis7.0%perannum,netofinvestmentexpenses(4.0%perannumforbenefitspayableundertheVariableAnnuityProgram).
(2) ThemortalitytablesforserviceanddisabilitypensionersweredevelopedfromanexperiencestudyofthePlan’spensioners.SampleprobabilitiesareshowninTable1A.Mortalitytablesforbeneficiariesweredevelopedfromexperiencereview.SampleprobabilitiesareshowninTable1B.
(3) ActiveServicetablesareusedtoestimatevariouswithdrawalsfromActiveService.Sampleprobabilities are shown in Table 2A for members withdrawing from Active Service due to Death or Disability who did not elect an improved retirement program and Table 2B for members electing an improved retirement program, in Table 3 for members withdrawing for Other Than Death or DisabilityorRetirement,andinTable4formemberswithdrawingfromActiveServiceaftereligibilityforServiceRetirement.
(4) ASalaryScaleisusedtoestimatesalariesattermination,retirementordeath.SamplepercentageincreasesareshowninTable5.TheSalaryScaleincludesaGeneralWageIncrease(GWI)assumptionof3.0%perannum.
(5) Theeconomicassumptions(i.e.,theassumedinvestmentreturnrate,GWIrateandCost-of-LivingAdjustments(COLA))weredevelopedassumingalong-termConsumerPriceInflation(CPI)assumptionof2.5%perannum.Theassumptionis1.5%perannumforAutoCOLAand2.5%perannumforescalation.
(6) Thevaluationassumesaclosedgroupofmembers.
(7) BeginningwiththeJune30,2010(Lag)actuarialvaluation,theEntryAgeActuarialCostMethod(EAACM)offundingisutilizedbythePlan’sActuarytocalculatethecontributionrequiredoftheEmployer.
Underthismethod,theActuarialPresentValue(APV)ofBenefits(APVB)ofeachindividualincludedintheactuarialvaluationisallocatedonalevelbasisovertheearnings(orservice)oftheindividualbetweenentryageandassumedexitage(s).TheemployerportionofthisAPVallocatedtoavaluationyearistheEmployerNormalCost.TheportionofthisAPVnotprovidedforatavaluationdatebytheAPVofFutureEmployerNormalCostsorfuturemembercontributionsistheActuarialAccruedLiability(AAL).
Theexcess,ifany,oftheAALovertheActuarialAssetValue(AAV)istheUnfundedActuarialAccruedLiability(UAAL).
Underthismethod,actuarialgains(losses),astheyoccur,reduce(increase)theUAALandareexplicitlyidentifiedandamortized.
Summary of Actuarial Assumptions and Methods In Effect For The June 30, 2014 (Lag) Actuarial Valuation
(Cont’d)

New York City Board of Education Retirement System
102
ACTU
ARIA
LSummary of Actuarial Assumptions and Methods In Effect For The June 30, 2014 (Lag) Actuarial Valuation (Cont’d)
Increases(decreases)inobligationsduetobenefitchanges,actuarialassumptionchangesand/oractuarialmethodchangesarealsoexplicitlyidentifiedandamortized.
Chapter105oftheLawsof2010established,asofJune30,2011,anEarlyRetirementIncentive(ERI)forcertainBERSmembers.TheUAALattributabletotheERIisamortizedonalevelbasisoveraperiodoffiveyears(4paymentsundertheOne-YearLagMethodology).
(9) One-YearLagMethodology(LagorOYLM)usesaJune30,XX-2valuationdatetodetermineFiscalYearXXEmployerContributions.
TheJune30,2014(Lag)actuarialvaluationusesaJune30,2014valuationdatetodetermineFiscalYear2016EmployerContributions.
ThismethodologyrequirestechnicaladjustmentstocertaincomponentsusedtodetermineFiscalYear 2016 Employer Contributions as follows:
• PresentValueofFutureSalary(PVFS)
ThePVFSatJune30,2014isreducedbythevalueofsalaryprojectedtobepaidduringFiscalYear2015.
• Salary for Determining Employer Contributions
Salary used to determine the employer normal contribution is the salary projected to be paid duringFiscalYear2016tomembersonpayrollatJune30,2014.
• UAAL Payments
FordeterminingtheUAALpaymentsforFiscalYear2016,andtobeconsistentwithOYLM,theUAALasofJune30,2014isadjustedbythediscountedvalueofemployernormalcontributionspaid during Fiscal Year 2015 and the discounted value of the administrative expensesreimbursedduringFiscalYears2015and2016.

New York City Board of Education Retirement System
103
ACTU
ARIA
L
Summary of Actuarial Assumptions and Methods In Effect For The June 30, 2014 (Lag) Actuarial Valuation
(Cont’d)
(10) TheActuaryresettheAAVtotheMarketValueofAssets(MVA)asofJune30,2011(i.e.,MarketValueRestart).
BeginningwiththeJune30,2012(Lag)actuarialvaluation,theActuarialAssetValuationMethod(AAVM)recognizesinvestmentreturnsgreaterorlessthanexpectedoveraperiodofsixyears.
InaccordancewiththisAAVM,actualUnexpectedInvestmentReturns(UIR)are phased into the AAV atratesof15%,15%,15%,15%,20%and20%peryear, respectively,(i.e.,cumulativeratesof15%,30%,45%,60%,80%and100%).
BeginningwiththeJune30,2014(Lag)actuarialvaluation,theAAVisconstrainedtobewithina20%corridoroftheMarketValue.
(11) TheAPVBasofJune30,2014,usedtodetermineFiscalYear2016EmployerContributions,includes estimates of liabilities for:
• WorldTradeCenterDisabilityBenefits.
• WorldTradeCenterDeathBenefits.
(12) Asdiscussedherein,theactuarialassumptionsandmethodsareunchangedfromthoseusedintheJune30,2013(Lag)actuarialvaluationexceptfortheadoptionofrevisedpost-retirementmortalityTablesanda20%corridorconstrainingtheActuarialAssetValueasdescribedinsections(1)and(10)above,respectively.

New York City Board of Education Retirement System
104
ACTU
ARIA
LSummary of Actuarial Assumptions and Methods In Effect For The June 30, 2014 (Lag) Actuarial Valuation (Cont’d)
Table 1B
DEATHS AMONG BENEFICAIRIESPercentage of Pensioners Dying within Next Year
Years of Service Males Females 40 0.0947% 0.0687%
45 0.2684 0.1202
50 0.4203 0.2512
55 0.8245 0.4448
60 1.0827 0.7377
65 1.4619 1.0274
70 1.9843 1.4161
75 2.9181 2.2280
80 5.3467 3.7564
85 8.2155 6.2437
90 14.2568 10.7174
95 22.8721 18.1287
100 31.4230 21.7021
105 37.5244 27.6686
110 100.0000 100.0000
Table 1ADEATHS AMONG SERVICE AND DISABILITY PENSIONERS
Percentage of Pensioners Dying within Next Year Service Pensioners Disability Pensioners Age Males Females Males Females 40 0.0947% 0.0573% 1.2639% 1.3481%
45 0.2982 0.1002 1.3564 1.4734
50 0.5603 0.2093 1.6327 1.7585
55 0.8732 0.3336 2.1003 1.8410
60 1.0191 0.4917 2.4210 1.9145
65 1.2791 0.6538 2.5828 2.1211
70 1.8603 1.0620 3.0075 2.4756
75 2.5748 1.7589 3.8204 3.2337
80 4.4557 2.9656 5.1977 4.4159
85 7.3027 4.9949 7.3175 6.4750
90 11.4055 8.5739 11.4213 11.1714
95 20.5692 15.5282 20.5864 18.8480
100 31.4230 21.6851 31.4230 22.6011
105 37.5244 27.6686 37.5244 27.6686
110 100.0000 100.0000 100.0000 100.0000
SocietyofActuariesMortalityImprovementScaleMP-2015isappliedtotheserates.
SocietyofActuariesMortalityImprovementScaleMP-2015isappliedtotheserates.

New York City Board of Education Retirement System
105
ACTU
ARIA
L
Summary of Actuarial Assumptions and Methods In Effect For The June 30, 2014 (Lag) Actuarial Valuation
(Cont’d)
Table 2AWITHDRAWALS FROM ACTIVE SERVICE (DUE TO DEATH OR DISABILITY)MEMBERS WHO DO NOT ELECT AN IMPROVED RETIREMENT PROGRAM
Percentage of Active Members Separating within Next Year
Accidental Ordinary Disability Disability Death Age Males Females Males Females Males Females
20 0.04% 0.02% 0.20% 0.20% 0.040% 0.030%
25 0.04 0.02 0.20 0.20 0.040 0.030
30 0.04 0.02 0.20 0.20 0.060 0.040
35 0.04 0.02 0.30 0.20 0.080 0.050
40 0.04 0.02 0.40 0.25 0.100 0.060
45 0.04 0.02 0.50 0.30 0.150 0.100
50 0.04 0.02 0.60 0.50 0.200 0.150
55 0.04 0.02 0.70 0.70 0.300 0.200
60 0.04 0.02 0.70 0.70 0.400 0.250
65 0.04 0.02 0.70 0.70 0.500 0.300
70 NA NA NA NA NA NA
Table 2BWITHDRAWALS FROM ACTIVE SERVICE (DUE TO DEATH OR DISABILITY)
MEMBERS WHO ELECTED AN IMPROVED RETIREMENT PROGRAM
Percentage of Active Members Separating within Next Year
Accidental Ordinary Disability Disability Death Age Males Females Males Females Males Females 20 0.04% 0.02% 0.20% 0.20% 0.040% 0.030%
25 0.04 0.02 0.20 0.20 0.040 0.030
30 0.04 0.02 0.20 0.20 0.060 0.040
35 0.04 0.02 0.30 0.20 0.080 0.050
40 0.04 0.02 0.40 0.25 0.100 0.060
45 0.04 0.02 0.50 0.30 0.150 0.100
50 0.04 0.02 0.60 0.50 0.200 0.150
55 0.04 0.02 0.70 0.70 0.300 0.200
60 0.04 0.02 0.70 0.70 0.400 0.250
65 0.04 0.02 0.70 0.70 0.500 0.300
70 NA NA NA NA NA NA

New York City Board of Education Retirement System
106
ACTU
ARIA
LSummary of Actuarial Assumptions and Methods In Effect For The June 30, 2014 (Lag) Actuarial Valuation (Cont’d)
Table 3
WITHDRAWALS FOR OTHER THAN DEATH OR DISABILITY OR RETIREMENT
Percentage of Active Members Withdrawing within Next Year
Probability of Withdrawal
Years of Service Males Females
0 6.00% 4.00%
5 4.00 3.00
10 2.50 2.00
15 1.50 1.50
20 1.00 1.00
25 1.00 1.00
(1) SeparateprobabilitiesofServiceRetirementareapplicabletothoseactivememberswhoelectedanOptionalRetirement ProgramsuchasChapter96oftheLawsof1995orChapter19oftheLawsof2008.
(2) ApplicabletomemberswhosebenefitswillbereduceduponretiringpriortothedateeligibleforunreducedService Retirement.
Table 4
WITHDRAWALS FROM ACTIVE SERVICE (AFTER ELIGIBILITY FOR SERVICE RETIREMENT)
Percentage of Eligible Active Members Retiring Within Next Year
WithUnreducedBenefit(1)
Members not Electing Members Electing Optional Retirement Program Optional Retirement Program
Years of Service Since First Elig. Years of Service Since First Elig.
With(2) Reduced Age Benefits 0-1 1-2 2+ 0-1 1-2 2+
50 0.00% 20.00% 15.00% 10.00% 40.00% 20.00% 15.00%
55 2.00 20.00 15.00 10.00 40.00 20.00 15.00
60 4.00 20.00 15.00 10.00 40.00 20.00 15.00
65 0.00 30.00 25.00 20.00 60.00 25.00 25.00
70 NA 100.00 100.00 100.00 100.00 100.00 100.00

New York City Board of Education Retirement System
107
ACTU
ARIA
L
Summary of Actuarial Assumptions and Methods In Effect For The June 30, 2014 (Lag) Actuarial Valuation
(Cont’d)
* SalaryScaleincludesaGeneralWageIncreaseassumptionof3.0%perannum.
Table 5
SALARY SCALE
Assumed Annual Years of Percentage Increases Service Within Next Year*
0 9.00%
5 5.00
10 4.50
15 4.50
20 4.25
25 4.00
30 4.00
35 4.00
40 4.00

New York City Board of Education Retirement System
108
ACTU
ARIA
L Active Member Valuation Data
Table 6
ACTIVE MEMBER VALUATION DATA
Percentage Annual Increase Valuation Annual Average (Decrease) in Date Number Payroll Salary Average Salary
6/30/05(Lag) 23,005 $715,077,619 $31,084 4.0%
6/30/06(Lag) 23,095 749,962,525 32,473 4.5
6/30/07(Lag) 21,947 777,626,307 35,432 9.1
6/30/08(Lag) 22,729 852,105,791 37,490 5.8
6/30/09(Lag) 23,303 910,609,483 39,077 4.2
6/30/10(Lag)(1) 23,324 912,290,136 39,114 0.1
6/30/11(Lag) 23,131 920,369,154 39,789 1.7
6/30/12(Lag) 27,840 1,018,895,365 36,598 (8.0)
6/30/13(Lag) 25,848 1,051,571,168 40,683 11.2
6/30/14(Lag) 25,182 1,045,187,738 41,505 2.0
(1) BeginningwiththeJune30,2010(Lag)actuarialvaluation,theannualizedcoveredpayrollisbasedonrevisedactuarialassumptions.
SUMMARY OF PLAN MEMBERSHIP
AsoftheJune30,2014(Lag)andJune30,2013(Lag)actuarialvaluations,thePlan’sMembershipconsisted of:
Table 7
Summary of Plan Membership Group 2014 (Lag) 2013 (Lag)
Retireesandbeneficiariescurrentlyreceivingbenefits 15,995 15,455
Terminatedvestedmembersnotyetreceivingbenefits 195 182
OtherInactives* 4,005 4,127
Active members 25,182 25,848
Total 45,377 45,612
*Representsmemberswhoarenolongeronpayrollbutnototherwiseclassified.

New York City Board of Education Retirement System
109
ACTU
ARIA
L
Funded Status Based on Entry Age Actuarial Cost Method
(Dollar Amounts in Thousands)
Actuarial UAAL as a Actuarial Accrued Percentage Value of Liability (AAL) - Unfunded AAL Funded Covered of Covered Assets Entry Age (UAAL) - Entry Age Ratio Payroll Payroll Valuation Date (a) (b) (b-a) (a/b) (c) ((b-a)/ c)
June30,2014(Lag)1 2,632,922 4,335,746 1,702,824 60.7% 1,045,188 162.9%
June30,2013(Lag)1 2,277,791 4,015,080 1,737,289 56.7 1,051,571 165.2
June30,2012(Lag)1 2,371,613 3,763,130 1,391,517 63.0 1,018,895 136.6
June30,2011(Lag)1 2,323,629 3,681,694 1,358,065 63.1 920,369 147.6
June30,2010(Lag)1 2,056,452 3,558,251 1,501,799 57.8 912,290 164.6
June30,2009(Lag) 1,963,719 2,858,115 894.396 68.7 910,609 98.2
June30,2008(Lag) 2,084,116 2,721,629 637,513 76.6 852,106 74.8
Note:ThisscheduleisbasedonactuarialassumptionsusedfordeterminingEmployerContributions.1 Reflectsrevisedactuarialassumptionsandmethodsbasedonexperiencereview,includinganAIRassumptionsof7.0%per
annum,netofinvestmentexpenses.
This Schedule is being provided by the Actuary for the Plan to improve the transparency and decision usefulnessofthisfinancialreport.
PriortotheJune30,2010(Lag)ActuarialValuation,theActuarialCostMethod(ACM)usedtodevelopthefundingrequirementsforthePlanwastheFrozenInitialLiability(FIL)ACM.UnderthisACM,followingestablishmentofanyInitialUnfundedActuarialAccruedLiabilities(UAAL),actuarialgainsandlossesarefinancedovertheworkinglifetimesofactiveparticipantsandarenotidentifiedasseparateUAAL.
The funding status and funding progress information provided in this Schedule has been prepared using theEntryAgeACMwheretheActuarialPresentValue(APV)ofanyobligationsofthePlannotprovidedbytheAPVofFutureContributions(EmployerandEmployee),asdeterminedundertheEntryAgeACM,equalstheActuarialAccruedLiability(AAL).UndertheEntryAgeACM,theUAALequalstheAALminustheActuarialValueofAssets.
Table 8
FUNDED STATUS BASED ON ENTRY AGE ACTUARIAL COST METHOD
(Dollar Amounts in Thousands)

New York City Board of Education Retirement System
110
ACTU
ARIA
L
Com
para
tive
Sum
mar
y of
Act
uaria
l Val
ues
and
Perc
enta
ges
Cove
red
by A
ctua
rial V
alue
of A
sset
s
Also,seefollowing“SOLVENCYTEST–NOTES.”
Tabl
e 9
SOLV
ENCY
TES
T
(Dol
lar A
mou
nts
in th
ousa
nds)
Ag
greg
ate A
ccru
ed Li
abili
ties F
or
Ac
cum
ulat
ed
Curre
nt
Activ
e Mem
bers
’ Ac
tuar
ial
Pe
rcen
tage
of A
ctua
rial
As
of
Mem
ber
Retir
ants
and
Em
ploy
er
Valu
e
Valu
es C
over
ed b
y
June30
Contributions
Beneficiaries
FinancedPortion
ofAssets
ActuarialValueofAssets
(A)
(B)
(C)
(D)
(A)
(B)
(C)
2005(Lag)
$301,021
$1,131,335
$742,368
$1,841,041
100%
100%
55%
2006(Lag)
317,544
1,181,666
809,206
1,830,338
100
100
41
2007(Lag)
319,153
1,233,708
839,993
1,983,714
100
100
51
2008(Lag)
337,821
1,262,046
904,890
2,084
,116
100
100
54
2009(Lag)
359,122
1,303,453
965,681
1,963,719
100
100
31
2010(Lag)
388,082
1,627,094
1,306,868
2,056,452
100
100
3
2011(Lag)
409,625
1,714,099
1,319,938
2,323,629
100
100
15
2012(Lag)
434,215
1,804,626
1,283,582
2,371,613
100
100
10
2013(Lag)
469,312
1,918,824
1,372,542
2,277,791
100
94
0
2014(Lag)
504,619
2,080,400
1,475,008
2,632,922
100
100
3

New York City Board of Education Retirement System
111
ACTU
ARIA
L
SOLVENCY TEST - NOTES
Theultimatetestoffinancialsoundnessinaretirementsystemisitsabilitytopayallofitspromisedbenefitswhendue.Theretirementsystem’sprogressinaccumulatingassetstopayallpromisedbenefitscanbemeasuredbycomparingtheActuarialValueofAssetsoftheretirementsystemwiththeAggregateAccrued Liabilities for:
(A) AccumulatedMemberContributions;(B) CurrentRetirantsandBeneficiaries;and(C) ActiveMembers’EmployerFinancedPortion.
TheAggregateAccruedLiabilitiesaretheAPVofprojectedbenefitsproducedbytheprojectedbenefitattributionapproachproratedonservice.TheAggregateAccruedLiabilitieswerecalculatedinaccordancewithGovernmentalAccountingStandardsBoardStatementNo.5(GASB5).
Thiscomparativesummaryallocatedassetsasiftheywereprioritygroups,somewhatsimilarto(butnotidenticalto)theprioritycategoriesofSection4044oftheEmployeeRetirementIncomeSecurityActof1974(ERISA).
Thevaluesinthetablearedependentuponcensusdata,benefitlevels(whichhavechangedonoccasionoverthepastyears),andtheactuarialassumptionsandmethodsemployedateachvaluationdate.ThetwomostrecentchangesinassumptionsandmethodsoccurredintheJune30,2014(Lag)valuationusetocomputeEmployerContributionsforFiscalYear2016andintheJune30,2010(Lag)valuationusedtocomputeEmployerContributionsforFiscalYear2012.TheseunderlyingbasescanbefoundwithintheComprehensiveAnnualFinancialReportforeachrespectiveyear.
Tofullyevaluatetrendsinfinancialsoundness,changesinassumptionsneedtobeevaluated.BeginningwiththeJune30,2010(Lag)actuarialvaluations,theActuarialInterestRateassumptionequals7.0%perannum,netofinvestmentexpenses,andtheGeneralWageIncreaseassumptionequals3.0%perannum.PriortotheJune30,2010(Lag)actuarialvaluation,theActuarialInterestRateassumptionwas8%perannum,grossofexpenses.
Comparative Summary of Actuarial Values and Percentages Covered by Actuarial Value of Assets
(Cont'd)

New York City Board of Education Retirement System
112
ACTU
ARIA
L
Ret
irant
s an
d B
enefi
ciar
ies
Adde
d To
and
Rem
oved
Fro
m R
olls
Ad
ded
to R
olls
Rem
oved
from
Rol
ls Ro
lls E
nd of
Year
% In
crea
se
Aver
age
Ye
ar
An
nual
Annu
al
An
nual
In
Ann
ual
Annu
al
En
ded
Num
ber
Allo
wanc
es(1
) Nu
mbe
r Al
lowa
nces
Nu
mbe
r Al
lowa
nces
(2)
Allo
wanc
es
Allo
wanc
es
6/30/05
779
$8,763,397
431
3,995,277
11,973
$133,647,065
3.7%
$11,164
6/30/06
1,066
12,053,392
466
3,414,306
12,573
142,286,151
6.5
11,317
6/30/07
958
10,886,720
540
3,850,151
12,991
149,322,720
4.9
11,494
6/30/08
667
8,148,653
462
4,350,475
13,196
153,120,898
2.5
11,604
6/30/09
936
10,879,798
491
4,135,086
13,641
159,865,610
4.4
11,719
6/30/10
850
10,705,737
522
4,700,094
13,969
165,871,253
3.8
11,874
6/30/11
901
14,977,636
471
4,325,573
14,399
176,523,316
6.4
12,259
6/30/12
1,053
16,201,746
578
6,211,198
14,874
186,513,864
5.7
12,540
6/30/13
1,110
16,977,455
529
4,957,022
15,455
198,534,297
6.4
12,846
6/30/14
1,094
13,701,890
554
5,306,812
15,995
206,929,375
4.2
12,937
(1)
BalancingItem–Amountsshownincludechangesduetobenefitfinalization,changeinbenefittype(e.g.,ServicetoAccidentD
isability),CO
LAincreasesandotherchanges.
(2)
AllowancesshownintablearethoseusedintheactuarialvaluationasoftheYearEndeddateandarenotadjustedforanticipatedchangesduetofinalizationofbenefit
calculationorcontractsettlements.
Tabl
e 10

New York City Board of Education Retirement System
113
ACTU
ARIA
L
Statutory vs. Annual Required Contributions
(1) Representstotalemployercontributionsaccruedforfiscalyear.
BeginningFiscalYear2006,theStatutoryContributionswerecomputedusingaOne-YearLagMethodologyinaccordancewithChapter152/06whichalsoeliminatedtheuseoften-yearphase-inofChapter278/02forfundingtheadditionalactuarialliabilitiesattributedtoChapter125/00.
(2) TheEmployerRateofContributionequalstheStatutoryContributionasapercentageofthesalariesofmemberswhowereonpayrollorprojectedtobeonpayroll(underOne-YearLagMethodology)asoftheprecedingJune30andadjusted,whereapplicable,tobeconsistentwithcollectivebargainingagreementsestimatedtobeachieved.
Fiscal Year Statutory Annual Required Employer Rate of Ended Contribution(1) Contribution Contribution(2)
6/30/07 $129,820,109 $129,820,109 18.641%
6/30/08 143,100,327 143,100,327 19.627
6/30/09 134,224,615 134,224,615 17.766
6/30/10 147,348,563 147,348,563 17.822
6/30/11 180,191,397 180,191,397 20.461
6/30/12 213,650,880 213,650,880 24.293
6/30/13 196,245,777 196,245,777 22.145
6/30/14 214,589,565 214,589,565 21.694
6/30/15 258,099,327 258,099,327 25.383
6/30/16 265,532,032 265,532,032 26.341
New York City Board of Education Retirement System
114
ACTU
ARIA
L
ThisSummaryofPlanProvisionsisapplicabletoPlanmembersincludedintheJune30,2014(Lag)actuarialvaluation.
A. MEMBERSHIP
MembershipintheNewYorkCityBoardofEducationRetirementSystem–QualifiedPensionPlanisavailabletoallnon-temporaryemployeesineducationservice,regardlessofpart-timeorfull-timestatus,otherthanpersonseligibletoparticipateintheNewYorkCityTeachers’RetirementSystem–QualifiedPensionPlan.
AllsuchpersonsholdingpermanentcivilservicepositionsarerequiredtobecomemembersoftheNewYorkCityBoardofEducationRetirementSystem–QualifiedPensionPlan.
B. BRIEF HISTORY
The Board of Education Retirement System was established as of September 1, 1921 and originally providedforitsmembersafractionalretirementplan(i.e.,age60-1/140th).Subsequently,additionalfractionalplansweremadeavailable(i.e.,theage55-1/120thandtheage55-1/100th).TheseplansareknownastheOldServiceFractionPlans.
Amendmentsin1968totheRulesandRegulationsoftheBoardofEducationRetirementSystemsubstantiallyrevisedthebenefitstructurebyestablishingtwonewretirementplanseffectiveJuly1,1968.MemberswhojoinedtheSystemonoraftertheeffectivedatewererequiredtochooseeitheroneofthetwoplans,namely(1)theCareerPensionPlan(PlanA),or(2)the55-YearIncreased-Service-FractionPlan(PlanB).AmemberwhojoinedtheSystempriortotheeffectivedatecouldcontinueunderhis/herexistingplan,orcouldelectoneofthesenewplans,providingsuchelectionwasmadepriortoJuly1,1970.MemberswhoelectedoneofthesenewplansarereferredtoasTierImembers.
Chapter1046oftheLawsof1973imposedcertainlimitationsonthebenefitsavailabletomembersjoiningtheSystemafterJune30,1973.FormemberswhojoinedtheSystembetweenJuly1,1973andJune30,1976(TierIImembers),twoplanswereavailable:theModifiedCareerPensionPlan(PlanC);andtheModified55-Year-Increased-Service-FractionPlan(PlanD).
Chapter890oftheLawsof1976establishedanewstatewidepensionplan,theCoordinatedEscalator(CO-ESC)RetirementPlan,coveringallemployeesjoiningonorafterJuly1,1976(TierIIImembers).However,theNewYorkCourtofAppealsonMay31,1988held,inCivilServiceEmployees’Associationvs.Regan,thatpersonswhobecamemembersbetweenJuly1,1976andJuly26,1976areconsideredTierII(i.e.,PlansCandD)members.
Summary of Plan Provisions
New York City Board of Education Retirement System
115
ACTU
ARIA
L
Summary of Plan Provisions
(Cont’d)
Chapter414oftheLawsof1983establishedtheCoordinatedRetirementPlan,effectiveSeptember1,1983,supersedingtheCO-ESCplanformostemployeesjoiningtheSystemonorafterJuly27,1976(TierIVmembers).Thisplansetanormalretirementageof62,andmandateda3%contributionbythememberforallyearsofmembership.MemberswhojoinedJuly27,1976throughAugust31,1983,however,areentitledtoreceiveabenefitfromeithertheCO-ESCorCoordinatedPlan,whicheverprovidesagreaterbenefit.
Chapter749oftheLawsof1992setforthpensionrights,includingretroactiverights,topart-timeemployees.
Chapter96oftheLawsof1995(Chapter96/95)establishedanOptionalRetirementProgrameffectiveduringFiscalYear1996.ThisProgramincreasedearlyretirementbenefitsandrequiredadditionalmembercontributions.ThisProgramisoptionalforthosehiredpriortotheeffectivedateofthelegislationandmandatoryforthosehiredafter.
Chapter442oftheLawsof1997reducedfrom4.35%to2.85%theAdditionalMemberContributionsforTierIIandTierIVmembersparticipatingintheChapter96/95OptionalRetirementProgram.
Chapter266oftheLawsof1998improvedbenefitsforTierIVmemberswhohadatleast20yearsofservicebutlessthan25yearsofserviceandpermittedcertainTierIIIretireestoelecttoreceiveTierIVbenefits.
Chapter388oftheLawsof1998providedapre-retirementdeathbenefitforcertainvestedmembersofthePlan.
Chapter389oftheLawsof1998allowedcertainmembersofthePlantobecomevestedafterfiveyearsofservice.
Chapter390oftheLawsof1998(Chapter390/98)providedadditionalbenefitsforcost-of-livingincreasesforcertainretireesofthePlan.AninitialincreaseformemberswhoretiredonorbeforeCalendarYear1992iseffectiveasofSeptember1998asenactedbytheCityCouncilonAugust27,1998.AsubsequentincreaseformemberswhoretiredonorbeforeCalendarYear1993iseffectiveasofSeptember1999asenactedbytheCityCouncilonAugust27,1998.
Chapter644oftheLawsof1998providedthatanyactivememberwithtenormoreyearsofserviceandwithinthreeyearsofretirementmaypurchaseuptothreeyearsofmemberservicecreditforU.S.MilitaryServiceduringaperiodofwar.
Chapter646oftheLawsof1999providedactiveandfuturememberstherighttoreinstateearliermembershipbyrepayingpriormembercontributionswith5%interest.

New York City Board of Education Retirement System
116
ACTU
ARIA
L Summary of Plan Provisions (Cont’d)
Chapter659oftheLawsof1999reducedtofiveyearstheamountofservicecreditneededforTierIII/IVvestedmemberstoreceivebenefitsatage55.
Chapter 110 of the Laws of 2000 amended the language of the legislation that later became Chapter 126oftheLawsof2000whichprovidesforbenefitenhancementsforcertainmembers.
Chapter125oftheLawsof2000(Chapter125/00)providedeligibleretireeswithannualautomaticCost-of-LivingAdjustments.Italsoprovidedforafive-yearphase-inforthefundingoftheadditionalactuarialliabilities.
Chapter126oftheLawsof2000providedforbenefitenhancements(i.e.,eliminationofemployeebasiccontributionsforTierIII/IVmemberswithmorethan10yearsofmembership,additionalservicecreditforTierI/IImembersofuptoamaximumof24months,andallowsTierIII/IVmemberstoretireatage55withreducedbenefitsunderthesameformulaasusedforTierIImembers)forcertainmembersoftheNewYorkCityRetirementSystems.
Chapter553oftheLawsof2000permittedTierIVmemberstoretireearlywithareducedbenefitbeginning at age 55 provided they have at least 5 years of credited service and are not members of the25YearEarlyRetirementProgramortheAge57RetirementProgram.
Chapter554oftheLawsof2000providedthatTiersII,IIIandIVmemberswhojoinedpriortoJanuary1,2001andwhoelectedDeathBenefitOnewillreceivethegreaterofDeathBenefitOneorDeathBenefitTwocoverage.NewmembersonandafterJanuary1,2001willonlyreceivecoverageunderDeathBenefitTwo.
Chapter509oftheLawsof2001reducedfrom2.85%to1.85%theAdditionalMemberContributionrateforTierIIandTierIVmembersparticipatingintheChapter96/95OptionalRetirementPrograms.
Chapter69oftheLawsof2002providedanEarlyRetirementIncentive(ERI)programforcertainmembers.
Chapter278oftheLawsof2002(Chapter278/02)revisedthephase-inscheduleofChapter125/00forFiscalYear2003andlaterbyextendingfromfivetotenyearsthephase-inperiodforthefundingoftheadditionalactuarialliabilitiesattributabletoChapter125/00.
Chapter307oftheLawsof2002providedCorpusFundingofadministrativeexpensesforthePlancommencingJuly1,2002andallowsfortheappointmentofanExecutiveDirectorforthePlan.
Chapter623oftheLawsof2004providedforanExcessBenefitPlantobeestablishedwhichwouldprovidebenefitstothosepensionerswhoseannualretirementbenefitsarelimitedbecausethosebenefitsexceedthelimitationssetbyIRCSection415(b).ThelawisretroactivetoJuly1,2000.

New York City Board of Education Retirement System
117
ACTU
ARIA
L
Summary of Plan Provisions
(Cont’d)
Chapter104oftheLawsof2005,asamendedbyChapter93oftheLawsof2005,createdapresumptive eligibility for accidental disability in connection with the World Trade Center attack on September11,2001.
Chapter105oftheLawsof2005statesthatamemberkilledintheU.S.ArmedForcesonandafterJune14,2005isdeemedaLine-of-Dutydeathwhileonactivepayroll.
Chapter133oftheLawsof2005continuedthevaluationandotherinterestratesforoneyeartoJune30,2006fromJune30,2005.
Chapter152oftheLawsof2006(Chapter152/06)providedforthechangesinactuarialassumptionsandmethodsthatrequirelegislation,includingthecontinuationoftheAIRassumptionof8.0%perannumandcontinuationofthecurrentFrozenInitialLiability(FIL)ActuarialCostMethodandtheexistingUnfundedActuarialAccruedLiability(UAAL).Inaddition,Chapter152/06providedfortheeliminationoftheuseoftheten-yearphase-inofChapter278/02forfundingtheadditionalactuarialliabilitiescreatedbythebenefitsprovidedbyChapter125/00.
Chapter445oftheLawsof2006(Chapter445/06)createdapresumptiveeligibilityofaccidentaldeathbenefitsinconjunctionwiththeWorldTradeCenterattackonSeptember11,2001.
Chapter5oftheLawsof2007amendedChapter445/06toclarifytheWorldTradeCenteraccidentaldisabilitybenefitspayabletoretireeswhodieinthefirst25yearsofretirement.ItalsoamendedChapter445/06toincludeWorldTradeCenterdeathsaspresumptiveaccidentaldeathsintheLineofDuty.
Chapter260oftheLawsof2007isareopeneroftheChapter96/95OptionalRetirementProgramforTierIIandTierIVmembersintheLoaderandHandlerjobtitles.
Chapter19oftheLawsof2008establishedretirementprogramstopermitcertainTierIIandTierIVmembers to elect to retire between ages 55 and 62 without reduction provided they have 25 years of service,bypayinganadditionalcontributionof1.85%offuturepay.NewmembersafterFebruary27,2008aremandatedintothisplanandarerequiredtobeage55andhave27yearsofservicetoretirewithoutreduction.
Chapter489oftheLawsof2008expandedandredefinedtheeligibilityprovisionsoftheaccidentaldisabilityandaccidentaldeathbenefitsthatariseinconnectionwiththeWorldTradeCenterattackonSeptember11,2001.
Chapter211oftheLawsof2009continuedthevaluationandotherinterestratesforoneyeartoJune30,2010fromJune30,2009.
New York City Board of Education Retirement System
118
ACTU
ARIA
L Summary of Plan Provisions (Cont’d)
Chapter504oftheLawsof2009(Chapter504/09)providesthatindividualsjoiningthePlanafterDecember10,2009,whoarerepresentedbytheUnitedFederationofTeachers(UFT)andwhoparticipateinthe55/27retirementprogram,willberequiredtomakepensioncontributionsof4.85%ofsalaryuntiltheyhave27yearsofcreditedserviceandcontributionsof1.85%ofsalarythereafter.Thesememberswillbecomevestedaftertenyearsofcreditedservice.
Also,underChapter504/09,allmembersofthePlanrepresentedbytheUFTwhoparticipateintheTaxDeferredAnnuityProgram(TDA),willreceiveaninterestrateof7.0%perannumcreditedtotheirTDAFixedFundsaccountsbeginningDecember10,2009.
Chapter105oftheLawsof2010(Chapter105/10)providedanEarlyRetirementIncentive(ERI)programforcertainmembers.
Chapter 157 of the Laws of 2011 provided that members who were laid off from the School ConstructionAuthority(SCA)onorafterDecember1,2002andwhoreturnedtoworkpriortoJanuary8,2008,canbuybacktheirlayofftimeforretirementpurposes.
Chapter265oftheLawsof2011continuedthevaluationandotherinterestratesforoneyeartoJune30,2011fromJune30,2010.
Chapter180oftheLawsof2011continuedthevaluationandotherinterestratesforoneyeartoJune30,2012fromJune30,2011.
Chapter18oftheLawsof2012(Chapter18/12)placedcertainlimitationsontheTierIIIandTierIVbenefitsavailabletoparticipantshiredonandafterApril1,2012inmostNewYorkStatePERS,includingBERS.ThesechangesaresometimesreferredtoasTierVI.
Chapter3oftheLawsof2013(Chapter3/13)implementedchangesintheactuarialproceduresfordeterminingEmployerContributionsbeginningFiscalYear2012.Inparticular,Chapter3/13continuedtheOYLM,employedtheEntryAgeActuarialCostMethod(EAACM),anActuarialInterestRate(AIR)assumptionof7.0%perannum,netofinvestmentexpensesanddefinedtheamortizationofUnfundedActuarialAccruedLiabilities(UAAL).
Chapter489oftheLawsof2013(Chapter489/13)extendedtheWTCDisabilityLawbenefitstovestedmembers.
FollowingisadescriptionoftheprincipalbenefitprovisionsoftheSystem,precededbysimplifieddefinitionsofthetechnicaltermsusedtherein.

New York City Board of Education Retirement System
119
ACTU
ARIA
L
Summary of Plan Provisions
(Cont’d)
C. COORDINATED RETIREMENT PLAN
ARTICLE15OFTHERETIREMENTANDSOCIALSECURITYLAW(RSSL)
I. Definitions
FinalAverageSalary(FAS)-Theaveragesalaryearnedduringanythreeconsecutiveyears(fiveyearsforTier6)whichprovidesthehighestaveragesalary.Ifthesalaryearnedduringanyyearincludedinthethree-yearperiod,however,exceedthatoftheaverageoftheprevioustwoyearsbymorethan10%,theamountinexcessof10%willbeexcludedfromthecomputationofFAS.
Salary-Theregularcompensationearnedbyandpaidtoamember.
II. Benefits Under The Coordinated Retirement Plan
AmemberwhosedateofmembershipisJuly27,1976orlater,belongstotheCoordinatedRetirementPlan.
a. SERVICERETIREMENT
1. NormalServiceRetirement
(a) PayabilityDatedependsonPlanasfollows:
(1)Age62and5yearsofservice;(2)Age57and5yearsofservice;(3)Age55and25yearsofservice;(4)Age55and27yearsofservice;or(5)Age63and10yearsofservice.
(b) (1) Pensionpayableformemberswithfewerthan20yearsofservice(25for membersinOptionalRetirementPlans):1/60timesFAStimesyearsofservice.
(2) Pensionpayableformemberswithatleast20yearsofservice(Tier6)(25for membersinOptionalRetirementPlans),butfewerthan30yearsofservice (Tier4):1/50timesFAStimesyearsofservice(Tier4)or35%plus2%times FAStimesyearsofserviceinexcessof20(Tier6).
(3) Pensionpayableformemberswith30ormoreyearsofservice:1/50timesFAS foreachofthefirstthirtyyearsofservice,plus3/200timesFASforeach additionalyear(Tier4).

New York City Board of Education Retirement System
120
ACTU
ARIA
L Summary of Plan Provisions (Cont’d)
2. EarlyServiceRetirement:
Commencingasearlyasage55,requirescompletionoffiveyearsofcreditedservice(tenyearsforTier6).BenefitisequaltotheServiceRetirementbenefitreduceddependingonthenumberofmonthspriortoage62(age63forTier6).
3. DeferredVestedBenefit
Amemberwhohasfiveormoreyearsofserviceuponterminationofemployment(tenyearsifhiredafterDecember10,2009)isentitledtoadeferredvestedbenefitpayablestartingatage62(age63forTier6).ThebenefitformulasarethesameasthosesetforthunderNormalServiceRetirement.
b. DISABILITYRETIREMENT
1. Requirements
A member is eligible for ordinary disability retirement if:
(a) he/shehascompletedtenormoreyearsofserviceand, (b) he/sheisincapacitatedfromperformanceofgainfulemployment.
If the disability is judged to be the result of an accident in the performance of duty, the servicerequirementiswaived.
2. BenefitPayable
Thebenefitisthegreatestof:
(a) ¹/³ ofFAS,(b) 1/60timesFAStimesyearsofcreditedservice,or(c) theserviceretirementallowancebutonlyifmemberhasmettheeligibility
requirementsforServiceRetirement.
c. ORDINARYDEATHBENEFIT
Uponthedeathofamemberinactiveservice,abenefitispayabletohis/herdesignatedbeneficiary.UnderlegislationeffectiveJuly26,1986,thedeathbenefitsarethesameasthoseapplicabletomemberswhojoinedtheSystembetweenJuly1,1973andJuly26,1976(describedinSectionD.II.eofthisSummaryOfPlanProvisions).

New York City Board of Education Retirement System
121
ACTU
ARIA
L
Summary of Plan Provisions
(Cont’d)
d. ACCIDENTALDEATHBENEFIT
1. Requirements
Abeneficiaryisentitledtothebenefitifthememberdiedbeforetheeffectivedateofretirementasanaturalandproximateresultofanaccidentsustainedintheperformanceofduty,andtheaccidentwasnotcausedbythemember’sownwillfulnegligence.
2. PensionPayable
Thebeneficiaryreceivesapensionequalto50%ofwagesearnedduringthelastyearofactualservice(mustbeappliedforwithintwoyearsofdeath)andwithin60daysifmemberjoinedafterAugust31,1983.
3. OtherProvisions
(a) Iftheeligiblebeneficiarybecomesineligibletocontinuetoreceivethebenefit,itshallbecontinuedtothenexteligibleclassofbeneficiaries,andifnone,toeachsuccessiveclass.
(b) Ifthebenefitspaiddonotexceedtheamountoftheordinarylumpsumbenefitbecauseoftheabsenceofeligiblebeneficiaries,thedifferenceistobepaidtothelasteligiblebeneficiary,orifnone,tothemember’sestate.
e. DESIGNATIONOFBENEFICIARY
Beneficiariesaredealtwithdifferentlyforordinarydeathandaccidentaldeathbenefits.Fortheordinarydeathbenefit,thelatestnamedbeneficiary,dulydesignatedonaSystemformfiledwiththeSystemwillreceivethedeathbenefit.Ifnoneisdesignated,thebenefitispaidtothemember’sestate.
Fortheaccidentaldeathbenefit,beneficiariesareprescribedinthefollowingorder:
1. asurvivingspousewhohasnotrenouncedsurvivorshiprightsinaseparationagreementuntilremarriage;
2. survivingchildren,untilage25;
3. dependentparentswhoseeligibilityshallbedeterminedinaccordancewithregulationspromulgatedbytheBoardofTrustees;and,
4. anyotherpersonwhoqualifiedasadependentonthefinalfederalincometaxreturnofthememberfiledintheyearimmediatelyprecedingtheyearofdeath,untilsuchpersonreaches21yearsofage.

New York City Board of Education Retirement System
122
ACTU
ARIA
L Summary of Plan Provisions (Cont’d)
D. PLANS FOR MEMBERS JOINING PRIOR TO JULY 27, 1976
I. Definitions
ACCUMULATEDDEDUCTIONS-Thetotalcontributionsmadebyamembertohisannuitysavingsaccount,withregularandspecialinterest,orincrementthereon.
FINALSALARY-(1)ForamemberwhojoinedpriortoJuly1,1973,salaryearnablebythememberinthe year ending on the date of retirement or alternatively, the average annual compensation during any threecalendaryearsdesignatedbythemember.(2)ForamemberwhojoinedafterJune30,1973,the average salary earned during any three consecutive years which provides the highest average salary.However,ifthesalaryearnedduringanyyearincludedinthisthreeyearperiodexceedstheaverageoftheprevioustwoyearsbymorethan20%,theamountinexcessof20%isexcludedfromthecomputation.
MINIMUMACCUMULATION-Theamountofnormalcontributionsaccumulatedwithinteresttothedate on which a member either completed or could have completed 25 years of career pension plan service,lesstheamountofthereserveforIncreased-Take-Home-Payonsuchdate.
PAYABILITYDATE-Formemberswhoelectedthecareerpensionplan,thedateonwhichtheserviceretirementallowancebegins,whichisthelatestof(1)thedateonwhichthememberretires,(2)thedateonwhichhe/sheattainstheage55(age50formembersinphysicallytaxingpositionsforatleast25yearsofservice),or(3)thedateonwhichhe/shecouldhavecompleted25yearsofservicehadhe/sheremainedinEducationalCityService.ForamemberwholastjoinedtheSystempriortoJuly1, 1959, the payability date is the date of retirement, regardless of age, provided such member has completed35yearsofservice.Forallothermembers,theretirementallowancebeginsonthedateofretirement.
PHYSICALLYTAXINGPOSITION-AnycareerpensionplanpositionwhichhasbeenincludedasphysicallytaxingbytheListAdministrator.
RESERVE-FOR-INCREASED-TAKE-HOME-PAY-Areserveof2percent,2.5percent,4percentor5percentofthemember’ssalary,pursuanttotheprovisionsofSection28oftheRulesandRegulations,accumulatedwithregularandadditionalinterest,orincrementthereon.
II. Benefits
a. SERVICERETIREMENT
1. CareerPensionPlan-(i)AmemberwhojoinedpriortoJuly1,1973whoelectedthecareerpensionplan(PlanA)iseligibletoretireafterhavingcompleted20yearsofcareerpensionplanqualifyingservice,withbenefitstobeginonthepayabilitydate.Regardless

New York City Board of Education Retirement System
123
ACTU
ARIA
L
Summary of Plan Provisions
(Cont’d)
of the number of years of service, however, a member who has elected the career pension planandwhoisatleast55yearsofagemayretirewithbenefitspayableimmediatelybycancelinghiselectionofthecareerpensionplan,therebybecomingeligibleforthebenefitsunderthe55year-increased-service-fractionplanwhichisdescribedinparagraph(2)below.(ii)InorderforamemberwhojoinedafterJune30,1973(PlanC)tobeeligibleforretirement,hemust(a)haveattainedage55and(b)haverenderedfiveyearsofcreditedservice,inadditiontotheaforementionedrequirements.
Theserviceretirementallowanceisthesumof(a)2.2%offinalsalary,multipliedbythenumberofyearsofcareerpensionplanservicenotinexcessof25,reducedbyanannuitywhichistheactuarialequivalentoftheMinimumAccumulation,(b)anannuitywhichistheactuarialequivalentoftheaccumulateddeductions,and(c)forallyearsofserviceotherthanthefirst25yearsofcareerpensionplanservice,(i)apensionforincreased-take-home-paymadeineachyearand(ii)1.2%offinalsalaryforeachsuchyearpriortoJuly1,1968and1.7%offinalsalaryforeachyearbeginningonorafterthatdate.
2. 55-Year-Increased-Service-FractionPlan-(i)AmemberwhojoinedpriortoJuly1,1973(PlanB)andwhoelectedthe55-year-increased-service-fractionplanmayretireafterhavingattainedage55withbenefitspayableimmediatelyuponretirement.(ii)InorderforamemberwhojoinedafterJune301973,(PlanD)tobeeligibleforretirement,hemusthaverenderedfiveyearsofcreditedservice,inadditiontotheaforementionedrequirement.
Theserviceretirementallowanceconsistsofapensionforservice,apensionforincreased-take-home-payandanannuity.Thepensionforserviceisequalto1.2%offinalsalarymultipliedbyeachyearofservicepriortoJuly1,1968,plus1.53%offinalsalarymultipliedbyeachyearofserviceafterJune30,1968;thepensionforincreased-take-home-payistheactuarialequivalentofthereserveforincreased-take-home-pay;andtheannuityistheactuarialequivalentofthemember’saccumulateddeductions.
Any Plan C or D member who did not join the Optional Retirement Programs and who retires priortoage62willhavehispensionforservicereducedby0.5%foreachofthefirst24monthsthatthepayabilitydateprecedesage62,andby0.25%foreachsuchadditionalmonth.
b. ORDINARYDISABILITYRETIREMENT
Regardless of the plan elected, a member, who has completed 10 or more years of city service immediately preceding the occurrence of disability from causes other than accident in the actual performanceofduty,isentitledtoanordinarydisabilityretirementallowance.
Ifuponbecomingdisabled,themembercouldhaveretiredforservicewithbenefitspayableimmediately,theordinarydisabilityallowanceisthesameastheserviceretirementallowance.

New York City Board of Education Retirement System
124
ACTU
ARIA
L Summary of Plan Provisions (Cont’d)
Forallothermembers,theordinarydisabilityallowanceiscomputedinthesamemannerasthoughthememberhadbeeneligibleforserviceretirementunderthe55-year-increased-service-fractionplanwithbenefitspayableimmediatelyregardlessofageandwithoutreductionforage.
c. ACCIDENTDISABILITYRETIREMENT
Upon the occurrence of disability caused by an accident in the actual performance of duty, a memberisentitledtoanaccidentdisabilityretirementallowanceconsistingofapensionequaltothree-fourthsoffinalcompensation,apensionforincreased-take-home-paywhichistheactuarialequivalentofthereserveforincreased-take-home-pay,andanannuitypurchasedwiththemember’saccumulateddeductions.ThepensionissubjecttoreductionbecauseofWorker’sCompensationbenefitsgrantedonaccountoftheaccident.
d. CHANGINGRETIREMENTPLAN
1. AmemberinPlanA(PlanC)maychangetoPlanB(PlanD)atanytimeafterhisfirstyearofcoverageunderPlanA(PlanC).
2. AmemberwhoelectedPlanB(PlanD)canchangetoPlanA(PlanC)atanytime.
3. AmemberinanOldServiceFractionPlancanchangetoPlanA,B,CorD.
4. APlanA(PlanC)memberwhointendstoleavecityservicewhohasatleast5yearsbutless than 20 years of service credit, and who wishes to vest his rights must elect Plan B (PlanD)byfilingwiththeRetirementSystemanaffidavitwithdrawingfromPlanA(PlanC),priortoresignation.
e. ORDINARYDEATHBENEFIT
Upon the death of a member from causes other than an accident in the actual performance ofduty,abenefitispaidtothemember’sestateortosuchpersonasthemembershallhavenominated.
WithrespecttoamemberwhojoinedbeforeJuly1,1973,andtotalnumberofyearsofallowableservicelessthanten,thebenefitisequaltothecompensationearnablebythememberinthesixmonthsimmediatelyprecedingdeathand,ifthetotalnumberofyearsofallowableserviceisgreaterthanten,butlessthantwenty,thebenefitisequaltothecompensationearnableduringthetwelvemonthsimmediatelyprecedingdeath.Ifthetotalnumberofyearsofallowableserviceisgreaterthantwenty,thebenefitisequaltotwicethecompensationearnableduringthetwelvemonthsimmediatelyprecedingdeath.

New York City Board of Education Retirement System
125
ACTU
ARIA
L
Summary of Plan Provisions
(Cont’d)
Inaddition,themember’saccumulateddeductionsandthereserveforincreased-take-home-payarepaidtothemember’sestateortothemember’sdesignatedbeneficiary.Thebenefitpayable on account of such a member who at the time of death would have been eligible for serviceretirementiseitherthebenefitdescribedaboveoranamountequaltothereserveontheretirement allowance which would have been payable had the member retired on the day before death,whicheverislarger.
AmemberwhojoinsafterJune30,1973mustchoosebetweenthefollowingtwodeathbenefitswhichcannotbechanged;upondeath,abenefitispaidpursuanttosuchelection.
DeathBenefit1:Onemonth’ssalaryforeachyearofserviceuptoamaximumofthreeyears’salary.Inaddition,themember’saccumulateddeductionsarepayable.Ifthememberwouldhavebeeneligibletoreceiveanunreducedretirementallowanceatthetimeofdeath,thebenefitisthereserve on the retirement allowance which would have been payable had the member retired on thedaybeforehisdeath,ifgreater.
DeathBenefit2:Inadditiontoarefundofthemember’saccumulateddeductions,oneyear’ssalaryforeachyearofserviceuptoamaximumofthreeyears’salary.Themaximumbenefitdeclinesafterage60attherateof5%peryear,toaminimumof50%ofthebenefitineffectatage60.
Abenefitisalsopayableupondeathafterretirement,whichbenefitisexpressedasapercentofthebenefitinforceimmediatelybeforeretirementasfollows:Ifdeathoccursinthefirstyearafterretirement,50%ofsuchbenefit;ifdeathoccursinthesecondyearfollowingretirement,25%;upondeathoccurringsubsequently,10%.Ifretirementoccurredafterage60,theminimumdeathbenefitpayableafterretirementis10%ofthedeathbenefitinforceatage60.
TheRulesandRegulationsadoptedbytheBoardofTrusteesinaccordancewithChapter581oftheLawsof1970providethatthefirst$50,000ofeachbenefitonaccountofdeathinactiveserviceispayablefromthegrouptermlifeinsuranceplan.Onlytheamountinexcessof$50,000,ifany,ispayablebytheretirementsystem.
f. ACCIDENTALDEATH
Thebenefitispayableuponthedeathofamemberwhichoccursasaresultofanaccidentsustainedintheperformanceofduty.
Theaccidentaldeathbenefitisalumpsumequaltothereserveforincreased-take-home-payandapensionequaltoone-halfoffinalaveragesalary,payabletothesurvivingspouseuntilremarriage or death, or if there is no surviving spouse, to a child or children until the attainment ofage18oftheyoungestchild,orifthereisnosurvivingspouseorchildtothedependent

New York City Board of Education Retirement System
126
ACTU
ARIA
L Summary of Plan Provisions (Cont’d)
parents.Inaddition,themember’saccumulateddeductionsarepaidtohis/herestateortothedesignatedbeneficiary.ThepensionissubjecttoreductionbecauseofWorker’sCompensationbenefitsgrantedonaccountoftheaccidentaldeath.
g. TERMINATIONOFEMPLOYMENT
Amemberwhoeitherresignsorisdismissedwithfaultreceivesabenefitequaltohisaccumulateddeductions.Atresignationwithatleast5yearsofservicethemembermayelect,in lieu of a return of his accumulated deductions, to receive an allowance computed in the same mannerastheretirementallowanceforretirementunderthe55-year-increased-service-fractionplan,exceptthattheallowanceisdeferredtoage55.Shouldamemberwithlessthan10yearsofservice who elected to receive a deferred retirement allowance die before the attainment of age 55,thebenefitconsistsoftheaccumulateddeductions.Ifamemberwhoatresignationhadatleast 10 years of service and elected to receive a deferred retirement allowance dies before the attainmentofage55,thebenefitisone-halfoftheordinarydeathbenefit.
A member not eligible for service retirement and who is removed from service without fault or delinquencyandhasnotlessthanone-halfyearofserviceintheyearimmediatelyprecedingthe date of termination or who is so removed from a position in the competitive or labor class, regardless of service, is entitled to the return of his accumulated deductions in a lump sum paymentortoapensionwhosepresentvalueisequaltothepensionhewouldhavereceivedathisearliestpayabilitydate,basedonhisservicetodateoftermination.Ifthememberhasattained age 50 and has completed at least 20 years of service, an additional pension is payable equaltoone-halfthedifferencebetweenthepensionsocomputedandthepensionpayableathisearliestageforserviceretirement.Inaddition,hereceivesapensionwhichistheactuarialequivalentofhisreserveforincreased-take-home-payandanannuityofsuchamountashisaccumulateddeductionswillpurchase.
h. AUTOMATICANNUALCOST-OF-LIVINGADJUSTMENTS(COLA)
COLAarepayabletomemberswhoareeither(1)atleastage62andhavebeenretiredforatleast5yearsor(2)atleastage55andhavebeenretiredforatleast10years.Additionally,COLAare payable to members who retired for disability after being retired for 5 or more years and beneficiariesreceivingaccidentaldeathbenefitswhohavebeenreceivingthemforatleast5years.
StartingwithbenefitsforSeptember2001,COLAare50%oftheincreaseintheCPI-UbasedontheyearendingMarch31,roundingtothenexthigher.1%,notlessthan1%norgreaterthan3%ofthefirst$18,000ofthesumofthemaximumretirementallowanceandpriorCOLA.
COLAarepayableduringthelifeoftheretiredmember.Onehalfoftheamountisalsopayableafterthemember’sdeathandduringthelifeofthespousebeneficiaryifsuchretiredmember

New York City Board of Education Retirement System
127
ACTU
ARIA
L
Summary of Plan Provisions
(Cont’d)
hadelectedoneoftheoptionsundertheAdministrativeCodewhichprovidesthatbenefitsareto be continued for the life of such spouse after the death of the retired member, and where the death of such retired member occurred or occurs more than thirty days after the effective date of theretirementofsuchmember.
E. OPTIONS ON RETIREMENT OR DEATH
No Option (Maximum Retirement Allowance)
Amemberuponretirementmayreceivethebasicmaximumretirementallowancepayableinmonthlyinstallmentsthroughoutlifewithallpaymentsendingatdeath.
Alternatively,amembermayelecttoreceiveanactuarialequivalentbenefitinanyoneofthefollowingoptionalforms.
WithrespecttoplansotherthantheCoordinatedRetirementPlan(Article15):
Option1(CashRefund)
WithrespecttomemberswhojoinedpriortoJuly1,1973,acashrefundallowanceunderwhichreduced payments will be made during life with a provision that in case of death before such payments haveequaledthepresentvalueoftheretirementallowanceatdateofretirement,thebalanceshallbepaidtothedesignatedbeneficiaryorestate.WithrespecttomemberswhojoinedafterJune30,1973,thisoptionisonlyavailablewithrespecttothebenefitsderivedfromemployeecontributions(annuity).
Option 2 (Jointand100%SurvivorAllowance)
Option 3 (Jointand50%SurvivorAllowance)
A joint and survivor allowance under which reduced payments will be made during life with a provision thatatthedeathofthememberthesamepayments(Option2)oronehalfofsuchpayments(Option3)shallbecontinuedthroughoutthelifeofsuchotherpersonasthemembershallhavedesignated.
Option4
SuchotherformofbenefitwhichistheactuarialequivalentasmaybecertifiedbytheActuaryandapprovedbytheBoardofTrustees.Byresolution,theBoardofTrusteeshasapprovedanoptionunderwhichreducedpaymentswillbemadeduringlifewithaprovisionthatuponhis/herdeath,asumspecifiedbythememberatthetimeofretirementshallbepaidtothedesignatedbeneficiaryorestate.

New York City Board of Education Retirement System
128
ACTU
ARIA
L Summary of Plan Provisions (Cont’d)
Option4-2and4-3
Option4-2andOption4-3areknownasthe“Pop-Up”options.Thesearecalled“Pop-Ups”becausethey are variations of Options 2 and 3 that provide if a joint and survivor option is elected and the beneficiarypredeceasestheretiree,thentheretirementallowancewillincrease(pop-up)tothelevelofthemaximumretirementallowance.
Ten-Year(orFive-Year)CertainandLife
Ten-year(orfive-year)certainandlifeallowanceunderwhichreducedpaymentswillbemadeduringthelifetimeofthememberwithaprovisionthatincaseofdeathwithinten(five)yearsofretirement,theremainingbenefitthatwouldhavebeenpayablehadthemembersurvivedforten(five)yearsshallbepaidtothedesignatedbeneficiaryorestateforthebalanceoftheten(five)years.
With respect to Article 15, the options are as follows:
a. Afive-yearorten-yearcertainandlifeoption,thesameasdescribedabove.
b. Ajointandsurvivoroptionunderwhichreducedpaymentswillbemadeduringlifewithaprovisionthatatthedeathofthemember,100%,75%,50%or25%ofsuchpaymentsshallbecontinuedthroughoutthelifeofsuchotherpersonasthemembershallhavedesignated.
c. Apop-upoptionasdescribedabove.
F. CONTRIBUTIONS
ThebenefitsofthesystemarefinancedbyemployeeandemployercontributionsandfrominvestmentearningsoftheSystem.
I. EMPLOYEECONTRIBUTIONS
AmemberofArticle15whojoinsBERSonorafterApril1,2012(Tier6)andisnotamemberoftheAutomotiveorSpecialOfficersProgramsisrequiredtocontributebetween3.0%and6.0%ofsalary,dependingonsalarylevel,forallyearsofservice.Tier6membersintheAutomotiveorSpecialOfficersProgramscontribute3.0%ofsalaryplusAdditionalMemberContributions(AMC).
ATier4memberofArticle15(CoordinatedRetirementPlan)whojoinedBERSonorbeforeMarch31,2012ismandatedtocontribute3%ofsalaryduringallyearsofcoverage.EffectiveOctober1,2000,thesemembersarenotrequiredtomakecontributionsafterthe10thanniversaryoftheirmembershipdateorcompletionoftenyearsofcreditedservice,whicheverisearlier.ForthosewhoelectedorweremandatedintotheOptionalRetirementPlans,AMCarerequired.

New York City Board of Education Retirement System
129
ACTU
ARIA
L
Summary of Plan Provisions
(Cont’d)
AmemberwhojoinedpriortoJuly27,1976contributesbysalarydeductionsonthebasisofanormalrateofcontributionwhichisassignedbytheSystematthetimehe/sheelectshis/herplan.Thenormalrate,whichisdependentuponthemember’sageandplan,aswellasthetablesineffectforthatpurposeatthetimehe/shebecameamember,isdeterminedsoastoprovideapproximatelyone-thirdofthebenefitonaccountofthefirst25yearsofservice.
In the plans which permit retirement for service at age 55, the normal contribution rate is calculatedsoastoprovideanannuityequalto1%offinalsalaryforeachyearofserviceattheearliestageforserviceretirement.Forsuchplans,thecontributionrateformemberswhoenteratage55oroveristherateapplicabletoamemberenteringatage54.
Membercontributionsareaccumulatedwithinterestonindividuallymaintainedledgeraccounts.ExceptunderArticle15,uponretirement,theamounttohis/hercredit(i.e.,accumulateddeductions)isusedtopurchaseanannuityonthebasisofthetablesadoptedbytheBoardofTrustees.Upondeathinservice,theaccumulateddeductionsarepaidtothebeneficiary.
BeginningJuly1,1960,onayeartoyearbasis,thenormalratesofcontributionofmemberswhojoinedbeforeJuly27,1976werereducedbyanincreased-take-home-payrateequaltotwoandone-halfpercentagepointsandequaltofivepercentagepointsbeginningJuly1,1961.BetweenJuly1,1968andDecember31,1975,anincreased-take-home-payrateoffourpercentagepointswaseffectiveforallmembers.OnJanuary1,1976,anincreased-take-home-payrateoftwopercentagepointsbecameeffectiveforallmembers.Followingisatableshowingtheeffectiveperiodsandincreased-take-home-payrate.
Period Increased-Take-Home-Pay Rate 07-01-1960-06-30-1961 2.5%07-01-1961-06-30-1968 5%07-01-1968-12-31-1975 4%01-01-1976andafter 2%fornon-Article14&15Members 0%forArticle14&15Members
At present the reduction is two percentage points for members other than members in the CoordinatedRetirementPlan.Ingeneral,theretirementanddeathbenefitspayabletooronaccountofmembersaresupplementedbythereserveforincreased-take-home-pay,accumulatedfromCitycontributionsequaltotheincreased-take-home-payratetimessalarysothatingeneral,thetotalbenefitisequaltothebenefitwhichwouldhavebeenpaidifthemembers’ratesofcontributionhadnotbeenreduced.However,thereserveforincreased-take-home-payisnotpayableupondeathofamemberwhojoinsafterJune30,1973.

New York City Board of Education Retirement System
130
ACTU
ARIA
L Summary of Plan Provisions (Cont’d)
II. Purchase Of Prior Service
A member is eligible to purchase credit for city service rendered prior to membership date by an additionalcontributionbasedonsalaryandperiodsofservicebeingpurchased.
InthecaseofanymemberinBERSpriortoJuly1,1968,whohaspurchasedservice,theamountofpurchasedservicecanbeusedtowardthetwenty-fiveyearsneededforretirementeligibilityunderPlanA,providedsuchservicewascontinuousandimmediatelyprecededmembership.
III. Loans
a. AfterthreeyearsofmembershipintheRetirementSystem,amembermayborrowupto75%ofaccumulateddeductions.
b. Amembermaytakethreeloansduringanytwelvemonthperiod.
c. Loansarerepaidthroughpayrolldeductionofnotlessthan5%ofgrosssalary.
Beginning90daysaftertheinceptionoftheloan,theunpaidportionisinsuredwithoutlimitation.Shouldtheborrowerretirebeforetheloanisrepaid,theactuarialequivalentoftheamountoutstandingisdeductedfromhis/herretirementallowance.
IV. Employer Contributions
TheEntryAgeActuarialCostMethodisutilizedbythePlan’sActuarytocalculatethecontributionfromtheemployers.
EmployercontributionsareaccruedbythePlanandarefundedbytheemployersonacurrentbasis.
G. VARIABLEANNUITYPROGRAM
BeginningJuly1,1970,membersweregiventheoptiontoparticipateinaVariableAnnuityProgram,therebyprovidingameanswhichcanreasonablybeexpectedtoprotectaportionoftheirretirementincomeagainsttheeffectofincreasesinthecostofliving.Themonthlyvariableannuitypaymentisafixednumberofunits,thevalueofwhichvarieseachmonthtoreflectthefinancialexperienceoftheinvestmentswhicharealmostentirelyincommonstocks.Amembermayelecttoplacepartorallofhis/hercontributionsandtheCity’scontributionsforincreased-take-home-payinthevariableannuityprogram.TheremainingportionoftheretirementallowancewhichisprovidedbytheCitymustbepaidinfixeddollaramounts.Subjecttocertainprescribedlimitations, a member may periodically elect either to participate in the variable annuity program ortorevokeapreviouselection.

New York City Board of Education Retirement System
131
ACTU
ARIA
L
Summary of Plan Provisions
(Cont’d)
Anindividualaccountofthemember’sowncontributionsismaintainedintheVariableAnnuitySavingsFund.AnotherindividualaccountbasedontheCity’scontributionforincreased-take-home-payismaintainedintheVariablePensionAccumulationFund.Depositsintheseaccountsare credited in terms of units, the value of which is determined at the beginning of each month andremainsunchangedduringthatmonth.OnJuly1,1970,theeffectivedateoftheprogram,aunitwasassignedanarbitraryvalueof$10.Eachmonth,thereafter,theunitvaluechangedreflectingtheinvestmentexperienceofthecommonstockfundduringtheprecedingmonth.
H. TAX-DEFERREDANNUITYPROGRAM
BeginningJanuary1,1970,membersweregiventheoptiontoparticipateinatax-deferredannuityprogram,therebyprovidingameansofdeferringincometaxpaymentsontheirtaxdeferredcontributionsuntiltheperiodafterretirement.Eachcalendaryear,amembermayelecttocontributetotheTax-DeferredAnnuityProgramanyamountnotinexcessofthemaximumpermissibleamountunderSection403(b)oftheInternalRevenueCode.TheCitymakesnocontributionstotheTax-DeferredAnnuityProgram,butifelectedbymembers,willguaranteethebenefitpaymentstoretiredmembers.Amemberhastheoptioneithertohavehis/hercontributionsaccumulateatregularandspecialinterestperannum,ortohavehis/hercontributionsinvestedinvariablefunds.
TheTax-DeferredAnnuityProgramismaintainedasaseparateaccountwithintheBoardofEducationRetirementSystem.Anindividualaccountofthemember’sfixeddollarcontributionsismaintainedintheTax-Deferred-AnnuitySavingsFundifhe/sheelectedtohavehis/herbenefitpaidinfixeddollars;otherwise,intheTax-DeferredVariableAnnuitySavingsFund.

New York City Board of Education Retirement System
132
STAT
ISTI
CAL
This page is intentionally left blank

New York City Board of Education Retirement System
133
STAT
ISTI
CAL
STATISTICAL• Introduction 135• ScheduleofRevenueBySource-QPP 136• ScheduleofExpensesByType-QPP 138• ScheduleofRefundsByType-QPP 140• ScheduleofChangesInQPPNetPosition 142• ScheduleofChangesInTDANetPosition 144• ScheduleofBenefitExpensesByType-QPP 146• ScheduleofRetiredMembersbyTypeofBenefit-QPP 147• ScheduleofSummaryofActivesbyAgeandService-QPP 150• ScheduleofAnnualAverageBenefitPaymentsAmount-QPP 153• ScheduleofParticipatingEmployers-QPP 154

New York City Board of Education Retirement System
134
STAT
ISTI
CAL
This page is intentionally left blank
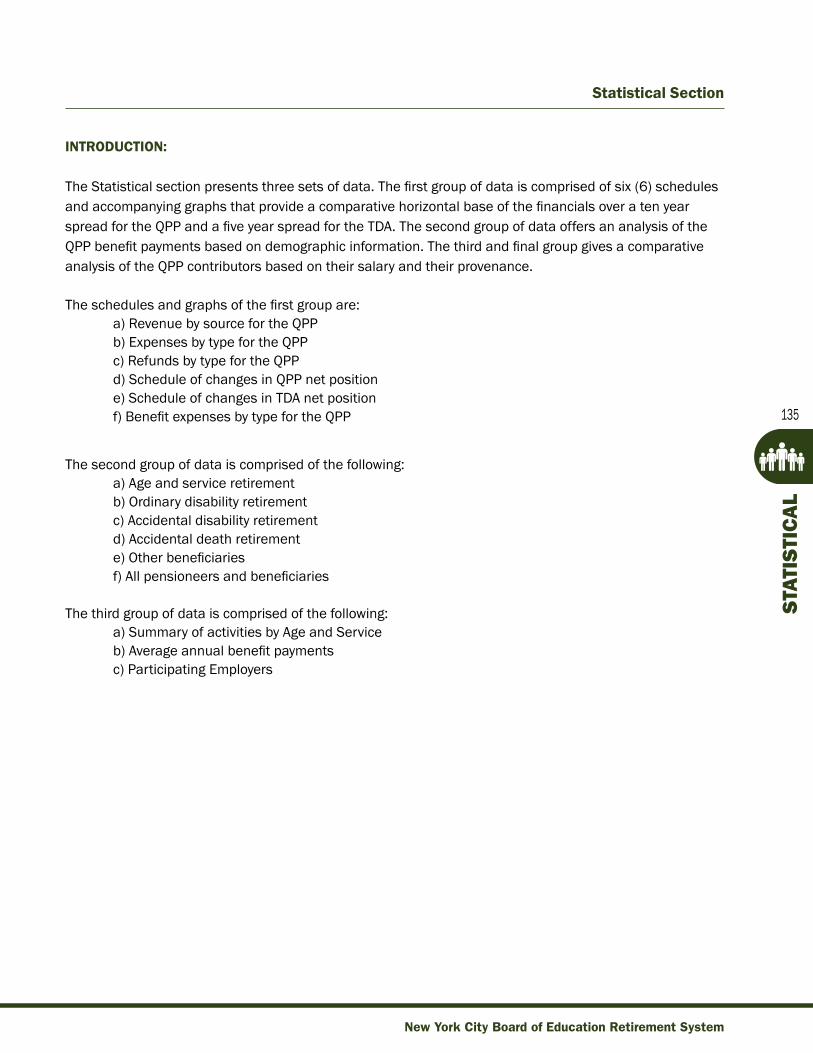
New York City Board of Education Retirement System
135
STAT
ISTI
CAL
Statistical Section
INTRODUCTION:
TheStatisticalsectionpresentsthreesetsofdata.Thefirstgroupofdataiscomprisedofsix(6)schedulesandaccompanyinggraphsthatprovideacomparativehorizontalbaseofthefinancialsoveratenyearspreadfortheQPPandafiveyearspreadfortheTDA.ThesecondgroupofdataoffersananalysisoftheQPPbenefitpaymentsbasedondemographicinformation.ThethirdandfinalgroupgivesacomparativeanalysisoftheQPPcontributorsbasedontheirsalaryandtheirprovenance.
Theschedulesandgraphsofthefirstgroupare: a)RevenuebysourcefortheQPP b)ExpensesbytypefortheQPP c)RefundsbytypefortheQPP d)ScheduleofchangesinQPPnetposition e)ScheduleofchangesinTDAnetposition f)BenefitexpensesbytypefortheQPP
The second group of data is comprised of the following: a)Ageandserviceretirement b)Ordinarydisabilityretirement c)Accidentaldisabilityretirement d)Accidentaldeathretirement e)Otherbeneficiaries f)Allpensioneersandbeneficiaries
The third group of data is comprised of the following: a)SummaryofactivitiesbyAgeandService b)Averageannualbenefitpayments c)ParticipatingEmployers

New York City Board of Education Retirement System
136
STAT
ISTI
CAL
Qua
lified
Pen
sion
Pla
n R
even
ue b
y So
urce
(In
thou
sand
s)
Fi
scal
Empl
oyer
Ye
ar E
nded
Ne
t Mem
ber
Empl
oyer
Ne
t Inv
estm
ent
Cont
ribut
ions
Ju
ne 3
0 Co
ntrib
utio
ns
Cont
ribut
ions
In
com
e Ot
her I
ncom
e To
tal
as %
of P
ayro
ll
2007
$26,148
$129,820
$342,656
$39,148
$537
,772
18.2
2008
$27,109
$143,100
($130,569)
($24,831)
$14,
809
19.1
2009
$30,971
$134,225
($329,365)
($141,090)
($30
5,25
9)
17.3
2010
$31,361
$147,349
$218,872
$38,232
$435
,814
17.3
2011
$31,008
$180,191
$425,690
$95,958
$732
,847
19.8
2012
$32,866
$213,651
$113,738
($170,091)
$190
,164
23.4
2013
$39,056
$196,246
$660,827
($340,057)
$556
,072
21.3
2014
$37,193
$214,590
$875,453
($277,531)
$849
,705
21.1
2015
$39,564
$258,099
$177,166
($137,125)
$337,704
24.5
2016
$38,581
$265,532
$164
,144
(252,288)
$215,969
25.4
Thetableoffersahorizontalcom
parisonbasefortherevenuesourcesofthePlanforthepast10years.
Itparticularlystressestheimportanceofemployercontributionsthathavesteadilyincreasedovertheyears.
NetInvestmentIncom
ehasbeenrestatedforthefiscalyears2012and2013duetothereclassificationofcertaindatabasedontheGASB67recommendation.

New York City Board of Education Retirement System
137
STAT
ISTI
CAL
Qua
lified
Pen
sion
Pla
n R
even
ue b
y So
urce
$-40
0,00
0
$-20
0,00
0$0
$200
,000
$400
,000
$600
,000
$800
,000
$1,0
00,0
00
Othe
r Rec
eipt
sN
et In
vest
men
t Inc
ome
Empl
oyer
Con
tribu
tions
Net
Mem
ber C
ontri
butio
ns
2016
2015
2014
2013
2012
2011
2010
2009
2008
2007

New York City Board of Education Retirement System
138
STAT
ISTI
CAL
Qua
lified
Pen
sion
Pla
n Ex
pens
es b
y Ty
pe
(In th
ousa
nds)
Fiscal
Benefit
Year
End
ed
Paym
ents
Ad
min
istra
tive
Ju
ne 3
0 De
ath
Retir
emen
t Re
fund
s Ot
her
Expe
nses
To
tal
2007
$6,326
$147,399
$3,534
$3,191
$7,281
$167
,731
2008
$3,827
$153,886
$3,395
$3,448
$7,854
$172
,410
2009
$7,544
$159,262
$2,768
$2,018
$8,413
$180
,006
2010
$8,548
$164
,362
$4,207
$1,296
$8,047
$186
,460
2011
$6,686
$172,680
$5,237
$1,662
$8,892
$195
,158
2012
$6,827
$181,735
$4,009
$1,936
$8,687
$203
,194
2013
$7,858
$191,463
$3,360
$1,412
$8,927
$213
,020
2014
$7,274
$202,233
$3,827
$981
$9,776
$224
,091
2015
$5,765
$211,693
$4,614
$1,172
$10,956
$234
,200
2016
$9,580
$224,639
$4,750
$1,758
$12,818
$253
,545
Thetableoffersahorizontalcom
parisonbasefortheexpensegroupsofthePlanforthepast10years.

New York City Board of Education Retirement System
139
STAT
ISTI
CAL
Qua
lified
Pen
sion
Pla
n Ex
pens
es b
y Ty
pe
(In th
ousa
nds)
$0
$50,
000
$100
,000
$150
,000
$200
,000
$250
,000
Adm
in. E
xpen
ses
Oth
erRe
fund
sRe
tirem
ent
Dea
th
2016
2015
2014
2013
2012
2011
2010
2009
2008
2007
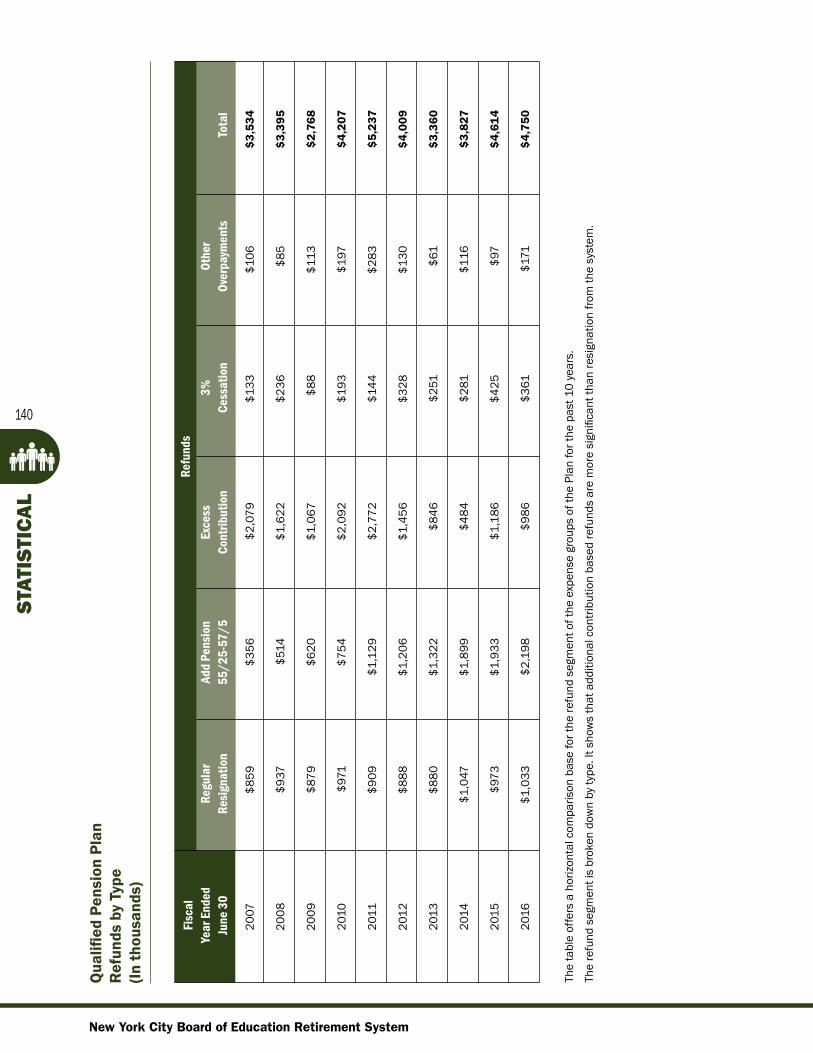
New York City Board of Education Retirement System
140
STAT
ISTI
CAL
Qua
lified
Pen
sion
Pla
n R
efun
ds b
y Ty
pe
(In th
ousa
nds)
Fi
scal
Re
fund
s
Year
End
ed
Regu
lar
Add
Pens
ion
Exce
ss
3%
Othe
r
June
30
Resig
natio
n 55
/25-
57/5
Co
ntrib
utio
n Ce
ssat
ion
Over
paym
ents
To
tal
2007
$859
$356
$2,079
$133
$106
$3,5
34
2008
$937
$514
$1,622
$236
$85
$3,3
95
2009
$879
$620
$1,067
$88
$113
$2,7
68
2010
$971
$754
$2,092
$193
$197
$4,2
07
2011
$909
$1,129
$2,772
$144
$283
$5,2
37
2012
$888
$1,206
$1,456
$328
$130
$4,0
09
2013
$880
$1,322
$846
$251
$61
$3,3
60
2014
$1,047
$1,899
$484
$281
$116
$3,8
27
2015
$973
$1,933
$1,186
$425
$97
$4,6
14
2016
$1,033
$2,198
$986
$361
$171
$4
,750
Thetableoffersahorizontalcom
parisonbasefortherefundsegmentoftheexpensegroupsofthePlanforthepast10years.
Therefundsegmentisbrokendownbytype.Itshowsthatadditionalcontributionbasedrefundsaremoresignificantthanresignationfromthesystem
.

New York City Board of Education Retirement System
141
STAT
ISTI
CAL
Qua
lified
Pen
sion
Pla
n R
efun
ds b
y Ty
pe
(In th
ousa
nds) $0
$500
,000
$1,0
00,0
00
$1,5
00,0
00
$2,0
00,0
00
$2,5
00,0
00
$3,0
00,0
00
Over
paym
ents
3% C
essa
tion
Exce
ss C
ontri
butio
n55
/25-
57/5
Regu
lar
2016
2015
2014
2013
2012
2011
2010
2009
2008
2007

New York City Board of Education Retirement System
142
STAT
ISTI
CAL
Qua
lified
Pen
sion
Pla
n Sc
hedu
le o
f Cha
nges
in N
et P
ositi
on
(In th
ousa
nds)
Net
Benefit
Changein
Ye
ar
Mem
ber
Empl
oyer
In
vest
men
t Ot
her
Tota
l Pa
ymen
ts
Adm
inist
rativ
e To
tal
Net
End
ed
Cont
ribut
ions
Con
tribu
tions
In
com
e Re
ceip
ts
Inco
me
Deat
h Re
fund
Re
tirem
ent
Othe
r Ex
pens
es
Expe
nses
Po
sitio
n
2007
$26,148
$129,820
$342,656
$39,148
$537
,772
$6,326
$3,534
$147,399
$3,191
$7,281
$167
,731
$370,041
2008
$27,109
$143,100
($130,569)
($24,831)
$14,
809
$3,827
$3,395
$153,886
$3,448
$7,854
$172
,410($157,601)
2009
$30,971
$134,225
($329,365)
($141,090)
($30
5,25
9)
$7,544
$2,768
$159,262
$2,018
$8,413
$180
,006
($485,265)
2010
$31,361
$147,349
$218,872
$38,232
$4
35,8
14
$8,548
$4,207
$164
,362
$1,296
$8,047
$186
,460
$249,354
2011
$31,008
$180,191
$425,690
$95,958
$732
,847
$6,686
$5,237
$172,680
$1,662
$8,892
$195
,158
$537,689
2012
$32,866
$213,651
$113,738
($170,091)
$190
,164
$6,827
$4,009
$181,735
$1,936
$8,687
$203
,194
($13,030)
2013
$39,056
$196,246
$660,827
($340,057)
$5
56,0
72
$7,858
$3,360
$191,463
$1,412
$8,927
$213
,020
$343,052
2014
$37,193
$214,590
$875,453
($277,531)
$8
49,7
05
$7,274
$3,827
$202,233
$981
$9,776
$224
,091
$625,614
2015
$39,56
4$258,099
$177,166
($137,125
$337
,704
$5,765
$4,614
$211,693
$1,172
$10,956
$234
,200
$103,504
2016
$38,581
$265,532
$164
,144
($252,288)
$215
,969
$9,580
$4,750
$224,639
$1,758
$12,818
$253
,545
(37,576)
Thetableoffersa10yearhorizontalcom
parisonbasefortheoperationsoftheBERS.

New York City Board of Education Retirement System
143
STAT
ISTI
CAL
Qua
lified
Pen
sion
Pla
n Sc
hedu
le o
f Cha
nges
in N
et P
ositi
on
(In th
ousa
nds)
$-60
0,00
0
$-40
0,00
0
$-20
0,00
0$0
$200
,000
$400
,000
$600
,000
$800
,000
$1,0
00,0
00
Chan
ge in
Net
Pos
ition
Tota
l Exp
ense
sTo
tal I
ncom
e
2016
2015
2014
2013
2012
2011
2010
2009
2008
2007

New York City Board of Education Retirement System
144
STAT
ISTI
CAL
Tax
Def
erre
d An
nuity
Pro
gram
Sc
hedu
le o
f Cha
nges
in N
et P
ositi
on
(In th
ousa
nds)
(Con
t'd)
Net
Transferof
Benefit
Changein
Ye
ar
Parti
cipa
nt
Inve
stm
ent
Othe
r In
vest
men
t To
tal
Paym
ents
Ad
min
istra
tive
Tota
l Ne
t E
nded
Co
ntrib
utio
ns
Inco
me
Rec
eipt
s In
com
e In
com
e De
ath
Refu
nd
Retir
emen
t Ot
her
Expe
nses
Ex
pens
es
Posit
ion
2012
$59,024
$6,468
$26,593
$28,396
$120
,481
$8,272
$25,146
$325
$68
$2,445
$36,
256
$84,225
2013
$61,550
$62,134
($86,810)
$163,756
$200
,630
$6,523
$27,802
$301
$31
$2,455
$37,
112$163,518
2014
$63,767
$82,223
($110,273)
$206,615
$242
,332
$9,242
$30,755
$354
$59
$2,531
$42,
941$199,391
2015
$74,890
$22,950
$4,448
$85,104
$187
,392
$4,133
$34,707
$370
$12
$3,033
$42,
255
$145,137
2016
$77,459
$1,049
($3,541)
$94,789
$169
,756
$13,292
$36,467
$351
$80
$850
$51,
039
$118,717
Thetableoffersa5yearhorizontalcom
parisonbasefortheoperationsoftheBERSTDAProgram.

New York City Board of Education Retirement System
145
STAT
ISTI
CAL
Tax
Def
erre
d An
nuity
Pro
gram
Sc
hedu
le o
f Cha
nges
in N
et P
ositi
on
(In th
ousa
nds)
(Con
t'd)
$0
$500
00
$100
000
$150
000
$200
000
$250
000
Chan
ge in
Net
Pos
ition
Tota
l Exp
ense
sTo
tal I
ncom
e
2016
2015
2014
2013
2012

New York City Board of Education Retirement System
146
STAT
ISTI
CAL
Qua
lified
Pen
sion
Pla
n B
enefi
t Exp
ense
s by
Typ
e (In
thou
sand
s)
Age A
nd
Disa
bilit
y Lu
mp
Sum
Pay
men
ts
Fi
scal
Year
Se
rvic
e Re
tirem
ent
De
ath
De
ath
Ended
Retirem
ent
Benefits
In
After
June30
Benefits
Duty
Non-Du
ty
Survivo
rs
Service
Retirem
ent
Total
2007
$147,399
$1,712
$3,595
$1,167
$4,678
$481
$159
,032
2008
$148,179
$1,841
$3,866
$1,226
$2,318
$284
$1
57,7
15
2009
$153,124
$1,980
$4,158
$1,288
$6,188
$68
$166
,806
2010
$157,760
$2,130
$4,472
$1,624
$6,887
$37
$172
,910
2011
$165,580
$2,291
$4,810
$1,280
$5,328
$77
$179
,366
2012
$174,099
$2,464
$5,173
$1,782
$5,035
$10
$188
,562
2013
$183,250
$2,649
$5,564
$1,963
$5,890
$5
$199
,321
2014
$193,400
$2,849
$5,984
$2,469
$4,768
$37
$209
,507
2015
$202,193
$3,065
$6,435
$1,532
$3,642
$592
$2
17,4
59
2016
$214,422
$3,296
$6,921
$2,453
$7,094
$34
$234
,219
Thetableoffersahorizontalcom
parisonbaseforthebenefitsegmentoftheexpensegroupsofthePlanacrossthepast10years.
Thebenefitsegmentisbrokendownbytype.

New York City Board of Education Retirement System
147
STAT
ISTI
CAL
Qualified Pension Plan
Retired Members by Type of Benefit
ORDINARY DISABILITY (NON-DUTY) RETIREMENT
NOTE:Thisscheduleisbasedon2014data(LAG)
Men Women Number Of Average Annual Number Of Average Annual Age Retirants Allowance Retirants Allowance
49&UNDER 6 $14,667 18 $13,450
50-54 25 17,977 39 11,942
55-59 44 19,914 93 11,072
60-64 51 17,458 147 9,824
65-69 38 16,188 152 9,678
70-74 26 13,245 118 8,968
75-79 13 14,038 45 9,073
80-84 6 19,757 20 6,687
85-89 6 15,906 2 7,834
90&OVER 3 7,261 1 12,354
TOTALS 218 $16,889 635 $9,981
AGE AND SERVICE RETIREMENT
Men Women Number Of Average Annual Number Of Average Annual Age Retirants Allowance Retirants Allowance
49&UNDER 1 $29,037 5 $16,583
50-54 13 43,635 2 44,246
55-59 88 28,187 282 12,938
60-64 338 31,344 1,284 11,763
65-69 545 28,819 2,440 10,542
70-74 532 28,353 2,337 9,779
75-79 456 26,932 1,782 8,486
80-84 347 24,269 1,479 8,151
85-89 235 26,015 1,165 7,745
90&OVER 118 21,944 701 7,731
TOTALS 2,673 $27,634 11,477 $9,508

New York City Board of Education Retirement System
148
STAT
ISTI
CAL
Qualified Pension Plan Retired Members by Type of Benefit (Cont’d)
ACCIDENTAL DISABILITY (DUTY) RETIREMENT
Men Women Age Of Number Of Average Annual Number Of Average Annual Retirants Retirants Allowance Retirants Allowance
49&UNDER 0 $0 3 $9,890
50-54 5 16,918 9 8,396
55-59 8 15,154 13 10,986
60-64 11 14,382 21 9,853
65-69 8 19,722 17 7,343
70-74 6 20,180 13 6,609
75-79 8 26,023 13 7,797
80-84 1 26,273 8 5,978
85-89 6 26,594 3 8,466
90&OVER 1 27,014 2 4,769
TOTALS 54 19,702 102 $8,332
ACCIDENTAL DEATH (DUTY) RETIREMENT
Men Women Age Of Number Of Average Annual Number Of Average Annual Retirants Retirants Allowance Retirants Allowance
49&UNDER 0 $0 0 $0
50-54 0 0 0 0
55-59 1 5,961 0 0
60-64 0 0 0 0
65-69 0 0 0 0
70-74 0 0 0 0
75-79 1 9,115 0 0
80-84 0 0 0 0
85-89 0 0 0 0
90&OVER 0 0 0 0
TOTALS 2 $7,538 0 $0
NOTE:Thisscheduleisbasedon2014data(LAG)

New York City Board of Education Retirement System
149
STAT
ISTI
CAL
Qualified Pension Plan Retired Members by Type of Benefit
(Cont’d)
ALL PENSIONERS AND BENEFICIARIES
Men Women Age Of Number Of Average Annual Number Of Average Annual Retirants Retirants Allowance Retirants Allowance
49&UNDER 36 $8,432 69 $8,265
50-54 53 21,488 76 11,160
55-59 153 23,125 411 12,320
60-64 412 28,599 1,496 11,591
65-69 616 27,014 2,670 10,584
70-74 586 26,760 2,542 10,063
75-79 504 25,484 1,938 9,131
80-84 373 23,388 1,608 8,790
85-89 261 24,783 1,272 8,592
90&OVER 130 20,727 789 8,481
TOTALS 3,124 $25,549 12,871 $9,876
OTHER BENEFICIARIES
Men Women Age Of Number Of Average Annual Number Of Average Annual Retirants Retirants Allowance Retirants Allowance
49&UNDER 29 $6,432 43 $5,014
50-54 10 3,760 26 8,398
55-59 12 4,522 23 10,542
60-64 12 11,679 44 13,307
65-69 25 6,446 61 15,450
70-74 22 6,001 74 21,399
75-79 26 6,277 98 21,055
80-84 19 8,293 101 18,790
85-89 14 7,127 102 18,284
90&OVER 8 7,047 85 14,707
TOTALS 177 $6,715 657 $16,536
NOTE:Thisscheduleisbasedon2014data(LAG)

New York City Board of Education Retirement System
150
STAT
ISTI
CAL
Qualified Pension Plan Summary of Actives by Age and Service Male
DATA USED IN THE JUNE 30, 2014 (LAG) ACTUARIAL VALUATIONFOR DETERMINING FISCAL YEAR 2016 EMPLOYER CONTRIBUTIONS
Age \ Svc Under 5 5-9 10-14 15-19 20-24 25-29 30-34 35-39 40 & Up All YearsNumber: UNDER 20 1 0 0 0 0 0 0 0 0 120TO24 103 0 0 0 0 0 0 0 0 10325 TO 29 288 32 0 0 0 0 0 0 0 32030TO34 369 136 25 0 0 0 0 0 0 53035 TO 39 320 204 100 21 1 0 0 0 0 64640TO44 289 245 154 60 16 1 0 0 0 76545TO49 268 221 179 134 55 21 1 0 0 87950TO54 272 205 167 158 138 85 14 2 0 1,04155 TO 59 194 167 144 130 121 119 44 12 0 93160TO64 117 115 86 86 73 79 44 20 5 62565 TO 69 47 58 53 28 21 19 15 9 6 25670 & UP 21 34 27 24 11 22 3 4 2 148TOTAL 2,289 1,417 935 641 436 346 121 47 13 6,245 Salaries (In thousands): UNDER20 44 0 0 0 0 0 0 0 0 4420TO24 2,885 0 0 0 0 0 0 0 0 2,88525 TO 29 10,700 1,316 0 0 0 0 0 0 0 12,01630TO34 16,564 7,523 1,106 0 0 0 0 0 0 25,19235 TO 39 15,819 12,769 6,045 1,308 55 0 0 0 0 35,99640TO44 13,985 16,687 10,833 3,887 867 26 0 0 0 46,28545TO49 12,447 15,094 12,494 9,971 3,943 1,431 75 0 0 55,45550TO54 12,021 12,195 10,660 11,781 10,516 6,932 1,087 155 0 65,34755 TO 59 8,104 9,963 8,994 9,227 9,392 10,211 4,334 1,011 0 61,23660TO64 4,957 6,423 4,984 5,611 6,057 6,817 4,168 1,737 420 41,17465 TO 69 1,635 2,769 2,497 1,951 1,556 1,585 1,346 956 638 14,93370 & UP 725 1,447 979 1,421 637 1,574 269 208 172 7,431TOTAL * 99,886 86,185 58,591 45,156 33,024 28,576 11,280 4,066 1,230 367,994
Average Salaries: ** UNDER20 43,880 0 0 0 0 0 0 0 0 43,88020TO24 28,011 0 0 0 0 0 0 0 0 28,01125 TO 29 37,153 41,117 0 0 0 0 0 0 0 37,55030TO34 44,888 55,314 44,233 0 0 0 0 0 0 47,53235 TO 39 49,433 62,595 60,446 62,279 55,460 0 0 0 0 55,72140TO44 48,392 68,110 70,347 64,787 54,169 25,700 0 0 0 60,50445TO49 46,444 68,298 69,797 74,407 71,695 68,156 75,440 0 0 63,08950TO54 44,195 59,486 63,834 74,566 76,204 81,547 77,633 77,400 0 62,77355 TO 59 41,774 59,658 62,458 70,976 77,621 85,808 98,506 84,212 0 65,77460TO64 42,371 55,854 57,951 65,245 82,974 86,288 94,719 86,861 83,958 65,87865 TO 69 34,781 47,733 47,109 69,671 74,104 83,432 89,749 106,220 106,367 58,33070 & UP 34,530 42,561 36,241 59,188 57,896 71,548 89,810 51,945 85,945 50,211TOTAL 43,637 60,822 62,664 70,447 75,743 82,589 93,222 86,517 94,606 58,926
Note:Ageislastbirthday.Serviceiscompletedyears.
* Totalmaynotaddupduetorounding.** Averagebasedonactualunroundedsalary.

New York City Board of Education Retirement System
151
STAT
ISTI
CAL
Qualified Pension Plan Summary of Actives by Age and Service
Female
DATA USED IN THE JUNE 30, 2014 (LAG) ACTUARIAL VALUATIONFOR DETERMINING FISCAL YEAR 2016 EMPLOYER CONTRIBUTIONS
Age \ Svc Under 5 5-9 10-14 15-19 20-24 25-29 30-34 35-39 40 & Up All YearsNumber: UNDER 20 3 0 0 0 0 0 0 0 0 320TO24 120 0 0 0 0 0 0 0 0 12025TO29 550 31 1 0 0 0 0 0 0 58230TO34 700 262 48 1 0 0 0 0 0 1,01135TO39 721 410 222 29 2 0 0 0 0 1,38440TO44 839 501 350 116 27 1 0 0 0 1,83445TO49 998 744 513 280 98 33 4 0 0 2,67050TO54 995 893 836 488 186 79 37 1 0 3,51555TO59 748 804 962 714 288 159 79 10 4 3,76860TO64 363 472 640 533 309 155 48 23 14 2,55765TO69 123 152 243 208 156 111 22 11 7 1,03370&UP 62 60 75 92 84 70 12 3 2 460TOTAL 6,222 4,329 3,890 2,461 1,150 608 202 48 27 18,937 Salaries (In thousands): UNDER20 85 0 0 0 0 0 0 0 0 8520TO24 3,148 0 0 0 0 0 0 0 0 3,14825TO29 22,880 1,249 80 0 0 0 0 0 0 24,20930TO34 33,168 14,342 2,102 43 0 0 0 0 0 49,65435TO39 29,382 21,758 11,633 1,340 103 0 0 0 0 64,21540TO44 29,984 20,182 16,241 6,114 1,734 82 0 0 0 74,33645TO49 30,638 25,311 18,396 11,281 5,212 1,984 388 0 0 93,21050TO54 27,980 28,847 27,506 16,547 7,897 4,472 2,503 93 0 115,84555TO59 22,091 25,675 30,007 23,268 10,634 7,735 5,250 755 228 125,64460TO64 10,711 15,123 19,431 15,736 11,275 6,263 2,742 1,405 882 83,56865TO69 3,382 4,558 6,966 5,804 4,701 3,622 1,090 600 509 31,23370&UP 1,370 1,603 1,828 2,433 2,158 1,957 489 115 97 12,049TOTAL * 214,817 158,648 134,188 82,565 43,715 26,115 12,462 2,968 1,716 677,194 Average Salaries: ** UNDER20 28,173 0 0 0 0 0 0 0 0 28,17320TO24 26,230 0 0 0 0 0 0 0 0 26,23025TO29 41,600 40,303 79,520 0 0 0 0 0 0 41,59630TO34 47,382 54,741 43,782 42,910 0 0 0 0 0 49,11435TO39 40,752 53,067 52,400 46,206 51,270 0 0 0 0 46,39840TO44 35,738 40,284 46,402 52,705 64,229 81,700 0 0 0 40,53245TO49 30,700 34,020 35,859 40,289 53,183 60,115 97,105 0 0 34,91050TO54 28,120 32,304 32,902 33,908 42,459 56,606 67,652 92,880 0 32,95755TO59 29,533 31,934 31,193 32,589 36,924 48,645 66,452 75,482 57,088 33,34560TO64 29,507 32,041 30,360 29,523 36,488 40,408 57,129 61,087 62,989 32,68265TO69 27,492 29,987 28,666 27,904 30,136 32,634 49,545 54,583 72,717 30,23570&UP 22,100 26,709 24,367 26,440 25,693 27,959 40,749 38,297 48,275 26,192TOTAL 34,525 36,648 34,496 33,550 38,013 42,952 61,695 61,833 63,547 35,760
Note:Ageislastbirthday.Serviceiscompletedyears.
* Totalmaynotaddupduetorounding.** Averagebasedonactualunroundedsalary.

New York City Board of Education Retirement System
152
STAT
ISTI
CAL
Qualified Pension Plan Summary of Actives by Age and Service Male and Female
DATA USED IN THE JUNE 30, 2014 (LAG) ACTUARIAL VALUATIONFOR DETERMINING FISCAL YEAR 2016 EMPLOYER CONTRIBUTIONS
Age \ Svc Under 5 5-9 10-14 15-19 20-24 25-29 30-34 35-39 40 & Up All YearsNumber: UNDER20 4 0 0 0 0 0 0 0 0 420TO24 223 0 0 0 0 0 0 0 0 22325TO29 838 63 1 0 0 0 0 0 0 90230TO34 1,069 398 73 1 0 0 0 0 0 1,54135TO39 1,041 614 322 50 3 0 0 0 0 2,03040TO44 1,128 746 504 176 43 2 0 0 0 2,59945TO49 1,266 965 692 414 153 54 5 0 0 3,54950TO54 1,267 1,098 1,003 646 324 164 51 3 0 4,55655TO59 942 971 1,106 844 409 278 123 22 4 4,69960TO64 480 587 726 619 382 234 92 43 19 3,18265TO69 170 210 296 236 177 130 37 20 13 1,28970&UP 83 94 102 116 95 92 15 7 4 608TOTAL 8,511 5,746 4,825 3,102 1,586 954 323 95 40 25,182 Salaries (In thousands): UNDER20 128 0 0 0 0 0 0 0 0 12820TO24 6,033 0 0 0 0 0 0 0 0 6,03325TO29 33,580 2,565 80 0 0 0 0 0 0 36,22530TO34 49,731 21,865 3,207 43 0 0 0 0 0 74,84735TO39 45,201 34,527 17,677 2,648 158 0 0 0 0 100,21140TO44 43,969 36,869 27,074 10,001 2,601 107 0 0 0 120,62245TO49 43,085 40,404 30,890 21,252 9,155 3,415 464 0 0 148,66550TO54 40,001 41,042 38,166 28,328 18,413 11,403 3,590 248 0 181,19255TO59 30,195 35,638 39,001 32,495 20,026 17,946 9,584 1,765 228 186,87960TO64 15,668 21,547 24,414 21,347 17,332 13,080 6,910 3,142 1,302 124,74265TO69 5,016 7,327 9,463 7,755 6,257 5,208 2,436 1,556 1,147 46,16570&UP 2,095 3,050 2,806 3,853 2,795 3,531 758 323 268 19,480TOTAL * 314,703 244,833 192,779 127,722 76,738 54,690 23,742 7,034 2,946 1,045,188 Average Salaries: ** UNDER 20 32,100 0 0 0 0 0 0 0 0 32,10020TO24 27,052 0 0 0 0 0 0 0 0 27,05225TO29 40,072 40,717 79,520 0 0 0 0 0 0 40,16130TO34 46,521 54,937 43,936 42,910 0 0 0 0 0 48,57035TO39 43,420 56,233 54,899 52,956 52,667 0 0 0 0 49,36540TO44 38,980 49,422 53,718 56,824 60,486 53,700 0 0 0 46,41145TO49 34,033 41,870 44,638 51,332 59,837 63,242 92,772 0 0 41,88950TO54 31,571 37,379 38,052 43,852 56,832 69,533 70,392 82,560 0 39,77055TO59 32,054 36,702 35,263 38,501 48,964 64,553 77,918 80,244 57,088 39,77060TO64 32,642 36,706 33,629 34,486 45,371 55,897 75,107 73,075 68,507 39,20265TO69 29,507 34,888 31,968 32,859 35,353 40,058 65,844 77,820 88,248 35,81570&UP 25,245 32,442 27,510 33,216 29,422 38,382 50,561 46,096 67,110 32,039TOTAL 36,976 42,609 39,954 41,174 48,385 57,327 73,505 74,045 73,641 41,505
Note:Ageislastbirthday.Serviceiscompletedyears.
* Totalmaynotaddupduetorounding.** Averagebasedonactualunroundedsalary.

New York City Board of Education Retirement System
153
STAT
ISTI
CAL
Qua
lified
Pen
sion
Pla
n An
nual
Ave
rage
Ben
efit P
aym
ents
Am
ount
Fisc
al Ye
ar
Serv
ice
Ordi
nary
(Non
-Dut
y)
Acci
dent
al (D
uty)
Su
rvivo
r
Ende
dRetirem
entB
enefits
DisabilityB
enefits
DisabilityB
enefits
Benefits
Ju
ne 3
0
Aver
age
Aver
age
Av
erag
e Av
erag
e
Aver
age
Aver
age
Av
erag
e Av
erag
e
Annu
al
Mon
thly
An
nual
M
onth
ly
Annu
al
Mon
thly
An
nual
M
onth
ly
Nu
mbe
r Al
lowa
nce
Allo
wanc
e Nu
mbe
r Al
lowa
nce
Allo
wanc
e Nu
mbe
r Al
lowa
nce
Allo
wanc
e Nu
mbe
r Al
lowa
nce
Allo
wanc
e
20
04(Lag)
10,45
0
$11,018
$918
45
4$9,881
$823
118
$12,29
5
$1,025
603
$12,942
$1,079
20
05(Lag)
10,723
$11,106
$926
495
$9,802
$817
125
$12,55
5
$1,046
628
$12,95
6
$1,080
20
06(Lag)
11,246
$11,26
0
$938
54
3$9,967
$831
127
$12,501
$1,042
657
$13,168
$1,097
20
07(Lag)
11,618
$11,44
0
$953
56
5$10,031
$836
141
$12,35
4
$1,030
667
$13,497
$1,125
20
08(Lag)
11,820
$11,55
6
$963
575
$10,278
$857
133
$12,614
$1,051
668
$13,38
2
$1,115
20
09(Lag)
12,176
$11,66
5
$972
627
$10,547
$879
118
$13,03
6
$1,086
720
$13,44
8
$1,121
2010(Lag)
12,43
5
$11,84
4
$987
671
$10,65
5
$888
13
3$12,700
$1,058
730
$13,35
6
$1,113
2011(Lag)
12,841
$12,244
$1,020
698
$10,975
$915
13
8$12,559
$1,047
722
$13,724
$1,144
2012
(Lag)
13,218
$12,520
$1,043
731
$11,39
3
$949
148
$12,49
0
$1,041
777
$13,96
9
$1,164
2013
(Lag)
13,662
$12,811
$1,068
795
$11,620
$968
15
3$12,80
9
$1,067
845
$14,579
$1,215
2014(Lag)
14,150
$12,932
$1,078
853
$11,68
0
$973
156
$12,26
8
$1,022
836
$14,43
5
$1,203

New York City Board of Education Retirement System
154
STAT
ISTI
CAL
Sche
dule
of P
artic
ipat
ing
Empl
oyer
s As
Of J
une
30, 2
014
(Lag
)
(1)
Thenumberofemployeesandtheircorrespondingsalaries(AnnualPayroll)includeonlycurrentactivemem
bersreceivingsalaryasofJune30th.
(2)
Alim
ited(deminimis)num
beroftheseemployeeshavebeenreportedasem
ployedbyem
ployersotherthanthoselistedinthetable.
Foractuarialvaluationpurposestheseem
ployeesareincludedwiththeNYCDepartmentofEducationpendingconfirmationofstatus.
As
of Ju
ne 3
0, 2
014
(Lag
) As
of Ju
ne 3
0, 2
005
Em
ploy
er
Num
ber o
f Em
ploy
ees(1
) An
nual
Pay
roll(1
) Nu
mbe
r of E
mpl
oyee
s(1)
Annu
al P
ayro
ll(1)
N
YC D
epar
tmen
t of E
duca
tion(
2)
24,608
$990,46
4,595
22,627
$685,062,766
NYCSchoolsConstructionAuthority
557
$54,110,222
36
4
$
29,538,936
Ch
arte
r Sch
ools
BeginningwithChildren
3
$101,372
7
$180,909
Renaissance
14
$
511,549
7
$295,008
To
tal
25
,182
$
1,0
45,1
87,7
38
23
,005
$
715,
077,
619


BOAR
D OF EDVCATION
CIT
Y OF N E W YORK
Board of Education Retirement System65 Court Street, Room 1603Brooklyn, NY 11201718-935-5400 • 800-843-5575