r d a - brookhaven national laboratory — a passion for ... · mental pathway scenarios that can...
TRANSCRIPT

Radiological Dose Assessment 8
2016 SITE ENVIRONMENTAL REPORT8-1
BNL’s annual radiological dose assessment assures stakeholders that on-site facilities and BNL operations are in compliance with federal, state, and local regulations, and that the public is protected. The potential radiological dose to members of the public is calculated at an off-site location closest to an emission source as the maximum dose that could be received by an off-site individual, defined as the “maximally exposed off-site individual” (MEOSI). Based on MEOSI dose calculation criteria, members of the public will receive a dose less than the MEOSI under all circumstances. The dose to the MEOSI is the sum total from direct and indirect dose pathways via air immersion, inhalation of particulates and gases, and ingestion of local fish and deer meat. In 2016, the total effective dose (TED) of 3.16 mrem (32 μSv) from Laboratory operations was well below the EPA and DOE regulatory dose limits for the public, workers, and the environment.
The dose estimates for 2016 were calculated using an updated version of the dose modeling software promulgated by EPA. As such, the effective dose equivalent (EDE) from air emissions in 2016 was estimated at 6.19E-01 mrem (6.2 μSv) to the MEOSI. This BNL dose level from the inhalation pathway was less than 7 percent of the EPA’s annual regulatory dose limit of 10 mrem (100 μSv). In addition, the dose from the ingestion pathway was estimated as 2.45 mrem (24.5 μSv) from the consumption of deer meat and 8.75E-2 mrem (0.88 μSv) from the consumption of fish caught in the vicinity of the Laboratory. In summary, the total annual dose to the MEOSI from all pathways was estimated at 3.16 mrem (32 μSv), which is less than 4 percent of DOE’s 100-mrem limit. The aggregate population dose was 0.937 person-rem among approximately 6 million people residing within a 50-mile radius of the Laboratory. On average, this is equivalent to a fraction of an airport whole body scan.
Dose to the maximally exposed individual (MEI) on-site and outside of controlled areas, calculated from thermoluminescent dosimeter (TLD) monitoring records, was 5 mrem above natural background radiation levels. The average annual external dose from ambient sources on-site was 64 ± 8 mrem (640 ± 80 μSv) and 60 ± 8 mrem (600 ± 80 μSv) from off-site ambient sources. Both on- and off-site external dose measurements include the contribution from natural terrestrial and cosmic background radiation. A statistical comparison of the average doses measured using 49 on-site TLDs and 18 off-site TLDs showed that there was no external dose contribution from BNL operations distinguishable from the natural background radiation level. An additional nine TLDs were used to measure on-site areas known to have radiation dose slightly above the natural background radiation.
Doses to aquatic and terrestrial biota were also found to be well below DOE regulatory limits. In summary, the overall dose impact from all Laboratory activities in 2016 was comparable to that of natural background radiation levels.
CHAPTER 8: RADIOLOGICAL DOSE ASSESSMENT

2016 SITE ENVIRONMENTAL REPORT 8-2
CHAPTER 8: RADIOLOGICAL DOSE ASSESSMENT
using standard statistical methods to assess the contribution, if any, from Laboratory operations.
8.1.1 Ambient Radiation MonitoringTo assess the dose impact of direct radiation
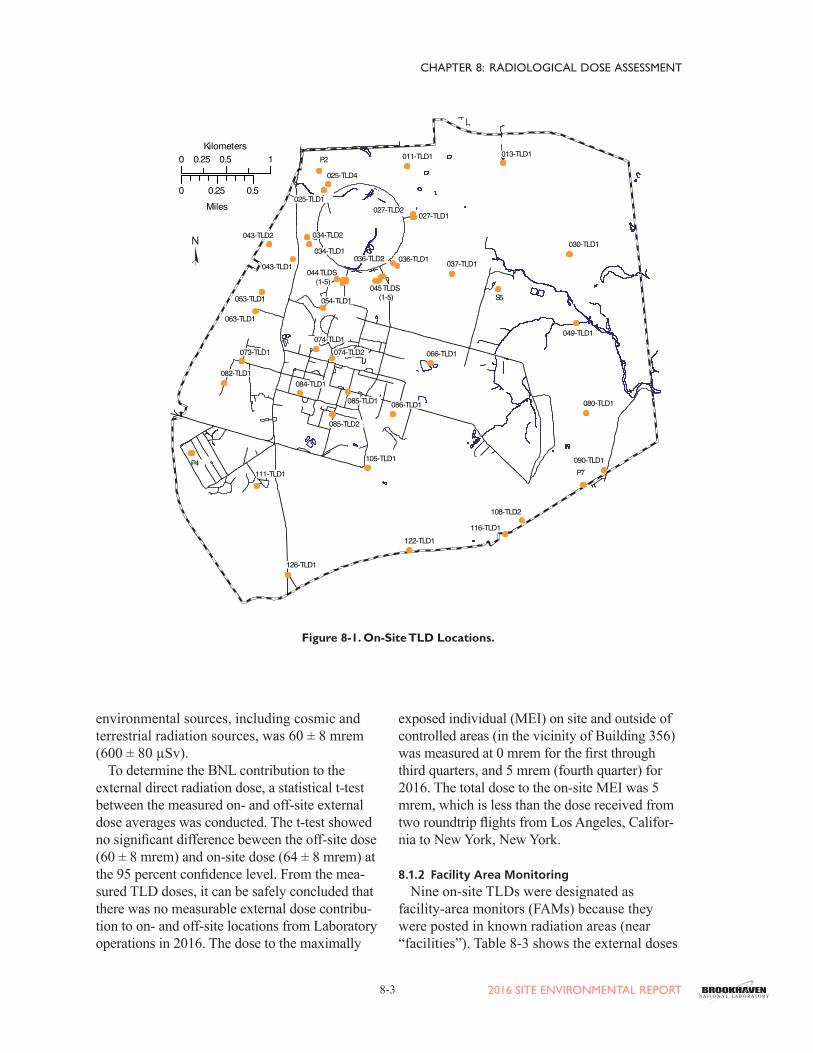
from BNL operations, TLDs are deployed on site and in the surrounding communities. On-site TLD locations are determined based on the potential for exposure to gaseous plumes, atmo-spheric particulates, scattered radiation, and the location of radiation-generating devices. The Laboratory perimeter is also posted with TLDs to assess the dose impact, if any, beyond the site’s boundaries. On- and off-site locations are divided into grids, and each TLD is assigned a unique identification code based on the grids.
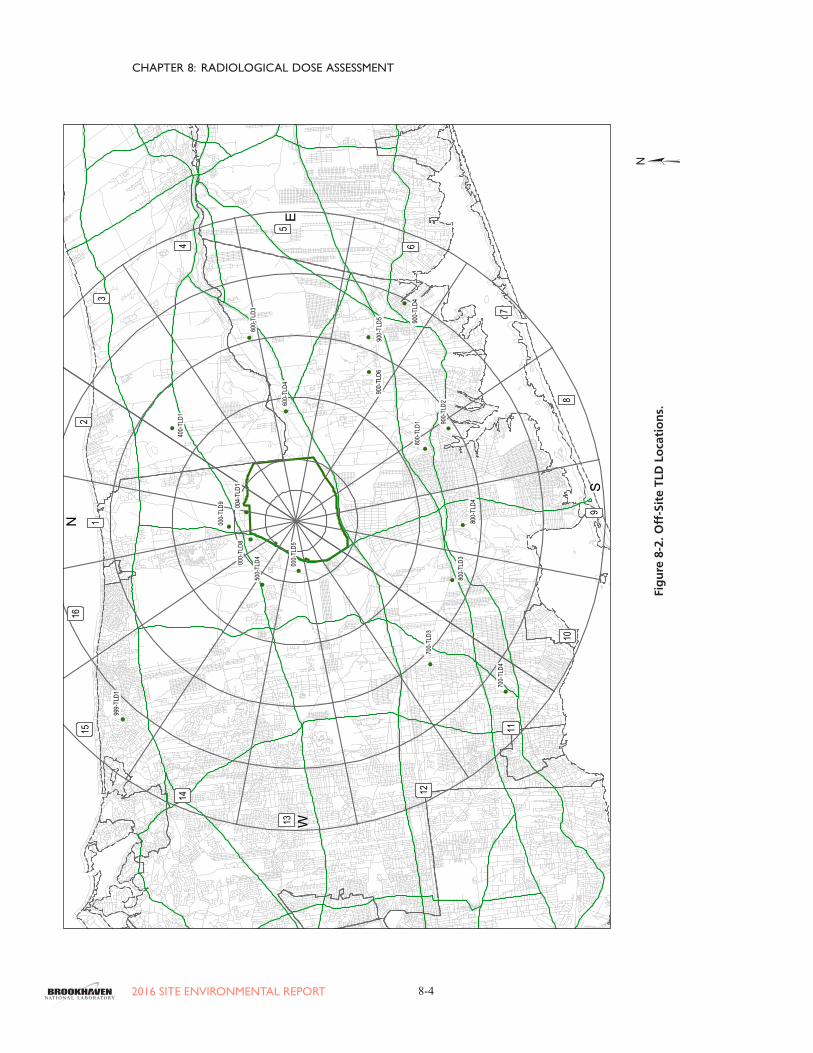
In 2016, a total of 49 environmental TLDs were deployed on site, of which 9 were placed in known radiation areas, and 18 were deployed at off-site locations (see Figures 8-1 and 8-2). All 16 wind sectors around the Laboratory had TLDs located in them. An additional 30 TLDs were stored in a lead-shielded container for use as reference and control TLDs for compari-son purposes. The average of the control TLD values, reported as “075-TLD4” in Tables 8-1 and 8-2, was 27 ± 3 mrem. This dose accounts for any small “residual” dose not removed from TLDs during the annealing process and the natural background and cosmic radiation sources that are not completely shielded. The on- and off-site TLDs were collected and read quarterly to determine the external radiation dose measured.
Table 8-1 shows the quarterly and yearly on-site radiation dose measurements for 2016. The on-site average external doses for the first through fourth quarters were 16.8 ± 3.4, 16.7 ± 3.9, 14.9 ± 3.0, and 16.3 ± 2.8 mrem, respec-tively. The on-site average annual external dose from all potential environmental sources, in-cluding cosmic and terrestrial radiation sources, was 64 ± 8 mrem (640 ± 80 µSv). Table 8-2 shows the quarterly and yearly off-site radiation dose measurements for 2016. The off-site aver-age external doses for the first through fourth quarters were 14.8± 3.3, 15.4 ± 2.8, 14.0 ± 2.2, and 16.1± 2.0 mrem, respectively. The off-site average annual ambient dose from all potential
8.0 INTRODUCTION
Chapter 8 discusses the dose risk conse-quences from research activities, radiation generating devices, facilities, and minor bench-top radiation sources at BNL. It is important to understand the health impacts of radiation to the public and workers, as well as radiation effects to the environment, fauna, and flora. The Labo-ratory’s routine operations, scientific experi-ments, and new research projects are evaluated for their radiological dose risk. The dose risks from decommissioned facilities and decontami-nation work are also evaluated. All environ-mental pathway scenarios that can cause a dose to humans, aquatic life, plants, and animals are evaluated to calculate the dose risks on site. Because all research reactors at BNL have been shut down, defueled, and partly or fully decom-missioned, there was no dose risk from these facilities in 2016. The Laboratory’s current radiological risks are from very small quanti-ties of radionuclides used in science experi-ments, production of radiopharmaceuticals at the Brookhaven Linac Isotope Producer (BLIP), and small amounts of air activation produced at the BNL accelerators: Alternating Gradient Syn-chrotron (AGS), Relativistic Heavy Ion Collider (RHIC), and the National Synchrotron Light Source II (NSLS-II). The radiological dose as-sessments are performed to ensure that dose risks from all Laboratory operations meet regu-latory requirements and remain “As Low As Reasonably Achievable” (ALARA) to members of the public, workers, and the environment.
8.1 DIRECT RADIATION MONITORING
A direct radiation-monitoring program is used to measure the external dose contribution to the public and workers from radiation sources at BNL. This is achieved by measuring direct penetrating radiation exposures at both on- and off-site locations. The direct measurements taken at the off-site locations are based on the premise that off-site exposures represent true natural background radiation (with contribu-tion from both cosmic and terrestrial sources) and represent no contribution from Labora-tory operations. On- and off-site external dose measurements are averaged and then compared
2016 SITE ENVIRONMENTAL REPORT8-3
CHAPTER 8: RADIOLOGICAL DOSE ASSESSMENT
Figure 8-1. On-Site TLD Locations.
025-TLD1
053-TLD1
074-TLD2
085-TLD1
105-TLD1
126-TLD1
122-TLD1
111-TLD1
116-TLD1
086-TLD1
085-TLD2
084-TLD1082-TLD1
080-TLD1
074-TLD1073-TLD1 066-TLD1
034-TLD1
034-TLD2043-TLD2
054-TLD1
049-TLD1
037-TLD1
030-TLD1
013-TLD1011-TLD1
025-TLD4
P2
S5
P4P7
0 0.5 10.25Kilometers
0 0.25 0.5Miles
090-TLD1
044TLDS(1-5)
027-TLD2027-TLD1
036-TLD2 036-TLD1
045TLDS(1-5)
063-TLD1
043-TLD1
108-TLD2
N
environmental sources, including cosmic and terrestrial radiation sources, was 60 ± 8 mrem (600 ± 80 µSv).
To determine the BNL contribution to the external direct radiation dose, a statistical t-test between the measured on- and off-site external dose averages was conducted. The t-test showed no significant difference beween the off-site dose (60 ± 8 mrem) and on-site dose (64 ± 8 mrem) at the 95 percent confidence level. From the mea-sured TLD doses, it can be safely concluded that there was no measurable external dose contribu-tion to on- and off-site locations from Laboratory operations in 2016. The dose to the maximally
exposed individual (MEI) on site and outside of controlled areas (in the vicinity of Building 356) was measured at 0 mrem for the first through third quarters, and 5 mrem (fourth quarter) for 2016. The total dose to the on-site MEI was 5 mrem, which is less than the dose received from two roundtrip flights from Los Angeles, Califor-nia to New York, New York.
8.1.2 Facility Area MonitoringNine on-site TLDs were designated as
facility-area monitors (FAMs) because they were posted in known radiation areas (near “facilities”). Table 8-3 shows the external doses
2016 SITE ENVIRONMENTAL REPORT 8-4
CHAPTER 8: RADIOLOGICAL DOSE ASSESSMENT
Fig
ure
8-2
. Off
-Sit
e TL
D L
oca
tio
ns.
N
!(
!(
!(
!(
!(
!(!(
!(
!(
!(
004-
TLD1
!(
!(
!(
!(
!(
800-
TLD4
!(
900-
TLD4
!( 900-
TLD5
!(
900-
TLD6
!(
999-
TLD1
N
E
S
W
12
3
4
5
6
7
810
9
11
12
13
14
1516
900-
TLD2
800-
TLD3
700-
TLD4
400-
TLD1
800-
TLD1
700-
TLD3
500-
TLD4
000-
TLD9
600-
TLD3
600-
TLD4
000-
TLD8
000-
TLD5
¥0
24
1Kilom
eters
01
23
0.5Mi
les
Figur
e 8-
2. O
ffsite
TLD
s
2016 SITE ENVIRONMENTAL REPORT8-5
CHAPTER 8: RADIOLOGICAL DOSE ASSESSMENT
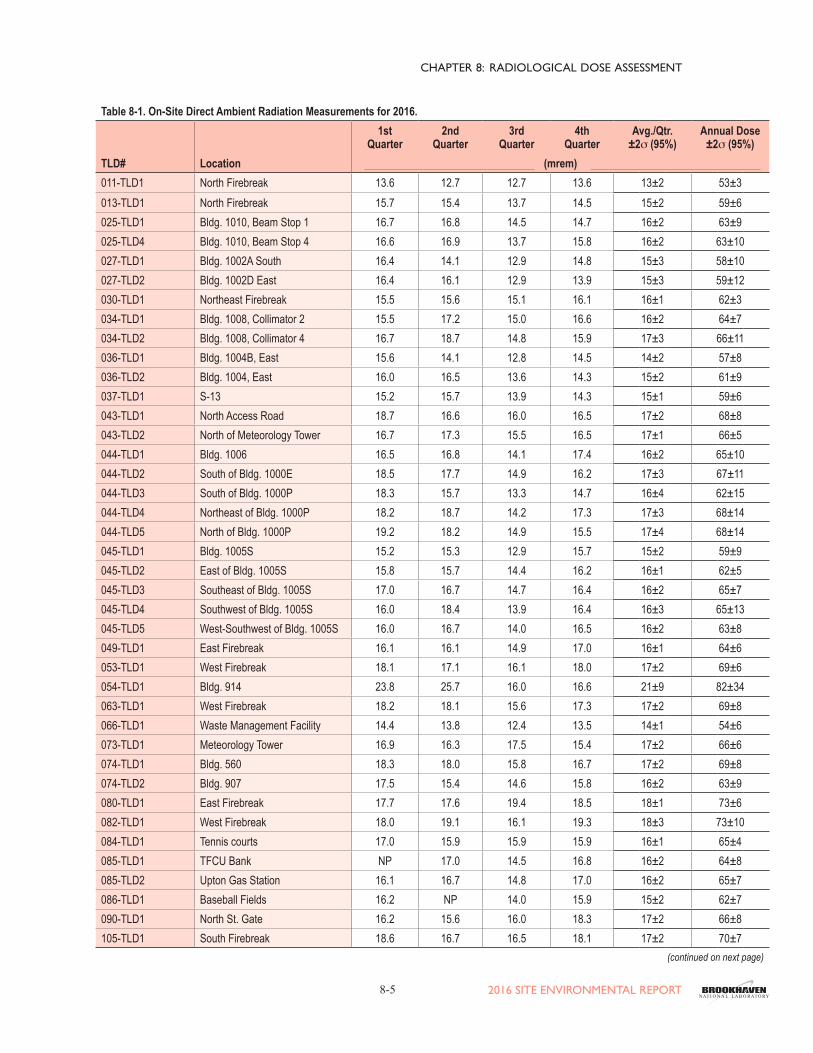
Table 8-1. On-Site Direct Ambient Radiation Measurements for 2016.
TLD# Location
1stQuarter
2ndQuarter
3rdQuarter
4thQuarter
Avg./Qtr.±2σ (95%)
Annual Dose±2σ (95%)
(mrem)011-TLD1 North Firebreak 13.6 12.7 12.7 13.6 13±2 53±3013-TLD1 North Firebreak 15.7 15.4 13.7 14.5 15±2 59±6025-TLD1 Bldg. 1010, Beam Stop 1 16.7 16.8 14.5 14.7 16±2 63±9025-TLD4 Bldg. 1010, Beam Stop 4 16.6 16.9 13.7 15.8 16±2 63±10027-TLD1 Bldg. 1002A South 16.4 14.1 12.9 14.8 15±3 58±10027-TLD2 Bldg. 1002D East 16.4 16.1 12.9 13.9 15±3 59±12030-TLD1 Northeast Firebreak 15.5 15.6 15.1 16.1 16±1 62±3034-TLD1 Bldg. 1008, Collimator 2 15.5 17.2 15.0 16.6 16±2 64±7034-TLD2 Bldg. 1008, Collimator 4 16.7 18.7 14.8 15.9 17±3 66±11036-TLD1 Bldg. 1004B, East 15.6 14.1 12.8 14.5 14±2 57±8036-TLD2 Bldg. 1004, East 16.0 16.5 13.6 14.3 15±2 61±9037-TLD1 S-13 15.2 15.7 13.9 14.3 15±1 59±6043-TLD1 North Access Road 18.7 16.6 16.0 16.5 17±2 68±8043-TLD2 North of Meteorology Tower 16.7 17.3 15.5 16.5 17±1 66±5044-TLD1 Bldg. 1006 16.5 16.8 14.1 17.4 16±2 65±10044-TLD2 South of Bldg. 1000E 18.5 17.7 14.9 16.2 17±3 67±11044-TLD3 South of Bldg. 1000P 18.3 15.7 13.3 14.7 16±4 62±15044-TLD4 Northeast of Bldg. 1000P 18.2 18.7 14.2 17.3 17±3 68±14044-TLD5 North of Bldg. 1000P 19.2 18.2 14.9 15.5 17±4 68±14045-TLD1 Bldg. 1005S 15.2 15.3 12.9 15.7 15±2 59±9045-TLD2 East of Bldg. 1005S 15.8 15.7 14.4 16.2 16±1 62±5045-TLD3 Southeast of Bldg. 1005S 17.0 16.7 14.7 16.4 16±2 65±7045-TLD4 Southwest of Bldg. 1005S 16.0 18.4 13.9 16.4 16±3 65±13045-TLD5 West-Southwest of Bldg. 1005S 16.0 16.7 14.0 16.5 16±2 63±8049-TLD1 East Firebreak 16.1 16.1 14.9 17.0 16±1 64±6053-TLD1 West Firebreak 18.1 17.1 16.1 18.0 17±2 69±6054-TLD1 Bldg. 914 23.8 25.7 16.0 16.6 21±9 82±34063-TLD1 West Firebreak 18.2 18.1 15.6 17.3 17±2 69±8066-TLD1 Waste Management Facility 14.4 13.8 12.4 13.5 14±1 54±6073-TLD1 Meteorology Tower 16.9 16.3 17.5 15.4 17±2 66±6074-TLD1 Bldg. 560 18.3 18.0 15.8 16.7 17±2 69±8074-TLD2 Bldg. 907 17.5 15.4 14.6 15.8 16±2 63±9080-TLD1 East Firebreak 17.7 17.6 19.4 18.5 18±1 73±6082-TLD1 West Firebreak 18.0 19.1 16.1 19.3 18±3 73±10084-TLD1 Tennis courts 17.0 15.9 15.9 15.9 16±1 65±4085-TLD1 TFCU Bank NP 17.0 14.5 16.8 16±2 64±8085-TLD2 Upton Gas Station 16.1 16.7 14.8 17.0 16±2 65±7086-TLD1 Baseball Fields 16.2 NP 14.0 15.9 15±2 62±7090-TLD1 North St. Gate 16.2 15.6 16.0 18.3 17±2 66±8105-TLD1 South Firebreak 18.6 16.7 16.5 18.1 17±2 70±7
(continued on next page)

2016 SITE ENVIRONMENTAL REPORT 8-6
CHAPTER 8: RADIOLOGICAL DOSE ASSESSMENT
Table 8-1. On-Site Direct Ambient Radiation Measurements for 2016.
TLD# Location
1stQuarter
2ndQuarter
3rdQuarter
4thQuarter
Avg./Qtr.±2σ (95%)
Annual Dose±2σ (95%)
(mrem)108-TLD1 Water Tower 15.7 16.8 15.7 17.2 16±1 65±5108-TLD2 Tritium Pole 20.3 19.8 19.0 19.6 20±1 79±4111-TLD1 Trailer Park 16.6 16.6 16.3 16.8 17±0 66±1122-TLD1 South Firebreak 15.8 15.1 14.8 18.9 16±3 65±13126-TLD1 South Gate 18.5 18.5 17.3 17.8 18±1 72±4P2 14.8 13.9 12.8 15.3 14±2 57±8P4 15.7 15.4 14.5 16.2 15±1 62±5P7 15.7 16.8 14.0 16.9 16±2 63±9S5 14.9 15.2 14.5 15.4 15±1 60±3On-Site Average 16.8 16.7 14.9 16.3 16±2 64±8
Std. Dev. (2s) 3.4 3.9 3.0 2.8 17 ± 3
075-TLD4: Control TLD Average 6.8 6.5 7.4 6.7 6.9±0.7 27±3Notes : See Figure 8-1 for TLD locations. L = TLD lost NP = TLD not posted TLD = thermoluninescent dosimeter
(concluded).
measured with the FAM-TLDs. Environmental TLDs 088-TLD1 through 088-TLD4 are posted at the S-6 blockhouse location and near S6 on the fence of the Former Hazardous Waste Man-agement Facility (FHWMF). The TLDs mea-sured external doses that were slightly elevated compared to the normal natural background radiation doses measured in other areas on site. This can be attributed to the presence of small amounts of contamination in soil. All TLD readings in this area were within 8 percent of each other, with 088-TLD1 being the highest. A comparison of the current ambient dose rates to doses from previous years shows that the dose rates have significantly declined since the re-moval of contaminated soil within the FHWMF. As shown in Table 8-3, the 2016 dose is just slightly above natural background levels. The FHWMF is fenced, so access to it is controlled. Two TLDs (075-TLD3 and 075-TLD5) near Building 356 showed slightly higher quarterly averages of 20 ± 2 mrem (200 ± 20 µSv) and 20±3 mrem (200±30 µSv), respectively, which are just above the normal ambient background radiation. The yearly doses were measured at 80 ± 9 mrem (800 ± 90 µSv) for 075-TLD3 and
79 ± 14 mrem (790 ± 140 µSv) for 075-TLD5. The direct doses are higher than the on-site an-nual average because Building 356 houses a Cobalt-60 (Co-60) source, which is used to ir-radiate materials, parts, and electronic circuit boards. The slightly elevated dose from Build-ing 356 measured on 075-TLD3 is attributed to the “sky-shine” phenomenon. This building also contains several Californium-252 (Cf-252) neutron sources in a cask near the corner of the building where 075-TLD5 is located. Although it is conceivable that individuals who use the parking lot adjacent to Building 356 could re-ceive a dose from these sources, the dose would be small due to the low occupancy factor.
Two FAM-TLDs placed on fence sections northeast and northwest of Building 913B (the AGS tunnel access) showed slightly elevated above-average ambient external dose. The first-quarter dose at these sites was measured at 30.1 mrem for 054-TLD2 and 21.9 mrem for 054-TLD3 (compared to the site-wide first-quarter dose of 16.8 ± 3.4 and off-site dose of 14.8 ± 3.3 mrem). The second-quarter dose at these sites was measured at 24.8 mrem for 054-TLD2 and 24.5 mrem for 054-TLD3 (compared to the

2016 SITE ENVIRONMENTAL REPORT8-7
CHAPTER 8: RADIOLOGICAL DOSE ASSESSMENT
Table 8-2. Off-Site Direct Radiation Measurements for 2016.
TLD# Location
1stQuarter
2nd Quarter
3rd Quarter
4th Quarter
Avg./Qtr.± 2 σ (95%)
Annual Dose± 2 σ (95%)
(mrem) 000-TLD5 Longwood Estate 13.9 13.6 13.2 14.3 14±1 55±3000-TLD8 Private property 9.4 NP NP 16.8 13±7 52±30000-TLD9 Private property 14.1 16.3 13.0 16.3 15±3 60±11000-TLD10 Private Property** 14.8 16.5 NP 16.3 16±2 63±6400-TLD1 Calverton National Cemetery 18.2 17.1 16.6 17.2 17±1 69±5500-TLD4 Private property 15.5 15.8 14.2 17.3 16±2 63±9600-TLD3 Private property 15.0 17.9 13.8 17.7 16±4 64±14600-TLD4 Maples B&G 14.8 14.8 14.2 15.0 15±1 59±2700-TLD3 Private property 14.2 15.1 13.4 15.6 15±2 58±7700-TLD4 Private property 14.7 15.3 14.2 15.9 15±1 60±5800-TLD1 Private property 16.0 15.8 14.5 15.5 15±1 62±5800-TLD3 Suffolk County Correctional
Department16.0 16.1 15.4 16.0 16±1 64±2
800-TLD4 Long Island National Wildlife Refuge 16.0 NP 15.0 16.7 16±1 64±6900-TLD2 Private property 14.1 14.2 NP NP 14±0 57±0900-TLD4 Private property 14.1 NP 13.5 17.2 15±3 60±13900-TLD5 Private property 15.3 12.8 13.5 14.1 14±2 56±7900-TLD6 Private property 14.1 13.3 11.8 15.2 14±2 54±10999-TLD1 Private property 15.4 16.1 13.3 16.4 15±2 61±10Off-site average 14.8 15.4 14.0 16.1 15±2 60±8Std. Dev. (2s) 3.3 2.8 2.2 2.0075-TLD4 : Control TLD Average 6.8 6.5 7.4 6.7 6.9±0.7 27±3Notes: See Figure 8-2 for TLD locations. NP = TLD not posted TLD = thermoluscient dosimeter
Table 8-3. Facility Monitoring Area for 2016.
TLD# Location
1stQuarter
2ndQuarter
3rdQuarter
4thQuarter
Average± 2σ (95%)
Annual Dose± 2σ (95%)
(mrem)054-TLD2 NE of Bldg. 913B 30.1 24.8 15.6 18.7 22±11 89±45054-TLD3 NW of Bldg. 913B 21.9 24.5 14.7 16.2 19±8 77±32S6 17.8 17.4 18.1 18.1 18±1 71±2088-TLD1 FWMF, 50' East of S6 19.9 20.1 19.7 19.3 20±1 79±2088-TLD2 FWMF, 50' West of S6 18.5 18.9 17.8 17.3 18±1 73±5088-TLD3 FWMF, 100' West of S6 18.5 19.3 18.3 19.9 19±1 76±5088-TLD4 FWMF, 150' West of S6 17.4 16.9 15.4 16.0 16±2 66±6075-TLD3 Building 356 19.2 19.2 19.4 21.9 20±2 80±9075-TLD5 North Corner of Bldg. 356 20.7 16.8 20.8 20.9 20±3 79±14Notes:See Figure 8-1 for TLD locations. FHWMF = Former Hazardous Waste Management Facility
2016 SITE ENVIRONMENTAL REPORT 8-8
CHAPTER 8: RADIOLOGICAL DOSE ASSESSMENT
site-wide second quarter dose of 16.7± 3.9 mrem and off-site dose of 15.4 ± 2.8 mrem). During the third quarter, both TLDs showed dose compara-ble to natural background radiation. In the fourth quarter, the 054-TLD2 site showed an elevated dose of 18.7 mrem, while the other was closer to background. The slightly higher levels of the first and second quarters are expected because the op-erating period for the AGS is typically in the first half of the calendar year.
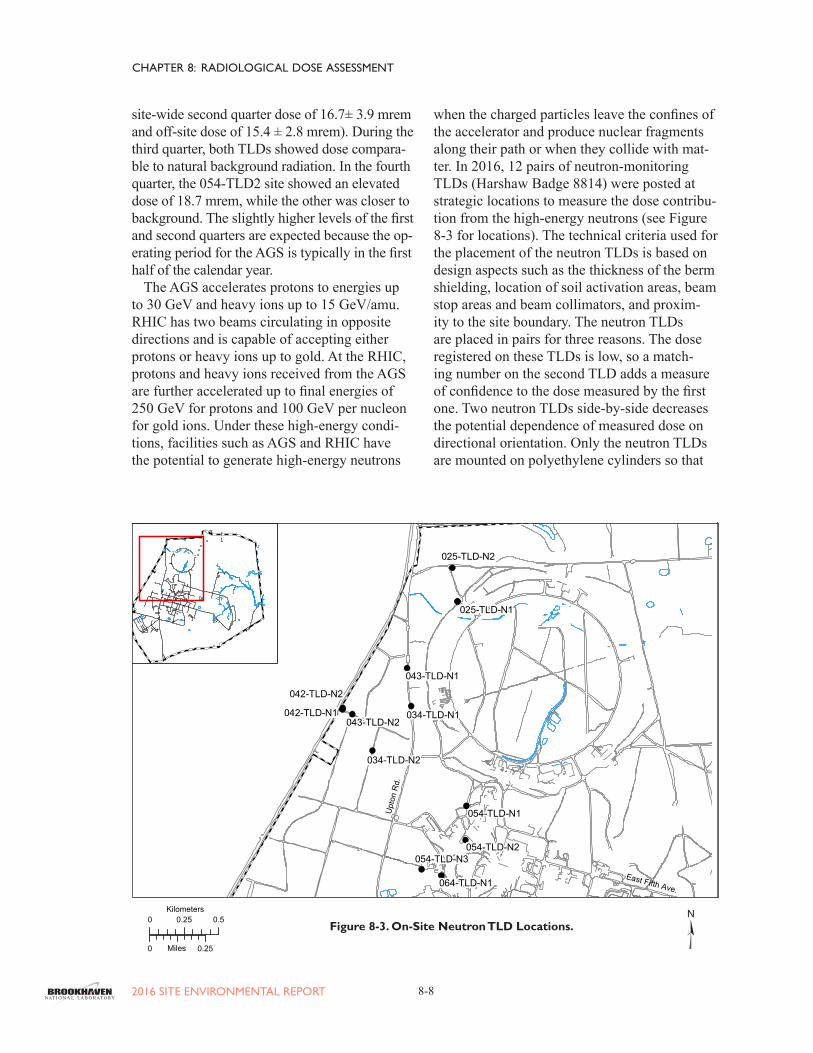
The AGS accelerates protons to energies up to 30 GeV and heavy ions up to 15 GeV/amu. RHIC has two beams circulating in opposite directions and is capable of accepting either protons or heavy ions up to gold. At the RHIC, protons and heavy ions received from the AGS are further accelerated up to final energies of 250 GeV for protons and 100 GeV per nucleon for gold ions. Under these high-energy condi-tions, facilities such as AGS and RHIC have the potential to generate high-energy neutrons
when the charged particles leave the confines of the accelerator and produce nuclear fragments along their path or when they collide with mat-ter. In 2016, 12 pairs of neutron-monitoring TLDs (Harshaw Badge 8814) were posted at strategic locations to measure the dose contribu-tion from the high-energy neutrons (see Figure 8-3 for locations). The technical criteria used for the placement of the neutron TLDs is based on design aspects such as the thickness of the berm shielding, location of soil activation areas, beam stop areas and beam collimators, and proxim-ity to the site boundary. The neutron TLDs are placed in pairs for three reasons. The dose registered on these TLDs is low, so a match-ing number on the second TLD adds a measure of confidence to the dose measured by the first one. Two neutron TLDs side-by-side decreases the potential dependence of measured dose on directional orientation. Only the neutron TLDs are mounted on polyethylene cylinders so that
East Fifth Ave.
Upto
n Rd
.
Brookhaven Ave.
064-TLD-N1
054-TLD-N1
054-TLD-N2054-TLD-N3
052-TLD-N1
044-TLD-N1
043-TLD-N2 043-TLD-N1
034-TLD-N1
034-TLD-N2
025-TLD-N1RHIC
LINAC
AGS
025-TLD-N2
Kilometers0 0.25 0.5
0 0.25Miles
Figure 8-3. On-Site Neutron TLD Locations.N
East Fifth Ave.
Upt
on R
d.
025-TLD-N2
025-TLD-N1
034-TLD-N1
034-TLD-N2
043-TLD-N1
043-TLD-N2042-TLD-N1
042-TLD-N2
054-TLD-N1
054-TLD-N2054-TLD-N3
064-TLD-N1
¥0 0.25 0.5 Kilometers
0 0.25 Miles
Figure 8-3 Neutron TLD Area Monitors

2016 SITE ENVIRONMENTAL REPORT8-9
CHAPTER 8: RADIOLOGICAL DOSE ASSESSMENT
incident neutrons, which are at a high enough energy to pass through the TLD undetected, are thermalized by the hydrocarbons in the polyeth-ylene. This allows the incident neutrons to be counted when reflected back out.
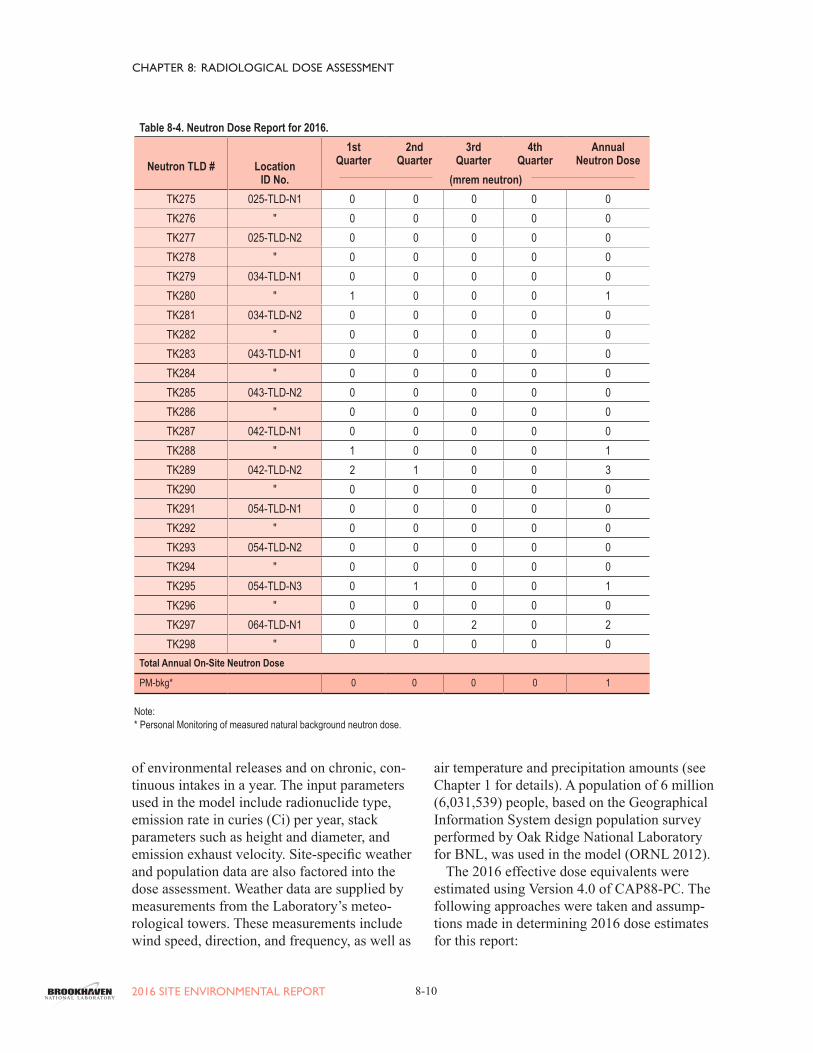
In the first quarter of 2016, passive monitors for neutron dose showed 1 mrem neutron dose at 034-TLD-N1, 1 mrem at 042-TLD-N1, and 2 mrem at 042-TLD-N2. In the second quarter, neutron TLDs at 042-TLD-N2 and 054-TLD-N3 showed neutron doses of 1 mrem. In the third quarter, a TLD at 064-TLD-N1 showed 2 mrem. Finally, no neutron dose was recorded in the fourth quarter at any neutron TLD loca-tion. See Table 8-4 for the neutron dose data. The RHIC/BLIP runs at slightly higher current and energy during the beginning of the third quarter for approximately one month, but is turned off for the remainder of the third quarter. In the fourth quarter, the RHIC/BLIP runs for a two-week period at the end of the calendar year at low, startup-testing levels. These low-level neutron doses indicate that engineering controls (i.e. berm shielding) in place at AGS and RHIC are effective.
8.2 DOSE MODELING
The EPA regulates radiological emissions from DOE facilities under the requirements set forth in 40 CFR 61, Sub-part H, entitled, “Na-tional Emission Standards for Hazardous Air Pollutants (NESHAPs).” This regulation speci-fies the compliance and monitoring require-ments for reporting radiation doses received by members of the public from airborne radionu-clides. The regulation mandates that no member of the public shall receive a dose greater than 10 mrem (100 µSv) in a year from airborne emis-sions. The emission monitoring requirements are set forth in Subpart H, Section 61.93(b), and include the use of a reference method for continuous monitoring at major release points (defined as those with a potential to exceed 1 percent of the 10 mrem standard) and a periodic confirmatory measurement for all other release points. The regulations also require DOE facili-ties to submit an annual NESHAPs report to EPA that describes the major and minor emis-sion sources and dose to the MEOSI. The dose
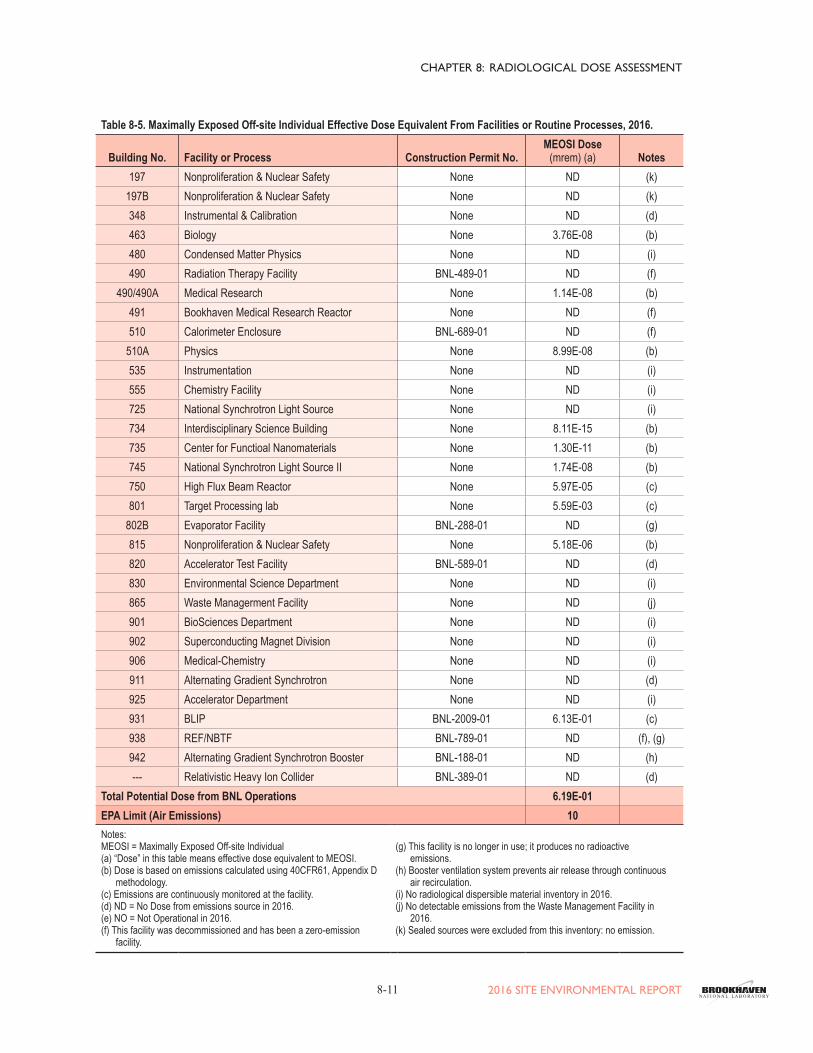
estimates from various facilities are given in Table 8-5, and the actual air emissions for 2016 are discussed in detail in Chapter 4.
As a part of the NESHAPs review process at BNL, any emission source, such as a stack, that has the potential to release airborne radioactive materials is evaluated for regulatory compli-ance. Under the Comprehensive Environmental Response, Compensation and Liability Act (CERCLA), certain restoration activities are also monitored and assessed for any potential to release airborne radioactive materials, and to determine their dose contribution, if any, to the environment. Any new radiological processes or activities are also evaluated for compliance with NESHAPs regulations using the EPA’s approved dose modeling software (see Sec-tion 8.2.1 for details). Because this model is designed to treat radioactive emission sources as continuous over the course of a year, it is not well-suited for estimating short-term or acute releases. Consequently, it overestimates poten-tial dose contributions from short-term projects and area sources. For that reason, modeling re-sults are considered to be conservative.
8.2.1 Dose Modeling ProgramCompliance with NESHAPs regulations is
demonstrated through the use of EPA dose-modeling software and the Clean Air Act As-sessment Package 1988 (CAP88-PC). This computer program uses a Gaussian plume model to estimate the average dispersion of radionuclides released from elevated stacks or diffuse sources. It calculates a final value of the projected dose at the specified distance from the release point by computing dispersed radionu-clide concentrations in the air, the rate of depo-sition on ground surfaces, and the intake via the food pathway (where applicable). CAP88-PC calculates both the EDE to the MEOSI and the collective population dose within a 50-mile radius of the emission source. In most cases, the CAP88-PC model provides conservative doses. For the purpose of modeling the dose to the MEOSI, all emission points are colocated at the BLIP Facility, which is used to represent the developed portion of the site. The dose cal-culations are based on very low concentrations
2016 SITE ENVIRONMENTAL REPORT 8-10
CHAPTER 8: RADIOLOGICAL DOSE ASSESSMENT
of environmental releases and on chronic, con-tinuous intakes in a year. The input parameters used in the model include radionuclide type, emission rate in curies (Ci) per year, stack parameters such as height and diameter, and emission exhaust velocity. Site-specific weather and population data are also factored into the dose assessment. Weather data are supplied by measurements from the Laboratory’s meteo-rological towers. These measurements include wind speed, direction, and frequency, as well as
air temperature and precipitation amounts (see Chapter 1 for details). A population of 6 million (6,031,539) people, based on the Geographical Information System design population survey performed by Oak Ridge National Laboratory for BNL, was used in the model (ORNL 2012).
The 2016 effective dose equivalents were estimated using Version 4.0 of CAP88-PC. The following approaches were taken and assump-tions made in determining 2016 dose estimates for this report:
Table 8-4. Neutron Dose Report for 2016.
Neutron TLD # Location ID No.
1stQuarter
2ndQuarter
3rdQuarter
4thQuarter
Annual Neutron Dose
(mrem neutron)TK275 025-TLD-N1 0 0 0 0 0TK276 " 0 0 0 0 0TK277 025-TLD-N2 0 0 0 0 0TK278 " 0 0 0 0 0TK279 034-TLD-N1 0 0 0 0 0TK280 " 1 0 0 0 1TK281 034-TLD-N2 0 0 0 0 0TK282 " 0 0 0 0 0TK283 043-TLD-N1 0 0 0 0 0TK284 " 0 0 0 0 0TK285 043-TLD-N2 0 0 0 0 0TK286 " 0 0 0 0 0TK287 042-TLD-N1 0 0 0 0 0TK288 " 1 0 0 0 1TK289 042-TLD-N2 2 1 0 0 3TK290 " 0 0 0 0 0TK291 054-TLD-N1 0 0 0 0 0TK292 " 0 0 0 0 0TK293 054-TLD-N2 0 0 0 0 0TK294 " 0 0 0 0 0TK295 054-TLD-N3 0 1 0 0 1TK296 " 0 0 0 0 0TK297 064-TLD-N1 0 0 2 0 2TK298 " 0 0 0 0 0
Total Annual On-Site Neutron Dose
PM-bkg* 0 0 0 0 1
Note: * Personal Monitoring of measured natural background neutron dose.
2016 SITE ENVIRONMENTAL REPORT8-11
CHAPTER 8: RADIOLOGICAL DOSE ASSESSMENT
Table 8-5. Maximally Exposed Off-site Individual Effective Dose Equivalent From Facilities or Routine Processes, 2016.
Building No. Facility or Process Construction Permit No.MEOSI Dose
(mrem) (a) Notes197 Nonproliferation & Nuclear Safety None ND (k)
197B Nonproliferation & Nuclear Safety None ND (k)348 Instrumental & Calibration None ND (d)463 Biology None 3.76E-08 (b)480 Condensed Matter Physics None ND (i)490 Radiation Therapy Facility BNL-489-01 ND (f)
490/490A Medical Research None 1.14E-08 (b)491 Bookhaven Medical Research Reactor None ND (f)510 Calorimeter Enclosure BNL-689-01 ND (f)
510A Physics None 8.99E-08 (b)535 Instrumentation None ND (i)555 Chemistry Facility None ND (i)725 National Synchrotron Light Source None ND (i)734 Interdisciplinary Science Building None 8.11E-15 (b)735 Center for Functioal Nanomaterials None 1.30E-11 (b)745 National Synchrotron Light Source II None 1.74E-08 (b)750 High Flux Beam Reactor None 5.97E-05 (c)801 Target Processing lab None 5.59E-03 (c)
802B Evaporator Facility BNL-288-01 ND (g)815 Nonproliferation & Nuclear Safety None 5.18E-06 (b)820 Accelerator Test Facility BNL-589-01 ND (d)830 Environmental Science Department None ND (i)865 Waste Managerment Facility None ND (j)901 BioSciences Department None ND (i)902 Superconducting Magnet Division None ND (i)906 Medical-Chemistry None ND (i)911 Alternating Gradient Synchrotron None ND (d)925 Accelerator Department None ND (i)931 BLIP BNL-2009-01 6.13E-01 (c)938 REF/NBTF BNL-789-01 ND (f), (g)942 Alternating Gradient Synchrotron Booster BNL-188-01 ND (h)--- Relativistic Heavy Ion Collider BNL-389-01 ND (d)
Total Potential Dose from BNL Operations 6.19E-01EPA Limit (Air Emissions) 10Notes: MEOSI = Maximally Exposed Off-site Individual (a) “Dose” in this table means effective dose equivalent to MEOSI.(b) Dose is based on emissions calculated using 40CFR61, Appendix D
methodology. (c) Emissions are continuously monitored at the facility. (d) ND = No Dose from emissions source in 2016. (e) NO = Not Operational in 2016. (f) This facility was decommissioned and has been a zero-emission
facility.
(g) This facility is no longer in use; it produces no radioactive
emissions. (h) Booster ventilation system prevents air release through continuous
air recirculation. (i) No radiological dispersible material inventory in 2016. (j) No detectable emissions from the Waste Management Facility in
2016. (k) Sealed sources were excluded from this inventory: no emission.
2016 SITE ENVIRONMENTAL REPORT 8-12
CHAPTER 8: RADIOLOGICAL DOSE ASSESSMENT
§ A conservative approach is used for agri-cultural data input into the CAP88 modeling program, in that 92 percent of vegetables, 100 percent of milk, and 99 percent of meat is considered to be from the assessment area.
§ The velocity of the exhaust from the BLIP facility stack was updated to reflect current operation. The average volumetric flow rate of the BLIP exhaust system in 2016 was 515 cfm, or 0.243 m3/sec. With an exit diameter of 0.1 m, the exit velocity was 30.95 m/sec, down slightly from last year’s 31.06 m/sec.
§ The method of characterizing atmospheric sta-bility for purposes of estimating effluent dis-persion was changed to the Solar Radiation/Delta Temperature method from the Sigma Theta method for increased conservatism.
§ Based on recent reviews, the programming for the STAR file used for development of the 2016 wind file was updated by the Envi-ronmental and Climate Sciences Department.
8.2.2 Dose Calculation Methods and Pathways8.2.2.1 Maximally Exposed Off-site and On-site Individual
The MEOSI is defined as a person who re-sides at a residence, office, or school beyond the BNL site boundary such that no other member of the public could receive a higher dose than the MEOSI. This person is assumed to reside 24 hours a day, 365 days a year, off-site, and close to the nearest emission point of the BNL site bound-ary. This person is also assumed to consume significant amounts of fish and deer containing radioactivity assumed to be attributable to Labo-ratory operations, based on projections from the New York State Department of Health (NYS-DOH). In reality, it is highly unlikely that such a combination of “maximized dose” to any single individual would occur, but the concept is useful for evaluating maximum potential dose and risk to members of the public. The dose to the on-site maximally exposed individual who could receive any dose outside of BNL’s controlled areas was also determined, by TLD measurements.
8.2.2.2 Effective Dose EquivalentThe EDE to the MEOSI from low levels
of radioactive materials dispersed into the
environment was calculated using the CAP88-PC dose modeling program, Version 4.0. Site meteorology data were used to calculate an-nual emission dispersions for the midpoint of a given wind sector and distance. Facility-specific radionuclide emission rates (Ci/yr) were used for continuously monitored facilities. For small sources, the emissions were calculated using the method set forth in 40 CFR 61, Appendix D. The Gaussian dispersion model calculated the EDE at the site boundary and the collective pop-ulation dose values from the immersion, inhala-tion, and ingestion pathways. As stated above, these dose and risk calculations to the MEOSI are based on low emissions and chronic intakes.
8.2.2.3 Dose Calculation: Fish IngestionTo calculate the EDE from the fish consump-
tion pathway, the intake is estimated. The term “Intake” is defined as the average amount of fish consumed by a person engaged in recreational fishing on the Peconic River. Based on a NYS-DOH study, the consumption rate is estimated at 15 pounds (7 kg) per year (NYSDOH 1996). For each radionuclide of concern for fish sam-ples, the dry weight activity concentration was converted to picoCuries per gram (pCi/g) “wet weight,” since wet weight is the form in which fish are caught and consumed. A dose conver-sion factor was used for each radionuclide to convert the activity concentration into the EDE. For example, the committed dose equivalent conversion factor for Cesium-137 (Cs-137) is 5.0E-02 rem/µCi, as set forth in DOE/EH-0071. The dose was calculated as: dose in (rem/yr) = intake (kg/yr) × activity in flesh (µCi/kg) × dose conversion factor (rem/µCi).
8.2.2.4 Dose Calculation: Deer Meat Ingestion The dose calculation for the deer meat ingestion
pathway is similar to that for fish consumption. The same Cs-137 radionuclide dose conversion factor was used to estimate dose, based on the U.S. Environmental Protection Agency Exposure Factors Handbook (EPA 1996). No other radionu-clides associated with Laboratory operations have been detected in deer meat. The total quantity of deer meat ingested during the course of a year was estimated at 64 pounds (29 kg) (NYSDOH 1999).
2016 SITE ENVIRONMENTAL REPORT8-13
CHAPTER 8: RADIOLOGICAL DOSE ASSESSMENT
8.3 SOURCES: DIFFUSE, FUGITIVE, “OTHER”
Diffuse sources, also known as nonpoint or area sources, are described as sources of radio-active contaminants which diffuse into the at-mosphere but do not have well-defined emission points. Fugitive sources include leaks through window and door frames, as well as unintended releases to the air through vents or stacks which are supposedly inactive (i.e., leaks from vents are fugitive sources). As part of the NESHAPs review process, in addition to stack emissions, any fugitive or diffuse emission source that could potentially emit radioactive materials to the environment is evaluated. Although CER-CLA-prompted actions, such as remediation projects, are exempt from procedural require-ments to obtain federal, state, or local permits, any BNL activity or process with the potential to emit radioactive material must be evaluated and assessed for potential dose impact to mem-bers of the public. No NESHAPs reviews were requested or performed in 2016.
8.3.1 Remediation WorkIn 2016, no remediation work requiring NES-
HAPs evaluation or monitoring was undertaken.
8.4 DOSE FROM POINT SOURCES 8.4.1 Brookhaven LINAC Isotope Producer
Source term descriptions for point sources are given in Chapter 4. The BLIP facility is the only emission source with the potential to con-tribute dose to members of the public greater than 1 percent of the EPA limit (0.1 mrem or 1.0 µSv). The BLIP facility is considered a major emission source in accordance with the ANSI N13.1-1999 standard’s graded approach; that is, a Potential Impact Category (PIC) of II. The gaseous emissions are directly and continuously measured in real time with an inline, low-reso-lution, sodium iodide (NaI) gamma spectrom-eter. The spectrometer system is connected to a computer workstation that is used to display and continuously record emission levels. The par-ticulate emissions are sampled for gross alpha and gross beta activity weekly using a conven-tional fiberglass filter, which is analyzed at an off-site contract analytical laboratory. Likewise, exhaust samples for tritium are also collected
continuously using a silica gel adsorbent and are then analyzed at an off-site contract analytical laboratory on a biweekly basis.
In 2016, the BLIP facility operated over a pe-riod of 30.4 weeks. During the year, 3,475 Ci of C-11 (half life: 20.4 minutes) and 6,950 Ci of O-15 (half life: 122 seconds) were released from the BLIP facility. A small quantity (4.46E-01 Ci) of tritiated water vapor from activation of the tar-gets’ cooling water was also released. The EDE to the MEOSI was calculated to be 6.13-01 mrem (6.1 µSv) in a year from BLIP operations.
8.4.2 Target Processing LaboratoryIn 2016, there were no detectable levels of
emissions from the Target Processing Laboratory.
8.4.3 High Flux Beam ReactorIn 2016, the residual tritium emissions from
the HFBR Facility were measured at 0.245 Ci, and the estimated dose attributed was 5.97E-5 mrem (0.60 nSv) in a year.
8.4.4 Brookhaven Medical Research ReactorIn 2016, the Brookhaven Medical Research
Reactor (BMRR) facility remained in a cold-shutdown mode as a radiological facility with institutional controls in place. There was no dose contribution from the BMRR in 2016.
8.4.5 Brookhaven Graphite Research ReactorIn 2016, long-term surveillance of the BGRR
continued, as well as the maintenance and peri-odic refurbishment of structures, systems, and components. This status will continue through-out the period of radioactive decay. There were no radionuclides released to the environment from the complex in 2016.
8.4.6 Waste Management FacilityIn 2016, there were no detectable levels of
emissions from the Waste Management Facility.
8.4.7 Unplanned ReleasesIn 2016, there were no unplanned releases.
8.5 DOSE FROM INGESTION
Radionuclides in the environment may bio-accumulate in deer and fish tissue, bones, and

2016 SITE ENVIRONMENTAL REPORT 8-14
CHAPTER 8: RADIOLOGICAL DOSE ASSESSMENT
organs; consequently, samples from deer and fish are analyzed to evaluate the contribution of dose to humans from the ingestion pathway. As discussed in Chapter 6, deer meat samples collected on- and off-site but near the BNL boundary were used to assess the potential dose impact to the MEOSI. The maximum tissue concentration in the deer meat (flesh) collected for sampling was used to calculate the potential dose to the MEOSI. Potassium-40 (K-40) and Cs-137 were detected in the tissue samples. K-40 is a naturally-occurring radionuclide and is not related to BNL operations.
In 2016, BNL collected samples from ten animals and analyzed for K-40 and Cs-137. It should be noted that since the site boundaries are not fenced, deer are able to travel short dis-tances back and forth across the site boundary. The average K-40 concentrations in deer tissue samples (off site < 1 mile) were 2.97 ± 0.37 pCi/g (wet weight) in the flesh and 2.92 ± 0.41 pCi/g (wet weight) in the liver. The maximum Cs-137 concentration was 1.69 ± 0.06 pCi/g (wet weight) in the flesh on site (see Table 6-2). The average Cs-137 concentration from all deer samples was 0.29 ± 0.08 pCi/g. However, the maximum Cs-137 concentration of 1.69 pCi/g from a deer sample collected on site was used for the purpose of MEOSI dose calculations. Therefore, the maximum estimated dose to hu-mans from consuming deer meat containing the maximum Cs-137 concentration was estimated to be 2.45 mrem (24.5 µSv) in a year. This dose is below the health advisory limit of 10 mrem (100 µSv) established by NYSDOH.
In collaboration with the New York State
Department of Environmental Conservation (NYSDEC) Fisheries Division, the Laboratory maintains an ongoing program of collecting and analyzing fish from the Peconic River and sur-rounding freshwater bodies. In 2016, the Peconic River was dry for a large majority of the year, so there were no samples of fish to analyze for radio-activity. Therefore, as a representative estimate of dose due to fish consumption from local freshwa-ter bodies for 2016, the previous year’s measured concentration of Cs-137 at 0.25 ± 0.06 pCi/g was used to estimate the EDE to the MEOSI. Ac-cordingly, the potential dose from consuming 15 pounds of such fish annually was estimated at 8.75E-2 mrem (0.88 µSv)—well below the NYS-DOH health advisory limit of 10 mrem.
8.6 DOSE TO AQUATIC AND TERRESTRIAL BIOTA
DOE-STD-1153-2002, A Graded Approach for Evaluating Radiation Doses to Aquatic and Terrestrial Biota, provides the guidelines for screening methods to estimate radiological doses to aquatic animals and terrestrial plants and ani-mals, using site-specific environmental surveil-lance data. The RESRAD-BIOTA 1.8, biota dose level 2, computer program was used to evaluate compliance with the requirements for protection of biota specified in DOE Order 458.1, Radiation Protection of the Public and the Environment.
In 2016, the terrestrial animal and plant doses were evaluated based on 0.88 pCi/g of Cs-137 (see Table 6-3) found in surface soils from the berms around the Sewage Treatment Plant (STP) sand filter beds and a strontium-90 (Sr-90) concentration of 0.47 pCi/L in the surface
Table 8-6. BNL Site Dose Summary, 2016.
PathwayDose to MaximallyExposed Individual
Percent of DOE100 mrem/year Limit
EstimatedPopulation Dose per year
Inhalation Air 0.619 mrem <1% 0.937 Person-remIngestion Drinking Water None None None Fish1 0.088 mrem <1% Not Tracked Deer 2.45 mrem <3% Not TrackedAll Pathways 3.16 mrerm <4% 0.937 Person-rem

2016 SITE ENVIRONMENTAL REPORT8-15
CHAPTER 8: RADIOLOGICAL DOSE ASSESSMENT
waters collected at the Station HQ location in 2015. No on-site Peconic River surface water samples were collected in 2016 due to drought conditions. Therefore, the 2015 Sr-90 value was used to calculate the terrestrial animal and plant doses. The dose to terrestrial animals was cal-culated to be 42.4 µGy/day, and to plants, 3.98 µGy/day. The dose to terrestrial animals was well below the biota dose limit of 1 mGy/day, and the plant dose was below the limit of 10 mGy/day for terrestrial plants.
In order to calculate the dose to aquatic and riparian animals, a similar conservative approach was taken due to drought conditions throughout the year. A Sr-90 radionuclide concentration value for surface water collected in 2015 from the eastern site boundary at Station HQ was used and an estimated Cs-137 concentration was used from a sediment sample that was col-lected in the Peconic River near the PR-WC-06 location. The estimated Cs-137 concentration in sediment at PR-WC-06 was 3.63 pCi/g, and the Sr-90 concentration in surface water at HQ was 0.47 pCi/L. The 2015 Cs-137 concentration was decay-corrected for one year’s decay. Thus, the calculated dose to aquatic animals was 0.82 µGy/day and the dose to riparian animals was 2.85 µGy/day. Therefore, the dose to aquatic animals was well below the limit of 10 mGy/day. Finally, the dose to riparian animals was also well below the 1 mGy/day limit specified by the regulations.
8.7 CUMULATIVE DOSE
Table 8-6 summarizes the potential cumulative dose from the BNL site in 2016. The total dose to the MEOSI from air and ingestion pathways was estimated to be 3.16 mrem (32 µSv). In compari-son, the EPA regulatory limit for the air pathway is 10 mrem (0.10 mSv) and the DOE limit from all pathways is 100 mrem (1 mSv). The cumu-lative population dose was 0.937 person-rem (9.37E-3 person-Sv) in the year. The effective dose is well below the DOE and EPA regula-tory limits, and the ambient TLD dose is within normal background levels seen at the Laboratory site. The potential dose from drinking water was not estimated, because most residents adjacent to the BNL site get their drinking water from the Suffolk County Water Authority rather than
private wells. To put the potential dose impact into perspective, a comparison was made with estimated doses from other sources of radiation. The annual dose from all natural background sources and radon is approximately 311 mrem (3.11 mSv). A mammogram gives a dose of ap-proximately 250 mrem (2.5 mSv) and a dental x-ray gives a dose of approximately 160 mrem (1.6 mSv) to an individual. Therefore, a dose of 3.16 mrem from all environmental pathways is a minute fraction of the dose from that of several routine diagnostic procedures as well as natural background radiation.
REFERENCES AND BIBLIOGRAPHY
40 CFR 61, Subpart H. National Emissions Standard for Hazardous Air Pollutants. U.S. Environmental Protection Agency, Washington, DC. 1989.
ANSI/HPS. 1999. Sampling and Monitoring Releases of Airborne Radioactive Substances from the Stacks and Ducts of Nuclear Facilities. N13.1-1999.
DOE. 2002. A Graded Approach for Evaluation of Radiation Doses to Aquatic and Terrestrial Biota. DOE-STD-1153-2002. U.S. Department of Energy, Washington, DC. July 2002.
DOE Order 458.1. 2011 Radiation Protection of the Public and the Environment. U.S. Department of Energy, Washington, DC. February 11, 2011.
DOE Order 436.1. 2011. Departmental Sustainability. U.S. Department of Energy, Washington, DC. May 2, 2011.
DOE/EH-0071. Internal Dose Conversion Factors for Calculations of Dose to the Public. July 1988.
EPA. 2007. User’s Guide for CAP88-PC, Version 3.0. EPA 402B92001. U.S. Environmental Protection Agency, Washington, DC.
EPA. 1996. Food Ingestion Factors, Exposure Factors Handbook-Volume II. EPA600P95002FB. U.S. Environmental Protection Agency, Washington, DC.
ORNL. 2012. Geographical Information System Population Survey of Long Island by Oak Ridge National Laboratory.
NCRP. 2006. Ionizing Radiation Exposure of the Population of the United States. NCRP Report No. 160. National Council on Radiation Protection and Measurements, Bethesda, MD.
NYSDOH. 1993. Environmental Radiation in New York State. Bureau of Environmental Radiation Protection, New York State Department of Health, Albany, NY.
NYSDOH. 1996. Radioactive Contamination in the Peconic River. Bureau of Environmental Radiation Protection, New York State Department of Health, Albany, NY.
NYSDOH. 1999. Deer Meat Contaminated With Cs-137 at Brookhaven National Laboratory. Bureau of Environmental Radiation Protection. New York State Department of Health, Albany, NY.