r-1512 - evaluation of grout-filled mechanical splices for ... · pdf fileevaluation of...
TRANSCRIPT

Technical Report Documentation Page
1. Report No. R-1512
2. Government Accession No.
3. MDOT Project Manager 5. Report Date May 2008
4. Title and Subtitle Evaluation of Grout-Filled Mechanical Splices for Precast Concrete Construction 6. Performing Organization Code
7. Author(s) Peter O. Jansson, P.E.
8. Performing Org. Report No. 07 TI-2094 10. Work Unit No. (TRAIS) 11. Contract No.
9. Performing Organization Name and Address Michigan Department of Transportation Construction and Technology Division P.O. Box 30049 Lansing, MI 48909 11(a). Authorization No.
13. Type of Report & Period Covered
12. Sponsoring Agency Name and Address Michigan Department of Transportation Construction and Technology Division P.O. Box 30049 Lansing, MI 48909
14. Sponsoring Agency Code
15. Supplementary Notes 16. Abstract This report evaluates two proprietary grout-filled mechanical reinforcement splices, the Lenton Interlok and the NMB Splice Sleeve, for suitability in connecting precast concrete structural elements. The testing program included slip, fatigue, ultimate load, and creep. Both splices met the AASHTO LRFD provisions for slip and fatigue, demonstrating little displacement both before and after fatigue testing of 1,000,000 cycles with a stress range of 18 ksi. The ultimate loads of the two splices demonstrated that they are capable of exceeding 125 percent of the reinforcing bar’s yield strength, and in most cases 150 percent of the reinforcing bar’s yield strength. Subjected to sustained loading, neither of the splices showed susceptibility to significant creep displacements, though the limited data suggests epoxy coating may lower ultimate load capacity after sustained loading. Both products are recommended for use on department projects. Proposed revisions to the department’s Qualified Products List and Qualification Procedure for Mechanical Reinforcement Splices are included. 17. Key Words Grout filled splices, mechanical splices, fatigue, slip testing, creep, NMB Splice Sleeve, Lenton Interlok
18. Distribution Statement No restrictions. This document is available to the public through the Michigan Department of Transportation.
19. Security Classification - report Unclassified
20. Security Classification - page Unclassified
21. No. of Pages 72
22. Price


MICHIGAN DEPARTMENT OF TRANSPORTATION
MDOT
Evaluation of Grout-Filled Mechanical Splices for Precast Concrete Construction
Peter O. Jansson, P.E.
Structural Section Construction and Technology Division
Report 07 TI-2094 Research Report R-1512
Michigan Transportation Commission
Ted B. Wahby, Chairman Linda Miller Atkinson, Vice Chairwoman
Maureen Miller Brosnan, Jerrod Jung James R. Rosendall, James S. Scalici
Kirk T. Steudle, Director Lansing, Michigan
May 2008


ii
ACKNOWLEDGEMENTS The author would like to thank the following Department staff for their contributions to the project. Dave Juntunen for initiating the project, Roger Till and Steve Kahl for project guidance, Chris Davis, Rich Ginther, Bryon Beck and Jon Todd for assistance with fabrication and testing the specimens, and Greg Palmer and Robert Miller for assistance with instrumentation and data acquisition. Thanks to Alvin Ericson and Julian Albrigo, with Splice Sleeve North America, Inc., and Erico, Inc., respectively, for providing materials and technical assistance.

iii
Table of Contents 1. Introduction………………………………………………………………………………….1 1.1 Overview 1.2 Example Details 1.3 Product Information 2. Literature Review…………………………………………………………………………..10 2.1 Previous Research 2.2 Testing Methods 3. Fabrication and Testing Plan……………………………………………………………….14 3.1 Specimen Fabrication 3.2 Material Properties 3.3 Testing Procedure 3.4 Equipment and Instrumentation 4. Experimental Results for the Lenton Interlok Splice………………………………………23 4.1 Overview 4.2 Slip Testing 4.3 Fatigue Testing 4.4 Post Fatigue Slip Testing 4.5 Ultimate Load Testing 4.6 Summary and Observations 5. Experimental Results for the NMB Splice Sleeve…………………………………………36 5.1 Overview 5.2 Slip Test 5.3 Fatigue Test 5.4 Post Fatigue Slip Testing 5.5 Ultimate Load Test 5.6 Summary and Observations 6. Creep under Sustained Loading...………………………………………………………….49 7. Summary…………………………………………………………………………………...55 7.1 Conclusions 7.2 Recommendations 8. References………………………………………………………………………………….57 9. Appendices…………………………………………………………………………………59 A. Test Data for Lenton Interlok Splice provided by Erico, Inc. B. Test Data for NMB Splice Sleeve provided by Splice Sleeve North America, Inc. C. Proposed revision for MDOT Qualification Procedure D. Proposed revision for MDOT Qualified Products List

1
1. INTRODUCTION 1.1 OVERVIEW In 2002, the American Association of State Highway and Transportation Officials’ (AASHTO) Technology Implementation Group (TIG), formed in 2000 to facilitate rapid acceptance and implementation of high-payoff and innovative technologies, identified prefabricated bridge elements as one of its first focus technologies. Principal in the advantages identified in prefabricated or precast bridge elements is the ability to minimize disruption to the motoring public while still providing a safe, durable, and economical structure, summarized by the slogan “get in, get out, stay out.” In addition to reducing the disruption to the motoring public, prefabricated bridge elements can make bridges safer to build by reducing the amount of labor over traffic or water, making bridge construction less disruptive to the environment, and increasing concrete quality by casting in a controlled environment. Over the last several years the use of prefabricated bridge elements has increased throughout the United States, and the Michigan Department of Transportation (MDOT) will be constructing its first bridge with prefabricated structural elements other than beams; precast deck panels, pier caps, and columns specifically, for S01 of 39014, Parkview Avenue over US-131 in Kalamazoo in 2008. Although this will be MDOT’s first experience using precast bridge elements, the department has used precast three-sided culverts extensively for the past 20 years when replacing shorter span older bridges up to 48 feet. Reducing construction time, casting concrete in a controlled environment, minimizing impact on the environment, and improving construction zone safety are the advantages seen in the use of precast bridge elements such as deck panels, pier caps, and columns, and have been realized for years with the use of precast three-sided culverts. One of the questions or concerns that commonly arise with the use of prefabricated elements is how to develop quality connections maintaining structural integrity through precast sections. The objective when it comes to designing connections for precast elements can be considered as emulating cast-in-place construction. To this goal, the America Concrete Institute (ACI) published ACI 550.1R-01, Emulating Cast-in-Place Detailing in Precast Construction. Although the information regarding bridge construction in this publication is limited, it does provide insight into the use of mechanical splices for connecting precast elements. Although lapped bars, welded splices, and mechanical splices are addressed, the latter, and more specifically grout filled mechanical splices are unique in their ability to connect precast elements to other precast elements; one typical example being a precast column to a precast pier cap. Grout filled splices can provide continuity of the reinforcement between precast elements and properly emulate cast in place construction. Because of the grout ports, grout filled splices can be used in the horizontal or vertical position and they permit the use of conventional reinforcement where the alternate might be prestressing, which requires stressing of the bars or tendons and grouting of ducts. Grout filled splices were first developed, for the purpose of connecting precast elements, in the 1970’s, with increased use in North America in the late 1980’s and 1990’s. The principal use of grout filled splices is fairly simple and straightforward. Examining a typical column to footing

2
connection where the footing is cast-in-place and the column is precast, the following procedure describes the basic installation process.
1. Attach splices to vertical reinforcement in the footing such that splices are flush with the top of the footing pour.
2. Connect hoses to the splice inlet and outlet ports and terminate them at the face of the
footing pour or beyond, plugging them and the top of the splice to prevent intrusion of concrete during the footing pour.
3. Pour footing and cure to sufficient strength to allow column placement.
4. With vertical reinforcement protruding from the bottom of the precast column, install
column such that reinforcement is fully embedded in the splices. 5. Remove plugs and pump grout in the bottom inlet hose until it flows out the top outlet
hose, and then plug to retain grout.
6. Brace column until grout reaches sufficient compressive strength of 3000 psi, which typically occurs in 24 hours.
An alternate procedure can be used eliminating the need for a grout pump and hoses in some cases by simply pouring the grout into the splices prior to setting the column. Some manufacturers refer to the alternate latter procedure as “pre grout” and the former procedure as “post grout”. Either way completes the connection and emulates a cast-in-place footing to column connection with significant time savings. The same basic procedures are used when connecting two precast elements in the field, except the splices are cast into one of the precast segments at the precast plant. Templates are typically used in precasting to assure correct alignment between elements when fabricated in the field. Several details can be seen in Section 1.2. This evaluation will review research and specifications, and examine in detail the performance of grout filled splices for their suitability in connecting precast bridge elements for department use. Guidance for use and a qualification procedure will be developed should the products be deemed acceptable for department use. The rest of this chapter provides examples of grout filled splices used for connecting precast elements, as well as product information on the splices chosen for this evaluation. 1.2 EXAMPLE DETAILS Designed specifically to structurally join precast elements, grout filled splices can be used in a variety of bridge construction applications. This section presents several examples of different details that have been used in bridge construction. Beam to abutment, beam to pier cap, pier cap to column, and column to footing connections can all be made with grout filled splices. Grout filled splices can be used to connect precast elements to either precast elements or to cast in place elements. In addition, grout filled splices can be used to connect segments of precast
3
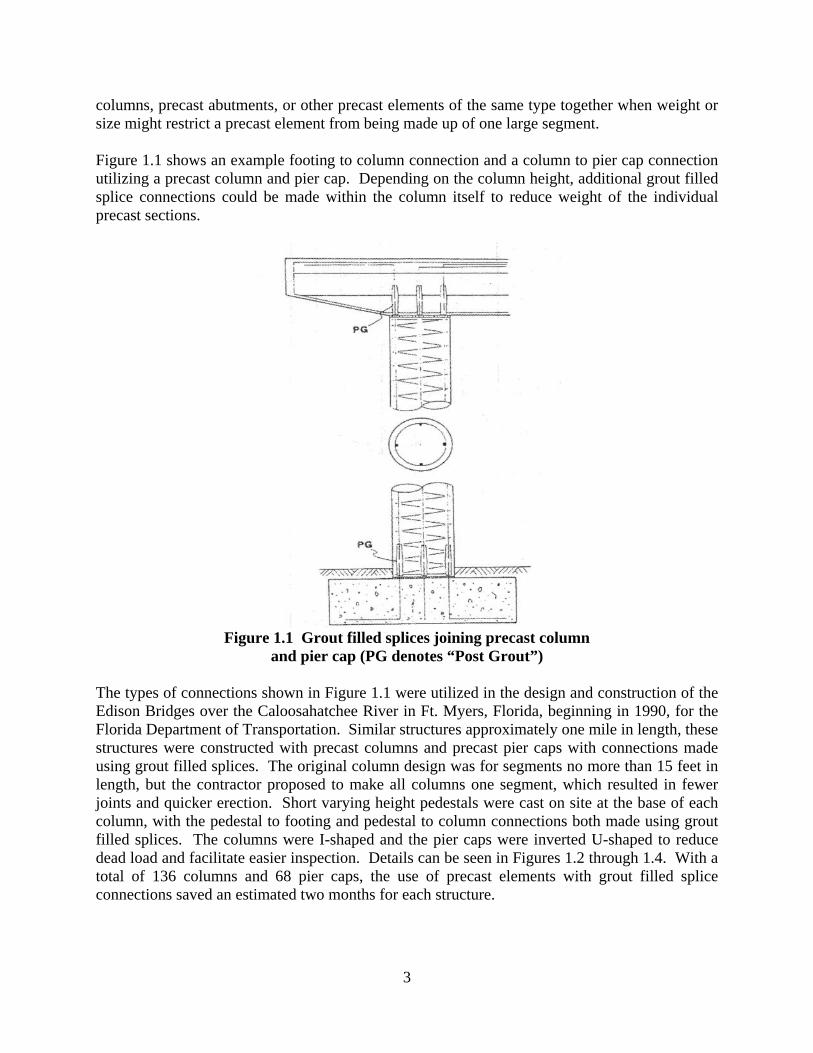
columns, precast abutments, or other precast elements of the same type together when weight or size might restrict a precast element from being made up of one large segment. Figure 1.1 shows an example footing to column connection and a column to pier cap connection utilizing a precast column and pier cap. Depending on the column height, additional grout filled splice connections could be made within the column itself to reduce weight of the individual precast sections.
Figure 1.1 Grout filled splices joining precast column
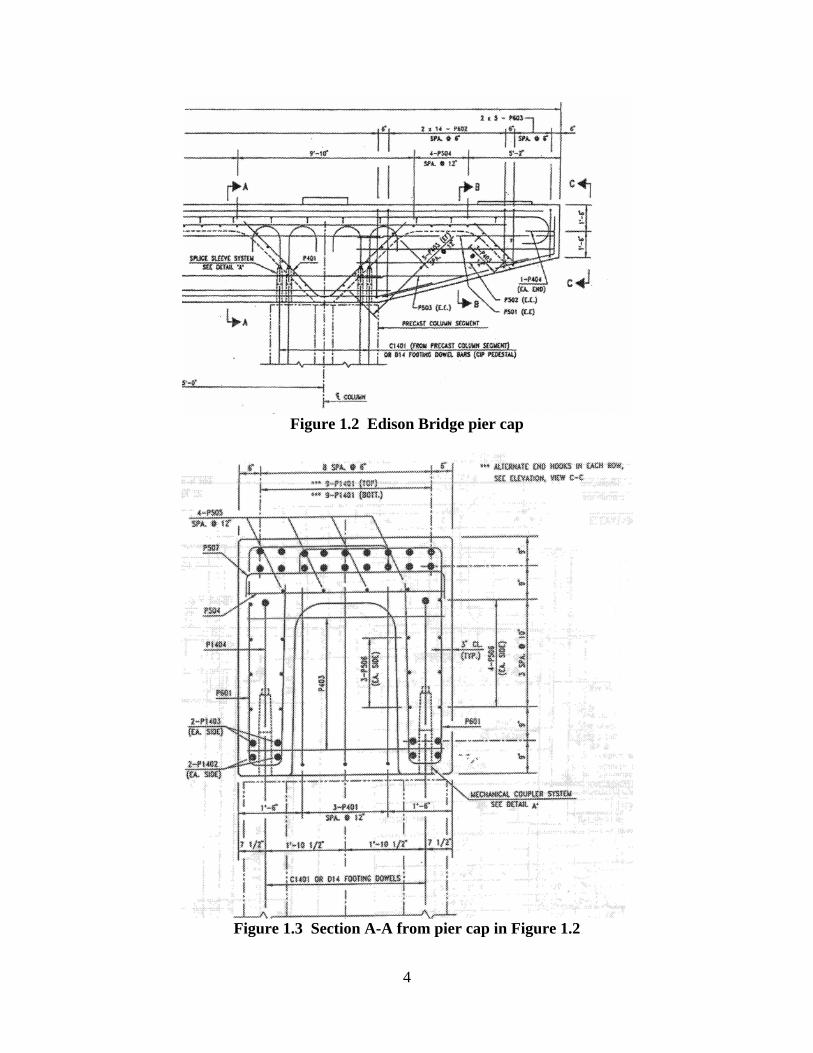
and pier cap (PG denotes “Post Grout”) The types of connections shown in Figure 1.1 were utilized in the design and construction of the Edison Bridges over the Caloosahatchee River in Ft. Myers, Florida, beginning in 1990, for the Florida Department of Transportation. Similar structures approximately one mile in length, these structures were constructed with precast columns and precast pier caps with connections made using grout filled splices. The original column design was for segments no more than 15 feet in length, but the contractor proposed to make all columns one segment, which resulted in fewer joints and quicker erection. Short varying height pedestals were cast on site at the base of each column, with the pedestal to footing and pedestal to column connections both made using grout filled splices. The columns were I-shaped and the pier caps were inverted U-shaped to reduce dead load and facilitate easier inspection. Details can be seen in Figures 1.2 through 1.4. With a total of 136 columns and 68 pier caps, the use of precast elements with grout filled splice connections saved an estimated two months for each structure.
4
Figure 1.2 Edison Bridge pier cap
Figure 1.3 Section A-A from pier cap in Figure 1.2
5
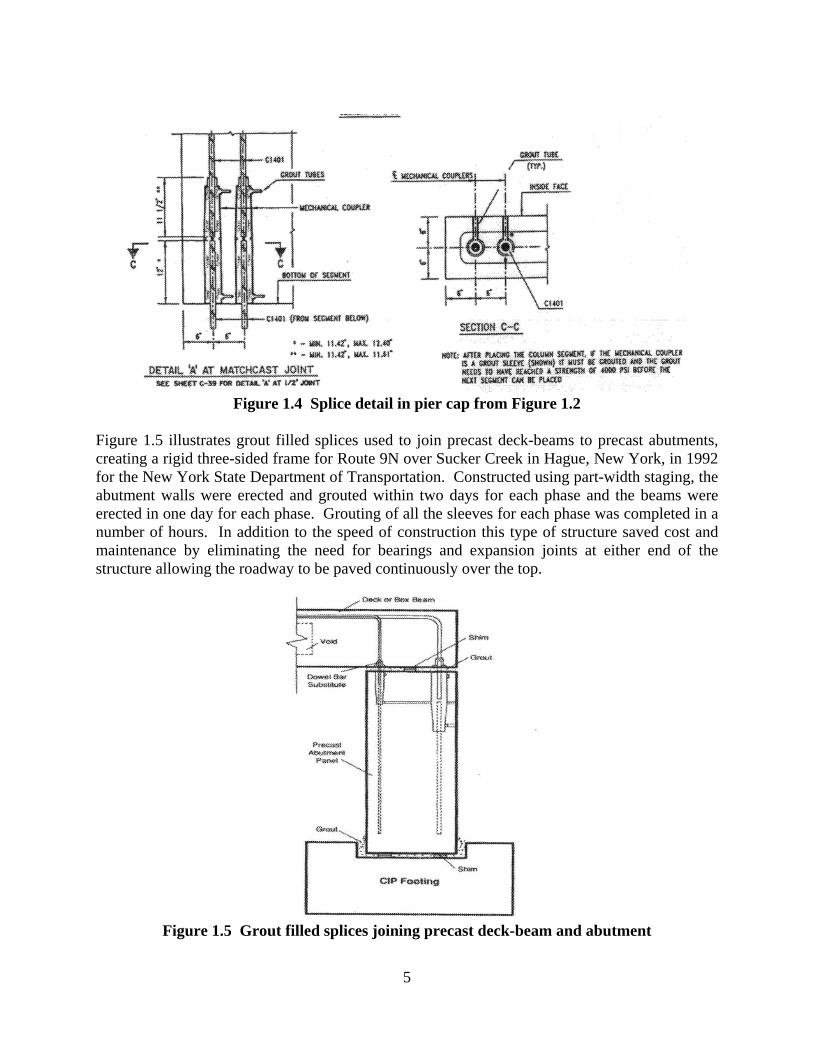
Figure 1.4 Splice detail in pier cap from Figure 1.2
Figure 1.5 illustrates grout filled splices used to join precast deck-beams to precast abutments, creating a rigid three-sided frame for Route 9N over Sucker Creek in Hague, New York, in 1992 for the New York State Department of Transportation. Constructed using part-width staging, the abutment walls were erected and grouted within two days for each phase and the beams were erected in one day for each phase. Grouting of all the sleeves for each phase was completed in a number of hours. In addition to the speed of construction this type of structure saved cost and maintenance by eliminating the need for bearings and expansion joints at either end of the structure allowing the roadway to be paved continuously over the top.
Figure 1.5 Grout filled splices joining precast deck-beam and abutment
6
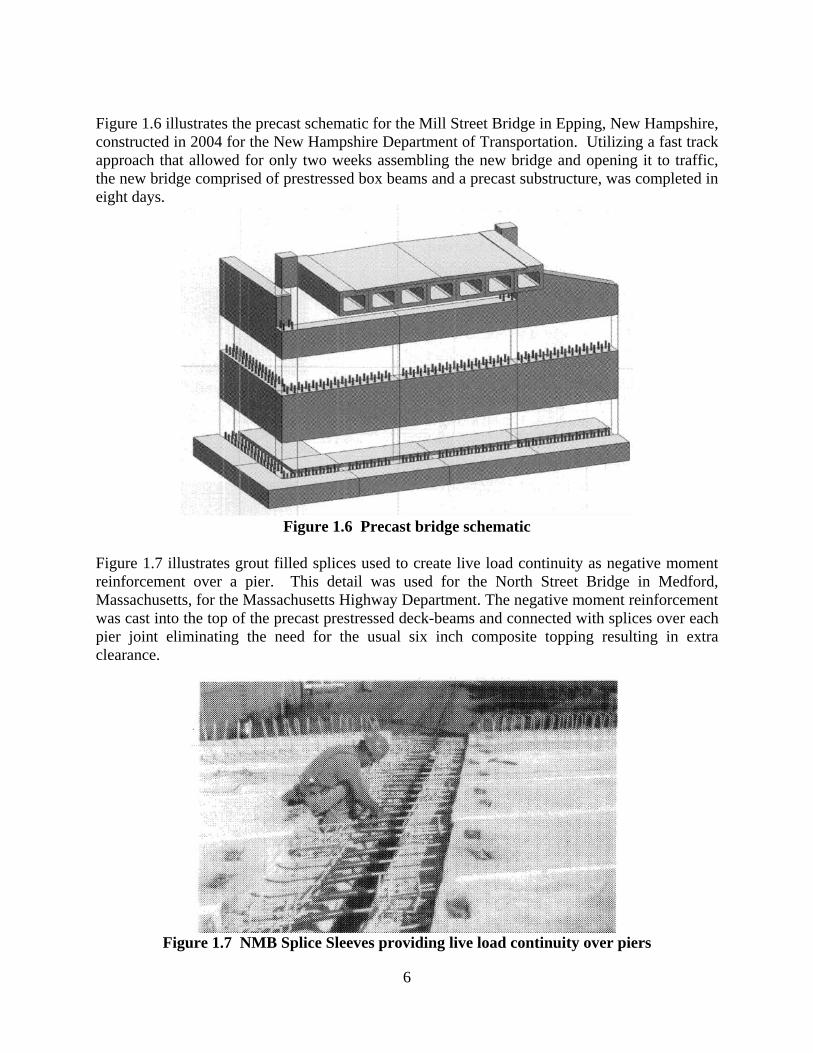
Figure 1.6 illustrates the precast schematic for the Mill Street Bridge in Epping, New Hampshire, constructed in 2004 for the New Hampshire Department of Transportation. Utilizing a fast track approach that allowed for only two weeks assembling the new bridge and opening it to traffic, the new bridge comprised of prestressed box beams and a precast substructure, was completed in eight days.
Figure 1.6 Precast bridge schematic
Figure 1.7 illustrates grout filled splices used to create live load continuity as negative moment reinforcement over a pier. This detail was used for the North Street Bridge in Medford, Massachusetts, for the Massachusetts Highway Department. The negative moment reinforcement was cast into the top of the precast prestressed deck-beams and connected with splices over each pier joint eliminating the need for the usual six inch composite topping resulting in extra clearance.
Figure 1.7 NMB Splice Sleeves providing live load continuity over piers

7
Another project for the Massachusetts Highway Department, the Great Road Bridge, Route 119 over B&M Railroad in Littleton, Massachusetts, used grout filled splices to connect the top of the abutment walls to the precast prestressed box beams, as well as the negative moment reinforcement over the piers. For this project, integral abutments and live load continuity were achieved at a lower cost with easier construction than with typical cast-in-place construction. 1.3 PRODUCT INFORMATION Erico, Inc. and Splice Sleeve North America, Inc. submitted their products, the Lenton Interlok and the NMB Splice Sleeve, respectively, for evaluation. A third company was identified but did not submit their product for evaluation. 1.3.1 Lenton Interlok The Lenton Interlok is a ductile iron casting which connects two reinforcing bars by using a tapered thread on one bar with the second bar being grouted inside the sleeve. Similar to deformations on reinforcing bars which increase pull-out resistance when embedded in concrete, the sleeves contain equally spaced concentric ribs on the interior surface to increase resistance to bond failure between the sleeve and the grout. The tapered bar is to be tightened to a specified torque dependent on the bar size. The Lenton Interlok is shown in Figure 1.8. It is available for connecting U.S. customary rebar sizes #6 through #18 and can connect two different sizes. The Lenton Interlok is available uncoated or epoxy coated. The grouted rebar is meant to be fully embedded although the manufacturer lists allowable tolerances for minimum embedment which can be one to two inches less than full embedment depending on bar size. Once cast into concrete the Lenton Interlok can be grouted either by gravity filling prior to connecting the precast element, or by using a grout pump with inlet and outlet hoses cast into the concrete after the precast element has been set in place.
Figure 1.8 Lenton Interlok for #6 steel reinforcing bar

8
1.3.2 NMB Splice Sleeve The NMB Splice Sleeve is also a ductile iron casting but differs from the Lenton Interlok in several ways, the most obvious being that there is no threaded connection. Both reinforcement bars spliced by the NMB Splice Sleeve are grouted into the sleeve, with a stop in the middle of the sleeve providing assurance that each bar is satisfactorily embedded. The tapered end also contains guides on the interior surface to help center one bar in the splice; the other end does not have guides in order to allow some flexibility of steel reinforcement placement when connecting a precast element with protruding steel reinforcement. The manufacturer lists minimum required embedment depths which range from 0.2 inch to 1.1 inches less than full embedment depending on bar size. With both bars requiring a grouted connection, the overall sleeve length is approximately 50 percent longer than the Lenton Interlok; the sleeve diameter is slightly smaller varying with sleeve size. The NMB splice is shown in Figure 1.9. Longitudinal ribs (see Figure 1.10) are cast on the outside tapered end of splices for bars #7 through #14 in order to provide a constant outer dimension to permit uniform sizes of stirrups or column ties. For reference in the photographs, the circular tie-down covers in the floor are 2 3/8-inch diameter and spaced one foot on center. The NMB Splice Sleeve is available for steel reinforcement sizes #5 through #18, and can connect steel reinforcement of two different sizes. The NMB splice also has concentric ribs on the interior surface to increase pull-out resistance, and with the deformations on the steel reinforcement, this assures that grout can flow between the steel reinforcement and the splice in case the steel reinforcement is offset from center. The splices can also be supplied uncoated or epoxy coated, and can be grouted either by gravity filling or use of a grout pump.
Figure 1.9 NMB Splice Sleeve for # 6 steel reinforcing bar

9
Figure 1.10 NMB Splice Sleeve for #11 steel reinforcing bar with longitudinal ribs
10
2. LITERATURE REVIEW 2.1 PREVIOUS RESEARCH This chapter provides a review of previous research and past and current specifications as well as a description of the test methods chosen for this evaluation. ACI Committee 439 reviewed various types of mechanical connections for reinforcing bars, including grout filled splices, in 1991. The committee provided basic information on many different types of connections, listing several advantages of using grout filled splices. The ability to connect different bar sizes and the particular suitability of grout filled splices for connecting reinforcement in precast construction, allowing elements to be assembled without any closure pour or formwork, though precautions must be taken to restrict any movement of the joined elements prior to the grout reaching a certain strength. However, some manufacturers describe the use of grout bedding and shims when using their products to connect precast elements, so a small amount of formwork may be necessary. The fatigue behavior of reinforcement connections, both welded and mechanical types, was investigated by Paulson and Hanson for NCHRP 10-35 in 1991. For each type of splice, there were reductions in fatigue performance, to varying degrees, when compared to unspliced bars. Recommendations were made for revisions to AASHTO provisions for fatigue design for reinforcing bar splices based on fatigue limit stress ranges for a minimum of 1,000,000 cycles. These recommendations were adopted in section 8.32.2 of AASHTO Standard Specification for Highway Bridges. The grout filled splices were the only connection type listed in the 18 ksi fatigue limit category, the highest limit. The test data indicated that the actual mean fatigue limit of uncoated and epoxy coated splices was 24.0 ksi and 25.4 ksi, respectively, with lower 95-percent tolerance limits of 20.8 ksi and 19.1 ksi, respectively. It should be mentioned that the grout filled splices tested in NCHRP 10-35 were of the type similar to the NMB Splice Sleeve, i.e. non-threaded splices, unlike the Lenton Interlok. It was found in general that threaded mechanical splices did not perform as well, though tapered threads did increase fatigue performance. Since the Lenton Interlok could be considered a combination of the categories in the AASHTO provisions, grout filled - 18 ksi and threaded - 12 ksi, the fatigue performance in this testing program was of significant interest. MDOT previously investigated the use of reinforcement splices for technical investigation TI-1745, Mechanical Reinforcement Splices, though no grout filled splices were included. Fatigue testing was conducted based on the findings of NCHRP 10-35 and in accordance with AASHTO Standard Specifications for Highway Bridges, with a selected stress range of 12 ksi to 24 ksi (20 to 40 percent of Fy) chosen to most accurately represent actual service conditions. As a result of TI-1745, MDOT developed a qualified products list (QPL) and qualification procedure for mechanical reinforcement splices. The requirements, comparable to NCHRP 10-35 and AASHTO, require an ultimate load in tension of 125 percent Fy, and fatigue strength with a stress range of 12 ksi at greater than 1,000,000 cycles. A special “high fatigue strength” category was designated for splices with a fatigue strength of 18 ksi at greater than 1,000,000 cycles, although there are currently no splices on the QPL meeting this requirement.
11
The AASHTO LRFD Bridge Design Specifications contain the same fatigue limits as the Standard Specifications for Highway Bridges, but add provisions for stress versus slip. These provisions were developed by the California Department of Transportation (Caltrans), in order to verify that bar slippage would not influence the development of cracks in the concrete. AASHTO LRFD lists two categories for slip criteria, one for bar sizes up to #14, and a second for #18 bars, with the slip limits being 0.01 inch and 0.03 inch, respectively. This differs somewhat from the Caltrans criteria, contained in the Prequalification Procedures and Acceptance Criteria for Ultimate Splice Mechanical Couplers on ASTM A706 Reinforcing Steel, and governed by California Test 670, Method of Tests for Steel Reinforcing Bar Butt Splices. In the Caltrans prequalification procedure the slip limits are as seen in Table 2.1.
Table 2.1 Caltrans Slip Criteria Reinforcing Bar
Number Total Slip (inch) #3 to #6 0.010 #7 to #9 0.014
#10 to #11 0.018 #14 0.024 #18 0.030
The slip is measured by preloading the specimen to a non-zero nominal load and taking initial readings, then loading to 30 ksi and unloading to 3 ksi at a predetermined rate, at which point the final slip readings are taken. Two measurements using linear variable differential transformers (LVDTs) or extensometers taken on opposite sides of the specimen are averaged for each reading, with the total slip being the initial averaged reading subtracted from the averaged final reading. The Caltrans criteria for splices also differs from AASHTO LRFD in that the ultimate strength of the splice is required to be 133 percent Fy compared to 125 percent Fy as in AASHTO. The American Concrete Institute (ACI) contains specifications for mechanical splices, contained in ACI Committee 318, Building Code Requirements for Structural Concrete and Commentary. Mechanical splices are divided into two categories, Type 1 and Type 2, which have ultimate load requirements of 125 percent Fy and 100 percent Ft, respectively. The International Code Council (ICC) contains specifications for mechanical connections in AC133, Acceptance Criteria for Mechanical Connectors for Steel Bar Reinforcement. AC133 also divides mechanical splices into two categories, Type 1 and Type 2. Type 1 requires an ultimate load of 125 percent Fy and Type 2 specifications are dependent upon the code under which they will be used, the Uniform Building Code (UBC) or International Building Code (IBC). The former requires the lesser of 95 percent Ft or 160 percent Fy, the latter requires 100 percent Ft. There is no provision for high cycle fatigue strength as per AASHTO, but a cyclic loading progression as seen in Table 2.2. Erico and Splice Sleeve North America state that their products are capable of exceeding the requirements of ACI and ICC for Type I and Type II splices.
12
Table 2.2 Description of Cyclic Tension and Compression Test, ICC AC133 Stage Tension Compression Cycles
1 0.95Fy 0.5Fy 20
2 2εy 0.5Fy 4
3 5εy 0.5Fy 4
4 Load in tension to failure Both Erico and Splice Sleeve North America were asked to provide independent testing data for their products. Data for the Lenton Interlok and the NMB Splice Sleeve are contained in Appendices A and B, respectively. Summarizing, all bar splice assemblies independently tested had ultimate load values in excess of 125 percent Fy of grade 60 rebar, meeting the Type I category for both ACI and ICC. Without tensile properties of the steel reinforcement provided, it was not possible to verify that Type II requirements were met for either splice, but all available ultimate load tests exceeded 150 percent Fy. Cyclic loading was conducted on both splices, in accordance with ICC in Table 2.2. No failures occurred during stages 1 through 3 for the Lenton Interlok or the NMB Splice Sleeve. There were various types of failure seen in stage 4 for the Lenton Interlok; bar fracture at the bar threads-splice interface, bar fracture independent of the splice, pull-out at the threads, and pull-out at the grouted end. Bar failure at the threaded end was the most common failure type, either fracturing the bar at the threads or thread failure. Failure modes were not available for the test data provided by Splice Sleeve North America. Considering the effects of epoxy coating on performance, two separate studies investigated the performance of uncoated steel reinforcement with that of epoxy coated steel reinforcement when using the NMB Splice Sleeve, and reached different conclusions. The first study, conducted by Nisso Master Builders, concluded that there was virtually no difference in performance in ultimate load values, with an average of 166 percent Fy for the uncoated steel reinforcement splices and an average of 165 percent Fy for the epoxy coated steel reinforcement splices. The second study, conducted by Caltrans, found that the average of the ultimate load values for the uncoated steel reinforcement splices was 182 percent of Fy and the average for the epoxy coated steel reinforcement splices was 169 percent Fy. These tests were also conducted using a worst-case scenario with the interior of the splices epoxy coated. Paulson and Hanson found that epoxy coated bars and splices had slightly improved fatigue performance over uncoated bars and splices, perhaps because the blast cleaning preparation for coating the bars reduced stress concentrations at initiation sites on the bar surface. For the NMB Splice Sleeve, slip testing conducted by The Science University of Tokyo obtained values between 0.003 inch and 0.011 inch. Slip testing conducted by Caltrans obtained values between 0.002 inch and 0.010 inch. Slip test data were not provided for the Lenton Interlok. 2.2 MDOT TESTING METHODS Epoxy coated bars were chosen for the MDOT testing program because previous research indicated that uncoated bars were likely to perform equal or greater than epoxy coated bars with the possible exception of fatigue testing, and because MDOT is more likely to use epoxy coated

13
bars where the splices are required. Epoxy coated splices were also desired for the same reason. Erico, Inc. submitted uncoated splices but because the insides of the Lenton Interlok splice are not epoxy coated, with the exception of a small amount of overspray at the top, it would not have an effect on testing. Splice Sleeve North America, Inc. did submit epoxy coated splices. Splice testing was conducted in open air, as opposed to the specimens being cast into a concrete beam or other element for modeling actual service conditions. However, it is believed that the restraining effects of the surrounding concrete would reduce any out of plane displacements or forces for a splice encased in concrete, creating a pure axial condition. This condition was attempted when fabricating the specimens by aligning the reinforcement as close as possible so that stresses due to secondary moments would be as small as possible. Paulson and Hanson also concluded that axial tension fatigue tests in air will generally provide a conservative prediction of the fatigue behavior of splices in actual service conditions. Therefore, it is believed that this evaluation was conservative if differing from actual service conditions. Testing was conducted in accordance with ASTM A1034, Standard Test Methods for Testing Mechanical Splices for Steel Reinforcing Bars, largely adopted from California Test 670. The provisions for fatigue listed in Section 5.5 and the provisions for ultimate load and slip listed in Section 5.11 of AASHTO LRFD were adopted as preliminary guidelines for this testing program. When considering cyclic loading, testing was limited to the long life region of the stress range – loading cycles (S-N) curve as seen in Figure 2.1. Manning, in summarizing NCHRP 10-35 for NCHRP Research Results Digest No. 197, concluded that the low cycle region was unimportant outside of seismic concerns. The long life region best examines the ultimate fatigue strength of the splices.
Figure 2.1 Representative S-N curve for steel reinforcing bars, NCHRP
Research Results Digest No. 197
14
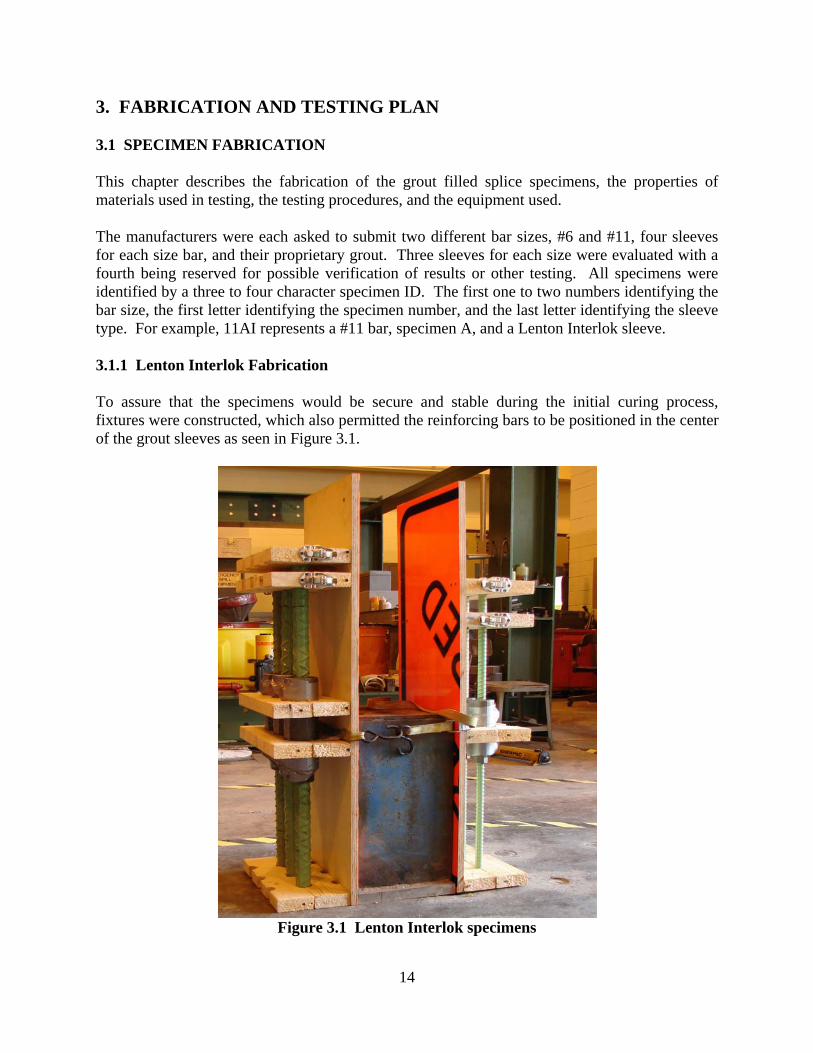
3. FABRICATION AND TESTING PLAN 3.1 SPECIMEN FABRICATION This chapter describes the fabrication of the grout filled splice specimens, the properties of materials used in testing, the testing procedures, and the equipment used. The manufacturers were each asked to submit two different bar sizes, #6 and #11, four sleeves for each size bar, and their proprietary grout. Three sleeves for each size were evaluated with a fourth being reserved for possible verification of results or other testing. All specimens were identified by a three to four character specimen ID. The first one to two numbers identifying the bar size, the first letter identifying the specimen number, and the last letter identifying the sleeve type. For example, 11AI represents a #11 bar, specimen A, and a Lenton Interlok sleeve. 3.1.1 Lenton Interlok Fabrication To assure that the specimens would be secure and stable during the initial curing process, fixtures were constructed, which also permitted the reinforcing bars to be positioned in the center of the grout sleeves as seen in Figure 3.1.
Figure 3.1 Lenton Interlok specimens

15
Prior to setting the specimens in the fixture the threaded bars were installed in the sleeves using a torque wrench at the manufacturer’s recommended settings, 130 foot-pounds for the #6 bars and 200 foot-pounds for the #11 bars. The grout inlet and outlet ports were then sealed with duct tape. The grout could either be poured or pumped into the sleeve, as long as all spaces in the sleeve are filled with grout. A representative from Erico, Inc. was present to assist with mixing and placing the grout. The prepackaged grout was mixed per the manufacturers instructions, with the initial addition of 0.63 gallon of water to the 50-pound bag of prepackaged grout producing a flow measurement of less than 3 inches. The flow was measured using a piece of 2-inch diameter plastic pipe, 4 inches in length, placed on the flow template and filled with grout and slowly lifted. This procedure is described in the manufacturer’s product literature and the desired consistency is a flow measurement of 5 to 6 inches, when the averages of two readings are taken at 90 degree angles to each other. With the addition of 0.04 gallon water the consistency was measured again and an average reading of 5.3 inches was obtained, as seen in Figure 3.2. After each addition of water the grout was mixed thoroughly for at least 5 minutes with a paddle mixer attached to a hand held drill. At this point the grout was poured into the sleeves while the sides were tapped to eliminate any air voids. Although the manufacturer’s user manual indicates that the working time for the grout is approximately 50 minutes at 75 degrees Fahrenheit (the ambient temperature at the time of grouting), the actual working time was estimated at 25 to 30 minutes. Once the sleeves were grouted the top bars were fully embedded in the grouted sleeves, secured to the fixture and left undisturbed to cure. Grout specimens were also cast to determine compressive strength at 24 hours, 3 days, 7 days, and 28 days. The splice specimens were removed from the fixtures at 24 hours and stored until testing at 28 days.
Figure 3.2 Flow template for Erico HY10L Grout
To avoid eccentric loading moments during the axial tensile testing, the bars were centered in the sleeves and kept as close to vertical as possible. The manufacturer lists an allowable misalignment angle for the bars, varying from five to nine degrees depending on bar size, but no
16
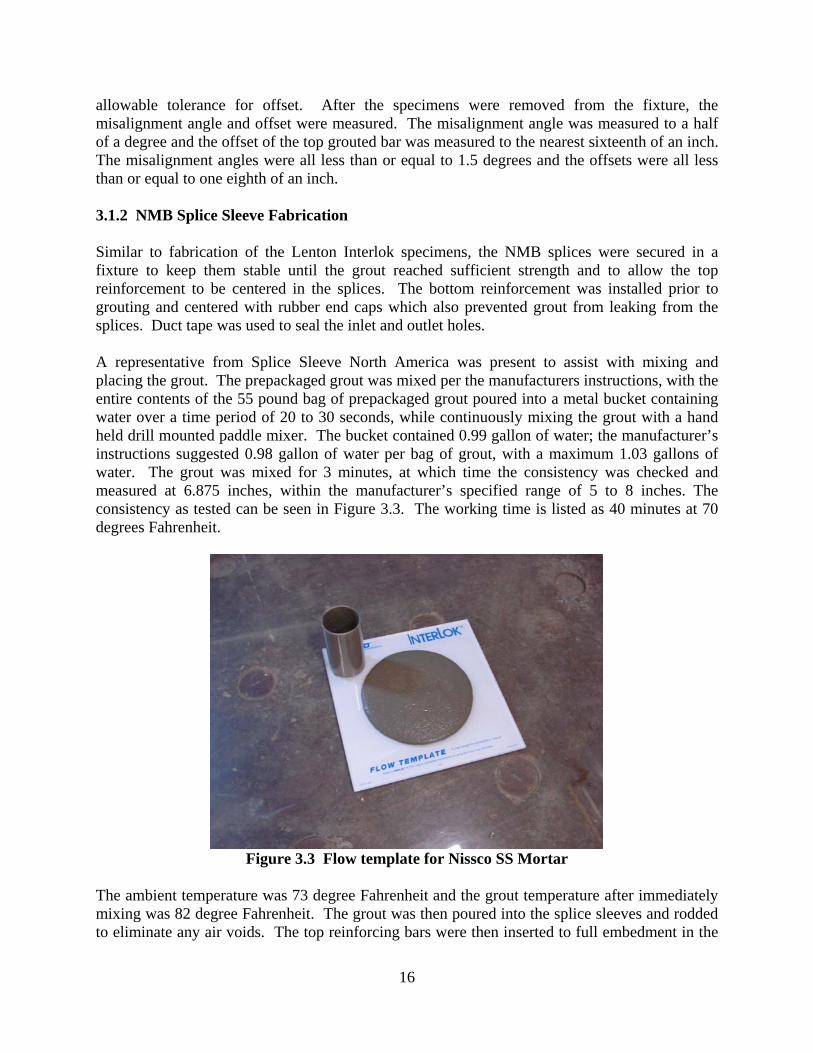
allowable tolerance for offset. After the specimens were removed from the fixture, the misalignment angle and offset were measured. The misalignment angle was measured to a half of a degree and the offset of the top grouted bar was measured to the nearest sixteenth of an inch. The misalignment angles were all less than or equal to 1.5 degrees and the offsets were all less than or equal to one eighth of an inch. 3.1.2 NMB Splice Sleeve Fabrication Similar to fabrication of the Lenton Interlok specimens, the NMB splices were secured in a fixture to keep them stable until the grout reached sufficient strength and to allow the top reinforcement to be centered in the splices. The bottom reinforcement was installed prior to grouting and centered with rubber end caps which also prevented grout from leaking from the splices. Duct tape was used to seal the inlet and outlet holes. A representative from Splice Sleeve North America was present to assist with mixing and placing the grout. The prepackaged grout was mixed per the manufacturers instructions, with the entire contents of the 55 pound bag of prepackaged grout poured into a metal bucket containing water over a time period of 20 to 30 seconds, while continuously mixing the grout with a hand held drill mounted paddle mixer. The bucket contained 0.99 gallon of water; the manufacturer’s instructions suggested 0.98 gallon of water per bag of grout, with a maximum 1.03 gallons of water. The grout was mixed for 3 minutes, at which time the consistency was checked and measured at 6.875 inches, within the manufacturer’s specified range of 5 to 8 inches. The consistency as tested can be seen in Figure 3.3. The working time is listed as 40 minutes at 70 degrees Fahrenheit.
Figure 3.3 Flow template for Nissco SS Mortar
The ambient temperature was 73 degree Fahrenheit and the grout temperature after immediately mixing was 82 degree Fahrenheit. The grout was then poured into the splice sleeves and rodded to eliminate any air voids. The top reinforcing bars were then inserted to full embedment in the

17
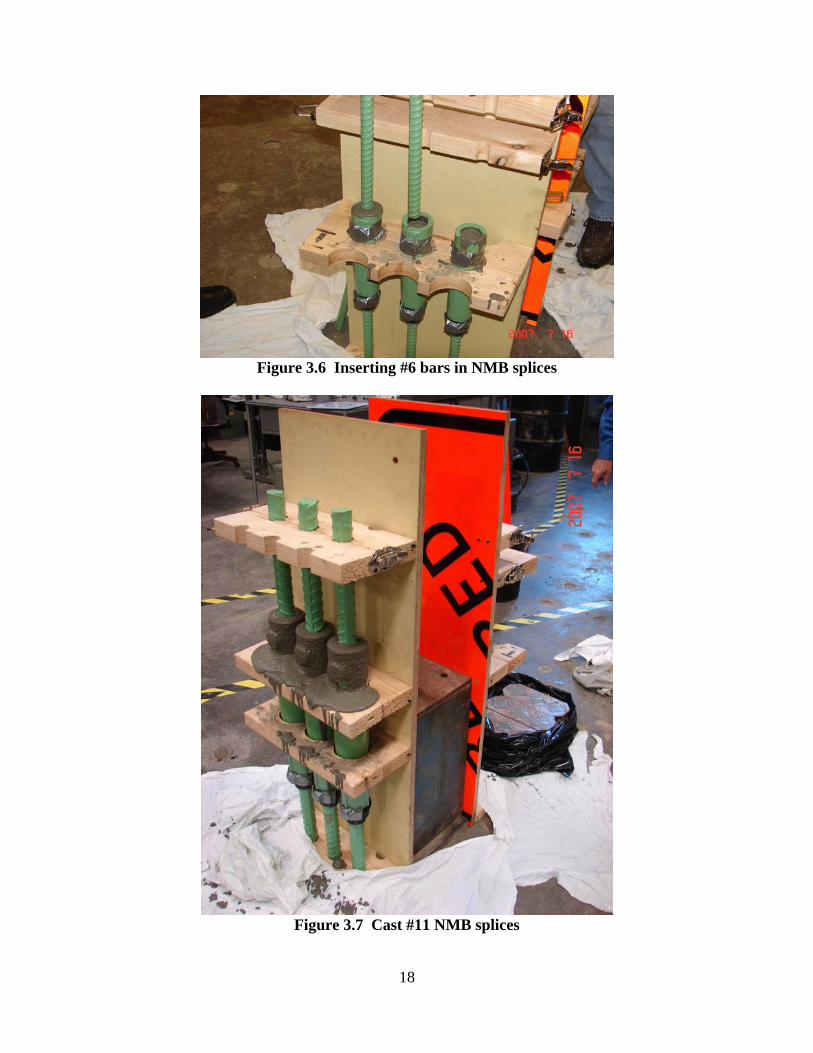
grouted splices and secured in the fixture to prevent any movement during the initial curing process. The specimens were removed from the fixture after 24 hours and stored until testing. Grout specimens were also cast to determine compressive strength at 24 hours, 3 days, 7 days, and 28 days. Figures 3.4 through 3.7 illustrate the fabrication process for the NMB Splice Sleeves.
Figure 3.4 Pouring grout in #11 NMB splices
Figure 3.5 Rodding grout in #6 NMB splices
18
Figure 3.6 Inserting #6 bars in NMB splices
Figure 3.7 Cast #11 NMB splices
19
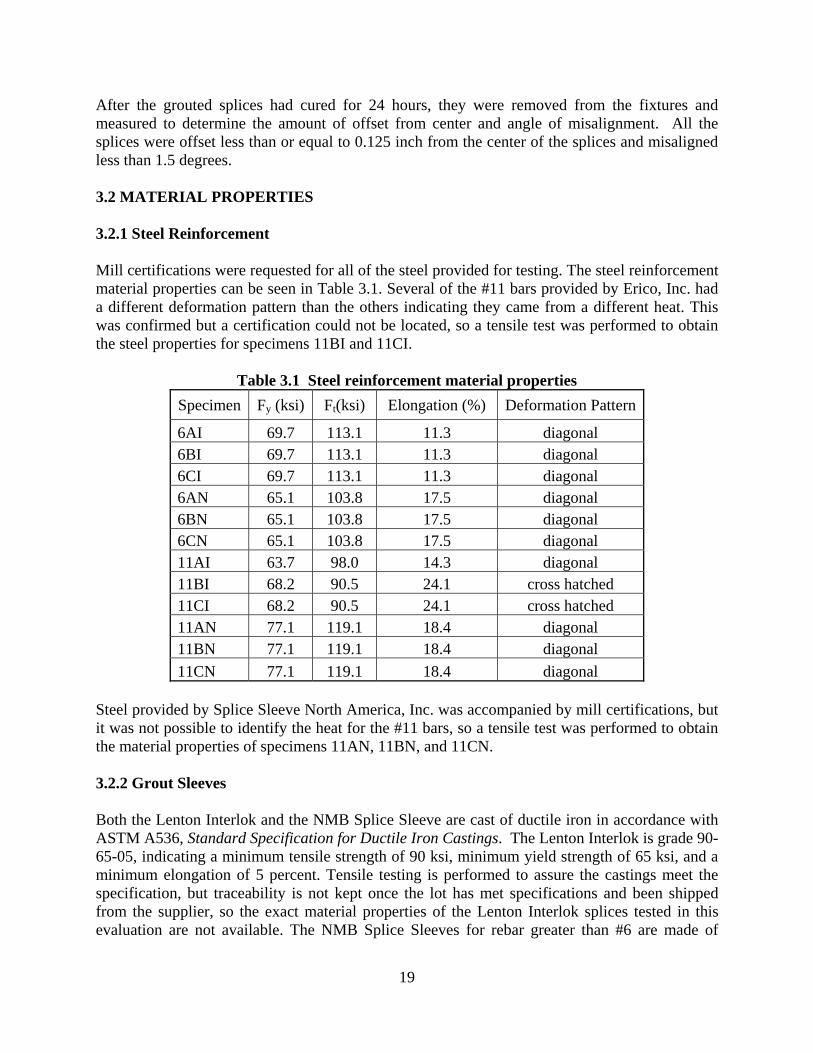
After the grouted splices had cured for 24 hours, they were removed from the fixtures and measured to determine the amount of offset from center and angle of misalignment. All the splices were offset less than or equal to 0.125 inch from the center of the splices and misaligned less than 1.5 degrees. 3.2 MATERIAL PROPERTIES 3.2.1 Steel Reinforcement Mill certifications were requested for all of the steel provided for testing. The steel reinforcement material properties can be seen in Table 3.1. Several of the #11 bars provided by Erico, Inc. had a different deformation pattern than the others indicating they came from a different heat. This was confirmed but a certification could not be located, so a tensile test was performed to obtain the steel properties for specimens 11BI and 11CI.
Table 3.1 Steel reinforcement material properties
Specimen Fy (ksi) Ft(ksi) Elongation (%) Deformation Pattern
6AI 69.7 113.1 11.3 diagonal 6BI 69.7 113.1 11.3 diagonal 6CI 69.7 113.1 11.3 diagonal 6AN 65.1 103.8 17.5 diagonal 6BN 65.1 103.8 17.5 diagonal 6CN 65.1 103.8 17.5 diagonal 11AI 63.7 98.0 14.3 diagonal 11BI 68.2 90.5 24.1 cross hatched 11CI 68.2 90.5 24.1 cross hatched 11AN 77.1 119.1 18.4 diagonal 11BN 77.1 119.1 18.4 diagonal 11CN 77.1 119.1 18.4 diagonal
Steel provided by Splice Sleeve North America, Inc. was accompanied by mill certifications, but it was not possible to identify the heat for the #11 bars, so a tensile test was performed to obtain the material properties of specimens 11AN, 11BN, and 11CN. 3.2.2 Grout Sleeves Both the Lenton Interlok and the NMB Splice Sleeve are cast of ductile iron in accordance with ASTM A536, Standard Specification for Ductile Iron Castings. The Lenton Interlok is grade 90-65-05, indicating a minimum tensile strength of 90 ksi, minimum yield strength of 65 ksi, and a minimum elongation of 5 percent. Tensile testing is performed to assure the castings meet the specification, but traceability is not kept once the lot has met specifications and been shipped from the supplier, so the exact material properties of the Lenton Interlok splices tested in this evaluation are not available. The NMB Splice Sleeves for rebar greater than #6 are made of
20
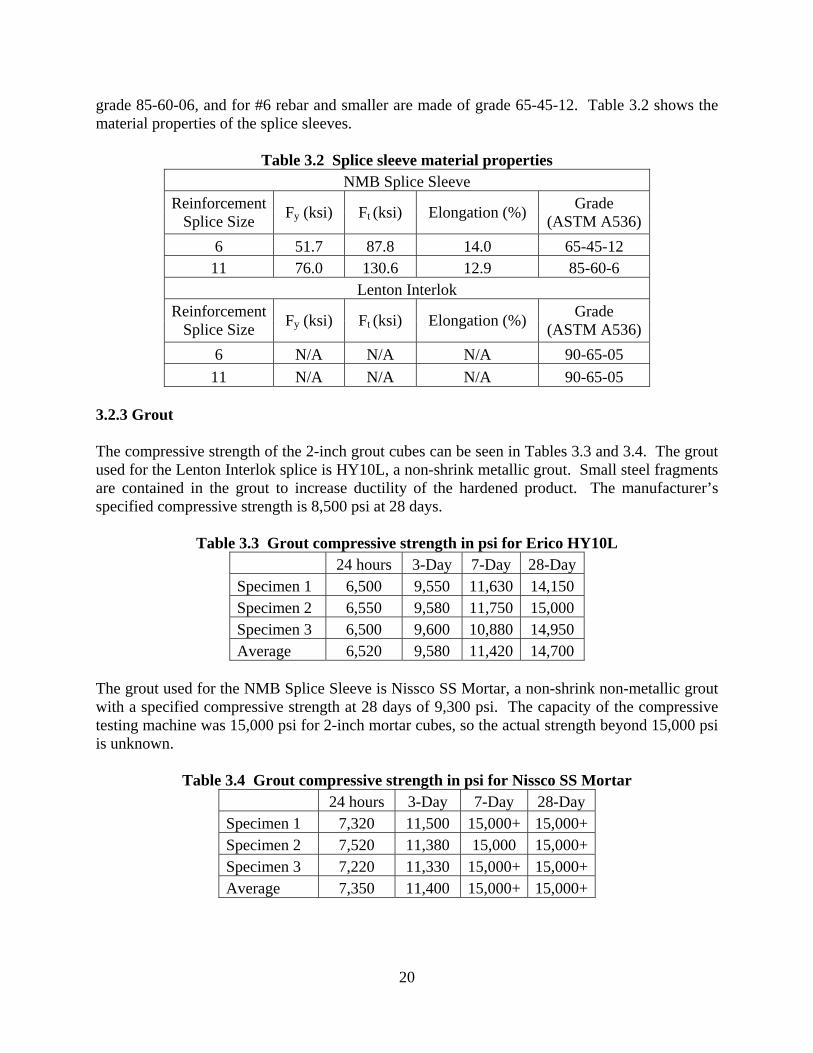
grade 85-60-06, and for #6 rebar and smaller are made of grade 65-45-12. Table 3.2 shows the material properties of the splice sleeves.
Table 3.2 Splice sleeve material properties NMB Splice Sleeve
Reinforcement Splice Size Fy (ksi) Ft (ksi) Elongation (%) Grade
(ASTM A536) 6 51.7 87.8 14.0 65-45-12 11 76.0 130.6 12.9 85-60-6
Lenton Interlok Reinforcement
Splice Size Fy (ksi) Ft (ksi) Elongation (%) Grade (ASTM A536)
6 N/A N/A N/A 90-65-05 11 N/A N/A N/A 90-65-05
3.2.3 Grout The compressive strength of the 2-inch grout cubes can be seen in Tables 3.3 and 3.4. The grout used for the Lenton Interlok splice is HY10L, a non-shrink metallic grout. Small steel fragments are contained in the grout to increase ductility of the hardened product. The manufacturer’s specified compressive strength is 8,500 psi at 28 days.
Table 3.3 Grout compressive strength in psi for Erico HY10L 24 hours 3-Day 7-Day 28-Day Specimen 1 6,500 9,550 11,630 14,150 Specimen 2 6,550 9,580 11,750 15,000 Specimen 3 6,500 9,600 10,880 14,950 Average 6,520 9,580 11,420 14,700
The grout used for the NMB Splice Sleeve is Nissco SS Mortar, a non-shrink non-metallic grout with a specified compressive strength at 28 days of 9,300 psi. The capacity of the compressive testing machine was 15,000 psi for 2-inch mortar cubes, so the actual strength beyond 15,000 psi is unknown.
Table 3.4 Grout compressive strength in psi for Nissco SS Mortar 24 hours 3-Day 7-Day 28-Day Specimen 1 7,320 11,500 15,000+ 15,000+ Specimen 2 7,520 11,380 15,000 15,000+ Specimen 3 7,220 11,330 15,000+ 15,000+ Average 7,350 11,400 15,000+ 15,000+
21
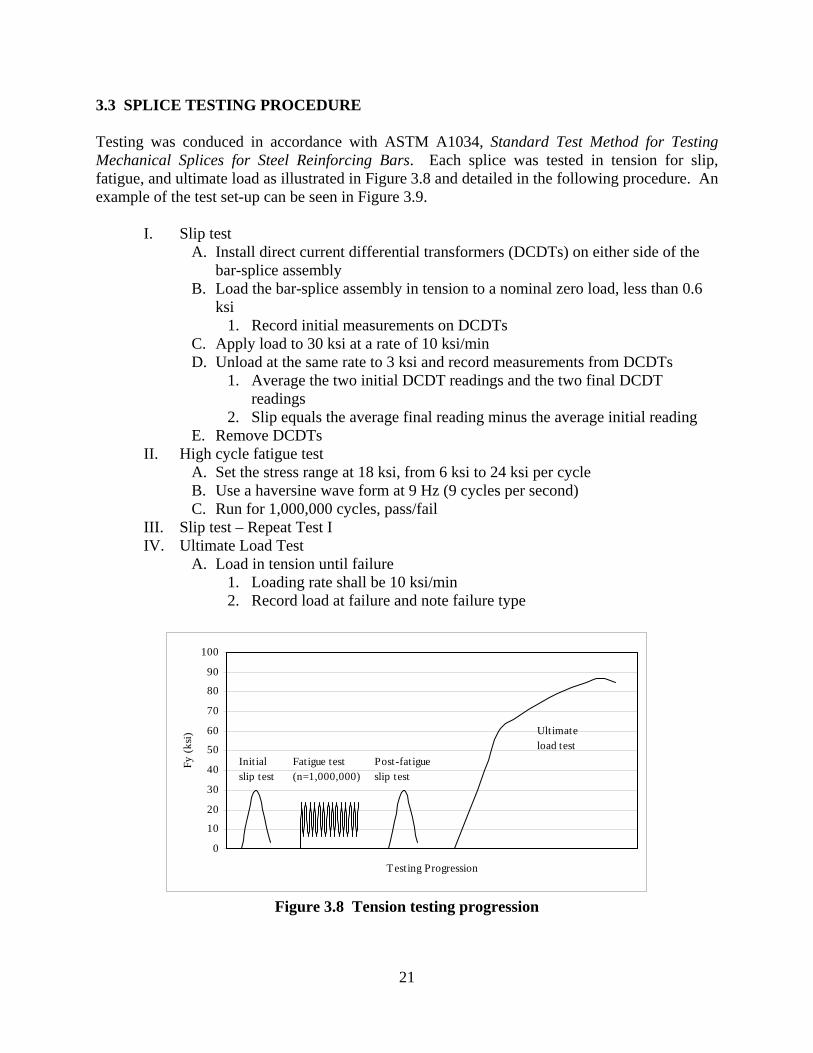
3.3 SPLICE TESTING PROCEDURE Testing was conduced in accordance with ASTM A1034, Standard Test Method for Testing Mechanical Splices for Steel Reinforcing Bars. Each splice was tested in tension for slip, fatigue, and ultimate load as illustrated in Figure 3.8 and detailed in the following procedure. An example of the test set-up can be seen in Figure 3.9.
I. Slip test A. Install direct current differential transformers (DCDTs) on either side of the
bar-splice assembly B. Load the bar-splice assembly in tension to a nominal zero load, less than 0.6
ksi 1. Record initial measurements on DCDTs
C. Apply load to 30 ksi at a rate of 10 ksi/min D. Unload at the same rate to 3 ksi and record measurements from DCDTs
1. Average the two initial DCDT readings and the two final DCDT readings
2. Slip equals the average final reading minus the average initial reading E. Remove DCDTs
II. High cycle fatigue test A. Set the stress range at 18 ksi, from 6 ksi to 24 ksi per cycle B. Use a haversine wave form at 9 Hz (9 cycles per second) C. Run for 1,000,000 cycles, pass/fail
III. Slip test – Repeat Test I IV. Ultimate Load Test
A. Load in tension until failure 1. Loading rate shall be 10 ksi/min 2. Record load at failure and note failure type
0
10
20
30
40
50
60
70
80
90
100
Testing Progression
Fy (k
si)
Init ial slip test
Fatigue test (n=1,000,000)
Post-fatigue slip test
Ultimate load test
Figure 3.8 Tension testing progression
22
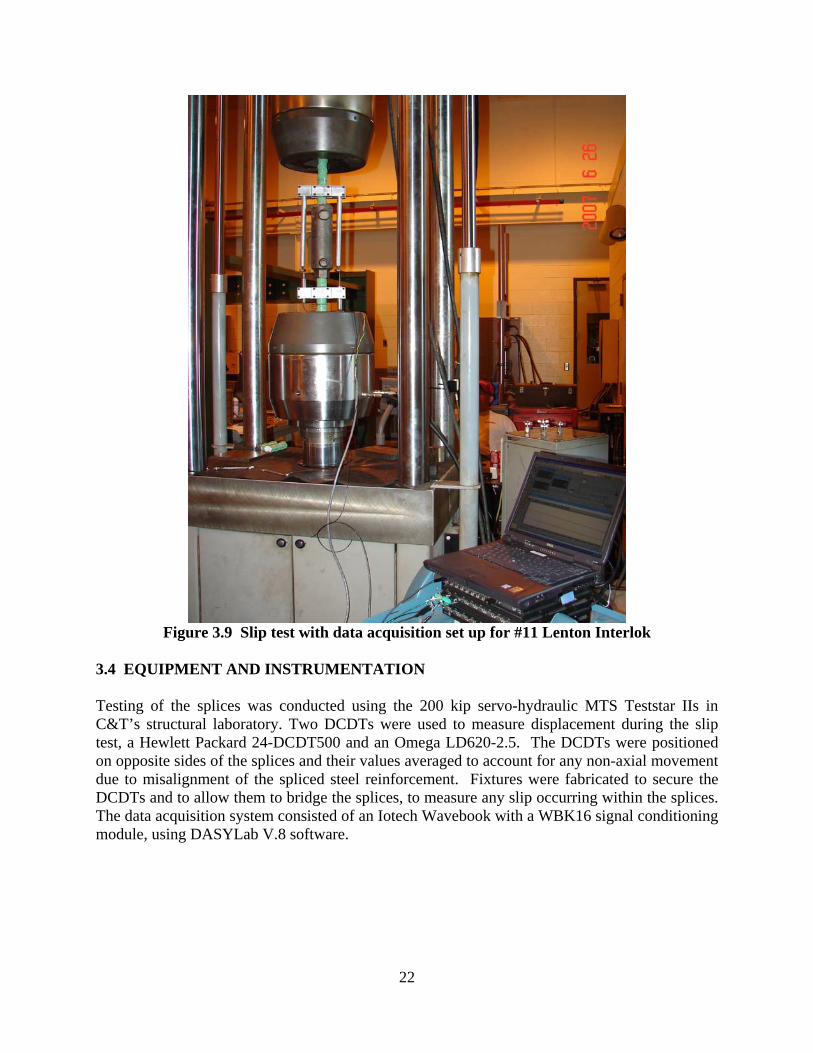
Figure 3.9 Slip test with data acquisition set up for #11 Lenton Interlok
3.4 EQUIPMENT AND INSTRUMENTATION Testing of the splices was conducted using the 200 kip servo-hydraulic MTS Teststar IIs in C&T’s structural laboratory. Two DCDTs were used to measure displacement during the slip test, a Hewlett Packard 24-DCDT500 and an Omega LD620-2.5. The DCDTs were positioned on opposite sides of the splices and their values averaged to account for any non-axial movement due to misalignment of the spliced steel reinforcement. Fixtures were fabricated to secure the DCDTs and to allow them to bridge the splices, to measure any slip occurring within the splices. The data acquisition system consisted of an Iotech Wavebook with a WBK16 signal conditioning module, using DASYLab V.8 software.

23
4. EXPERIMENTAL RESULTS FOR THE LENTON INTERLOK SPLICE 4.1 OVERVIEW This chapter presents the test results of the Lenton Interlok splice for slip testing, fatigue loading and ultimate loading. Table 4.1 summarizes the test results.
Table 4.1 Test results for the Lenton Interlok Splice (fatigue test pass = 1,000,000 cycles)
Slip (in) Fatigue
Test Post Fatigue
Slip (in) Ultimate Load
(kips) % Fy Specimen 6AI 0.004 pass 0.002 45.7 173 Specimen 6BI 0.003 pass 0.002 42.4 161 Specimen 6CI 0.005 pass 0.003 45.7 173 Average 0.004 0.002 44.6 169
Slip (in) Fatigue
Test Post Fatigue
Slip (in) Ultimate Load
(kips) % Fy Specimen 11AI 0.006 pass 0.005 115.6 124 Specimen 11BI 0.006 pass 0.003 144.9 155 Specimen 11CI 0.003 pass 0.004 154.2 165 Average 0.005 0.004 138.2 148
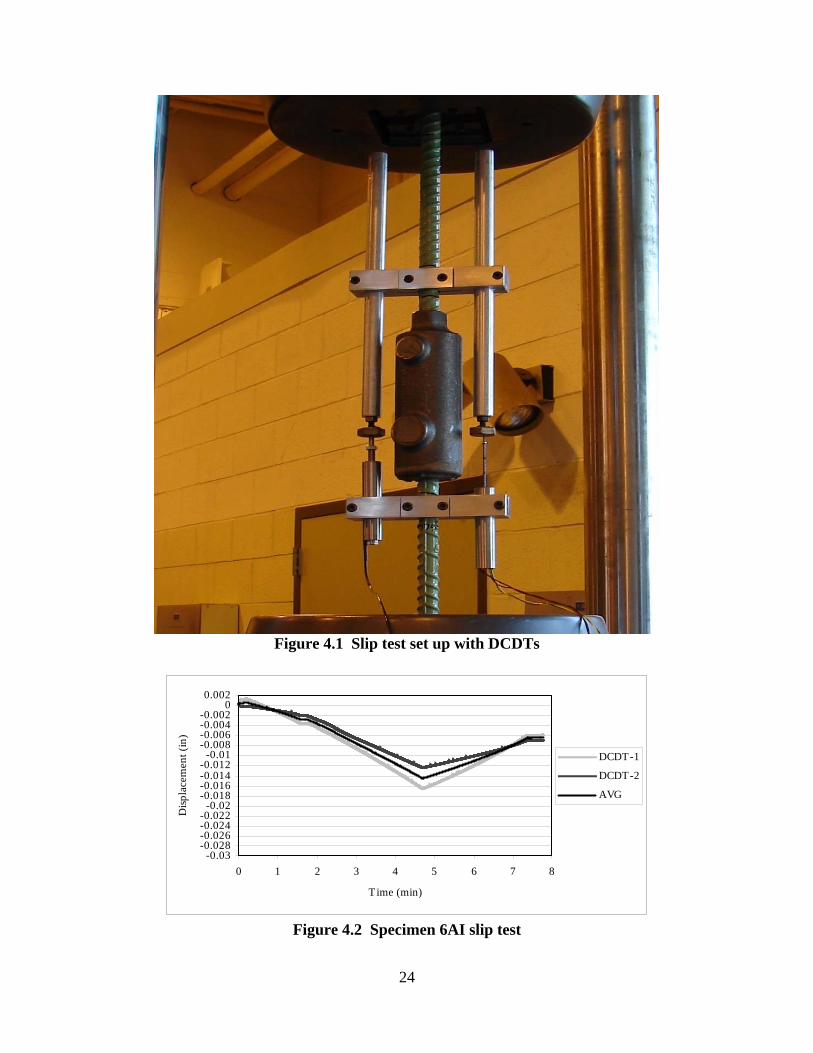
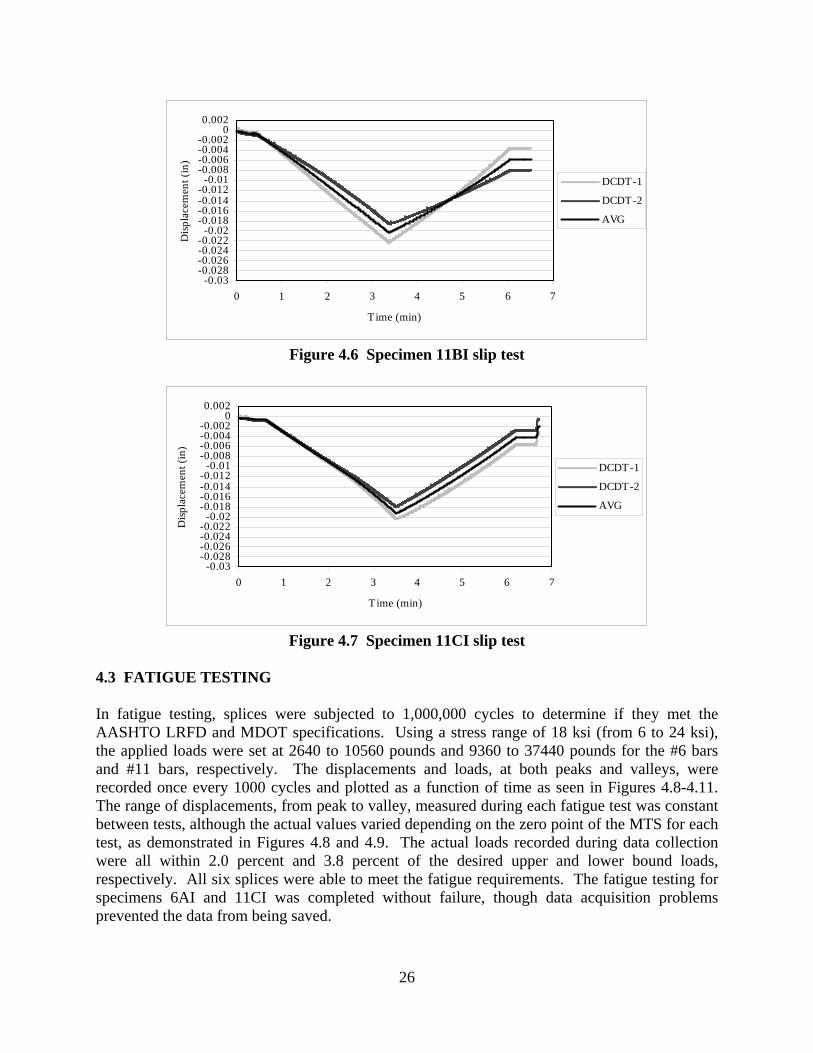
4.2 SLIP TESTING All six specimens conformed to the slip criteria specified in AASHTO LRFD, less than or equal to 0.010 inch of displacement measured after being loaded to 30 ksi and then relaxed to 3 ksi. The slip measured for the #6 bars ranged from 0.003 inch to 0.005 inch and averaged 0.004 inch. The slip measured for the #11 bars ranged from 0.003 inch to 0.006 inch and averaged 0.005 inch. A close-up of the test set up can be seen in Figure 4.1. Figures 4.2-4.7 show graphs of the displacement as a function of time during the slip tests. The measurements of interest, or the reported values of the slip tests, can be seen in the graphs as the horizontal portions of the average readings in the six to eight minute range, when the specimens were unloaded to 3 ksi. Regarding sign convention in Figures 4.2-4.7, negative values indicate tension.
24
Figure 4.1 Slip test set up with DCDTs
-0.03-0.028-0.026-0.024-0.022
-0.02-0.018-0.016-0.014-0.012
-0.01-0.008-0.006-0.004-0.002
00.002
0 1 2 3 4 5 6 7 8
Time (min)
Disp
lace
men
t (in
)
DCDT-1
DCDT-2
AVG
Figure 4.2 Specimen 6AI slip test

25
-0.03-0.028-0.026-0.024-0.022
-0.02-0.018-0.016-0.014-0.012
-0.01-0.008-0.006-0.004-0.002
00.002
0 1 2 3 4 5 6 7
Time (min)
Disp
lace
men
t (in
)DCDT-1
DCDT-2
AVG
Figure 4.3 Specimen 6BI slip test
-0.03-0.028-0.026-0.024-0.022
-0.02-0.018-0.016-0.014-0.012
-0.01-0.008-0.006-0.004-0.002
00.002
0 1 2 3 4 5 6 7
Time (min)
Disp
lace
men
t (in
)
DCDT-1
DCDT-2
AVG
Figure 4.4 Specimen 6CI slip test
-0.03-0.028-0.026-0.024-0.022
-0.02-0.018-0.016-0.014-0.012
-0.01-0.008-0.006-0.004-0.002
00.002
0 1 2 3 4 5 6 7
Time (min)
Disp
lace
men
t (in
)
DCDT-1
DCDT-2
AVG
Figure 4.5 Specimen 11AI slip test
26
-0.03-0.028-0.026-0.024-0.022
-0.02-0.018-0.016-0.014-0.012
-0.01-0.008-0.006-0.004-0.002
00.002
0 1 2 3 4 5 6 7
Time (min)
Disp
lace
men
t (in
)DCDT-1
DCDT-2
AVG
Figure 4.6 Specimen 11BI slip test
-0.03-0.028-0.026-0.024-0.022
-0.02-0.018-0.016-0.014-0.012
-0.01-0.008-0.006-0.004-0.002
00.002
0 1 2 3 4 5 6 7
Time (min)
Disp
lace
men
t (in
)
DCDT-1
DCDT-2
AVG
Figure 4.7 Specimen 11CI slip test
4.3 FATIGUE TESTING In fatigue testing, splices were subjected to 1,000,000 cycles to determine if they met the AASHTO LRFD and MDOT specifications. Using a stress range of 18 ksi (from 6 to 24 ksi), the applied loads were set at 2640 to 10560 pounds and 9360 to 37440 pounds for the #6 bars and #11 bars, respectively. The displacements and loads, at both peaks and valleys, were recorded once every 1000 cycles and plotted as a function of time as seen in Figures 4.8-4.11. The range of displacements, from peak to valley, measured during each fatigue test was constant between tests, although the actual values varied depending on the zero point of the MTS for each test, as demonstrated in Figures 4.8 and 4.9. The actual loads recorded during data collection were all within 2.0 percent and 3.8 percent of the desired upper and lower bound loads, respectively. All six splices were able to meet the fatigue requirements. The fatigue testing for specimens 6AI and 11CI was completed without failure, though data acquisition problems prevented the data from being saved.

27
0.01
0.1
1
10
100
1000
10000
100000
0 200000 400000 600000 800000 1000000
No. of Cycles
Load
(lb)
00.020.040.060.080.10.120.140.160.180.2
Disp
lace
men
t (in
)
Load Displacement
Figure 4.8 Specimen 6BI fatigue test
0.01
0.1
1
10
100
1000
10000
100000
0 200000 400000 600000 800000 1000000
No. of Cycles
Load
(lb)
0
0.05
0.1
0.15
0.2
0.25
0.3
0.35
0.4
Disp
lace
men
t (in
)
Load Displacement
Figure 4.9 Specimen 6CI fatigue test
0.01
0.1
1
10
100
1000
10000
100000
0 200000 400000 600000 800000 1000000
No. of Cycles
Load
(lb)
00.020.040.060.080.10.120.140.160.180.2
Disp
lace
men
t (in
)
Load Displacement
Figure 4.10 Specimen 11AI fatigue test
28
0.01
0.1
1
10
100
1000
10000
100000
0 200000 400000 600000 800000 1000000
No. of Cycles
Load
(lb)
00.020.040.060.080.10.120.140.160.180.2
Disp
lace
men
t (in
)
Load Displacement
Figure 4.11 Specimen 11BI fatigue test
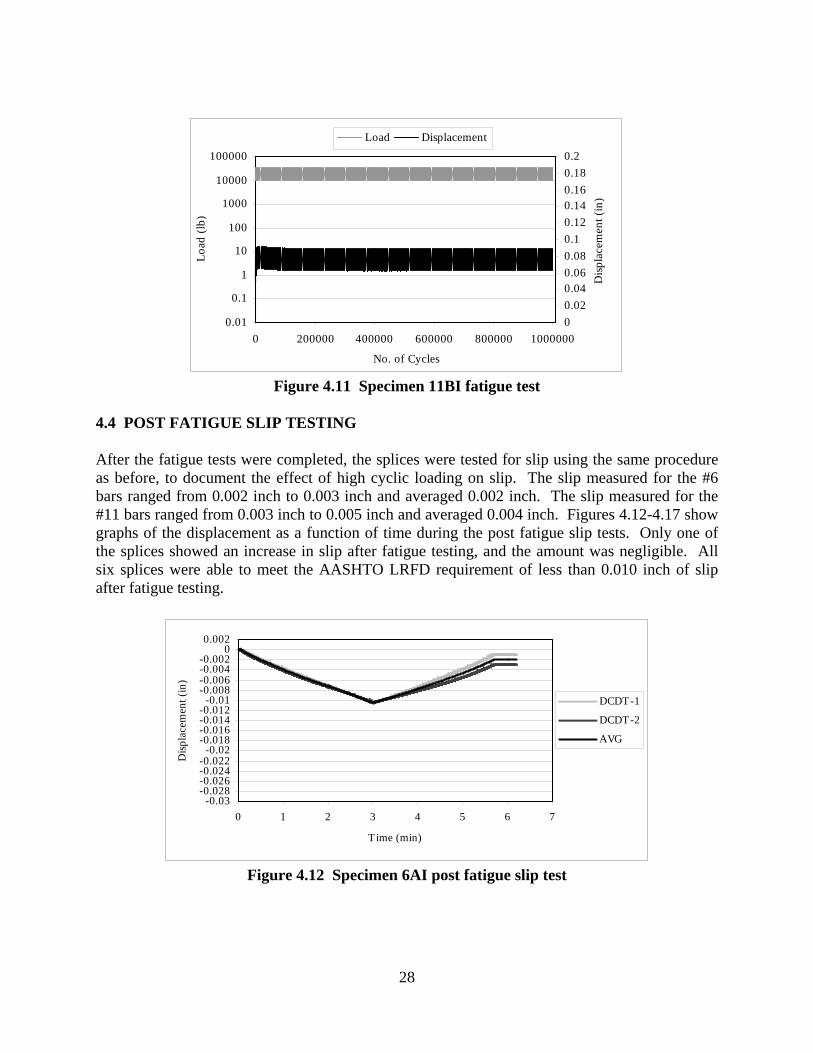
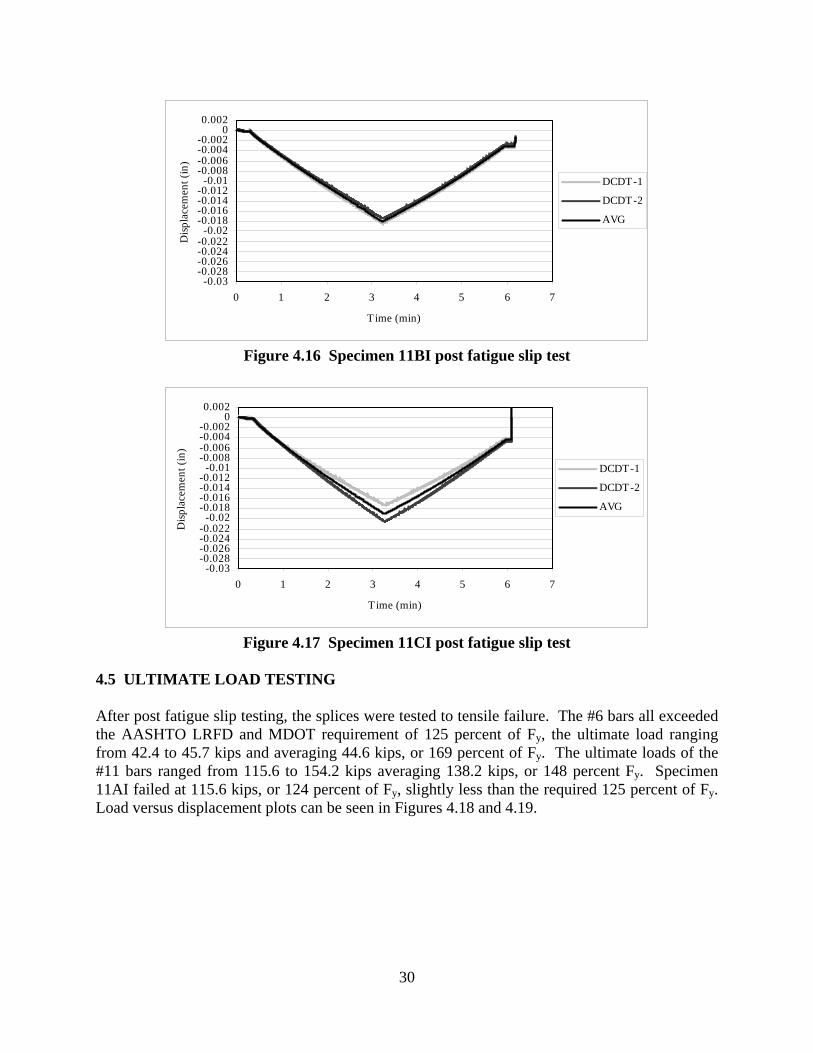
4.4 POST FATIGUE SLIP TESTING After the fatigue tests were completed, the splices were tested for slip using the same procedure as before, to document the effect of high cyclic loading on slip. The slip measured for the #6 bars ranged from 0.002 inch to 0.003 inch and averaged 0.002 inch. The slip measured for the #11 bars ranged from 0.003 inch to 0.005 inch and averaged 0.004 inch. Figures 4.12-4.17 show graphs of the displacement as a function of time during the post fatigue slip tests. Only one of the splices showed an increase in slip after fatigue testing, and the amount was negligible. All six splices were able to meet the AASHTO LRFD requirement of less than 0.010 inch of slip after fatigue testing.
-0.03-0.028-0.026-0.024-0.022
-0.02-0.018-0.016-0.014-0.012
-0.01-0.008-0.006-0.004-0.002
00.002
0 1 2 3 4 5 6 7
Time (min)
Disp
lace
men
t (in
)
DCDT-1
DCDT-2
AVG
Figure 4.12 Specimen 6AI post fatigue slip test

29
-0.03-0.028-0.026-0.024-0.022
-0.02-0.018-0.016-0.014-0.012
-0.01-0.008-0.006-0.004-0.002
00.002
0 1 2 3 4 5 6 7
Time (min)
Disp
lace
men
t (in
)DCDT-1
DCDT-2
AVG
Figure 4.13 Specimen 6BI post fatigue slip test
-0.03-0.028-0.026-0.024-0.022
-0.02-0.018-0.016-0.014-0.012
-0.01-0.008-0.006-0.004-0.002
00.002
0 1 2 3 4 5 6 7
Time (min)
Disp
lace
men
t (in
)
DCDT-1
DCDT-2
AVG
Figure 4.14 Specimen 6CI post fatigue slip test
-0.03-0.028-0.026-0.024-0.022
-0.02-0.018-0.016-0.014-0.012
-0.01-0.008-0.006-0.004-0.002
00.002
0 1 2 3 4 5 6 7
Time (min)
Disp
lace
men
t (in
)
DCDT-1
DCDT-2
AVG
Figure 4.15 Specimen 11AI post fatigue slip test
30
-0.03-0.028-0.026-0.024-0.022
-0.02-0.018-0.016-0.014-0.012
-0.01-0.008-0.006-0.004-0.002
00.002
0 1 2 3 4 5 6 7
Time (min)
Disp
lace
men
t (in
)DCDT-1
DCDT-2
AVG
Figure 4.16 Specimen 11BI post fatigue slip test
-0.03-0.028-0.026-0.024-0.022
-0.02-0.018-0.016-0.014-0.012
-0.01-0.008-0.006-0.004-0.002
00.002
0 1 2 3 4 5 6 7
Time (min)
Disp
lace
men
t (in
)
DCDT-1
DCDT-2
AVG
Figure 4.17 Specimen 11CI post fatigue slip test
4.5 ULTIMATE LOAD TESTING After post fatigue slip testing, the splices were tested to tensile failure. The #6 bars all exceeded the AASHTO LRFD and MDOT requirement of 125 percent of Fy, the ultimate load ranging from 42.4 to 45.7 kips and averaging 44.6 kips, or 169 percent of Fy. The ultimate loads of the #11 bars ranged from 115.6 to 154.2 kips averaging 138.2 kips, or 148 percent Fy. Specimen 11AI failed at 115.6 kips, or 124 percent of Fy, slightly less than the required 125 percent of Fy. Load versus displacement plots can be seen in Figures 4.18 and 4.19.

31
05000
100001500020000250003000035000400004500050000
0.00 0.20 0.40 0.60 0.80 1.00 1.20 1.40 1.60 1.80 2.00
Displacement (in)
Load
(lb) 6AI
6BI
6CI
Figure 4.18 Load versus Displacement for specimens 6AI, 6BI, 6CI
02000040000
6000080000
100000
120000140000160000
180000
0.00 0.20 0.40 0.60 0.80 1.00 1.20 1.40 1.60 1.80 2.00
Displacement (in)
Load
(lb) 11AI
11BI
11CI
Figure 4.19 Load versus Displacement for specimens 11AI, 11BI, 11CI
Specimens 6AI, 6BI, and 6CI exhibited the same failure mode, bar fracture at the threads accompanied by a small amount of spalling at the grouted connection, as demonstrated by specimen 6CI in Figures 4.20 and 4.21. Displacement of the grouted bar was evident during ultimate load testing but was not instrumented due to the risk of damage to instrumentation during failure. Although displacement of the grips was measured by the MTS system, it was not possible to differentiate between displacement of the connection via bond failure and displacement due to elongation of the bar. Displacement of the connection was visually estimated at 0.25 to 0.5 inch. The #11 splices exhibited two different failure modes. Specimen 11AI fractured at the threads similar to the #6 splices, but the threads failed in shear for specimens 11BI and 11CI. Similar to the #6 splices, the failure of the threaded bars was accompanied by a small amount of spalling at

32
the grouted connection. Photographs of the failed #11 splices can be seen in Figures 4.22 through 4.25.
Figure 4.20 Bar fracture of specimen 6CI
Figure 4.21 Spalling of specimen 6CI (typical of 6AI and 6BI)
33
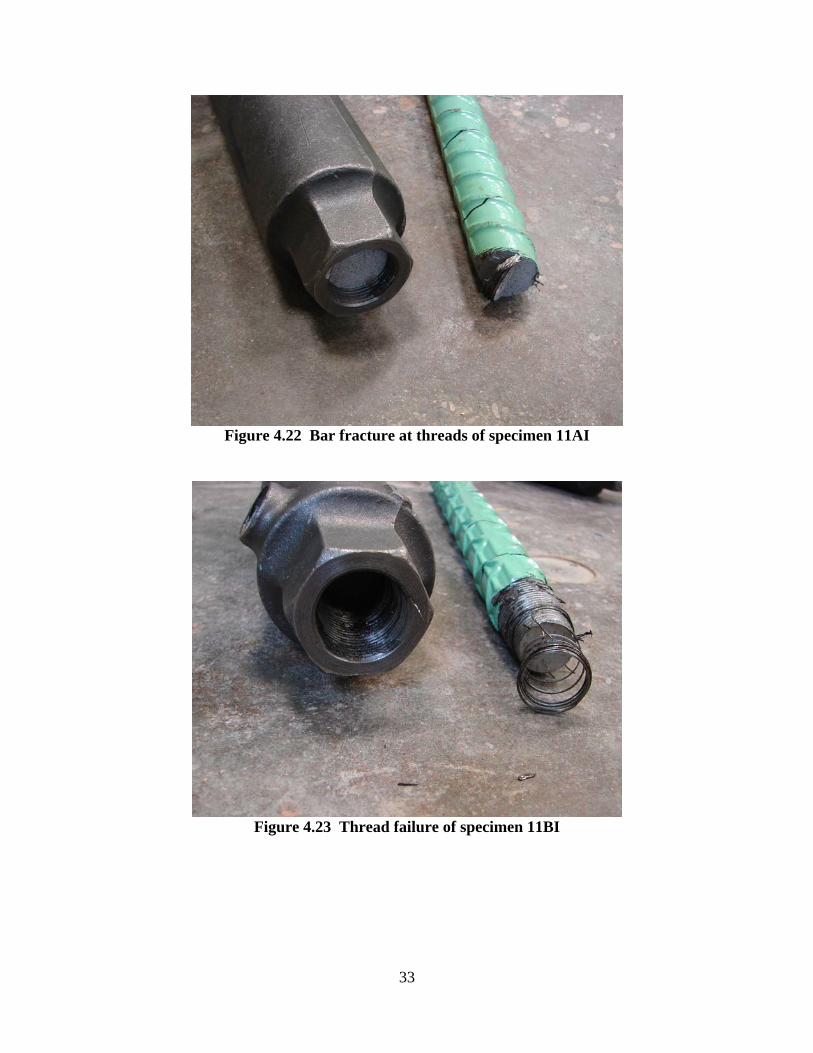
Figure 4.22 Bar fracture at threads of specimen 11AI
Figure 4.23 Thread failure of specimen 11BI

34
Figure 4.24 Thread failure of specimen 11CI
Figure 4.25 Spalling of specimen 11CI (typical of 11AI and 11BI)
Upon further inspection of Specimen 11AI, a defect was found on the fracture surface which likely explains the lower than expected tensile strength when compared to 11BI, 11CI, and the independent test data. The defect can be seen on the left side of Figure 4.26, and was the likely origin of fracture, which is supported by the visible striations seen emanating from the defect. Therefore, the lower than expected ultimate load for Specimen 11AI is most likely due to the defect in the steel reinforcement and not substandard performance of the spliced connection.

35
Figure 4.26 Fracture surface close up of Specimen 11AI
(note defect at left – 6X magnification) 4.6 SUMMARY AND OBSERVATIONS The fabrication and assembly of the Lenton Interlok specimens was relatively simple and straightforward; the only concern being that the working time of the grout was less than the time indicated on the packaging. The specimens performed very well in testing. The average slip was 0.004 inch and 0.005 inch for the #6 splices and #11 splices, respectively, meeting the AASHTO LRFD requirement of 0.010 inch. Post-fatigue slip testing indicated that the fatigue cycling had little or no effect on the slip of the splices. Fatigue testing demonstrated that the splices were able to withstand at least 1,000,000 cycles with a stress range of 18 ksi, as specified by AASHTO LRFD. Although the actual fatigue life is unknown beyond 1,000,000 cycles, it was decided not to extend fatigue testing to failure in order to preserve the samples for post-fatigue slip testing and ultimate load testing. In ultimate load testing all specimens except for 11AI exceeded the AASHTO LRFD and MDOT requirement of 125 percent Fy, and specimen 11AI likely failed at a lower load because of a defect in the reinforcing steel. If the test results for specimen 11AI are not considered, the average ultimate strengths were 169 percent Fy and 160 percent Fy for the #6 splices and the #11 splices, respectively. All specimens with the exception of 11AI also exceeded the 100 percent Ft requirement for Type 2 splices as specified in ACI 318 and ICC AC133. The threaded connections were found to be the common failure location for all splices tested, either due to fracture of the bar at the reduced threaded section or by shear failure of the threads themselves. However, neither the fatigue nor ultimate load capacities appeared to be significantly decreased by the threaded connection.
36
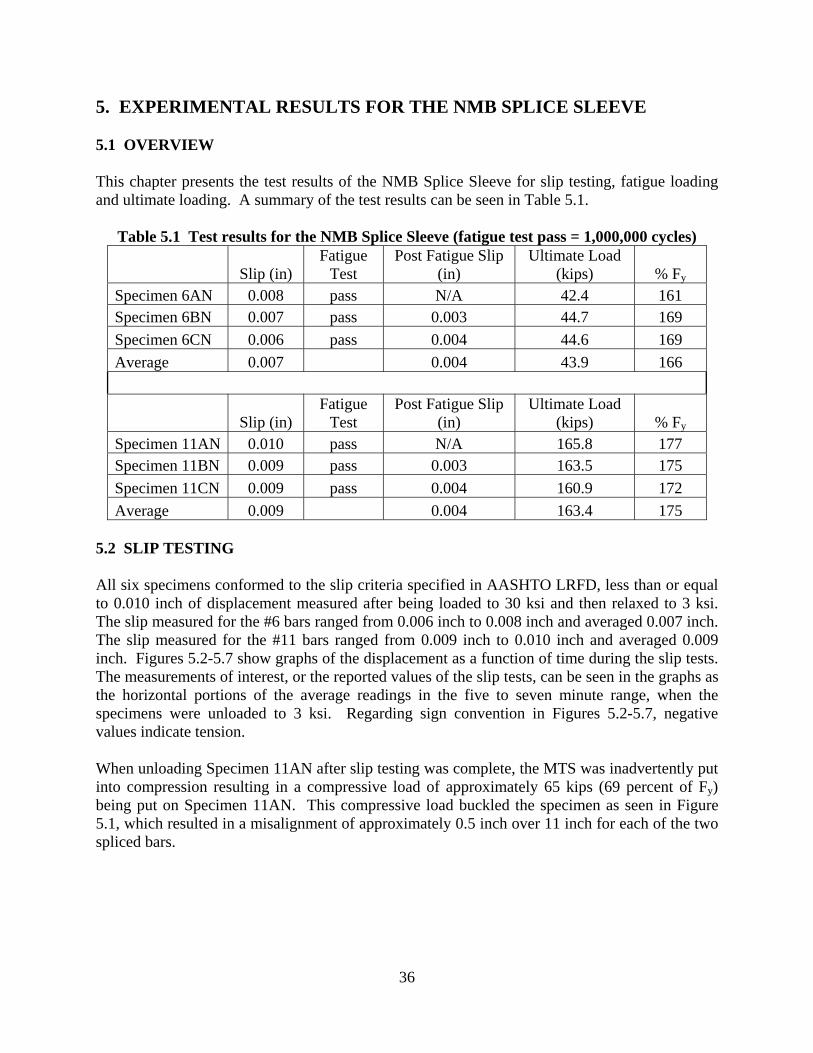
5. EXPERIMENTAL RESULTS FOR THE NMB SPLICE SLEEVE 5.1 OVERVIEW This chapter presents the test results of the NMB Splice Sleeve for slip testing, fatigue loading and ultimate loading. A summary of the test results can be seen in Table 5.1.
Table 5.1 Test results for the NMB Splice Sleeve (fatigue test pass = 1,000,000 cycles)
Slip (in) Fatigue
Test Post Fatigue Slip
(in) Ultimate Load
(kips) % Fy Specimen 6AN 0.008 pass N/A 42.4 161 Specimen 6BN 0.007 pass 0.003 44.7 169 Specimen 6CN 0.006 pass 0.004 44.6 169 Average 0.007 0.004 43.9 166
Slip (in) Fatigue
Test Post Fatigue Slip
(in) Ultimate Load
(kips) % Fy Specimen 11AN 0.010 pass N/A 165.8 177 Specimen 11BN 0.009 pass 0.003 163.5 175 Specimen 11CN 0.009 pass 0.004 160.9 172 Average 0.009 0.004 163.4 175
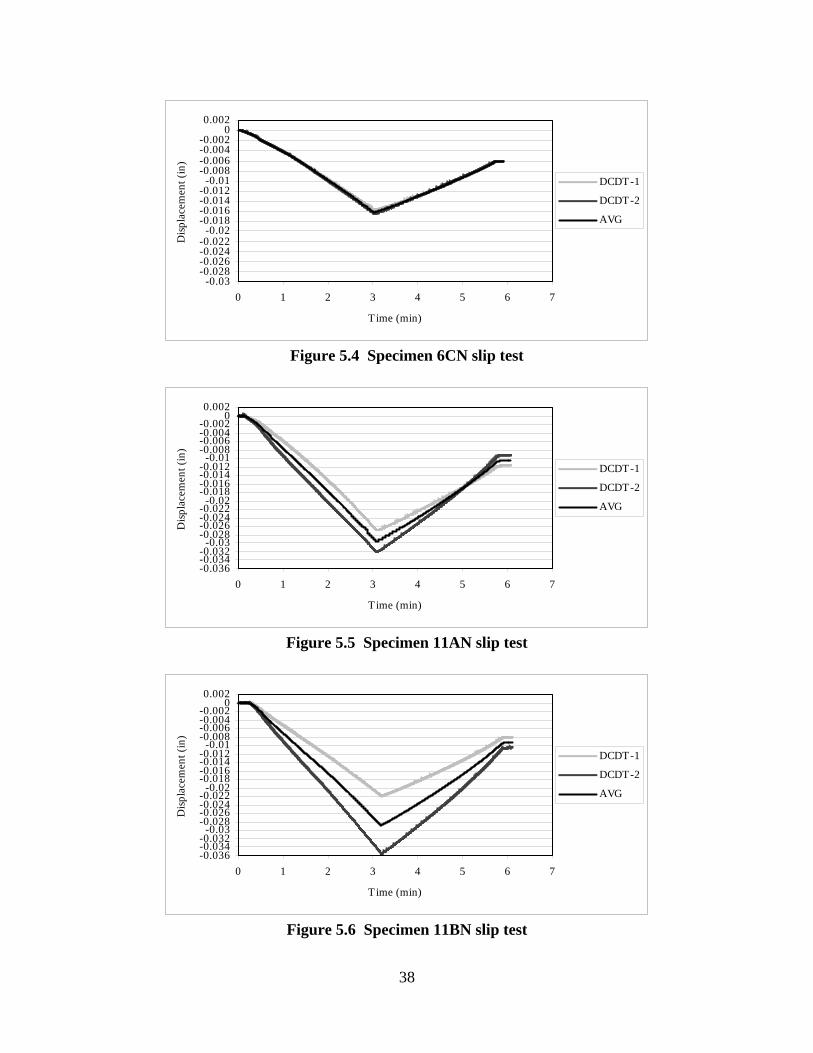
5.2 SLIP TESTING All six specimens conformed to the slip criteria specified in AASHTO LRFD, less than or equal to 0.010 inch of displacement measured after being loaded to 30 ksi and then relaxed to 3 ksi. The slip measured for the #6 bars ranged from 0.006 inch to 0.008 inch and averaged 0.007 inch. The slip measured for the #11 bars ranged from 0.009 inch to 0.010 inch and averaged 0.009 inch. Figures 5.2-5.7 show graphs of the displacement as a function of time during the slip tests. The measurements of interest, or the reported values of the slip tests, can be seen in the graphs as the horizontal portions of the average readings in the five to seven minute range, when the specimens were unloaded to 3 ksi. Regarding sign convention in Figures 5.2-5.7, negative values indicate tension. When unloading Specimen 11AN after slip testing was complete, the MTS was inadvertently put into compression resulting in a compressive load of approximately 65 kips (69 percent of Fy) being put on Specimen 11AN. This compressive load buckled the specimen as seen in Figure 5.1, which resulted in a misalignment of approximately 0.5 inch over 11 inch for each of the two spliced bars.
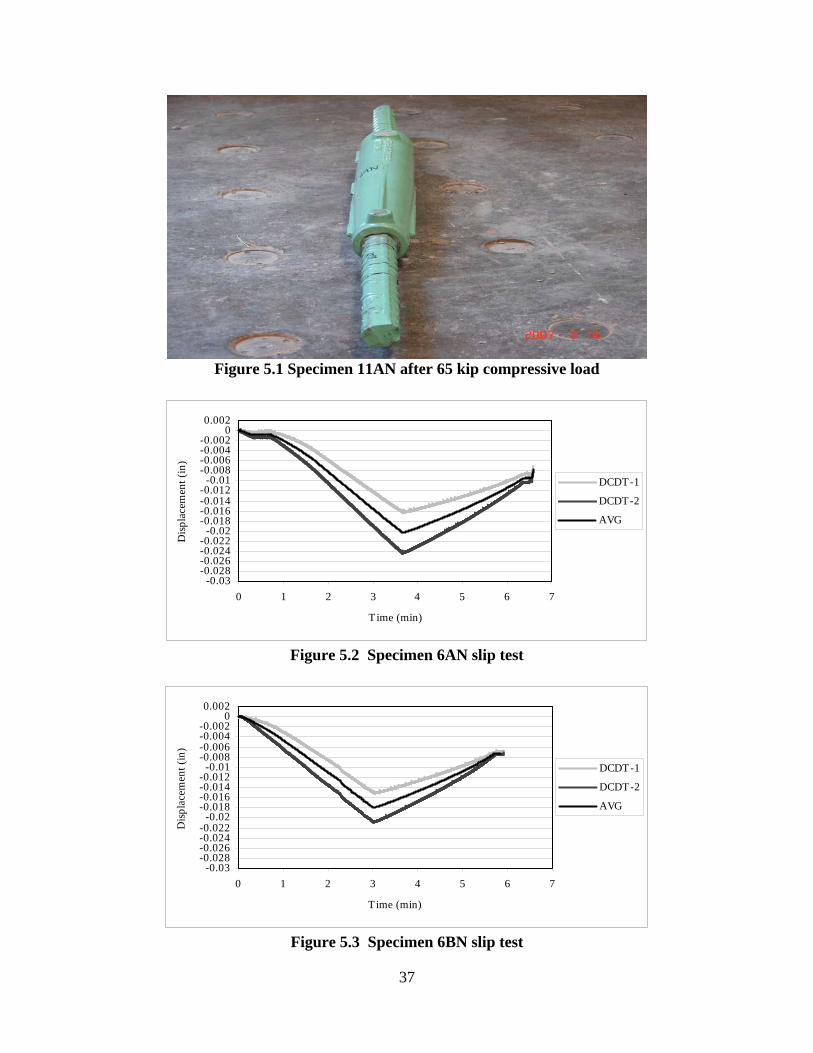
37
Figure 5.1 Specimen 11AN after 65 kip compressive load
-0.03-0.028-0.026-0.024-0.022
-0.02-0.018-0.016-0.014-0.012
-0.01-0.008-0.006-0.004-0.002
00.002
0 1 2 3 4 5 6 7
Time (min)
Disp
lace
men
t (in
)
DCDT-1
DCDT-2
AVG
Figure 5.2 Specimen 6AN slip test
-0.03-0.028-0.026-0.024-0.022
-0.02-0.018-0.016-0.014-0.012
-0.01-0.008-0.006-0.004-0.002
00.002
0 1 2 3 4 5 6 7
Time (min)
Disp
lace
men
t (in
)
DCDT-1
DCDT-2
AVG
Figure 5.3 Specimen 6BN slip test
38
-0.03-0.028-0.026-0.024-0.022
-0.02-0.018-0.016-0.014-0.012
-0.01-0.008-0.006-0.004-0.002
00.002
0 1 2 3 4 5 6 7
Time (min)
Disp
lace
men
t (in
)DCDT-1
DCDT-2
AVG
Figure 5.4 Specimen 6CN slip test
-0.036-0.034-0.032
-0.03-0.028-0.026-0.024-0.022
-0.02-0.018-0.016-0.014-0.012
-0.01-0.008-0.006-0.004-0.002
00.002
0 1 2 3 4 5 6 7
Time (min)
Disp
lace
men
t (in
)
DCDT-1
DCDT-2
AVG
Figure 5.5 Specimen 11AN slip test
-0.036-0.034-0.032
-0.03-0.028-0.026-0.024-0.022
-0.02-0.018-0.016-0.014-0.012
-0.01-0.008-0.006-0.004-0.002
00.002
0 1 2 3 4 5 6 7
Time (min)
Disp
lace
men
t (in
)
DCDT-1
DCDT-2
AVG
Figure 5.6 Specimen 11BN slip test

39
-0.036-0.034-0.032
-0.03-0.028-0.026-0.024-0.022
-0.02-0.018-0.016-0.014-0.012
-0.01-0.008-0.006-0.004-0.002
00.002
0 1 2 3 4 5 6 7
Time (min)
Disp
lace
men
t (in
)DCDT-1
DCDT-2
AVG
Figure 5.7 Specimen 11CN slip test
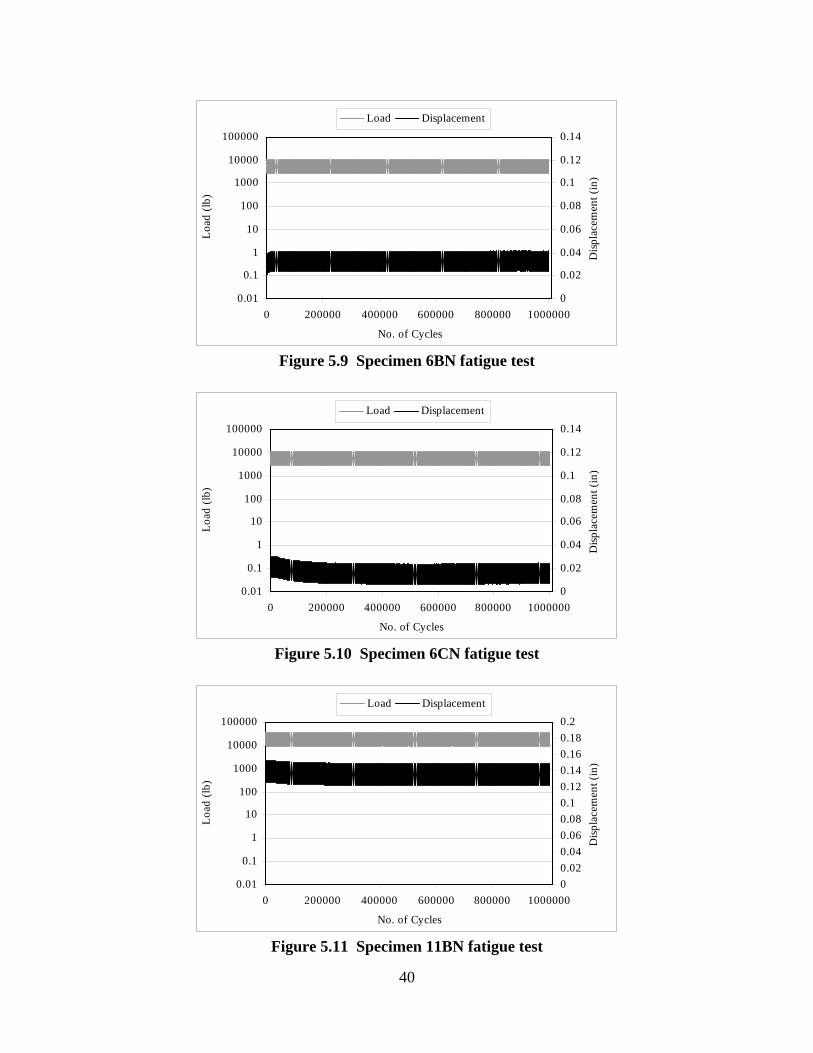
5.3 FATIGUE TESTING In fatigue testing, the splices were subjected to 1,000,000 cycles to determine if they met the AASHTO LRFD and MDOT specifications. Using a stress range of 18 ksi (from 6 to 24 ksi), the applied loads were set at 2640 to 10560 pounds and 9360 to 37440 pounds for the #6 bars and #11 bars, respectively. The displacements and loads, at both peaks and valleys, were recorded once every 1000 cycles and plotted as a function of time as seen in Figures 5.8-5.12. The range of displacements, from peak to valley, measured during each fatigue test was constant between tests, although the actual values varied depending on the zero point of the MTS for each test, as demonstrated in Figures 5.8 and 5.9. The actual loads recorded during data collection were all within 1.6 percent and 3.4 percent of the desired upper and lower bound loads, respectively. All six splices were able to meet the fatigue requirements. Specimen 11AN, which was slightly buckled during the slip test, as seen in Figure 5.1, was not tested for fatigue to assure that premature failure during a fatigue test would not prevent an ultimate load test from being performed.
0.01
0.1
1
10
100
1000
10000
100000
0 200000 400000 600000 800000 1000000
No. of Cycles
Load
(lb)
0
0.02
0.04
0.06
0.08
0.1
0.12
0.14
Disp
lace
men
t (in
)
Load Displacement
Figure 5.8 Specimen 6AN fatigue test
40
0.01
0.1
1
10
100
1000
10000
100000
0 200000 400000 600000 800000 1000000
No. of Cycles
Load
(lb)
0
0.02
0.04
0.06
0.08
0.1
0.12
0.14
Disp
lace
men
t (in
)
Load Displacement
Figure 5.9 Specimen 6BN fatigue test
0.01
0.1
1
10
100
1000
10000
100000
0 200000 400000 600000 800000 1000000
No. of Cycles
Load
(lb)
0
0.02
0.04
0.06
0.08
0.1
0.12
0.14
Disp
lace
men
t (in
)
Load Displacement
Figure 5.10 Specimen 6CN fatigue test
0.01
0.1
1
10
100
1000
10000
100000
0 200000 400000 600000 800000 1000000
No. of Cycles
Load
(lb)
00.020.040.060.080.10.120.140.160.180.2
Disp
lace
men
t (in
)
Load Displacement
Figure 5.11 Specimen 11BN fatigue test

41
0.01
0.1
1
10
100
1000
10000
100000
0 200000 400000 600000 800000 1000000
No. of Cycles
Load
(lb)
00.020.040.060.080.10.120.140.160.180.2
Disp
lace
men
t (in
)
Load Displacement
Figure 5.12 Specimen 11CN fatigue test
5.4 POST FATIGUE SLIP TESTING After the fatigue tests were completed, the splices were tested for slip using the same procedure as before, to document the effect of high cyclic loading on slip. The slip measured for both the #6 and the #11 bars ranged from 0.003 inch to 0.004 inch. Figures 5.14-5.17 show graphs of the displacement as a function of time during the post fatigue slip tests. All six splices were able to meet the AASHTO LRFD requirement of no more than 0.010 inch of slip after fatigue testing. Specimen 6AN, which was inadvertently put into compression similar to specimen 11AN (Figure 5.1), and seen in Figure 5.13, was not tested along with 11AN for post fatigue slip in order to preserve it for ultimate load testing.
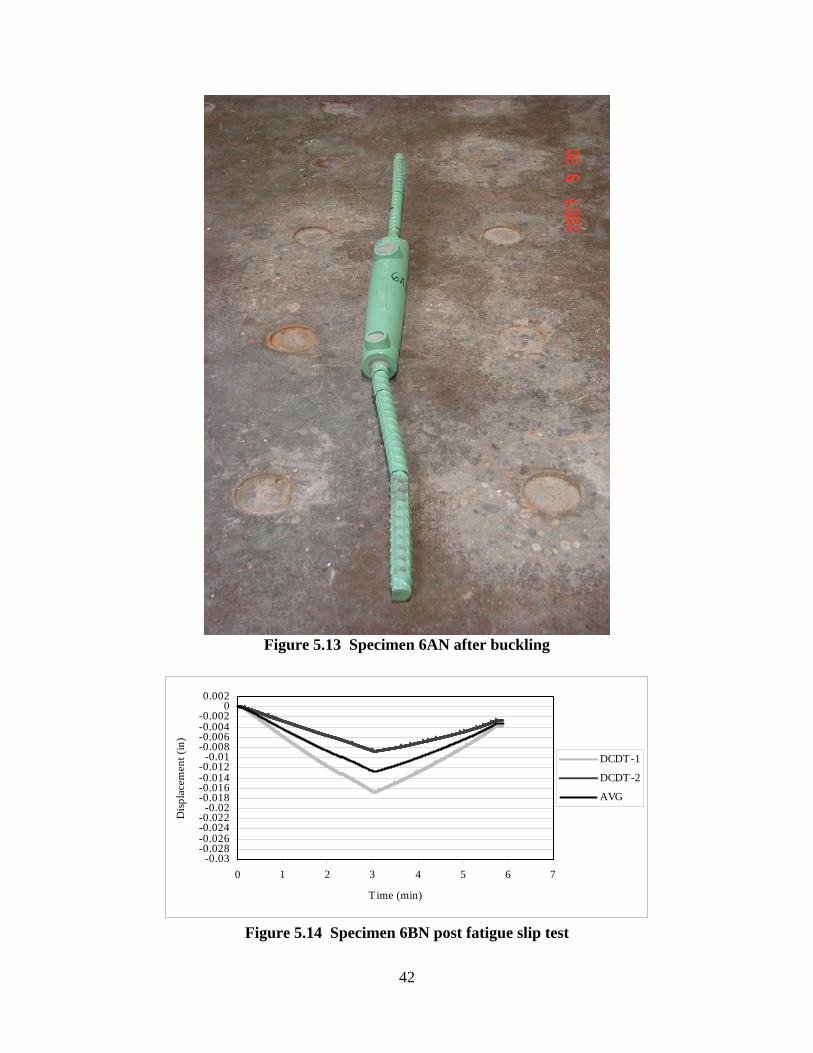
42
Figure 5.13 Specimen 6AN after buckling
-0.03-0.028-0.026-0.024-0.022
-0.02-0.018-0.016-0.014-0.012
-0.01-0.008-0.006-0.004-0.002
00.002
0 1 2 3 4 5 6 7
Time (min)
Disp
lace
men
t (in
)
DCDT-1
DCDT-2
AVG
Figure 5.14 Specimen 6BN post fatigue slip test

43
-0.03-0.028-0.026-0.024-0.022
-0.02-0.018-0.016-0.014-0.012
-0.01-0.008-0.006-0.004-0.002
00.002
0 1 2 3 4 5 6 7
Time (min)
Disp
lace
men
t (in
)DCDT-1
DCDT-2
AVG
Figure 5.15 Specimen 6CN post fatigue slip test
-0.036-0.034-0.032
-0.03-0.028-0.026-0.024-0.022
-0.02-0.018-0.016-0.014-0.012
-0.01-0.008-0.006-0.004-0.002
00.002
0 1 2 3 4 5 6 7
Time (min)
Disp
lace
men
t (in
)
DCDT-1
DCDT-2
AVG
Figure 5.16 Specimen 11BN post fatigue slip test
-0.036-0.034-0.032
-0.03-0.028-0.026-0.024-0.022
-0.02-0.018-0.016-0.014-0.012
-0.01-0.008-0.006-0.004-0.002
00.002
0 1 2 3 4 5 6 7
Time (min)
Disp
lace
men
t (in
)
DCDT-1
DCDT-2
AVG
Figure 5.17 Specimen 11CN post fatigue slip test
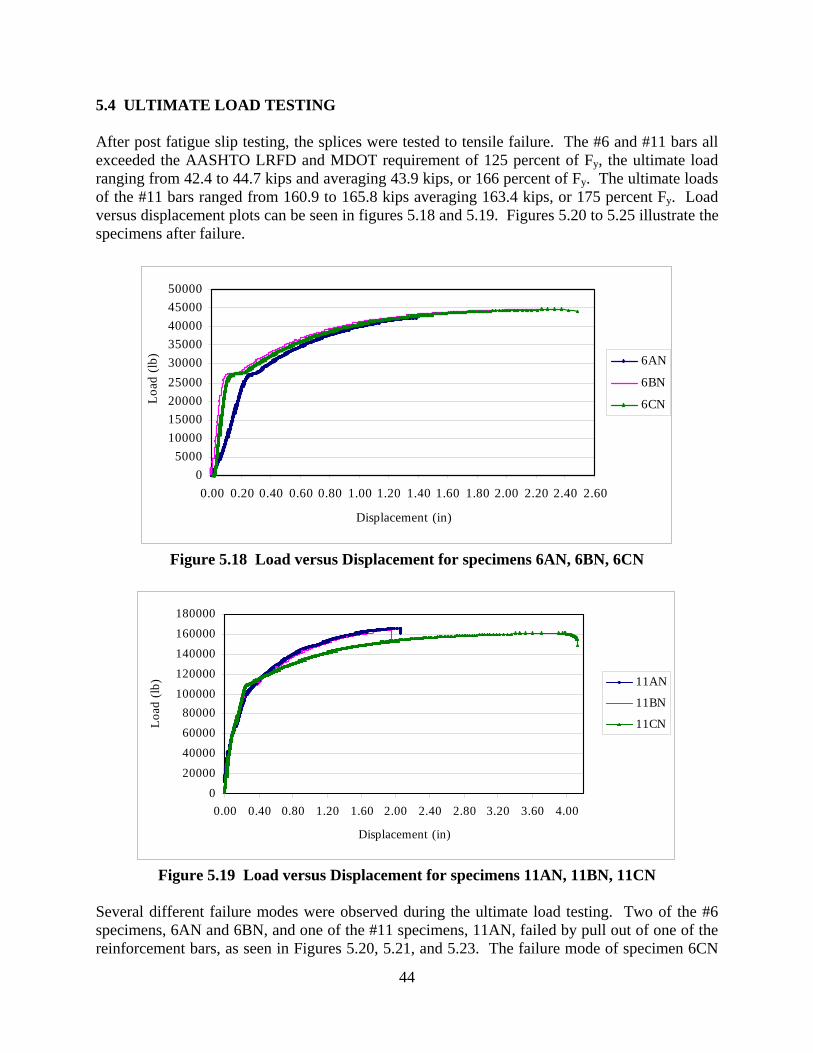
44
5.4 ULTIMATE LOAD TESTING After post fatigue slip testing, the splices were tested to tensile failure. The #6 and #11 bars all exceeded the AASHTO LRFD and MDOT requirement of 125 percent of Fy, the ultimate load ranging from 42.4 to 44.7 kips and averaging 43.9 kips, or 166 percent of Fy. The ultimate loads of the #11 bars ranged from 160.9 to 165.8 kips averaging 163.4 kips, or 175 percent Fy. Load versus displacement plots can be seen in figures 5.18 and 5.19. Figures 5.20 to 5.25 illustrate the specimens after failure.
05000
100001500020000250003000035000400004500050000
0.00 0.20 0.40 0.60 0.80 1.00 1.20 1.40 1.60 1.80 2.00 2.20 2.40 2.60
Displacement (in)
Load
(lb) 6AN
6BN
6CN
Figure 5.18 Load versus Displacement for specimens 6AN, 6BN, 6CN
020000400006000080000
100000120000140000160000180000
0.00 0.40 0.80 1.20 1.60 2.00 2.40 2.80 3.20 3.60 4.00
Displacement (in)
Load
(lb) 11AN
11BN
11CN
Figure 5.19 Load versus Displacement for specimens 11AN, 11BN, 11CN
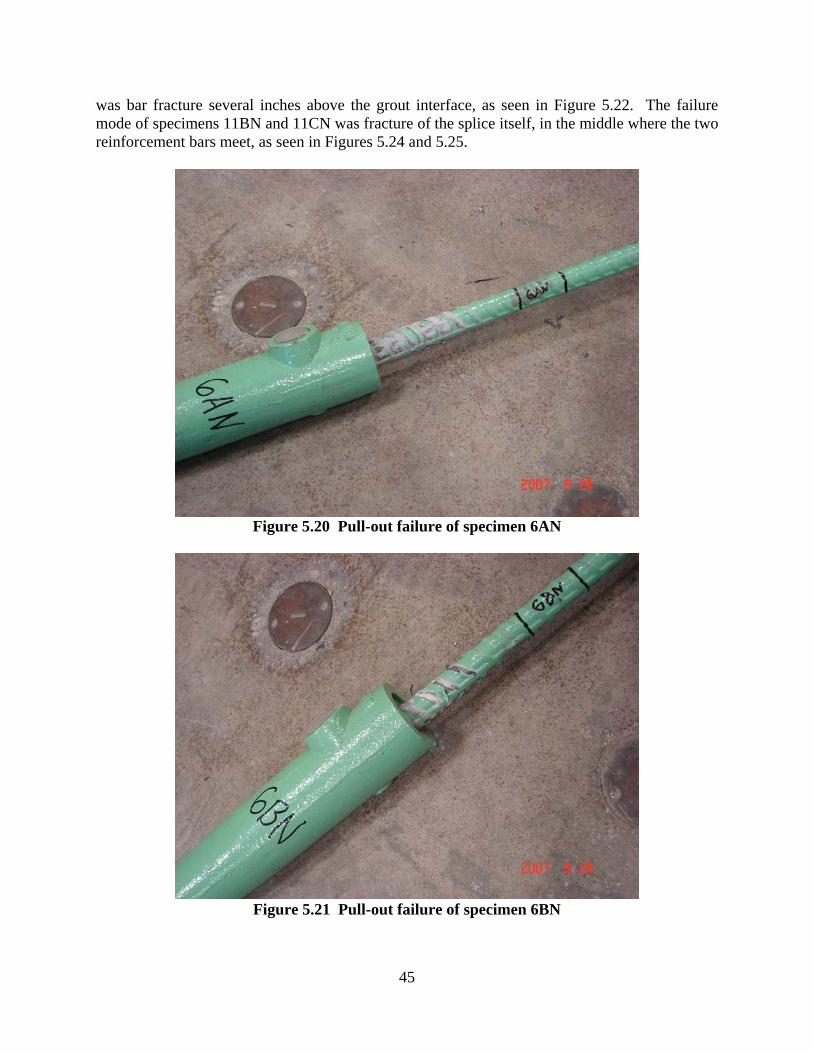
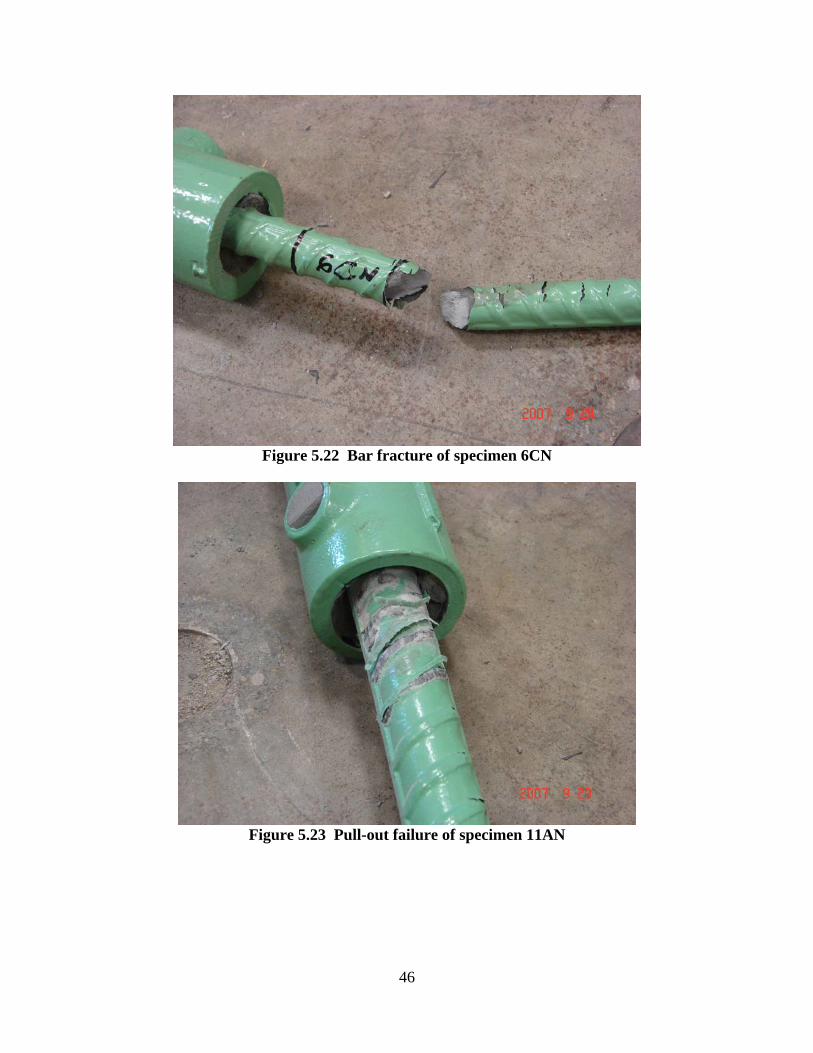
Several different failure modes were observed during the ultimate load testing. Two of the #6 specimens, 6AN and 6BN, and one of the #11 specimens, 11AN, failed by pull out of one of the reinforcement bars, as seen in Figures 5.20, 5.21, and 5.23. The failure mode of specimen 6CN
45
was bar fracture several inches above the grout interface, as seen in Figure 5.22. The failure mode of specimens 11BN and 11CN was fracture of the splice itself, in the middle where the two reinforcement bars meet, as seen in Figures 5.24 and 5.25.
Figure 5.20 Pull-out failure of specimen 6AN
Figure 5.21 Pull-out failure of specimen 6BN
46
Figure 5.22 Bar fracture of specimen 6CN
Figure 5.23 Pull-out failure of specimen 11AN

47
Figure 5.24 Splice fracture of specimen 11BN
Figure 5.25 Splice fracture of specimen 11CN
5.5 SUMMARY AND OBSERVATIONS The fabrication and assembly of the NMB Splice Sleeve specimens was relatively simple and straightforward. The working time of the grout is listed as 40 minutes at 70 degrees Fahrenheit, which was estimated to be the actual working time during fabrication of the test specimens. The

48
specimens performed very well in testing. The average slip was 0.007 inch and 0.009 inch for the #6 splices and #11 splices, respectively, meeting the AASHTO LRFD requirement of 0.010 inch. Fatigue testing demonstrated that the splices were able to withstand at least 1,000,000 cycles with a stress range of 18ksi, as specified by AASHTO LRFD. Although the actual fatigue life is unknown beyond 1,000,000 cycles, it was decided not to extend fatigue testing to failure in order to preserve the samples for post-fatigue slip testing and ultimate load testing. Post-fatigue slip testing indicated that the fatigue cycling had little or no effect on the slip of the splices. The post fatigue slip values actually reduced to averages of 0.004 inch for both the #6 and #11 bars. In ultimate load testing all specimens exceeded the AASHTO LRFD and MDOT requirement of 125 percent Fy. The average ultimate strengths were 166 percent Fy and 175 percent Fy for the #6 splices and the #11 splices, respectively. All specimens also exceeded the 100 percent Ft requirement for Type 2 splices as specified in ACI 318 and ICC AC133. Several different failure modes were observed but there was no discernable effect of the type of failure mode on the ultimate load of the splices.
49
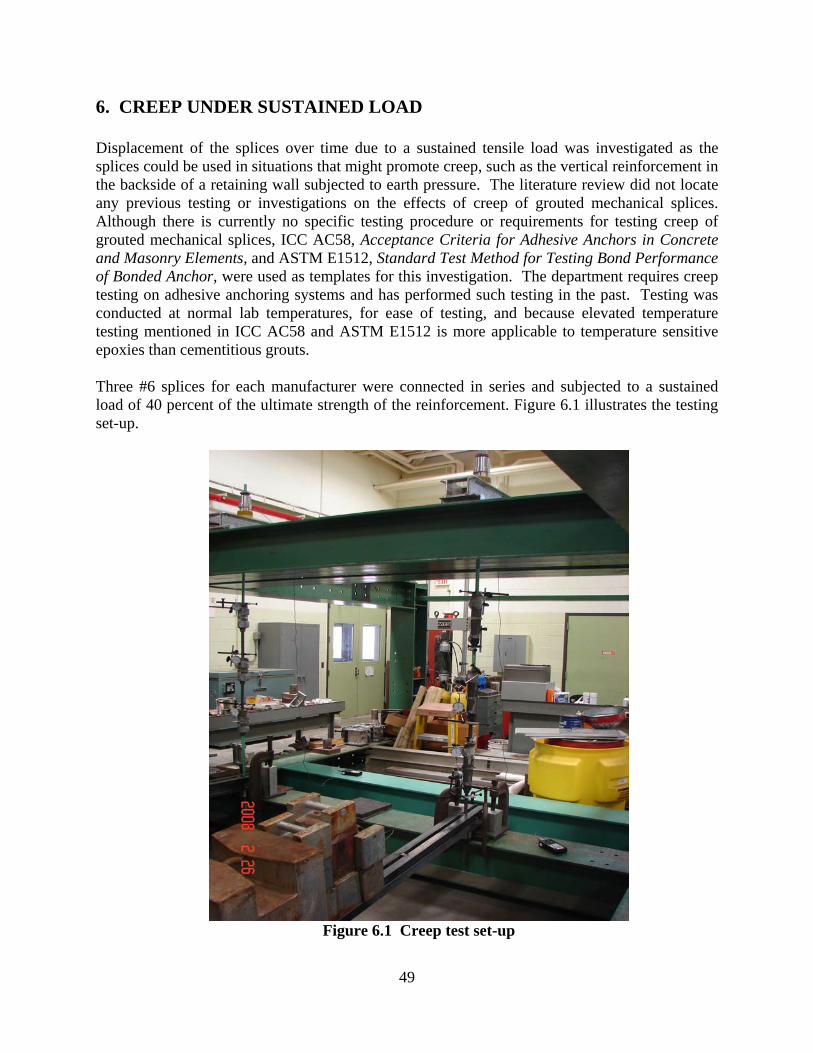
6. CREEP UNDER SUSTAINED LOAD Displacement of the splices over time due to a sustained tensile load was investigated as the splices could be used in situations that might promote creep, such as the vertical reinforcement in the backside of a retaining wall subjected to earth pressure. The literature review did not locate any previous testing or investigations on the effects of creep of grouted mechanical splices. Although there is currently no specific testing procedure or requirements for testing creep of grouted mechanical splices, ICC AC58, Acceptance Criteria for Adhesive Anchors in Concrete and Masonry Elements, and ASTM E1512, Standard Test Method for Testing Bond Performance of Bonded Anchor, were used as templates for this investigation. The department requires creep testing on adhesive anchoring systems and has performed such testing in the past. Testing was conducted at normal lab temperatures, for ease of testing, and because elevated temperature testing mentioned in ICC AC58 and ASTM E1512 is more applicable to temperature sensitive epoxies than cementitious grouts. Three #6 splices for each manufacturer were connected in series and subjected to a sustained load of 40 percent of the ultimate strength of the reinforcement. Figure 6.1 illustrates the testing set-up.
Figure 6.1 Creep test set-up
50
Plastic and hardened properties of the grout used in creep testing are seen in tables 6.1 and 6.2.
Table 6.1 Properties of HY10L Grout for Lenton Interlok splices
7-Day 28-Day Air Temp
(F) Grout Temp.
(F) Water (gal.
per bag) Spread
(in) Specimen 1 11,500 13,800 Specimen 2 10,900 13,930 Specimen 3 11,450 13,750 Average 11,283 13,827
71.4 88.3 0.687 5.69
Table 6.2 Properties of Nissco SS Mortar for NMB Splice Sleeves
7-Day 28-Day Air Temp
(F) Grout Temp.
(F) Water (gal.
per bag) Spread
(in) Specimen 1 14,130 15000+ Specimen 2 11,630 15000+ Specimen 3 12,800 15000+ Average 12,853 15000+
71.7 74.0 0.975 8.38
Displacement was measured using dial indicators mounted as close to the reinforcement-grout interface as possible to eliminate any displacement measured from elongation of the bar. The NMB splices were measured for displacement at each end while the Lenton splices were measured only at the grouted end. Weights were placed at the end of levers positioned to apply a load equal to 40 percent of the ultimate load of the reinforcement, 15.84 kips, equivalent to 60 percent of Fy. Hollow core load cells mounted at bearing locations of the splice assemblies on the top of the load frame were used to verify the loads applied to the splices. Displacement was recorded within the first three minutes of loading, every hour for the first six hours, and then daily for 42 days. At the conclusion of testing the displacement data was extrapolated to 600 days using a logarithmic trend line determined by calculating a least-squares fit through the data points using Equation 6-1.
bxcy +⋅= ln Equation 6-1
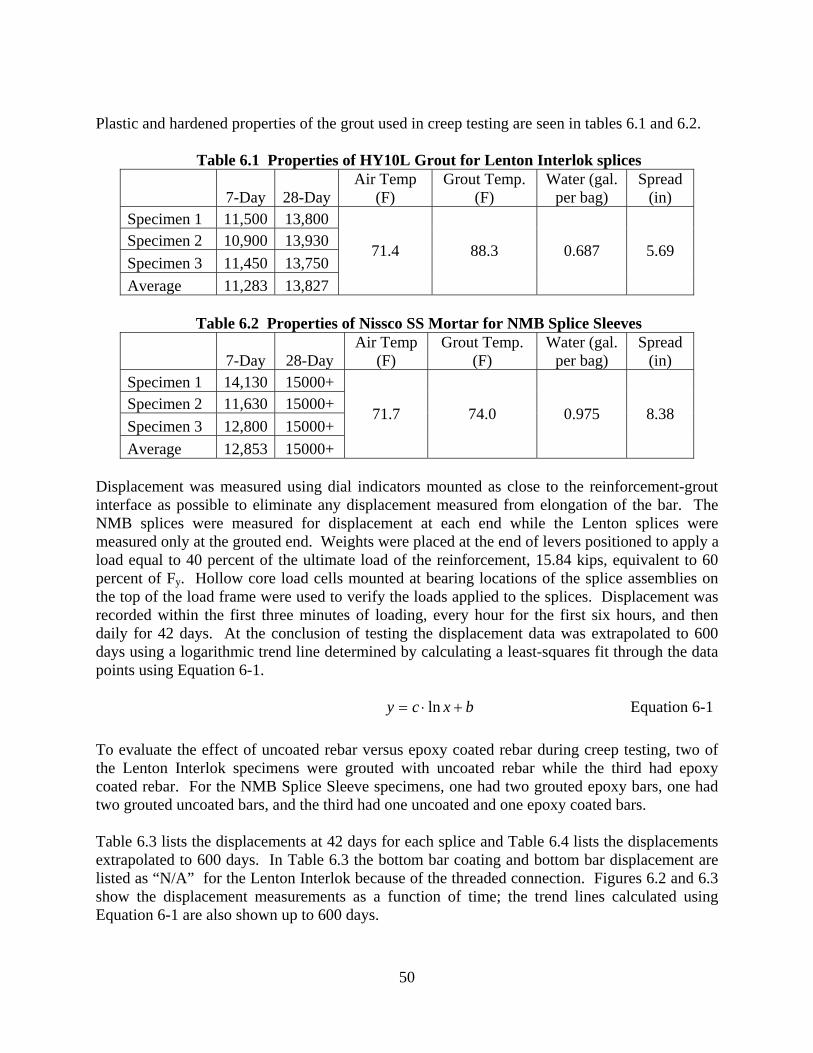
To evaluate the effect of uncoated rebar versus epoxy coated rebar during creep testing, two of the Lenton Interlok specimens were grouted with uncoated rebar while the third had epoxy coated rebar. For the NMB Splice Sleeve specimens, one had two grouted epoxy bars, one had two grouted uncoated bars, and the third had one uncoated and one epoxy coated bars. Table 6.3 lists the displacements at 42 days for each splice and Table 6.4 lists the displacements extrapolated to 600 days. In Table 6.3 the bottom bar coating and bottom bar displacement are listed as “N/A” for the Lenton Interlok because of the threaded connection. Figures 6.2 and 6.3 show the displacement measurements as a function of time; the trend lines calculated using Equation 6-1 are also shown up to 600 days.

51
Table 6.3 Creep test displacement Displacement at 42 days
(in)
Specimen Top Bar Coating
Bottom Bar Coating
Top Bottom Total
Total displacement
after load removal (in)
6DI epoxy coated N/A 0.020 N/A 0.021 0.009 6EI uncoated N/A 0.017 N/A 0.018 0.006 6FI uncoated N/A 0.005 N/A 0.005 0.000 Lenton
Average 0.014 0.008 6DN uncoated uncoated 0.014 0.016 0.030 0.012 6EN uncoated epoxy coated 0.021 0.013 0.034 0.019 6FN epoxy coated epoxy coated 0.016 0.008 0.024 0.003 NMB
Average 0.029 0.011
Table 6.4 Displacement extrapolated to 600 days Specimen Displacement at 600 days (in)
6DI 0.021 6EI 0.018 6FI 0.006 Lenton
Average 0.015 6DN 0.034 6EN 0.035 6FN 0.025 NMB
Average 0.031
0
0.01
0.02
0.03
0.04
0.05
0.06
0.001 0.010 0.100 1.000 10.000 100.000 1000.000
Time (days)
Dis
plac
emen
t (in
) 6DI
6EI
6FI
6DI: y=0.00079636*Ln(x)+0.01629531
6EI: y=0.00045491*Ln(x)+0.01523764
6FI: y=0.00035102*Ln(x)+0.00356685
Figure 6.2 Displacement of Lenton Interlok specimens
52
0
0.01
0.02
0.03
0.04
0.05
0.06
0.001 0.010 0.100 1.000 10.000 100.000 1000.000
Time (days)
Disp
lace
men
t (in
)
6DN
6EN
6FN
6DN: y=0.00119946*Ln(x)+0.02598500
6EN: y=0.00038630*Ln(x)+0.03240898
6FN: y=0.00018620*Ln(x)+0.02347897
Figure 6.3 Displacement of NMB Splice Sleeve specimens
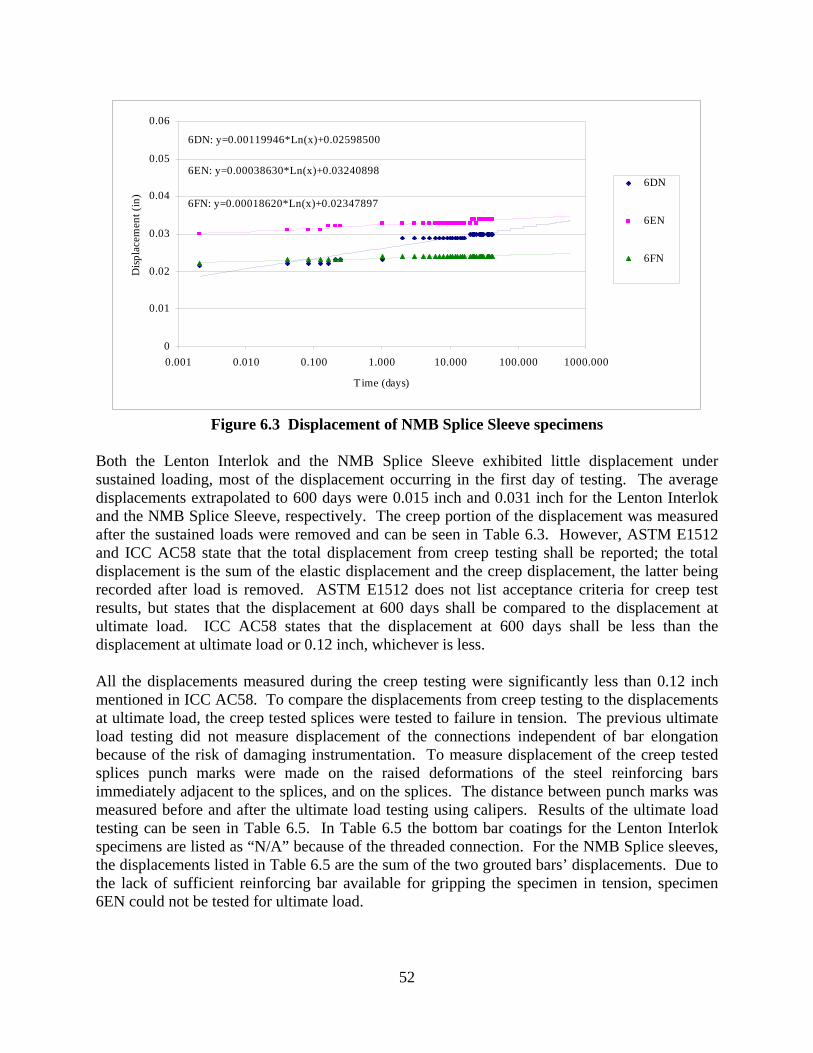
Both the Lenton Interlok and the NMB Splice Sleeve exhibited little displacement under sustained loading, most of the displacement occurring in the first day of testing. The average displacements extrapolated to 600 days were 0.015 inch and 0.031 inch for the Lenton Interlok and the NMB Splice Sleeve, respectively. The creep portion of the displacement was measured after the sustained loads were removed and can be seen in Table 6.3. However, ASTM E1512 and ICC AC58 state that the total displacement from creep testing shall be reported; the total displacement is the sum of the elastic displacement and the creep displacement, the latter being recorded after load is removed. ASTM E1512 does not list acceptance criteria for creep test results, but states that the displacement at 600 days shall be compared to the displacement at ultimate load. ICC AC58 states that the displacement at 600 days shall be less than the displacement at ultimate load or 0.12 inch, whichever is less. All the displacements measured during the creep testing were significantly less than 0.12 inch mentioned in ICC AC58. To compare the displacements from creep testing to the displacements at ultimate load, the creep tested splices were tested to failure in tension. The previous ultimate load testing did not measure displacement of the connections independent of bar elongation because of the risk of damaging instrumentation. To measure displacement of the creep tested splices punch marks were made on the raised deformations of the steel reinforcing bars immediately adjacent to the splices, and on the splices. The distance between punch marks was measured before and after the ultimate load testing using calipers. Results of the ultimate load testing can be seen in Table 6.5. In Table 6.5 the bottom bar coatings for the Lenton Interlok specimens are listed as “N/A” because of the threaded connection. For the NMB Splice sleeves, the displacements listed in Table 6.5 are the sum of the two grouted bars’ displacements. Due to the lack of sufficient reinforcing bar available for gripping the specimen in tension, specimen 6EN could not be tested for ultimate load.
53
Table 6.5 Ultimate loads after creep testing
Specimen Bottom Bar Coating
Top Bar Coating
Ultimate load (kips)
Displacement at ultimate load (in) % Fy
6DI epoxy coated N/A 33.5 N/A 127 6EI uncoated N/A 49.1 0.11 186 6FI uncoated N/A 43.0 0.11 163 Lenton
Average 159 6DN uncoated uncoated 48.4 0.27 183 6EN uncoated epoxy coated N/A N/A N/A 6FN epoxy coated epoxy coated 42.6 0.08 161 NMB
Average 45.5 0.18 172 The ultimate loads of specimens 6DI, 6EI, and 6FI showed wide variation, from 127 percent Fy to 186 percent Fy, and a slightly lower average, 159 percent Fy, than the earlier ultimate load tests seen in Table 4.1 for specimens 6AI, 6BI, and 6CI. The displacement for specimen 6DI was not recorded as the failure mode was sudden bar pull out. The failure mode for specimens 6EI and 6FI was bar fracture at the threaded connection, and both had 0.11 inch of displacement at failure, greater than the displacement during creep testing. The ultimate loads of specimens 6DN and 6FN were similar to the earlier tested 6AN-6CN, which averaged 175 percent Fy for ultimate load testing, as seen in Table 5.1. Specimen 6DN exhibited larger measurable displacement at ultimate load and fractured one of the reinforcing bars in failure. Specimen 6FN exhibited smaller measurable displacement because the failure mode was sudden bar pullout which prevented displacement measurement at one end after testing. Both of the displacements at ultimate load were greater than the displacements from creep testing. Figure 6.4 compares the creep displacements from the specimens as a function of coating type. When comparing the performance of epoxy and uncoated bars with the NMB Splice Sleeves, displacements from the two grouted ends were plotted separately. The epoxy coated bars did not displace significantly more than the uncoated bars. For the Lenton Interlok, the epoxy coated bar displaced slightly more than the uncoated bars. For the NMB Splice Sleeve, the epoxy coated bars displaced slightly less than the uncoated bars.

54
00.0020.0040.0060.008
0.010.0120.0140.0160.018
0.020.0220.0240.0260.028
0.03
Disp
lace
men
t (in
)
Epoxy coated
Uncoated
Lenton Interlok NMB Splice Sleeve
Figure 6.4 Effect of coating on creep displacement
Although the epoxy coating did not appear to detrimentally effect creep displacement, the creep tested epoxy coated bars tested to failure in tension exhibited lower values than the uncoated bars, for both the Lenton Interlok and the NMB Splice Sleeve, as seen in Table 6.5. This may be in part indicative of the ultimate load performance of epoxy coated bars compared to uncoated bars in general, not solely a result of creep testing. The previous ultimate load testing seen in Tables 4.1 and 5.1 used epoxy coated bars exclusively, so the data comparing the ultimate load performance of epoxy coated bars to uncoated bars are limited. Test data provided by Splice Sleeve North America, Inc., for the NMB Splice Sleeve, shown in Appendix Figures B.1 and B.2, show slightly lower ultimate loads for epoxy coated bars. The displacements from creep testing were compared to the displacements measured during slip testing at the maximum stress of 30 ksi (equivalent to a 13.2 kip load on a #6 bar). The average displacements from creep testing of 0.015 inch and 0.031 inch, for the Lenton Interlok and NMB Splice Sleeve, respectively, compare well to the average slip displacements of 0.013 inch and 0.021 inch at 30 ksi for the Lenton Interlok and NMB Splice Sleeve, respectively. The creep test displacements were slightly higher due to the higher magnitude of sustained loading, but compare well to the displacements measured during the slip testing, further indication that neither the Lenton Interlok nor the NMB Splice Sleeve are susceptible to significant creep displacements.

55
7. SUMMARY 7.1 CONCLUSIONS Slip testing for both products met AASHTO LRFD requirements, and slip testing improved after 1,000,000 cycles of fatigue testing in nine out of the ten specimens subjected to post-fatigue slip testing. The Lenton Interlok had slightly better performance in the slip testing than the NMB Splice Sleeve, most likely due to one end of the connection having tapered threads instead of two grouted ends. All specimens subjected to fatigue testing met AASHTO LRFD fatigue requirements for grout filled splices. Eleven out of the twelve specimens met the AASHTO LRFD requirement of 125 percent Fy in tension. The ultimate load of the Lenton Interlok #6 splices averaged 169 percent Fy, and the #11 splices averaged 148 percent Fy. A defect in one of the reinforcement bars used for specimen 11AI likely caused a lower ultimate of 124 percent Fy; the average of the other two #11 splices was 160 percent Fy. The ultimate load of the NMB Splice Sleeve #6 splices averaged 166 percent Fy, and the #11 splices averaged 175 percent Fy. Creep testing indicated that neither the Lenton Interlok nor the NMB Splice Sleeve are susceptible to significant displacement under sustained load, and the type of coating did not have a significant effect on the creep displacement. Similar to the slip test results, the creep displacements for the NMB Splice Sleeves were likely higher than the creep test displacements for the Lenton Interlok because of the double grouted connection compared to the single grouted connection. Post creep test ultimate loads were comparable to the earlier ultimate load testing though the limited data suggests that epoxy coated bars subjected to creep testing may exhibit lower ultimate loads. However, all five specimens subjected to creep testing were able to exceed 125 percent Fy, and four out of five exceeded 150 percent Fy in ultimate load testing. The effect of rebar deformation patterns did not have a discernible effect on performance during slip, fatigue, or ultimate testing. The allowable misalignments given by the manufacturers seem reasonable for installation in field conditions. The effects of misalignment on the testing parameters were not investigated, though it is suggested by the manufacturers that misalignment may improve ultimate tensile strength by mechanical interlock of the rebar deformations with the interior sleeve deformations. Future research could investigate this. Since both the Lenton Interlok and NMB Splice Sleeve performed well under testing for slip, fatigue, ultimate strength, and creep, they are recommended for departmental use. Both products have relatively simple installation procedures, though there will likely be a learning curve as contractors and fabricators are introduced into using these products on departmental projects for the first time. 7.2 RECOMMENDATIONS
1. Approve both the NMB Splice Sleeve and the Lenton Interlok for use on departmental projects.
2. Where not addressed by the MDOT 2003 Standard Specifications for Construction,
follow methods and procedures for grout-filled mechanical splices specified by the

56
manufacturers. Require training and/or on-site presence by manufacturer’s representatives if contractor has not installed these types of splices before.
3. Revise the current MDOT qualification procedure; Section 712.03L, Qualification
Procedure for Mechanical Reinforcement Splicing, to address the requirements of “High Strength” grout-filled mechanical splices as identified in the qualification procedure as seen in Appendix C.
4. Revise the MDOT QPL section 712.03L, Mechanical Reinforcement Splicing to
include the NMB Splice Sleeve and Lenton Interlok, designated as “High Strength” splices, as seen in Appendix D. Require “High Strength” splices when designing connections of structural precast elements.
5. Study the constructability and performance of grout-filled mechanical splices for
the first few department projects. 6. Consider additions to the MDOT Bridge Design Manual and/or MDOT Standard
Specifications for Construction addressing the use of prefabricated bridge elements and their connections.
57
8. REFERENCES AASHTO, Standard Specifications for Highway Bridges, 16th Edition, with 2002 Interim Revisions, Washington D.C., 2002. AASHTO, LRFD Bridge Design Specifications, Third Edition, with 2006 Interim Revisions, Washington D.C., 2006 ACI Committee 318, Building Code Requirements for Structural Concrete and Commentary, ACI 318-02, American Concrete Institute, Farmington Hills, MI, 2002. ACI Committee 439, Mechanical Connections of Reinforcing Bars, ACI 439.3R, ACI Structural Journal, American Concrete Institute, Detroit, MI, 1991. ACI-ASCE Joint Committee 550, Emulating Cast-in-Place Detailing in Precast Concrete Structures, ACI 550.1R-01, American Concrete Institute, Farmington Hills, MI, 2001. ASTM International, ASTM A536-84, Standard Specification for Ductile Iron Castings, West Conshohocken, PA, 2007. ASTM International, ASTM A1034-05, Standard Test Methods for Testing Mechanical Splices for Steel Reinforcing Bars, West Conshohocken, PA, 2007. ASTM International, ASTM C109-05, Standard Test Method for Compressive Strength of Hydraulic Cement Mortars, West Conshohocken, PA, 2007. ASTM International, ASTM E1512-01, Standard Test Method for Testing Bond Performance of Bonded Anchors, West Conshohocken, PA, 2007. California Department of Transportation, California Test 670, Method of Tests for Steel Reinforcing Bar Butt Splices, Sacramento, CA, 1999. California Department of Transportation, 2006 Standard Specifications for Construction, Sacramento, CA, 2006. ICC Evaluation Service, Inc., AC58, Acceptance Criteria for Adhesive Anchors in Concrete and Masonry Elements, Whittier, CA, 2005. ICC Evaluation Service, Inc., AC133, Acceptance Criteria for Mechanical Connectors for Steel bar Reinforcement, Whittier, CA, 2004. ICC Evaluation Service, Inc., Evaluation Report-3967, Reinforcing Steel Couplers and Splices – Erico, Inc., Whittier, CA, 2006. ICC Evaluation Service, Inc., Evaluation Report-5645, Reinforcing Steel Couplers and Splices – Splice Sleeve North America, Inc., Whittier, CA, 2005.

58
Lower, Bard, R. MDOT Research Report No. R-1314, Determination of the Slip Coefficient for Organic and Inorganic Primers in Bolted Connections, Lansing, MI, 1991. Manning, D. G., NCHRP Research Results Digest, Number 197, Washington D.C., 1994. MDOT, Materials Source Guide, Qualified Products List, Section 712.03L, Lansing, MI, 2007. MDOT, Materials Quality Assurance Procedures Manual, Qualification Procedure for Mechanical Reinforcement Splicing, Section F712.03L, Lansing, MI, 2006. Paulson, C. and Hanson, J.M., Wiss, Janney, Elstner Associates, Inc., NCHRP 10-35, Fatigue Behavior of Welded and Mechanical Splices in Reinforcing Steel, Chicago and Northbrook, IL, 1991. Pearson, L., MDOT Technical Investigation TI-1745, Mechanical Reinforcement Splices, notes and memorandums from project file. Lansing, MI, 1995-1998. Splice Sleeve North America, Inc., NMB Splice Sleeve System User’s Manual, Irvine, CA, 2007.

Appendix A Test Data for the Lenton Interlok Splice
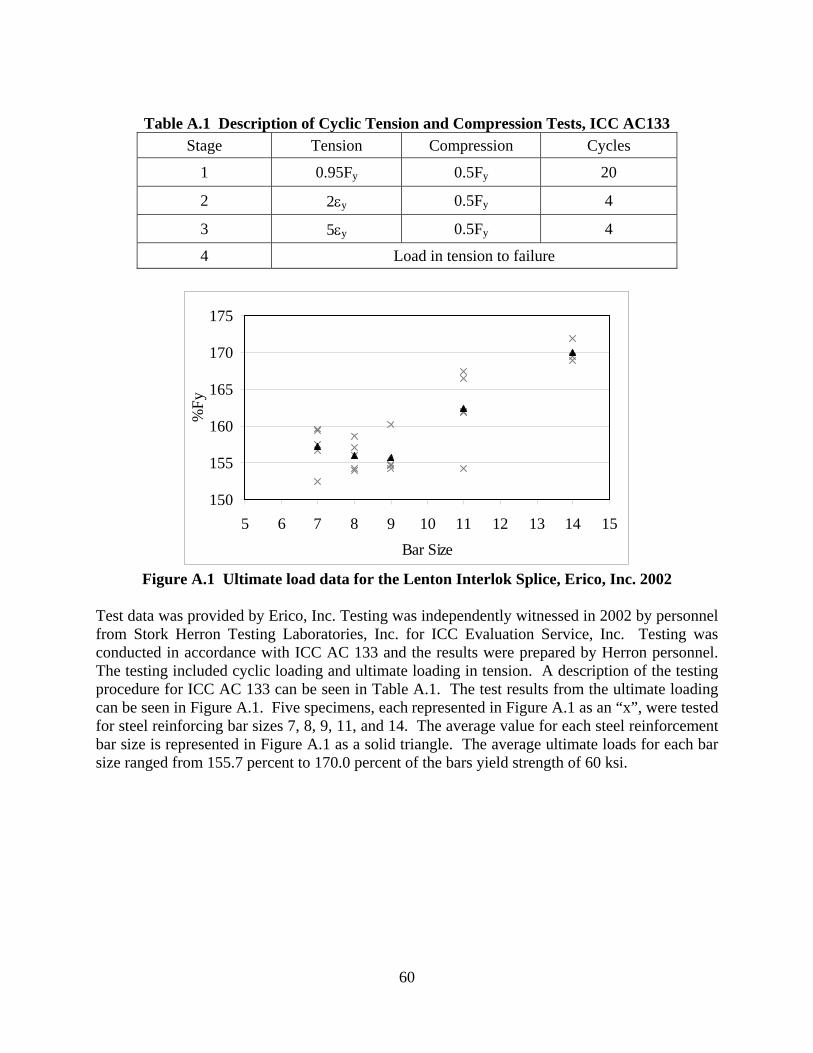
60
Table A.1 Description of Cyclic Tension and Compression Tests, ICC AC133
Stage Tension Compression Cycles
1 0.95Fy 0.5Fy 20
2 2εy 0.5Fy 4
3 5εy 0.5Fy 4
4 Load in tension to failure
150
155
160
165
170
175
5 6 7 8 9 10 11 12 13 14 15Bar Size
%Fy
Figure A.1 Ultimate load data for the Lenton Interlok Splice, Erico, Inc. 2002
Test data was provided by Erico, Inc. Testing was independently witnessed in 2002 by personnel from Stork Herron Testing Laboratories, Inc. for ICC Evaluation Service, Inc. Testing was conducted in accordance with ICC AC 133 and the results were prepared by Herron personnel. The testing included cyclic loading and ultimate loading in tension. A description of the testing procedure for ICC AC 133 can be seen in Table A.1. The test results from the ultimate loading can be seen in Figure A.1. Five specimens, each represented in Figure A.1 as an “x”, were tested for steel reinforcing bar sizes 7, 8, 9, 11, and 14. The average value for each steel reinforcement bar size is represented in Figure A.1 as a solid triangle. The average ultimate loads for each bar size ranged from 155.7 percent to 170.0 percent of the bars yield strength of 60 ksi.

Appendix B Test Data for the NMB Splice Sleeve

62
150.0155.0160.0165.0170.0175.0180.0185.0190.0
0 1 2 3
Test set
%Fy
Figure B.1 Ultimate load data for the NMB Splice Sleeve, plain (1) and epoxy coated bars (2), California Department of Transportation, 1987
150.0152.0154.0156.0158.0160.0162.0164.0166.0168.0170.0
0 1 2 3
Test set
%Fy
Figure B.2 Ultimate load data for the NMB Splice Sleeve, plain (1) and
epoxy coated bars (2), Nisso Master Builders Laboratory
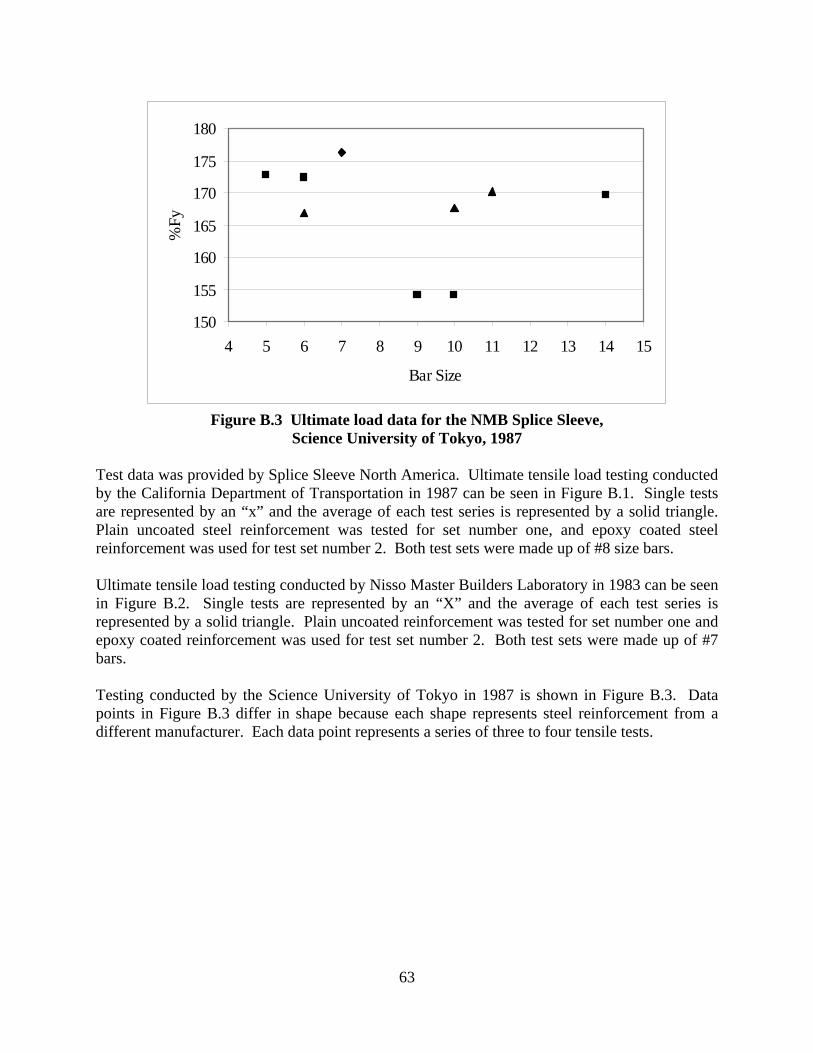
63
150
155
160
165
170
175
180
4 5 6 7 8 9 10 11 12 13 14 15
Bar Size
%Fy
Figure B.3 Ultimate load data for the NMB Splice Sleeve,
Science University of Tokyo, 1987 Test data was provided by Splice Sleeve North America. Ultimate tensile load testing conducted by the California Department of Transportation in 1987 can be seen in Figure B.1. Single tests are represented by an “x” and the average of each test series is represented by a solid triangle. Plain uncoated steel reinforcement was tested for set number one, and epoxy coated steel reinforcement was used for test set number 2. Both test sets were made up of #8 size bars. Ultimate tensile load testing conducted by Nisso Master Builders Laboratory in 1983 can be seen in Figure B.2. Single tests are represented by an “X” and the average of each test series is represented by a solid triangle. Plain uncoated reinforcement was tested for set number one and epoxy coated reinforcement was used for test set number 2. Both test sets were made up of #7 bars. Testing conducted by the Science University of Tokyo in 1987 is shown in Figure B.3. Data points in Figure B.3 differ in shape because each shape represents steel reinforcement from a different manufacturer. Each data point represents a series of three to four tensile tests.

Appendix C Proposed revisions (underlined) for MDOT Qualification Procedure

65
Qualification Procedure For Mechanical Reinforcement Splicing 1. Scope
1.1 This document covers the procedure to be followed by producers in order to have a mechanical reinforcement splice approved for MDOT use.
2. Submittal Requirements
2.1 Product Data Sheets - Submit a copy of product literature describing the product's use and other pertinent information such as design drawings, manufacturer’s name and address, manufacturer’s trade name, model number, etc. of the sample submitted to the MDOT address listed below:
Experimental Studies Group Construction & Technology Division 8885 Ricks Road P.O. Box 30049 Lansing, Michigan 48909 Telephone: (517) 322-5707
2.2 Report of tests - The producer shall include test results from an independent testing
laboratory demonstrating that the mechanical reinforcement splice meets the following criteria:
2.2.1 All splices tested shall develop a tensile strength of 125% of the reinforcing
bar’s yield strength.
2.2.2 All splices tested shall develop a fatigue strength of 12,000 psi (83 MPa) tension at greater than 1,000,000 cycles.
2.2.3 To be considered for “High Strength” splices, all splices tested shall conform
to the following criteria: 2.2.3.1 Splices shall develop a tensile strength of 150% of the reinforcing
bars yield strength. 2.2.3.2 Splices shall develop a fatigue strength of 18,000 psi (124 MPa)
tension at greater than 1,000,000 cycles. 2.2.3.3 Splices shall slip no more than 0.01 inch for bar sizes up to #14, and
no more than 0.03 inch for bar size #18, when subjected to slip testing in accordance with ASTM 1034.
2.3 Sample Submittal
2.3.1 The producer shall provide splices for verification testing by MDOT in order to
verify independent test data. When special equipment is not required to
66
prepare the splice, the producer shall provide the samples unassembled with installation instructions. If special equipment is required to prepare the splice, arrangements shall be made where a representative of MDOT can witness the assembly of the test samples. If this is not feasible, the producer shall prepare the test samples and supply information on the procedure used to prepare each splice. The following number of test samples shall be provided (Note: MDOT currently accepts soft-converted metric reinforcement sizes.):
Small Size: Submit 4 samples; minimum size equals #4 (#13) or smallest splice available if larger than minimums shown here. A combination of small size bars can be submitted.
Medium Size: Submit 4 samples; a combination of #3, #7 or #8 (#9, #22, or #25) bars can be submitted.
Large Size: Submit 4 samples; maximum size equals #11 (#36) or largest splice available if smaller than the maximums shown. A combination of large bar sizes may be submitted.
Test sample bars shall have 12 inches (300 mm) exposed length beyond the prepared splice. The bars shall be Grade 60 psi (400 MPa) and supplied by the producer.
3. Evaluation
3.1 The submitted information will be reviewed and samples will be tested for conformance to the specified requirements. The product will also be reviewed for general workmanship, corrosion protection, ease of installation, and any requirements specific to a given design. Please note: Only splices having collinear axes after splicing will be approved, i.e., offset bar splices will not be accepted. The submitter will be notified in writing concerning the results of the evaluation. MDOT reserves the right to verify submitted test information or reevaluate a product at any time by conducting its own tests.
4. Disqualification
4.1 A product may be immediately disqualified from MDOT use should any problem develop related to installation or performance of the product. A product may also be removed due to specification changes made by either MDOT or the product manufacturer.
5. Requalification
5.1 A product that has been disqualified will be considered for reevaluation only after submittal of a written request along with the acceptable evidence that the problems causing the disqualification have been corrected.

Appendix D Proposed revisions (underlined) for MDOT Qualified Products List 712.03L

68
712.03L Mechanical Reinforcement Splicing NOTE: Splices used to connect structural precast elements shall be High Strength splices.
BPI Bar Splicer System Grip Twist Threaded Position Coupler Zap Screwlok Bar-Lock L-Series Bar-Lock S/CA-Series DB SAE Lenton Lenton Form Saver Lenton Position Coupler Lenton Interlok (High Strength) NMB Splice Sleeve (High Strength)
Bar Splice Products, Inc., Beavercreek, OH Bar Splice Products, Inc., Beavercreek, OH Bar Splice Products, Inc., Beavercreek, OH Dayton Superior Corp., Miamisburg, OH Dayton Superior Corp., Miamisburg, OH Dayton Superior Corp., Miamisburg, OH ERICO Concrete Construction, Solon, OH ERICO Concrete Construction, Solon, OH ERICO Concrete Construction, Solon, OH ERICO Concrete Construction, Solon, OH Splice Sleeve North America, Inc., Irvine, CA