r-05-35 - skb · skb rapport r-05-35 keywords: stress state, geological correlation, regional...
TRANSCRIPT

Evaluation of the state of stress at the Forsmark site
Preliminary site investigation Forsmark area – version 1.2
Jonny Sjöberg, Ulf Lindfors, Fredrik Perman, Daniel Ask
SwedPower AB
September 2005
R-05-35
Svensk Kärnbränslehantering ABSwedish Nuclear Fueland Waste Management CoBox 5864SE-102 40 Stockholm Sweden Tel 08-459 84 00 +46 8 459 84 00Fax 08-661 57 19 +46 8 661 57 19

Evaluation of the state of stress at the Forsmark site
Preliminary site investigation Forsmark area – version 1.2
Jonny Sjöberg, Ulf Lindfors, Fredrik Perman, Daniel Ask
SwedPower AB
September 2005
ISSN 1402-3091
SKB Rapport R-05-35
Keywords: Stress state, Geological correlation, Regional stress data, Overcoring, Hydraulic fracturing, Core discing.
This report concerns a study which was conducted for SKB. The conclusions and viewpoints presented in the report are those of the authors and do not necessarily coincide with those of the client.
A pdf version of this document can be downloaded from www.skb.se

3
Summary
This report presents an evaluation of the state of stress at the Forsmark site, based on all conducted stress measurements to date at the site, indirect stress estimates, geological and tectonic description of the site, and regional stress data from nearby locations. The work included (i) compilation of measurement results from Forsmark, as well as from nearby (regional) sites/locations, (ii) analysis of confidence intervals for each group of measurement, (iii) assessment of the stress state for the Forsmark site accounting for geological/tectonic evolution at the site, (iv) assessment of stress state for selected nearby (regional) sites/locations, and (v) comparison and combined interpretation of similarities and/or differences in stress state from a regional perspective.
The combined assessment of the local (site-scale) and regional stress data for Forsmark showed that the major stress is orientated sub-horizontally and trending NW-SE; however, with significant local variation. A thrust faulting (σH > σh > σv) or possibly strike-slip faulting (σH > σv > σh) stress regime is evident at the Forsmark site. The maximum horizontal stress tends to be higher at the site compared to nearby sites and regional conditions. The site and regional data indicate that the vertical stress seems to be solely due to the overburden pressure. The lack of solid core discing for large portions of the boreholes at Forsmark was used to estimate an upper limit of the maximum horizontal stress magnitude. However, such an estimation is highly uncertain due to e.g. partly unknown mechanism for core discing failure, and unknown effects of the simplifying assumptions made in the analysis. The possible effects of shallow-dipping deformation zones on the stress state, could not be verified from the currently available data. However, the possibility of different stress regimes above and below deformation zones must be considered in future work. Slightly lower horizontal stress was found in gneissic rock. Aside from this, clear correlations between rock type and measured stresses were also lacking, as well as confirmatory evidence of a low-stress environment in the superficial, more fractured bedrock.
Assessment of a representative stress state for the Forsmark site was based on different subsets of the total data set of stress measurements. Linear stress profiles were assumed for the horizontal and vertical stress components, with each stress profile being representative of the conditions within the tectonic lens. These stress profiles define the lower and upper limit of the stress state based on the data considered reliable for each stress component. The resulting stress profiles are:• Maximum horizontal stress (σH) applicable for 230–450 m vertical depth (z):
Lower limit: σH = 0.085z (MPa) Upper limit: σH = 13+0.095z (MPa) Alternative upper limit: σH = 29+0.050z (MPa) Orientation: 140° (clockwise from North)
• Minimum horizontal stress (σh) applicable for 0–1,000 m vertical depth (z): Lower limit: σh = 0.022z (MPa) Upper limit: σh = 5.5+0.0265z (MPa)
• Vertical stress (σv) applicable for 0–800 m vertical depth (z): σv = 0.0265z (MPa)
4
Future measurements and activities should be planned to address the gaps indicated by the present data set. It is recommended that new overcoring measurements are conducted, starting already at approximately 100 m depth below the ground surface, and continued as deep as possible – until the method is no longer applicable (extensive core damage and/or core discing inhibiting correct installation and/or overcoring of the measurement probe). Furthermore, any observations on core discing should be logged in detail to provide confirmatory evidence of stress magnitudes. If core discing of solid core is observed, pilot hole drilling with subsequent overcoring (without installation of the measurement probe) should be considered to induce ring discing of a hollow core. Having two observations of different core geometries can significantly increase the accuracy in stress estimation from core discing observations. However, the uncertainties associated with the methodology for using core discing observations to estimate stresses must be considered. Additional work to verify this approach would be beneficial for an improved stress estimate at Forsmark. Hydraulic measurements (primarily HTPF) should be planned following overcoring measurements, to complement the stress assessment and resolve any remaining issues. An integrated stress determination using inversion analysis for both overcoring and hydraulic data should also be considered for the site. A new approach for stress modelling is proposed, in which the boundary conditions of a numerical stress model are calibrated in an objective manner to individual or groups of stress measurements, without excluding any data a priori.

5
Sammanfattning
I denna rapport presenteras en utvärdering av spänningsförhållandena i Forsmark, baserat på alla utförda spänningsmätningar i området, indirekta metoder för spännings-bestämning, geologisk och tektonisk beskrivning av platsområdet, samt regionala spänningsdata från närliggande mätplatser. Arbetet omfattade (i) sammanställning av mätresultat från Forsmark, samt från närliggande, regionala, mätningar, (ii) beräkning av konfidensintervall för varje grupp av mätningar, (iii) bedömning av spänningsförhållandena i platsområdet med avseende på geologisk och tektonisk utveckling, (iv) bedömning av spänningsförhållandena för utvalda närliggande mätplatser och (v) jämförelse och sammantagen tolkning av likheter och skillnader i spänningsfält i ett regionalt perspektiv.
Den sammantagna analysen av lokala och regionala spänningsdata för Forsmark visade på en största spänning orienterad subhorisontellt och riktad NV-SÖ, men med avsevärda lokala variationer. Ett spänningsfält motsvarande en reversförkastning (σH > σh > σv) eller en horisontalförkastning (σH > σv > σh) är tillämpbart för platsområdet. Den största horisontella spänningen förefaller att vara högre i Forsmark jämfört med närliggande områden och regionala förhållanden. Vertikalspänningen verkar enbart vara en funktion av tyngden av ovanliggande berg. Avsaknaden av ”core discing” i solida borrkärnor för stora delar av borrhålen i Forsmark nyttjades för att uppskatta en övre gräns för storleken på största horisontalspänningen. En sådan bestämning är dock osäker, till följd av delvis okänd brottmekanism för ”core discing” och okänd inverkan av gjorda antaganden i analysen. De möjliga effekter som flackt stupande deformationszoner kan ha på spännings-fältet, kunde ej verifieras med tillgängliga data. Förekomsten av olika spänningsdomäner ovan och under deformationszoner måste dock beaktas i fortsatta arbeten. Något lägre horisontella spänningar kunde noteras i gnejsigt berg. Bortsett från detta fanns det inga tydliga samband mellan bergart och uppmätt spänning. Befintliga data kunde inte heller nyttjas för att bekräfta förekomsten av en zon med lägre spänning i det ytliga, mer uppspruckna berget i Forsmark.
Bestämning av representativa spänningsvärden för Forsmark baserades på olika del-mängder av den totala datamängden från utförda spänningsmätningar i Forsmark. Linjära spänningssamband antogs för de horisontella och vertikala spänningskomponenterna. Spänningsprofilerna bedömdes vara representativa för förhållandena i den tektoniska linsen. Dessa samband definierar undre och övre gränserna för de spänningsdata som ansetts tillförlitliga för respektive spänningskomponent. Följande värden erhölls:• Största horisontella spänning (σH) för 230–450 m vertikalt djup (z):
Undre gräns: σH = 0.085z (MPa) Övre gräns: σH = 13+0.095z (MPa) Övre gräns – alternativ: σH = 29+0.050z (MPa) Orientering: 140° (medurs från norr)
• Minsta horisontella spänning (σh) för 0–1,000 m vertikalt djup (z): Undre gräns: σh = 0.022z (MPa) Övre gräns: σh = 5.5+0.0265z (MPa)
• Vertikal spänning (σv) för 0–800 m vertikalt djup (z): σv = 0.0265z (MPa)

6
Framtida mätningar och undersökningar bör planeras för att fylla de kunskapsluckor som denna studie påvisat. Nya överborrningsmätningar rekommenderas, med start redan på ca 100 m djup under markytan. Mätningarna bör sedan fortsättas ned till så stort djup som möjligt – tills dess att mätmetoden inte längre är tillförlitlig (omfattande mikrouppsprickning av överborrad kärna och/eller ”core discing” vilket medför att cellen inte kan installeras eller överborras på ett korrekt sätt). Om ”core discing” observeras bör denna karteras i detalj, för att ge kompletterande data på spänningsmagnituderna. För de fall då ”core discing” av solid kärna observeras, bör man överväga pilotborrning med efterföljande överborrning (utan installation av mätcell) för att inducera s k ”ring discing”, vilket i sin tur ger avsevärt bättre noggrannhet i spänningsbestämningen från observationer av ”core discing”. De osäkerheter som finns i användandet av ”core discing” för att uppskatta spänningarna måste dock beaktas. Ytterligare studier i syfte att verifiera denna metodik skulle vara till nytta för en förbättrad spänningsbestämning i Forsmark. Hydrauliska mätningar (primärt HTPF) bör utföras efter överborrningsmätningar, för att ge kompletterande spänningsbestämningar. En integrerad spänningsbestämning med nyttjande av såväl överborrningsdata som data från hydrauliska metoder, bör också övervägas för Forsmarkplatsen. En alternativ metod för spänningsanalys föreslås, i vilken randvillkoren för en numerisk modell kalibreras på ett objektivt sätt mot enskilda eller grupper av spänningsdata från mätningar, utan att några data behöver exkluderas a priori.

7
Contents
1 Introduction 9
2 Objective and scope 11
3 Stress measurement data at Forsmark 133.1 Geological setting 133.2 Conducted measurements 16
3.2.1 Overview 163.2.2 Overcoring measurements in boreholes DBT-1 and DBT-3 173.2.3 Overcoring measurements in borehole KFM01B 193.2.4 Hydraulic fracturing measurements in boreholes KFM01A,
KFM01B, KFM02A and KFM04A 203.2.5 Other measurements 203.2.6 Indirect stress estimates 223.2.7 Stress information from measured P-wave velocities 26
3.3 Geological correlation and stress state 283.3.1 Effect of major deformation zones 283.3.2 Effect of lithology and fractures 32
3.4 Comparison of methods for stress determination 34
4 Regional stress data 374.1 World stress map and plate motions 384.2 Finnsjön 394.3 Stockholm City area 394.4 Björkö 404.5 Olkiluoto 404.6 Summary findings 42
5 Assessment of stress state for the Forsmark site 455.1 Summary of base data 455.2 Stress state 46
5.2.1 Maximum horizontal stress (σH ); 230–450 m depth 475.2.2 Minimum horizontal stress (σh); 0–1,000 m depth 495.2.3 Vertical stress (σv); 0–800 m depth 50
6 Conclusions and recommendations 53
7 References 57
Appendix A Forsmark stress data – boreholes DBT-1 and DBT-3 61Appendix B Forsmark stress data – borehole KFM01B 73Appendix C Forsmark stress data – HF-measurements in boreholes
KFM01A, KFM01B, KFM02A and KFM04A 77Appendix D Forsmark stress data – other measurements 81Appendix E Regional stress data – Finnsjön 93Appendix F Regional stress data – Stockholm City area 97
8
Appendix G Regional stress data – Björkö 107Appendix H Regional stress data – Olkiluoto 109Appendix I Core discing in the Forsmark area 117Appendix J Primary measurement data from Forsmark, Finnsjön
and Olkiluoto 121

9
1 Introduction
This report presents an evaluation of the state of stress at the Forsmark site, based on all conducted stress measurements to date at the site, indirect stress estimates, geological and tectonic description of the site, and regional stress data from nearby locations. The work presented, which is one of the activities within the site investigation at Forsmark, was performed according to Activity Plan AP PF 400-04-16 (SKB internal controlling document).

11
2 Objective and scope
The objective of this work was to summarize and interpret all available stress measurement data from the Forsmark site, for later use as a basis for stress modelling. A secondary objective was to compare the interpreted stress state at the site with stress measurement data from nearby locations in a regional perspective.
The work included (i) compilation of measurement results from Forsmark, as well as from nearby (regional) sites/locations, (ii) analysis of confidence intervals for each group of measurement, (iii) assessment of the stress state for the Forsmark site accounting for geological/tectonic evolution at the site, (iv) assessment of stress state for selected nearby (regional) sites/locations, and (v) comparison and combined interpretation of similarities and/or differences in stress state from a regional perspective.
Descriptions of the geological and tectonic evolution were obtained from the site descriptive model, version 1.1 /SKB, 2004a/ and version 1.2 /SKB, 2005/. Stress measurement data/information from the site included primarily (i) old overcoring measurements and re-evaluation of these /SSPB, 1982; Perman and Sjöberg, 2003/, (ii) recent overcoring measurements and evaluation of these /Sjöberg, 2004; Lindfors et al. 2004/, (iii) recent hydraulic fracturing measurements /Klee and Rummel, 2004/, (iv) observed core discing, and (v) data from P-wave velocity measurements on drill cores. Additional data from other stress measurements at or near Forsmark, as well as stress data from Stockholm and Olkiluoto, were used to assess the regional stress state in the area. Previous interpretations of the stress state at the site were also utilized /Carlsson and Christiansson, 1986, 1987/.
In this presentation, all stresses are denoted using a geomechanical sign convention with compressive stresses taken as positive. All stress orientations are given with respect to geographic north, using a right-hand rule notation.

13
3 Stress measurement data at Forsmark
3.1 Geological settingThe geological information given in this report is that presented by /SKB, 2004a/ and /SKB, 2005/ and is determined through an extensive program containing both surface and borehole investigation. The geological information was gathered through various methods such as bedrock mapping, airborne geophysical data, rock core mapping, etc. The latter publication /SKB, 2005/ refers to the latest version of the site descriptive model, currently in preparation.
In general, the Forsmark region is dominated by meta-igneous, quartz-rich rock types that have been affected by ductile deformation. Some few young granites and pegmatite rock types only display a weak foliation /SKB, 2004a, 2005/. In the descriptive geological model of the Forsmark site, forty-two rock domains (RFM001–RFM042) are presented and they are separated by their basic composition of rock types, grain size, degree of inhomogeneity, and ductile deformation. Two representative domains are labelled as: (i) RFM029, consisting of granite to granodiorite, being metamorphic and of medium grain size, and (ii) RFM032, consisting of granite, being metamorphic and aplitic, see Figure 3-1. RFM029 is dominating the candidate area at the site and is characterised as homogeneous, lineated and weakly foliated, with an inferred lower degree of ductile deformation. RFM032, on the other hand, is a key domain to define a major folded structure in the central part of the region, and is characterized as inhomogeneous, banded foliated and lineated, with an inferred higher degree of ductile deformation. This is valid for both the regional (165 km2) and local scale (31 km2) of the area. The tectonic foliation and banding in the rock mass strikes mostly in NW-SE direction, with a steep dip angle. The mineral stretching lineation has a trend towards SE and is moderately steep, with a plunge of 35–50º. A complete description of all rock domains and their presences at the Forsmark region is presented in /SKB, 2004a, 2005/.
For the boreholes drilled during the last three years and considered in this study (KFM01A, KFM01B, KFM02A, KFM03A, KFM03B, KFM04A, KFM05A), the dominant rock domain encountered is RMF029, with the following exceptions. In borehole KFM03A, RFM017 is intersected between 220 and 293 m hole length. In borehole KFM04A, RFM018 occurs between 12 and 177 m length, and RFM012 is intersected between 177 and 500 m hole length. RFM017 and RMF018 comprise tonalite to granodiorite, metamorphic, whereas RMF012 consists of granite to granodiorite, metamorphic.
In the regional scale of the Forsmark area, 879 linked lineaments have been identified. The majority (approximately 700) of these are shorter than 1 km in length. Only a few of these (seven) have a length longer than 10 km. Lineament analysis showed that four dominant orientations are present among the major lineaments (NS, NE, NW, and EW), of which the NW orientation appear to be the most represented direction among them.

14
Figure 3-1. Rock domains used in the modelling procedure numbered from 1 to 41. Surface view of the regional model volume /SKB, 2005/. The colours show the rock units that were defined on the basis of dominant rock type, with numbering as follows: 111058 = Granite, fine- to medium-grained, 111057 = Granite to granodiorite, metamorphic, veined to migmatitic, 101051 = Granitoid, metamorphic, fine- to medium-grained, 101058 = Granite, metamorphic, aplitic, 101057 = Granite to granodiorite, metamorphic, 101056 = Granodiorite, 101054 = Tonalite to granodiorite, metamorphic, 101033 = Diorite, quartz diorite and gabbro, metamorphic, 101004 = Ultramafic rock, metamorphic,103076 = Felsic to intermediate volcanic rock, metamorphic, 106001 = Sedimentary rock, metamorphic, veined to migmatitic.

15
In general, the deformations zones present at Forsmark site can be divided into four sets as follows /SKB, 2005/:1. Vertical and steeply, SW-dipping zones with NW-WNW strike direction. These zones
are both regional (length > 10 km) such as Singö, Eckarfjärden and the Forsmark deformation zones) and local (length < 10 km), in size, showing both ductile and brittle deformation (Figure 3-2).
2. Steeply dipping zones (brittle deformation) with NE-ENE strike, being locally major to locally minor in size.
3. Steeply dipping zone with NS strike (only one local minor zone).4. Gently SE-and S-dipping brittle deformation zones, being locally major in size, and
occurring mostly in the south-eastern part of the candidate volume (Figure 3-3).
The major deformation zones (Singö, Eckarfjärden and Forsmark) belong to the first category above. They form a tectonic lens, in which the major portion of the candidate area is situated. An important finding from recent drillings at the site is that the character of the bedrock at 1,000 m depth (in the tectonic lens) is identical to that observed at the surface /SKB, 2005/. The superficial bedrock is extensively fractured leading to high transmissivities (recorded in the percussion-drilled boreholes at all drill sites). However, at depth, the bedrock appears to have a very low conductivity /SKB, 2004a/. Very low fracture intensity and very tight rock was encountered, e.g. in borehole KFM01A.
Figure 3-2. Structural model of the candidate site showing steeply dipping zones with judged high or medium confidence of occurrence /SKB, 2005/.

16
New data and interpretations of possible deformation zones in the area have lead to higher degree of confidence of occurrence for some of the more flatly dipping zones (category 4 above). A potential zone of particular interest is termed ZFMNE00A2, with an orientation of 080/24 and daylighting near drill site 1 (boreholes KFM01A and KFM01B), see Figure 3-3 and Figure 3-4 below. The zone intersects drill site 2 at approximately 415 m depth and drill site 3 at around 785 m depth /SKB, 2005/.
3.2 Conducted measurements3.2.1 Overview
Stress measurements have been conducted in 11 different boreholes at the Forsmark site during the time period of 1977 to 2004. The location of the measurement boreholes is shown in Figure 3-4. Historically, the majority of the measurements have been conducted using overcoring (boreholes DBT-1, DBT-3, D358, KB-21, KB-22, KB7-S, SFR 1/177) whereas hydraulic fracturing was only employed in borehole DBT-1. With the start of the site investigation at Forsmark, additional overcoring was conducted in borehole KFM01B, and hydraulic fracturing and hydraulic tests on pre-existing fractures in boreholes KFM01A, KFM01B, KFM02A, and KFM04A, during 2003–2004. The conducted measurements are briefly reviewed below, with the main findings presented. Confidence intervals were
Figure 3-3. Structural model of the candidate site showing gently dipping zones with judged high or medium confidence of occurrence /SKB, 2005/.

17
also calculated for the stress data for each measurement level in each borehole, using the methodology and computer program described in /Lindfors et al. 2004/. A summary of all measurement data is presented in Appendix J. In addition to direct measurements, data from core discing were used to indirectly assess the stress state. Results from P-wave velocity measurements on drill cores were also studied from a stress information perspective.
3.2.2 Overcoring measurements in boreholes DBT-1 and DBT-3
Overcoring stress measurements in boreholes DBT-1 and DBT-3 were conducted within the construction area of the Forsmark Power Plant, during the period of 1977 to 1979. Measurements were conducted with the SSPB cell /Hiltscher et al. 1979; Hallbjörn, 1986; Hallbjörn et al. 1990/, which was a precursor of the currently used Borre probe /Sjöberg and Klasson, 2003/. Hydraulic fracturing measurements were later performed in borehole DBT-1, see Section 3.2.5.
Figure 3-4. Map of the Forsmark site showing all boreholes in which rock stress measurements have been conducted.

18
The results from the overcoring measurements have been reported in a measurement report /Ingevald and Strindell, 1981/ and in a summary report including all conducted borehole investigations /SSPB, 1982/. The results were also published and discussed in a paper by /Martna et al. 1983/. It must be observed that the reported data are not the same in the two reports. Strain differences and, hence, calculated stresses are different in /SSPB, 1982/ compared to /Ingevald and Strindell, 1981/. The changes are relatively small – a few microstrains in strain difference, resulting stresses being up to a few MPa higher in /SSPB, 1982/. There is no explicit explanation in the report as to why these changes were made, but it is assumed that the final (and later) report underwent additional scrutiny and quality checks, which led to some revisions of the measurement data. In this study, all measurement data used were taken from the most recent report /SSPB, 1982/. Furthermore, it is not clear whether the reported values on E and ν are for the axial or horizontal direction, or an average of the two. In the following, it has been assumed that the values on E and ν in /SSPB, 1982/ are average values for all strain gauges. The measured values of the horizontal and vertical stress components (σH, σh, σv) and the orientation of σH are presented in Appendix A.
/Martna et al. 1983/ stated that measurements were taken without major problems down to the 320 m level (vertical depth below the ground surface). At this depth, a fracture zone was penetrated by borehole DBT-1. Below this zone, measurements became difficult to perform, mainly due to extensive core discing. This phenomenon occurred in the form of 12–18 mm thick discs of the overcore samples (so-called ring discing). It was estimated that discing occurred when the maximum principal stress (σ1) exceeded 65 MPa /Martna et al. 1983/. This estimate was probably based on the maximum stress measured in the borehole (σ1 = 67 MPa at 486 m depth, cf Appendices A and J).
Below 320 m depth, only 8 (of 11 attempted) measurements were successfully completed. The distance between some of these was quite large, further indicating the difficulty in obtaining measurements. /Martna et al. 1983/ concluded that the measurements were taken at points, which, locally, experienced lower values of the in situ stress. The interpretation offered by /Martna et al. 1983/ was that the maximum stresses below 320 m are probably higher than 65 MPa. The interpretation of /SSPB, 1982/ and /Martna et al. 1983/ involved a significant “stress jump” at the 320 m level, as an effect of having passed the fracture zone at this level. Considering the amount of core discing coupled with the relatively few measurements below 320 m, this interpretation is somewhat uncertain.
Recently, a re-analysis was performed on the data from 1982, comprising a transient strain analysis using the method and code developed by /Hakala et al. 2003/. All tests below 100 m depth were re-analysed /Perman and Sjöberg, 2003/. An attempt was made to discard apparent outliers in the data, based on calculated induced tensile stresses and amount of unexplained strain. The re-interpreted data are shown in Appendix A, together with calculated confidence intervals for each measurement level. (It should be noted that 90%-intervals for the principal stress orientations could not be calculated in some cases – for these, 95%- or 97%-intervals are shown for comparison.)
When discarding outliers and suspiciously erroneous data, the inferred “stress jump” at the 320 m level is less apparent, and a linear trend is equally well fitted to data for the maximum horizontal stress. Similarly, linear trends can be fitted to the vertical and minimum horizontal stress component. A zero (0) intercept was assumed at the ground surface, in lieu of better alternatives, resulting in the following relations (valid for the 100–500 m depth range):
σ H = 0.113z (r2 = 0.74),
σ h = 0.069z (r2 = 0.69),
19
where all stresses are in MPa and z is the depth below ground surface in meters. For the vertical stress, a gradient of 0.033 MPa/m was found from linear regression (with r2 = 0.21). Assuming that the vertical stress corresponds to the overburden weight, a slightly different relation is obtained, which is also fits the data quite well:
σ v = 0.027z.
The re-interpreted data still indicate some clustering of stresses (for σH) in the upper 300 m of the borehole (see Figure A-2 in Appendix A) – something, which is less well represented through a linear fit. The maximum horizontal stress is (with two exceptions) less than 30 MPa above the 300 m level. Below this level, a linear stress increase is more evident (although the number of measurements are few). However, the quoted estimate of σH = 65 MPa below the 320 m level (based on core discing) would imply an even higher leap of stress magnitude compared to the upper 300 m. Based on the available data it is difficult to state, with certainty, which of these interpretations that are most representative of the actual conditions. This issue is discussed in Section 3.3.1.
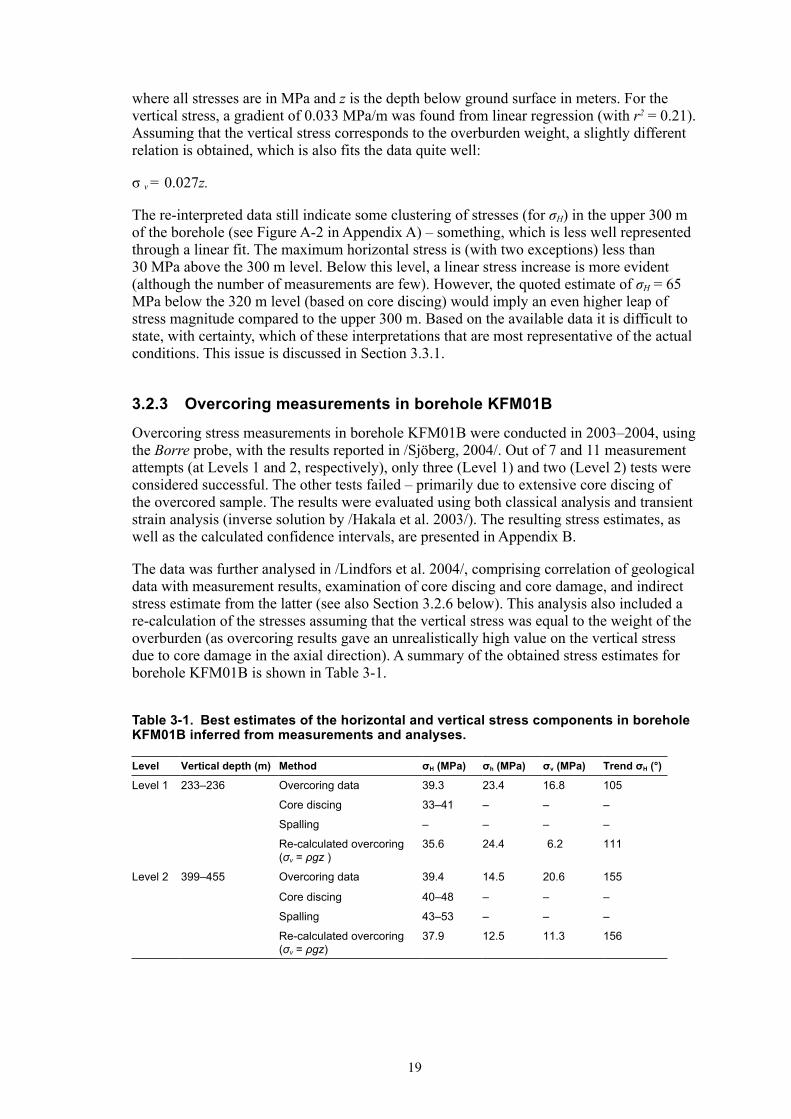
3.2.3 Overcoring measurements in borehole KFM01B
Overcoring stress measurements in borehole KFM01B were conducted in 2003–2004, using the Borre probe, with the results reported in /Sjöberg, 2004/. Out of 7 and 11 measurement attempts (at Levels 1 and 2, respectively), only three (Level 1) and two (Level 2) tests were considered successful. The other tests failed – primarily due to extensive core discing of the overcored sample. The results were evaluated using both classical analysis and transient strain analysis (inverse solution by /Hakala et al. 2003/). The resulting stress estimates, as well as the calculated confidence intervals, are presented in Appendix B.
The data was further analysed in /Lindfors et al. 2004/, comprising correlation of geological data with measurement results, examination of core discing and core damage, and indirect stress estimate from the latter (see also Section 3.2.6 below). This analysis also included a re-calculation of the stresses assuming that the vertical stress was equal to the weight of the overburden (as overcoring results gave an unrealistically high value on the vertical stress due to core damage in the axial direction). A summary of the obtained stress estimates for borehole KFM01B is shown in Table 3-1.
Table 3-1. Best estimates of the horizontal and vertical stress components in borehole KFM01B inferred from measurements and analyses.
Level Vertical depth (m) Method σH (MPa) σh (MPa) σv (MPa) Trend σH (°)
Level 1 233–236 Overcoring data 39.3 23.4 16.8 105
Core discing 33–41 – – –
Spalling – – – –
Re-calculated overcoring (σv = ρgz )
35.6 24.4 6.2 111
Level 2 399–455 Overcoring data 39.4 14.5 20.6 155
Core discing 40–48 – – –
Spalling 43–53 – – –
Re-calculated overcoring (σv = ρgz)
37.9 12.5 11.3 156

20
3.2.4 Hydraulic fracturing measurements in boreholes KFM01A, KFM01B, KFM02A and KFM04A
A large measurement campaign involving hydraulic fracturing (HF) and hydraulic tests on pre-existing fractures (HTPF) was carried out in four boreholes at the Forsmark site during 2004. A total of 85 tests were conducted, as reported by /Klee and Rummel, 2004/. The final, interpreted, results are presented in Appendix C. These results are based on inversion analysis of selected test data and indicate a vertical stress approximately equal to, or slightly larger than, the overburden pressure. The minimum horizontal stress is fairly equal to the vertical stress, whereas the maximum horizontal stress is approximately 1.5 times the vertical stress. The stress orientations vary from 100° to 145° for the reported test data.
However, there is considerable scatter in this data set, in particular for the determination of the maximum horizontal stress. During field measurements, problems with healed and/or very tight fractures inhibited opening. It was attempted to carry out HTPF measurements on these, but often a classical breakdown response (i.e. hydraulic fracturing) was experienced. Several non-axial (sometimes horizontal) fracture traces were also obtained during hydraulic fracturing. Finally, imprints were not taken for all tests, thus adding to the uncertainty of which fracture orientation was actually tested.
To increase the confidence in the stress determination, a selected data set was evaluated. The only stress component that is reliably determined from hydrofracturing is the normal stress to the induced fracture /see e.g. Ito et al. 1999/. Hence, the vertical and minimum horizontal stress can be assessed by analysing tests on horizontal and vertical fractures, respectively. Only tests with fractures dipping less than 20° from the horizontal were used to assess the vertical stress component (fractures were chosen from both imprints and core log). To assess the minimum horizontal stress, only tests with single or double axial fractures as determined from imprints and with dip of more than 75° from the horizontal were used (test sections with non-axial fractures and pre-existing fractures were excluded). The maximum horizontal stress could not be reliably evaluated from the reported data and was thus not included in the selected data set.
The selected data comprised 22 test for assessing the vertical stress, and 12 tests for assessing the minimum horizontal stress. These data are from boreholes KFM01A, KFM01B, and KFM02A. No tests from KFM04A satisfied the selection criteria described above. The selected data are presented in Appendix C, Figure C-4. These data confirm that the vertical stress is close to the weight of the overburden. Significant scatter is found for the minimum horizontal stress, as well as for the stress orientations. It may, tentatively, be concluded that σh ≈ σv, but stress orientations are not conclusive. A full evaluation and (in part) re-interpretation of the hydraulic tests in these boreholes is currently underway /Ask, 2005/.
3.2.5 Other measurements
The other conducted stress measurements in the Forsmark area comprise overcoring measurements in a short vertical hole (D358) near DBT-1 and DBT-3, doorstopper measurements in short boreholes from the discharge tunnel from the power plant, overcoring in relatively short boreholes near the SFR facility (the final repository for radioactive operational waste) – boreholes SFR 1/177, KB-21, KB-22, KB7-S – and hydraulic fracturing in the 500 m-deep borehole DBT-1, as summarized in Table 3-2.

21
Table 3-2. Other stress measurements at Forsmark.
Site Borehole name Method ReferenceForsmark D358 OC /SSPB, 1982/; /Hiltscher and Strindell, 1976/Forsmark Discharge tunnel OC (2D) /SSPB, 1982/; /Martna et al. 1983/Forsmark BH SFR 1/177 OC /Ljunggren and Persson, 1995/Forsmark KB-21 OC /Ljunggren and Persson, 1995/Forsmark KB-22 OC /Ljunggren and Persson, 1995/Forsmark KB7-S OC /Ljunggren and Persson, 1995/Forsmark DBT-1 *) HF /Stephansson and Ångman, 1984/
*) Same boreholes as that in which overcoring measurements were conducted, see Section 3.2.2.
Borehole D358 was a short vertical borehole located near unit 3 of the power plant, see Figure 3-4. Measurements in this borehole were conducted prior to the measurements in boreholes DBT-1 and DBT-3. A total of seven successful measurements were taken from 6 to 31 m vertical depth below the surface. Since the rock exhibited major residual stresses, the results were only presented as stresses in the horizontal-vertical planes /Hiltscher and Strindell, 1976; SSPB, 1982/.
Overcoring doorstopper measurements (two-dimensional) were conducted in four boreholes in the discharge tunnel of units 1 and 2 of the power plant. Only the horizontal stress components were measured with this method.
Measurements in borehole SFR 1/177 were conducted in the SFR access tunnel at chainage 1/177 in 1985. A total of 4 measurements were conducted in a 17 m long borehole from the tunnel, located at 25 m depth. Measurements in boreholes KB-21 and KB-22 were done from the SFR construction tunnel at chainage 5/965 respectively 6/058, also in 1985. A total of eight and five measurements were made in the upward oriented boreholes (–35° and –10°) of 47 and 29 m length, respectively. The boreholes were drilled from the tunnel at 70 and 63 m depth below the ground surface (sea level), respectively. Measurements in KB7-S were conducted in 1981 and involved 10 measurements in vertical borehole from the ground surface and down to 144 m depth.
Measurements using hydraulic fracturing in borehole DBT-1 (in which overcoring was previously conducted) were carried out in 1984 and reported by /Stephansson and Ångman, 1984/. Measurements were taken down to 491 m depth. Orientations could only be successfully determined for one test, at 289 m depth.
The results from these measurements are presented in Appendix D, along with calculated confidence intervals for each measurement level. Data from the doorstopper measurements in the discharge tunnel were not included in this analysis, as the raw data could not be accessed. Furthermore, confidence intervals were not calculated for borehole D358 as measurements were more or less evenly spread out over the borehole length.
The results from borehole SFR 1/177 resulted in drastically different stress orientations, probably as result of this borehole being located in or near the Singö deformation zone /Carlsson and Christiansson, 1986/. Hence, this data set was excluded from the compound analysis. The remaining data indicate large variations in stress magnitudes, as could be expected at shallow depths (and considering the measurement precision, see e.g. /Sjöberg and Klasson, 2003/). Fairly large horizontal stresses were measured in borehole D358 – around 25 MPa at 30 m depth. The horizontal stress was considerable also in the other boreholes – up to 15 MPa at 40 m depth, nearly 20 MPa at 100 m depth, and 25 MPa at 145 m depth. The vertical stress, at least below 100 m depth, is close to the overburden pressure, but the scatter is large close to the ground surface. The minimum horizontal stress tends to be larger than the vertical stress.

22
The principal stresses appear to be oriented in the vertical-horizontal plane; the minor principal stress (σ3) is almost vertical in every case. The orientation of the maximum horizontal stress varies between 110° and 170° for the overcoring measurements, with the exception of three (out of 30) measurements. The only hydraulic fracturing orientation data yielded a trend of 145° for σH.
The data from measurements in horizontal boreholes (KB-21 and KB-22) indicate lower stress magnitudes when compared to data from vertical holes, at least for the maximum horizontal stress. However, the vertical depth range for the horizontal holes is small (≈ 60–80 m) compared to the vertical measurement holes (≈ 40–150 m); hence, this may be a local effect.
The data from the discharge tunnel measurements (two-dimensional) pointed at horizontal stresses of between 9 and 15 MPa, oriented at 120–156°. Thus, these data seem to confirm the trend indicated from the three-dimensional overcoring measurements at shallow depths at Forsmark.
3.2.6 Indirect stress estimates
Extensive core discing was observed in conjunction with the overcoring measurements in borehole KFM01B /Sjöberg, 2004/. The core discing was primarily of ring discing type, i.e. fracturing of the overcored rock cylinder into thin, ring-shaped, discs. Discing of solid core was only observed for a few cases in borehole KFM01B – at 427.5 m borehole length, as well as between 431 and 433 m borehole length /Lindfors et al. 2004/.
The extent of core discing has been mapped also in the other cored boreholes at the Forsmark site. This includes boreholes KFM02A, KFM04A, KFM05A /SKB, 2004b/, with the results summarized in Appendix I. No clear signs of core discing (fully separated discs) were noted during logging of borehole KFM01A. Some of the logged fractures may be interpreted as signs of incipient discing; however, this was not systematically logged for the core from KFM01A. The estimated possible extent of incipient discing is, nevertheless, very limited in KFM01A /Berglund, 2004/. Core discing of solid core has only been observed for some portions of the drill core from each of the other boreholes. For borehole KFM02A, core discing was noted at 428 and 925 m borehole lengths (approximately equal vertical depth), whereas for boreholes KFM04A and KFM05A, discing was observed already at 120 m and 150 m borehole length, respectively, and then occurring intermittently throughout the borehole.
Borehole KFM04A intersects the boundary of the tectonic lens at approximately 480–500 m borehole length /Petersson et al. 2004/. Below 543 m, no core discing was observed in borehole KFM04A. The observed core discing occurred in different rock types, both granite to granodiorite, and pegmatite to pegmatite granite. Core discing in pegmatitic rock was observed at 305–307 m and 468–471 m borehole length. In borehole KFM05A, the only occurrence of discing in pegmatite was at 979 m borehole length (Appendix I). It is noteworthy that core discing does not appear to be confined to a particular rock type, not even in a particular section of core discing. Furthermore, a rough study of the core logs from each hole showed no clear correlations between frequency of open fractures and the occurrence of core discing.

23
Information on core discing can be used to estimate the virgin stress state, using the methodology described by /Hakala, 1999a,b, 2000/. This methodology is based on the assumption that core discing is caused by pure tensile failure, and that the rock behaves as a continuous, homogeneous, linear-elastic and isotropic material (up to the point of failure). A set of nomograms can be used for quick and rough estimates of the virgin stresses, given the disc thickness, the tensile strength, and the σh /σH-ratio. /Lindfors et al. 2004/ used these nomograms to estimate the stresses in borehole KFM01B based on ring discing, as summarized above in Table 3-1. The nomograms can also be used to assess the virgin stresses based on solid core discing. However, an accurate determination of the stress state requires information on core discing both from normal coring (solid core) and overcoring from the same depth, which is not available from Forsmark.
The results from indirect tensile tests on samples from boreholes KFM01A, KFM02A, KFM03A, and KFM04 /Jacobsson, 2004a,b,c,d; Eloranta, 2004/ were used to assess the tensile strength of the rock in borehole KFM01B. /Hakala, 1999a/ states that failure leading to discing is more likely to be a combined yield (σ3 < 0) than pure uniaxial tensile failure. However, only tensile stress was considered in the developed methodology /Hakala, 1999a,b, 2000/. The errors introduced were deemed to be small for hard rocks, but could be considerable for lower-strength rocks. Test data on direct tensile strength are not available for the Forsmark site. However, it may be argued that the indirect strength more closely resembles the mechanisms governing core discing. Given the inherent uncertainties in using the nomograms for stress estimation (as described above), the possible differences in direct and indirect tensile strength values are anyhow judged to be of relatively lesser importance for this exercise. The indirect tensile strength data indicated fairly consistent results with an indirect tensile strength in the range of 10–20 MPa, with a mean of around 14 MPa (for all boreholes). The differences between various rock types and/or different sampling depths (in the boreholes) were small with no clear trends. Hence, the mean value was primarily used in the following.
Using the nomograms of /Hakala, 1999a/ along with: (i) the value on the tensile strength (ii) the core discing data in Appendix I, (iii) an assumed vertical stress equal to the overburden pressure, and (iv) an assumed value of 0.25 for Poisson’s ratio (the only value for which the nomograms are valid), the results according to Table 3-3 were obtained for the observed discing in solid cores. Here, stresses were only calculated for a few representative depths, and for an average disc thickness for the sections in which core discing had been observed. For each depth, two values were calculated corresponding to an assumed σh /σH-ratio of 0.25 and 0.50, respectively. The nomograms assume that the vertical stress is oriented parallel to the borehole axis. As shown by /Hakala, 1999a/, the induced tensile stresses on the core in an inclined borehole may be even higher than in a vertical borehole, but the effect on disc thickness was not analysed. Due to lack of better alternatives, the nomograms were applied also to inclined boreholes, such as KFM04A, to arrive at preliminary estimates of the stress state based on observed discing, bearing in mind that the basic assumptions of the method were not fulfilled for such boreholes. The details of the methodology using the nomograms are described in /Lindfors et al. 2004/.

24
In borehole KFM04A, discing has only been observed down to approximately 400 m vertical depth. These observations indicate stress magnitudes of between 51 and 67 MPa. For the other two boreholes, maximum horizontal stresses of between 45 and 85 MPa can be inferred. The majority of the data group around 60 MPa, see also Figure I-1 in Appendix I.
The lack of solid core discing for the other portions of the boreholes at Forsmark (cf Appendix I) indicates that stresses are probably lower at these sections (assuming that the tensile strength is fairly constant). Using the nomograms of /Hakala, 1999a/, a very crude estimate may be obtained of the upper limit of stress magnitude before the initiation of core discing (assuming that coring diameter has negligible influence on the resulting stress magnitude). This analysis indicates a maximum horizontal stress of σH = 55 MPa for an average tensile strength of 14 MPa. The results are similar regardless of the chosen σh/σH- ratio. This value can thus be used an upper limit to the maximum horizontal stress in areas with no observed core discing. As core discing is somewhat more abundant below approximately 400–450 m depth (for all the boreholes except KFM04A), the upper limit of σH = 55 MPa is applicable at least down to approximately 450 m depth. However, since the obtained value on discing stress is strongly dependent on the tensile strength, it may be prudent to use the measured variation in indirect tensile strength to calculate an interval of the “discing stress”. Thus, using a minimum value of 10 and a maximum value of 20 for σt, the resulting values of the discing stress is 40 and 79 MPa.
The nomograms of /Hakala, 1999a/ was also applied to the reported core discing in borehole DBT-1 (see Section 3.2.2). In this case, discing occurred in overcored samples with a reported disc thickness of 12 to 18 mm /Martna et al. 1983/. Using these values and an assumed tensile strength of 14 MPa, the resulting stresses in Table 3-4 were obtained. These data indicate a maximum horizontal stress of 41–48 MPa in areas where core discing was observed (the thinner discs dictate the maximum stress value). These values are lower than the previous estimate by /Martna et al. 1983/ of σH = 65 MPa. It must be noted that no test data on tensile strengths are available from borehole DBT-1; hence, the actual strength may differ from the assumed value. Since the tensile strength has a large influence on the stress levels, the data in Table 3-4 should be used with caution. A summarizing plot of all stress estimates from core discing data is showin in Appendix I.
The use of core discing to estimate in situ stress magnitudes is still a novel approach and calibration with additional field data is required. Therefore, these results must be used with caution. Nevertheless, qualitative comparisons with other sites (such as URL in Canada, and Hästholmen in Finland) at which extensive core discing has been observed confirm that the values stated above are not unreasonable considering the discing geometry and the rock types at the Forsmark site /Lindfors et al. 2004/.

25
Table 3-3. Stress estimation from discing of solid core in boreholes KFM02A, KFM04A, and KFM05A, using nomograms by /Hakala, 1999a/.
Borehole no
Vertical depth (m)
Section length (m)
Geology ***) Disc thickness (mm)
σh/σH σH (MPa)
KFM02A 500 0.08 Granite, granodiorite and tonalite 34 *) 0.25 N/A
KFM02A 500 0.08 Granite, granodiorite and tonalite 34 *) 0.50 59
KFM02A 925 0.04 Granite, granodiorite and tonalite 34 *) 0.25 N/A
KFM02A 925 0.04 Granite, granodiorite and tonalite 34 *) 0.50 60
KFM04A 220 1.66 Granite to granodiorite and pegmatite to pegmatite granite
18 0.25 58
KFM04A 220 1.66 Granite to granodiorite and pegmatite to pegmatite granite
18 0.50 63
KFM04A 260 1.08 Granite to granodiorite and felsic to intermediate volcanic rock and pegmatite to pegmatite granite
16 0.25 56
KFM04A 260 1.08 Granite to granodiorite and felsic to intermediate volcanic rock and pegmatite to pegmatite granite
16 0.50 67
KFM04A 345 0.64 Granite to granodiorite, tonalite and amphibolite
16 0.25 57
KFM04A 345 0.64 Granite to granodiorite, tonalite and amphibolite
16 0.50 67
KFM04A 390 13.43 **) Granite to granodiorite, amphibolite, tonalite and pegmatite to pegmatite granite
18 0.25 51
KFM04A 390 13.43 **) Granite to granodiorite, amphibolite, tonalite and pegmatite to pegmatite granite
18 0.50 64
KFM05A 126 0.15 Granite to granodiorite 11 0.25 N/A
KFM05A 126 0.15 Granite to granodiorite 11 0.50 N/A
KFM05A 168 0.37 Granite to granodiorite 12 0.25 N/A
KFM05A 168 0.37 Granite to granodiorite 12 0.50 N/A
KFM05A 294 0.02 Granite to granodiorite 10 0.25 85
KFM05A 294 0.02 Granite to granodiorite 10 0.50 N/A
KFM05A 462 0.06 Granite to granodiorite and breccia 12 0.25 54
KFM05A 462 0.06 Granite to granodiorite and breccia 12 0.50 N/A
KFM05A 504 1.5**) Granite to granodiorite 15 0.25 45
KFM05A 504 1.5**) Granite to granodiorite 15 0.50 73
KFM05A 756 0.68 Granite to granodiorite and pegmatite to pegmatite granite
18 0.25 N/A
KFM05A 756 0.68 Granite to granodiorite and pegmatite to pegmatite granite
18 0.50 58
*) Disc thickness assumed as 34 mm, since no value was given in the logging data.**) Part of borehole containg sections of possible core discing, section span is not given more precisely in the
logging data.***) Geology at core discing position, see Appendix I.N/A = Not applicable; solution did not converge.

26
Table 3-4. Stress estimation from discing of overcore samples in borehole DBT-1, using nomograms by /Hakala, 1999a/.
Borehole no
Vertical depth (m)
σv = ρgz (MPa)
σh/σH Disc thick-ness (mm)
σT/σH σv/σH σH (MPa)
DBT-1 320 8.5 0.50 12 0.34 0.20 41
DBT-1 320 8.5 0.50 18 0.54 0.33 26
DBT-1 320 8.5 0.25 12 0.30 0.18 47
DBT-1 320 8.5 0.25 18 N/A N/A N/A
DBT-1 500 13.2 0.50 12 0.33 0.31 42
DBT-1 500 13.2 0.50 18 N/A N/A N/A
DBT-1 500 13.2 0.25 12 0.29 0.27 48
DBT-1 500 13.2 0.25 18 N/A N/A N/A
Tensile strength, σT, has been assumed as 14 MPa; no test data available from the borehole.N/A = Not applicable; solution did not converge.
3.2.7 Stress information from measured P-wave velocities
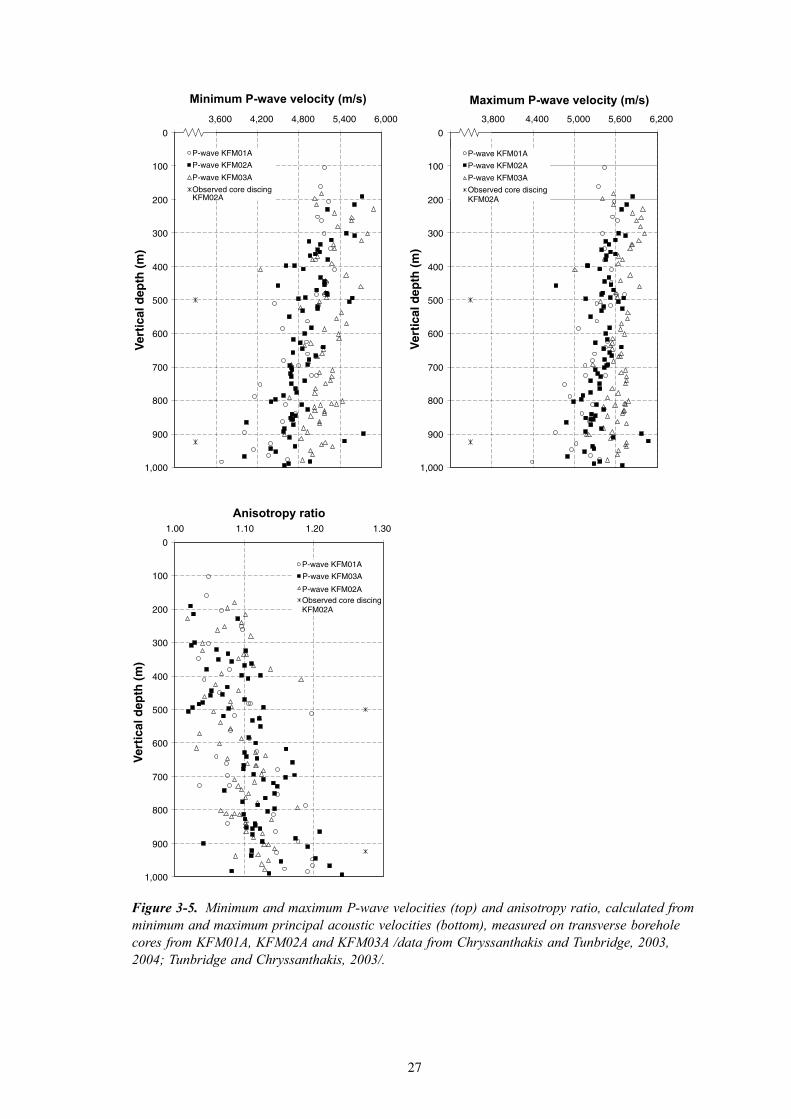
P-wave velocity measurements have been carried out on drill cores from boreholes KFM01A (34 tests), KFM02A (74 tests) and KFM03A (68 tests). Three measurements were also conducted on cores from KMF03B and reported together with the results from the KFM03A-measurements /Chryssanthakis and Tunbridge, 2003, 2004; Tunbridge and Chryssanthakis, 2003/. Due to the few numbers of tests from borehole KFM03B, these data were not included in this study.
The measured maximum and minimum P-wave velocities from the three considered boreholes are shown in Figure 3-5. The scatter in measured maximum P-wave velocity in each borehole appears to be slightly larger between 300 and 500 m vertical depth. Below 500 m, the scatter is markedly smaller, and again increasing below approximately 700 m vertical depth. The scatter for the measured minimum P-wave velocities is larger compared to the maximum velocities, but similar trends may be observed for this data set.
The anisotropy ratio is here defined as the measured maximum velocity divided with the measured minimum velocity for a certain sample/depth. The calculated anisotropy ratios for the three boreholes are shown in Figure 3-5. These results show a gradually increasing anisotropy ratio below approximately 500–600 m vertical depth. Above 500 m, there is a fairly consistent pattern with anisotropy ratios between 1.02 and 1.13 for all boreholes (with a few exceptions for cores from KFM03A).
The P-wave data cannot be used to quantify the stress magnitudes; rather, they indicate that the stress magnitudes are high enough to cause damage to intact core samples at the depth where the anisotropy in P-wave velocity increases. Larger differences in principal stress magnitudes would result in larger differences in core damage due to the anisotropic stress relief that the core is subjected to. Hence, the measured anisotropy ratio can be used as a qualitative measure of the core damage potential /see also e.g. Martin and Stimpson, 1994/. In the present case, the potential for core damage (microcracking) significantly increases below 500–600 m vertical depth.
The observed core discing in borehole KFM02A is also shown in Figure 3-5 (no discing observed in KFM01A or KFM03A). The onset of core discing observed in borehole KFM02A correlates roughly with the increase in measured anisotropy ratio. This finding implies that a threshold is reached in terms of stress magnitude that the cores can withstand. This does not necessarily imply any drastic change in stresses below this depth – a slow linear stress increase with depth can also explain these findings.
27
Figure 3-5. Minimum and maximum P-wave velocities (top) and anisotropy ratio, calculated from minimum and maximum principal acoustic velocities (bottom), measured on transverse borehole cores from KFM01A, KFM02A and KFM03A /data from Chryssanthakis and Tunbridge, 2003, 2004; Tunbridge and Chryssanthakis, 2003/.
0
100
200
300
400
500
600
700
800
900
1,000
3000 3,600 4,200 4,800 5,400 6,000
P-wave KFM01A
P-wave KFM02A
P-wave KFM03A
Observed core discingKFM02A
0
100
200
300
400
500
600
700
800
900
1,000
3200 3,800 4,400 5,000 5,600 6,200
P-wave KFM01A
P-wave KFM02A
P-wave KFM03A
Observed core discingKFM02A
0
100
200
300
400
500
600
700
800
900
1,000
1.00 1.10 1.20 1.30
P-wave KFM01A
P-wave KFM02A
P-wave KFM03A
Observed core discingKFM02A
Minimum P-wave velocity (m/s)
Ver
tica
l dep
th (
m)
Ve r
tica
l dep
th (
m)
Ver
tica
l dep
th (
m)
Anisotropy ratio
Maximum P-wave velocity (m/s)

28
3.3 Geological correlation and stress state3.3.1 Effect of major deformation zones
The major deformation zones (Forsmark, Eckarfjärden, and Singö) that surround the tectonic lens of the candidate area are likely to influence the virgin stress state. The possible effects of the shallow-dipping, ESE-WNW trending zone (ZFMNE00A2, see Section 3.1) inside the lens, are also of interest. The locations of these deformation zones are shown on a horizontal projection in Figure 3-6, and in a perspective view in Figure 3-7 along with the location of the investigation boreholes.
The stress measurement results obtained on either side of the Singö deformation zone are compared in Figure 3-8 (for similar depths). This data set now also includes measurements above 100 m in boreholes DBT-1 and DBT-3 (these were previously excluded, cf Section 3.2.2). However, it should be noted that these data were not re-analysed using transient strain analysis; hence, some uncertainty remains as to the validity of the results.
Figure 3-6. Map of the Forsmark site showing all boreholes in which rock stress measurements have been conducted, along with the approximate location of major deformation zones (Singö, Eckarfjärden and Forsmark), all striking NW-SE, and the newly detected flatly-dipping zone ZFMNE00A2 (orientation 080/24) daylighting near drill site 1 (boreholes KFM01A, KFM01B).

29
Although not entirely conclusive, the comparison in Figure 3-8 indicates that the horizontal stresses are higher to the west of the Singö deformation zone. This is most obvious at shallow depths (above 100 m), whereas the data below 100 m point at fairly similar horizontal stress magnitudes on either side of the deformation zone. The scatter in the vertical stress is high, but it appears to be less affected by the deformation zone. No clear trend can be observed for the stress orientations with respect to the Singö zone. It may, tentatively, be concluded that stress orientations are similar on either side of the deformation zone. A complicating factor in the above interpretation is that the measurement data do not completely overlap, in terms of measurement depth. Hence, only data west of the Singö zone are available above approximately 40 m depth, and below 100 m depth. All new, deep, boreholes within the candidate are also located west of the Singö zone, which precludes any comparisons at larger depths.
The ZFMNE00A2 zone intersects borehole KFM02A at approximately 415 m depth. Using the selected hydraulic test data of /Klee and Rummel, 2004/, cf Section 3.2.4, a comparison of measured stresses to the north and south of the ZFMNE00A2 zone is shown in Figure 3-9. The data from borehole KFM02A suggest a change in stress orientation on either side of the deformation zone; however, the data from boreholes KFM01A and KFM01B do not confirm that stress orientations are different – rather, they imply that the scatter is large. This data does not reveal any distinct differences in stress magnitudes on either side of the deformation zone. It is more plausible, however, that the zone primarily affects the maximum horizontal stress. Due to the uncertainties in the data from /Klee and Rummel, 2004/, this stress component could not be reliably evaluated; hence, no comparison is presently possible. The lack of overcoring data on either side of the ZFMNE00A2 zone precludes other comparisons or conclusions regarding possibly different stress regimes above and below such a structure.
Figure 3-7. Persective view of the Forsmark site looking south, showing location of boreholes for rock stress measurements, along with the location of major deformation zones /SKB, 2005/.

30
Figure 3-8. Comparison of results (horizontal and vertical stress components) from overcoring measurements located east (filled markers) and west (open markers) of the Singö deformation zone. (Note that data from DBT-1 and DBT-3 above 100 m depth have not been re-analysed using transient strain analysis, cf Section 3.2.2).
0
20
40
60
80
100
120
140
0 10 20 30 400
20
40
60
80
100
120
140
-10 0 10 20
0
20
40
60
80
100
120
140
-10 0 10 200
20
40
60
80
100
120
140
0 30 60 90 120 150 180
East of Singö-lineSFR 1/177 [OC]KB-21 [OC]KB-22 [OC]KB7-S [OC]West of Singö-lineDBT 1 [HF]DBT-1 [OC]DBT-3 [OC]D358 [OC]
σH (MPa)V
erti
cal d
epth
(m
)
Ver
tica
l dep
th (
m)
Ver
tica
l dep
th (
m)
Ver
tica
l dep
th (
m)
σh (MPa)
σV (MPa) Orientation of σH (°)

31
Figure 3-9. Comparison of results (horizontal and vertical stress components) from hydraulic fracturing measurements north (open markers) and south (filled markers) of the ZFMNE00A2 deformation zone (orientation 080/20); cf Figure 3-6.
0
100
200
300
400
500
600
700
800
900
1,000
0 10 20 30
0
100
200
300
400
500
600
700
800
900
1,000
0 10 20 30
0
100
200
300
400
500
600
700
800
900
1,000
0 30 60 90 120 150 180
KFM01AKFM01BKFM02ATheory
Ver
tica
l dep
th (
m)
Ver
tica
l dep
th (
m)
Ver
tica
l dep
th (
m)
σh (MPa)
σv (MPa) Orientation of σH (°)

32
Another deformation zone – ZFMNE1192, oriented 073/82 – intersects borehole KFM01B at around 415–454 m depth /SKB, 2005/. Measurements were taken both above and below this zone /Sjöberg, 2004; Lindfors et al. 2004/. However, the data did not reveal any significant differences in stress state above and below this zone. The vertical and minimum horizontal stresses are lower below the zone, whereas σH is somewhat higher. The orientations are virtually unaffected. The confidence intervals for the orientations and the maximum horizontal stress are also small /see Lindfors et al. 2004/.
In boreholes DBT-1, the high stresses measured below 320 m, as well as the observed core discing below this depth, were previously interpreted as an effect of having passed a heavily fractured zone at 320 m depth in DBT-1, thus moving into a different stress regime /SSPB, 1982/. The number of observations was few, thus making this conclusion somewhat speculative. The re-analysed data (Section 3.2.2) showed a reasonably good fit for a constant stress gradient with depth. Also, the stress estimates based on core discing reported in Section 3.2.6 point at stresses being 41–48 MPa in areas of core discing, which fits well with the re-analyzed data (cf Figure A-2 in Appendix A). The observed core discing can be explained as simply having passed the point where the induced stresses on the overcore sample exceed the damage threshold of the rock substance, and does not necessarily imply a drastic change in stress magnitude below a certain depth.
On the other hand, the difficulties in obtaining measurements below 320 m can be interpreted as stresses in general being higher than the local measurements showed (measurements only possible in areas with locally lower stress magnitudes) according to /Martna et al. 1983/. This would imply that the maximum horizontal stress generally was higher than 65 MPa below 320 m depth (which is the maximum value measured). If this holds true, the notion of two different stress regimes above and below the fracture zone appears reasonable.
Unfortunately, neither of the above two hypothesis can be fully confirmed due to lack of reliable measurement data at depth (below the fracture zone). The possibility of two different stress regimes above and below fracture zones exists, and must be considered in future work at the site. It is also clear that once core discing is initiated, then overcoring measurements become less reliable and must be supplemented by other measurement methods.
3.3.2 Effect of lithology and fractures
The conducted measurements (overcoring and hydraulic fracturing) at Forsmark have, to a large extent, been conducted in the same rock domain (RFM029, see Figure 3-1). Local variations in lithology exist for some of the measurement locations. A comparison of measurement results with respect to deviations from the dominant rock type (granite to granodiorite, metamorphic, medium-grained) is shown in Figure 3-10 /geological data taken from SSPB, 1982; Petersson and Wängnerud, 2003; Petersson et al. 2003; Berglund et al. 2004/. The horizontal stress components (σH and σh) are slightly lower for measurements taken in grey gneiss granite and grey gneiss granite, aplitic rock. No trends (with respect to geology) are obvious for the vertical stress and the major stress orientation. Similar findings were reported by /Carlsson and Christiansson, 1986/.

33
Figure 3-10. Comparison of results (horizontal and vertical stress components) from stress measurements at Forsmark with respect to rock type at the test position.
0
100
200
300
400
500
600
700
800
900
1,000
0 10 20 30 40 50 60
0
100
200
300
400
500
600
700
800
900
1,000
-10 0 10 20 30 40 50
0
100
200
300
400
500
600
700
800
900
1000
-10 0 10 20 30
0
100
200
300
400
500
600
700
800
900
1000
0 30 60 90 120 150 180
Unspecified geology
granite to granodiorite,metamorphic, medium-grained
grey gneiss granite
granite, fine- to medium-grained
grey gneiss granite, aplitic
massive pegmatitic granite
grey gneiss granite, redcoloured feldspars
granite, granodiorite andtonalite, metamorphic, fine-to medium-grained
σH (MPa)
Ver
tica
l dep
th (
m)
Ver
tica
l dep
th (
m)
Ve r
tica
l dep
th (
m)
Ve r
tica
l dep
th (
m)
σh (MPa)
σv (MPa) Orientation of σH (°)

34
In the evaluation of overcoring measurements in KFM01B /Lindfors et al. 2004/, no clear correlation could be found between rock types and measurement results. Nor could the difference in stress orientation between the two measurement levels be linked to any geological structures. However, this study indicated that measurements at Level 1 in KFM01B were located in rock with a lower frequency of open fractures, compared to Level 2. Hence, it is not surprising that the measured stresses were as high as, or even higher, at Level 1 compared to Level 2, since the areas of fracture-free rock would attract stresses more easily.
The fracture frequency for the site in general is lower at larger depths (cf Section 3.1), which also may have some impact on the stress magnitudes. /Carlsson and Christiansson, 1986/ stated that measurements showed large scatter with respect to both magnitude and orientation down to approximately 50–60 m depth. Below this level, stresses appeared to increase relatively constantly with depth. These trends are also apparent in the current, complete data set from Forsmark. However, the available data does not provide any confirmation of significant changes in stress magnitudes below a certain depth, basically due to the lack of shallow data from some boreholes, or the lack of deep data from other boreholes. Such hypotheses must be confirmed through additional measurements at the site.
3.4 Comparison of methods for stress determinationThe fact that both overcoring and hydraulic methods have been used in the same boreholes (DBT-1 and KFM01B) at Forsmark, provides a unique opportunity to compare the results of each method. The data from both these boreholes (Figure 3-11) show that hydraulic methods (in this case tests on pre-existing fractures in borehole KFM01B) gave lower values on the vertical stress, which also are in good agreement with the overburden pressure. Hydraulic methods also resulted in lower values on the minimum horizontal stress (in both boreholes), and significantly lower values on the maximum horizontal stress. The latter is not surprising since, in hydraulic fracturing, the only stress component that is reliably determined is the minimum horizontal stress (or rather the normal stress to the initiated fracture), see e.g. /Ito et al. 1999/. The maximum horizontal stress is generally underestimated, and can, at best, be considered as a lower limit to the actual stress. There are too few orientation data from hydraulic fracturing available to do a comparison per borehole. Comparing orientation data from all measurements at the site combined, the total scatter tends to be equally large for overcoring and hydraulic fracturing measurements, whereas the average orientations are fairly similar.
The current data cannot be used to state conclusively which method that is most suitable for application at the Forsmark site. It appears however, that hydraulic fracturing should not be used as an only method, as the maximum stresses (which often are of most interest) cannot be assessed in a confident manner. Moreover, the fact that many non-axial (even horizontal) fractures were obtained in the latest measurement campaign implies that the method has some distinct drawbacks at the Forsmark site in particular.
Hydraulic tests on pre-existing fractures (HTPF) do not suffer from the limitation regarding the determination of σH (since only the normal stress acting on the fracture surface is measured). Determination of the stress components (σH, σh, σv, or σ1, σ2, σ3) requires, however, pre-existing fractures in different orientations, accurate determination of fracture orientation (through e.g. imprints or imaging tools) and a subsequent inversion analysis of the test data. Unfortunately, the conditions at the Forsmark site, with a (relatively) limited number of fracture orientations, as well as very tight fractures (low permeability) sometimes inhibiting fracture opening, are not ideal for the application of HTPF.

35
Overcoring measurements provide data on the full, three-dimensional stress tensor and is, in that respect, superior to hydraulic methods. On the other hand, overcoring measures the stress (or rather the strain) over a much smaller volume, making the method sensitive to local rock heterogeneities. The scatter from individual measurements tends to be larger for this method. In a study by /Martin et al. 2001/, it was also shown that although the scatter was larger for small measurement volumes, the mean value of ten overcoring measurements was very similar to that of one large-scale stress measurement techniques. Hence, it can be concluded that the larger scatter of small-scale methods require that more measurements are taken to obtain a reliable mean value. For the conditions at Forsmark, with a high horizontal-to-vertical stress ratio, and measurement in deep, vertical boreholes, the problem of tensile core damage is a limiting factor for overcoring applications. Once core discing occurs, the reliability of overcoring measurements is reduced.
However, tensile damage can also manifest itself as microcracking, causing anomalies in the measured strains. With the currently employed 76 mm borehole diameter for the Borre probe, the overcored sample is very susceptible to tensile damage in the axial direction. This problem can only be overcome completely by increasing the coring diameter – but this makes drilling to large depths much more difficult and costly. Cautious drilling (reduced rate and thrust) may improve conditions somewhat. The extent and effects of core damage can also be assessed through transient strain analysis /Hakala et al. 2003/. In fortunate cases, it is even possible to calculate stresses from the early pre-overcoring strains (prior to major damage of the rock).
The indirect stress estimates from core discing and spalling failures only provide approximate data on the maximum horizontal stress magnitude, with no information on orientation. This approach is thus more limited, but it has the important advantage of being coupled directly to real, observed, behaviour of the rock. As such, core discing observations and associated stress estimates, are important complements to direct measurements. The use of these indirect methods have been proven to confirm stress magnitudes from overcoring measurements, see e.g. Table 3-1.
In summary, overcoring, coupled with transient strain analysis, remain the primary method of choice for stress determination at Forsmark, but it must be used wisely with a high degree of quality control and careful examination of core damage potential, so as not to violate the basic assumptions of the method. The occurrence of core damage due to high horizontal stresses typically results in overestimated vertical stresses, whereas the horizontal stresses (when measured in a vertical borehole) are confidently determined. For the Forsmark site, the application of overcoring is probably limited in depth, due to the expected high horizontal stress magnitudes. For measurements below 500 m, hydraulic methods, preferably HTPF but also limited amount of HF, are probably required. However, for comparative purposes between methods and for combined inversions using hydraulic and overcoring data, the sampling interval for the two methods should overlap, i.e. hydraulic methods should also be conducted at shallow depths. HTPF is also required to accurately assess the vertical stress component. Core discing observations provide qualitative data on stress magnitudes, which supplement direct determinations and also provide important stress information from boreholes in which no measurements have been conducted. The use of several methods in conjunction can significantly improve the confidence in stress determination from a borehole or an area.

36
Figure 3-11. Comparison of results (horizontal and vertical stress components) obtained from hydraulic fracturing (HF) and overcoring (OC) measurements in boreholes DBT-1 and KFM01B.
0
100
200
300
400
500
600
0 10 20 30 40 50 60
0
100
200
300
400
500
600
0 10 20 30 40
0
100
200
300
400
500
600
0 10 20 300
100
200
300
400
500
600
0 30 60 90 120 150 180
DBT-1 [OC]
DBT 1 [HF]
KFM01B [OC]
KFM01B [HFMeSy]
σH (MPa) σh (MPa)
σv (MPa) Orientation of σH (°)
Ver
tica
l dep
th (
m)
Ve r
tica
l dep
th (
m)
Ver
tica
l dep
th (
m)
Ver
tica
l dep
th (
m)
37
4 Regional stress data
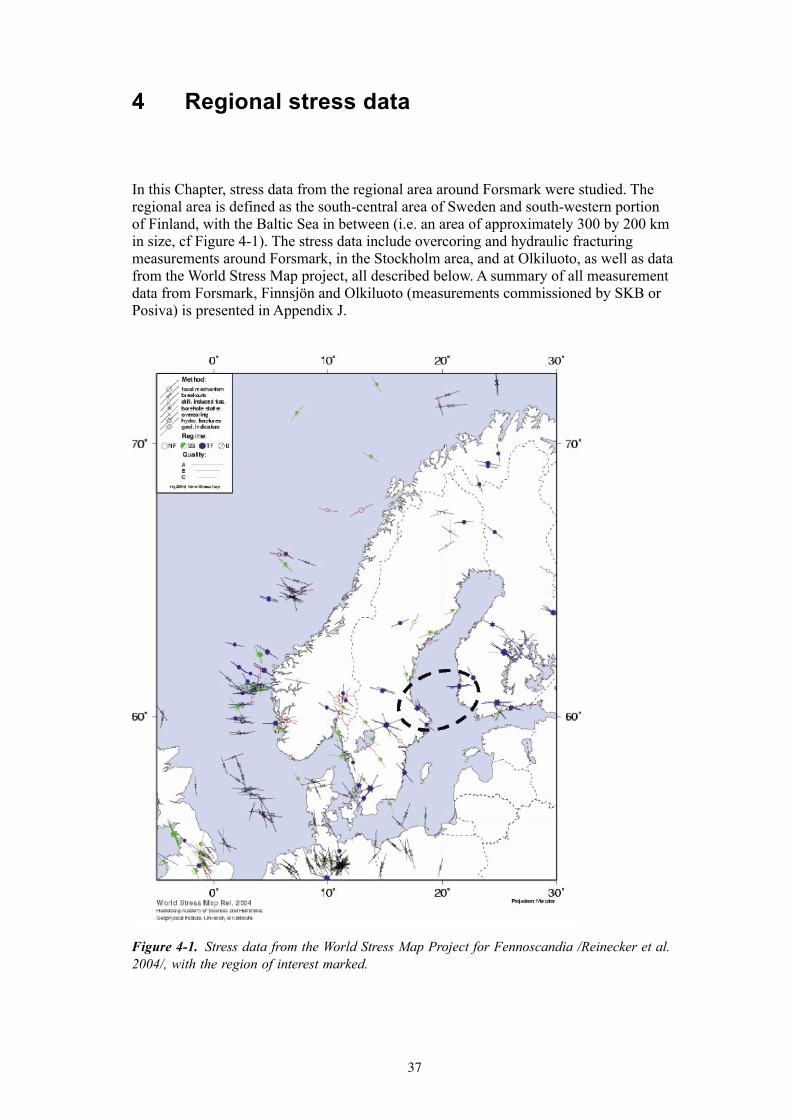
In this Chapter, stress data from the regional area around Forsmark were studied. The regional area is defined as the south-central area of Sweden and south-western portion of Finland, with the Baltic Sea in between (i.e. an area of approximately 300 by 200 km in size, cf Figure 4-1). The stress data include overcoring and hydraulic fracturing measurements around Forsmark, in the Stockholm area, and at Olkiluoto, as well as data from the World Stress Map project, all described below. A summary of all measurement data from Forsmark, Finnsjön and Olkiluoto (measurements commissioned by SKB or Posiva) is presented in Appendix J.
Figure 4-1. Stress data from the World Stress Map Project for Fennoscandia /Reinecker et al. 2004/, with the region of interest marked.
38
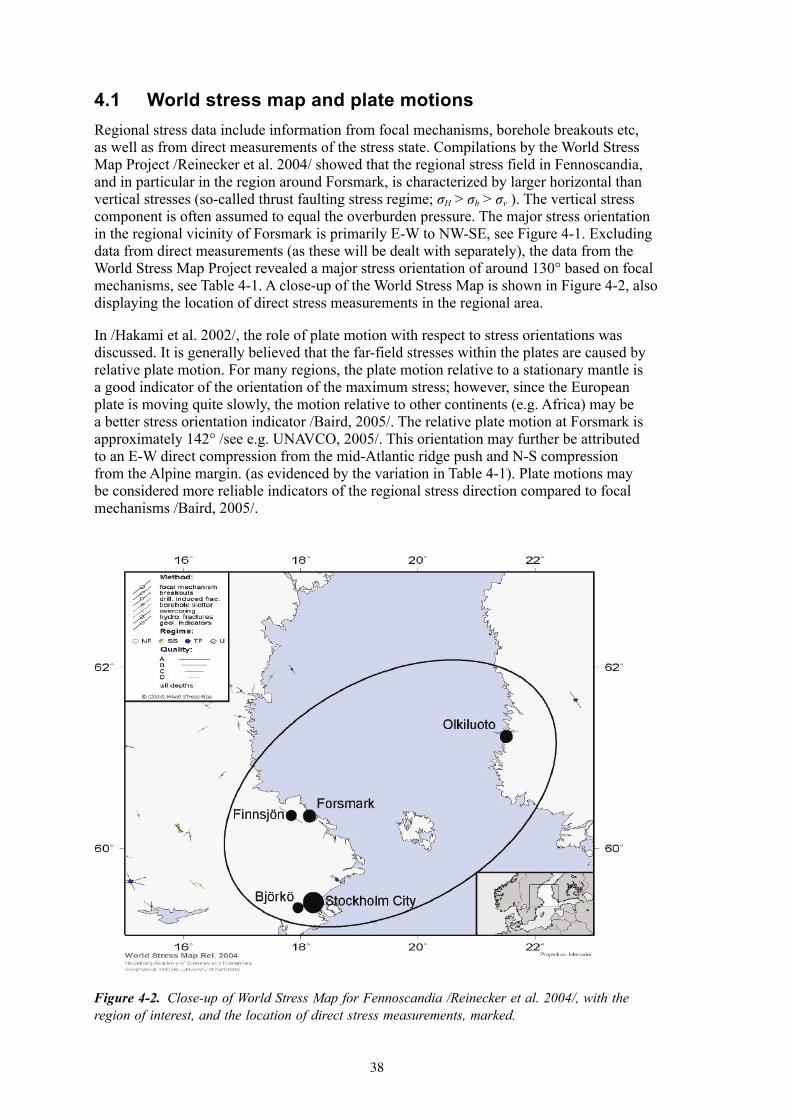
4.1 World stress map and plate motionsRegional stress data include information from focal mechanisms, borehole breakouts etc, as well as from direct measurements of the stress state. Compilations by the World Stress Map Project /Reinecker et al. 2004/ showed that the regional stress field in Fennoscandia, and in particular in the region around Forsmark, is characterized by larger horizontal than vertical stresses (so-called thrust faulting stress regime; σH > σh > σv ). The vertical stress component is often assumed to equal the overburden pressure. The major stress orientation in the regional vicinity of Forsmark is primarily E-W to NW-SE, see Figure 4-1. Excluding data from direct measurements (as these will be dealt with separately), the data from the World Stress Map Project revealed a major stress orientation of around 130° based on focal mechanisms, see Table 4-1. A close-up of the World Stress Map is shown in Figure 4-2, also displaying the location of direct stress measurements in the regional area.
In /Hakami et al. 2002/, the role of plate motion with respect to stress orientations was discussed. It is generally believed that the far-field stresses within the plates are caused by relative plate motion. For many regions, the plate motion relative to a stationary mantle is a good indicator of the orientation of the maximum stress; however, since the European plate is moving quite slowly, the motion relative to other continents (e.g. Africa) may be a better stress orientation indicator /Baird, 2005/. The relative plate motion at Forsmark is approximately 142° /see e.g. UNAVCO, 2005/. This orientation may further be attributed to an E-W direct compression from the mid-Atlantic ridge push and N-S compression from the Alpine margin. (as evidenced by the variation in Table 4-1). Plate motions may be considered more reliable indicators of the regional stress direction compared to focal mechanisms /Baird, 2005/.
Figure 4-2. Close-up of World Stress Map for Fennoscandia /Reinecker et al. 2004/, with the region of interest, and the location of direct stress measurements, marked.

39
Table 4-1. Relevant locations and stress orientations from the World Stress Map Project /from Reinecker et al. 2004/ in the vicinity of the Forsmark site.
Type Approximate locality Azimuth (trend relative to North)
FMS Veda – Norrtälje 128
FMS Länna Kyrksjö – Norrtälje 131
FMS Harg – Östhammar 20
FMS = single focal mechanism.
4.2 FinnsjönHydraulic fracturing measurements were conducted at Finnsjön in borehole KFI 06 in 1987. The borehole is located in the Brändan area about 15 km west of the Forsmark area in Tierp community. The measurements were conducted using the hydrofracturing instrumentation of the Division of Rock Mechanics at Luleå University of Technology, and reported by /Bjarnason and Stephansson, 1988/.
The results, in terms of the horizontal stress components, are presented in Appendix E, along with calculated confidence intervals for each measurement level. The data indicate a minimum horizontal stress (σh), which is fairly equal to the theoretical vertical stress due to overburden pressure. The maximum horizontal stress (σH) is about 1.5 times the minimum horizontal stress (however, uncertainties prevail regarding the determination of this component from hydraulic fracturing, see /Ito et al. 1999/). The orientation of the maximum horizontal stress is relatively consistently determined, trending 110–150°, with an average of around 140°. It can be noted that, for some of the measurement levels, the confidence intervals for the orientations (Figure E-3) indicate two possible orientations, which is a function of the uncertainty and scatter in the data. However, the majority of the data fall into the NW-SE orientation trend.
4.3 Stockholm City areaMeasurements in the Stockholm City area include primarily overcoring data at shallow depths (less than 50 m from the ground surface). One hydraulic fracturing measurement was also conducted down to approximately 40 m depth, see Table 4-2. All measurements were conducted for various infrastructure projects in Stockholm /see also Ljunggren and Persson, 1995/. The measured values for the vertical and horizontal stress components are presented in Appendix F, along with calculated confidence intervals. (It should be noted that 90%–intervals for the principal stress orientations could not be calculated in some cases – for these, 95%- or 97%-intervals are shown for comparison.)
The reported stress magnitudes vary significantly, primarily due to expected large variations in geology and fracturing close to the ground surface. However, it appears that the maximum horizontal stress is larger than the vertical stress for most of the measurements. Relatively high horizontal stresses were measured at low depths – up to 15 MPa at less than 30 m depth, but the majority of the data point to a maximum horizontal stress of around 5 MPa. The stress orientations also vary considerably, but an E-W to NW-SE trend for the maximum stress, being sub-horizontal, can be inferred.

40
Table 4-2. Measurement sites in the Stockholm City area (OC = overcoring, HF = hydraulic fracturing).
Site Borehole name Method References
Finnboda Varv 211/D01 OC /Klasson and Wikman, 1994b/
Danvikshem 211/D04 OC /Klasson and Wikman, 1994b/
Biskopsudden 213/D03 OC /Klasson and Wikman, 1994b/
Bolidenplan DBH04 OC /Klasson, 1993/
Årsta torg DBH05 OC /Klasson, 1993/
Johannes brandstation DBH1 OC /Klasson et al. 1993/
Slätbaksvägen KBH 12 OC /Klasson and Wikman, 1994a/
Ruddammsberget N3510 OC /Ljunggren and Wikman, 1994/
KTH N3511 OC /Ljunggren and Wikman, 1994/
Humlegården BSM1 HF /Klasson and Ljunggren, 1992/
4.4 BjörköA stress measurement campaign involving both conventional hydraulic fracturing, as well as hydraulic tests on pre-existing fractures, was carried out in borehole BJ001 at the Björkö island in the Lake Mälaren during 2002. Measurements were conducted down to a depth of 875 m below the ground surface. The data were evaluated using inversion analysis, thus yielding values on the maximum and minimum horizontal stress, as well as the orientation of the maximum horizontal stress, see Appendix G /Ask, 2003; Ask and Stephansson, 2003/.
Measurements were collected in the Björkö meteoritic impact structure with the rock type being a heavily fractured breccia. Thus, the results may not be directly comparable to other regional locations. The data suggest a minimum horizontal stress, which is equal to, or lower, than the overburden weight. Furthermore, the maximum horizontal stress is about 1.5 to 2 times the minimum horizontal stress. Stress orientations vary from 100° near the ground surface to 160° at depth. A clear stress rotation is evident from the presented data, but /Ask, 2003/ suggested that the observed rotation may be superficial and a result of few measurements at shallow depth. Thus, the most likely prevailing orientation of maximum horizontal stress is 160°.
4.5 OlkiluotoStress measurements at Olkiluoto (the designated location of the final nuclear waste repository for Finland) have been conducted for a depth range of 300 to 800 m. All measurements have been made in vertical boreholes drilled from the ground surface using either overcoring or hydraulic fracturing as measurement method, see Table 4-3. Overcoring was used in two boreholes (OL-KR10 and OL-KR24) whereas hydraulic fracturing was used in four boreholes (OL-KR1, OL-KR2, OL-KR4, and OL-KR10).
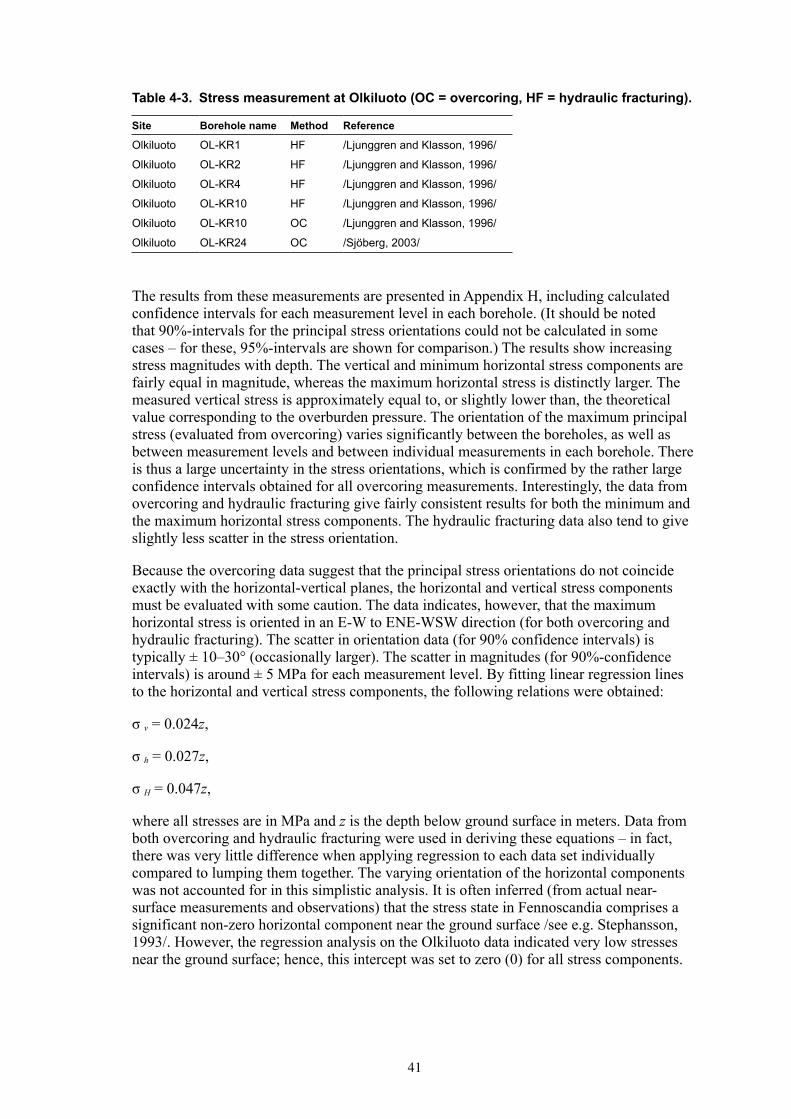
41
Table 4-3. Stress measurement at Olkiluoto (OC = overcoring, HF = hydraulic fracturing).
Site Borehole name Method Reference
Olkiluoto OL-KR1 HF /Ljunggren and Klasson, 1996/
Olkiluoto OL-KR2 HF /Ljunggren and Klasson, 1996/
Olkiluoto OL-KR4 HF /Ljunggren and Klasson, 1996/
Olkiluoto OL-KR10 HF /Ljunggren and Klasson, 1996/
Olkiluoto OL-KR10 OC /Ljunggren and Klasson, 1996/
Olkiluoto OL-KR24 OC /Sjöberg, 2003/
The results from these measurements are presented in Appendix H, including calculated confidence intervals for each measurement level in each borehole. (It should be noted that 90%-intervals for the principal stress orientations could not be calculated in some cases – for these, 95%-intervals are shown for comparison.) The results show increasing stress magnitudes with depth. The vertical and minimum horizontal stress components are fairly equal in magnitude, whereas the maximum horizontal stress is distinctly larger. The measured vertical stress is approximately equal to, or slightly lower than, the theoretical value corresponding to the overburden pressure. The orientation of the maximum principal stress (evaluated from overcoring) varies significantly between the boreholes, as well as between measurement levels and between individual measurements in each borehole. There is thus a large uncertainty in the stress orientations, which is confirmed by the rather large confidence intervals obtained for all overcoring measurements. Interestingly, the data from overcoring and hydraulic fracturing give fairly consistent results for both the minimum and the maximum horizontal stress components. The hydraulic fracturing data also tend to give slightly less scatter in the stress orientation.
Because the overcoring data suggest that the principal stress orientations do not coincide exactly with the horizontal-vertical planes, the horizontal and vertical stress components must be evaluated with some caution. The data indicates, however, that the maximum horizontal stress is oriented in an E-W to ENE-WSW direction (for both overcoring and hydraulic fracturing). The scatter in orientation data (for 90% confidence intervals) is typically ± 10–30° (occasionally larger). The scatter in magnitudes (for 90%-confidence intervals) is around ± 5 MPa for each measurement level. By fitting linear regression lines to the horizontal and vertical stress components, the following relations were obtained:
σ v = 0.024z,
σ h = 0.027z,
σ H = 0.047z,
where all stresses are in MPa and z is the depth below ground surface in meters. Data from both overcoring and hydraulic fracturing were used in deriving these equations – in fact, there was very little difference when applying regression to each data set individually compared to lumping them together. The varying orientation of the horizontal components was not accounted for in this simplistic analysis. It is often inferred (from actual near-surface measurements and observations) that the stress state in Fennoscandia comprises a significant non-zero horizontal component near the ground surface /see e.g. Stephansson, 1993/. However, the regression analysis on the Olkiluoto data indicated very low stresses near the ground surface; hence, this intercept was set to zero (0) for all stress components.
42
A major uncertainty in the Olkiluoto data is the pronounced anisotropy with respect to the mechanical properties, which may have a large effect on the evaluated stress state from overcoring measurements /see e.g. Amadei and Stephansson, 1997/. This has not been accounted for in the analysis of overcoring data (so far), which has resulted in an unquantifiable error.
4.6 Summary findingsThe scatter in the data reflects that of the typical measurement imprecision for the methods. For the Borre probe, an absolute imprecision of 1–2 MPa, with an additional relative imprecision of at least ± 10%, applies for the stress tensor components /Sjöberg and Klasson, 2003/. The imprecision in terms of stress orientation are dependent on the relation (magnitude-wise) between the different tensor components, but is generally at least ± 10–20°. For the present data set, larger scatter was found for the shallow measurements, whereas the deeper measurements in general show less scatter.
The regional stress data can now be compared to the Forsmark site data, while considering the above values on measurement precision. Comparing measurements at shallow depths from the Stockholm City area and the Forsmark area (Figure 4-3), a large scatter is obvious for measurements close to the ground surface. However, the data show that stresses are at least as high in Forsmark, as in neighbouring areas. Comparing measurements at larger depth from Olkiluoto (Appendix H), this trend is more pronounced. The Olkiluoto data indicate maximum horizontal stresses of around 25 MPa at 500 m depth, whereas the Forsmark data point towards a stress magnitude that is approximately twice as large at this depth.
Stress orientations from the shallow measurements (Figure 4-3) also show large scatter with no clear trends from the Stockholm City area. The data from Finnsjön (situated very close to Forsmark) point at a NW-SE orientation for the maximum horizontal stress, similar to that of the Forsmark site, and also in agreement with the dominant stress orientation for this region of Fennoscandia (142° based on relative plate motion). Data from Olkiluoto only to some extent support a NW-SE major stress orientation, and the scatter is larger for this site. Data from Björkö point at lower stress magnitudes, but similar orientations (NW-SE) at depth. The possible stress rotation (more E-W at shallower depth) may be a result of fewer measurements shallow depth.
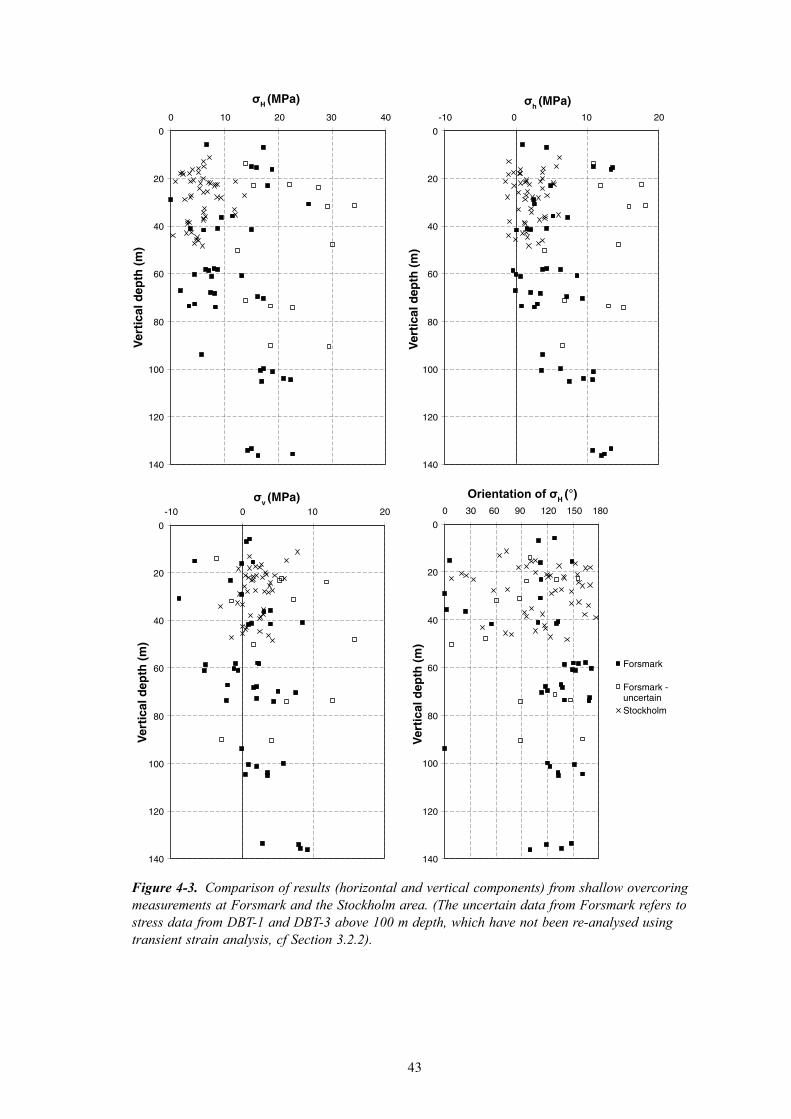
43
Figure 4-3. Comparison of results (horizontal and vertical components) from shallow overcoring measurements at Forsmark and the Stockholm area. (The uncertain data from Forsmark refers to stress data from DBT-1 and DBT-3 above 100 m depth, which have not been re-analysed using transient strain analysis, cf Section 3.2.2).
0
20
40
60
80
100
120
140
0 10 20 30 40
σH (MPa)
0
20
40
60
80
100
120
140
-10 0 10 20
0
20
40
60
80
100
120
140
-10 0 10 200
20
40
60
80
100
120
140
0 30 60 90 120 150 180
Forsmark
Forsmark -uncertainStockholm
Ver
tica
l dep
th (
m)
Ver
tica
l dep
th (
m)
Ve r
tica
l dep
th (
m)
Ver
tica
l dep
th (
m)
σh (MPa)
σv (MPa) Orientation of σH (°)

44
The stresses measured at Forsmark can also be compared to general stress relations for Fennoscandia published by /Stephansson, 1993/. For overcoring measurements over a depth range of 0 to 1,000 m, the following stress profiles were suggested:
σ II = 6.7+0.0444z (r = 0.61),
σ h = 0.8+0.0329z, (r = 0.91),
where all stresses are in MPa and z is the depth below ground surface in meters. Similar equations were also derived for hydraulic fracturing measurements, but this is not considered in the following. These relations encompass all (at that time) accessible measurement data in Fennoscandia; hence, the scatter is quite high, as indicated by the relatively poor fit for the maximum horizontal stress. This reflects the local variability (at the measurement scale) as well as regional differences, and these two are difficult to separate. However, by plotting these relations versus the measurement data at Forsmark, some interesting observations can be made, see Figure 4-4. The measured stresses at Forsmark are, with very few exceptions, higher than the average stress profile by /Stephansson, 1993/. This applies to both the maximum and the minimum horizontal stress. The difference is, in several cases, up to 30 MPa, which must be considered substantial. It is also noteworthy that these differences are obvious also at shallow depths (below 100 m). Finally, it should be noted that the equations by /Stephansson, 1993/ probably include some of the old overcoring data from Forsmark. If these were to be excluded, a lower average stress would be inferred for the rest of Fennoscandia, thus further reinforcing the concept of elevated horizontal stresses at Forsmark, compared to the regional stress state.
Figure 4-4. Comparison of measured horizontal stresses at Forsmark (all measurements) with derived average stress profiles for Fennoscandia from /Stephansson, 1993/.
0
100
200
300
400
500
600
700
800
900
1,000
0 10 20 30 40 50 60 70 80 90
σH (MPa)
0
100
200
300
400
500
600
700
800
900
1,000
-10 0 10 20 30 40 50
Ver
tica
l dep
th (
m)
Ver
tica
l dep
th (
m)
σh (MPa)
HF-Old (<2004)HF-New dataOC-Old (<2003)OC-New dataStephansson (1993)
HF-Old (<2004)HF-New dataOC-Old (<2003)OC-New dataSpalling & core discingDiscing - solid coreDiscing - DBT-1Stephansson (1993)

45
5 Assessment of stress state for the Forsmark site
5.1 Summary of base dataThe stress state at the Forsmark site was assessed based on: (i) overcoring measurements in borehole KFM01B, (ii) stress estimation from observed core discing and spalling failure in borehole KFM01B, (iii) stress estimation from observed discing of solid core in boreholes KFM01A, KFM02A, KFM04A, and KFM05A, (iv) selected data from hydraulic fracturing measurements in boreholes KFM01A, KFM01B, KFM02A, and KFM04A, (v) overcoring stress measurements in boreholes DBT-1 and DBT-3, including reinterpretation of the data using transient strain analysis and indirect stress estimates from observed core discing, (vi) hydraulic fracturing stress measurements in borehole DBT-1, (vii) other, shallow, measurements at Forsmark (near unit 3 and near the SFR facility), and (viii) regional stress data from Finnsjön, the Stockholm City area, Björkö, and Olkiluoto, as well as data from the World Stress Map and relative plate motions, as described in Chapters 3 and 4 above.
The regional and site stress data point towards the major principal stress being horizontally to sub-horizontally oriented. The orientations of the intermediate and minor principal stresses are less consistent, partly because they are similar in magnitude for several measurement sites. In the following, it has been assumed that the principal stresses are oriented in the horizontal-vertical planes.
The orientation of the maximum horizontal stress in the regional area is NW-SE. Based on relative plate motion, a stress orientation of 142° can be inferred for the area. Data from focal mechanisms in the World Stress Map indicate a trend of about 130° (from North) for the major stress component. Regional data from Finnsjön and Björkö also support a NW-SE stress orientation, whereas data from Olkiluoto point towards a more E-W major stress orientation. Stress measurements within the Forsmark site area showed maximum horizontal stress orientations of between 90° and 170° (with a few exceptions). In some boreholes, e.g. KFM01B, measurements at shallower depths resulted in more E-W orientations, whereas the deeper measurements indicated a more N-S orientation. However, this trend is not obvious when considering all available site data.
The regional stress data indicate a vertical stress magnitude, which is close to the overburden pressure, a minimum horizontal stress being nearly equal to the vertical stress, and a maximum horizontal stress being up to twice the minimum horizontal stress magnitude. (The Björkö site is a notable exception, exhibiting lower values on the horizontal stresses due to the heavily brecciated rock at this site.)
46
Hydraulic fracturing measurements on pre-existing fractures at the Forsmark site confirm that the vertical stress is approximately equal to the overburden pressure (this stress component is largely overestimated in nearly all overcoring measurements, as a result of microcracking and core discing). Furthermore, hydraulic fracturing data point at the minimum horizontal stress being at least as large as the vertical stress in magnitude. However, there is considerable scatter in this data set, even after excluding uncertain data (where no imprints are available, the fractures are non-vertical, or several fractures are included in the test section). A more detailed interpretation of these data is currently underway /Ask, 2005/. Overcoring data, as well as indirect stress estimates, indicate a maximum horizontal stress that is significantly larger than the minimum horizontal stress component, i.e. a highly deviatoric stress state in the horizontal plane. These data point at a maximum horizontal stress of at least 35 MPa at 250 m depth and 40 MPa at 400 m depth. There are also indications that the stresses measured at the deeper levels in boreholes KFM01B and DBT-1 represent a lower limit to the actual stress state. Successful measurements were only obtained at points where the stresses were locally lower in magnitude; at other points, measurements failed due to microcracking and/or core discing /Martna et al. 1983; Sjöberg, 2004/.
The core discing observations also point towards higher local stresses. For the portions of the boreholes where no discing of solid core was observed, an upper limit of σH ≈ 55 MPa may apply, down to approximately 450 m depth. Below this depth, stresses are probably not significantly higher, judging from the relatively few instances of observed discing, but this has not been verified. Data from P-wave velocity measurements on drill cores showed gradually reduced velocities and increasing anisotropy ratio below approximately 500–600 m depth. These data may be interpreted as an increase in stress-induced core damage, which, in turn, signifies increasing stresses with depth at the site.
It is possible (and probably also reasonable) that the stress – in particular the major horizontal stress – is higher inside the tectonic lens bounded by the major deformation zones at the site. However, the lack of stress measurement data at depths below 100 m precludes verification of this hypothesis.
The possibility of different stress regimes within the candidate area cannot be confirmed or refuted, based on the currently available data. For the shallow-dipping deformation zone ZFMNE00A2, there is not enough reliable data on either side of the zone to permit any conclusions regarding possibly different stress regimes above and below such a structure. The same applies to other observed deformation zones in the stress measurement boreholes (KFM01B, DBT-1)
5.2 Stress stateOne objective of the present work was to assess the stress state at Forsmark, for later use in e.g. stress modelling. To arrive at representative, and useable, stress values, the horizontal and vertical stress components were determined based on different subsets of the data, which were believed to be the most confident based on an overall assessment of measurement quality, traceability, measurement method, geological data, etc.
47
A linear stress profile was assumed for each of the stress components, in absence of better alternatives that could be verified. The stress profiles are representative of the tectonic lens. Possible differences in stress regimes within the tectonic lens were not addressed due to lack of verifying data. The scatter in the stress data did not permit reliable confidence intervals to be determined for the combined stress estimate given below. Rather, estimated lower and upper limits were defined for each of the stress components. There was not sufficient information available currently to assess the stress state above 150 m depth or below 500 m depth for the maximum horizontal stress component, whereas the minimum horizontal and vertical stresses could be confidently assessed for a larger depth interval. In general, the linear fits were subjectively defined to encompass the majority (but not all) of the data, thus providing reasonable input data for the future stress analysis.
In the following, the data used to assess each stress component is listed, followed by the derived stress profiles. These stress profiles define the lower and upper limit of the stress state based on the data considered reliable for each stress component. Thus, a stress profile with different gradient and/or offset at the ground surface, may be fitted within the lower and upper limits given below. Which one of these possible stress profiles that are most likely for the Forsmark site cannot be determined using the presently available data.
5.2.1 Maximum horizontal stress (σH ); 230–450 m depth
The maximum horizontal stress magnitude was assessed based on (all depths are given as vertical depth below the ground surface):• Overcoring data from KFM01B, including re-calculated stresses to fit a theoretical
vertical stress (233–455 m depth).• Estimated stresses based on observed core discing and spalling failure in borehole
KFM01B (233–455 m depth).• Estimated stresses from core discing of solid core in boreholes KFM01A, KFM02A,
KFM04A, and KFM05A (125–925 m depth). The absence of core discing for large portions of the cored boreholes was used to estimate an upper limit of the maximum horizontal stress; no lower limit can be determined from this data (0–450 m depth).
• Re-interpreted overcoring data from borehole DBT-1 (134–502 m depth).• Estimated stresses from core discing of overcore samples in borehole DBT-1
(320–500 m depth).
The stress profile is presented in Table 5-1, and Figure 5-1. The highest confidence with respect to data quality is for the depth interval of 230 to 450 m, but an extrapolation to 150 and 500 m, respectively, may be justified. Note that two alternative upper limits are given; one with a high gradient and one with a low gradient. None of these are considered more accurate than the other – they simply reflect two different interpretations.
The excluded data comprise all shallow measurements from boreholes D358, KB-21, KB-22, KB7-S, and SFR 1/177. Measurements in borehole SFR 1/177 gave anomalous stress orientations due to its close proximity to the Singö deformation zone. The other measurements indicated similar orientations as the deeper measurements at the site. Stress magnitudes were, in general, high considering the shallow depths. For boreholes KB-21, KB-22 and KB7-S, influences from the Singö zone are possible, and in borehole D358, high residual stresses were noted, which motivated these to be excluded in the stress assessment. It should be noted that if these data were included, an even higher horizontal stress magnitude may be inferred for the entire data set (more in line with the alternative upper limit).
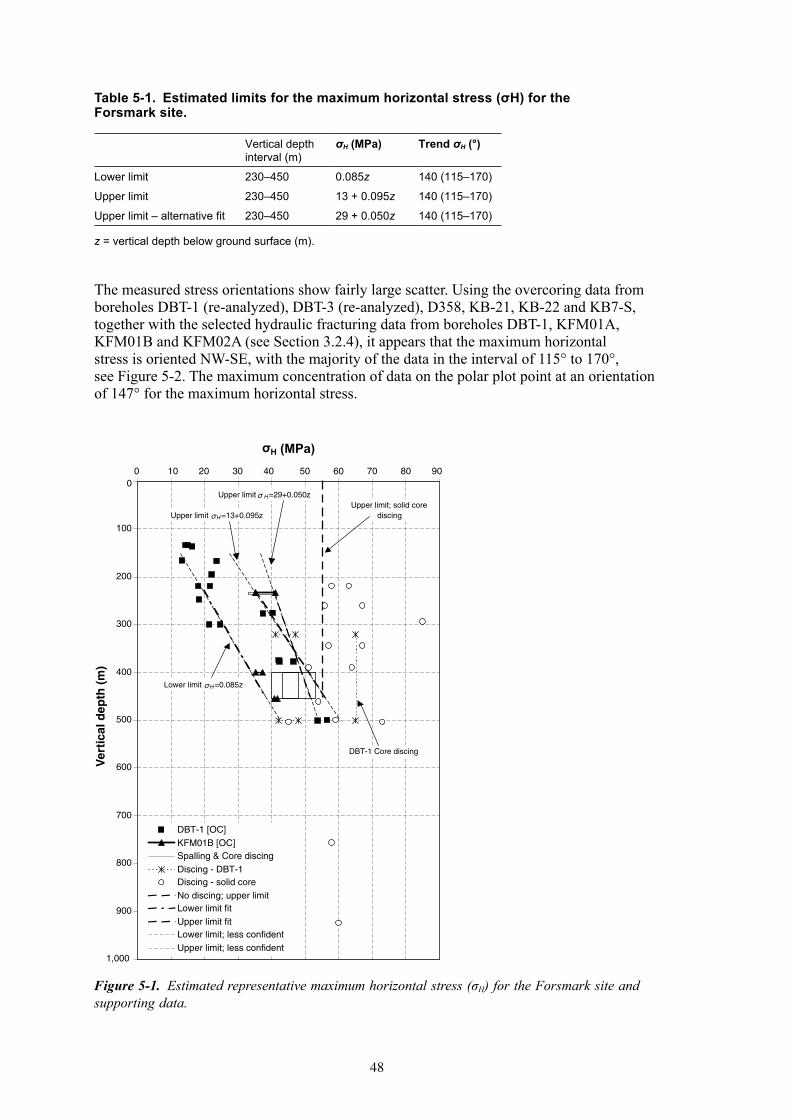
48
Table 5-1. Estimated limits for the maximum horizontal stress (σH) for the Forsmark site.
Vertical depth interval (m)
σH (MPa) Trend σH (°)
Lower limit 230–450 0.085z 140 (115–170)
Upper limit 230–450 13 + 0.095z 140 (115–170)
Upper limit – alternative fit 230–450 29 + 0.050z 140 (115–170)
z = vertical depth below ground surface (m).
The measured stress orientations show fairly large scatter. Using the overcoring data from boreholes DBT-1 (re-analyzed), DBT-3 (re-analyzed), D358, KB-21, KB-22 and KB7-S, together with the selected hydraulic fracturing data from boreholes DBT-1, KFM01A, KFM01B and KFM02A (see Section 3.2.4), it appears that the maximum horizontal stress is oriented NW-SE, with the majority of the data in the interval of 115° to 170°, see Figure 5-2. The maximum concentration of data on the polar plot point at an orientation of 147° for the maximum horizontal stress.
Figure 5-1. Estimated representative maximum horizontal stress (σH) for the Forsmark site and supporting data.
0
100
200
300
400
500
600
700
800
900
1,000
0 10 20 30 40 50 60 70 80 90
σH (MPa)
DBT-1 [OC]KFM01B [OC]Spalling & Core discingDiscing - DBT-1Discing - solid coreNo discing; upper limitLower limit fitUpper limit fitLower limit; less confidentUpper limit; less confident
Lower limit σH =0.085z
Upper limit σH =13+0.095z
Upper limit σ H =29+0.050z
DBT-1 Core discing
Upper limit; solid core discing
Ver
tica
l dep
th (
m)
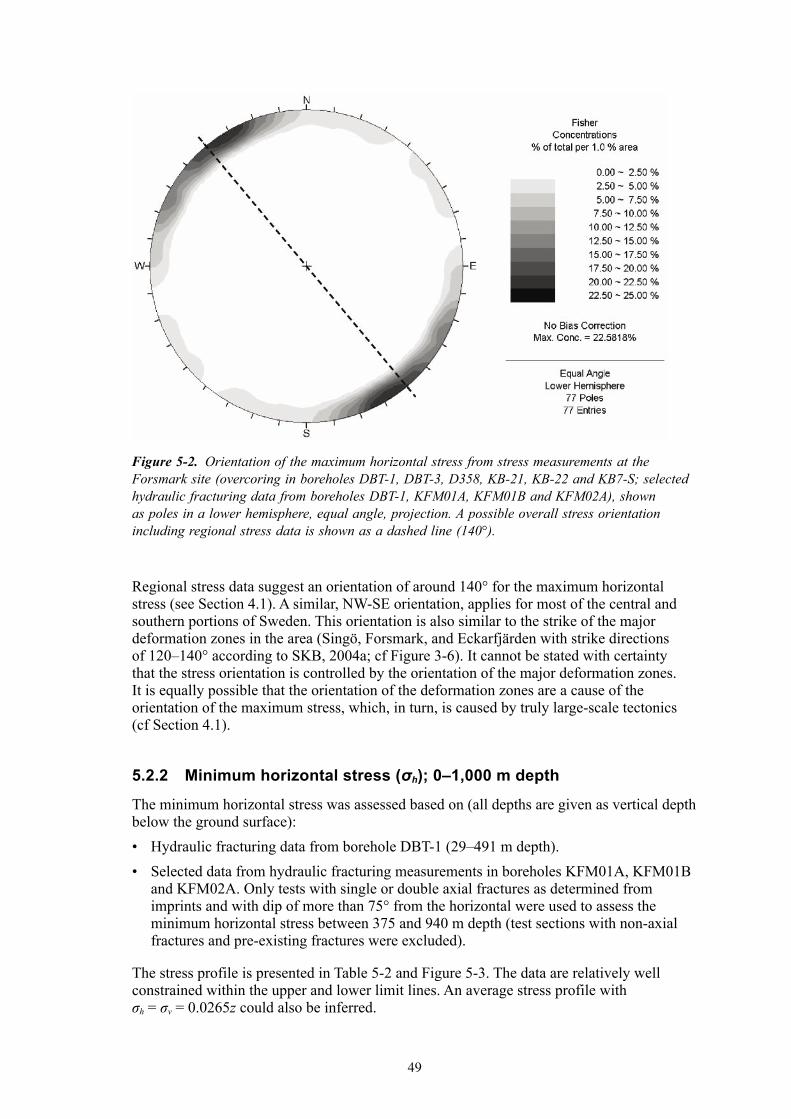
49
Regional stress data suggest an orientation of around 140° for the maximum horizontal stress (see Section 4.1). A similar, NW-SE orientation, applies for most of the central and southern portions of Sweden. This orientation is also similar to the strike of the major deformation zones in the area (Singö, Forsmark, and Eckarfjärden with strike directions of 120–140° according to SKB, 2004a; cf Figure 3-6). It cannot be stated with certainty that the stress orientation is controlled by the orientation of the major deformation zones. It is equally possible that the orientation of the deformation zones are a cause of the orientation of the maximum stress, which, in turn, is caused by truly large-scale tectonics (cf Section 4.1).
5.2.2 Minimum horizontal stress (σh); 0–1,000 m depth
The minimum horizontal stress was assessed based on (all depths are given as vertical depth below the ground surface):• Hydraulic fracturing data from borehole DBT-1 (29–491 m depth).• Selected data from hydraulic fracturing measurements in boreholes KFM01A, KFM01B
and KFM02A. Only tests with single or double axial fractures as determined from imprints and with dip of more than 75° from the horizontal were used to assess the minimum horizontal stress between 375 and 940 m depth (test sections with non-axial fractures and pre-existing fractures were excluded).
The stress profile is presented in Table 5-2 and Figure 5-3. The data are relatively well constrained within the upper and lower limit lines. An average stress profile with σh = σv = 0.0265z could also be inferred.
Figure 5-2. Orientation of the maximum horizontal stress from stress measurements at the Forsmark site (overcoring in boreholes DBT-1, DBT-3, D358, KB-21, KB-22 and KB7-S; selected hydraulic fracturing data from boreholes DBT-1, KFM01A, KFM01B and KFM02A), shown as poles in a lower hemisphere, equal angle, projection. A possible overall stress orientation including regional stress data is shown as a dashed line (140°).
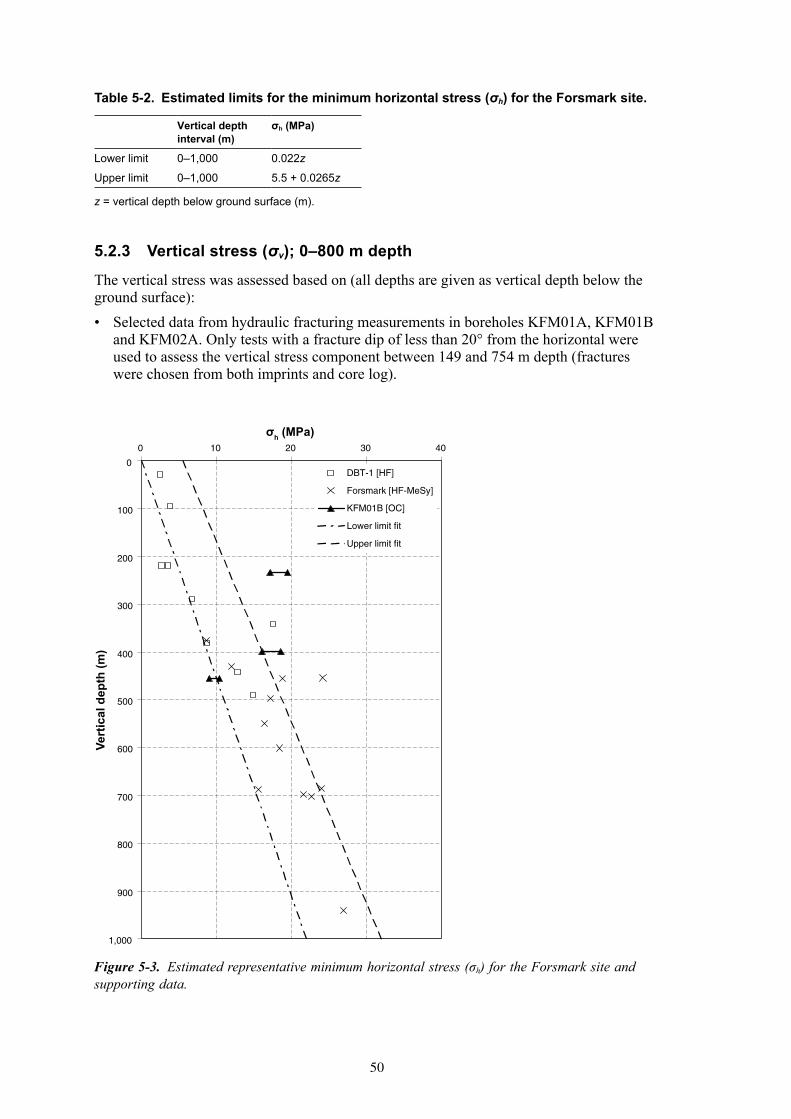
50
Table 5-2. Estimated limits for the minimum horizontal stress (σh) for the Forsmark site.
Vertical depth interval (m)
σh (MPa)
Lower limit 0–1,000 0.022z
Upper limit 0–1,000 5.5 + 0.0265z
z = vertical depth below ground surface (m).
5.2.3 Vertical stress (σv); 0–800 m depth
The vertical stress was assessed based on (all depths are given as vertical depth below the ground surface):• Selected data from hydraulic fracturing measurements in boreholes KFM01A, KFM01B
and KFM02A. Only tests with a fracture dip of less than 20° from the horizontal were used to assess the vertical stress component between 149 and 754 m depth (fractures were chosen from both imprints and core log).
Figure 5-3. Estimated representative minimum horizontal stress (σh) for the Forsmark site and supporting data.
0
100
200
300
400
500
600
700
800
900
1,000
0 10 20 30 40
σh (MPa)
DBT-1 [HF]
Forsmark [HF-MeSy]
KFM01B [OC]
Lower limit fit
Upper limit fit
Vert
ical
dep
th (m
)
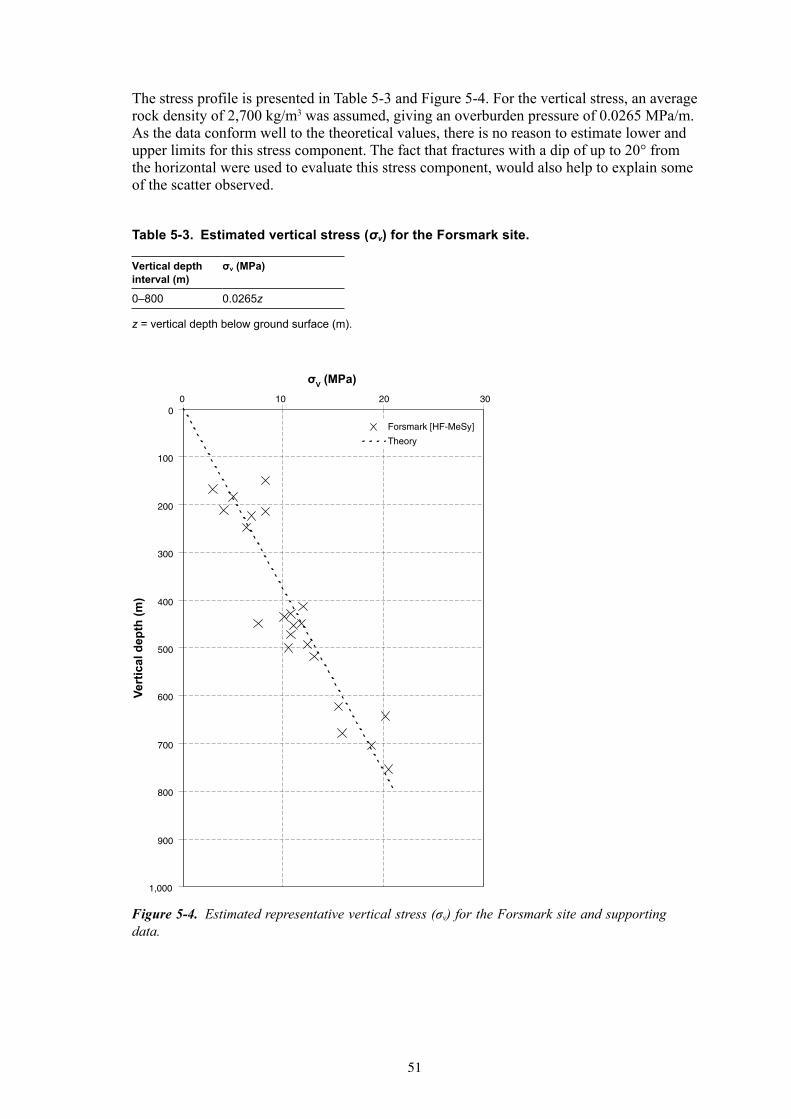
51
The stress profile is presented in Table 5-3 and Figure 5-4. For the vertical stress, an average rock density of 2,700 kg/m3 was assumed, giving an overburden pressure of 0.0265 MPa/m. As the data conform well to the theoretical values, there is no reason to estimate lower and upper limits for this stress component. The fact that fractures with a dip of up to 20° from the horizontal were used to evaluate this stress component, would also help to explain some of the scatter observed.
Table 5-3. Estimated vertical stress (σv) for the Forsmark site.
Vertical depth interval (m)
σv (MPa)
0–800 0.0265z
z = vertical depth below ground surface (m).
Figure 5-4. Estimated representative vertical stress (σv) for the Forsmark site and supporting data.
0
100
200
300
400
500
600
700
800
900
1,000
0 10 20 30
Forsmark [HF-MeSy]
Theory
σV (MPa)
Vert
ical
dep
th (m
)
53
6 Conclusions and recommendations
A combined assessment of the local (site-scale) and regional stress data for Forsmark support the following conclusions:• The major stress is orientated NW-SE (140°) and horizontally; however, with significant
local variation for different (i) measurement levels, (ii) boreholes, and (iii) measurement sites.
• A thrust faulting (σH > σh > σv) or possibly strike-slip faulting (σH > σv > σh) stress regime is evident at the Forsmark site.
• Regional stress data point at the maximum horizontal stress at Forsmark being higher than at nearby areas (Stockholm, Björkö, Olkiluoto), as well as compared to the average stress state in Fennoscandia.
• It appears reasonable that stresses are higher within the tectonic lens formed by the Singö, Forsmark, and Eckarfjärden deformation zones, but supporting data on either side of the zones, particularly at depths larger than 100 m, are lacking. Hence, this hypothesis could not be verified.
• The vertical stress appears to be a function of solely the weight of the overburden. • An estimated upper limit of the maximum horizontal stress can be obtained from the
lack of solid core discing for large portions of the boreholes at Forsmark. However, such an estimation is highly uncertain due to: (i) partly unknown mechanism for core discing failure, (ii) possible scatter in tensile strength at depth, and (iii) possible effects of the simplifying assumptions made in the analysis /application of the methodology by Hakala, 1999a,b, 2000/.
• The possible effects of shallow-dipping deformation zones on the stress state could not be verified from the currently available data. The possibility of different stress regimes above and below deformation zones still exists, and must be considered in future work at the site.
• The measured horizontal stress components were slightly lower for measurements in grey gneiss granite and grey gneiss granite, aplitic rock, compared to the other rock types at the site. No clear correlations were found for the other rock types and the measured stress magnitudes and/or stress orientations.
• The horizontal stresses appear to be high (up to 25 MPa) also at shallow (< 100 m) depths as evidenced by previous (old) measurements. It has been proposed that stresses are likely to be lower in the superficial, more fractured, portions of the rock mass, but the present data cannot be used to verify this hypothesis, as more recent measurements have not been conducted above 200 m depth.
Assessment of a representative stress state for the Forsmark site was based on different subsets of the total data set of stress measurements. Linear stress profiles were assumed for the horizontal and vertical stress components, with each stress profile being representative of the conditions within the tectonic lens. The resulting stress profiles are:• Maximum horizontal stress (σH) applicable for 230–450 m vertical depth (z):
Lower limit: σ H = 0.085z (MPa) Upper limit: σ H = 13+0.095z (MPa) Alternative upper limit: σ H = 29+0.050z (MPa) Orientation: 140° (clockwise from North)
54
• Minimum horizontal stress (σh) applicable for 0–1,000 m vertical depth (z): Lower limit: σ h = 0.022z (MPa) Upper limit: σ h = 5.5+0.0265z (MPa)
• Vertical stress (σv) applicable for 0–800 m vertical depth (z): σ h = 0.0265z (MPa)
The present data does not permit a more refined analysis (with respect to depth and/or geology). An improved stress assessment (reduced uncertainty) requires additional site investigations. Future measurements and activities should be planned to address the gaps indicated by the present data set, as follows: • The primary objective of new measurements should be to confirm the presumed
(relatively) high stress magnitudes inside the tectonic lens, for a larger depth interval than the present data.
• Overcoring measurements are recommended as the primary method for the next measurement campaign. Transient strain analysis should be conducted for all measurements to check that the basic assumptions of the method are not violated, as well as a quality control tool.
• Overcoring measurements should be conducted above 200 m vertical depth, preferably starting already at approximately 100 m depth below the ground surface.
• Overcoring measurements should be conducted at several measurement levels, separated by no more than approximately 100 m vertical distance. However, local geological conditions should dictate the final choice on measurement levels; hence, the proposed depth intervals are not rigid.
• Overcoring measurements should be attempted as deep as possible in the borehole – until the method is no longer applicable (extensive core damage and/or core discing inhibiting correct installation and/or overcoring of the measurement probe). Once core discing is observed overcoring measurements become less reliable and must be supplemented by other measurement methods.
• Any observed core discing on solid and/or overcore samples should be logged in as much detail as possible. In particular, disc thickness (minimum, maximum, average) and disc shape should be recorded immediately after core recovery, as this can provide confirmatory evidence of stress magnitudes.
• If core discing of solid core is observed in the borehole, pilot hole drilling with subsequent overcoring (without installation of the measurement probe) should be considered to induce ring discing of a hollow core. Having two observations of different core geometries can significantly increase the accuracy in stress estimation from core discing observations.
• Overcoring measurements may be made in a vertical or near-vertical borehole. This would facilitate later hydraulic measurements. An inclined borehole would, however, result in lower tangential stresses on the borehole wall, which could reduce the risk for spalling failure in the pilot hole. On the other hand, the risk for microcracking and/or core discing due to induced tensile stresses is not significantly reduced until the borehole is inclined more than 60° /Hakala, 1999a/.
• The uncertainties associated with the methodology for using core discing observations to estimate stresses must be considered. The methodology relies on a simple tensile strength criterion and calibration with measurement data are needed. Additional work to verify this approach would be beneficial for an improved stress estimate at Forsmark.
55
• Hydraulic measurements (primarily HTPF) should be planned following overcoring measurements, to complement the stress assessment and resolve any remaining issues, once the overcoring data has been analysed and interpreted. The hydraulic data should be collected so that they overlap the overcoring data to facilitate direct comparisons between methods. Preferably, hydraulic measurements should be conducted in the same borehole as overcoring measurements.
• An integrated stress determination using inversion analysis for both overcoring and hydraulic data should be considered for the site.
• If shallow-dipping deformations zones are confirmed with a high confidence, overcoring stress measurements in a borehole, which intersects a zone at between 150 and 250 m depth, should be considered. This would provide data on the possible different stress regimes above and below a shallow-dipping structure. It is imperative that the borehole is placed as to not intersect the structure at too large depths, as this would jeopardize the application of overcoring measurements (the full three-dimensional stress tensor must be measured).
• As a complement to the method of stress modelling outlined in /Hakami et al. 2002/, the method proposed by /McKinnon, 2001/ may be considered. This approach allows the boundary conditions of a numerical stress model to be calibrated to individual or groups of stress measurements. In this methodology, unit normal and shear tractions are applied to model boundaries and the response calculated at the measurement locations. An optimisation procedure is used to calculate the proportions of each unit response tensor (together with the gravitational stress) to reproduce the measured stress. The advantage of the method is that one does not need to exclude any data a priori. Also, the results and fitting of boundary conditions are conducted in an objective manner (as opposed to subjective criteria). The method can be used even when omitting known geological features in a model. For SKB’s purposes, however, it is believed that the best results would be obtained if the geology and structural features of the candidate area are well defined and characterised and then included in the numerical model.
57
7 References
Amadei B, Stephansson O, 1997. Rock stress and its measurement. London: Chapman & Hall, 490 pp.
Ask D, 2003. Hydraulic rock stress measurements in borehole BJO01, Björkö island, lake Mälaren, Sweden. KTH, Stockholm.
Ask D, Stephansson O, 2003. Hydraulic rock stress measurements in the Björkö meteoritic impact structure, lake Mälaren, Sweden. Proc. 3rd Int. Symp. on Rock Stress (Kumamoto, 4–6 Nov, 2003). Lisse: A. A. Balkema.
Ask D, 2005. Evaluation of hydraulic and overcoring stress measurements in boreholes KFM01A, KFM01B, KFM02A, and KFM04A at the Forsmark site. SKB P-report (in preparation). Svensk Kärnbränslehantering AB.
Baird A, 2005. Personal communciation.
Berglund J, 2004. Personal communication.
Berglund J, Petersson J, Wängnerud A, Danielsson P, 2004. Boremap mapping of core drilled borehole KFM01B. SKB P-04-114. Svensk Kärnbränslehantering AB.
Bjarnason B, Stephansson O, 1988. Hydraulic fracturing stress measurements in borehole Fi-6 Finnsjön study site, Central Sweden. SKB Arbetsrapport 88–54.
Carlsson A, Christiansson R, 1986. Rock stresses and geological structures in the Forsmark area. Proc. Int. Symp. on Rock stress and rock stress measurements (Stockholm, 1–3 Sept, 1986), pp 457–465. Luleå: Centek Publishers.
Carlsson A, Christiansson R, 1987. Geology and tectonics at Forsmark, Sweden. Swedish State Power Board, R & D-report no. U(B) 1987/42.
Chryssanthakis P, Tunbridge L, 2003. Borehole: KFM03A. Determination of P-wave velocity, transverse borehole core. SKB P-04-180. Svensk Kärnbränslehantering AB.
Chryssanthakis P, Tunbridge L, 2004. Borehole: KFM02A. Determination of P-wave velocity, transverse borehole core. SKB P-04-09. Svensk Kärnbränslehantering AB.
Eloranta P, 2004. Drill hole KFM01A: Indirect tensile strength test (HUT). SKB P-04-171. Svensk Kärnbränslehantering AB.
Hakala M, 1999a. Numerical study on core damage and interpretation of in situ state of stress. Posiva report 99-25.
Hakala M, 1999b. Numerical study of the core disk fracturing and interpretation of the in situ state of stress. Proc. Ninth International Congress on Rock Mechanics (Paris, 1999), Vol. 2, pp 1149–1153. Rotterdam: A. A. Balkema.
Hakala M, 2000. Interpretation of the Hästholmen in situ state of stress based on core damage observations. Posiva report 2000-01.

58
Hakala M, Hudson JA, Christiansson R, 2003. Quality control of overcoring stress measurement data. Int. J. Rock Mech. Min. Sci., 40, No. 7–8, pp 1141–1159.
Hakami E, Hakami H, Cosgrove J, 2002. Strategy for a rock mechanics site descriptive model. Development and testing of an approach to modelling the state of stress. SKB R-02-03. Svensk Kärnbränslehantering AB.
Hallbjörn L, 1986. Rock stress measurements performed by the Swedish State Power Board. Proc. Int. Symp. on Rock stress and rock stress measurements (Stockholm, 1–3 Sept, 1986), pp 197–205. Luleå: Centek Publishers.
Hallbjörn L, Ingevald K, Martna J, Strindell L, 1990. A new automatic probe for measuring triaxial rock stresses in deep bore holes. Tunneling and Underground Space Technology, 5, pp 141–145.
Hiltscher R, Strindell L, 1976. Bergspänningsmätning som underlag vid projektering av stora bergrum. Bergmekanikdag 1976, pp 151–157. Stockholm: Stiftelsen Bergteknisk Forskning (in Swedish).
Hiltscher R, Martna J, Strindell L, 1979. The measurement of triaxial rock stresses in deep boreholes. Proc. 4th Int. Congress on Rock Mechanics (Montreaux, 1979), Vol. 2, pp 227–234. Rotterdam: Balkema.
Hubbert MK, Willis DK, 1957. Mechanics of hydraulic fracturing. Trans. AIME, 210, pp 153–163.
Ingevald K, Strindell L, 1981. Mätning av bergspänningar (bergtryck) i djupa vertikala borrhål. Statens Vattenfallsverk, rapport L-543:2 (in Swedish).
Ito T, Evans K, Kawai K, Hayashi K, 1999. Hydraulic fracturing reopening pressure and the estimation of maximum horizontal stress. Int. J. Rock Mech. Min. Sci., 36, pp 811–826.
Jacobsson L, 2004a. Drill hole KFM01A. Indirect tensile strength test. SKB P-04-170. Svensk Kärnbränslehantering AB.
Jacobsson L, 2004b. Drill hole KFM02A. Indirect tensile strength test. SKB P-04-172. Svensk Kärnbränslehantering AB.
Jacobsson L, 2004c. Drill hole KFM03A. Indirect tensile strength test. SKB P-04-173. Svensk Kärnbränslehantering AB.
Jacobsson L, 2004d. Drill hole KFM04A. Indirect tensile strength test. SKB P-04-174. Svensk Kärnbränslehantering AB.
Klasson H, 1993. Bergspänningsmätningar i borrhål DBH04 Bolidenplan, och borrhål DBH05 Årsta torg. Förhandskopia. Vattenfall Hydropower AB (in Swedish).
Klasson H, Ljunggren C, 1992. Bergspänningsmätningar i borrhål BSM1, Humlegården, slutrapport. Renco AB, Luleå (in Swedish).
Klasson H, Wikman A, 1994a. Södra länken PM 1994-04-07 – Bergspänningsmätning i borrhål KBH 12, Slätbaksvägen. Vattenfall Hydropower AB (in Swedish).
Klasson H, Wikman A, 1994b. Österleden, Bergspänningsmätningar i borrhål 213/D03-Biskopsudden, borrhål 211/D01-Finnboda Varv & borrhål 211/D04-Danvikshem. Vattenfall Hydropower AB (in Swedish).

59
Klasson H, Wikman A, Ljunggren C, 1993. Bergspänningsmätningar i borrhål DBH1, Johannes brandstation – slutrapport. Vattenfall Hydropower AB, Luleå (in Swedish).
Klee G, Rummel F, 2004. Rock stress measurements with hydraulic fracturing and hydraulic testing of pre-existing fractures in borehole KFM01A, KFM01B, KFM02A and KFM04A. Results from in-situ tests. SKB P-04-311. Svensk Kärnbränslehantering AB.
Lindfors U, Perman F, Sjöberg J, 2004. Evaluation of the overcoring results from borehole KFM01B. SKB P-05-66. Svensk Kärnbränslehantering AB.
Ljunggren C, Persson M, 1995. Beskrivning av databas – Bergspänningsmätningar i Sverige. SKB Projektrapport PR D-95-017 (in Swedish).
Ljunggren C, Klasson H, 1996. Rock stress measuremtens at the tree investigation sites, Kivetty, Romuvaara and Olkiluoto, Finland. Volumes 1 & 2. Work report PATU-96-26e. Vattenfall Hydropower AB.
Ljunggren C, Wikman A, 1994. Norra länken II, Bergspänningsmätningar i borrhål N3510 Ruddammsberget, och borrhål N3511 KTH. Vattenfall Hydropower AB (in Swedish).
Martin CD, Christiansson R, Söderhäll J, 2001. Rock stability considerations for siting and constructing a KBS-3 repository. SKB TR-01-38. Svensk Kärnbränslehantering AB.
Martin CD, Stimpson B, 1994. The effect of sample disturbance on laboratory properties of Lac du Bonnet granite. Canadian Geotechnical Journal, 31(5), pp 692–702.
Martna J, Hiltscher R, Ingevald K, 1983. Geology and rock stresses in deep boreholes at Forsmark in Sweden. Proc. 5th Int. Congress on Rock Mechanics (Melbourne, 1983, Vol. 2, pp F 111-F 116. Rotterdam: A. A. Balkema.
McKinnon SD, 2001. Analysis of stress measurements using a numerical model methodology. Int. J. Rock Mech. Min. Sci., 38, pp 699–709.
Perman F, Sjöberg J, 2003. Transient strain analysis of overcoring measurements in boreholes DBT-1 and DBT-3. SKB P-03-119. Svensk Kärnbränslehantering AB.
Petersson J, Wängnerud A, 2003. Boremap mapping of telescopic drilled borehole KFM01A. SKB P-03-23. Svensk Kärnbränslehantering AB.
Petersson J, Wängnerud A, Stråhle A, 2003. Boremap mapping of telescopic drilled borehole KFM02A. SKB P-03-98. Svensk Kärnbränslehantering AB.
Petersson J, Wängnerud A, Berglund J, Danielsson P, Stråhle A, 2004. Boremap mapping of telescopic drilled borehole KFM04A. SKB P-04-115. Svensk Kärnbränslehantering AB.
Reinecker J, Heidbach O, Tingay M, Connolly P, Müller B, 2004. The 2004 release of the World Stress Map (available online at www.world-stress-map.org), accessed 2004-07-15.
Sjöberg J, 2003. Overcoring rock stress measurements in borehole OL-KR24, Olkiluoto. Posiva Working Report 2003-60, 158 p.
Sjöberg J, 2004. Overcoring rock stress measurements in borehole KFM01B. SKB P-04-83. Svensk Kärnbränslehantering AB.

60
Sjöberg J, Klasson H, 2003. Stress measurements in deep boreholes using the Borre (SSPB) probe. Int. J. Rock Mech. Min. Sci., 40, No. 7-8, pp 1205–1233.
SKB, 2004a. Preliminary site description. Forsmark area – version 1.1. SKB R-04-15. Svensk Kärnbränslehantering AB.
SKB, 2004b. SICADA information obtained from SKB. Core discing data from boreholes KFM02A, KFM04A, and KFM05A.
SKB, 2005. Preliminary site description. Forsmark area – version 1.2. (in preparation).
SSPB (The Swedish State Power Board), 1982. Characterization of deep-seated rock masses by means of borehole investigations. In-situ rock stress measurements, hydraulic testing and core-logging. Final Report, April 1982, Research and Development Report 5:1. Stockholm: The Swedish State Power Board. (Report compiled by A. Carlsson and T. Olsson.)
Stephansson O. 1993. Rock stress in the Fennoscandian shield. In Comprehensive Rock Engineering, Chapter 17, Vol. 3, pp 445–459. Oxford: Pergamon Press.
Stephansson O, Ångman P, 1984. Hydraulic Fracturing Stress Measurements at Forsmark and Stidsvig, Sweden. Research Report TULEA 1984:30, Luleå University of Technology, 61 p. Luleå, Sweden.
Tunbridge L, Chryssanthakis P, 2003. Borehole: KFM01A. Determination of P-wave velocity, transverse borehole core. SKB P-03-38. Svensk Kärnbränslehantering AB.
UNAVCO, 2005. UNAVCO Facility. Plate motion calculator. http://sps.unavco.org/crustal_motion/dxdt/nnrcalc/ (June 7, 2005).
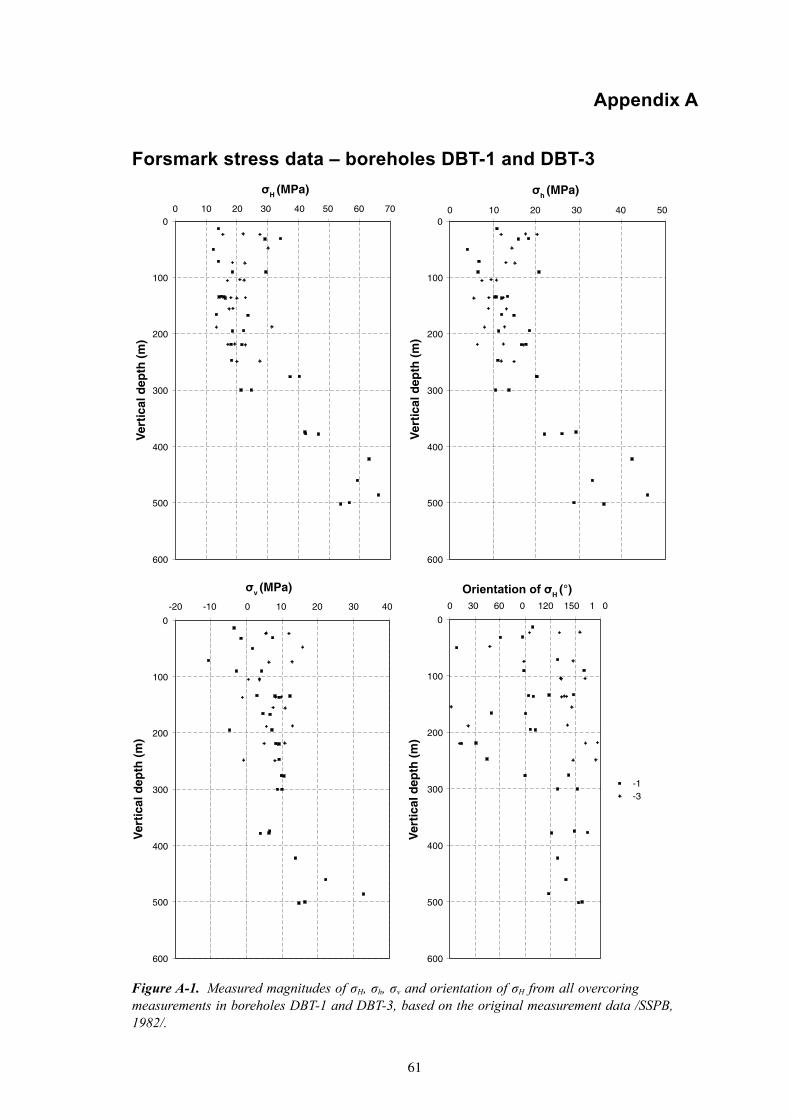
61
Appendix A
Forsmark stress data – boreholes DBT-1 and DBT-3
Figure A-1. Measured magnitudes of σH, σh, σv and orientation of σH from all overcoring measurements in boreholes DBT-1 and DBT-3, based on the original measurement data /SSPB, 1982/.
0
100
200
300
400
500
600
0 10 20 30 40 50 60 700
100
200
300
400
500
600
0 10 20 30 40 50
0
100
200
300
400
500
600
-20 -10 0 10 20 30 400
100
200
300
400
500
600
0 30 60 �0 120 150 1� 0
���-1 �������-3 ����
σH (MPa)
Ver
tica
l dep
th (
m)
Ve r
tica
l dep
th (
m)
Ver
tica
l dep
th (
m)
Ver
tica
l dep
th (
m)
σh (MPa)
σv (MPa) Orientation of σH (°)
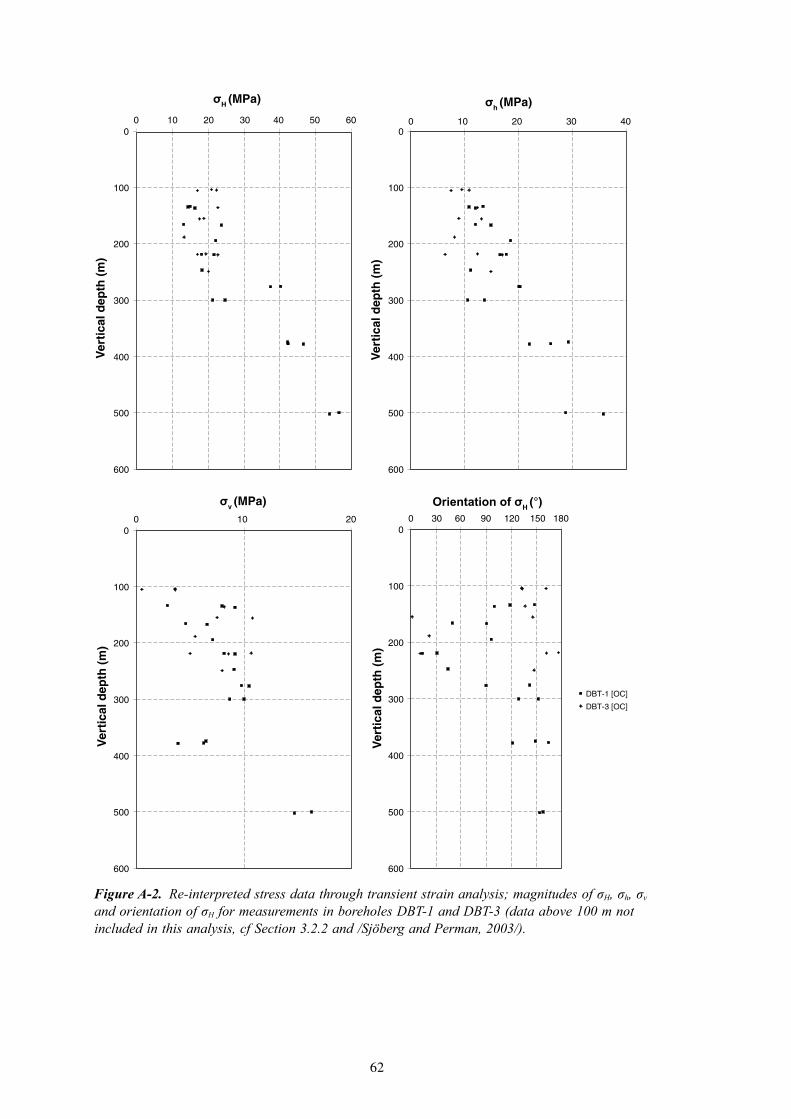
62
Figure A-2. Re-interpreted stress data through transient strain analysis; magnitudes of σH, σh, σv and orientation of σH for measurements in boreholes DBT-1 and DBT-3 (data above 100 m not included in this analysis, cf Section 3.2.2 and /Sjöberg and Perman, 2003/).
0
100
200
300
400
500
600
0 10 20 30 40 50 600
100
200
300
400
500
600
0 10 20 30 40
0
100
200
300
400
500
600
0 10 200
100
200
300
400
500
600
0 30 60 90 120 150 180
DBT-1 [OC]
DBT-3 [OC]
σH (MPa)V
erti
cal d
epth
(m
)
Ver
tica
l dep
th (
m)
Ver
tica
l dep
th (
m)
Ver
tica
l dep
th (
m)
σh (MPa)
σv (MPa) Orientation of σH (°)

63
Fig
ure
A-3
. Av
erag
e va
lues
(■-m
arke
rs) a
nd 9
0%-c
onfid
ence
inte
rval
s (├
──
─┤
) for
the
hori
zont
al a
nd v
ertic
al s
tress
com
pone
nts,
show
n to
geth
er w
ith
mea
sure
d va
lues
usi
ng o
verc
orin
g fo
r ea
ch m
easu
rem
ent l
evel
(x-m
arke
rs) i
n bo
reho
les
DBT
-1 a
nd D
BT-3
(re-
inte
rpre
ted
data
). (F
or th
e ve
rtic
al s
tress
, a
line
corr
espo
ndin
g to
the
over
burd
en p
ress
ure
is s
how
n fo
r re
fere
nce.
)
0 00
1
00
2
00
3
00
4
00
5
00
6
07
06
05
04
03
02
01
0
Vertical depth (m)
0 00
1
00
2
00
3
00
4
00
5
00
6
05
04
03
02
01
0
Vertical depth (m)
0 00
1
00
2
00
3
00
4
00
5
00
6
03
02
01
00
1-
Vertical depth (m)
σ H (
MP
a)σ h
(M
Pa)
σ v (
MP
a)

64
Figure A-4. Confidence intervals (90%) for the orientation of the principal stresses in DBT-1, Level 3 (re-interpreted data).
Figure A-5. Confidence intervals (90%) for the orientation of the principal stresses in DBT-1, Level 4 (re-interpreted data).

65
Figure A-6. Confidence intervals for the orientation of the principal stresses in DBT-1, Level 5 (only one measurement; re-interpreted data).

66
Figure A-7. Confidence intervals for the orientation of the principal stresses in DBT-1; Level 6: 90% (top) and 97% (bottom) (re-interpreted data).

67
Figure A-8. Confidence intervals (90%) for the orientation of the principal stresses in DBT-1, Level 7 (re-interpreted data).
Figure A-9. Confidence intervals (90%) for the orientation of the principal stresses in DBT-1, Level 8 (re-interpreted data).
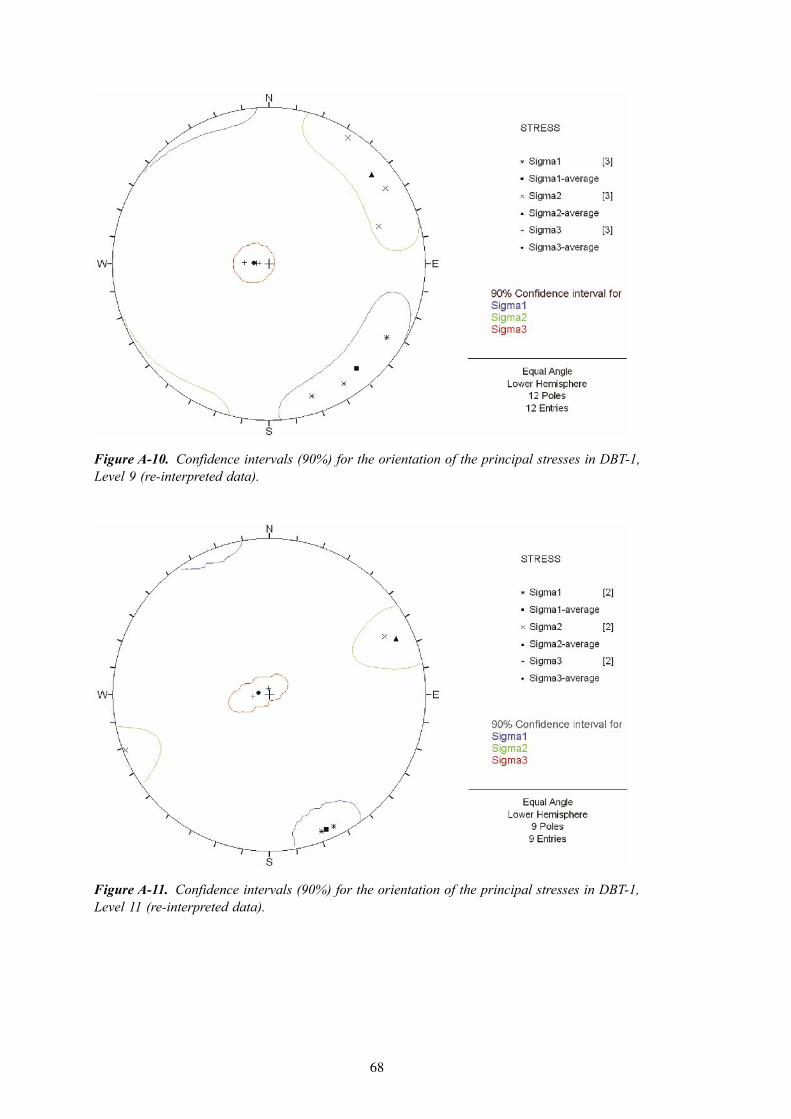
68
Figure A-10. Confidence intervals (90%) for the orientation of the principal stresses in DBT-1, Level 9 (re-interpreted data).
Figure A-11. Confidence intervals (90%) for the orientation of the principal stresses in DBT-1, Level 11 (re-interpreted data).
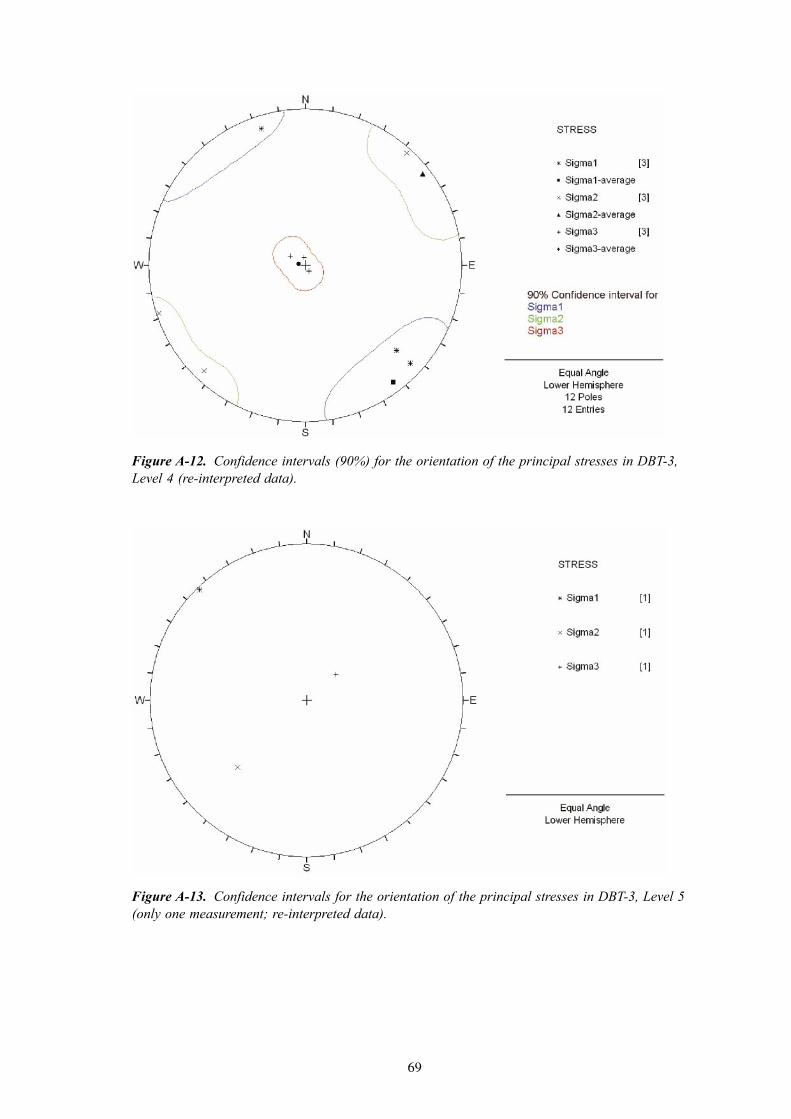
69
Figure A-12. Confidence intervals (90%) for the orientation of the principal stresses in DBT-3, Level 4 (re-interpreted data).
Figure A-13. Confidence intervals for the orientation of the principal stresses in DBT-3, Level 5 (only one measurement; re-interpreted data).

70
Figure A-14. Confidence intervals for the orientation of the principal stresses in DBT-3, Level 6: 90% (top) and 95% (bottom) (re-interpreted data).

71
Figure A-15. Confidence intervals for the orientation of the principal stresses in DBT-3, Level 7 (only one measurement; re-interpreted data).
Figure A-16. Confidence intervals (90%) for the orientation of the principal stresses in DBT-3, Level 8 (re-interpreted data).

72
Figure A-17. Confidence intervals for the orientation of the principal stresses in DBT-3, Level 9 (only one measurement; re-interpreted data).

73
Appendix B
Forsmark stress data – borehole KFM01B
Figure B-1. Measured magnitudes of σH, σh, σv and orientation of σH from overcoring measurements in borehole KFM01B.
0
50
100
150
200
250
300
350
400
450
500
0 10 20 30 40 500
50
100
150
200
250
300
350
400
450
500
0 10 20 30 40
0
50
100
150
200
250
300
350
400
450
500
0 10 20 300
50
100
150
200
250
300
350
400
450
500
0 30 60 90 120 150 180
KFM01B [OC]
σH (MPa)
Ver
tica
l dep
th (
m)
Ver
tica
l dep
th (
m)
Ve r
tica
l dep
th (
m)
Ver
tica
l dep
th (
m)
σh (MPa)
σV (MPa) Orientation of σH (°)
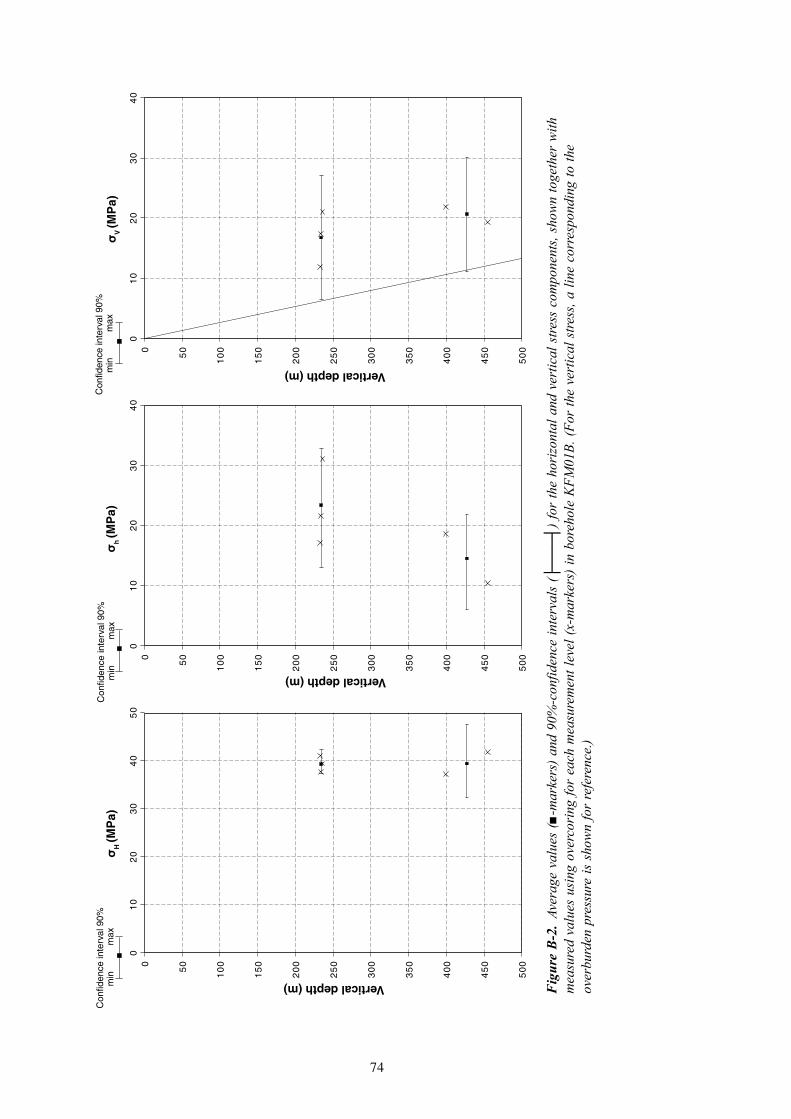
74
Fig
ure
B-2
. Av
erag
e va
lues
(■-m
arke
rs) a
nd 9
0%-c
onfid
ence
inte
rval
s (├
──
─┤
) for
the
hori
zont
al a
nd v
ertic
al s
tress
com
pone
nts,
show
n to
geth
er w
ith
mea
sure
d va
lues
usi
ng o
verc
orin
g fo
r ea
ch m
easu
rem
ent l
evel
(x-m
arke
rs) i
n bo
reho
le K
FM01
B. (F
or th
e ve
rtic
al s
tress
, a li
ne c
orre
spon
ding
to th
e ov
erbu
rden
pre
ssur
e is
sho
wn
for
refe
renc
e.)
0 05
00
1
05
1
00
2
05
2
00
3
05
3
00
4
05
4
00
5
05
04
03
02
01
00 0
5
00
1
05
1
00
2
05
2
00
3
05
3
00
4
05
4
00
5
04
03
02
01
00 0
5
00
1
05
1
00
2
05
2
00
3
05
3
00
4
05
4
00
5
04
03
02
01
0
σ H (M
Pa)
Vertical depth (m)
Vertical depth (m)
Vertical depth (m)
σ h (M
Pa)
σ V (M
Pa)
Con
fiden
ce in
terv
al 9
0%m
in
max
Con
fiden
ce in
terv
al 9
0%m
in
max
Con
fiden
ce in
terv
al 9
0%m
in
ma x

75
Figure B-3. Confidence intervals (90%) for the orientation of the principal stresses in KFM01B, Level 1.
Figure B-4. Confidence intervals (90%) for the orientation of the principal stresses in KFM01B, Level 2.
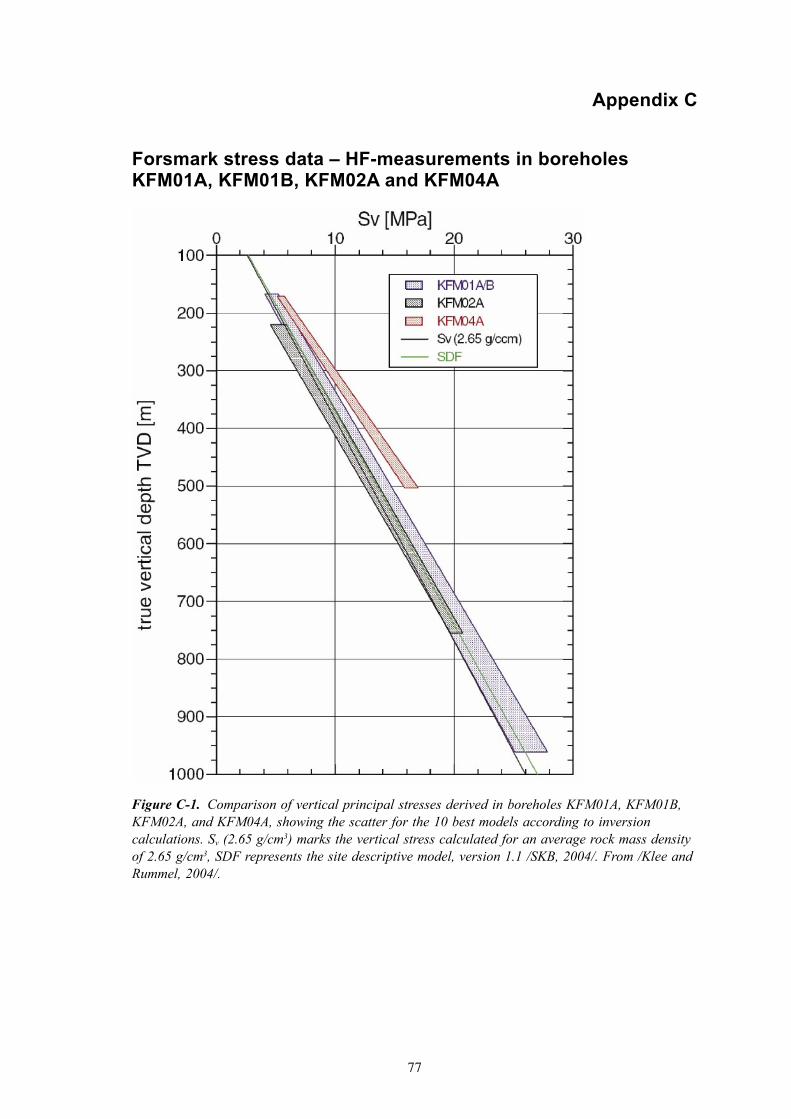
77
Appendix C
Forsmark stress data – HF-measurements in boreholes KFM01A, KFM01B, KFM02A and KFM04A
Figure C-1. Comparison of vertical principal stresses derived in boreholes KFM01A, KFM01B, KFM02A, and KFM04A, showing the scatter for the 10 best models according to inversion calculations. Sv (2.65 g/cm3) marks the vertical stress calculated for an average rock mass density of 2.65 g/cm3, SDF represents the site descriptive model, version 1.1 /SKB, 2004/. From /Klee and Rummel, 2004/.

78
Figure C-2. Comparison of minimum horizontal principal stresses derived in boreholes KFM01A, KFM01B, KFM02A, and KFM04A, showing the scatter for the 10 best models according to inversion calculations. The open squares represent the results according to the “classical” /Hubbert and Willis, 1957/ approach. Sv (2.65 g/cm3) marks the vertical stress calculated for an average rock mass density of 2.65 g/cm3, SDF represents the site descriptive model, version 1.1 /SKB, 2004/. From /Klee and Rummel, 2004/.

79
Figure C-3. Comparison of maximum horizontal principal stresses derived in boreholes KFM01A, KFM01B, KFM02A, and KFM04A, showing the scatter for the 10 best models according to inversion calculations. The closed squares represent the results according to the “classical” /Hubbert and Willis, 1957/ approach. Sv (2.65 g/cm3) marks the vertical stress calculated for an average rock mass density of 2.65 g/cm3, SDF represents the site descriptive model, version 1.1 /SKB, 2004/. From /Klee and Rummel, 2004/.

80
Figure C-4. Measured magnitudes of σh and σv (also shown is the theoretical vertical stress due to overburden weight) and orientation of σH from selected data from the hydraulic fracturing measurements in boreholes KFM01A, KFM01B, and KFM02A /data from Klee and Rummel, 2004/.
0
100
200
300
400
500
600
700
800
900
1,000
0 10 20 30
0
100
200
300
400
500
600
700
800
900
1,000
0 10 20 300
100
200
300
400
500
600
700
800
900
1,000
0 30 60 90 120 150 180
Sigma h
Sigma V
Orientation ofSigma H
Ver
tica
l dep
th (
m)
Ve r
tica
l dep
th (
m)
Ver
tica
l dep
th (
m)
σh (MPa)
σV (MPa) Orientation of σH (°)
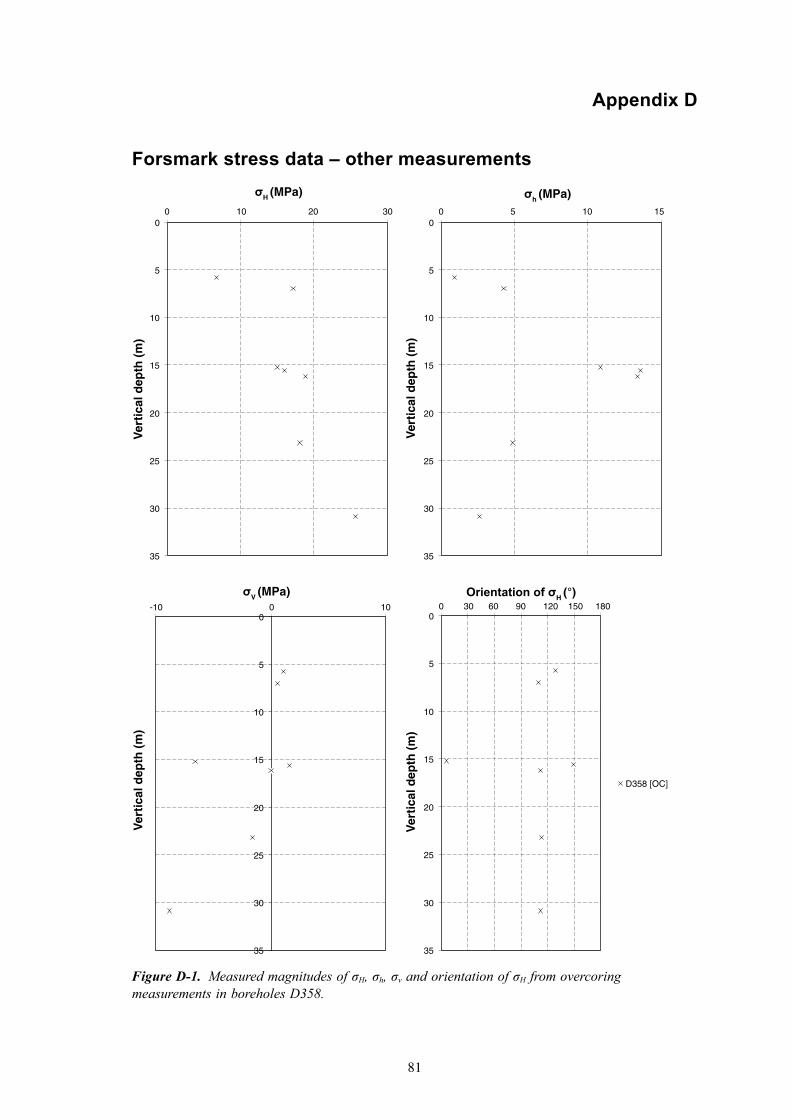
81
Appendix D
Forsmark stress data – other measurements
Figure D-1. Measured magnitudes of σH, σh, σv and orientation of σH from overcoring measurements in boreholes D358.
0
5
10
15
20
25
30
35
0 10 20 300
5
10
15
20
25
30
35
0 5 10 15
0
5
10
15
20
25
30
35
-10 0 100
5
10
15
20
25
30
35
0 30 60 90 120 150 180
D358 [OC]
σH (MPa)
Ver
tica
l dep
th (
m)
Ver
tica
l dep
th (
m)
Ve r
tica
l dep
th (
m)
Ver
tica
l dep
th (
m)
σh (MPa)
σV (MPa) Orientation of σH (°)

82
Figure D-2. Measured magnitudes of σH, σh, σv and orientation of σH from overcoring measurements in boreholes SFR 1/177.
0
5
10
15
20
25
30
35
40
45
0 10 200
5
10
15
20
25
30
35
40
45
0 10
0
5
10
15
20
25
30
35
40
45
0 100
5
10
15
20
25
30
35
40
45
0 30 60 90 120 150 180
SFR 1/177 [OC]
σH (MPa)V
erti
cal d
epth
(m
)
Ver
tica
l dep
th (
m)
Ve r
tica
l dep
th (
m)
Ver
tica
l dep
th (
m)
σh (MPa)
σv (MPa) Orientation of σH (°)

83
Figure D-3. Measured magnitudes of σH, σh, σv and orientation of σH from overcoring measurements in boreholes KB-21, KB-22, and KB7-S.
0
20
40
60
80
100
120
140
160
0 10 20 300
20
40
60
80
100
120
140
160
-10 0 10 20 30
0
20
40
60
80
100
120
140
160
-10 0 100
20
40
60
80
100
120
140
160
0 30 60 90 120 150 180
KB-21 [OC]KB-22 [OC]KB7-S [OC]
σH (MPa)
Ver
tica
l dep
th (
m)
Ver
tica
l dep
th (
m)
Ve r
tica
l dep
th (
m)
Ver
tica
l dep
th (
m)
σh (MPa)
σV (MPa) Orientation of σH (°)

84
Figure D-4. Measured magnitudes of σH, σh and orientation of σH from hydraulic fracturing measurements in borehole DBT-1.
0
100
200
300
400
500
600
0 10 20 300
100
200
300
400
500
600
0 10 20
0
100
200
300
400
500
600
0 30 60 90 120 150 180
DBT-1 [HF]
σH (MPa)V
erti
cal d
epth
(m
)
Ver
tica
l dep
th (
m)
Ver
tica
l dep
th (
m)
σh (MPa)
Orientation of σH (°)

85
Fig
ure
D-5
. Av
erag
e va
lues
(■-m
arke
rs) a
nd 9
0%-c
onfid
ence
inte
rval
s (├
──
─┤
) for
the
hori
zont
al a
nd v
ertic
al s
tress
com
pone
nts,
show
n to
geth
er w
ith
mea
sure
d va
lues
usi
ng o
verc
orin
g fo
r ea
ch m
easu
rem
ent l
evel
(x-m
arke
rs) i
n bo
reho
le S
FR 1
/177
. (Fo
r th
e ve
rtic
al s
tress
, a li
ne c
orre
spon
ding
to th
e ov
erbu
rden
pre
ssur
e is
sho
wn
for
refe
renc
e.)
0 5 01
51
02
52
03
53
04
54
02
01
00 5 0
1
51
02
52
03
53
04
54
01
00
1 -0 5 0
1
51
02
52
03
53
04
54
03
02
01
00
1 -
σ H (M
Pa)
Vertical depth (m)
Vertical depth (m)
Vertical depth (m)
σ h (M
Pa)
σ V (M
Pa)
Con
fiden
ce in
terv
al 9
0%m
in
max
Con
fiden
ce in
terv
al 9
0%m
in
max
Con
fiden
ce in
ter v
al 9
0%m
in
ma x

86
Fig
ure
D-6
. Av
erag
e va
lues
(■-m
arke
rs) a
nd 9
0%-c
onfid
ence
inte
rval
s (├
──
─┤
) for
the
hori
zont
al a
nd v
ertic
al s
tress
com
pone
nts,
show
n to
geth
er
with
mea
sure
d va
lues
usi
ng o
verc
orin
g fo
r ea
ch m
easu
rem
ent l
evel
(x-m
arke
rs) i
n bo
reho
les
KB-
21, K
B-22
, and
KB7
-S. (
For
the
vert
ical
stre
ss, a
line
co
rres
pond
ing
to th
e ov
erbu
rden
pre
ssur
e is
sho
wn
for
refe
renc
e.)
0 02
04
06
08
00
1
02
1
04
1
06
1
04
03
02
01
00 0
2
04
06
08
00
1
02
1
04
1
06
1
03
02
01
00
1-0
2 -0 0
2
04
06
08
00
1
02
1
04
1
06
1
02
01
00
1-0
2 -
σ H (M
Pa)
Vertical depth (m)
Vertical depth (m)
Vertical depth (m)
σ h (M
Pa)
σ V (M
Pa)
Con
fiden
ce in
terv
al 9
0%m
in
max
Con
fiden
ce in
terv
al 9
0%m
in
max
Con
fiden
ce in
terv
al 9
0%m
in
ma x

87
Figure D-7. Confidence intervals (90%) for the orientation of the principal stresses in SFR 1/177, Level 1.
Figure D-8. Confidence intervals (90%) for the orientation of the principal stresses in SFR 1/177, Level 2.

88
Figure D-9. Confidence intervals (90%) for the orientation of the principal stresses in KB-21, Level 1.
Figure D-10. Confidence intervals (90%) for the orientation of the principal stresses in KB-21, Level 2.

89
Figure D-11. Confidence intervals (90%) for the orientation of the principal stresses in KB-21, Level 3.
Figure D-12. Confidence intervals (90%) for the orientation of the principal stresses in KB-22, Level 1.

90
Figure D-13. Confidence intervals (90%) for the orientation of the principal stresses in KB-22, Level 2 (only one measurement).
Figure D-14. Confidence intervals (90%) for the orientation of the principal stresses in KB-22, Level 3.
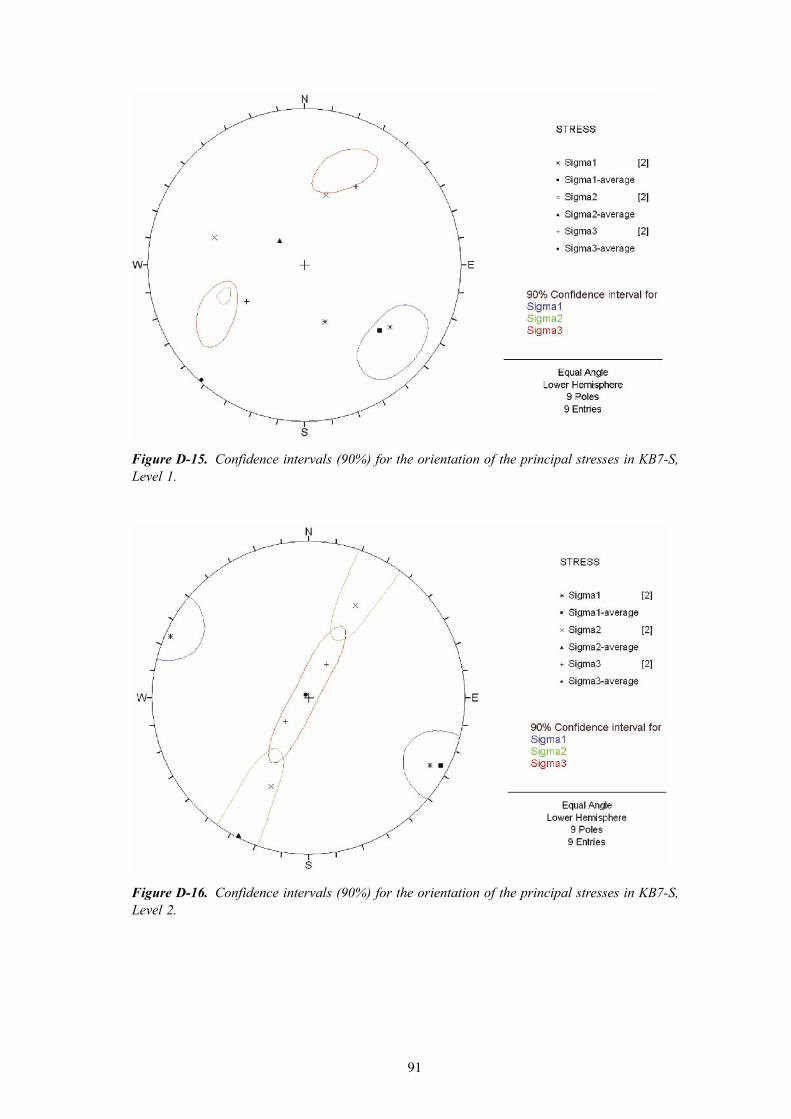
91
Figure D-15. Confidence intervals (90%) for the orientation of the principal stresses in KB7-S, Level 1.
Figure D-16. Confidence intervals (90%) for the orientation of the principal stresses in KB7-S, Level 2.
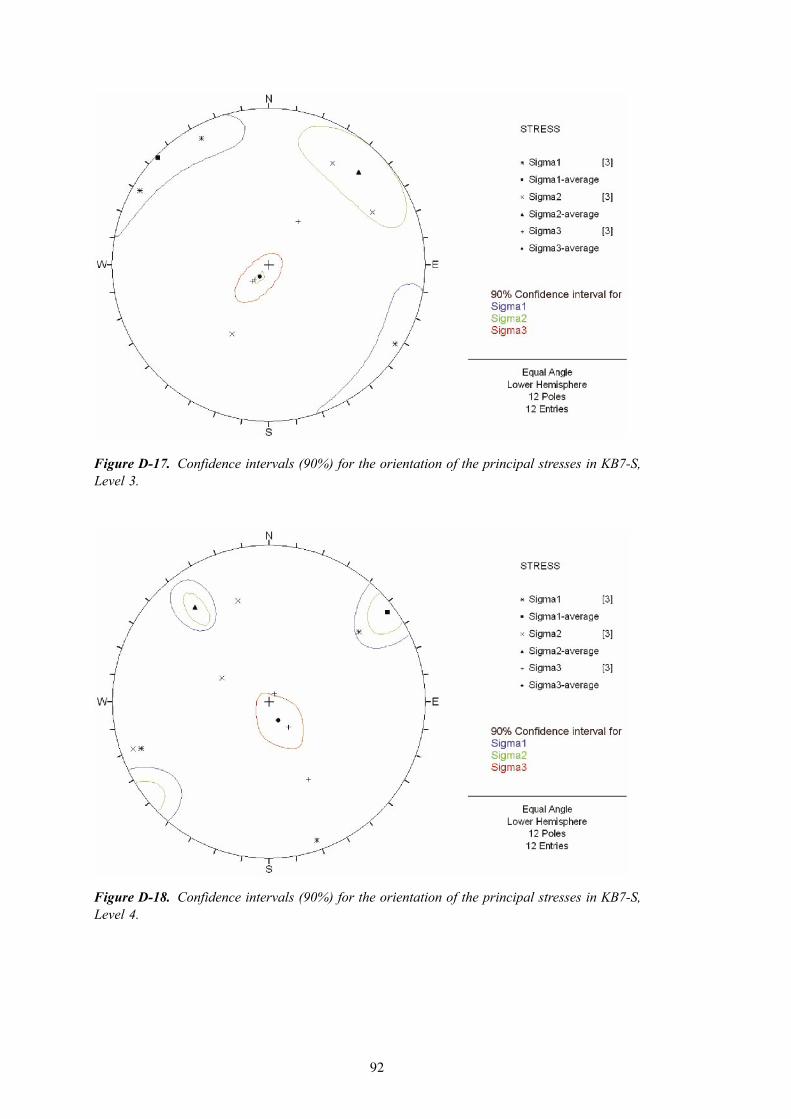
92
Figure D-17. Confidence intervals (90%) for the orientation of the principal stresses in KB7-S, Level 3.
Figure D-18. Confidence intervals (90%) for the orientation of the principal stresses in KB7-S, Level 4.
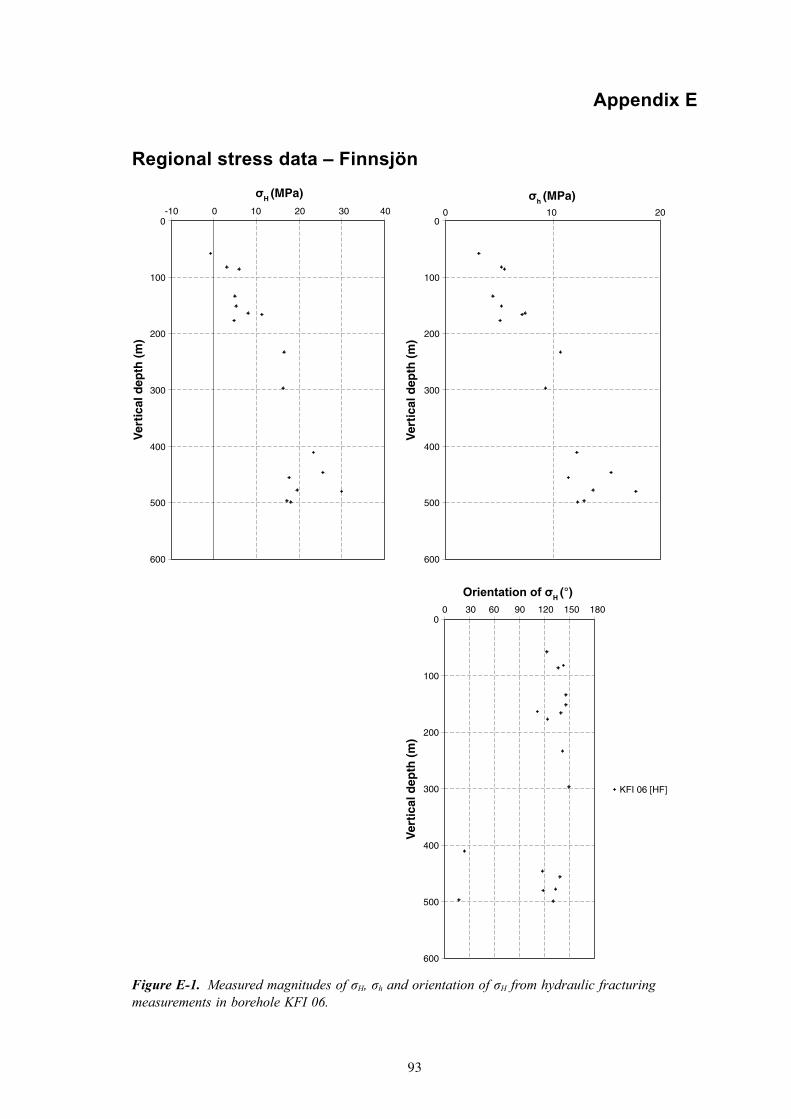
93
Appendix E
Regional stress data – Finnsjön
Figure E-1. Measured magnitudes of σH, σh and orientation of σH from hydraulic fracturing measurements in borehole KFI 06.
0
100
200
300
400
500
600
-10 0 10 20 30 400
100
200
300
400
500
600
0 10 20
0
100
200
300
400
500
600
0 30 60 90 120 150 180
KFI 06 [HF]
σH (MPa)
Ver
tica
l dep
th (
m)
Ver
tica
l dep
th (
m)
Ver
tica
l dep
th (
m)
σh (MPa)
Orientation of σH (°)

94
Figure E-2. Average values (■-markers) and 90%-confidence intervals (├───┤) for the horizontal and vertical stress components, shown together with measured values using hydraulic fracturing for each measurement level (x-markers) in borehole KFI 06.
0
100
200
300
400
500
600
-10 0 10 20 30 400
100
200
300
400
500
600
-10 0 10 20 30
σH (MPa)V
erti
cal d
epth
(m
)
Ve r
tica
l dep
th (
m)
σh (MPa)Confidence interval 90%
min maxConfidence interval 90%
min max
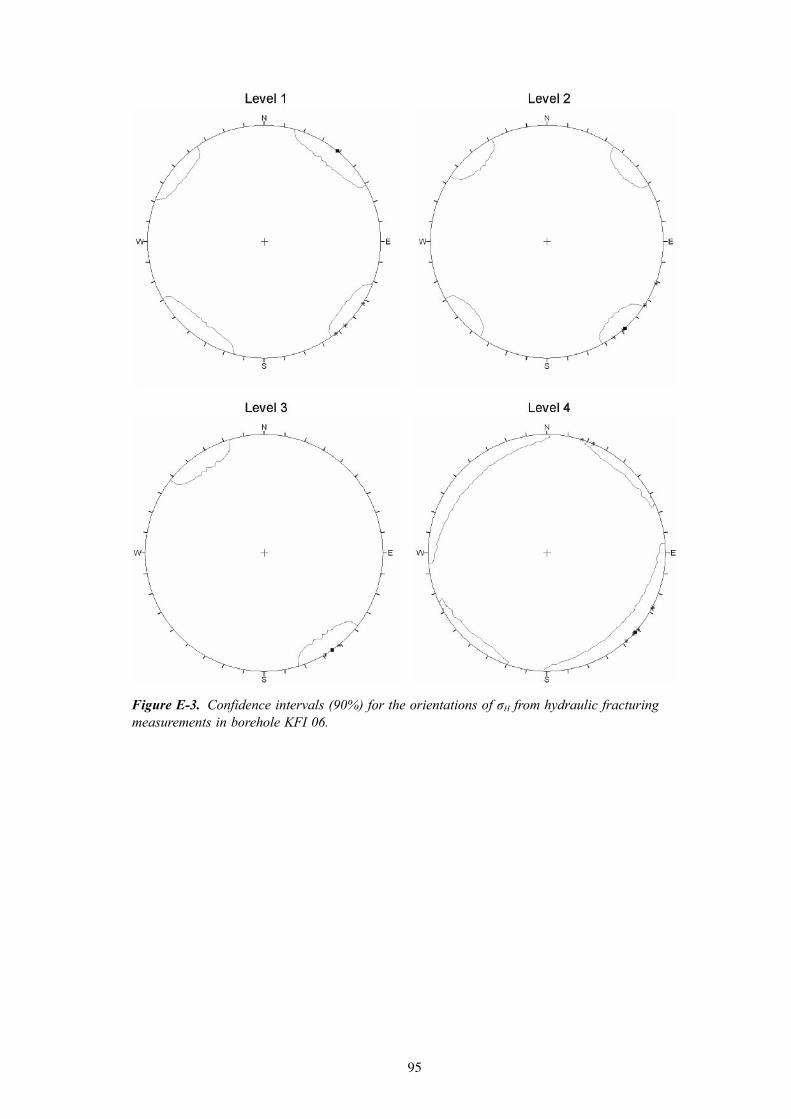
95
Figure E-3. Confidence intervals (90%) for the orientations of σH from hydraulic fracturing measurements in borehole KFI 06.
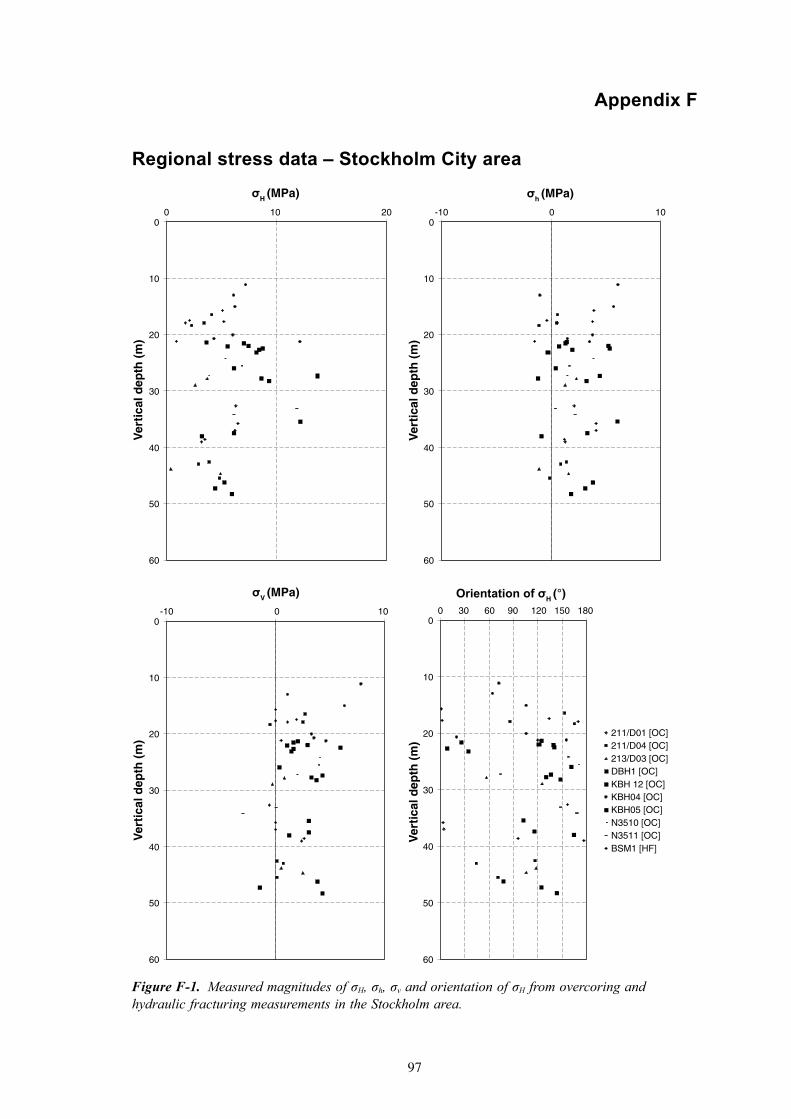
97
Appendix F
Regional stress data – Stockholm City area
Figure F-1. Measured magnitudes of σH, σh, σv and orientation of σH from overcoring and hydraulic fracturing measurements in the Stockholm area.
0
10
20
30
40
50
60
0 10 200
10
20
30
40
50
60
-10 0 10
0
10
20
30
40
50
60
-10 0 100
10
20
30
40
50
60
0 30 60 90 120 150 180
211/D01 [OC]211/D04 [OC]213/D03 [OC]DBH1 [OC]KBH 12 [OC]KBH04 [OC]KBH05 [OC]N3510 [OC]N3511 [OC]BSM1 [HF]
σH (MPa)
Ver
tica
l dep
th (
m)
Ver
tica
l dep
th (
m)
Ve r
tica
l dep
th (
m)
Ver
tica
l dep
th (
m)
σh (MPa)
σV (MPa) Orientation of σH (°)

98
Fig
ure
F-2
. Av
erag
e va
lues
(■-m
arke
rs) a
nd 9
0%-c
onfid
ence
inte
rval
s (├
──
─┤
) for
the
hori
zont
al a
nd v
ertic
al s
tress
com
pone
nts,
show
n to
geth
er w
ith
mea
sure
d va
lues
usi
ng o
verc
orin
g or
hyd
raul
ic fr
actu
ring
for
each
mea
sure
men
t lev
el (x
-mar
kers
)in th
e St
ockh
olm
are
a. (F
or th
e ve
rtic
al s
tress
, a li
ne
corr
espo
ndin
g to
the
over
burd
en p
ress
ure
is s
how
n fo
r re
fere
nce.
)
0 01
02
03
04
05
06
02
01
00 0
1
02
03
04
05
06
01
00
1 -0 0
1
02
03
04
05
06
01
00
1 -
σ H (M
Pa)
Vertical depth (m)
Vertical depth (m)
Vertical depth (m)
σ h (M
Pa)
σ V (M
Pa)
Con
fiden
ce in
terv
al 9
0%m
in
max

99
Figure F-3. Confidence intervals for the orientation of the principal stresses in 211/D01: 90% (top) and 97% (bottom), determined from overcoring measurements.

100
Figure F-4. Confidence intervals for the orientation of the principal stresses in 211/D04: 90% (top) and 97% (bottom), determined from overcoring measurements.
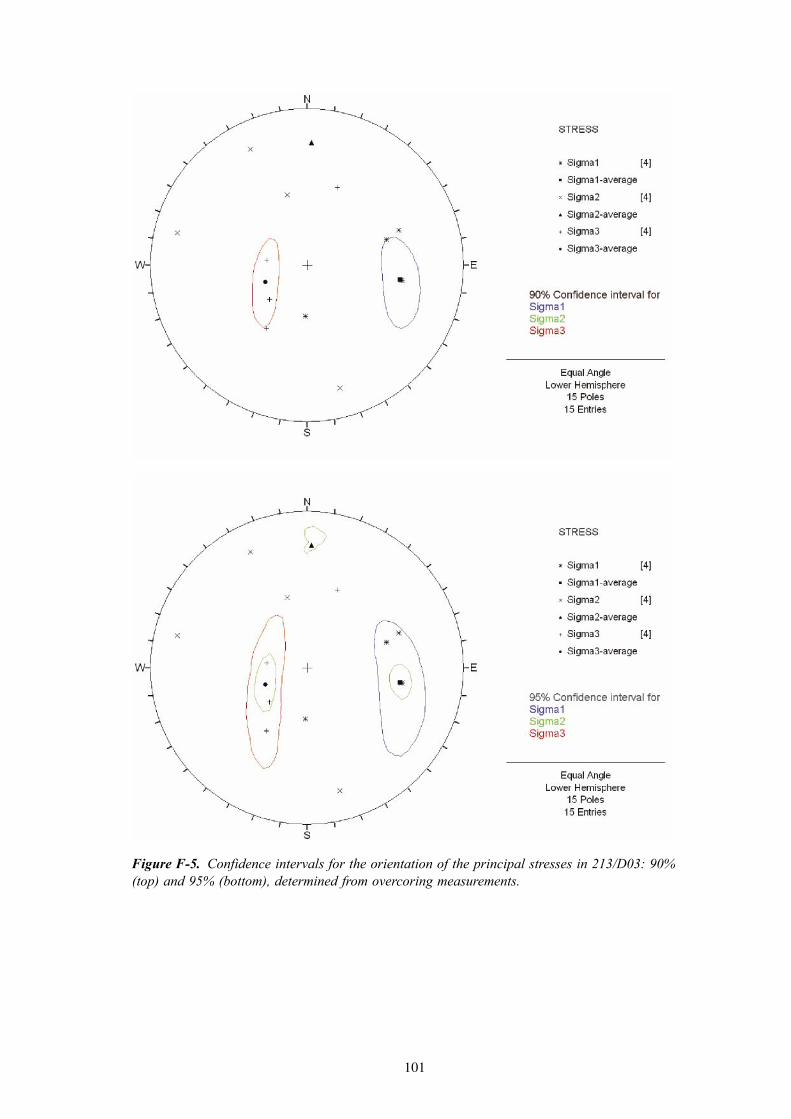
101
Figure F-5. Confidence intervals for the orientation of the principal stresses in 213/D03: 90% (top) and 95% (bottom), determined from overcoring measurements.
102
Figure F-6. Confidence intervals (90%) for the orientation of the principal stresses in DBH1, determined from overcoring measurements.
103
Figure F-7. Confidence intervals for the orientation of the principal stresses in KBH12: 90% (top) and 95% (bottom), determined from overcoring measurements.

104
Figure F-8. Confidence intervals for the orientation of the principal stresses in KBH04: 90% (top) and 95% (bottom), determined from overcoring measurements.
105
Figure F-9. Confidence intervals (90%) for the orientation of the principal stresses in KBH05, determined from overcoring measurements.
Figure F-10. Confidence intervals (90%) for the orientation of the principal stresses in N3510, determined from overcoring measurements.
106
Figure F-11. Confidence intervals (90%) for the orientation of the principal stresses in N3511, determined from overcoring measurements.
Figure F-12. Confidence intervals (90%) for the orientations of σH from hydraulic fracturing measurements in borehole BSM1.

107
Appendix G
Regional stress data – Björkö
Figure G-1. Measured magnitudes of σH, σh and orientation of σH for hydraulic fracturing measurements at Björkö.
0
100
200
300
400
500
600
700
800
900
1,000
0 10 20 30 400
100
200
300
400
500
600
700
800
900
1,000
0 10 20
0
100
200
300
400
500
600
700
800
900
1,000
0 30 60 90 120 150 180
BJO01 [HF]
σH (MPa)
Ver
tica
l dep
th (
m)
Ver
tica
l dep
th (
m)
Ver
tica
l dep
th (
m)
σh (MPa)
Orientation of σH (°)
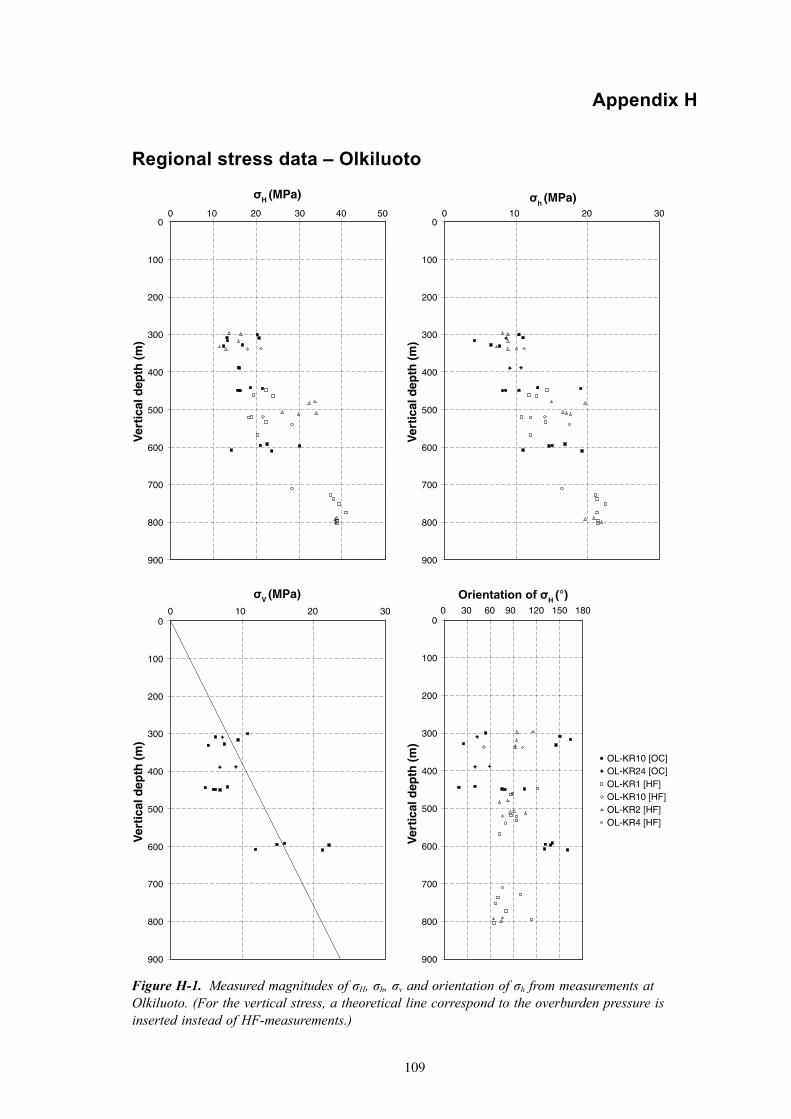
109
Appendix H
Regional stress data – Olkiluoto
Figure H-1. Measured magnitudes of σH, σh, σv and orientation of σh from measurements at Olkiluoto. (For the vertical stress, a theoretical line correspond to the overburden pressure is inserted instead of HF-measurements.)
0
100
200
300
400
500
600
700
800
900
0 10 20 30 40 500
100
200
300
400
500
600
700
800
900
0 10 20 30
0
100
200
300
400
500
600
700
800
900
0 10 20 300
100
200
300
400
500
600
700
800
900
0 30 60 90 120 150 180
OL-KR10 [OC]OL-KR24 [OC]OL-KR1 [HF]OL-KR10 [HF]OL-KR2 [HF]OL-KR4 [HF]
σH (MPa)
Ver
tica
l dep
th (
m)
Ver
tica
l dep
th (
m)
Ve r
tica
l dep
th (
m)
Ver
tica
l dep
th (
m)
σh (MPa)
σV (MPa) Orientation of σH (°)

110
Fig
ure
H-2
. Av
erag
e va
lues
(■-m
arke
rs) a
nd 9
0%-c
onfid
ence
inte
rval
s (├
──
─┤
) for
the
hori
zont
al a
nd v
ertic
al s
tress
com
pone
nts,
show
n to
geth
er w
ith
mea
sure
d va
lues
usi
ng o
verc
orin
g or
hyd
raul
ic fr
actu
ring
for
each
mea
sure
men
t lev
el (x
-mar
kers
)in b
oreh
oles
at O
lkilu
oto.
(For
the
vert
ical
stre
ss, a
line
co
rres
pond
ing
to th
e ov
erbu
rden
pre
ssur
e is
sho
wn
for
refe
renc
e.)
0 00
1
00
2
00
3
00
4
00
5
00
6
00
7
00
8
00
9
05
04
03
02
01
00 0
01
00
2
00
3
00
4
00
5
00
6
00
7
00
8
00
9
03
02
01
00 0
01
00
2
00
3
00
4
00
5
00
6
00
7
00
8
00
9
03
02
01
0
σ H (M
Pa)
Vertical depth (m)
Vertical depth (m)
Vertical depth (m)
σ h (M
Pa)
σ V (M
Pa)
Con
fiden
ce in
terv
al 9
0%m
in
max
Con
fiden
ce in
terv
al 9
0%m
in
max
Con
fiden
ce in
ter v
al 9
0%m
in
ma x

111
Figure H-3. Confidence intervals for the orientation of the principal stresses in OL-KR10, Level 1: 90% (top) and 95% (bottom), determined from overcoring measurements.
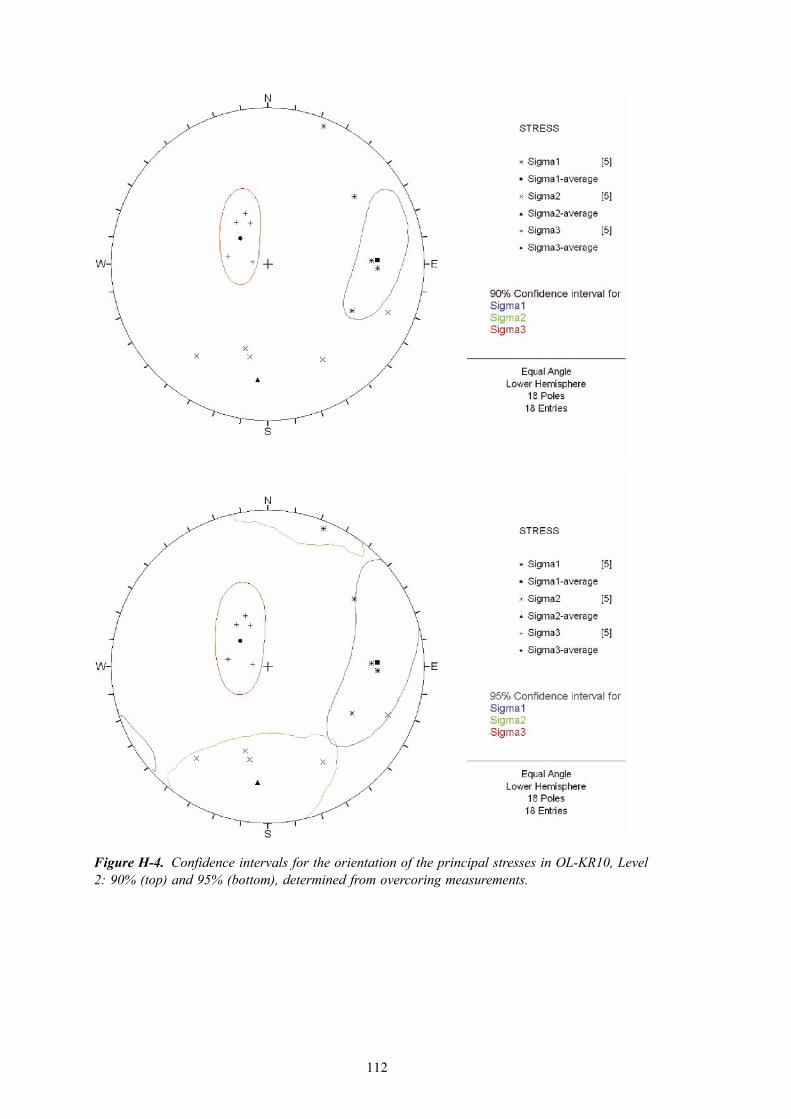
112
Figure H-4. Confidence intervals for the orientation of the principal stresses in OL-KR10, Level 2: 90% (top) and 95% (bottom), determined from overcoring measurements.

113
Figure H-5. Confidence intervals (90%) for the orientation of the principal stresses in OL-KR10, Level 3, determined from overcoring measurements.
Figure H-6. Confidence intervals for the orientation of the principal stresses in OL-KR24 Level 1 (only one measurement), determined from overcoring measurements.

114
Figure H-7. Confidence intervals (90%) for the orientation of the principal stresses in OL-KR24, Level 2, determined from overcoring measurements.
Figure H-8. Confidence intervals (90%) for the orientation of the maximum horizontal stress from hydraulic fracturing measurements in borehole OL-KR1.

115
Figure H-9. Confidence intervals (90%) for the orientation of the maximum horizontal stress from hydraulic fracturing measurements in borehole OL-KR4.
Figure H-10. Confidence intervals (90%) for the orientation of the maximum horizontal stress from hydraulic fracturing measurements in borehole OL-KR2.

116
Figure H-11. Confidence intervals (90%) for the orientation of the maximum horizontal stress from hydraulic fracturing measurements in borehole OL-KR10.
117
Appendix I
Core discing in the Forsmark area
Table I-1. Core discing geometry in borehole KFM02A.
Hole length section of core discing (m)
Geology Disc thickness (mm) *)
Comments
Min Max
497.60–497.60 Granite to granodiorite and tonalite – – Probably core discing
497.61–497.61 Granite to granodiorite and tonalite – – Probably core discing
497.63–497.63 Granite to granodiorite and tonalite – – Probably core discing
497.65–497.65 Granite to granodiorite and tonalite – – Probably core discing
497.67–497.67 Granite to granodiorite and tonalite – – Probably core discing
497.68–497.68 Granite to granodiorite and tonalite – – Probably core discing
924.67–924.67 Granite to granodiorite and tonalite – – Probably core discing
924.68–924.68 Granite to granodiorite and tonalite – – Probably core discing
924.69–924.69 Granite to granodiorite and tonalite – – Probably core discing
924.70–924.70 Granite to granodiorite and tonalite – – Probably core discing
*) No values were given in the logging data.
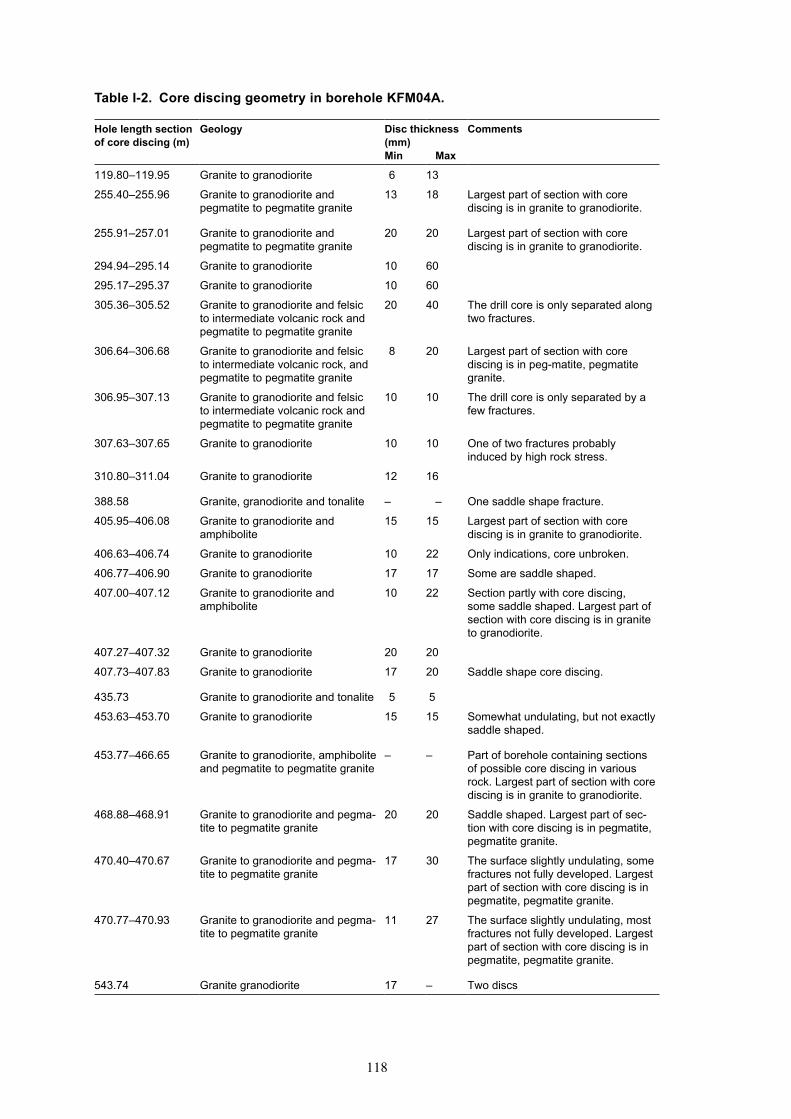
118
Table I-2. Core discing geometry in borehole KFM04A.
Hole length section of core discing (m)
Geology Disc thickness (mm)
Comments
Min Max
119.80–119.95 Granite to granodiorite 6 13
255.40–255.96 Granite to granodiorite and pegmatite to pegmatite granite
13 18 Largest part of section with core discing is in granite to granodiorite.
255.91–257.01 Granite to granodiorite and pegmatite to pegmatite granite
20 20 Largest part of section with core discing is in granite to granodiorite.
294.94–295.14 Granite to granodiorite 10 60
295.17–295.37 Granite to granodiorite 10 60
305.36–305.52 Granite to granodiorite and felsic to intermediate volcanic rock and pegmatite to pegmatite granite
20 40 The drill core is only separated along two fractures.
306.64–306.68 Granite to granodiorite and felsic to intermediate volcanic rock, and pegmatite to pegmatite granite
8 20 Largest part of section with core discing is in peg-matite, pegmatite granite.
306.95–307.13 Granite to granodiorite and felsic to intermediate volcanic rock and pegmatite to pegmatite granite
10 10 The drill core is only separated by a few fractures.
307.63–307.65 Granite to granodiorite 10 10 One of two fractures probably induced by high rock stress.
310.80–311.04 Granite to granodiorite 12 16
388.58 Granite, granodiorite and tonalite – – One saddle shape fracture.
405.95–406.08 Granite to granodiorite and amphibolite
15 15 Largest part of section with core discing is in granite to granodiorite.
406.63–406.74 Granite to granodiorite 10 22 Only indications, core unbroken.
406.77–406.90 Granite to granodiorite 17 17 Some are saddle shaped.
407.00–407.12 Granite to granodiorite and amphibolite
10 22 Section partly with core discing, some saddle shaped. Largest part of section with core discing is in granite to granodiorite.
407.27–407.32 Granite to granodiorite 20 20
407.73–407.83 Granite to granodiorite 17 20 Saddle shape core discing.
435.73 Granite to granodiorite and tonalite 5 5
453.63–453.70 Granite to granodiorite 15 15 Somewhat undulating, but not exactly saddle shaped.
453.77–466.65 Granite to granodiorite, amphibolite and pegmatite to pegmatite granite
– – Part of borehole containing sections of possible core discing in various rock. Largest part of section with core discing is in granite to granodiorite.
468.88–468.91 Granite to granodiorite and pegma-tite to pegmatite granite
20 20 Saddle shaped. Largest part of sec-tion with core discing is in pegmatite, pegmatite granite.
470.40–470.67 Granite to granodiorite and pegma-tite to pegmatite granite
17 30 The surface slightly undulating, some fractures not fully developed. Largest part of section with core discing is in pegmatite, pegmatite granite.
470.77–470.93 Granite to granodiorite and pegma-tite to pegmatite granite
11 27 The surface slightly undulating, most fractures not fully developed. Largest part of section with core discing is in pegmatite, pegmatite granite.
543.74 Granite granodiorite 17 – Two discs

119
Table I-3. Core discing geometry in borehole KFM05A.
Hole length section of core discing (m)
Geology Disc thickness (mm)
Comments
Min Max
147.43–147.46 Granite to granodiorite 12 12 Initial discing, only one of three fractures fully developed.
151.99–152.11 Granite to granodiorite 10 10
200.82–201.19 Granite to granodiorite 12 20 Initial discing, only two of five fractures fully developed.
348.72 Granite to granodiorite 10 10
348.74 Granite to granodiorite 10 10
545.02 Granite to granodiorite 12 12
545.04 Granite to granodiorite 12 12
593.72 Granite to granodiorite and breccia 17 17 Saddle shaped surface. Core discing is in breccia.
593.79 Granite to granodiorite and breccia 13 13 Saddle shaped surface. Core discing is in breccia.
611.99–612.15 Granite to granodiorite 15 15 Initial
612.19–613.51 Granite to granodiorite 12 18 Part of borehole containing sections of possible core discing
635.48–635.50 Granite to granodiorite 10 10
894.97 Granite to granodiorite 25 25
895.00 Granite to granodiorite 12 12
895.01 Granite to granodiorite 17 17
895.03 Granite to granodiorite 17 17
895.05 Granite to granodiorite 17 17
957.76–957.81 Granite to granodiorite 4 16
957.84 Granite to granodiorite 35 35
978.49–979.00 Granite to granodiorite and pegmatite to pegmatite granite
10 14 Mostly saddle shaped; indications of core discing above but core not broken; individual discs are broken into smaller pices. Largest part of section with core discing is in granite to granodiorite.
120
Figure I-1. Estimated magnitudes of the maximum horizontal stress (σH) from observations of core discing on hollow and solid cores from boreholes DBT-1, KFM01A, KFM01B, KFM02A, KFM04A, and KFM05A, as well as from spalling failure in borehole KFM01B.
0
100
200
300
400
500
600
700
800
900
1,000
0 10 20 30 40 50 60 70 80 90
σH (MPa)
Discing - solid core KFM02A
Discing - solid core KFM04A
Discing - solid core KFM05A
Discing - solid core (all holes)
Spalling & discing KFM01B
Discing - overcoring DBT-1
Discing - DBT-1 (Martna et al., 1983)

121
App
endi
x J
Prim
ary
mea
sure
men
t dat
a fr
om F
orsm
ark,
Fin
nsjö
n an
d O
lkilu
oto
Tabl
e J-
1. P
rimar
y da
ta fr
om ro
ck s
tres
s m
easu
rem
ents
at t
he F
orsm
ark,
Fin
nsjö
n an
d O
lkilu
oto
site
s (m
easu
rem
ents
com
mis
sion
ed b
y SK
B o
r Po
siva
).
Site
Bor
ehol
e
and
met
hod
Vert
ical
de
pth
(m)
σ 1σ 2
σ 3σ H
(M
Pa)
σ h
(MPa
)σ V
(M
Pa)
Orie
ntat
ion
of σ
H (º
)M
agni
tude
(M
Pa)
Dip
Dir
(º)
Dip
(º
)M
agni
tude
(M
Pa)
Dip
Dir
(º)
Dip
(º
)M
agni
tude
(M
Pa)
Dip
Dir
(º)
Dip
(º
)
Finn
sjön
KFI
06
(HF)
57.5
0–
––
––
––
––
–0.8
3.1
–12
2
Finn
sjön
KFI
06
(HF)
82.0
0–
––
––
––
––
3.0
5.2
–14
2
Finn
sjön
KFI
06
(HF)
86.0
0–
––
––
––
––
5.9
5.5
–13
6
Finn
sjön
KFI
06
(HF)
134.
00–
––
––
––
––
4.9
4.4
–14
5
Finn
sjön
KFI
06
(HF)
151.
50–
––
––
––
––
5.2
5.2
–14
5
Finn
sjön
KFI
06
(HF)
164.
00–
––
––
––
––
8.0
7.4
–11
1
Finn
sjön
KFI
06
(HF)
166.
00–
––
––
––
––
11.2
7.1
–13
9
Finn
sjön
KFI
06
(HF)
177.
00–
––
––
––
––
4.7
5.1
–12
3
Finn
sjön
KFI
06
(HF)
233.
50–
––
––
––
––
16.4
10.7
–14
1
Finn
sjön
KFI
06
(HF)
297.
20–
––
––
––
––
16.2
9.3
–14
9
Finn
sjön
KFI
06
(HF)
410.
90–
––
––
––
––
23.3
12.2
–23
Finn
sjön
KFI
06
(HF)
446.
30–
––
––
––
––
25.5
15.4
–11
7
Finn
sjön
KFI
06
(HF)
456.
00–
––
––
––
––
17.6
11.4
–13
8
Finn
sjön
KFI
06
(HF)
478.
00–
––
––
––
––
19.5
13.7
–13
3
Finn
sjön
KFI
06
(HF)
480.
00–
––
––
––
––
29.9
17.7
–11
8
Finn
sjön
KFI
06
(HF)
497.
00–
––
––
––
––
17.1
12.9
–17
Finn
sjön
KFI
06
(HF)
499.
00–
––
––
––
––
18.0
12.3
–13
0
Fors
mar
kD
358
(OC
)5.
8–
––
––
––
––
6.7
0.9
1.1
129
Fors
mar
kD
358
(OC
)7
––
––
––
––
–17
.24.
30.
611
0
Fors
mar
kD
358
(OC
)15
.2–
––
––
––
––
15.0
10.9
–6.6
6
Fors
mar
kD
358
(OC
)15
.6–
––
––
––
––
16.0
13.6
1.6
149

122
Site
Bor
ehol
e
and
met
hod
Vert
ical
de
pth
(m)
σ 1σ 2
σ 3σ H
(M
Pa)
σ h
(MPa
)σ V
(M
Pa)
Orie
ntat
ion
of σ
H (º
)M
agni
tude
(M
Pa)
Dip
Dir
(º)
Dip
(º
)M
agni
tude
(M
Pa)
Dip
Dir
(º)
Dip
(º
)M
agni
tude
(M
Pa)
Dip
Dir
(º)
Dip
(º
)
Fors
mar
kD
358
(OC
)16
.2–
––
––
––
––
18.9
13.4
0.0
112
Fors
mar
kD
358
(OC
)23
.2–
––
––
––
––
18.1
4.9
–1.6
113
Fors
mar
kD
358
(OC
)30
.9–
––
––
––
––
25.7
2.6
–8.8
112
Fors
mar
kB
H S
FR 1
/177
(OC
)35
.82
13.4
825
5.9
108
201.
323
357
11.5
5.2
4.0
2
Fors
mar
kB
H S
FR 1
/177
(OC
)36
.39
13.1
3131
7.3
292
1–0
.620
159
9.4
7.3
3.1
25
Fors
mar
kB
H S
FR 1
/177
(OC
)41
.14
3.7
298
172.
441
370.
418
848
3.6
1.6
1.4
109
Fors
mar
kB
H S
FR 1
/177
(OC
)41
.78
6.4
5612
1.1
163
55–0
.431
833
6.2
0.1
0.9
55
Fors
mar
kD
BT
1 (H
F)29
.00
––
––
––
––
––
2.5
––
Fors
mar
kD
BT
1 (H
F)94
.00
––
––
––
––
–5.
83.
8–
–
Fors
mar
kD
BT
1 (H
F)21
9.00
––
––
––
––
–6.
73.
6–
–
Fors
mar
kD
BT
1 (H
F)22
0.00
––
––
––
––
–3.
82.
7–
–
Fors
mar
kD
BT
1 (H
F)28
9.00
––
––
––
––
–11
.86.
8–
145
Fors
mar
kD
BT
1 (H
F)34
2.00
––
––
––
––
–28
.317
.5–
–
Fors
mar
kD
BT
1 (H
F)38
2.00
––
––
––
––
–17
.08.
7–
–
Fors
mar
kD
BT
1 (H
F)44
3.00
––
––
––
––
–23
.612
.8–
–
Fors
mar
kD
BT
1 (H
F)49
1.00
––
––
––
––
–27
.114
.9–
–
Fors
mar
kD
BT-
1 (O
C)
13.8
714
.099
111
.29
8–3
.819
682
14.0
10.9
–3.5
100
2)
Fors
mar
kD
BT-
1 (O
C)
31.3
635
.587
1218
.435
64
6.0
249
7834
.318
.37.
387
2)
Fors
mar
kD
BT-
1 (O
C)
31.9
630
.058
1016
.832
612
–3.2
185
7529
.215
.9–1
.561
2)
Fors
mar
kD
BT-
1 (O
C)
50.3
712
.69
94.
510
319
1.1
256
6912
.44.
11.
78
2)
Fors
mar
kD
BT-
1 (O
C)
71.4
014
.130
83
7.3
218
9–1
1.1
5781
14.0
6.8
–10.
612
92)
Fors
mar
kD
BT-
1 (O
C)
90.0
018
.834
15
6.7
250
6–3
.111
482
18.6
6.6
–2.9
161
2)
Fors
mar
kD
BT-
1 (O
C)
90.6
229
.526
83
21.0
178
73.
818
8229
.520
.74.
289
2)
Fors
mar
kD
BT-
1 (O
C)
133.
6115
.115
56
13.8
246
102.
535
7915
.013
.42.
914
8
Fors
mar
kD
BT-
1 (O
C)
134.
1815
.430
521
11.2
4114
6.6
161
6514
.410
.88.
011
9
Fors
mar
kD
BT-
1 (O
C)
134.
7419
.032
444
15.2
7016
4.2
175
4215
.810
.412
.294
1)
123
Site
Bor
ehol
e
and
met
hod
Vert
ical
de
pth
(m)
σ 1σ 2
σ 3σ H
(M
Pa)
σ h
(MPa
)σ V
(M
Pa)
Orie
ntat
ion
of σ
H (º
)M
agni
tude
(M
Pa)
Dip
Dir
(º)
Dip
(º
)M
agni
tude
(M
Pa)
Dip
Dir
(º)
Dip
(º
)M
agni
tude
(M
Pa)
Dip
Dir
(º)
Dip
(º
)
Fors
mar
kD
BT-
1 (O
C)
136.
4118
.528
526
12.2
199
6.9
126
6316
.312
.09.
210
0
Fors
mar
kD
BT-
1 (O
C)
165.
5413
.349
612
.031
82
4.5
208
8413
.312
.04.
650
Fors
mar
kD
BT-
1 (O
C)
166.
8024
.227
510
16.6
921
4.4
162
6723
.714
.96.
691
Fors
mar
kD
BT-
1 (O
C)
194.
7722
.227
52
19.0
185
116.
715
7922
.218
.57.
196
Fors
mar
kD
BT-
1 (O
C)
195.
3919
.228
39
11.3
131
–5.4
111
8118
.611
.3–4
.810
31)
Fors
mar
kD
BT-
1 (O
C)
218.
9020
.632
926
18.1
238
25.
414
464
18.2
17.7
8.2
31
Fors
mar
kD
BT-
1 (O
C)
219.
6325
.818
127
17.4
8510
4.4
336
6121
.716
.69.
214
Fors
mar
kD
BT-
1 (O
C)
246.
9418
.445
111
.113
512
9.0
311
7818
.411
.19.
145
Fors
mar
kD
BT-
1 (O
C)
275.
6540
.532
34
21.4
5518
8.4
222
7140
.320
.19.
814
3
Fors
mar
kD
BT-
1 (O
C)
276.
3138
.027
08
20.3
02
9.9
102
8237
.420
.310
.590
Fors
mar
kD
BT-
1 (O
C)
299.
7121
.831
111
13.9
4312
9.3
180
7321
.413
.710
.012
9
Fors
mar
kD
BT-
1 (O
C)
300.
3432
.033
229
10.6
241
21.
514
961
24.8
10.6
8.7
153
Fors
mar
kD
BT-
1 (O
C)
374.
6342
.514
86
29.7
577
5.8
275
8142
.229
.36.
514
9
Fors
mar
kD
BT-
1 (O
C)
377.
3742
.816
27
28.0
7117
3.8
273
7242
.426
.06.
316
5
Fors
mar
kD
BT-
1 (O
C)
378.
1647
.212
27
22.1
323
3.3
275
8346
.622
.03.
912
2
Fors
mar
kD
BT-
1 (O
C)
422.
5963
.112
83
43.2
3810
12.7
233
8063
.042
.313
.712
91)
Fors
mar
kD
BT-
1 (O
C)
460.
4860
.413
910
33.1
229
021
.231
981
59.3
33.1
22.2
139
1)
Fors
mar
kD
BT-
1 (O
C)
485.
7267
.030
29
48.7
3622
29.0
190
6666
.145
.932
.811
91)
Fors
mar
kD
BT-
1 (O
C)
499.
8756
.915
94
28.8
249
116
.135
485
56.6
28.8
16.3
159
Fors
mar
kD
BT-
1 (O
C)
501.
7654
.115
44
36.6
6311
13.7
266
7853
.935
.814
.715
5
Fors
mar
kD
BT-
3 (O
C)
22.6
522
.534
010
17.9
728
4.9
201
7722
.117
.65.
615
62)
Fors
mar
kD
BT-
3 (O
C)
23.2
615
.513
23
11.9
222
25.
234
487
15.5
11.9
5.3
131
2)
Fors
mar
kD
BT-
3 (O
C)
23.8
127
.694
421
.03
1511
.120
074
27.6
20.3
11.9
952)
Fors
mar
kD
BT-
3 (O
C)
48.0
230
.247
119
.531
649
10.7
138
4130
.214
.415
.848
2)
Fors
mar
kD
BT-
3 (O
C)
73.6
218
.813
615
17.0
3340
8.5
242
4618
.613
.012
.714
82)
Fors
mar
kD
BT-
3 (O
C)
74.2
022
.888
415
.135
84
6.2
224
8422
.715
.16.
389
2)

124
Site
Bor
ehol
e
and
met
hod
Vert
ical
de
pth
(m)
σ 1σ 2
σ 3σ H
(M
Pa)
σ h
(MPa
)σ V
(M
Pa)
Orie
ntat
ion
of σ
H (º
)M
agni
tude
(M
Pa)
Dip
Dir
(º)
Dip
(º
)M
agni
tude
(M
Pa)
Dip
Dir
(º)
Dip
(º
)M
agni
tude
(M
Pa)
Dip
Dir
(º)
Dip
(º
)
Fors
mar
kD
BT-
3 (O
C)
104.
0222
.013
313
9.5
422
2.7
302
7721
.09.
53.
613
3
Fors
mar
kD
BT-
3 (O
C)
104.
6322
.534
25
10.8
252
10.
414
785
22.4
10.8
0.5
162
Fors
mar
kD
BT-
3 (O
C)
105.
2317
.113
35
7.5
224
43.
535
084
17.0
7.5
3.6
133
Fors
mar
kD
BT-
3 (O
C)
135.
7022
.831
71
14.0
226
286.
649
6222
.812
.48.
213
7
Fors
mar
kD
BT-
3 (O
C)
136.
3118
.114
14
11.8
235
497.
048
4118
.19.
09.
714
01)
Fors
mar
kD
BT-
3 (O
C)
136.
9320
.131
43
5.7
443
–1.3
179
8520
.15.
6–1
.213
41)
Fors
mar
kD
BT-
3 (O
C)
154.
7819
.13
99.
497
266.
825
663
18.8
8.9
7.5
2
Fors
mar
kD
BT-
3 (O
C)
155.
3818
.232
616
13.1
235
110
.214
274
17.6
13.1
10.8
146
Fors
mar
kD
BT-
3 (O
C)
187.
4034
.332
220
13.1
5918
9.7
188
6331
.512
.712
.914
11)
Fors
mar
kD
BT-
3 (O
C)
188.
4517
.022
298.
129
11
1.9
199
6113
.48.
15.
522
Fors
mar
kD
BT-
3 (O
C)
218.
2421
.63
2513
.110
118
7.9
223
5919
.412
.410
.717
7
Fors
mar
kD
BT-
3 (O
C)
218.
8520
.334
925
10.1
8613
1.1
201
6117
.16.
45.
016
2
Fors
mar
kD
BT-
3 (O
C)
219.
4524
.118
417
17.8
8914
6.5
322
6822
.817
.08.
611
Fors
mar
kD
BT-
3 (O
C)
248.
2328
.835
411
12.0
264
3–2
.015
778
27.6
11.9
–0.8
175
1)
Fors
mar
kD
BT-
3 (O
C)
248.
9220
.532
610
15.1
234
87.
510
677
20.1
14.9
8.0
148
Fors
mar
kK
B-2
1 (O
C)
58.3
48.
815
61
6.5
6610
2.2
253
808.
86.
32.
415
7
Fors
mar
kK
B-2
1 (O
C)
58.6
47.
232
05
–0.4
230
0–5
.213
685
7.1
–0.4
–5.1
140
Fors
mar
kK
B-2
1 (O
C)
67.2
71.
813
60
–0.1
226
4–2
.044
861.
8–0
.1–2
.013
6
Fors
mar
kK
B-2
1 (O
C)
68.0
38.
329
621
2.3
198
201.
168
617.
42.
12.
111
8
Fors
mar
kK
B-2
1 (O
C)
68.3
08.
231
81
3.4
228
31.
771
878.
23.
41.
713
8
Fors
mar
kK
B-2
1 (O
C)
72.7
74.
517
0–
3.6
260
331.
480
574.
53.
02.
117
0
Fors
mar
kK
B-2
1 (O
C)
73.6
93.
432
02
0.9
230
8–2
.364
813.
40.
8–2
.214
0
Fors
mar
kK
B-2
1 (O
C)
74.0
89.
033
525
6.4
220
42–
8638
8.3
2.6
4.5
169
Fors
mar
kK
B-2
2 (O
C)
57.9
68.
234
55
4.4
255
22.
114
685
8.1
4.4
2.2
165
Fors
mar
kK
B-2
2 (O
C)
58.1
46.
615
11
3.9
241
7–0
.952
836.
63.
8–0
.915
1
Fors
mar
kK
B-2
2 (O
C)
60.2
74.
817
015
0.1
7615
–1.6
303
694.
4–
–1.1
171
125
Site
Bor
ehol
e
and
met
hod
Vert
ical
de
pth
(m)
σ 1σ 2
σ 3σ H
(M
Pa)
σ h
(MPa
)σ V
(M
Pa)
Orie
ntat
ion
of σ
H (º
)M
agni
tude
(M
Pa)
Dip
Dir
(º)
Dip
(º
)M
agni
tude
(M
Pa)
Dip
Dir
(º)
Dip
(º
)M
agni
tude
(M
Pa)
Dip
Dir
(º)
Dip
(º
)
Fors
mar
kK
B-2
2 (O
C)
61.0
613
.333
00
8.6
605
–0.5
235
8613
.38.
6–0
.515
0
Fors
mar
kK
B-2
2 (O
C)
61.2
07.
833
25
1.3
240
17–6
.078
727.
70.
7–5
.315
3
Fors
mar
kK
B7-
S (O
C)
40.9
711
.116
048
7.7
287
282.
833
288.
84.
38.
513
3
Fors
mar
kK
B7-
S (O
C)
41.6
217
.012
622
4.7
1740
–0.6
238
4315
.02.
14.
013
1
Fors
mar
kK
B7-
S (O
C)
69.8
116
.411
97
7.7
2723
4.5
224
6616
.27.
25.
112
0
Fors
mar
kK
B7-
S (O
C)
70.4
917
.329
42
9.9
203
277.
028
6317
.29.
37.
611
4
Fors
mar
kK
B7-
S (O
C)
99.9
817
.430
03
6.9
208
375.
234
5317
.36.
35.
812
1
Fors
mar
kK
B7-
S (O
C)
100.
6416
.833
25
3.9
6317
0.5
226
7316
.73.
60.
915
2
Fors
mar
kK
B7-
S (O
C)
101.
3519
.112
23
11.5
3215
1.4
223
7519
.010
.92.
112
3
Fors
mar
kK
B7-
S (O
C)
142.
1826
.225
08
21.2
343
225.
414
267
26.0
19.0
8.0
64
Fors
mar
kK
B7-
S (O
C)
142.
8413
.952
181.
229
753
–2.3
153
3212
.7–1
.31.
454
Fors
mar
kK
B7-
S (O
C)
143.
5216
.916
14
12.5
251
51.
534
8316
.812
.41.
616
0
Fors
mar
kK
FM01
A (H
F)24
7.99
––
––
––
––
––
–6.
3–
Fors
mar
kK
FM01
A (H
F)43
0.28
––
––
––
––
––
12.0
–71
Fors
mar
kK
FM01
A (H
F)43
4.78
––
––
––
––
––
–10
.1–
Fors
mar
kK
FM01
A (H
F)44
8.81
––
––
––
––
––
–11
.8–
Fors
mar
kK
FM01
A (H
F)45
2.87
––
––
––
––
––
–11
.0–
Fors
mar
kK
FM01
A (H
F)47
2.27
––
––
––
––
––
–10
.8–
Fors
mar
kK
FM01
A (H
F)49
2.11
––
––
––
––
––
–12
.4–
Fors
mar
kK
FM01
A (H
F)49
8.03
––
––
––
––
––
17.2
–16
0
Fors
mar
kK
FM01
A (H
F)49
9.46
––
––
––
––
––
–10
.5–
Fors
mar
kK
FM01
A (H
F)62
1.90
––
––
––
––
––
–15
.5–
Fors
mar
kK
FM01
A (H
F)67
8.02
––
––
––
––
––
–15
.9–
Fors
mar
kK
FM01
A (H
F)68
4.58
––
––
––
––
––
24.0
–64
Fors
mar
kK
FM01
A (H
F)68
7.51
––
––
––
––
––
15.6
–10
8

126
Site
Bor
ehol
e
and
met
hod
Vert
ical
de
pth
(m)
σ 1σ 2
σ 3σ H
(M
Pa)
σ h
(MPa
)σ V
(M
Pa)
Orie
ntat
ion
of σ
H (º
)M
agni
tude
(M
Pa)
Dip
Dir
(º)
Dip
(º
)M
agni
tude
(M
Pa)
Dip
Dir
(º)
Dip
(º
)M
agni
tude
(M
Pa)
Dip
Dir
(º)
Dip
(º
)
Fors
mar
kK
FM01
A (H
F)93
9.52
––
––
––
––
––
26.9
–87
Fors
mar
kK
FM01
B (H
F)16
7.07
––
––
––
––
––
–3.
0–
Fors
mar
kK
FM01
B (H
F)18
3.46
––
––
––
––
––
–5.
0–
Fors
mar
kK
FM01
B (H
F)21
1.13
––
––
––
––
––
–4.
1–
Fors
mar
kK
FM01
B (H
F)45
4.68
––
––
––
––
––
24.2
–14
4
Fors
mar
kK
FM01
B (O
C)
232.
7741
.310
46
21.9
199
346.
96
5541
.017
.111
.910
3
Fors
mar
kK
FM01
B (O
C)
233.
8038
.728
212
22.3
187
1915
.643
6737
.721
.617
.410
3
Fors
mar
kK
FM01
B (O
C)
235.
7640
.228
912
32.4
195
1719
.053
6939
.431
.121
.111
4
Fors
mar
kK
FM01
B (O
C)
399.
1842
.314
128
25.2
3034
10.3
261
4337
.218
.621
.915
2
Fors
mar
kK
FM01
B (O
C)
455.
1546
.815
623
14.5
1162
10.0
252
1441
.710
.419
.315
7
Fors
mar
kK
FM02
A (H
F)14
9.20
––
––
––
––
––
–8.
2–
Fors
mar
kK
FM02
A (H
F)21
3.71
––
––
––
––
––
–8.
2–
Fors
mar
kK
FM02
A (H
F)22
2.88
––
––
––
––
––
–6.
8–
Fors
mar
kK
FM02
A (H
F)37
4.78
––
––
––
––
––
8.7
–24
Fors
mar
kK
FM02
A (H
F)41
3.57
––
––
––
––
––
–12
.0–
Fors
mar
kK
FM02
A (H
F)42
8.66
––
––
––
––
––
–10
.8–
Fors
mar
kK
FM02
A (H
F)44
8.36
––
––
––
––
––
–7.
5–
Fors
mar
kK
FM02
A (H
F)45
5.77
––
––
––
––
––
18.8
–28
Fors
mar
kK
FM02
A (H
F)51
8.34
––
––
––
––
––
–13
.1–
Fors
mar
kK
FM02
A (H
F)54
9.53
––
––
––
––
––
16.4
–12
8
Fors
mar
kK
FM02
A (H
F)60
0.58
––
––
––
––
––
18.3
–13
7
Fors
mar
kK
FM02
A (H
F)64
2.47
––
––
––
––
––
–20
.2–
Fors
mar
kK
FM02
A (H
F)69
8.30
––
––
––
––
––
21.6
–14
2
Fors
mar
kK
FM02
A (H
F)70
1.08
––
––
––
––
––
22.6
–13
6
Fors
mar
kK
FM02
A (H
F)70
3.75
––
––
––
––
––
–18
.8–
Fors
mar
kK
FM02
A (H
F)75
3.75
––
––
––
––
––
–20
.5–

127
Site
Bor
ehol
e
and
met
hod
Vert
ical
de
pth
(m)
σ 1σ 2
σ 3σ H
(M
Pa)
σ h
(MPa
)σ V
(M
Pa)
Orie
ntat
ion
of σ
H (º
)M
agni
tude
(M
Pa)
Dip
Dir
(º)
Dip
(º
)M
agni
tude
(M
Pa)
Dip
Dir
(º)
Dip
(º
)M
agni
tude
(M
Pa)
Dip
Dir
(º)
Dip
(º
)
Olk
iluot
oO
L-K
R1
(HF)
448.
00–
––
––
––
––
22.3
14.3
–12
2
Olk
iluot
oO
L-K
R1
(HF)
461.
00–
––
––
––
––
19.4
11.8
–89
Olk
iluot
oO
L-K
R1
(HF)
464.
00–
––
––
––
––
24.0
12.9
–87
Olk
iluot
oO
L-K
R1
(HF)
519.
00–
––
––
––
––
19.0
10.8
–87
Olk
iluot
oO
L-K
R1
(HF)
522.
00–
––
––
––
––
18.3
12.0
–95
Olk
iluot
oO
L-K
R1
(HF)
533.
00–
––
––
––
––
22.3
14.1
–95
Olk
iluot
oO
L-K
R1
(HF)
568.
00–
––
––
––
––
20.4
12.0
–72
Olk
iluot
oO
L-K
R1
(HF)
728.
00–
––
––
––
––
37.3
21.1
–10
0
Olk
iluot
oO
L-K
R1
(HF)
738.
00–
––
––
––
––
38.1
21.3
–70
Olk
iluot
oO
L-K
R1
(HF)
752.
00–
––
––
––
––
39.3
22.4
–67
Olk
iluot
oO
L-K
R1
(HF)
773.
00–
––
––
––
––
41.0
21.3
–81
Olk
iluot
oO
L-K
R1
(HF)
795.
00–
––
––
––
––
38.9
21.4
–11
4
Olk
iluot
oO
L-K
R1
(HF)
804.
00–
––
––
––
––
38.9
21.4
–65
Olk
iluot
oO
L-K
R2
(HF)
296.
00–
––
––
––
––
13.7
8.1
–11
6
Olk
iluot
oO
L-K
R2
(HF)
298.
00–
––
––
––
––
16.4
8.8
–95
Olk
iluot
oO
L-K
R2
(HF)
318.
00–
––
––
––
––
15.9
8.8
–94
Olk
iluot
oO
L-K
R2
(HF)
333.
00–
––
––
––
––
11.4
7.2
–93
Olk
iluot
oO
L-K
R2
(HF)
339.
00–
––
––
––
––
12.9
8.8
–92
Olk
iluot
oO
L-K
R2
(HF)
479.
00–
––
––
––
––
33.7
14.9
–83
Olk
iluot
oO
L-K
R2
(HF)
483.
00–
––
––
––
––
32.3
19.6
–72
Olk
iluot
oO
L-K
R2
(HF)
507.
00–
––
––
––
––
26.0
16.5
–91
Olk
iluot
oO
L-K
R2
(HF)
509.
00–
––
––
––
––
34.0
17.0
–86
Olk
iluot
oO
L-K
R2
(HF)
512.
00–
––
––
––
––
29.8
17.6
–10
6
Olk
iluot
oO
L-K
R2
(HF)
790.
00–
––
––
––
––
38.8
20.8
–76
Olk
iluot
oO
L-K
R2
(HF)
792.
00–
––
––
––
––
38.4
19.6
–64
Olk
iluot
oO
L-K
R2
(HF)
799.
00–
––
––
––
––
38.5
21.9
–74

128
Site
Bor
ehol
e
and
met
hod
Vert
ical
de
pth
(m)
σ 1σ 2
σ 3σ H
(M
Pa)
σ h
(MPa
)σ V
(M
Pa)
Orie
ntat
ion
of σ
H (º
)M
agni
tude
(M
Pa)
Dip
Dir
(º)
Dip
(º
)M
agni
tude
(M
Pa)
Dip
Dir
(º)
Dip
(º
)M
agni
tude
(M
Pa)
Dip
Dir
(º)
Dip
(º
)
Olk
iluot
oO
L-K
R4
(HF)
540.
00–
––
––
––
––
28.3
17.4
–80
Olk
iluot
oO
L-K
R4
(HF)
710.
00–
––
––
––
––
28.3
16.4
–76
Olk
iluot
oO
L-K
R10
(HF)
337.
00–
––
––
––
––
21.2
11.1
–52
Olk
iluot
oO
L-K
R10
(HF)
339.
00–
––
––
––
––
18.0
10.0
–10
2
Olk
iluot
oO
L-K
R10
(HF)
520.
00–
––
––
––
––
21.6
14.0
–76
Olk
iluot
oO
L-K
R10
(OC
)30
0.26
22.6
217
2716
.010
832
2.9
338
4520
.310
.4–
54
Olk
iluot
oO
L-K
R10
(OC
)30
9.06
14.8
136
2511
.441
104.
329
163
13.2
11.0
–15
1
Olk
iluot
oO
L-K
R10
(OC
)31
7.26
15.3
151
349.
925
421.
826
430
13.3
4.2
9.5
165
Olk
iluot
oO
L-K
R10
(OC
)32
8.10
18.0
199
209.
991
403.
030
843
16.8
6.5
7.6
25
Olk
iluot
oO
L-K
R10
(OC
)33
1.48
15.0
123
309.
821
200.
626
353
12.4
7.7
5.3
146
Olk
iluot
oO
L-K
R10
(OC
)44
1.75
20.2
5220
14.6
150
205.
028
161
18.7
13.0
8.0
40
Olk
iluot
oO
L-K
R10
(OC
)44
3.76
21.6
223
19.6
112
114.
327
979
21.5
19.0
4.9
19
Olk
iluot
oO
L-K
R10
(OC
)44
8.44
19.0
119
2711
.821
817
2.0
337
5816
.110
.46.
310
5
Olk
iluot
oO
L-K
R10
(OC
)44
9.29
16.5
9220
13.2
195
320.
633
651
15.7
8.5
6.0
75
Olk
iluot
oO
L-K
R10
(OC
)45
0.43
18.3
8823
10.0
191
283.
232
353
16.3
8.1
7.0
79
Olk
iluot
oO
L-K
R10
(OC
)59
2.20
27.7
129
3417
.729
1410
.128
053
22.6
16.8
16.0
141
Olk
iluot
oO
L-K
R10
(OC
)59
5.48
25.8
135
3415
.122
85
10.0
325
5621
.015
.014
.913
2
Olk
iluot
oO
L-K
R10
(OC
)59
7.39
31.3
136
2021
.735
964
13.9
232
1730
.114
.622
.213
9
Olk
iluot
oO
L-K
R10
(OC
)60
8.51
16.0
134
3411
.123
213
10.1
340
5414
.211
.011
.913
1
Olk
iluot
oO
L-K
R10
(OC
)61
0.20
23.8
341
921
.214
281
19.2
251
323
.719
.221
.316
1
Olk
iluot
oO
L-K
R24
(OC
)31
0.10
20.8
222
79.
212
927
6.5
325
6220
.78.
67.
343
Olk
iluot
oO
L-K
R24
(OC
)38
8.15
16.6
269
2715
.115
284.
114
349
15.9
10.7
9.2
59
Olk
iluot
oO
L-K
R24
(OC
)39
0.05
16.1
220
29.
312
915
6.7
316
7516
.19.
16.
940
1) M
easu
rem
ent d
isca
rded
in /P
erm
an a
nd S
jöbe
rg, 2
003/
.2)
Mea
sure
men
t not
ana
lyse
d in
/Per
man
and
Sjö
berg
, (20
03/.
OC
= O
verc
orin
g m
easu
rem
ent.
HF
= H
F an
d/or
HTP
F m
easu
rem
ent.