qut digital repository: · motor vehicle co2 emission factors may be calculated from fuel...
TRANSCRIPT
QUT Digital Repository: http://eprints.qut.edu.au/
Jayaratne, Rohan and Ristovski, Zoran and Morawska, Lidia and Meyer, Nickolas K. (2010) Carbon dioxide emissions from diesel and compressed natural gas buses during acceleration. Transportation Research Part D Transport and Environment, 15(5). pp. 247-253.
© Copyright 2010 Elsevier
Carbon Dioxide Emissions from Diesel and Compressed Natural Gas Buses during Acceleration
E.R. Jayaratne, Z.D. Ristovski*, L. Morawska and N.K. Meyer
International Laboratory for Air Quality and Health
Queensland University of Technology
GPO Box 2434, Brisbane, QLD 4001, Australia
Revised: March 2010
* Corresponding author contact details:
Tel: (617) 3138 1129; Fax: (617) 3138 9079
Email: [email protected]
Submitted to “Transportation Research D; Transport and Environment”

2
Abstract
Motor vehicle emission factors are generally derived from driving tests mimicking
steady state conditions or transient drive cycles. However, neither of these test
conditions completely represents real world driving conditions. In particular, they fail
to determine emissions generated during the accelerating phase – a condition in which
urban buses spend much of their time. In this study we analyse and compare the
results of time-dependant emission measurements conducted on diesel and
compressed natural gas (CNG) buses during an urban driving cycle on a chassis
dynamometer and we derive power-law expressions relating carbon dioxide (CO2)
emission factors to the instantaneous speed while accelerating from rest. Emissions
during acceleration are compared with that during steady speed operation. These
results have important implications for emission modelling particularly under
congested traffic conditions.
Keywords: motor vehicle emissions, carbon dioxide, greenhouse gas emissions, traffic
congestion, bus emissions.
3
1. Introduction
The impact of greenhouse gas (GHG) emissions from the transportation sector on the
atmosphere is of increasing concern. At present, this sector accounts for about 14% of
the total anthropogenic GHG emissions and constitutes one of the strongest growing
sources (IPCC, 2007). This clearly has significant implications for global climate
change and has led to calls for urgent and effective measures and strategies to reduce
GHGs from road transport (OECD, 2002). Since many of these depend on effective
modelling studies to assess and project GHG emissions from the use of transportation,
there is a pivotal need for reliable emission factors pertaining to the various types of
vehicles and driving conditions.
Motor vehicle CO2 emission factors may be calculated from fuel consumption
statistics assuming stoichiometric conditions or determined directly through emission
measurements. Calculated emissions assume complete decomposition of hydrocarbon
fuels to H2O and CO2, while measured emissions incorporate combustion
inefficiencies and, as such, deviate somewhat from the stoichiometric reaction form,
where the complete combustion of 1 L of petrol and diesel fuel yields about 2.5 and
2.7 kg of CO2, respectively (AGO, 2003). The direct measurements are generally
carried out on dynamometers at steady engine loads and speeds or over specified
drive cycles that consist of a range of driving conditions. Several studies have
reported CO2 emission factors for diesel and CNG buses based on complete
dynamometer drive cycles (Clark et al, 1999; Lanni et al, 2003). However, the values
thus derived are averages over a range of driving conditions and do not provide speed-
dependent emission factors. Although there are some reports of speed-dependent
4
emission factors during acceleration for light-duty vehicles (Ahn et al, 2002; El-
Shawarby et al, 2005), there are no emission factors available in the literature for
accelerating buses. This is of particular concern as a significant fraction of emissions
from motor vehicles are thought to occur during acceleration – a condition in which
an increasingly large number of buses operate due to worsening urban traffic
congestion. Furthermore, bus emission factors during acceleration are crucial in urban
traffic simulation and environmental impact models.
In the present study, we analysed CO2 emission data obtained during acceleration
segments of a transient cycle from diesel and CNG powered transport buses to
determine emission factors during acceleration. We used these results to estimate the
total CO2 emission from a bus as it accelerated from rest to a given speed, and
compared this value with the total emission when the bus cruised through the same
distance without stopping. These findings enable us to investigate the effects of traffic
congestion on CO2 and, hence, greenhouse gas emissions.
2. Methods
2.1 Transient Test Cycle
The buses were tested on a chassis dynamometer using the DT-80 transient urban
driving cycle. This cycle consists of a 1 min idle segment, three hard accelerations
from rest to 80 km h-1 and a 1 min cruise segment at 80 km h-1 as shown in the speed-
time diagram in Fig 1(a). In each of the first and second acceleration segments, the
speed of the bus was increased from zero to 80 km h-1, when the foot was taken off
the accelerator, allowing it to drop to zero again. In the third acceleration segment,
once the speed reached 80 km h-1, it was maintained at this speed for 1 min before

5
being decreased to zero. The duration of each cycle was 5-6 mins and the distance
covered was 3.5-4.0 km. Each bus was tested at least three times, providing at least 9
acceleration segments per bus.
2.2 Vehicles Tested
The vehicles tested included 9 diesel and 13 CNG buses from the same urban fleet.
The diesel buses consisted of 5 Euro3 Mercedes OC-500, each less than 2 years old
with an odometer reading of 165-217 x 103 km, and 4 older Volvo Euro1 B10M and
Euro2 B10L buses ranging from 8-16 years in service with odometer readings
between 596-1045 x 103 km. They were all operated on 50 ppm ultralow sulphur
diesel and contained no after-treatment devices. The CNG buses consisted of 5 Euro3
MAN, all less than 1 year old with odometer readings of 2-20 x 103 km, and 8 Euro2
and Euro3 Scania buses, 3-5 years old with the odometer between 134-226 x 103 km.
All CNG buses were fitted with oxidation catalysts. All buses belonged to the same
city fleet and were subject to similar operation and service patterns.
2.3 Sampling Methods
During testing, each bus was mounted on the chassis dynamometer and the emissions
were monitored using a constant volume sampling system with the entire exhaust
drawn into a sampling line of diameter 300 mm and diluted with ambient air to give a
total air flow rate of 500 L s-1. The CO2 concentration in the tunnel was measured
with a non-dispersive infra-red CO2 monitor from California Analytical Instruments
Inc. The response time and the accuracy of the instrument were 1 s and ± 10 ppm,
respectively. CO2 emission rates from the bus were calculated in real time at 1 s
intervals during the course of each test cycle. Operational characteristics such as
instantaneous speed, distance covered, engine power and load were also recorded.

6
3. Results
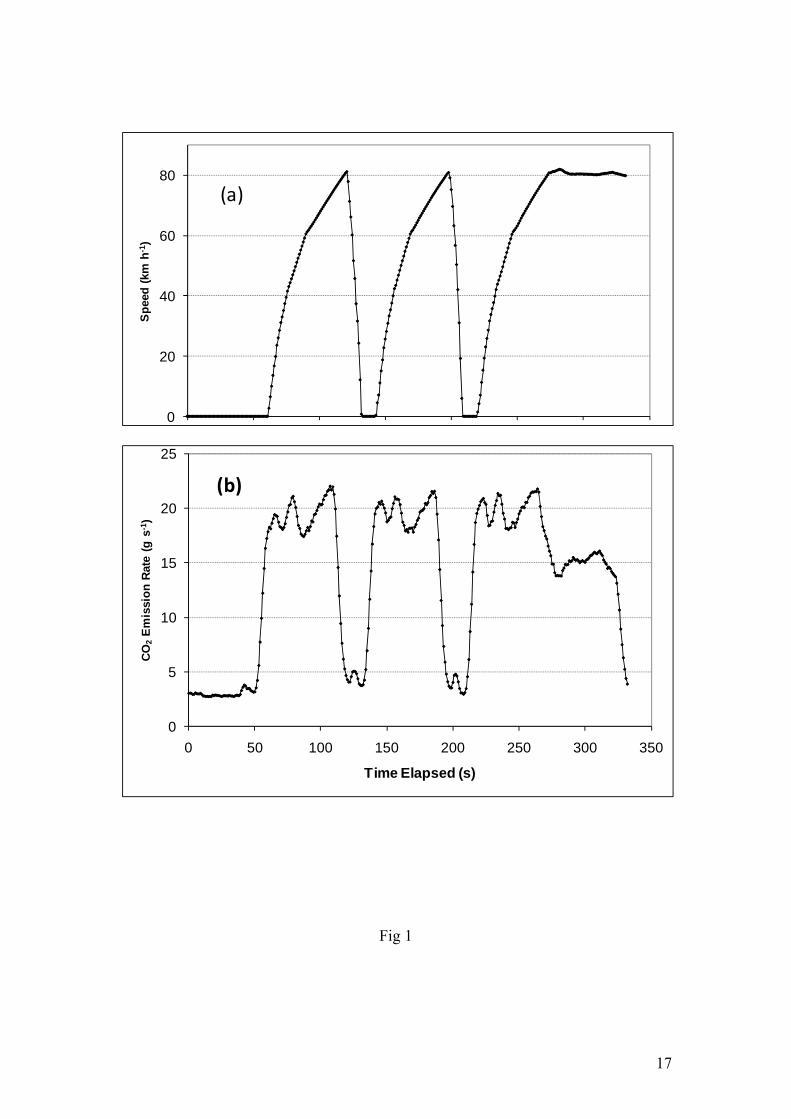
3.1 Emission Rates during Acceleration Fig 1 shows (a) the instantaneous speed and (b) the corresponding CO2 emission rate
from a CNG bus in a typical DT-80 cycle. The measurements show that, when the bus
accelerated, the emission rate increased sharply. The shape of the emission rate curve
was typical for all buses and the undulations reflected the gear changes during
acceleration. With each gear change, the emission rate dropped and then recovered
with further increase in speed. After the first two accelerating segments the speed was
reduced to zero when it reached 80 km h-1. In the third accelerating segment the speed
was again increased to 80 km h-1 and then maintained at this speed for a further 1
min. Note that, as soon as the acceleration was complete, the emission rate dropped
from about 22 g s-1 to about 15 g s-1.
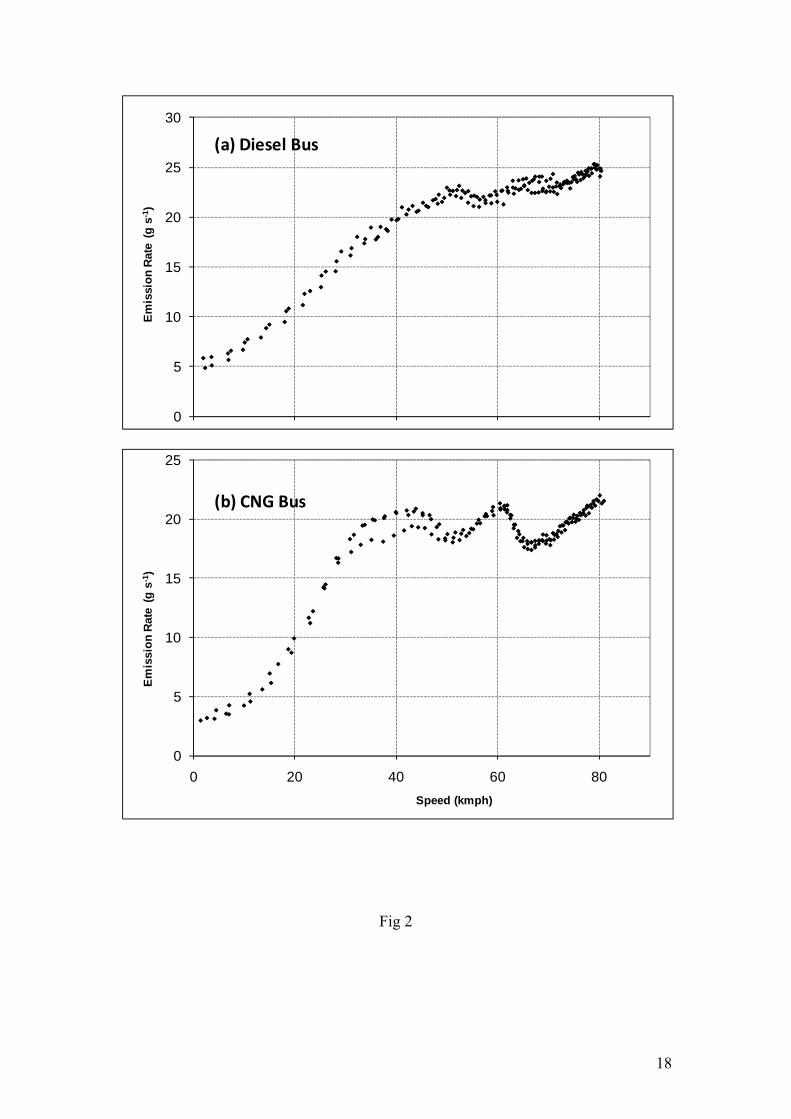
Next, we look at the acceleration segments in more detail. In Fig 2, we have plotted
the emission rates as a function of instantaneous speed for all three acceleration
segments in a drive cycle for (a) a diesel bus (Volvo B10L) and (b) a CNG bus
(Scania). The shapes of the three curves for a given bus were generally consistent and
reproducible over every acceleration segment. The shapes of the curves for diesel
buses and CNG buses were similar except for some general differences. For example,
the peak emission rates of the diesel buses were generally about 15-20% greater than
for the CNG buses. The CNG buses showed the effect of gear changes much more
clearly than the diesel buses.
Over a given gear position, the emission rate was approximately linear with speed.
For example, the bus started in first gear and the change to second gear occurred
7
below 5 km h-1. The change to third gear took place at 40-45 km h-1 (see Fig 2), so
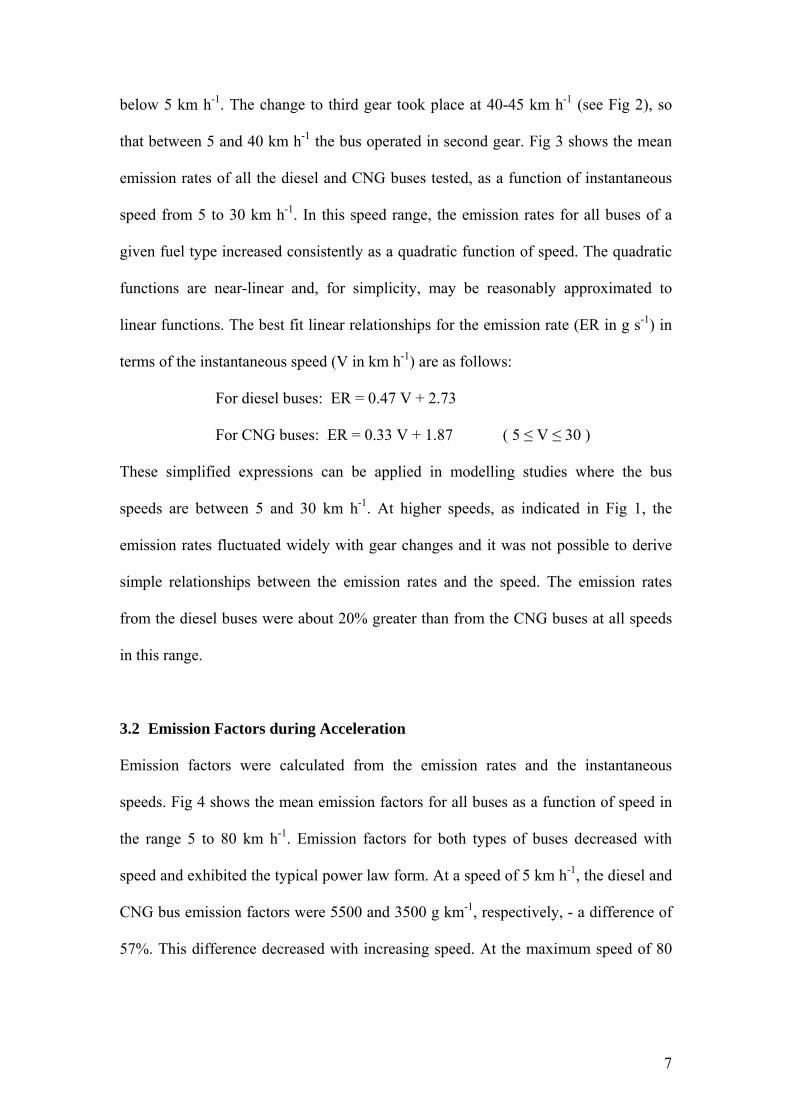
that between 5 and 40 km h-1 the bus operated in second gear. Fig 3 shows the mean
emission rates of all the diesel and CNG buses tested, as a function of instantaneous
speed from 5 to 30 km h-1. In this speed range, the emission rates for all buses of a
given fuel type increased consistently as a quadratic function of speed. The quadratic
functions are near-linear and, for simplicity, may be reasonably approximated to
linear functions. The best fit linear relationships for the emission rate (ER in g s-1) in
terms of the instantaneous speed (V in km h-1) are as follows:
For diesel buses: ER = 0.47 V + 2.73
For CNG buses: ER = 0.33 V + 1.87 ( 5 ≤ V ≤ 30 )
These simplified expressions can be applied in modelling studies where the bus
speeds are between 5 and 30 km h-1. At higher speeds, as indicated in Fig 1, the
emission rates fluctuated widely with gear changes and it was not possible to derive
simple relationships between the emission rates and the speed. The emission rates
from the diesel buses were about 20% greater than from the CNG buses at all speeds
in this range.
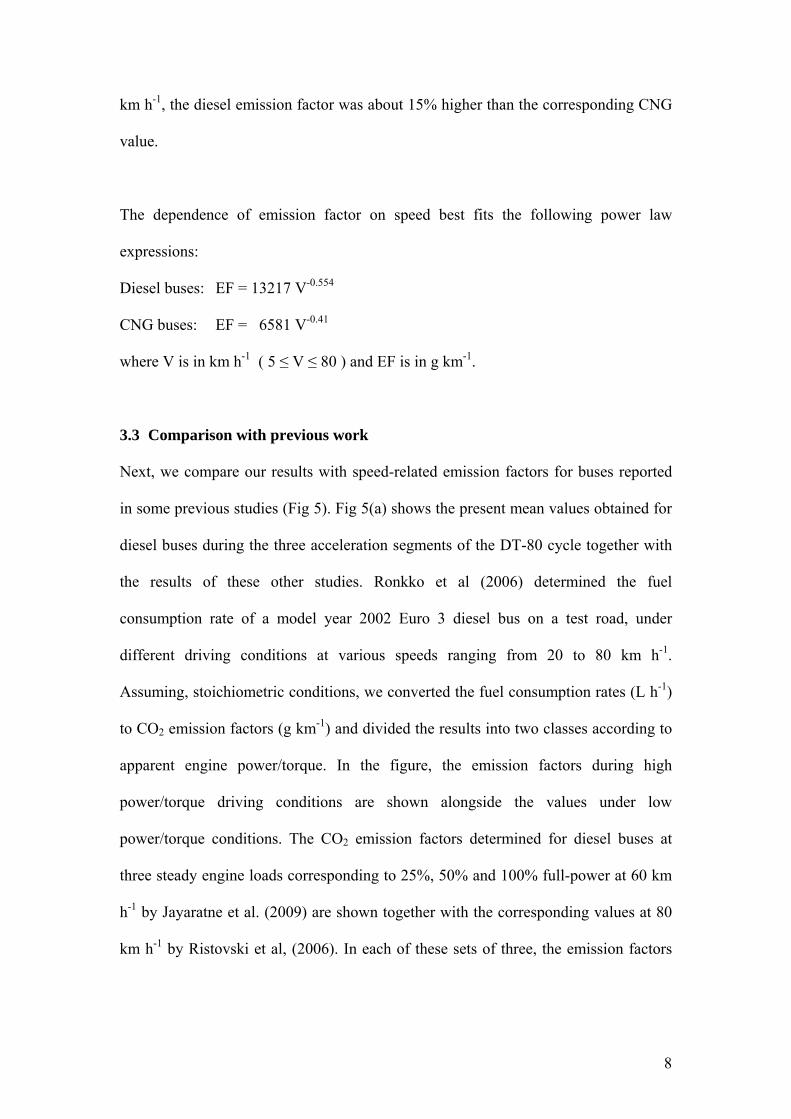
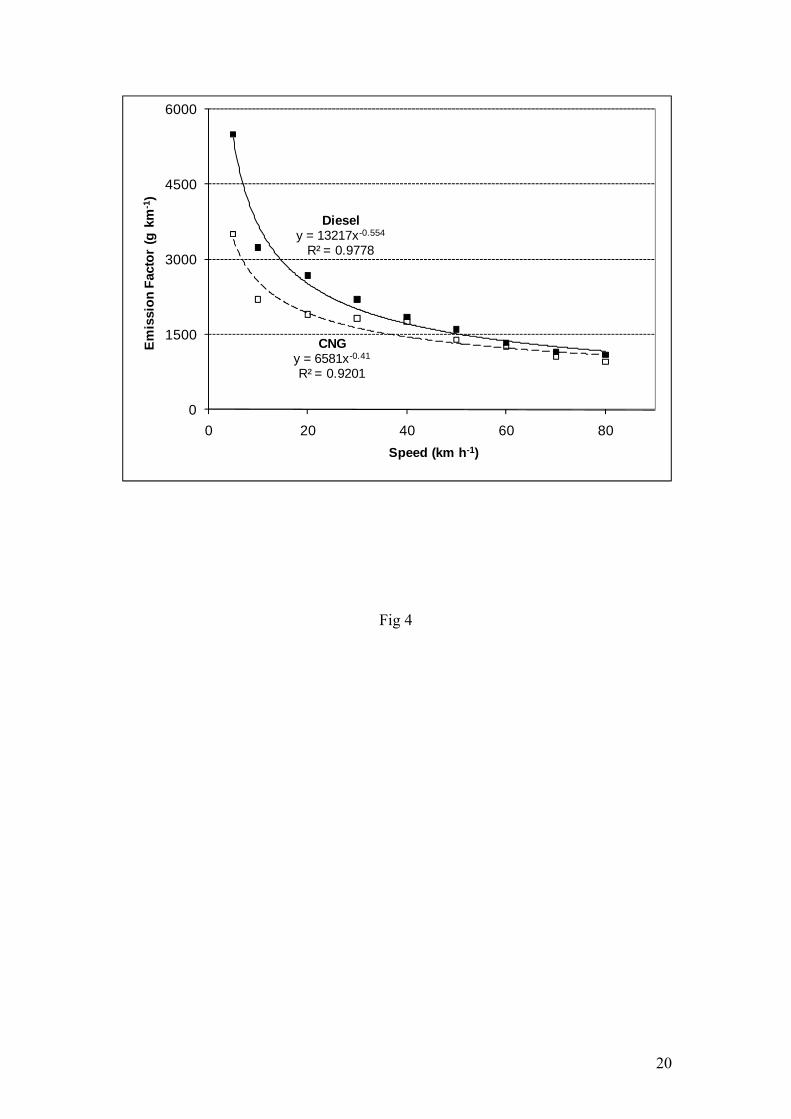
3.2 Emission Factors during Acceleration
Emission factors were calculated from the emission rates and the instantaneous
speeds. Fig 4 shows the mean emission factors for all buses as a function of speed in
the range 5 to 80 km h-1. Emission factors for both types of buses decreased with
speed and exhibited the typical power law form. At a speed of 5 km h-1, the diesel and
CNG bus emission factors were 5500 and 3500 g km-1, respectively, - a difference of
57%. This difference decreased with increasing speed. At the maximum speed of 80
8
km h-1, the diesel emission factor was about 15% higher than the corresponding CNG
value.
The dependence of emission factor on speed best fits the following power law
expressions:
Diesel buses: EF = 13217 V-0.554
CNG buses: EF = 6581 V-0.41
where V is in km h-1 ( 5 ≤ V ≤ 80 ) and EF is in g km-1.
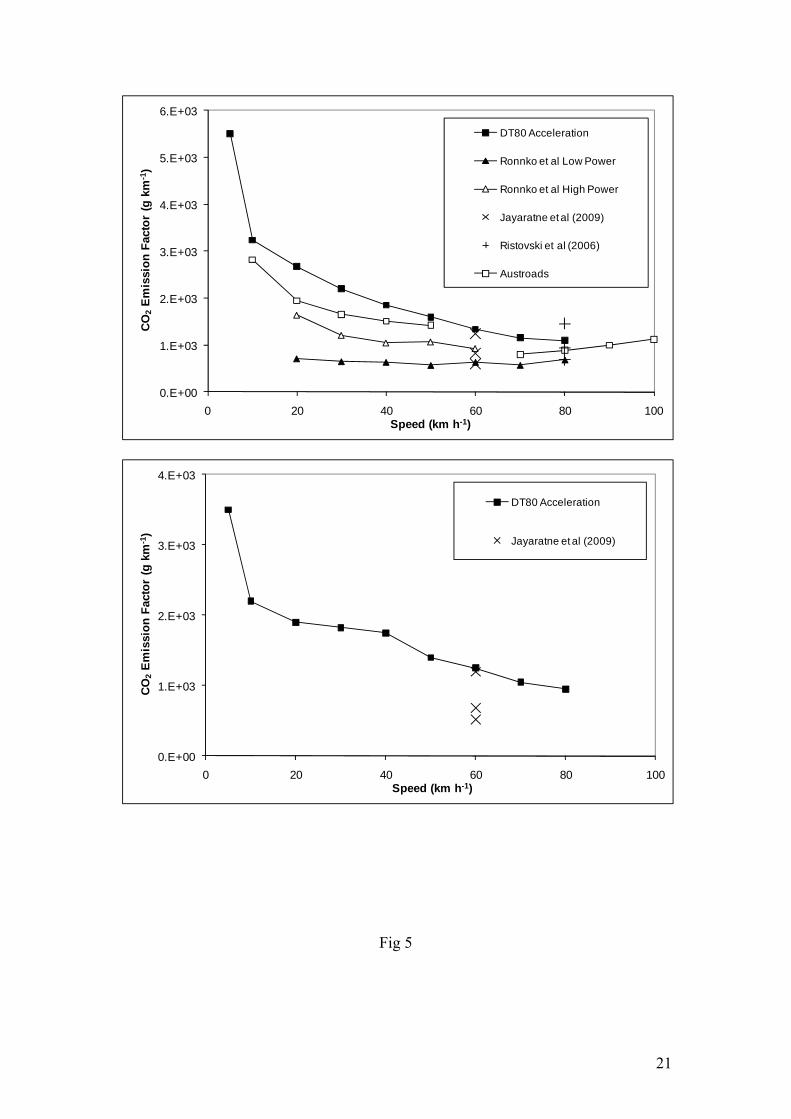
3.3 Comparison with previous work Next, we compare our results with speed-related emission factors for buses reported
in some previous studies (Fig 5). Fig 5(a) shows the present mean values obtained for
diesel buses during the three acceleration segments of the DT-80 cycle together with
the results of these other studies. Ronkko et al (2006) determined the fuel
consumption rate of a model year 2002 Euro 3 diesel bus on a test road, under
different driving conditions at various speeds ranging from 20 to 80 km h-1.
Assuming, stoichiometric conditions, we converted the fuel consumption rates (L h-1)
to CO2 emission factors (g km-1) and divided the results into two classes according to
apparent engine power/torque. In the figure, the emission factors during high
power/torque driving conditions are shown alongside the values under low
power/torque conditions. The CO2 emission factors determined for diesel buses at
three steady engine loads corresponding to 25%, 50% and 100% full-power at 60 km
h-1 by Jayaratne et al. (2009) are shown together with the corresponding values at 80
km h-1 by Ristovski et al, (2006). In each of these sets of three, the emission factors

9
increase with power; that is the lowest emission factor corresponds to 25% power and
the highest corresponds to 100% power.
Also shown in this figure are the emission factors calculated from an empirical
formula for the fuel consumption rate for transport buses recommended by Austroads
(2004). The equation has the form
where V is the average speed in km h-1 and F the fuel consumption rate in L/100 km.
The coefficients A, B, C and D are assigned two different sets of values at speeds
below and above 60 km h-1, accounting for the break in the curve at this speed.
It is not surprising that the emission factors determined in the DT-80 cycle for
accelerating buses are higher than both Ronkko et al and Austroads. The Ronkko et al
measurements were carried out on an open road under a range of mixed driving
conditions including steady speed and acceleration. The Austroads values are based
on a range of urban driving conditions that generally include steady speed, stop and
start conditions. The steady speed dynamometer measurements at 60 km h-1 all show
emission factors that are lower than the present accelerating value at this speed. At 80
km h-1, the emission factors at 25% and 50% engine power are lower than the present
value during acceleration. However the emission factor at 80 km h-1 at full engine
power is greater than in the DT-80 acceleration segment. It is possible that the engine
power/torque of a bus at this high speed and load exceeds that during acceleration.
10
Fig 5(b) shows the CO2 emission factors derived for CNG buses during the three
acceleration segments of the DT-80 cycle, together with the corresponding values
determined for CNG buses at the three steady engine loads corresponding to 25%,
50% and 100% full-power at 60 km h-1 by Jayaratne et al, (2009). The steady state
emission factors increase with engine power but are all less than the value for the
accelerating buses found in the present study at 60 km h-1.
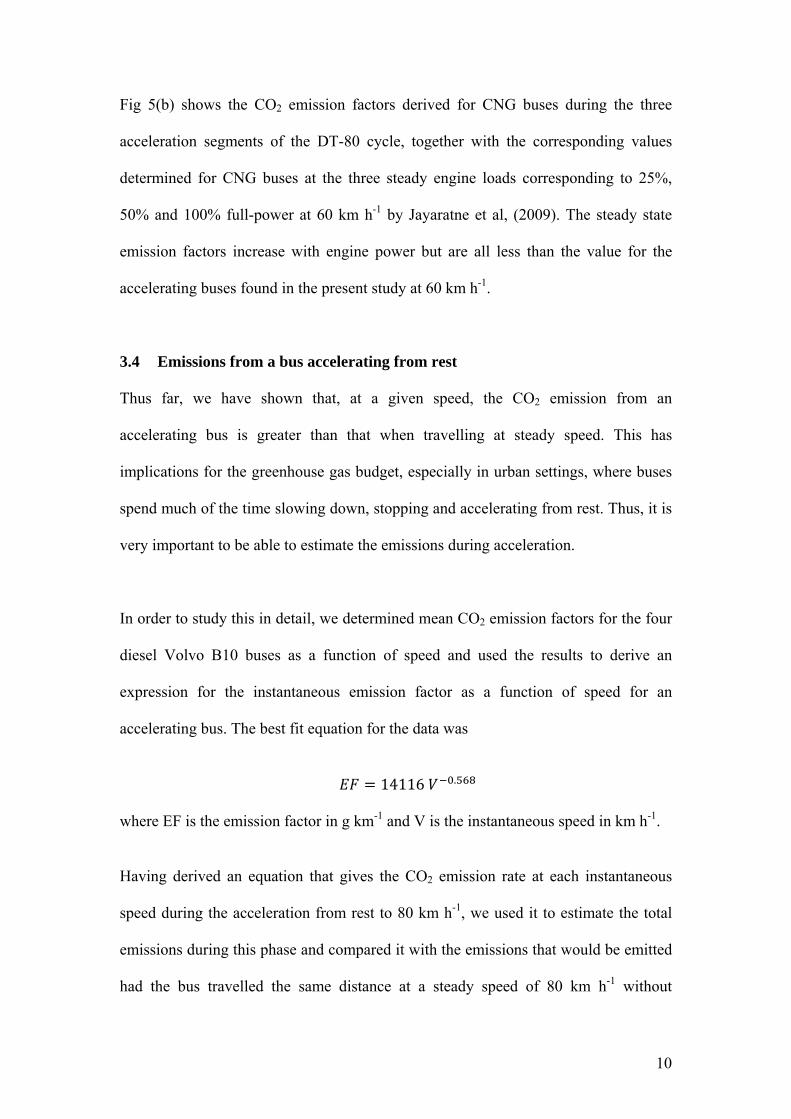
3.4 Emissions from a bus accelerating from rest
Thus far, we have shown that, at a given speed, the CO2 emission from an
accelerating bus is greater than that when travelling at steady speed. This has
implications for the greenhouse gas budget, especially in urban settings, where buses
spend much of the time slowing down, stopping and accelerating from rest. Thus, it is
very important to be able to estimate the emissions during acceleration.
In order to study this in detail, we determined mean CO2 emission factors for the four
diesel Volvo B10 buses as a function of speed and used the results to derive an
expression for the instantaneous emission factor as a function of speed for an
accelerating bus. The best fit equation for the data was
14116 .
where EF is the emission factor in g km-1 and V is the instantaneous speed in km h-1.
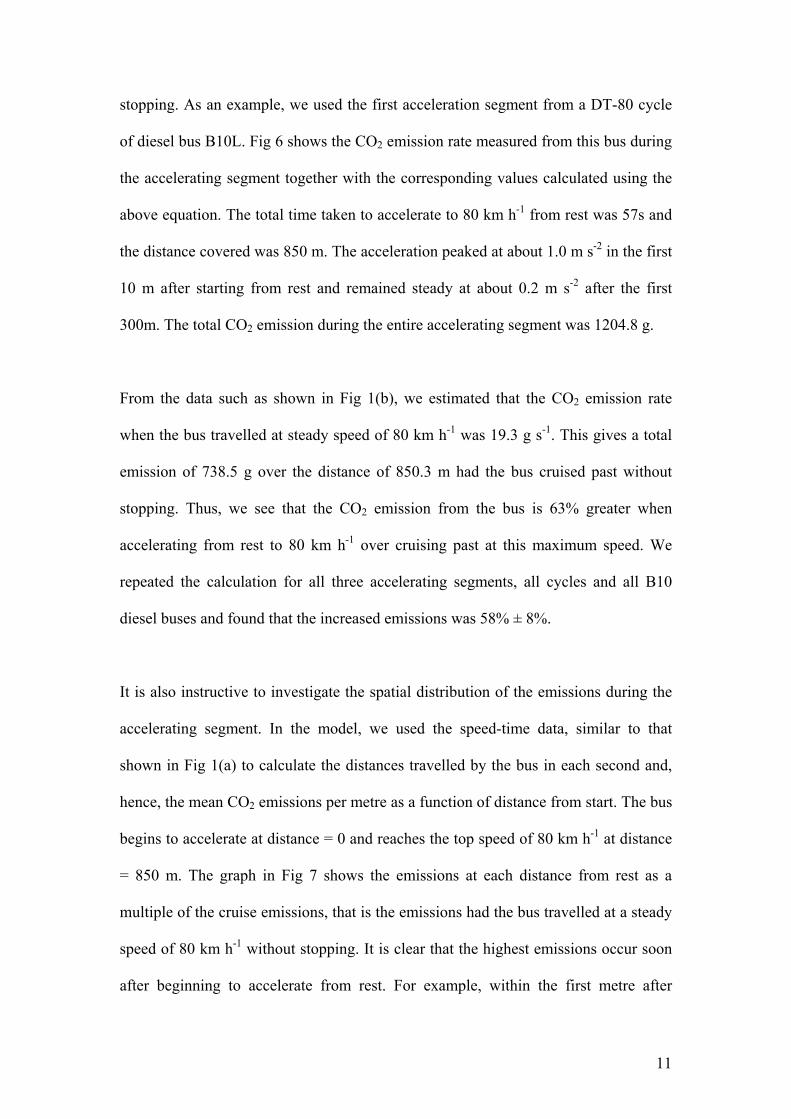
Having derived an equation that gives the CO2 emission rate at each instantaneous
speed during the acceleration from rest to 80 km h-1, we used it to estimate the total
emissions during this phase and compared it with the emissions that would be emitted
had the bus travelled the same distance at a steady speed of 80 km h-1 without
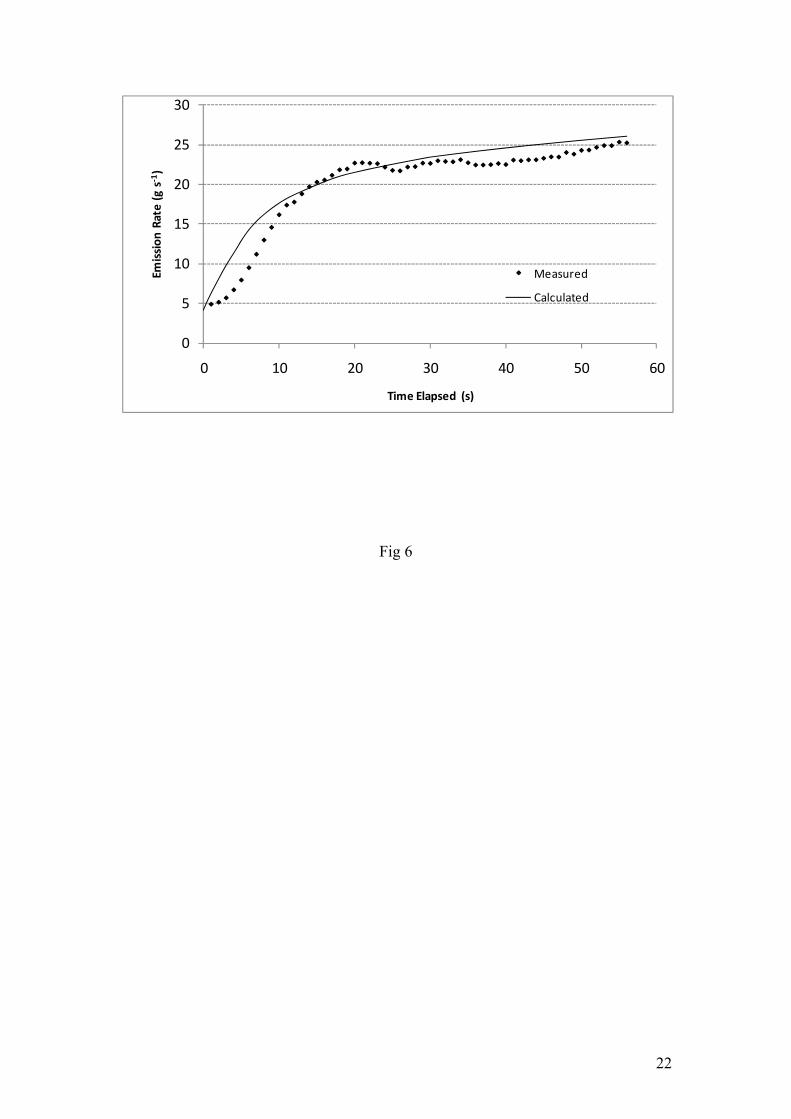
11
stopping. As an example, we used the first acceleration segment from a DT-80 cycle
of diesel bus B10L. Fig 6 shows the CO2 emission rate measured from this bus during
the accelerating segment together with the corresponding values calculated using the
above equation. The total time taken to accelerate to 80 km h-1 from rest was 57s and
the distance covered was 850 m. The acceleration peaked at about 1.0 m s-2 in the first
10 m after starting from rest and remained steady at about 0.2 m s-2 after the first
300m. The total CO2 emission during the entire accelerating segment was 1204.8 g.
From the data such as shown in Fig 1(b), we estimated that the CO2 emission rate
when the bus travelled at steady speed of 80 km h-1 was 19.3 g s-1. This gives a total
emission of 738.5 g over the distance of 850.3 m had the bus cruised past without
stopping. Thus, we see that the CO2 emission from the bus is 63% greater when
accelerating from rest to 80 km h-1 over cruising past at this maximum speed. We
repeated the calculation for all three accelerating segments, all cycles and all B10
diesel buses and found that the increased emissions was 58% ± 8%.
It is also instructive to investigate the spatial distribution of the emissions during the
accelerating segment. In the model, we used the speed-time data, similar to that
shown in Fig 1(a) to calculate the distances travelled by the bus in each second and,
hence, the mean CO2 emissions per metre as a function of distance from start. The bus
begins to accelerate at distance = 0 and reaches the top speed of 80 km h-1 at distance
= 850 m. The graph in Fig 7 shows the emissions at each distance from rest as a
multiple of the cruise emissions, that is the emissions had the bus travelled at a steady
speed of 80 km h-1 without stopping. It is clear that the highest emissions occur soon
after beginning to accelerate from rest. For example, within the first metre after
12
starting, emissions from the accelerating bus were 9.8 times greater than from the
cruising bus. Similarly, within the first 10m from start, the emissions were 5.2 times
greater and within the first 100m they were 2.8 times greater. This has relevance to
situations such as at bus stops, traffic intersections and pedestrian and level crossings,
where buses stop and start and are especially applicable to urban locations where
traffic congestion is an increasing problem.
4. Conclusions
We used experimental data to derive power-law expressions relating CO2 emission
factors for diesel and CNG buses to the instantaneous speed when accelerating from
rest to 80 km h-1. During acceleration, the emission rate from a diesel bus was about
15-20% greater than from a CNG bus at all speeds. We used the expressions to
calculate CO2 emissions from a diesel bus while accelerating and compared it with the
emissions had it travelled through the same distance at a steady speed and showed that
the CO2 emissions increased by 58 ± 8%. Most of the increase occurred in the first
few metres after starting from rest. These results are important for transport modellers
because, until now, CO2 emission factors for buses have been available only under
steady speed conditions or for standard drive cycles, neither of which are suitable to
calculate emissions during acceleration – a condition in which urban buses spend
much of their time.
13
Acknowledgements
This work was supported by the Australian Research Council and Queensland
Transport through Linkage Grant LP0775260. We would like to thank Jurgen
Pasieczny, Ray Donato, Randall Fletcher, John Woodland of Queensland Transport
for their help and guidance, and Bill Duncan, Malcolm Knowles and Rod
Chippendale for their invaluable advice and assistance during the dynamometer study.

14
References
AGO 2003. Australian methodology for the estimation of greenhouse gas emissions
and sinks 2003. Energy (transport) p 36. Australian Greenhouse Office, Canberra.
Ahn, K., Rakha, H., Trani, A. And Van Aerde, M. 2002. Estimating vehicle fuel
consumption and emissions based on instantaneous speed and acceleration levels.
J. Transportation Engineering. 128, 182-190.
Austroads 2004. Guide to project evaluation, Part 4: Project evaluation data, Report
AP-G82/04, Austroads, Sydney, Australia.
Clark, N.N., Gautam, M., Rapp, B.L., Lyons, D.W., Graboski, M.S., McCormick, R.L.,
Alleman, T.L. and Morton, P. 1999. Diesel and CNG transit bus emissions
characterization by two chassis dynamometer laboratories: Results and issues.
SAE Technical Paper Series, 1999-01-1469. Society of Automotive Engineers.
El-Shawarby, I., Ahn, K. And Rakha, H. 2005. Comparative field evaluation of vehicle
cruise speed and acceleration level impacts on hot stabilised emissions.
Transportation Res. D, 10, 13-30.
IPCC 2007. Intergovernmental Panel on Climate Change. Fourth Assessment Report:
Climate Change 2007. The Physical Science Basis.
Jayaratne, E.R., Ristovski, Z.D., Meyer, N., Morawska, L., 2009. Particle and Gaseous
Emissions from Compressed Natural Gas and Ultralow Sulphur Diesel-Fuelled
Buses at Four Steady Engine Loads. Science of the Total Environment. 407,
2845-2852.
Lanni, T., Frank, B.P., Tang, S., Rosenblatt, D. and Lowell, D. 2003. Performance
and emissions evaluation of compressed natural gas and clean diesel buses at
15
New York City’s metropolitan transit authority. SAE Technical Paper Series,
2003-01-0300. Society of Automotive Engineers.
OECD 2002: Strategies to Reduce Greenhouse Gas Emissions from Road Transport:
Analytical Methods. OECD Report 772002011P1. OECD Publishing, 2002.
Ristovski, Z.D., Jayaratne, E.R., Lim, M., Ayoko, G.A. and Morawska, L. 2006.
Influence of diesel fuel sulphur on nanoparticle emissions from city buses.
Environ. Sci. Technol. 40, 1314-1320.
Ronkko, T., Virtanen, A., Vaaraslahti, K., Keskinen, J., Pirjola, L. And Maija, L. 2006.
Effect of dilution conditions and driving parameters on nucleation mode particles
in diesel exhaust: laboratory and on-road study. Atmos. Environ. 40, 2893-2901.
16
Figure Captions
Fig 1: (a) Instantaneous speed and (b) CO2 emission rates in a typical DT-80 transient
drive cycle for a CNG bus.
Fig 2: Emission rates as a function of instantaneous speed for all three acceleration
segments in a drive cycle for (a) a diesel bus and (b) a CNG bus.
Fig 3: Mean emission rates of accelerating buses as a function of instantaneous speed
in the range 5 to 30 km h-1.
Fig 4: Mean emission factors of accelerating buses as a function of instantaneous
speed.
Fig 5: Comparison of emission factors in present study with previous results on (a)
diesel and (b) CNG buses.
Fig 6: Measured emission rate of a B10L bus during acceleration from rest to 80 km
h-1 together with the calculated value using the equation derived in Fig 6.
Fig 9: Calculated emissions per metre as a function of distance from rest for an
accelerating B10L bus, expressed as a multiple of the cruise emissions.
17
Fig 1
0
20
40
60
80
Spe
ed (k
m h
-1)
(a)
0
5
10
15
20
25
0 50 100 150 200 250 300 350
CO
2Em
issi
on R
ate
(g s
-1)
Time Elapsed (s)
(b)
18
Fig 2
0
5
10
15
20
25
30
Emis
sion
Rat
e (g
s-1
)(a) Diesel Bus
0
5
10
15
20
25
0 20 40 60 80
Emis
sion
Rat
e (g
s-1
)
Speed (kmph)
(b) CNG Bus

19
Fig 3
y = 0.0024x2 + 0.472x + 2.7299R² = 0.9994
y = 0.0033x2 + 0.3308x + 1.8719R² = 0.9983
0
5
10
15
20
25
0 5 10 15 20 25 30 35
Emis
sion
Rat
e (g
s-1
)
Speed (km h-1)
Diesel
CNG
20
Fig 4
Diesely = 13217x-0.554
R² = 0.9778
CNGy = 6581x-0.41
R² = 0.9201
0
1500
3000
4500
6000
0 20 40 60 80
Emis
sion
Fac
tor
(g k
m-1
)
Speed (km h-1)
21
Fig 5
0.E+00
1.E+03
2.E+03
3.E+03
4.E+03
5.E+03
6.E+03
0 20 40 60 80 100
CO
2Em
issi
on F
acto
r (g
km
-1)
Speed (km h-1)
DT80 Acceleration
Ronnko et al Low Power
Ronnko et al High Power
Jayaratne et al (2009)
Ristovski et al (2006)
Austroads
0.E+00
1.E+03
2.E+03
3.E+03
4.E+03
0 20 40 60 80 100
CO
2Em
issi
on F
acto
r (g
km
-1)
Speed (km h-1)
DT80 Acceleration
Jayaratne et al (2009)
22
Fig 6
0
5
10
15
20
25
30
0 10 20 30 40 50 60
Emission
Rate (g s
‐1)
Time Elapsed (s)
Measured
Calculated

23
Fig 7
0
2
4
6
8
10
12
0 200 400 600 800 1000
Acceleration/Cruise Emission
s
Distance from start (m)