quo vadis - mare forumold.mareforum.com/mareforum2012presentations/... · • japan in 70’s...
TRANSCRIPT

Quo Vadis dove Andiamo TTOY TTAME
14 May 2012 Mare Forum Italy” SORRENTO
Past President Philip Embiricos

Global GDP - revisions

IS CHINA’S GROWTH MATURING?
• CHINA IS ENTERING THE MIDDLE INCOME TRAP (5,000 TO 15,000USD/HEAD)
• AT THIS POINT THERE IS A SHIFT IN GROWTH RATE
• Japan in 70’s Taiwan in 80’s Korea in 90’s all shifted down from 9% to 5%
• CHINA WITH A GROWTH RATE OF 11% MIGHT SLOW DOWN TO 7% OVER THE NEXT FEW YEARS
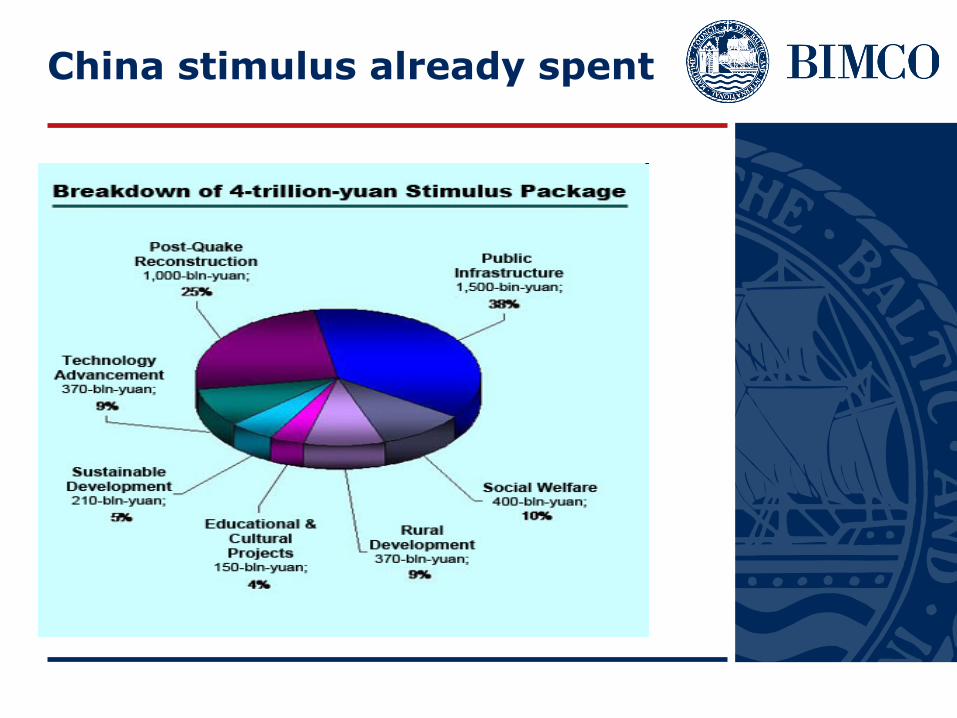
China stimulus already spent

Has the stimulus money been exhausted??
• Caterpillar sales first quarter fell 45% re-exporting 20% of its earth moving equipment
• Otis (elevators) sales 9% down 1st quarter
• Kone ( escalators) -5 to 10% 2nd quarter • Volvo forecast construction equipment to fall
15 to 25% this year
Only hopeful note The internal provinces will keep growing to
move populations to cities

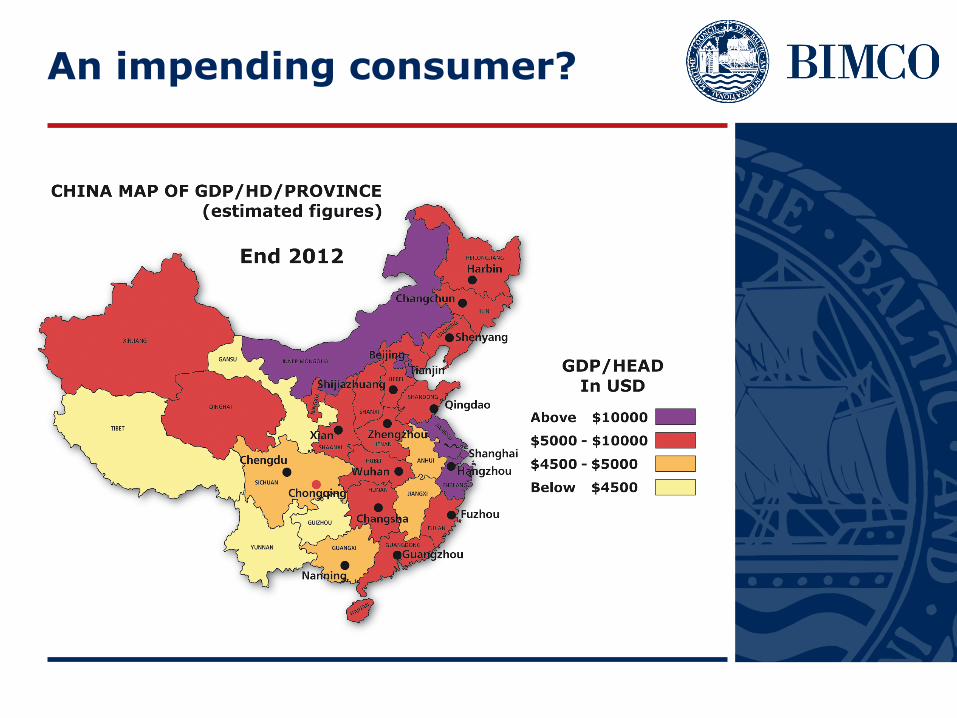
An impending consumer?

GNP/HEAD IS GROWING RAPIDLY
5 year growth rates on basis 2010 statistics indicate that
In 2011 608M people are below USD 5000/head In 2012 344M people are below USD 5000/head
In 2013 108M people are below USD 5000/head
By end 2014 overall GNP/head could be as high as
USD 8400

CHINA’s heavy industrialisation is slowing
BUT bulk carrier deliveries are overflowing
STEEL PRODUCTION GROWTH RATE IS SLOWING DOWN

China Iron Ore Imports 2009: 630 million tons
Australia
Brazil
India
South Africa
Ukraine
Canada
Others
Source: China Customs Statistics

CHINA WANTS TO BREAK DEPENDENCE ON BIG MINERS

Shipbuilding Ordering 2011
Offshore
Container
BulkerTanker
CruiseGas
INVESTMENT 90 Billion USD

CHINA 1ST SHIPBUILDING COUNTRY IN CGT CAPACITY
FOOD FOR THOUGHT FOR BANKERS

THIS WAS WRITTEN IN 2008
US MANUFACTURING IS “RE-SHORING” (IFT Asia 25th april 2012)

Bunker costs increase more than the crude prices
Source: BIMCO, Marine Bunker Exchange
0
20
40
60
80
100
120
140
160
0
100
200
300
400
500
600
700
800
US
D p
er b
arre
l
US
D p
er t
onn
es/
Rat
io
Oil and bunker fuel prices, 2006-2012 (1 May)
380 cST Singapore (8-wk moving average)
Brent Crude (8-wk moving average), RH-axis
What will happen when we have to use 0.5% Sulfur fuels??

Clarkson’s optimum speeds
0
50
100
150
200
250
300
350
400
24 23 22 21 20 19 18 17 16 15 14 13 12 11 10 9 8
Fuel
cos
t sav
ing
, cha
rter c
ost i
ncre
ase
$000
best speed at $200/tonne bunkers
best speed at $1500/tonne bunkers
Martin Stopford Speech at BIMCO’s Annual General meeting, Singapore April 25th 2012

Even today Slow steaming reduces Shipping Environmental footprint
Source: BIMCO, CRSL, China Statistical Yearbook 2009
139
121.2
77.4
76.7
77.7
57.6
0 50 100 150
China Power Stations
German Power Stations
Containers fleet
Non cargo
Bulker fleet
Tanker and Gas fleet
Other dry and specialized fleet
Million Kilowatt capacity installed, 2009
Capacity Slow steaming potential
2,987 2020 PROJECTIONS RANGE 4000-6000 MKw
DOES SHIPPING REALLY REQUIRE MBM’s
WHAT IS THE SOLUTION?
• Is LNG Propulsion a solution? • What will be the investment? - producers
- transporters - suppliers
• Will there be enough supply? • Can a tramp owner ever chance it ?
Too long a subject and I don’t know enough!!!
IF YOU ARE INTERESTED

SEE YOU IN CYPRUS ON JUNE 12TH
1st MARE FORUM CYPRUS ���Eastern Mediterranean OIL & GAS ���
���