quick manufacturing tutorial - evsm | the easiest way to ... · double-click to change both units...
TRANSCRIPT

Copyright © 2016 The eVSM Group, All Rights Reserved
This tutorial will guide you through the steps to draw a simple map, perform common
calculations, and plot charts using the Quick Manufacturing stencil.
Quick Manufacturing Tutorial
Viewing/printing eVSM Tutorial:
This tutorial is designed for two
page layout. If printing, you will
need double-sided print.
For on-screen viewing, save the PDF
file to your PC and then open it in
Acrobat Reader (not in a web
browser). In the Acrobat menus,
click “View>Page Display", make
sure “Show Cover Page in Two Page
View” is checked and then select
"Two Page View”.
A001
0
A002
0
A003
0
A004
0
A005
0
A006
0
A007
0
A008
0
A009
0
A011
0
A012
0
A013
0
A014
0
Casting Sets
Machine
Customer
Machined Sets
Polish
Polished Sets
Assemble
Cutters
Package
Boxes
Springs
Machine and form
caliper springs
Spring Steel Rolls

Copyright © 2016 The eVSM Group, All Rights Reserved
On your Desktop, click
the “Start eVSM” icon.
1
Click to enable
macros.Click “Trust all from
publisher” to avoid the
security notice in future.
3
4
If you see a message like this,
you must “Enable” macros.
2
Step 1: Start eVSM

Copyright © 2016 The eVSM Group, All Rights Reserved
This area intentionally left blank

Copyright © 2016 The eVSM Group, All Rights Reserved
eVSM adds this toolbar to Visio as well
as the stencils on the left and right. If
the eVSM toolbar disconnects, click
File>Save As and save the file, close
the file, then re-open it. This tip can
used for other crashes in eVSM.
The left hand side has the Quick
eVSM stencils which are optimized
for specific application areas such as
manufacturing vs office vs
healthcare.
The Quick stencils contain macro
shapes which are often collections of
individual eVSM shapes with pre-built
names, units, equations, and other
properties.
A new map is initiated by selecting
your application area from the "Open"
button. Only the stencils required for
your selected application area will
open on the left side.
A Visio file can have multiple pages
which are accessed with these tabs.
Each page gets locked to a chosen
eVSM application and then not be used
for other applications.
The eVSM Environment

Copyright © 2016 The eVSM Group, All Rights Reserved
The stencils on the right
stencils contain individual
base eVSM icons. These are
organized into separate
stencils (arrows, data, etc.) to
make it easier to find shapes.
Hover over each button in the eVSM
Toolbar to learn what it does. Detailed
help and tutorials are available at the
eVSM help site which can be
accessed via this button.

Copyright © 2016 The eVSM Group, All Rights Reserved
Quick_eVSM
Learn eVSM BasicsStep 2:
Avoid re-sizing eVSM shapes. Instead
grow the drawing page when needed.
To resize the page, hold down the “Ctrl”
key, and then drag any page edge to the
required size. This method works on all
four edges of the page.
1
VSM
Save your Visio file and then
insert a new page via the right-
mouse menus on the page-tabs.
4

Copyright © 2016 The eVSM Group, All Rights Reserved
Learn eVSM Basics
Blue icons in the main stencil
represent families of shapes. Drag
out the Transport icon.
2
Use the shape’s
right-mouse menus
to turn it into a car
3
Zooming:
-Ctrl + Shift = Drag Zoom Options
-Whole page view in Visio 2010/2013: Ctrl + Shift + W
5

Copyright © 2016 The eVSM Group, All Rights Reserved
Quick Mfg Stencils Overview
Quick Manufacturing has three stencils.
Sketch Mfg
Quick Mfg
Quick Mfg LT
The Sketch stencil allows you to capture the
value stream flow with no data shapes. Data
shapes can later be added automatically via
right mouse button menus.
The full Quick stencil contains all of the macro
shapes available in Quick manufacturing.
Includes the full set of add-on (yellow icons)
calculations.
The LT stencil contains all the flow shapes but
only a small subset of the add-on (yellow icons)
calculations. Great for new users and for users
who don’t need the advanced calculations.

Copyright © 2016 The eVSM Group, All Rights Reserved
White icons
represent Summary
Centers
Yellow icons are
additional add-on
calculations to add
to Centers
**DRAG RED
SHAPES OUT
FIRST** Green icons
represent Centers
Purple icons are the
graphs and other
charts
Quick Stencil Icon Colors
Below is an overview of the Quick Mfg stencil shapes.

Copyright © 2016 The eVSM Group, All Rights Reserved
Click the Wall Map button in the
toolbar to import a wall map picture
into eVSM.
1
Using the wall map sketcher
Click the Insert Wall Map
button to browse for the
image on your computer.
2
Trace a rectangle over any one
process box to scale the picture.
3
Click Done
when finished.
4
Step 3:
Wall Map
Often value stream maps are started on walls or paper. Converting a hand-drawn map can be tedious and error
prone. An easy way to handle this is to take a clear picture of the map, import it into eVSM and then draw the
electronic map, directly on to of the picture. This page shows how the eVSM Wall Map function can help with
this. You can use a picture of any map to learn this step, if you don’t have one, download a copy from:
http://www.evsm.com/wallmap

Copyright © 2016 The eVSM Group, All Rights Reserved
Using the wall map sketcher
Click OK to start
sketching over the
picture.
6
Delete the wall picture.
Click the Wall Map button
again to bring up the form.
7
Map visibility can be
switched on/off and
transparency can be
set in this form as well.
5

Copyright © 2016 The eVSM Group, All Rights Reserved
Step 4: Initiate the map for Quick Manufacturing LT
Click the button
in the eVSM toolbar.
The Manufacturing stencils will
open on the left. For this tutorial,
use the Quick Mfg LT.
Select Manufacturing,
and click Open.
1
3
2Open

Copyright © 2016 The eVSM Group, All Rights Reserved
Initiate the map for Quick Manufacturing LT

Copyright © 2016 The eVSM Group, All Rights Reserved
eVSM
Data
QuickMfg
9.32.0000.
1
5
Week
day
70
Week
Hr
52
Year
Week
Un
its
Drag out the two red
icons first. This is
very important!
Set to US Units
and click OK.
Enter available hours per week
here. This is actual work hours
after subtracting break time.
Step 4B: Initiate the map for Quick Manufacturing LT
Time Center
Customer Center
1
2
6

Copyright © 2016 The eVSM Group, All Rights Reserved
allA0010
Share % %100
Effective Demand
ItemWeek
Auto
Customer
Customer Demand
ItemWeek
1000
Initiate the map for Quick Manufacturing LT
Align all new
shapes to the grid
as you drop them.
Leave “Auto” fields
alone. They will be
calculated
automatically.
Enter customer
demand here.
3
5
4

Copyright © 2016 The eVSM Group, All Rights Reserved
eVSM
Data
QuickMfg
9.32.0000.
1
5
Week
day
70
Week
Hr
52
Year
Week
50
Roll
Set
1
Set
Item
Un
its
Click the NUM button in
the toolbar.
Click the “New Unit”
button, type “Set”, and
click OK. Create
another unit named
“Roll” and click OK.
Double-click each
field to match the
appropriate units
converters.
Double-click the
bottom field to change
to “Item”.
Adding Custom Unit ConvertersStep 5:
3
4
5
NUM
2

Copyright © 2016 The eVSM Group, All Rights Reserved
allA0010
Share % %100
Effective Demand
ItemWeek
Auto
Customer
Customer Demand
SetWeek
1000
Drag out two Units Converter
shapes from the “eVSM Data”
stencil and glue to the existing
Time Center.
Double-click the units for
Customer Demand and change
the numerator to “Set”.
Adding Custom Unit Converters
1
6

Copyright © 2016 The eVSM Group, All Rights Reserved
Unit Converters Usage
· Secs/Mins, Mins/Hrs units converters are hidden
· Made visible through NUM button in the toolbar
Visibility of a unit converter
can be switched on or off.
NUM

Copyright © 2016 The eVSM Group, All Rights Reserved
· Unit families eliminate errors when changing units
· Only Time units will appear when double-clicking on Mins to change to Hrs
· If desired unit does not appear:
o Create a new unit -- OR --
o Place a units converter on map
· Use NUM button in toolbar to create the new unit
· New unit will require units converter to connect default unit to new unit
· New unit will appear in “Select Unit” window when double-click unit (family)
· If desired unit was in the NUM, add a units converter to the map
· Built-in error proofing to prevent incompatible units
NUM
60
Hr
Min

Copyright © 2016 The eVSM Group, All Rights Reserved
eVSM
Data
QuickMfg
9.32.0000.
1
Type
#0A0020
Inventory Itemxx
DayAuto
#0A0030
Qty Per Cycle Item1
CapacityItemDay
Auto
Pre OEE Capacity
ItemDay
Auto
OEE Percent %Auto
Process
SecAuto
1
Cycle Time Secx.xx
5
Week
day
70
Week
Hr
52
Year
Week
50
Roll
Set
1
Set
Item
Un
its
The green shapes are called
“Centers”. Use the centers to
represent the flow.
If the Value Added and Non
Value Added timeline is not
lined up, use the “Align
Timeline” command in the
right-mouse button menu.
Remember to align all
new shapes to the
grid as you drop them.
Operation Tag number
may not match with your
screen. This is OK, this
will be handled later.
Activity Center
Inventory Center
1
3
2
4
Draw the flow Step 6:

Copyright © 2016 The eVSM Group, All Rights Reserved
allA0010
Share % %100
Effective Demand
ItemWeek
Auto
Customer
Customer Demand
SetWeek
1000
Draw the flow

Copyright © 2016 The eVSM Group, All Rights Reserved
Disable Flying Connector
Select Timeline
Align Timeline
Working with the timeline
· Shift the entire timeline up or down, use “Select Timeline” in the right-mouse menu
· If that option doesn’t appear in the menu, make sure you have the entire VA or NVA shape
selected and try again
· “Align Timeline” function also in the right-mouse menu will create the ladder timeline for
you if the VA and NVA shapes are not correctly aligned, as shown below
DayAuto
DayAuto
MinAuto
MinAuto
MinAuto MinAuto

Copyright © 2016 The eVSM Group, All Rights Reserved
This area intentionally left blank

Copyright © 2016 The eVSM Group, All Rights Reserved
eVSM
Data
QuickMfg
9.32.0000.
1
Casting Sets
#0A0020
Inventory Set1000
DayAuto
#0A0030
Qty Per Cycle Set1
CapacityItemDay
Auto
Pre OEE Capacity
ItemDay
Auto
OEE Percent %Auto
Machine
SecAuto
1
Cycle Time Min3
Spring Steel Rolls
#0A0110
Inventory Roll10
DayAuto
#0A0120
Qty Per Cycle Roll1
CapacityItemDay
Auto
Pre OEE Capacity
ItemDay
Auto
OEE Percent %Auto
Machine and form caliper springs
SecAuto
1
Cycle Time Hr4
Machined Sets
#0A0040
Inventory Set50
DayAuto
#0A0050
Qty Per Cycle Item1
CapacityItemDay
Auto
Pre OEE Capacity
ItemDay
Auto
OEE Percent %Auto
Polish
SecAuto
1
Cycle Time Min5
Springs
#0A0130
Inventory Set150
DayAuto
5
Week
day
70
Week
Hr
52
Year
Week
50
Roll
Set
1
Set
Item
Un
its
If text does not fit, avoid re-
sizing eVSM shapes. Instead,
make the font smaller.
Check to make sure
you have the
appropriate units. If
not, double-click the
unit to change it.
Complete the flow and enter dataStep 7:
2
3

Copyright © 2016 The eVSM Group, All Rights Reserved
Polished Sets
#0A0060
Inventory Set100
DayAuto
#0A0070
Qty Per Cycle Item1
CapacityItemDay
Auto
Pre OEE Capacity
ItemDay
Auto
OEE Percent %Auto
Assemble
SecAuto
1
Cycle Time Min7
Cutters
#0A0080
Inventory Set15
DayAuto
#0A0090
Qty Per Cycle Item1
CapacityItemDay
Auto
Pre OEE Capacity
ItemDay
Auto
OEE Percent %Auto
Package
SecAuto
1
Cycle Time Min2
allA0010
Share % %100
Effective Demand
ItemWeek
Auto
Customer
Customer Demand
SetWeek
1000
Boxes
#0A0100
Inventory Item1000
DayAuto
Complete as shown below,
including annotation, data
values, and units.
Complete the flow and enter data1

Copyright © 2016 The eVSM Group, All Rights Reserved
· Fractional units makes specifying and computing demand quantities or production times
easier
· Provides better control of data entry and display
· Fractional units changed like any other unit on map using the NUM button in the toolbar
Fractional Units

Copyright © 2016 The eVSM Group, All Rights Reserved
Data Entry Hints
Little’s Law:
Wait Time (Non-Value Added) = Inventory / Customer Demand
· When entering data use tab key to go to next NVU
· Non-Value Added and Value Added ladders are already glued to
Activity Center and Inventory Center, respectively
· The standard NVUs on an Activity Center are required for
calculations and MUST NOT be deleted
1
A0030
A0040
Process
Type 1
SecAuto
Cycle Time Secx.xx
Qty Per Cycle Item1
CapacityItemDay
Auto
Pre OEE Capacity
ItemDay
Auto
OEE Percent %Auto
Inventory Itemxx
DayAuto
1
Input values with a default x.xx
are mandatory and require a
numeric value otherwise the map
will not solve

Copyright © 2016 The eVSM Group, All Rights Reserved
Glue all arrows at
both ends.
eVSM
Data
QuickMfg
9.32.0000.
1
Casting Sets
#0A0020
Inventory Set1000
DayAuto
#0A0030
Qty Per Cycle Set1
CapacityItemDay
Auto
Pre OEE Capacity
ItemDay
Auto
OEE Percent %Auto
Machine
SecAuto
1
Cycle Time Min3
Spring Steel Rolls
#0A0110
Inventory Roll10
DayAuto
#0A0120
Qty Per Cycle Roll1
CapacityItemDay
Auto
Pre OEE Capacity
ItemDay
Auto
OEE Percent %Auto
Machine and form caliper springs
SecAuto
1
Cycle Time Hr4
Machined Sets
#0A0040
Inventory Set50
DayAuto
#0A0050
Qty Per Cycle Item1
CapacityItemDay
Auto
Pre OEE Capacity
ItemDay
Auto
OEE Percent %Auto
Polish
SecAuto
1
Cycle Time Min5
Springs
#0A0130
Inventory Set150
DayAuto
5
Week
day
70
Week
Hr
52
Year
Week
50
Roll
Set
1
Set
Item
Un
its
Add Arrows from Main StencilStep 8:
2

Copyright © 2016 The eVSM Group, All Rights Reserved
SecAuto
DayAuto
Use the right mouse
button menu of the
arrows to turn into a
“Push” arrow.
Drag the arrows from the
Main stencil on the right.
Polished Sets
#0A0060
Inventory Set100
DayAuto
#0A0070
Qty Per Cycle Item1
CapacityItemDay
Auto
Pre OEE Capacity
ItemDay
Auto
OEE Percent %Auto
Assemble
SecAuto
1
Cycle Time Min7
Cutters
#0A0080
Inventory Set15
DayAuto
#0A0090
Qty Per Cycle Item1
CapacityItemDay
Auto
Pre OEE Capacity
ItemDay
Auto
OEE Percent %Auto
Package
1
Cycle Time Min2
allA0010
Share % %100
Effective Demand
ItemWeek
Auto
Customer
Customer Demand
SetWeek
1000
Boxes
#0A0100
Inventory Item1000
Add Arrows from Main Stencil
3
1

Copyright © 2016 The eVSM Group, All Rights Reserved
eVSM
Data
QuickMfg
9.32.0000.
1
Casting Sets
#0A0020
Inventory Set1000
DayAuto
#0A0030
Qty Per Cycle Set1
CapacityItemDay
Auto
Pre OEE Capacity
ItemDay
Auto
OEE Percent %Auto
Machine
SecAuto
1
Cycle Time Min3
Spring Steel Rolls
#0A0110
Inventory Roll10
DayAuto
#0A0120
Qty Per Cycle Roll1
CapacityItemDay
Auto
Pre OEE Capacity
ItemDay
Auto
OEE Percent %Auto
Machine and form caliper springs
SecAuto
1
Cycle Time Hr4
Machined Sets
#0A0040
Inventory Set50
DayAuto
#0A0050
Qty Per Cycle Item1
CapacityItemDay
Auto
Pre OEE Capacity
ItemDay
Auto
OEE Percent %Auto
Polish
SecAuto
1
Cycle Time Min5
Springs
#0A0130
Inventory Set150
DayAuto
5
Week
day
70
Week
Hr
52
Year
Week
50
Roll
Set
1
Set
Item
Un
its
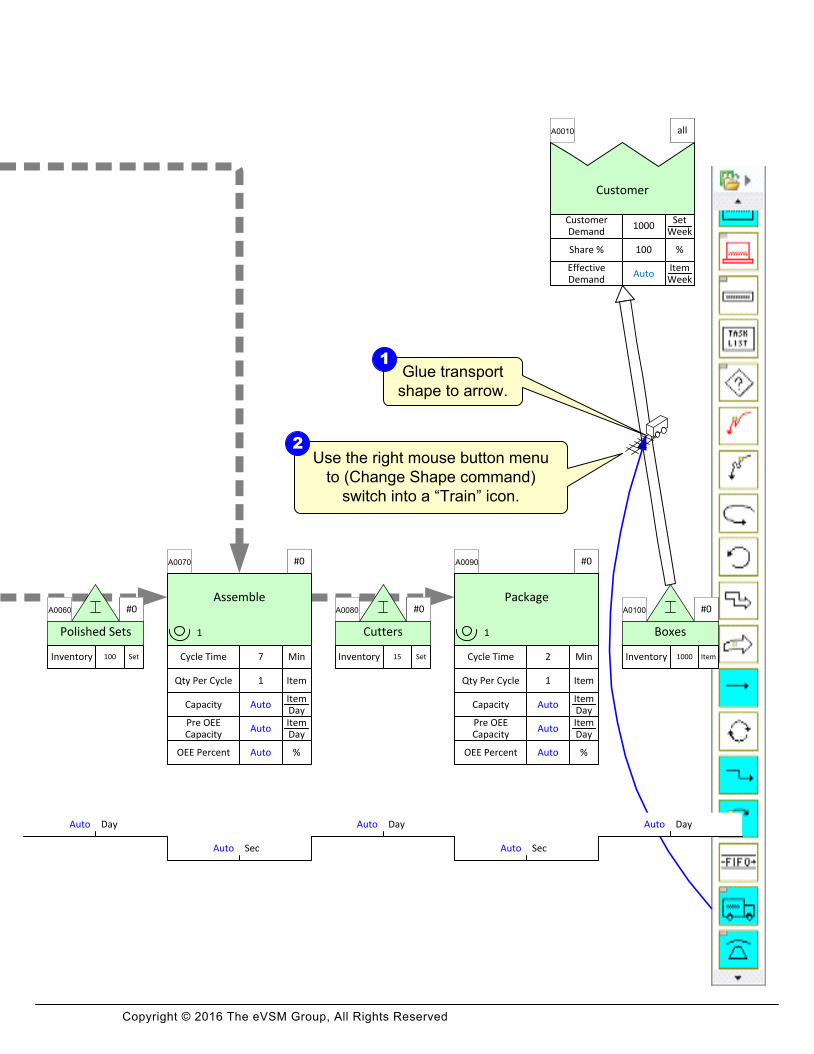
Step 9: Add Transport shapes
Copyright © 2016 The eVSM Group, All Rights Reserved
Use the right mouse button menu
to (Change Shape command)
switch into a “Train” icon.
Glue transport
shape to arrow.
Polished Sets
#0A0060
Inventory Set100
DayAuto
#0A0070
Qty Per Cycle Item1
CapacityItemDay
Auto
Pre OEE Capacity
ItemDay
Auto
OEE Percent %Auto
Assemble
SecAuto
1
Cycle Time Min7
Cutters
#0A0080
Inventory Set15
DayAuto
#0A0090
Qty Per Cycle Item1
CapacityItemDay
Auto
Pre OEE Capacity
ItemDay
Auto
OEE Percent %Auto
Package
SecAuto
1
Cycle Time Min2
allA0010
Share % %100
Effective Demand
ItemWeek
Auto
Customer
Customer Demand
SetWeek
1000
Boxes
#0A0100
Inventory Item1000
DayAuto
2
1

Copyright © 2016 The eVSM Group, All Rights Reserved
· Transport, Transmit, and Flow Shapes now have text box framed to allow data values to be
added if needed
· If data is added to shape, an Operation Tag and Path Locator needs to be added
· To remove frame, right-click on shape and select “Frame Icon”
Frame All
Frame Icon
No Frame
Frame All
(Default)
Frame Icon No Frame
· Use Text Block tool to move text
Transport, Transmit, and Flow Shapes

Copyright © 2016 The eVSM Group, All Rights Reserved
Blue Stack Shapes
Change Shapes
By Foot
Color Flags
Computer
Database
Electronic Document
Fax
Instant Message
Light Signal
Meeting
Pager
Phone
Post
Sound Signal
Spreadsheet
Tube Carrier
Wall LCD
Web Form
Whiteboard
· Blue icon stack has other shapes to choose
· Right-click on shape and select desired shapes
· Use the Stack Help button in the toolbar to see complete list of shapes in a stack after
selecting a blue or green stack icon from a stencil

Copyright © 2016 The eVSM Group, All Rights Reserved
Sequence arrows are needed for
upstream and downstream
calculations. To add them, hold down
the SHIFT key and select the green
shapes in the order shown here.
Click the Sequence
button.
eVSM
Data
QuickMfg
9.32.0000.
1
Casting Sets
#0A0020
Inventory Set1000
DayAuto
#0A0030
Qty Per Cycle Set1
CapacityItemDay
Auto
Pre OEE Capacity
ItemDay
Auto
OEE Percent %Auto
Machine
SecAuto
1
Cycle Time Min3
Spring Steel Rolls
#0A0110
Inventory Roll10
DayAuto
#0A0120
Qty Per Cycle Roll1
CapacityItemDay
Auto
Pre OEE Capacity
ItemDay
Auto
OEE Percent %Auto
Machine and form caliper springs
SecAuto
1
Cycle Time Hr4
Machined Sets
#0A0040
Inventory Set50
DayAuto
#0A0050
Qty Per Cycle Item1
CapacityItemDay
Auto
Pre OEE Capacity
ItemDay
Auto
OEE Percent %Auto
Polish
SecAuto
1
Cycle Time Min5
Springs
#0A0130
Inventory Set150
DayAuto
5
Week
day
70
Week
Hr
52
Year
Week
50
Roll
Set
1
Set
Item
Un
its
Step 10: Sequence Arrows
1
2
Sequence
A
B
C
D

Copyright © 2016 The eVSM Group, All Rights Reserved
Polished Sets
#0A0060
Inventory Set100
DayAuto
#0A0070
Qty Per Cycle Item1
CapacityItemDay
Auto
Pre OEE Capacity
ItemDay
Auto
OEE Percent %Auto
Assemble
SecAuto
1
Cycle Time Min7
Cutters
#0A0080
Inventory Set15
DayAuto
#0A0090
Qty Per Cycle Item1
CapacityItemDay
Auto
Pre OEE Capacity
ItemDay
Auto
OEE Percent %Auto
Package
SecAuto
1
Cycle Time Min2
allA0010
Share % %100
Effective Demand
ItemWeek
Auto
Customer
Customer Demand
SetWeek
1000
Boxes
#0A0100
Inventory Item1000
DayAuto
Sequence Arrows
E
F
G
H
I
J

Copyright © 2016 The eVSM Group, All Rights Reserved
· Provide a means of generating tag numbers in upstream to downstream sequence (using the
AutoTag button)
· Provide a means of generating path numbers that comprehend all of the paths on the map
(using the Auto Path button)
· Are the basis for upstream/downstream calculations in the built-in eVSM equations
· Sequence arrows can be added for a few centers at a time or in a continuous path.
Sequence Arrows Sequence
Auto Path
Auto Tag

Copyright © 2016 The eVSM Group, All Rights Reserved
This area intentionally left blank

Copyright © 2016 The eVSM Group, All Rights Reserved
eVSM
Data
QuickMfg
9.32.0000.
1
Casting Sets
#0A0020
Inventory Set1000
DayAuto
#0A0030
Qty Per Cycle Set1
CapacityItemDay
Auto
Pre OEE Capacity
ItemDay
Auto
OEE Percent %Auto
Machine
SecAuto
1
Cycle Time Min3
Spring Steel Rolls
#0A0110
Inventory Roll10
DayAuto
#0A0120
Qty Per Cycle Roll1
CapacityItemDay
Auto
Pre OEE Capacity
ItemDay
Auto
OEE Percent %Auto
Machine and form caliper springs
SecAuto
1
Cycle Time Hr4
Machined Sets
#0A0040
Inventory Set50
DayAuto
#0A0050
Qty Per Cycle Item1
CapacityItemDay
Auto
Pre OEE Capacity
ItemDay
Auto
OEE Percent %Auto
Polish
SecAuto
1
Cycle Time Min5
Springs
#0A0130
Inventory Set150
DayAuto
5
Week
day
70
Week
Hr
52
Year
Week
50
Roll
Set
1
Set
Item
Un
its
A
B
C
Step 11: Sequence Path 2
For the second path, hold the SHIFT
key and select the green shapes A to
D in the order shown. Then click the
Sequence button.
2

Copyright © 2016 The eVSM Group, All Rights Reserved
The sequence arrows
are now connecting
path one.
Polished Sets
#0A0060
Inventory Set100
DayAuto
#0A0070
Qty Per Cycle Item1
CapacityItemDay
Auto
Pre OEE Capacity
ItemDay
Auto
OEE Percent %Auto
Assemble
SecAuto
1
Cycle Time Min7
Cutters
#0A0080
Inventory Set15
DayAuto
#0A0090
Qty Per Cycle Item1
CapacityItemDay
Auto
Pre OEE Capacity
ItemDay
Auto
OEE Percent %Auto
Package
SecAuto
1
Cycle Time Min2
allA0010
Share % %100
Effective Demand
ItemWeek
Auto
Customer
Customer Demand
SetWeek
1000
Boxes
#0A0100
Inventory Item1000
DayAuto
D
1

Copyright © 2016 The eVSM Group, All Rights Reserved
eVSM
Data
QuickMfg
9.32.0000.
1
Casting Sets
1A0040
Inventory Set1000
DayAuto
1A0050
Qty Per Cycle Set1
CapacityItemDay
Auto
Pre OEE Capacity
ItemDay
Auto
OEE Percent %Auto
Machine
SecAuto
1
Cycle Time Min3
Spring Steel Rolls
2A0010
Inventory Roll10
DayAuto
2A0020
Qty Per Cycle Roll1
CapacityItemDay
Auto
Pre OEE Capacity
ItemDay
Auto
OEE Percent %Auto
Machine and form caliper springs
SecAuto
1
Cycle Time Hr4
Machined Sets
1A0060
Inventory Set50
DayAuto
1A0070
Qty Per Cycle Item1
CapacityItemDay
Auto
Pre OEE Capacity
ItemDay
Auto
OEE Percent %Auto
Polish
SecAuto
1
Cycle Time Min5
Springs
2A0030
Inventory Set150
DayAuto
5
Week
day
70
Week
Hr
52
Year
Week
50
Roll
Set
1
Set
Item
Un
its
Step 12: Use Auto Path to Generate Path ID’s based on Sequence Arrows
Click Auto Path to automatically generate
Path numbers based on Sequence arrows.
The path numbers on your map might not
exactly match the ones on this example,
and that is okay.Click AutoTag again to re-order
the tags based on the new
sequence arrows.
2
3
Auto Path
Auto Tag

Copyright © 2016 The eVSM Group, All Rights Reserved
The sequence arrows
are now connecting
path one and two.
Sequence arrow visibility can be
switched On/Off with the Show
Seq button. Try it.
These Path tags are used to specify
paths. #2 implies that the shape is on 2
paths. If you’d like to see the path
numbers the shape is on, right click and
select “Show paths on Center”. This will
display all the path numbers the shape is
on just above the path tag.
Polished Sets
1A0080
Inventory Set100
DayAuto
#2A0090
Qty Per Cycle Item1
CapacityItemDay
Auto
Pre OEE Capacity
ItemDay
Auto
OEE Percent %Auto
Assemble
SecAuto
1
Cycle Time Min7
Cutters
#2A0100
Inventory Set15
DayAuto
#2A0110
Qty Per Cycle Item1
CapacityItemDay
Auto
Pre OEE Capacity
ItemDay
Auto
OEE Percent %Auto
Package
SecAuto
1
Cycle Time Min2
allA0130
Share % %100
Effective Demand
ItemWeek
Auto
Customer
Customer Demand
SetWeek
1000
Boxes
#2A0120
Inventory Item1000
DayAuto
1
4
5
Show Seq.

Copyright © 2016 The eVSM Group, All Rights Reserved
Path List
· Path List: The Path List is used to identify a path that an activity (or other shape able to be
tagged) belongs to. The shape is glued above the top right corner of the shape.
· An activity can belong to no paths, one or more, or all paths. The benefit of assigning path
numbers to activities is that the associated activity variables (like NVA time) can be summed
up across the map in a path specific sense.
· After you have used the Auto Path function, the Path List will appear as either of the
following:
Path ListOperation Tag
The center is on all paths
The center is on 4 different paths
The center is only on path 6
Right clicking on the Path List shape will pull up a menu to display all the path numbers on each
center/page, or to hide all paths on each center or for the whole page.
The “1:4” indicates
that this center is on
paths 1 through 4
(1, 2, 3, 4)
Using the “Select Shapes with Paths” option
will highlight all shapes on the map that
have those specific path numbers.
The “1,3” indicates
that this center is on
paths 1 and 3
P
1,3
#2
1:4
#4
A0010
Process
#4
All
6

Copyright © 2016 The eVSM Group, All Rights Reserved
· Operation Tags:
· Provides short name for process step
· Identifies process step to Excel for calculations
· Defines the order in which data is plotted on charts
· Operation Tags MUST be 1-alpha and 4-numeric characters (ie: A0200)
· Are typically assigned using the Auto Tag button and AFTER sequence arrows have been
applied
Operation Tags

Copyright © 2016 The eVSM Group, All Rights Reserved
Double-click to
change this
path ID to 2.
Double-click to
change both units to
Min on each Time
Summary.
eVSM
Data
QuickMfg
9.32.0000.
1
Z0010 P
Total Value Added
MinAuto
Value Added Percent
%Auto
Takt TimeMinItem
Auto
Total Cycle Time MinAuto
Time Summary
Lead Time DayAuto
Z0020 P
Total Value Added
MinAuto
Value Added Percent
%Auto
Takt TimeMinItem
Auto
Total Cycle Time MinAuto
Time Summary
Lead Time DayAuto
Casting Sets
1A0010
Inventory Set1000
DayAuto
1A0020
Qty Per Cycle Set1
CapacityItemDay
Auto
Pre OEE Capacity
ItemDay
Auto
OEE Percent %Auto
Machine
SecAuto
1
Cycle Time Min3
Spring Steel Rolls
2A0060
Inventory Roll10
DayAuto
2A0070
Qty Per Cycle Roll1
CapacityItemDay
Auto
Pre OEE Capacity
ItemDay
Auto
OEE Percent %Auto
Machine and form caliper springs
SecAuto
1
Cycle Time Hr4
Machined Sets
1A0030
Inventory Set50
DayAuto
1A0040
Qty Per Cycle Item1
CapacityItemDay
Auto
Pre OEE Capacity
ItemDay
Auto
OEE Percent %Auto
Polish
SecAuto
1
Cycle Time Min5
Springs
2A0080
Inventory Set150
DayAuto
5
Week
day
70
Week
Hr
52
Year
Week
50
Roll
Set
1
Set
Item
Un
its
Step 13: Time Summary by Path
3
4
Double-click to
change this path
filter to “1” using
the Path Filter
Manager.
2
Drag out two
Time Summary
Centers.
1

Copyright © 2016 The eVSM Group, All Rights Reserved
Polished Sets
1A0050
Inventory Set100
DayAuto
#2A0090
Qty Per Cycle Item1
CapacityItemDay
Auto
Pre OEE Capacity
ItemDay
Auto
OEE Percent %Auto
Assemble
SecAuto
1
Cycle Time Min7
Cutters
#2A0100
Inventory Set15
DayAuto
#2A0110
Qty Per Cycle Item1
CapacityItemDay
Auto
Pre OEE Capacity
ItemDay
Auto
OEE Percent %Auto
Package
SecAuto
1
Cycle Time Min2
allA0130
Share % %100
Effective Demand
ItemWeek
Auto
Customer
Customer Demand
SetWeek
1000
Boxes
#2A0120
Inventory Item1000
DayAuto
Time Summary by Path

Copyright © 2016 The eVSM Group, All Rights Reserved
eVSM
Data
QuickMfg
9.32.0000.
1
Z0010 P
Total Value Added
Min17.00
Value Added Percent
%0.19
Takt TimeMinItem
4.20
Total Cycle Time Min17.00
Time Summary
Lead Time Day10.85
Z0020 P
Total Value Added
Min249.00
Value Added Percent
%3.44
Takt TimeMinItem
4.20
Total Cycle Time Min249.00
Time Summary
Lead Time Day8.62
Casting Sets
1A0010
Inventory Set1000
Day5.00
1A0020
Qty Per Cycle Set1
CapacityItemDay
280.00
Pre OEE Capacity
ItemDay
280.00
OEE Percent %100.00
Machine
Sec180.00
1.00
Cycle Time Min3
Spring Steel Rolls
2A0060
Inventory Roll10
Day2.50
2A0070
Qty Per Cycle Roll1
CapacityItemDay
175.00
Pre OEE Capacity
ItemDay
175.00
OEE Percent %100.00
Machine and form caliper springs
Sec14400.00
1.00
Cycle Time Hr4
Machined Sets
1A0030
Inventory Set50
Day0.25
1A0040
Qty Per Cycle Item1
CapacityItemDay
168.00
Pre OEE Capacity
ItemDay
168.00
OEE Percent %100.00
Polish
Sec300.00
1.00
Cycle Time Min5
Springs
2A0080
Inventory Set150
Day0.75
5
Week
day
70
Week
Hr
52
Year
Week
50
Roll
Set
1
Set
Item
Un
its
Step 14: Perform Calculations
When complete, note that
all blue values show
calculated results
3
Double-click the unit if
you would like to change
it to minutes, or any
other time measure.
4

Copyright © 2016 The eVSM Group, All Rights Reserved
Click the “Solve” button
to calculate.
Click the “Check” button
and fix any problems
flagged.
Polished Sets
1A0050
Inventory Set100
Day0.50
#2A0090
Qty Per Cycle Item1
CapacityItemDay
120.00
Pre OEE Capacity
ItemDay
120.00
OEE Percent %100.00
Assemble
Sec420.00
1.00
Cycle Time Min7
Cutters
#2A0100
Inventory Set15
Day0.08
#2A0110
Qty Per Cycle Item1
CapacityItemDay
420.00
Pre OEE Capacity
ItemDay
420.00
OEE Percent %100.00
Package
Sec120.00
1.00
Cycle Time Min2
allA0130
Share % %100
Effective Demand
ItemWeek
1000.00
Customer
Customer Demand
SetWeek
1000
Boxes
#2A0120
Inventory Item1000
Day5.00
2
1
Check
Solve

Copyright © 2016 The eVSM Group, All Rights Reserved
First Check then Solve
· Performs comprehensive model checking
· Fixes obvious problem
· Provides list of outstanding issues
Check Button
· Performs basic model checking
· Stops if there is any obvious issues like missing data values
· Solves the built-in equations and puts the results on the map
· Exports data to an Excel spreadsheet
Solve Button
Users should first Check and then Solve the map.
Check
Solve

Copyright © 2016 The eVSM Group, All Rights Reserved
This area intentionally left blank

Copyright © 2016 The eVSM Group, All Rights Reserved
eVSM
Data
QuickMfg
9.32.0000.
1
Z0010 P
Total Value Added
Min17.00
Value Added Percent
%0.19
Takt TimeMinItem
4.20
Total Cycle Time Min17.00
Time Summary
Lead Time Day10.85
Z0020 P
Total Value Added
Min249.00
Value Added Percent
%3.44
Takt TimeMinItem
4.20
Total Cycle Time Min249.00
Time Summary
Lead Time Day8.62
Casting Sets
1A0010
Inventory Set1000
Day5.00
1A0020
Qty Per Cycle Set1
CapacityItemDay
280.00
Pre OEE Capacity
ItemDay
280.00
OEE Percent %100.00
Machine
Sec180.00
1.00
Cycle Time Min3
Spring Steel Rolls
2A0060
Inventory Roll10
Day2.50
2A0070
Qty Per Cycle Roll1
CapacityItemDay
175.00
Pre OEE Capacity
ItemDay
175.00
OEE Percent %100.00
Machine and form caliper springs
Sec14400.00
1.00
Cycle Time Hr4
Machined Sets
1A0030
Inventory Set50
Day0.25
1A0040
Qty Per Cycle Item1
CapacityItemDay
168.00
Pre OEE Capacity
ItemDay
168.00
OEE Percent %100.00
Polish
Sec300.00
1.00
Cycle Time Min5
Springs
2A0080
Inventory Set150
Day0.75
5
Week
day
70
Week
Hr
52
Year
Week
50
Roll
Set
1
Set
Item
Un
its
Step 15:
CT / TT Chart
Add Cycle Time Takt Time Chart
Drag out CT/TT
Chart icon
1
Use the right mouse
button menu of chart icon
and select “Plot Chart”
2

Copyright © 2016 The eVSM Group, All Rights Reserved
Polished Sets
1A0050
Inventory Set100
Day0.50
#2A0090
Qty Per Cycle Item1
CapacityItemDay
120.00
Pre OEE Capacity
ItemDay
120.00
OEE Percent %100.00
Assemble
Sec420.00
1.00
Cycle Time Min7
Cutters
#2A0100
Inventory Set15
Day0.08
#2A0110
Qty Per Cycle Item1
CapacityItemDay
420.00
Pre OEE Capacity
ItemDay
420.00
OEE Percent %100.00
Package
Sec120.00
1.00
Cycle Time Min2
allA0130
Share % %100
Effective Demand
ItemWeek
1000.00
Customer
Customer Demand
SetWeek
1000
Boxes
#2A0120
Inventory Item1000
Day5.00
Add Cycle Time Takt Time Chart
Cycle Time / Takt Time Chart
Min
/Ite
m
0
1
2
3
4
5
6
7
A0020
Mac
hine
A0040
Polish
A0070
Mac
hine
and
form
ca.
.
A0090
Ass
emble
A0110
Pac
kage
Cycle Time Per Unit
Legend
Activity Takt Time

Copyright © 2016 The eVSM Group, All Rights Reserved
Double-click to
change to Hr/Day.
eVSM
Data
QuickMfg
9.32.0000.
1
Z0010 P
Total Value Added
Min257.00
Value Added Percent
%2.13
Takt TimeMinItem
4.20
Total Cycle Time Min257.00
Time Summary
Lead Time Day14.38
Z0020 P
Total Value Added
Min257.00
Value Added Percent
%2.13
Takt TimeMinItem
4.20
Total Cycle Time Min257.00
Time Summary
Lead Time Day14.38
Casting Sets
1A0010
Inventory Set1000
Day5.00
1A0020
Qty Per Cycle Set1
CapacityItemDay
288.00
Pre OEE Capacity
ItemDay
320.00
OEE Percent %90.00
Machine
Sec180.00
1.00
Cycle Time Min3
Spring Steel Rolls
2A0060
Inventory Roll10
Day2.50
2A0070
Qty Per Cycle Roll1
CapacityItemDay
297.50
Pre OEE Capacity
ItemDay
350.00
OEE Percent %85.00
Machine and form caliper springs
Sec14400.00
1.00
Cycle Time Hr4
Machined Sets
1A0030
Inventory Set50
Day0.25
1A0040
Qty Per Cycle Item1
CapacityItemDay
319.20
Pre OEE Capacity
ItemDay
336.00
OEE Percent %95.00
Polish
Sec300.00
1.00
Cycle Time Min5
Springs
2A0080
Inventory Set150
Day0.75
OEE Input Percent
%90
Scrap Percent %5
Stations Stn2
Activity TimeHr
Day8
OEE Input Percent
%85
Scrap Percent %10
Stations Stn2
OEE Input Percent
%95
Stations Stn2
Step 16:
Activity Stations
Try Add-on Calculations: OEE, Scrap, Activity Time
Activity Center
Activity Scrap
Activity OEE Direct
Activity Time
2
Run “Solve” and
note the changes in
the chart.
3
Solve

Copyright © 2016 The eVSM Group, All Rights Reserved
Polished Sets
1A0050
Inventory Set100
Day0.50
#2A0090
Qty Per Cycle Item1
CapacityItemDay
192.00
Pre OEE Capacity
ItemDay
240.00
OEE Percent %80.00
Assemble
Sec420.00
1.00
Cycle Time Min7
Cutters
#2A0100
Inventory Set15
Day0.08
#2A0110
Qty Per Cycle Item1
CapacityItemDay
228.00
Pre OEE Capacity
ItemDay
240.00
OEE Percent %95.00
Package
Sec120.00
1.00
Cycle Time Min2
allA0130
Share % %100
Effective Demand
ItemWeek
1000.00
Customer
Customer Demand
SetWeek
1000
Boxes
#2A0120
Inventory Item1000
Day5.00
OEE Input Percent
%80
Scrap Percent %10
Stations Stn2
OEE Input Percent
%95
Activity TimeHr
Day8
5
Week
day
70
Week
Hr
52
Year
Week
50
Roll
Set
1
Set
Item
Un
its Try Add-on Calculations: OEE, Scrap, Activity Time
Drag out the appropriate add-ons
for each center. Be sure to glue the
add-ons to the center.
1
Cycle Time / Takt Time Chart
Min
/Ite
m
0
0.5
1
1.5
2
2.5
3
3.5
4
4.5
A0020
Mac
hine
A0040
Polish
A0070
Mac
hine
and
form
ca.
.
A0090
Ass
emble
A0110
Pac
kage
Scrap Loss
Legend
OEE Remainder Loss
Cycle Time Per Unit
Activity Takt Time

Copyright © 2016 The eVSM Group, All Rights Reserved
eVSM
Data
QuickMfg
9.32.0000.
1
Z0010 P
Total Value Added
Min257.00
Value Added Percent
%2.13
Takt TimeMinItem
4.20
Total Cycle Time Min257.00
Time Summary
Lead Time Day14.38
Z0020 P
Total Value Added
Min257.00
Value Added Percent
%2.13
Takt TimeMinItem
4.20
Total Cycle Time Min257.00
Time Summary
Lead Time Day14.38
Casting Sets
1A0010
Inventory Set1000
Day5.00
1A0020
Qty Per Cycle Set1
CapacityItemDay
288.00
Pre OEE Capacity
ItemDay
320.00
OEE Percent %90.00
Machine
Sec180.00
1.00
Cycle Time Min3
Spring Steel Rolls
2A0060
Inventory Roll10
Day2.50
2A0070
Qty Per Cycle Roll1
CapacityItemDay
297.50
Pre OEE Capacity
ItemDay
350.00
OEE Percent %85.00
Machine and form caliper springs
Sec14400.00
1.00
Cycle Time Hr4
Machined Sets
1A0030
Inventory Set50
Day0.25
1A0040
Qty Per Cycle Item1
CapacityItemDay
319.20
Pre OEE Capacity
ItemDay
336.00
OEE Percent %95.00
Polish
Sec300.00
1.00
Cycle Time Min5
Springs
2A0080
Inventory Set150
Day0.75
Scrap Percent %5
Activity TimeHr
Day8
OEE Input Percent
%90
Stations Stn2
Scrap Percent %10
OEE Input Percent
%85
Stations Stn2
OEE Input Percent
%95
Stations Stn2
Step 17: Hide/Show Cost Variables
Cumulative Cost
$Item37.00
Added Cost
$Set37
Added Cost$
Set1
Cumulative Cost
$Item
40.00
Cumulative Cost
$Item6.00
Added Cost
$Roll300
Added Cost$
Set0.25
Cumulative Cost
$Item
6.94
Cumulative Cost
$Item40.00
Added Cost
$Item0.00
Added Cost$
Set2
Cumulative Cost
$Item
42.00
Cumulative Cost
$Item6.94
Added Cost
$Item0.00
Click the Views button
in the toolbar.
1
Views

Copyright © 2016 The eVSM Group, All Rights Reserved
Polished Sets
1A0050
Inventory Set100
Day0.50
#2A0090
Qty Per Cycle Item1
CapacityItemDay
192.00
Pre OEE Capacity
ItemDay
240.00
OEE Percent %80.00
Assemble
Sec420.00
1.00
Cycle Time Min7
Cutters
#2A0100
Inventory Set15
Day0.08
#2A0110
Qty Per Cycle Item1
CapacityItemDay
228.00
Pre OEE Capacity
ItemDay
240.00
OEE Percent %95.00
Package
Sec120.00
1.00
Cycle Time Min2
allA0130
Share % %100
Effective Demand
ItemWeek
1000.00
Customer
Customer Demand
SetWeek
1000
Boxes
#2A0120
Inventory Item1000
Day5.00
Scrap Percent %10
OEE Input Percent
%80
Stations Stn2
OEE Input Percent
%95
Activity TimeHr
Day8
5
Week
day
70
Week
Hr
52
Year
Week
50
Roll
Set
1
Set
Item
Un
itsHide/Show Cost Variables
Cumulative Cost
$Item42.00
Added Cost
$Item0.00
Added Cost$
Set3
Cumulative Cost
$Item
57.72
Cumulative Cost
$Item57.72
Added Cost
$Item0.00
Added Cost$
Set1
Cumulative Cost
$Item
58.72
Cumulative Cost
$Item58.72
Added Cost
$Item0.00
Now that the Added Cost and
Cumulative Cost variables are
visible, fill in the data values
for Added Cost and click the
Solve button.
Check the Added
Cost visibility box
and click OK.
Check the
Cumulative Cost
visibility box.
Make sure the
correct unit is
selected for each
center.
4
3
2
5
Solve

Copyright © 2016 The eVSM Group, All Rights Reserved
eVSM
Data
QuickMfg
9.32.0000.
1
Z0010 P
Total Value Added
Min257.00
Value Added Percent
%2.13
Takt TimeMinItem
4.20
Total Cycle Time Min257.00
Time Summary
Lead Time Day14.38
Z0020 P
Total Value Added
Min257.00
Value Added Percent
%2.13
Takt TimeMinItem
4.20
Total Cycle Time Min257.00
Time Summary
Lead Time Day14.38
Casting Sets
1A0010
Inventory Set1000
Day5.00
1A0020
Qty Per Cycle Set1
CapacityItemDay
288.00
Pre OEE Capacity
ItemDay
320.00
OEE Percent %90.00
Machine
Sec180.00
1.00
Cycle Time Min3
Spring Steel Rolls
2A0060
Inventory Roll10
Day2.50
2A0070
Qty Per Cycle Roll1
CapacityItemDay
297.50
Pre OEE Capacity
ItemDay
350.00
OEE Percent %85.00
Machine and form caliper springs
Sec14400.00
1.00
Cycle Time Hr4
Machined Sets
1A0030
Inventory Set50
Day0.25
1A0040
Qty Per Cycle Item1
CapacityItemDay
319.20
Pre OEE Capacity
ItemDay
336.00
OEE Percent %95.00
Polish
Sec300.00
1.00
Cycle Time Min5
Springs
2A0080
Inventory Set150
Day0.75
Scrap Percent %5
Activity TimeHr
Day8
OEE Input Percent
%90
Stations Stn2
Scrap Percent %10
OEE Input Percent
%85
Stations Stn2
OEE Input Percent
%95
Stations Stn2
all
Step 18: Plot Lead Time Chart
Lead Time Chart
Cumulative Cost
$Item37.00
Added Cost
$Set37
Added Cost$
Set1
Cumulative Cost
$Item
40.00
Cumulative Cost
$Item6.00
Added Cost
$Roll300
Added Cost$
Set0.25
Cumulative Cost
$Item
6.94
Cumulative Cost
$Item40.00
Added Cost
$Item0.00
Added Cost$
Set2
Cumulative Cost
$Item
42.00
Cumulative Cost
$Item6.94
Added Cost
$Item0.00Drag out Lead
Time Chart icon.
Use the right mouse
button menu of chart
icon and select “Plot
Ladder Chart”
1
2
Lead Time Summary
0 1 2 3 4 5 6 7 8
A0010
Casting Sets
A0030
Machined Sets
A0050
Polished Sets
A0100
Cutters
A0120
Boxes
10.85
A0060
Spring Steel
Rolls
A0070
Machine and
form caliper
springs
A0080
Springs
A0100
Cutters
A0120
Boxes
8.63
See how the lead times
for the two paths match
the Time Summaries
3

Copyright © 2016 The eVSM Group, All Rights Reserved
Polished Sets
1A0050
Inventory Set100
Day0.50
#2A0090
Qty Per Cycle Item1
CapacityItemDay
192.00
Pre OEE Capacity
ItemDay
240.00
OEE Percent %80.00
Assemble
Sec420.00
1.00
Cycle Time Min7
Cutters
#2A0100
Inventory Set15
Day0.08
#2A0110
Qty Per Cycle Item1
CapacityItemDay
228.00
Pre OEE Capacity
ItemDay
240.00
OEE Percent %95.00
Package
Sec120.00
1.00
Cycle Time Min2
allA0130
Share % %100
Effective Demand
ItemWeek
1000.00
Customer
Customer Demand
SetWeek
1000
Boxes
#2A0120
Inventory Item1000
Day5.00
Scrap Percent %10
OEE Input Percent
%80
Stations Stn2
OEE Input Percent
%95
Activity TimeHr
Day8
5
Week
day
70
Week
Hr
52
Year
Week
50
Roll
Set
1
Set
Item
Un
its Plot Lead Time Chart
Cumulative Cost
$Item42.00
Added Cost
$Item0.00
Added Cost$
Set3
Cumulative Cost
$Item
57.72
Cumulative Cost
$Item57.72
Added Cost
$Item0.00
Added Cost$
Set1
Cumulative Cost
$Item
58.72
Cumulative Cost
$Item58.72
Added Cost
$Item0.00
Lead Time SummaryDay
9 10 11
A0120
Boxes
1
2
Non Value Added
Legend
Value Added

Copyright © 2016 The eVSM Group, All Rights Reserved
eVSM
Data
QuickMfg
9.32.0000.
1
Z0010 P
Total Value Added
Min257.00
Value Added Percent
%2.13
Takt TimeMinItem
4.20
Total Cycle Time Min257.00
Time Summary
Lead Time Day14.38
Z0020 P
Total Value Added
Min257.00
Value Added Percent
%2.13
Takt TimeMinItem
4.20
Total Cycle Time Min257.00
Time Summary
Lead Time Day14.38
Casting Sets
1A0010
Inventory Set1000
Day5.00
1A0020
Qty Per Cycle Set1
CapacityItemDay
288.00
Pre OEE Capacity
ItemDay
320.00
OEE Percent %90.00
Machine
Sec180.00
1.00
Cycle Time Min3
Spring Steel Rolls
2A0060
Inventory Roll10
Day2.50
2A0070
Qty Per Cycle Roll1
CapacityItemDay
297.50
Pre OEE Capacity
ItemDay
350.00
OEE Percent %85.00
Machine and form caliper springs
Sec14400.00
1.00
Cycle Time Hr4
Machined Sets
1A0030
Inventory Set50
Day0.25
1A0040
Qty Per Cycle Item1
CapacityItemDay
319.20
Pre OEE Capacity
ItemDay
336.00
OEE Percent %95.00
Polish
Sec300.00
1.00
Cycle Time Min5
Springs
2A0080
Inventory Set150
Day0.75
Scrap Percent %5
Activity TimeHr
Day8
OEE Input Percent
%90
Stations Stn2
Scrap Percent %10
OEE Input Percent
%85
Stations Stn2
OEE Input Percent
%95
Stations Stn2
Step 19: Resource Modeling
Resource Center
Cumulative Cost
$Item37.00
Added Cost
$Set37
Added Cost$
Set1
Cumulative Cost
$Item
40.00
Cumulative Cost
$Item6.00
Added Cost
$Roll300
Added Cost$
Set0.25
Cumulative Cost
$Item
6.94
Cumulative Cost
$Item40.00
Added Cost
$Item0.00
Added Cost$
Set2
Cumulative Cost
$Item
42.00
Cumulative Cost
$Item6.94
Added Cost
$Item0.00

Copyright © 2016 The eVSM Group, All Rights Reserved
Drag out the Resource
Center from the Quick
Mfg stencil and enter
the data.
Right-click the center
to change into a
Machine.
Polished Sets
1A0050
Inventory Set100
Day0.50
Operator
A0140 all
Resource Quantity RQ2
Resource TimeHr
Day12
Resource Rate$
Hr20
Resource Utilization %0.00
#2A0090
Qty Per Cycle Item1
CapacityItemDay
192.00
Pre OEE Capacity
ItemDay
240.00
OEE Percent %80.00
Assemble
Sec420.00
1.00
Cycle Time Min7
Cutters
#2A0100
Inventory Set15
Day0.08
Machine
A0150 all
Resource Quantity RQ1
Resource TimeHr
Day14
Resource Rate$
Hr15
Resource Utilization %0.00
#2A0110
Qty Per Cycle Item1
CapacityItemDay
228.00
Pre OEE Capacity
ItemDay
240.00
OEE Percent %95.00
Package
Sec120.00
1.00
Cycle Time Min2
allA0130
Share % %100
Effective Demand
ItemWeek
1000.00
Customer
Customer Demand
SetWeek
1000
Boxes
#2A0120
Inventory Item1000
Day5.00
Scrap Percent %10
OEE Input Percent
%80
Stations Stn2
OEE Input Percent
%95
Activity TimeHr
Day8
5
Week
day
70
Week
Hr
52
Year
Week
50
Roll
Set
1
Set
Item
Un
itsResource Modeling
1
2
Cumulative Cost
$Item42.00
Added Cost
$Item0.00
Added Cost$
Set3
Cumulative Cost
$Item
57.72
Cumulative Cost
$Item57.72
Added Cost
$Item0.00
Added Cost$
Set1
Cumulative Cost
$Item
58.72
Cumulative Cost
$Item58.72
Added Cost
$Item0.00

Copyright © 2016 The eVSM Group, All Rights Reserved
eVSM
Data
QuickMfg
9.32.0000.
1
Z0010 P
Total Value Added
Min257.00
Value Added Percent
%2.13
Takt TimeMinItem
4.20
Total Cycle Time Min257.00
Time Summary
Lead Time Day14.38
Z0020 P
Total Value Added
Min257.00
Value Added Percent
%2.13
Takt TimeMinItem
4.20
Total Cycle Time Min257.00
Time Summary
Lead Time Day14.38
Casting Sets
1A0010
Inventory Set1000
Day5.00
1A0020
Qty Per Cycle Set1
CapacityItemDay
288.00
Pre OEE Capacity
ItemDay
320.00
OEE Percent %90.00
Machine
Sec180.00
1.00
Cycle Time Min3
Spring Steel Rolls
2A0060
Inventory Roll10
Day2.50
2A0070
Qty Per Cycle Roll1
CapacityItemDay
297.50
Pre OEE Capacity
ItemDay
350.00
OEE Percent %85.00
Machine and form caliper springs
Sec14400.00
1.00
Cycle Time Hr4
Machined Sets
1A0030
Inventory Set50
Day0.25
1A0040
Qty Per Cycle Item1
CapacityItemDay
319.20
Pre OEE Capacity
ItemDay
336.00
OEE Percent %95.00
Polish
Sec300.00
1.00
Cycle Time Min5
Springs
2A0080
Inventory Set150
Day0.75
Scrap Percent %5
Activity TimeHr
Day8
OEE Input Percent
%90
Stations Stn2
Scrap Percent %10
OEE Input Percent
%85
Stations Stn2
OEE Input Percent
%95
Stations Stn2
Step 20: Adding Resource Pipes
Cumulative Cost
$Item37.00
Added Cost
$Set37
Added Cost$
Set1
Cumulative Cost
$Item
40.00
Cumulative Cost
$Item6.00
Added Cost
$Roll300
Added Cost$
Set0.25
Cumulative Cost
$Item
6.94
Cumulative Cost
$Item40.00
Added Cost
$Item0.00
Added Cost$
Set2
Cumulative Cost
$Item
43.67
Cumulative Cost
$Item6.94
Added Cost
$Item0.00
Resource PTMinItem5
Add Resource Pipes for the
appropriate Resource Centers to
Activity Centers. Make sure the
correct unit is changed for the
data on the Resource Pipe.
2

Copyright © 2016 The eVSM Group, All Rights Reserved
Polished Sets
1A0050
Inventory Set100
Day0.50
Operator
A0140 all
Resource Quantity RQ2
Resource TimeHr
Day12
Resource Rate$
Hr20
Resource Utilization %
231.48
#2A0090
Qty Per Cycle Item1
CapacityItemDay
192.00
Pre OEE Capacity
ItemDay
240.00
OEE Percent %80.00
Assemble
Sec420.00
1.00
Cycle Time Min7
Cutters
#2A0100
Inventory Set15
Day0.08
Machine
A0150 all
Resource Quantity RQ1
Resource TimeHr
Day14
Resource Rate$
Hr15
Resource Utilization %
264.55
#2A0110
Qty Per Cycle Item1
CapacityItemDay
228.00
Pre OEE Capacity
ItemDay
240.00
OEE Percent %95.00
Package
Sec120.00
1.00
Cycle Time Min2
allA0130
Share % %100
Effective Demand
ItemWeek
1000.00
Customer
Customer Demand
SetWeek
1000
Boxes
#2A0120
Inventory Item1000
Day5.00
Scrap Percent %10
OEE Input Percent
%80
Stations Stn2
OEE Input Percent
%95
Activity TimeHr
Day8
5
Week
day
70
Week
Hr
52
Year
Week
50
Roll
Set
1
Set
Item
Un
itsAdding Resource Pipes
A
B
Cumulative Cost
$Item43.67
Added Cost
$Item0.00
Added Cost$
Set3
Cumulative Cost
$Item
66.05
Cumulative Cost
$Item66.05
Added Cost
$Item0.00
Added Cost$
Set1
Cumulative Cost
$Item
67.05
Cumulative Cost
$Item67.05
Added Cost
$Item0.00
Resource PTMinItem10
Resource PTMinItem10
To add Resource Pipes, hold down
the SHIFT key and select the
Resource Center and then the
Activity that it is being piped into, then
click the Auto Pipe button.
1
Auto Pipe

Copyright © 2016 The eVSM Group, All Rights Reserved
eVSM
Data
QuickMfg
9.32.0000.
1
Z0010 P
Total Value Added
Min257.00
Value Added Percent
%2.13
Takt TimeMinItem
4.20
Total Cycle Time Min257.00
Time Summary
Lead Time Day14.38
Z0020 P
Total Value Added
Min257.00
Value Added Percent
%2.13
Takt TimeMinItem
4.20
Total Cycle Time Min257.00
Time Summary
Lead Time Day14.38
Casting Sets
1A0010
Inventory Set1000
Day5.00
1A0020
Qty Per Cycle Set1
CapacityItemDay
288.00
Pre OEE Capacity
ItemDay
320.00
OEE Percent %90.00
Machine
Sec180.00
1.00
Cycle Time Min3
Spring Steel Rolls
2A0060
Inventory Roll10
Day2.50
2A0070
Qty Per Cycle Roll1
CapacityItemDay
297.50
Pre OEE Capacity
ItemDay
350.00
OEE Percent %85.00
Machine and form caliper springs
Sec14400.00
1.00
Cycle Time Hr4
Machined Sets
1A0030
Inventory Set50
Day0.25
1A0040
Qty Per Cycle Item1
CapacityItemDay
319.20
Pre OEE Capacity
ItemDay
336.00
OEE Percent %95.00
Polish
Sec300.00
1.00
Cycle Time Min5
Springs
2A0080
Inventory Set150
Day0.75
Scrap Percent %5
Activity TimeHr
Day8
OEE Input Percent
%90
Stations Stn2
Scrap Percent %10
OEE Input Percent
%85
Stations Stn2
OEE Input Percent
%95
Stations Stn2Resource
Balance
Step 21: Resource Balance Chart
Resource Balance Chart
Cumulative Cost
$Item37.00
Added Cost
$Set37
Added Cost$
Set1
Cumulative Cost
$Item
40.00
Cumulative Cost
$Item6.00
Added Cost
$Roll300
Added Cost$
Set0.25
Cumulative Cost
$Item
6.94
Cumulative Cost
$Item40.00
Added Cost
$Item0.00
Added Cost$
Set2
Cumulative Cost
$Item
43.67
Cumulative Cost
$Item6.94
Added Cost
$Item0.00
Resource PTMinItem5
Click the Solve button
to update the new
calculations.
1
Solve
Drag out the
Resource Balance
Chart shape.
Use the right mouse
button menu of chart
icon and select “Plot
Chart” 3
4
Switch to the
Quick Mfg setncil
2

Copyright © 2016 The eVSM Group, All Rights Reserved
Polished Sets
1A0050
Inventory Set100
Day0.50
Operator
A0140 all
Resource Quantity RQ2
Resource TimeHr
Day12
Resource Rate$
Hr20
Resource Utilization %
231.48
#2A0090
Qty Per Cycle Item1
CapacityItemDay
192.00
Pre OEE Capacity
ItemDay
240.00
OEE Percent %80.00
Assemble
Sec420.00
1.00
Cycle Time Min7
Cutters
#2A0100
Inventory Set15
Day0.08
Machine
A0150 all
Resource Quantity RQ1
Resource TimeHr
Day14
Resource Rate$
Hr15
Resource Utilization %
264.55
#2A0110
Qty Per Cycle Item1
CapacityItemDay
228.00
Pre OEE Capacity
ItemDay
240.00
OEE Percent %95.00
Package
Sec120.00
1.00
Cycle Time Min2
allA0130
Share % %100
Effective Demand
ItemWeek
1000.00
Customer
Customer Demand
SetWeek
1000
Boxes
#2A0120
Inventory Item1000
Day5.00
Scrap Percent %10
OEE Input Percent
%80
Stations Stn2
OEE Input Percent
%95
Activity TimeHr
Day8
5
Week
day
70
Week
Hr
52
Year
Week
50
Roll
Set
1
Set
Item
Un
itsResource Balance Chart
Cumulative Cost
$Item43.67
Added Cost
$Item0.00
Added Cost$
Set3
Cumulative Cost
$Item
66.05
Cumulative Cost
$Item66.05
Added Cost
$Item0.00
Added Cost$
Set1
Cumulative Cost
$Item
67.05
Cumulative Cost
$Item67.05
Added Cost
$Item0.00
Resource PTMinItem10
Resource PTMinItem10
Resource Balance Chart
Min
/Da
y
0
500
1000
1500
2000
2500
3000
3500
A0140
Ope
rato
r
A0150
Mac
hine
Polish
Assemble
Assemble
Resource Usage PT
Legend
Effective Resource Time
Check the
new chart
5

Copyright © 2016 The eVSM Group, All Rights Reserved
eVSM
Data
QuickMfg
9.32.0000.
1
Z0010 P
Total Value Added
Min257.00
Value Added Percent
%2.13
Takt TimeMinItem
4.20
Total Cycle Time Min257.00
Time Summary
Lead Time Day14.38
Z0020 P
Total Value Added
Min257.00
Value Added Percent
%2.13
Takt TimeMinItem
4.20
Total Cycle Time Min257.00
Time Summary
Lead Time Day14.38
Casting Sets
1A0010
Inventory Set1000
Day5.00
1A0020
Qty Per Cycle Set1
CapacityItemDay
288.00
Pre OEE Capacity
ItemDay
320.00
OEE Percent %90.00
Machine
Sec180.00
1.00
Cycle Time Min3
Spring Steel Rolls
2A0060
Inventory Roll10
Day2.50
2A0070
Qty Per Cycle Roll1
CapacityItemDay
297.50
Pre OEE Capacity
ItemDay
350.00
OEE Percent %85.00
Machine and form caliper springs
Sec14400.00
1.00
Cycle Time Hr4
Machined Sets
1A0030
Inventory Set50
Day0.25
1A0040
Qty Per Cycle Item1
CapacityItemDay
319.20
Pre OEE Capacity
ItemDay
336.00
OEE Percent %95.00
Polish
Sec300.00
1.00
Cycle Time Min5
Springs
2A0080
Inventory Set150
Day0.75
Scrap Percent %5
Activity TimeHr
Day8
OEE Input Percent
%90
Stations Stn2
Scrap Percent %10
OEE Input Percent
%85
Stations Stn2
OEE Input Percent
%95
Stations Stn2
Step 22: Kaizen Improvements
Kaizen
Data
Excessive capital tied up in raw
materials inventory
002
Cumulative Cost
$Item37.00
Added Cost
$Set37
Added Cost$
Set1
Cumulative Cost
$Item
40.00
Cumulative Cost
$Item6.00
Added Cost
$Roll300
Added Cost$
Set0.25
Cumulative Cost
$Item
6.94
Cumulative Cost
$Item40.00
Added Cost
$Item0.00
Added Cost$
Set2
Cumulative Cost
$Item
43.67
Cumulative Cost
$Item6.94
Added Cost
$Item0.00
Resource PTMinItem5
Right click kaizen and select “Edit
Kaizen”. Add relevant information in the
Kaizen Properties form, such as Impact
and Ease of Implementation values.
2

Copyright © 2016 The eVSM Group, All Rights Reserved
Click the Kaizen Export button
in the toolbar to create a kaizen
report in Excel.
Polished Sets
1A0050
Inventory Set100
Day0.50
Operator
A0140 all
Resource Quantity RQ2
Resource TimeHr
Day12
Resource Rate$
Hr20
Resource Utilization %
231.48
#2A0090
Qty Per Cycle Item1
CapacityItemDay
192.00
Pre OEE Capacity
ItemDay
240.00
OEE Percent %80.00
Assemble
Sec420.00
1.00
Cycle Time Min7
Cutters
#2A0100
Inventory Set15
Day0.08
Machine
A0150 all
Resource Quantity RQ1
Resource TimeHr
Day14
Resource Rate$
Hr15
Resource Utilization %
264.55
#2A0110
Qty Per Cycle Item1
CapacityItemDay
228.00
Pre OEE Capacity
ItemDay
240.00
OEE Percent %95.00
Package
Sec120.00
1.00
Cycle Time Min2
allA0130
Share % %100
Effective Demand
ItemWeek
1000.00
Customer
Customer Demand
SetWeek
1000
Boxes
#2A0120
Inventory Item1000
Day5.00
Scrap Percent %10
OEE Input Percent
%80
Stations Stn2
OEE Input Percent
%95
Activity TimeHr
Day8
5
Week
day
70
Week
Hr
52
Year
Week
50
Roll
Set
1
Set
Item
Un
itsKaizen Improvements
3
Kaizen Export
Assemble process is a bottleneck because of
low OEE and high scrap
001
Cumulative Cost
$Item43.67
Added Cost
$Item0.00
Added Cost$
Set3
Cumulative Cost
$Item
66.05
Cumulative Cost
$Item66.05
Added Cost
$Item0.00
Added Cost$
Set1
Cumulative Cost
$Item
67.05
Cumulative Cost
$Item67.05
Added Cost
$Item0.00
Resource PTMinItem10
Resource PTMinItem10
Drag out Kaizen
starbursts from the
Quick Extras stencil.
1

Copyright © 2016 The eVSM Group, All Rights Reserved
eVSM
Data
QuickMfg
9.32.0000.
1
Z0010 P
Total Value Added
Min257.00
Value Added Percent
%2.13
Takt TimeMinItem
4.20
Total Cycle Time Min257.00
Time Summary
Lead Time Day14.38
Z0020 P
Total Value Added
Min257.00
Value Added Percent
%2.13
Takt TimeMinItem
4.20
Total Cycle Time Min257.00
Time Summary
Lead Time Day14.38
Casting Sets
1A0010
Inventory Set1000
Day5.00
1A0020
Qty Per Cycle Set1
CapacityItemDay
288.00
Pre OEE Capacity
ItemDay
320.00
OEE Percent %90.00
Machine
Sec180.00
1.00
Cycle Time Min3
Spring Steel Rolls
2A0060
Inventory Roll10
Day2.50
2A0070
Qty Per Cycle Roll1
CapacityItemDay
297.50
Pre OEE Capacity
ItemDay
350.00
OEE Percent %85.00
Machine and form caliper springs
Sec14400.00
1.00
Cycle Time Hr4
Machined Sets
1A0030
Inventory Set50
Day0.25
1A0040
Qty Per Cycle Item1
CapacityItemDay
319.20
Pre OEE Capacity
ItemDay
336.00
OEE Percent %95.00
Polish
Sec300.00
1.00
Cycle Time Min5
Springs
2A0080
Inventory Set150
Day0.75
Scrap Percent %5
Activity TimeHr
Day8
OEE Input Percent
%90
Stations Stn2
Scrap Percent %10
OEE Input Percent
%85
Stations Stn2
OEE Input Percent
%95
Stations Stn2
Step 23: Kaizen Impact Matrix
Kaizen
Data
Excessive capital tied up in raw
materials inventory
002
Cumulative Cost
$Item37.00
Added Cost
$Set37
Added Cost$
Set1
Cumulative Cost
$Item
40.00
Cumulative Cost
$Item6.00
Added Cost
$Roll300
Added Cost$
Set0.25
Cumulative Cost
$Item
6.94
Cumulative Cost
$Item40.00
Added Cost
$Item0.00
Added Cost$
Set2
Cumulative Cost
$Item
43.67
Cumulative Cost
$Item6.94
Added Cost
$Item0.00
Resource PTMinItem5
5
4
3
2
1
1 2 3 4 5
Ease Of Implementation
Imp
act O
n V
alu
e
Kaizen Impact Matrix
002
001

Copyright © 2016 The eVSM Group, All Rights Reserved
Drag out the Kaizen
Impact Matrix and
right-click to plot.
Polished Sets
1A0050
Inventory Set100
Day0.50
Operator
A0140 all
Resource Quantity RQ2
Resource TimeHr
Day12
Resource Rate$
Hr20
Resource Utilization %
231.48
#2A0090
Qty Per Cycle Item1
CapacityItemDay
192.00
Pre OEE Capacity
ItemDay
240.00
OEE Percent %80.00
Assemble
Sec420.00
1.00
Cycle Time Min7
Cutters
#2A0100
Inventory Set15
Day0.08
Machine
A0150 all
Resource Quantity RQ1
Resource TimeHr
Day14
Resource Rate$
Hr15
Resource Utilization %
264.55
#2A0110
Qty Per Cycle Item1
CapacityItemDay
228.00
Pre OEE Capacity
ItemDay
240.00
OEE Percent %95.00
Package
Sec120.00
1.00
Cycle Time Min2
allA0130
Share % %100
Effective Demand
ItemWeek
1000.00
Customer
Customer Demand
SetWeek
1000
Boxes
#2A0120
Inventory Item1000
Day5.00
Scrap Percent %10
OEE Input Percent
%80
Stations Stn2
OEE Input Percent
%95
Activity TimeHr
Day8
5
Week
day
70
Week
Hr
52
Year
Week
50
Roll
Set
1
Set
Item
Un
itsKaizen Impact Matrix
1
Assemble process is a bottleneck because of
low OEE and high scrap
001
Cumulative Cost
$Item43.67
Added Cost
$Item0.00
Added Cost$
Set3
Cumulative Cost
$Item
66.05
Cumulative Cost
$Item66.05
Added Cost
$Item0.00
Added Cost$
Set1
Cumulative Cost
$Item
67.05
Cumulative Cost
$Item67.05
Added Cost
$Item0.00
Resource PTMinItem10
Resource PTMinItem10
Kaizen
Impact
Matrix