questo: interactive construction of objective …remco/publications/2020/eurovis2020...questo:...
TRANSCRIPT

Eurographics Conference on Visualization (EuroVis) 2020M Gleicher T Landesberger von Antburg and I Viola(Guest Editors)
Volume 39 (2020) Number 3
QUESTO Interactive Construction of Objective Functions forClassification Tasks
Subhajit Das1 Shenyu Xu1 Michael Gleicher2 Remco Chang3 and Alex Endert1
1Georgia Institute of Technology USA 2University of Wisconsin ndash Madison USA 3Tufts University USA
Figure 1 QUESTO A Incorrect predictions B Confusion matrices C Model score D Sliders to weight objectives E Draggable con-straints to specify priority F Selected model G Test data constraints H Model run and Export button I Rule panel J Important features
AbstractBuilding effective classifiers requires providing the modeling algorithms with information about the training data and modelinggoals in order to create a model that makes proper tradeoffs Machine learning algorithms allow for flexible specification of suchmeta-information through the design of the objective functions that they solve However such objective functions are hard forusers to specify as they are a specific mathematical formulation of their intents In this paper we present an approach that allowsusers to generate objective functions for classification problems through an interactive visual interface Our approach adopts asemantic interaction design in that user interactions over data elements in the visualization are translated into objective functionterms The generated objective functions are solved by a machine learning solver that provides candidate models which can beinspected by the user and used to suggest refinements to the specifications We demonstrate a visual analytics system QUESTOfor users to manipulate objective functions to define domain-specific constraints Through a user study we show that QUESTOhelps users create various objective functions that satisfy their goals
CCS Conceptsbull Computing methodologies rarr Model construction and selection bull Mathematics of computing rarr Interactive objectivefunctions bull Human-centered computing rarr Visual analytics bullMachine learning task rarr Classification
ccopy 2020 The Author(s)Computer Graphics Forum ccopy 2020 The Eurographics Association and JohnWiley amp Sons Ltd Published by John Wiley amp Sons Ltd
Das et al QUESTO Interactive Construction of Objective Functions for Classification Tasks
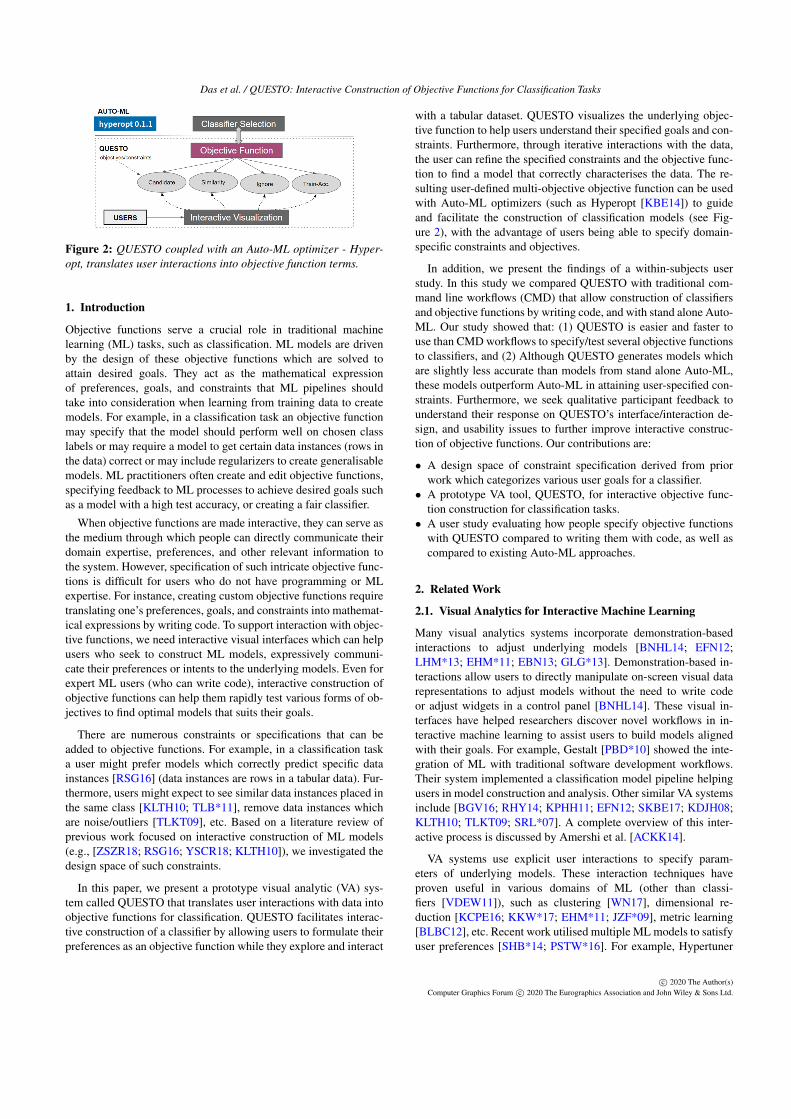
Figure 2 QUESTO coupled with an Auto-ML optimizer - Hyper-opt translates user interactions into objective function terms
1 Introduction
Objective functions serve a crucial role in traditional machinelearning (ML) tasks such as classification ML models are drivenby the design of these objective functions which are solved toattain desired goals They act as the mathematical expressionof preferences goals and constraints that ML pipelines shouldtake into consideration when learning from training data to createmodels For example in a classification task an objective functionmay specify that the model should perform well on chosen classlabels or may require a model to get certain data instances (rows inthe data) correct or may include regularizers to create generalisablemodels ML practitioners often create and edit objective functionsspecifying feedback to ML processes to achieve desired goals suchas a model with a high test accuracy or creating a fair classifier
When objective functions are made interactive they can serve asthe medium through which people can directly communicate theirdomain expertise preferences and other relevant information tothe system However specification of such intricate objective func-tions is difficult for users who do not have programming or MLexpertise For instance creating custom objective functions requiretranslating onersquos preferences goals and constraints into mathemat-ical expressions by writing code To support interaction with objec-tive functions we need interactive visual interfaces which can helpusers who seek to construct ML models expressively communi-cate their preferences or intents to the underlying models Even forexpert ML users (who can write code) interactive construction ofobjective functions can help them rapidly test various forms of ob-jectives to find optimal models that suits their goals
There are numerous constraints or specifications that can beadded to objective functions For example in a classification taska user might prefer models which correctly predict specific datainstances [RSG16] (data instances are rows in a tabular data) Fur-thermore users might expect to see similar data instances placed inthe same class [KLTH10 TLB11] remove data instances whichare noiseoutliers [TLKT09] etc Based on a literature review ofprevious work focused on interactive construction of ML models(eg [ZSZR18 RSG16 YSCR18 KLTH10]) we investigated thedesign space of such constraints
In this paper we present a prototype visual analytic (VA) sys-tem called QUESTO that translates user interactions with data intoobjective functions for classification QUESTO facilitates interac-tive construction of a classifier by allowing users to formulate theirpreferences as an objective function while they explore and interact
with a tabular dataset QUESTO visualizes the underlying objec-tive function to help users understand their specified goals and con-straints Furthermore through iterative interactions with the datathe user can refine the specified constraints and the objective func-tion to find a model that correctly characterises the data The re-sulting user-defined multi-objective objective function can be usedwith Auto-ML optimizers (such as Hyperopt [KBE14]) to guideand facilitate the construction of classification models (see Fig-ure 2) with the advantage of users being able to specify domain-specific constraints and objectives
In addition we present the findings of a within-subjects userstudy In this study we compared QUESTO with traditional com-mand line workflows (CMD) that allow construction of classifiersand objective functions by writing code and with stand alone Auto-ML Our study showed that (1) QUESTO is easier and faster touse than CMD workflows to specifytest several objective functionsto classifiers and (2) Although QUESTO generates models whichare slightly less accurate than models from stand alone Auto-MLthese models outperform Auto-ML in attaining user-specified con-straints Furthermore we seek qualitative participant feedback tounderstand their response on QUESTOrsquos interfaceinteraction de-sign and usability issues to further improve interactive construc-tion of objective functions Our contributions are
bull A design space of constraint specification derived from priorwork which categorizes various user goals for a classifierbull A prototype VA tool QUESTO for interactive objective func-
tion construction for classification tasksbull A user study evaluating how people specify objective functions
with QUESTO compared to writing them with code as well ascompared to existing Auto-ML approaches
2 Related Work
21 Visual Analytics for Interactive Machine Learning
Many visual analytics systems incorporate demonstration-basedinteractions to adjust underlying models [BNHL14 EFN12LHM13 EHM11 EBN13 GLG13] Demonstration-based in-teractions allow users to directly manipulate on-screen visual datarepresentations to adjust models without the need to write codeor adjust widgets in a control panel [BNHL14] These visual in-terfaces have helped researchers discover novel workflows in in-teractive machine learning to assist users to build models alignedwith their goals For example Gestalt [PBD10] showed the inte-gration of ML with traditional software development workflowsTheir system implemented a classification model pipeline helpingusers in model construction and analysis Other similar VA systemsinclude [BGV16 RHY14 KPHH11 EFN12 SKBE17 KDJH08KLTH10 TLKT09 SRL07] A complete overview of this inter-active process is discussed by Amershi et al [ACKK14]
VA systems use explicit user interactions to specify param-eters of underlying models These interaction techniques haveproven useful in various domains of ML (other than classi-fiers [VDEW11]) such as clustering [WN17] dimensional re-duction [KCPE16 KKW17 EHM11 JZF09] metric learning[BLBC12] etc Recent work utilised multiple ML models to satisfyuser preferences [SHB14 PSTW16] For example Hypertuner
ccopy 2020 The Author(s)Computer Graphics Forum ccopy 2020 The Eurographics Association and John Wiley amp Sons Ltd
Das et al QUESTO Interactive Construction of Objective Functions for Classification Tasks
[TCWM18] and BEAMES [DCCE18] allowed tuning hyperparam-eters of multiple regression models to support user goals Cluster-vision enabled exploring multiple cluster models to analyze the fit-ness based on metrics such as Silhouette Coefficient [KEV18]
In general these current VA tools interactively adjust ML modelsbased on a pre-defined objective function (by ML practitioners orsystem developers) which users often cannot adjust or view Suchtools do not allow users to interactively design an objective functionthat seeks to adjust the behavior of ML models or select modelsthat better suits the specified constraints Rather user interaction inthese tools is interpreted as changing feature weights or adjustingvalues of model parameters for model steering Instead this paperexplores how people can interact with objective functions
Past researchers have looked at human-in-the-loop based MLprocesses [AFKT11 BZSA17 BM17 KBS11 GFT16 KTD17]where they showed human contribution in ML processes in vari-ous ways For example the system Label-and-Learn facilitated auser-guided labeling process in ML using interactive visualizationtechniques [SLT17] Squares showed humans interactively debug-ging ML models [RAL17] Liu et al showed an interactive systemcalled CNNVis that helps ML experts debug diagnose and fur-ther improve CNN models [LSL17] Sacha et al have examinedvarious VA systems to discover that users evaluate models by aplethora of measures including conventional metrics such as ac-curacy and cost as well as novel criteria such as unexpectedness[SSZ17] Holzinger et al have claimed that in cases of insuffi-cient training data ML problems are often NP-hard which can besolved by interactive ML-based solutions using a domain-expertuserrsquos input [Hol16] To increase human input crowd-sourcing isa new avenue in human-machine collaboration [CFEC17] Crowdworkers perform various tasks such as cleantransform data ano-tateadd labels etc Novel techniques have improved the reliabilityof having crowd workers be part of conventional ML pipelines asshown in [CAK17 NKHK17 CB15 SRL09 WLDW01]
22 Auto-ML Systems
Conventional ML pipeline requires selecting an appropriate learn-ing algorithm and finding an optimal combination of hyperparam-eters to construct a model Evidently this workflow is not suitablefor novice ML users who otherwise rely on GUI based tools suchas WEKA [EW16] To help novices construct better ML modelsnew tools are developed in the space of automated ML or Auto-MLsuch as Auto Weka [THHLB13 KTH16] BigML [MLa] SigOpt[PPJ07] Hyperopt [BYC13 KBE14] Snowcat [CHH19] andAUTO-SKLEARN [FKE15] Holzinger et al explored Auto-MLbased workflows in various domains to further confirm the useful-ness of such systems [Hol16] While useful these tools are limitedto optimize ML models based on conventional metrics such as Pre-cision or Recall Users cannot specify constraints or metrics thatare more meaningfuluseful to them In this paper we seek to createa novel technique to incorporate domain expertise and userrsquos sub-jective preferences in model construction selection and evaluation
23 Visualizing Objective Functions and Solutions
Various techniques have been used to visualize solution sets froman objection function space such as MDS RadViz bubble chartparallel coordinates self organizing map etc [HY17] Further Heet al proposed a new visualization technique to map solutions froma high-dimensional objective space to a 2D polar coordinate plotTheir method helped a user to understand tradeoffs between ob-jectives and find desirable solutions [HY16] Sahu et al showedthe use of a radar chart to visualize many-objective solution spaces[SC11] Walker et al visualized a set of mutually non-dominatingsolutions using Radviz to show multi-objective solutions and intro-duced techniques to measure the similarity of non-dominating so-lutions [WEF13 WFE12] Many researchers have looked at mea-sures to assess the diversity of pareto-optimal solutions in multi-objective optimization problems [MLY17 LYL14] In QUESTOwe leverage these techniques to visualize solutions to a multi-objective objective function However the focus of our work is noton the visualization of the solution spaces but in helping users ex-press their analysis intent through objective functions
24 User PreferencesModeling
ML users solve various problems which are context dependentand personal [AF18] eg interaction with robots in a hospital[RLD18 EIZ13] Diverse problem scenarios create an opportu-nity to specify a diverse set of user preferences These preferencesare the building blocks to construct an objective function We stud-ied the literature to understand what kind of specifications userscan provide to construct a classifier [ZSZR18 YSCR18 CW18CES09 TDCF07] Kapoor et al discussed often users have torely on the overall classification accuracy of predictive models in-stead of relying on predictions generated by marginal models Thisoften leads to a bad model selection [KLTH10] Zhu et al de-scribed the machine teaching paradigm where a machine teacher(usually a domain expert) shows informative data instances of pos-itive and negative class labels to maximize the distance between theclasses [ZSZR18]
Lime a submodular optimization technique helped usersinterpret models by explaining the prediction of a classifier on aset of relevant data instances [RSG16] This showed the relevanceof a modelrsquos performance on a specific subset of data items thatthe users care about Tamuz et al showed an adaptive algorithmthat estimated a similarity matrix from human judgments basedon comparisons of triples [TLB11] Applying the same ideologyin classification tasks users can specify data instances that aresimilar and should be predicted to be in the same class label Thesystem Flock asked crowd workers to define the reason behind apair of instances to be in a positive class and vice versa [CB15]Kapoor et al discussed if users can understand the model behaviorthey can assess the possible next moves to adjust the model further[KLTH10] For example users can evaluate if models correctlypredict similar data instances in the same class label If these arenot in the same class users may provide additional examples torefine the model These pioneer works in the literature inspiredus to help users define their measure of success in a classifierconstruction process through interactive objective functions
ccopy 2020 The Author(s)Computer Graphics Forum ccopy 2020 The Eurographics Association and John Wiley amp Sons Ltd
Das et al QUESTO Interactive Construction of Objective Functions for Classification Tasks
3 Design space of objectives and constraints
We define objectives as a component or a function term of a multi-objective objective function These objectives are also referred to asuser preferences goals subjective requirements etc in the paperNext each of these objectives may have constraints For example auser may have an objective of finding a highly performant modelA constraint can be the accuracy be calculated using precision re-call or F1-score metrics Similarly another objective could be thatthe classifier performs better on hand-chosen data instances In thisobjective one constraint may be that it labels similar data instances(specified by the user) in the same class label
We analyzed 61 papers from visual analytics and interactive ma-chine learning areas which included 18 VA systems to formulatea set of objectives and their respective constraints for a classifica-tion task (dagger) Using an affinity diagramming approach we clusteredsimilar papers and VA systems with similar interactive constraintsFurther we iteratively refined these until we were satisfied withthe relationships between the clusters For example based on theliterature we derived constraints such as Critical that representsdata instances which users find important to be correctly predictedCandidate that captures data instances which are strong represen-tatives of a class label (and not necessarily Critical) Finally wederived 15 constraints users can define organized into 4 objectivecategories for a classification task Instance-based Feature-basedTrain-objectives and Test-objectives described below
31 Instance-based
This objective allows users to specify that the classifier should per-form well on a set of data instances While many of the constraintsin this section involve adjusting weights on specified data instanceswe categorized them separately based on how they are revealed inthe user interface and the user task supported
Similarity This constraint captures the degree of similarity (or dif-ference) between data items A user specifies a set of similar datainstances and expects them to be predicted in the same class labelUsers can also specify pairs of data items to be predicted in dif-ferent classes However in both cases (ldquosimilarrdquo and ldquodifferentrdquo)users do not specify the class in which the specified data instancesshould be placed There are various VA systemstechniques wheresimilarity and difference between data samples was sought fromusers to construct models For example Tamuz et al discussed asimilarity matrix to infer if an object rdquoArdquo is similar to rdquoBrdquo or rdquoCrdquofor a user [TLB11] Another system Flock asked crowd workersto specify paired examples to define similar or different instancesof positive or negative class [CB15]
Candidate This constraint type refers to user feedback on a set ofdata instances from the training set which are good representativesof their class Based on prior knowledge users can specify that datainstances represent a given class well
Critical This constraint lets users specify a set of data instances toshow that correct prediction of these are critical for them This con-straint can be specified when users want a set of data instances to
dagger The full list of papers is provided in the supplemental material
be correctly classified while the accuracy of other data instances isless important For example consider a financial analysis scenariowhere a company needs a classifier to predict which clients shouldbe granted a loan The analyst might know a few clients who aremore profitable than others Thus he or she might prefer a classi-fier that correctly predicts these clients than the less profitable onesUsers can assess constructed classifiers based on how accuratelythey predict the specified critical data instances Other researchershave looked at critical data instances For example Lime is a MLalgorithm which helps users to interpret models by explaining theirpredictions on data instances that are critical [RSG16]
Ignore This constraint specifies if the user intends to remove noisyor outlier data instances from the training set Removal of noise oran outlier increases the accuracy of prediction and the power of themodel to generalize on unseen data This constraint may also in-clude specification of data instances whose prediction (correct orincorrect) is irrelevant to users Elzen et al prototyped Baobab-View for inspecting outliers and noisy data to improve interactiveconstruction of decision trees [VDEW11]
32 Feature-based
This category includes items which users can specify to help amodel in its learning process The following constraints defined un-der this category operates at the level of the features (or attributes)
Feature selection This constraint allows users to specify fea-tures that are important for classification A classifier will only usethe specified features when it is learning the data or the Auto-MLsystem will penalize any model that uses features other than theones specified by the user This is inspired from previous workthat showed the value of human-centered feature selection in modelconstruction [KPB14 LWLZ17 CB15]
Correlation and Variance This constraint allows users to spec-ify correlation and variance in the features based on their domainexpertise Users specify perceived correlation between features andvariance per feature in the data Correlation and Variance are basedon the userrsquos domain knowledge and not necessarily grounded inthe training data For example a financial analyst might know thatexperienced bank customers in the age group of 40minus 50 are morelikely to spend economically and pay on time Thus the featuresage and payment are correlated based on the domain knowledge ofthe user which may or may not be present in the data Hall showeda feature selection method based on correlation in the data [H99]Instead of computing correlation in the features from the trainingdata users may specify correlation and variance in the data an in-formation that affects how the model learns from the data
33 Train-objectives and Test-objectives
ML models can be evaluated using conventional model met-rics or constraints such as Accuracy Precision Recall and F1-Score When applied to the training set we consider them Train-objectives compared to applying them to the test set when we con-sider them Test-objectives Together these two objectives help userscontrol for model overfitting Using the Train-objectives users canverify how well the model is learning from the data while using
ccopy 2020 The Author(s)Computer Graphics Forum ccopy 2020 The Eurographics Association and John Wiley amp Sons Ltd
Das et al QUESTO Interactive Construction of Objective Functions for Classification Tasks
the Test-objectives they can validate if the model generalises wellon unseen data For example one can first find models with hightraining accuracy (ie low bias) then tune the hyperparametersto achieve a high test set accuracy (ie low variance) and finallyweight or rank these constraints to find classifiers that show an op-timal tradeoff between bias and variance
4 QUESTO System Design and Description
QUESTO helps users interactively construct classifiers that ad-dress their subjective goals specified in the form of interactiveobjective functions The interface is designed to facilitate inter-active specification of constraints at the data instance and fea-ture level QUESTO enables users to see specified constraints andaddremoveedit them QUESTO supports classifier inspection andselection from a set of candidate models generated from the user-specified objective function with Hyperopt in the backend
Upon data import QUESTO splits the datasets into a trainingset multiple test sets and a final validation set The training set isused to build the initial model The multiple test sets are used foreach iteration of user feedback to test how well the model meets theobjectives and constraints specified When users are satisfied thereis a final validation set (which is never seen by the model duringthe previous iterations) used to validate the model
41 User Interface and Interactions
Data table view It displays the training and test data sets intwo data tables In addition it supports specification of 4 typesof constraints Critical Ignore Similarity and Candidate Tospecify Critical or Ignore constraints users can click on the row(See Figure 4-E) To specify a Similarity constraint users canspecify either rdquoSimilarrdquo or rdquoDifferentrdquo on pairs of data instancesTo specify the Candidate constraint (see Figure 4-B E) userscan select rows within a class to specify example data instancesWhen users select a model from the model interpreter view theclass label column of both training and test data shows correctpredictions with a check mark while incorrect predictions areshown with a cross mark (see Figure 1-A)
Scatterplot matrix view Shows the relationship between variousattributes and helps users find missing data outliers etc
Confusion matrix A confusion matrix for both the training andtest dataset is shown on the right of the data table view (see Fig-ure 1-C) Clicking on cells in the confusion matrix filters the datatable to show data instances responsible for the prediction
Feature panel The features of the data are visualized as a parallelcoordinate plot (Figure 4-G) Brushing on any feature (representedas vertical lines) allow users to filter the data instances in the datatable Users can specify a Feature Selection constraint by clickingon the cells over the vertical lines (Figure 4-F) Further right click-ing on these cells specifies a Correlation and Variance constraint
Objective function stack This view visualizes the interactive ob-jective function Each box (see Figure 1-G) represents an objec-tive category and contains constraints under the categorization de-scribed in section 3 Users can specify a constraint by clicking
on its name (a specified constraint is shown with a green check-mark see Figure 1-E) When users explore and interact with thedata QUESTO automatically infers constraints such as CandidateCritical etc However users can override the inferred constraintsif they disagree Underneath each box is a slider (Figure 1-D E)which allows users to adjust the weight of each objective Users canalso reorder constraints vertically to indicate priority
Model interpreter Shows metrics of k ML models Users canchoose to inspect each model by seeing it in a parallel coordinateor in a star plot (see Figure 1-F) Users can select a model whichupdates the data table view (showing predictions for each data in-stance) and updates the confusion matrices This view also showsthe top 3 features used by the classifier
Rule Panel When users specify any constraints by filtering datainstances QUESTO saves these data instances as part of a rule(Figure 1-I) that can be interacted with through this view
42 Technique
This section describes the underlying techniques in QUESTO thatdrive the construction of an interactive objective function (seeFigure 3) QUESTO uses an Auto-ML module called Hyperopt[KBE14] to find an optimal hyperparameter combination whichmay meet user goals QUESTO specifies a learning algorithmand a set of hyperparameters for Hyperopt to construct models(eg we used a random forest classifier with the hyperparame-ters MaxDepth Criteria (ldquoginirdquo or ldquoentropyrdquo) and MinSamples)Our technique uses an iterative model construction and evaluationworkflow Users formulate their preferences in the objective func-tion O by specifying a set of constraints Φ and a weight vectorW Per iteration Hyperopt consumes O to construct and rank newmodels M This cycle allows users to search for models by definingtheir goals and constraints in O
421 Classifier Creation and Selection
Model Construction QUESTO splits the loaded data set Z intotraining D multiple test sets T = T1T2T3Tt and a validation setV Next it triggers Hyperopt to start the model optimization pro-cess on the supplied data D to build M classifiers of size N (M =m1m2m3 mN ) It constructs each model mi using a suppliedlearning algorithm κ and sampled B hyperparameter combinationsWe used Scikit-Learnrsquos machine learning package to build the clas-sifiers [MLb] further supported by Hyperopt which provides newhyperparameter combinations Finally each of the trained model mipredicts class labels for both D and Ti The models are evaluatedbased on their performance on the supplied objective function O
Model Optimization Hyperopt traverses the space of pre-definedhyperparameters to construct a set of models As an input Hyper-opt expects a list of hyperparameters to tune H = h1h2hB anda domain space νi for each hyperparameter hi We pre-selectedB hyperparameters and their domain space For example if adomain space of 2 minus 100 for MaxDepth hyperparameter waschosen Hyperopt will sample a value between 2 to 100 Fur-ther using user-defined constraints such as Testing-Accuracy orCross-val-score Hyperopt samples the hyperparameter space tocontrol for model overfitting Hyperopt evaluates each model in
ccopy 2020 The Author(s)Computer Graphics Forum ccopy 2020 The Eurographics Association and John Wiley amp Sons Ltd
Das et al QUESTO Interactive Construction of Objective Functions for Classification Tasks
Figure 3 QUESTO system architecture
M with the supplied objective function O The objective functionO is constructed by a weighted linear combination of user-definedconstraints Φ Each model mi in M gets a objective function scoreS = s1s2 sN based on its performance on O Hyperopt ranks theN classifiers (we set N = 100 but can be changed) based on theobjective function scores in S
422 Interactive Objective Function Creation
The set of constraints Φ represent the different categories of goalsand constraints in our taxonomy (see Section 3) Using QUESTOusers can define the following constraints interactively
Critical Hyperopt trains a model mi on the supplied training setD with original labels Ldo Next it predicts labels on the trainingset as Ldp Users specify a list of IDs of x critical data instancesC = c1c2cx QUESTO retrieves the prediction on the criticaldata instances based on supplied IDs C as Lcp (Lcp sub Ldp)QUESTO retrieves the original class labels of the critical datainstances as Lco QUESTO initializes the score for the Criticalconstraint as s1 = 0 It compares Lco with Lcp to find the numberof correct matches and save in s1 (normalized between 0 to 1)
Similarity This constraint is of two types The first type capturessimilar data items when a user specifies a list of data items Y thatare similar and should be placed in the same class The algorithmiterates over Y to find the original class label Lno If Y belongs tomore than one class label the most frequent class label is assignedto Lno Next the algorithm matches the prediction Lnp with theoriginal class label Lno where i is the index iterating from 0 tob (the number of user-specified similar data instances) For everycorrect match the score for this constraint s2a gets a +1 scoreNext it normalizes s2a as (s2a)b to get a score between 0 to 1
The second type consists of users specifying items that should bedifferent A user does so by specifying a list of tuples σ where eachitem in the list is represented as σi = (σxσy) Here σx and σy aredata instances that users expect to be predicted in different classesThe algorithm iterates over σ and matches the predicted class labelLσpi of item σi to class label Lσp j of item σ j For every incorrectmatch the score for this constraint s2b gets a +1 point Next itnormalizes s2b as (s2b)b to get a score between 0 to 1 Finallythe score for this constraint is computed as s2 = (s2a + s2b) Wenormalize s2 to get a score between 0 to 1
Candidate Users specify a list of b data items in G with a classlabel A The algorithm increases the training data weights (W =w1ws2ws3wb) for these data items It inputs W to Hyperopt
which trains the classifiers M based on the updated weights The al-gorithm iterates through G and matches each items predicted classlabel L f p with A The score for this metric s3 is initialized as 0For each correct match in the iteration s3 is assigned a +1 pointFinally the algorithm normalizes s3 as s3 = s3b
Ignore Users specify a list of data items I The algorithm removesthese data items from D to form a new training set DII Furtherwhen computing classification model metrics such as PrecisionRecall etc the algorithm removes the data items in I from D
Accuracies This captures the classification model metrics definedas part of the category Train-objectives and Test-objectives (seesection 3) These are Precision Recall F1-Score etc For each ofthese QUESTO uses Scikit-Learns classification metrics [MLb]
Feature Selection Correlation and Variance QUESTO incor-porates a user-based feature selection technique Users can guidefeature selection in one of two ways First users can select a setof features Fd using the feature panel QUESTO interpretes thatthe user chose a set of features which has a high correlation withthe class label For model construction QUESTO will only use thefeatures in Fd Second users can specify a set of correlated fea-tures Fc or features with low variance in Fv QUESTO automati-cally discards the features which show high correlation (negativeor positive) with each other and selects the ones which are uncorre-lated Similarly QUESTO discards features with low variance Theselected features F = FminusFc or F = FminusFv are fed to Hyperopt
Objective Function Formulation The resulting objective func-tion in QUESTO is a weighted linear combination of constraintsΦ The algorithm computes the scores for each constraint Finallyit linearly combines these individual constraint scores as shown inthe equation O = s1 lowastω1 + s2 lowastω2 + s3 lowastω3 + s4 lowastω4 + s5 lowastω5where s1s2s3 etc are the scores of the user-specified constraints
Weighting Preferences Initially the weights W = ω1ω2 ωUare evenly set for each constraint in Φ However users can over-ride and specify weightings for each constraint by interaction tech-niques shown in Section 41 The weight vector W sums to 1 toensure correctness in computing the contribution of each item in Φ
Guarding Against Data Leakage QUESTO searches for bestmodels from a pool of sampled ML models (facilitated by Hyper-opt) This is different from optimizing the internal algorithm of MLmodels such as designing the loss function for a random forest Asour technique treats each model as a black box it can optimize formodels that may perform better on train or test data This is similarto conventional model construction processes where ML practi-tioners aim for a higher training or test accuracy or a balance be-tween each However to guard against data leakage our techniqueuses multiple sets of test data T = T1T2Tt (each used per itera-tion of model construction) When QUESTO loads input data Z itautomatically splits into three sets train D test T and validationV Next it makes t subsets of the test data each used per iterationof model construction This serves to address potential data leak-age as the models are tested on unseen data and during training thetest data is not used Per iteration the model gets a new test set Tito compute the objective score (test-accuracy test-F1-score etc) Inaddition when the model is exported by the user they get to validateit on the validation set V which is not used on any prior iteration
ccopy 2020 The Author(s)Computer Graphics Forum ccopy 2020 The Eurographics Association and John Wiley amp Sons Ltd
Das et al QUESTO Interactive Construction of Objective Functions for Classification Tasks
5 Usage Scenario
We describe a scenario showing how QUESTO can help users buildclassifiers on an imbalanced dataset through the specification of in-teractive objective functions Chris is a public policy analyst (withbasic knowledge of ML) is analyzing San Franciscorsquos employmentdata to predict employees department [Off] (10000 samples) Chrisexplores the salary data in QUESTO and begins constructing clas-sifiers They inspect the best classifier from the model interpreterto observe that it scored poorly on both training and test set (avg48 accuracy) Chris explores the confusion matrix to discover that80 of the original labels are of type public service indicating thatthe data is imbalanced (there are 5 class labels) While the currentmodel correctly predicted 70 of this label type it failed to predictthe other labels accurately Chris expects the classifier to predicteach class label with at least 80 accuracy to be valuable for theiranalysis Next using the objective function stack view Chris spec-ifies the constraint F1-Score to account for the imbalanced natureof the dataset and the constraint Cross-val-score to construct gen-eralisable models
Chris triggers QUESTO to construct a set of new classifiers (seenthrough the model interpreter) based on the updated objective func-tion They click on model 2 as it shows the best performance on allthe specified constraints in the star plot view However other thanthe class public service) this model failed to perform as per expec-tation on other labels For example the label culturalrecreationand adminfinance showed 0 correctly predicted data items Mo-tivated to resolve these two classes Chris brushes on the featureretirement on the feature panel to filter jobs with high retirementbenefits Next Chris picks the constraint Candidate from the drop-down menu as seen in Figure 4-B They click on a set of data itemsof label administrationfinance on the table (shown with a greenhighlight see Figure 4-E) When Chris specifies the Candidate con-straint QUESTO automatically records the selected data instancesas part of a rule (see Figure 1-I) Chris assigns it a custom namehigh-retirement Next they filter the data instances using the fea-ture panel with low overtime and high salary values Chris speci-fies a subset of these data instances as Candidate constraint for theclass culturalrecreation QUESTO saves these data instances as arule which Chris calls high-sal (Figure 1-I)
Chris inspects one of the new models (model 2) by hovering overthe two rules (high-retirement and high-sal shows associated dataitems in the table view) Quickly glancing through these data itemsChris observes that the prediction error is less than 10 which theyfind acceptable Next Chris explores the confusion matrices andfinds that the performance score for the model increased to 72accuracy (see Figure 5-BC) Furthermore Chris notices that themodelrsquos performance improved significantly achieving on average70 accuracy for all classes except adminfinance In order to boostthe performance of the label adminfinance Chris specifies all thedata instances of this label (in the training set with more than 80000retirement benefits total 12 items) as a Critical constraint
Iterating further Chris finds a new set of classifiers from the col-lection satisfied the constraints Candidate Critical and F1-ScoreHowever the performance dropped on the test set in all of thesemodels To further emphasize the performance on the test set as animportant criteria Chris specifies the Testing-Accuracy constraint
Figure 4 A Critical constraint B Other constraints C Classselector D Filter tags E Selected data F Select features corre-lation and variance G Parallel coordinate plot
Figure 5 Views for Evaluating Model Performance
In addition they lower the weights on the constraints in thecategories Train-objectives and Instance-based and increases theweight on the category Test-objectives (see Figure 1-D E) Theyalso re-order individual constraints specifying highest priorityto the constraint Candidate Chris constructs new classifiers andchooses model 3 based on its performance as viewed in the starplot view They hover over the two custom rules (see Figure 1-I) tosee that most of the data instances in them are correctly predictedand performs equally well on all class labels Content with thecurrent model Chris tests the model on a validation set and thenexports it for future use This usage scenario shows how QUESTOenabled a domain expert to build an accurate classifier on animbalanced dataset by exploring various objective functions thatcaptured his subjective preferences
6 Evaluation
Other than using interactive visual interfaces like QUESTO twopopular alternatives to constructing classifiers are (1) manuallycreating them via code or command-line (CMD) interfaces and (2)automatically generating them using Auto-ML We wanted to com-pare QUESTO with manually coding to verify if QUESTO is easierand faster to specify constraints Furthermore we wanted to com-pare QUESTO with Auto-ML to verify if QUESTO satisfies sub-jective user goals better and to compare the resulting accuracy Weconducted a within-subject controlled lab user study of QUESTOcomparing it with CMD and Auto-ML to construct a classifier Ourstudy addresses the following research questions
RQ1 Is QUESTO easier and faster to use than CMD workflowsRQ2 Does QUESTO build more accurate models than
automatically-generated models from Auto-MLRQ3 Does QUESTO build models that addresses user-specified
constraints better than models from Auto-ML
We hypothesize the interactive visual interface of QUESTO will
ccopy 2020 The Author(s)Computer Graphics Forum ccopy 2020 The Eurographics Association and John Wiley amp Sons Ltd
Das et al QUESTO Interactive Construction of Objective Functions for Classification Tasks
be easier and faster to use compared to command-line interfacesHere ldquofasterrdquo refers to the time it takes to specify constraints andconstruct classifiers it does not include the time needed to trainclassifiers Further we hypothesize that Auto-ML will generatemore globally accurate models given the objective function op-timizing towards a specified accuracy metric such as high cross-validation score However RQ3 tests our hypothesis that QUESTOwill be better at building models that fit specific user constraintsgiven the customized objective function thus illuminating thistradeoff between accuracy and user goals
In the literature there is no well-defined metric to measure howwell user-defined constraints are satisfied in classifier constructionThus we defined constraint satisfaction score as a metric thatcaptures how well a model attains user-specifed constraints suchas Critical Candidate etc These scores are normalized between0minus 1 (higher is better) It is expressed as (sumU
0 ωi lowast γi)U where ω
is the weight of U constraints γ is the score of each constraint U isthe total number of specified constraints in the objective function
We recruited 16 participants (7 Male 9 Female) aged between21-29 (M=25 SD=291) by inviting participants through our uni-versity mailing lists We required them to at least have a basic ex-pertise in writing python code with elementary understanding ofML All of the participants (undergraduate and graduate students)were familiar with basicintermediate data analysis using tools suchas MS Excel Tableau etc The experiment lasted 60 minutes andwe compensated each participants with a $10 Amazon gift cardThe study was conducted using a 17-inch display and a mouse
61 Study Design
We began the study with a practice session teaching users howto interact with both QUESTO and CMD (with VS Code as thescripting editor) During the practice session participants were en-couraged to ask questions to clarify uncertainty in relation to theworkflow or the interaction design We proceeded to the experi-mental sessions only when the participants felt confident in usingeach system For quantitative evaluation each participant interactedwith both QUESTO and CMD using one dataset Furthermore theorder of the interfaces (QUESTO and CMD) the datasets andthe tasks were randomized to remove any orderinglearning effectWe considered these dependent variables for quantitative analysis(1) Task completition times in specifying an objective functionthrough QUESTO or CMD (2) Model accuracy the accuracy ofthe model constructed using QUESTO CMD and Auto-ML standalone (3) Constraint satisfaction score measure to capture con-straints satisfied by the model and (4) User preference rating av-erage preference rating of Ease of Use for QUESTO and CMD
62 Datasets
For the practice session we provided a dataset of 10000 credit cardtransaction records [YL09] The data has attributes such as bill paidmonth 1 bill paid month 2 bill paid month 3 account balanceetc It was a binary classification task to predict if a bank customerwill default on a bank loan or not For the experimental sessionswe provided San Franciscorsquos employment dataset [Off] containing5000 data items for the quantitative evaluation Each row in the data
contains information about an employeersquos remuneration containingattributes such as dental benefits annual salary monthly salaryextra benefits etc The task was to predict the employeersquos depart-ment (5 classes) For the qualitative evaluation we used a moviesdataset [Mov] (5000 samples) containing attributes such as budgetgross revenue facebook likes of lead actors director cast etc Thedata has three labels for movie rating high medium and low Fol-lowing best ML practices we use multiple test datasets so that theconstructed model never sees unseen data instances
63 Tasks and Procedure
In the practice session we asked users to perform 2 tasks per inter-face The first task was to design an objective function in QUESTOby specifying a Critical constraint They were asked to iterate mul-tiple times and improve the classifiers performance by refining theconstraint The next task was to add two more constraints (Similar-ity and Candidate) to the objective function in QUESTO and iter-atively improve the classifiers performance They repeat the sametasks by writing code and using CMD to run their code to con-struct a classifier For the quantitative evaluation participants arerandomly assigned an interface (QUESTO or CMD) Participantswere encouraged to think aloud while they interact with each sys-tem The interviewer was a silent observer and was away from theparticipant to mitigate Hawthorne and Rosenthal effect during thesession Participants performed 3 tasks per interface (6 tasks total)Each of the tasks were in increasing level of difficulty
Task 1 Specify the constraint Similarity (Max time 3 minutes)Task 2 Specify Critical and Candidate (Max time 5 minutes)Task 3 Specify Critical Similarity Candidate F1-Score Preci-
sion Accuracy and Cross-Validation (Max time 7 minutes)
For the qualitative evaluation we asked participants to freely useQUESTO (may specify any constraint) to build a classifier (on themovies data) and improve its objective function score in 5 minutes
64 Data Collection
For quantitative assessment we saved log data which stores (periteration) models selected by users their learning algorithms andhyperparameters predicted class labels interacted data items user-specified constraints etc When participants completed the threetasks on both interfaces we asked them to fill a NASA-TLX form[HS88] and a post-study questionnaire with a set of likert scalequestions We asked questions to seek user preference rating to eachinterfacersquos various dimensions such as (1) Ease of use (2) Flexi-bility (3) Fun to use (4) Learnability and (5) Intuitiveness Afterthe qualitative evaluation we conducted a semi-structured interviewasking open-ended questions about the workflow system usabilityand interaction design for each interface In this interview we askedquestions such as (1) Describe your thought process while you in-teracted with QUESTO (2) Explain your experience in construct-ing an objective function interactively vs through writing code(3) How do you think we can improve the current workflow and de-sign of QUESTO We also captured video and audio of participantsscreen while they interacted with QUESTO
ccopy 2020 The Author(s)Computer Graphics Forum ccopy 2020 The Eurographics Association and John Wiley amp Sons Ltd
Das et al QUESTO Interactive Construction of Objective Functions for Classification Tasks
Figure 6 The study results comparing QUESTO with coding interfaces and Auto-ML techniques for classification tasks
65 Quantitative Analysis
For the following we used the Friedman Test for Repeated-Measures as it is a good indicator of statistical significance formulti-class classifiers with multiple datasets which may not fol-low a normal distribution as suggested by [Dem06] Furthermorewe utilised Post-hoc Wilcoxon signed-rank tests with Bonferronicorrection (new p value = 003) to test for statistical significance
Ease of use To answer RQ1 we used likert scale rating scores(5-point scale) from participants (average ease of use rating 464higher is better see Figure 6-D) The ease of use of QUESTO wassignificant across all tasks (χ2(1) = 4803 p lt 003) thus answer-ing RQ1 that QUESTO is easier to use than CMD
Task completion times Participants were significantly faster tospecify constraints in QUESTO than CMD (Figure 6-C) Every par-ticipant completed all tasks except for three who failed to completetask 3 in the allotted time using CMD In these cases we recordedthe maximum alotted time for that task Quantitatively we foundstatistically significant difference in task completion time for alltasks Task1 (χ2(1) = 160 p lt 003) Task2 (χ2(1) = 160 p lt003) and Task3 (χ2(1) = 40 p lt 003) This answered RQ1 thatQUESTO is faster to specify constraints than CMD
Model Accuracies To answer RQ2 we compared the models gen-erated using QUESTO CMD and Auto-ML with respect to theiraccuracies We found QUESTO generated similar quality modelsin relation to accuracies as produced by CMD (refer Figure 6-A)However accuracies generated by models from Auto-ML standalone were higher in comparison to QUESTO We observed sta-tistically significant difference in the model accuracy for task 1(χ2(1) = 1225 p lt 003) and task 3 (χ2(1) = 40 p lt 003)
Constraint satisfaction We found that QUESTO outperformedAuto-ML in meeting user-specified constraints for all tasks Task1(χ2(1) = 625 p lt 003) Task2 (χ2(1) = 225 p lt 003) andTask3 (χ2(1) = 90 p lt 003) This answered RQ3 We analysedthis based on data collected from the employment dataset [Off](users were given the example data items to specify as constraints)and on the movie dataset [Mov] (users freely specified constraints)
66 Qualitative Analysis
User Preferences We measured user preferences using 5-pointlikert scale rating QUESTOrsquos user preference ratings (out of 5)
were higher than CMD workflow in various aspects such as Easyof use (Q 453 CMD 322) Fun to use (Q 469 CMD 288) Learnable (Q 434 CMD 297) and Intuitive (Q 438 CMD287) (see Figure 6-D) In addition through the NASA-TLXsurvey we found that average participantsrsquo cognitive workload wassignificantly lower in QUESTO than CMD interfaces (Q 430CMD 887 out of 10 lower is better) Based on these results itis likely that participants preferred QUESTO compared to usingthe CMD interface for objective function creation However manyparticipants found CMD comparably flexible to QUESTO tospecify preferences (Q 378 CMD 352) and debug models
Easy workflow Every participant found QUESTOrsquos interface andthe workflow easy to learn and use Users liked the table view withthe ability to filter and search for specific data items as examplesfor constraint specification P03 said ldquoI like how I can mouseoveron the cells of the confusion matrix to see incorrectly predicteddata itemsrdquo P08 added ldquoI frequently brush over the feature panelto filter data items by a set of attributes I care aboutrdquo Howeverusers recommended that more advanced sorting feature in the tablewould have helped them find appropriate examples quickly
Level of Detail Some participants had elementary knowledge ofpython and ML while a few others had in-depth ML expertise P09reflected ldquoBest part of this workflow is how easy the tool makesto change my constraints in terms of weighting or ordering themwhich lets me look into a new set of classifiersrdquo While advancedML users appreciated the idea of an interactive interface to definean objective function reflected that they would prefer to look at thenumerical weights on each constraint so that they can better trusthow the modeling engine is selecting classifiers P13 said Thoughthe objective function view is very useful I am not sure if I un-derstand whatrsquos happening on the background without knowing thenumerical weights on these constraints
Meaningful constraints Participants found the constraints inQUESTO appropriate and useful for classifier construction P10added ldquoI think the constraints make a lot of sense to me When Itest models I frequently look at specific data items to verify if theclassifier modeled the data correctlyrdquo However a few participantscommented that it would help if QUESTO could recommend itemsto consider next For example P03 suggested ldquoI think you can useprediction probabilities to reflect on how confident the model is oneach prediction That may help me specify better examplesrdquo
Intuitive model selection Users found the model interpreter view
ccopy 2020 The Author(s)Computer Graphics Forum ccopy 2020 The Eurographics Association and John Wiley amp Sons Ltd
Das et al QUESTO Interactive Construction of Objective Functions for Classification Tasks
useful to compare models based on their performance on the spec-ified constraints P17 noted ldquoFrom the star plot view I can inspectthe size of the polygons to select models that performed better onrelevant constraints I would prefer to mouseover (instead of click)to browse the model output results on the table and the confusionmatricesrdquo However participants wanted to see a bookmark featureto save models they like Furthermore one participant desired tosee how each constraint contributed to a change in model output tounderstand what interaction improved performance
Task complexity The three tasks in the user study had differentlevels of complexity While task 1 and task 2 involved satisfyingonly subjective user preferences task 3 included finding modelsthat are accurate yet address constraints such as Similarity Can-didate etc Participants found task 3 more challenging as findingthe right model that is accurate and addresses their personal goalswas difficult P15 noted ldquoIt was hard to improve the classifiers per-formance when I had more than 4 constraints to specify Howeverwith QUESTO I could rapidly test different weightingsrankings tothese constraints to find an optimal classifierrdquo
Conflicting constraints We observed that participants sometimesspecified conflicting constraints For example they specified a setof data item as a Candidate constraint but in a later iteration theyspecified a subset of these data items as a Ignore constraint AsQUESTO currently does not support alerting users about conflictsin future we plan to mitigate them in objective specification
Modeling process From the study we found that QUESTOrsquosworkflow does not help users understand the underlying modelingprocess Often participants wondered what interaction in the previ-ous iteration led to the improvement or degradation in the accuracyor the objective function score Future work could make the mod-eling process more transparent and allow users to reason about theimpact of their objective specification on classifier selection
7 Discussion
User-System Feedback loop Interactive objective functions mayguide an Auto-ML model solver to select models that weigh datainstances preferentially to better support user goals For examplean objective function with the Critical constraint will guide theAuto-ML solver to prefer classifiers that correctly predict specificitems In response users may inspect a model in relation to howwell it supports the specified constraints Thus interactive objec-tive functions employ a two-way feedback loop between the userand the system for (1) communicating preferences to find suitablemodels and (2) providing a medium for understanding classifierperformance Participants confirmed that (per iteration) they vali-dated models in relation to how well they support the constraints
Tradeoff Analysis Practically in a multi-objective optimizationproblem satisfying every objective might not be feasible [SAS02]due to a plethora of reasons including conflicting constraints math-ematical infeasibility noiseoutliers in the data high dimensional-ity etc [KLTH10] Formalizing user goals as a set of constraintsin an objective function facilitates searching for a set of pareto-optimal solutions which may only satisfy a subset of the specifieduser goals Furthermore visualizing these pareto-optimal modelshelp users inspect them and understand tradeoffs
ML users often seek models that support other customizedsubjective goalsobjectives that are personal and problem-specific([KLTH10]) This study validated that while QUESTO producedslightly less accurate models than Auto-ML model solvers theymet subjective user-specified constraints We envision that userswill need to find a balance between these two extremes
71 Limitations
Scope and assumptions of the user study In the study we timedeach task to ensure the study can be completed within a reasonabletime However in more realistic settings optimizing for (or lim-iting) time may not be meaningful Further we used pre-definedhyperameters within which Hyperopt sampled values to constructclassifiers The study results may vary if the set of hyperparametersused are different Also our study only included participants withbasic expertise of python and ML
Model overfitting Good ML practices entail that trained modelshave no knowledge of test data In QUESTO we follow the sameprocess The test data view in the data table allows users to inspectclassifiers by reviewing the predictions made at the data instancelevel Furthermore by specifying the objectives Train-objectivesand (and weighting them) users can control for model overfit-ting Nevertheless we are aware that if users do not specify theymay produce overfitted models However this may be the case forcommand-line classifier construction as well if addition of regular-izers or cross-validation approaces are not used
Scalability The current UI design is based on datasets of mod-est size Thus there are aspects of the UI that would become lessusable if datasets grew larger For example while the table viewsupports sorting and filtering the fundamental design of showingitems in a table may make finding individual relevant data itemschallenging However for larger datsets we can augment QUESTOwith visualisations that can aggregate data and show example dataitems on demand (eg grouped heatmap view etc)
8 Conclusion
In this paper we present a design space of constraints categorizingvarious user goals for a classification task Grounded in this designspace we developed a prototype system QUESTO that supports in-teractive construct of objective functions to specify their subjectivepreferences to a classifier Finally we validate the effectiveness ofQUESTO by a within-subject user study that proved that QUESTOis easier and faster to use than conventional command line alterna-tives We also demonstrate that while QUESTO produces slightlyless accurate classifiers than Auto-ML it produces models that bet-ter satisfy user-specified constraints This presents a step towardsunderstanding how to integrate people into Auto-ML processes
9 Acknowledgements
Support for the research is partially provided by DARPA FA8750-17-2-0107 DARPA FA8750-17-2-010 NSF 1841349 and NSFIIS-1452977 The views and conclusions contained in this doc-ument are those of the authors and should not be interpreted asrepresenting the official policies either expressed or implied ofthe US Government
ccopy 2020 The Author(s)Computer Graphics Forum ccopy 2020 The Eurographics Association and John Wiley amp Sons Ltd
Das et al QUESTO Interactive Construction of Objective Functions for Classification Tasks
References[ACKK14] AMERSHI S CAKMAK M KNOX W B and KULESZA
T ldquoPower to the people The role of humans in interactive machine learn-ingrdquo AI Magazine 354 (2014) 105ndash120 2
[AF18] AHAMED F and FARID F ldquoApplying Internet of Things andMachine-Learning for Personalized Healthcare Issues and Challengesrdquo2018 International Conference on Machine Learning and Data Engi-neering (iCMLDE) 2018 19ndash21 DOI 101109iCMLDE201800014 3
[AFKT11] AMERSHI S FOGARTY J KAPOOR A and TAN D SldquoEffective End-User Interaction with Machine Learningrdquo AAAI 2011 3
[BGV16] BOUALI F GUETTALA A and VENTURINI G ldquoVizAssistAn Interactive User Assistant for Visual Data Miningrdquo Vis Comput3211 (Nov 2016) 1447ndash1463 ISSN 0178-2789 DOI 10 1007 s00371- 015- 1132- 9 URL httpdxdoiorg101007s00371-015-1132-9 2
[BLBC12] BROWN E T LIU J BRODLEY C E and CHANGR ldquoDis-function Learning distance functions interactivelyrdquo 2012IEEE Conference on Visual Analytics Science and Technology (VAST)2012 83ndash92 DOI 101109VAST20126400486 2
[BM17] BIRAN O and MCKEOWN K ldquoHuman-centric Justification ofMachine Learning Predictionsrdquo Proceedings of the 26th InternationalJoint Conference on Artificial Intelligence IJCAIrsquo17 Melbourne Aus-tralia AAAI Press 2017 1461ndash1467 ISBN 978-0-9992411-0-3 3
[BNHL14] BRADEL L NORTH C HOUSE L and LEMAN S ldquoMulti-model semantic interaction for text analyticsrdquo 2014 IEEE Conference onVisual Analytics Science and Technology (VAST) 2014 163ndash172 DOI101109VAST20147042492 2
[BYC13] BERGSTRA J YAMINS D and COX D D ldquoHyperopt Apython library for optimizing the hyperparameters of machine learn-ing algorithmsrdquo Proceedings of the 12th Python in Science Conference2013 13ndash20 3
[BZSA17] BERNARD J ZEPPELZAUER M SEDLMAIR M andAIGNER W ldquoA Unified Process for Visual-Interactive Labelingrdquo Euro-Vis Workshop on Visual Analytics (EuroVA) Ed by S MICHAEL and TCHRISTIAN The Eurographics Association 2017 ISBN 978-3-03868-042-0 DOI 102312eurova20171123 3
[CAK17] CHANG J C AMERSHI S and KAMAR E ldquoRevolt Collab-orative Crowdsourcing for Labeling Machine Learning Datasetsrdquo Pro-ceedings of the 2017 CHI Conference on Human Factors in ComputingSystems CHI rsquo17 Denver Colorado USA ACM 2017 2334ndash2346ISBN 978-1-4503-4655-9 DOI 10 1145 3025453 3026044URL httpdoiacmorg10114530254533026044 3
[CB15] CHENG J and BERNSTEIN M S ldquoFlock Hybrid Crowd-Machine Learning Classifiersrdquo Proceedings of the 18th ACM Confer-ence on Computer Supported Cooperative Work amp38 Social Comput-ing CSCW rsquo15 Vancouver BC Canada ACM 2015 600ndash611 ISBN978-1-4503-2922-4 DOI 10114526751332675214 3 4
[CES09] CRAMER H S M EVERS V S VAN et al ldquoAwarenessTraining and Trust in Interaction with Adaptive Spam Filtersrdquo Proceed-ings of the SIGCHI Conference on Human Factors in Computing Sys-tems CHI rsquo09 Boston MA USA ACM 2009 909ndash912 ISBN 978-1-60558-246-7 DOI 10114515187011518839 3
[CFEC17] CROUSER R J FRANKLIN L ENDERT A and COOK KldquoToward theoretical techniques for measuring the use of human effort invisual analytic systemsrdquo IEEE transactions on visualization and com-puter graphics 231 (2017) 121ndash130 3
[CHH19] CASHMAN D HUMAYOUN S F HEIMERL F et al ldquoAUser-based Visual Analytics Workflow for Exploratory Model Analy-sisrdquo Computer Graphics Forum 383 (2019) 185ndash199 DOI 101111cgf13681 3
[CW18] CHEN M and WANG H ldquoHow Personal Experience and Techni-cal Knowledge Affect Using Conversational Agentsrdquo Proceedings of the23rd International Conference on Intelligent User Interfaces Compan-ion IUI rsquo18 Companion Tokyo Japan ACM 2018 531ndash532 ISBN978-1-4503-5571-1 DOI 10114531803083180362 3
[DCCE18] DAS S CASHMAN D CHANG R and ENDERT AldquoBEAMES Interactive Multi-Model Steering Selection and Inspec-tion for Regression Tasksrdquo Symposium on Visualization in Data Sci-ence(VDS) Berlin Germany 2018 3
[Dem06] DEMŠAR JANEZ ldquoStatistical Comparisons of Classifiers overMultiple Data Setsrdquo J Mach Learn Res 7 (Dec 2006) 1ndash30 ISSN1532-4435 9
[EBN13] ENDERT ALEX BRADEL LAUREN and NORTH CHRIS ldquoBe-yond Control Panels Direct Manipulation for Visual Analyticsrdquo IEEEComputer Graphics and Applications 334 (2013) 6ndash13 ISSN 0272-1716 DOI 101109MCG201353 2
[EFN12] ENDERT A FIAUX P and NORTH C ldquoSemantic Interactionfor Visual Text Analyticsrdquo Proceedings of the SIGCHI Conference onHuman Factors in Computing Systems CHI rsquo12 Austin Texas USAACM 2012 473ndash482 ISBN 978-1-4503-1015-4 DOI 10 1145 22076762207741 2
[EHM11] ENDERT A HAN CHAO MAITI D et al ldquoObservation-level Interaction with Statistical Models for Visual Analyticsrdquo IEEEVAST 2011 121ndash130 2
[EIZ13] ESCUDERO J IFEACHOR E ZAJICEK J P et al ldquoMachineLearning-Based Method for Personalized and Cost-Effective Detectionof Alzheimerrsquos Diseaserdquo IEEE Transactions on Biomedical Engineer-ing 601 (2013) 164ndash168 ISSN 0018-9294 DOI 101109TBME20122212278 3
[EW16] EIBE F MARK A H and W IAN H The WEKA WorkbenchOnline Appendix for Data Mining Practical Machine Learning Toolsand Techniques 2016 3
[FKE15] FEURER M KLEIN A EGGENSPERGER K et al ldquoEfficientand robust automated machine learningrdquo Advances in Neural Informa-tion Processing Systems 2015 2962ndash2970 3
[GFT16] GILLIES M FIEBRINK R TANAKA A et al ldquoHuman-Centred Machine Learningrdquo Proceedings of the 2016 CHI ConferenceExtended Abstracts on Human Factors in Computing Systems CHI EArsquo16 San Jose California USA ACM 2016 3558ndash3565 ISBN 978-1-4503-4082-3 DOI 10114528515812856492 3
[GLG13] G SAMUEL L ALEXANDER G NILS et al ldquoLineUp Vi-sual Analysis of Multi-Attribute Rankingsrdquo IEEE Transactions on Vi-sualization and Computer Graphics (InfoVis rsquo13) 1912 (2013) 2277ndash2286 DOI 101109TVCG2013173 2
[H99] H MARK A Correlation-based Feature Selection for MachineLearning Tech rep 1999 4
[Hol16] HOLZINGER A ldquoInteractive machine learning for health infor-matics when do we need the human-in-the-looprdquo Brain Informatics32 (2016) 119ndash131 ISSN 2198-4026 DOI 101007s40708-016-0042-6 3
[HS88] H SANDRA G and S LOWELL E ldquoDevelopment of NASA-TLX (Task Load Index) Results of Empirical and Theoretical Re-searchrdquo Human Mental Workload Ed by H PETER A and M NA-JMEDIN Vol 52 Advances in Psychology North-Holland 1988 139 ndash183 DOI httpsdoiorg101016S0166-4115(08)62386-9 8
[HY16] HE Z and YEN G G ldquoVisualization and Performance Metricin Many-Objective Optimizationrdquo IEEE Transactions on EvolutionaryComputation 203 (2016) 386ndash402 ISSN 1089-778X DOI 101109TEVC20152472283 3
[HY17] HE Z and YEN G G ldquoComparison of visualization approachesin many-objective optimizationrdquo 2017 IEEE Congress on EvolutionaryComputation (CEC) 2017 357ndash363 DOI 101109CEC20177969334 3
ccopy 2020 The Author(s)Computer Graphics Forum ccopy 2020 The Eurographics Association and John Wiley amp Sons Ltd
Das et al QUESTO Interactive Construction of Objective Functions for Classification Tasks
[JZF09] JEONG D H ZIEMKIEWICZ C FISHER B et al ldquoiPCA AnInteractive System for PCA-based Visual Analyticsrdquo Computer Graph-ics Forum Vol 28 3 Wiley Online Library 2009 767ndash774 2
[KBE14] KOMER B BERGSTRA J and ELIASMITH C ldquoHyperopt-sklearn automatic hyperparameter configuration for scikit-learnrdquo ICMLworkshop on AutoML 2014 2 3 5
[KBS11] KULESZA T BURNETT M STUMPF S et al ldquoWhere AreMy Intelligent Assistantrsquos Mistakes A Systematic Testing ApproachrdquoProceedings of the Third International Conference on End-user Develop-ment IS-EUDrsquo11 Torre Canne Italy Springer-Verlag 2011 171ndash186ISBN 978-3-642-21529-2 3
[KCPE16] KIM H CHOO J PARK H and ENDERT A ldquoInterAxisSteering scatterplot axes via observation-level interactionrdquo IEEE trans-actions on visualization and computer graphics 221 (2016) 131ndash140 2
[KDJH08] KRESIMIR M DENIS G JELOVIC M and H HELWIGldquoInteractive Visual Steering ndash Rapid Visual Prototyping of a CommonRail Injection Systemrdquo IEEE Transactions on Visualization and Com-puter Graphics 146 (Nov 2008) URL httpswwwcgtuwienacatresearchpublications2008Matkovic-2008-Steer 2
[KEV18] KWON B C EYSENBACH B VERMA J et al ldquoCluster-vision Visual Supervision of Unsupervised Clusteringrdquo IEEE Transac-tions on Visualization and Computer Graphics 241 (2018) 142ndash151ISSN 1077-2626 DOI 101109TVCG20172745085 3
[KKW17] KWON B C KIM H WALL E et al ldquoAxiSketcher In-teractive Nonlinear Axis Mapping of Visualizations through User Draw-ingsrdquo IEEE Trans Vis Comput Graph 231 (2017) 221ndash230 2
[KLTH10] KAPOOR A LEE B TAN D and HORVITZ E ldquoInteractiveOptimization for Steering Machine Classificationrdquo Proceedings of theSIGCHI Conference on Human Factors in Computing Systems CHI rsquo10Atlanta Georgia USA ACM 2010 1343ndash1352 ISBN 978-1-60558-929-9 DOI 10114517533261753529 2 3 10
[KPB14] KRAUSE J PERER A and BERTINI E ldquoINFUSE Interac-tive Feature Selection for Predictive Modeling of High DimensionalDatardquo IEEE Transactions on Visualization and Computer Graphics2012 (2014) 1614ndash1623 ISSN 1077-2626 DOI 101109TVCG20142346482 4
[KPHH11] KANDEL S PAEPCKE A HELLERSTEIN J and HEERJ ldquoWrangler Interactive Visual Specification of Data TransformationScriptsrdquo ACM Human Factors in Computing Systems (CHI) 2011 2
[KTD17] KIM S TASSE D and DEY A K ldquoMaking Machine-Learning Applications for Time-Series Sensor Data Graphical and In-teractiverdquo ACM Trans Interact Intell Syst 72 (July 2017) 81ndash830ISSN 2160-6455 DOI 1011452983924 3
[KTH16] KOTTHOFF L THORNTON C HOOS H H et al ldquoAuto-WEKA 20 Automatic model selection and hyperparameter optimiza-tion in WEKArdquo Journal of Machine Learning Research 17 (2016) 1ndash5 3
[LHM13] LEMAN S C HOUSE L MAITI D et al ldquoVisual to para-metric interaction (v2pi)rdquo PloS one 83 (2013) e50474 2
[LSL17] LIU M SHI J LI Z et al ldquoTowards Better Analysis of DeepConvolutional Neural Networksrdquo IEEE Transactions on Visualizationand Computer Graphics 231 (2017) 91ndash100 ISSN 2160-9306 DOI101109TVCG20162598831 3
[LWLZ17] LIU S WANG X LIU M and ZHU J ldquoTowards betteranalysis of machine learning models A visual analytics perspectiverdquoVisual Informatics 11 (2017) 48 ndash56 ISSN 2468-502X DOI httpsdoiorg101016jvisinf201701006 4
[LYL14] LI M YANG S and LIU X ldquoDiversity Comparison of ParetoFront Approximations in Many-Objective Optimizationrdquo IEEE Transac-tions on Cybernetics 4412 (2014) 2568ndash2584 ISSN 2168-2267 DOI101109TCYB20142310651 3
[MLa] ML BIG Big ML httpsbigmlcom Accessed March20 2019 3
[MLb] ML SCIKIT LEARN Scikit Learn Model Metrics API Refer-ence httpsscikit- learnorgstablemodulesclasseshtmlmodule-sklearnmetrics Accessed March20 2019 5 6
[MLY17] MIQING L LIANGLI Z and Y XIN ldquoHow to Read Many-Objective Solution Sets in Parallel Coordinatesrdquo CoRR abs170500368(2017) 3
[Mov] Movies Dataset howpublished = https www kaggle comcarolzhangdcimdb-5000-movie-datasetmovie_metadatacsv note = Accessed 2018-12-11 8 9
[NKHK17] NUSHI B KAMAR E HORVITZ E and KOSSMANN DldquoOn Human Intellect and Machine Failures Troubleshooting IntegrativeMachine Learning Systemsrdquo Proceedings of the Thirty-First AAAI Con-ference on Artificial Intelligence AAAIrsquo17 San Francisco CaliforniaUSA AAAI Press 2017 1017ndash1025 3
[Off] OFFICE THE SAN FRANCISCO CONTROLLERrsquoS Employee Com-pensation Data https data sfgov org City -Management - and - Ethics Employee - Compensation 88g8-5mnd Accessed March 15 2019 7ndash9
[PBD10] PATEL K BANCROFT N DRUCKER S M et al ldquoGestaltIntegrated Support for Implementation and Analysis in Machine Learn-ingrdquo Proceedings of the 23Nd Annual ACM Symposium on User In-terface Software and Technology UIST rsquo10 New York New YorkUSA ACM 2010 37ndash46 ISBN 978-1-4503-0271-5 DOI 10114518660291866038 2
[PPJ07] PAPARIZOS S PATEL J M and JAGADISH HV ldquoSIGOPTUsing schema to optimize XML query processingrdquo Data Engineer-ing 2007 ICDE 2007 IEEE 23rd International Conference on IEEE2007 1456ndash1460 3
[PSTW16] PAJER S STREIT M TORSNEY-WEIR T et alldquoWeightLifter Visual Weight Space Exploration for Multi-Criteria De-cision Makingrdquo IEEE Transactions on Visualization and ComputerGraphics (2016) 2
[RAL17] REN D AMERSHI S LEE B et al ldquoSquares Support-ing Interactive Performance Analysis for Multiclass Classifiersrdquo IEEETransactions on Visualization and Computer Graphics 231 (2017) 61ndash70 ISSN 1077-2626 DOI 101109TVCG20162598828 3
[RHY14] REN D HOumlLLERER T and YUAN X ldquoiVisDesigner Expres-sive Interactive Design of Information Visualizationsrdquo IEEE Transac-tions on Visualization and Computer Graphics 2012 (2014) 2092ndash2101ISSN 1077-2626 DOI 101109TVCG20142346291 2
[RLD18] RUDOVIC O LEE J DAI M et al ldquoPersonalized machinelearning for robot perception of affect and engagement in autism ther-apyrdquo Science Robotics 319 (2018) DOI 101126sciroboticsaao6760 3
[RSG16] RIBEIRO M T SINGH S and GUESTRIN C ldquoWhy ShouldI Trust You Explaining the Predictions of Any Classifierrdquo Proceed-ings of the 22Nd ACM SIGKDD International Conference on KnowledgeDiscovery and Data Mining KDD rsquo16 San Francisco California USAACM 2016 1135ndash1144 ISBN 978-1-4503-4232-2 DOI 10114529396722939778 2ndash4
[SAS02] SARAVANAN R ASOKAN P and SACHIDANANDAM M ldquoAmulti-objective genetic algorithm (GA) approach for optimization of sur-face grinding operationsrdquo International Journal of Machine Tools andManufacture 4212 (2002) 1327 ndash1334 ISSN 0890-6955 DOI httpsdoiorg101016S0890-6955(02)00074-3 10
[SC11] SAHU R and CHATURVEDI A K ldquoMany-Objective Comparisonof Twelve Grid Scheduling Heuristicsrdquo 2011 3
[SHB14] SEDLMAIR M HEINZL C BRUCKNER S et al ldquoVisualParameter Space Analysis A Conceptual Frameworkrdquo IEEE Transac-tions on Visualization and Computer Graphics 2012 (2014) 2161ndash2170ISSN 1077-2626 DOI 101109TVCG20142346321 2
ccopy 2020 The Author(s)Computer Graphics Forum ccopy 2020 The Eurographics Association and John Wiley amp Sons Ltd
Das et al QUESTO Interactive Construction of Objective Functions for Classification Tasks
[SKBE17] SAKET B KIM H BROWN E T and ENDERT A ldquoVi-sualization by Demonstration An Interaction Paradigm for Visual DataExplorationrdquo IEEE Transactions on Visualization and Computer Graph-ics 231 (2017) 331ndash340 ISSN 1077-2626 DOI 101109TVCG20162598839 2
[SLT17] SUN Y LANK E and TERRY M ldquoLabel-and-Learn Visu-alizing the Likelihood of Machine Learning Classifierrsquos Success Dur-ing Data Labelingrdquo Proceedings of the 22Nd International Confer-ence on Intelligent User Interfaces IUI rsquo17 Limassol Cyprus ACM2017 523ndash534 ISBN 978-1-4503-4348-0 DOI 10114530251713025208 3
[SRL07] STUMPF S RAJARAM V LI L et al ldquoToward HarnessingUser Feedback for Machine Learningrdquo Proceedings of the 12th Inter-national Conference on Intelligent User Interfaces IUI rsquo07 HonoluluHawaii USA ACM 2007 82ndash91 ISBN 1-59593-481-2 DOI 10 114512162951216316 2
[SRL09] STUMPF S RAJARAM V LI L et al ldquoInteracting Mean-ingfully with Machine Learning Systems Three Experimentsrdquo Int JHum-Comput Stud 678 (Aug 2009) 639ndash662 ISSN 1071-5819 DOI101016jijhcs200903004 3
[SSZ17] S DOMINIK S MICHAEL Z LEISHI et al ldquoWhat you see iswhat you can change Human-centered machine learning by interactivevisualizationrdquo Neurocomputing 268 (2017) 164ndash175 3
[TCWM18] T LI CONVERTINO G WANG W and MOST H ldquoHyper-Tuner Visual Analytics for Hyperparameter Tuning by ProfessionalsrdquoMachine Learning from User Interaction for Visualization and Analyt-ics IEEE VIS 2018 (2018) 3
[TDCF07] TULLIO J DEY A K CHALECKI J and FOGARTY JldquoHow It Works A Field Study of Non-technical Users Interacting withan Intelligent Systemrdquo Proceedings of the SIGCHI Conference on Hu-man Factors in Computing Systems CHI rsquo07 San Jose CaliforniaUSA ACM 2007 31ndash40 ISBN 978-1-59593-593-9 DOI 10114512406241240630 3
[THHLB13] THORNTON C HUTTER F HOOS H H and LEYTON-BROWN K ldquoAuto-WEKA Combined selection and hyperparameter op-timization of classification algorithmsrdquo Proceedings of the 19th ACMSIGKDD international conference on Knowledge discovery and datamining ACM 2013 847ndash855 3
[TLB11] TAMUZ O LIU C BELONGIE S et al ldquoAdaptively Learn-ing the Crowd Kernelrdquo Proceedings of the 28th International Con-ference on International Conference on Machine Learning ICMLrsquo11Bellevue Washington USA Omnipress 2011 673ndash680 ISBN 978-1-4503-0619-5 2ndash4
[TLKT09] TALBOT J LEE B KAPOOR A and TAN D S ldquoEnsem-bleMatrix interactive visualization to support machine learning withmultiple classifiersrdquo CHI Ed by JR DAN R OLSEN ARTHURRICHARD B HINCKLEY KEN et al ACM 2009 1283ndash1292 ISBN978-1-60558-246-7 2
[VDEW11] VAN DEN ELZEN S and van WIJK J J ldquoBaobabview In-teractive construction and analysis of decision treesrdquo Visual Analyt-ics Science and Technology (VAST) 2011 IEEE Conference on IEEE2011 151ndash160 2 4
[WEF13] WALKER D J EVERSON R and FIELDSEND J E ldquoVisu-alizing Mutually Nondominating Solution Sets in Many-Objective Op-timizationrdquo Trans Evol Comp 172 (Apr 2013) 165ndash184 ISSN 1089-778X DOI 101109TEVC20122225064 3
[WFE12] WALKER D FIELDSEND J and EVERSON R ldquoVisualisingMany-objective Populationsrdquo Proceedings of the 14th Annual Confer-ence Companion on Genetic and Evolutionary Computation GECCOrsquo12 Philadelphia Pennsylvania USA ACM 2012 451ndash458 ISBN 978-1-4503-1178-6 DOI 10114523307842330853 3
[WLDW01] WOLFMAN S A LAU T DOMINGOS P and WELDD S ldquoMixed Initiative Interfaces for Learning Tasks SMARTeditTalks Backrdquo Proceedings of the 6th International Conference on Intel-ligent User Interfaces IUI rsquo01 Santa Fe New Mexico USA ACM2001 167ndash174 ISBN 1-58113-325-1 DOI 10 1145 359784 360332 3
[WN17] WENSKOVITCH J and NORTH C ldquoObservation-Level Inter-action with Clustering and Dimension Reduction Algorithmsrdquo Pro-ceedings of the 2Nd Workshop on Human-In-the-Loop Data AnalyticsHILDArsquo17 Chicago IL USA ACM 2017 141ndash146 ISBN 978-1-4503-5029-7 DOI 10114530772573077259 2
[YL09] YEH I and LIEN C ldquoThe comparisons of data mining tech-niques for the predictive accuracy of probability of default of credit cardclientsrdquo Expert Systems with Applications 362 Part 1 (2009) 2473 ndash2480 ISSN 0957-4174 DOI httpsdoiorg101016jeswa200712020 8
[YSCR18] YANG Q SUH J CHEN N and RAMOS G ldquoGroundingInteractive Machine Learning Tool Design in How Non-Experts ActuallyBuild Modelsrdquo ACM 2018 2 3
[ZSZR18] Z XIAOJIN SINGLA A ZILLES S and RAFFERTY A NldquoAn Overview of Machine Teachingrdquo CoRR abs180105927 (2018) 23
ccopy 2020 The Author(s)Computer Graphics Forum ccopy 2020 The Eurographics Association and John Wiley amp Sons Ltd
Das et al QUESTO Interactive Construction of Objective Functions for Classification Tasks
Figure 2 QUESTO coupled with an Auto-ML optimizer - Hyper-opt translates user interactions into objective function terms
1 Introduction
Objective functions serve a crucial role in traditional machinelearning (ML) tasks such as classification ML models are drivenby the design of these objective functions which are solved toattain desired goals They act as the mathematical expressionof preferences goals and constraints that ML pipelines shouldtake into consideration when learning from training data to createmodels For example in a classification task an objective functionmay specify that the model should perform well on chosen classlabels or may require a model to get certain data instances (rows inthe data) correct or may include regularizers to create generalisablemodels ML practitioners often create and edit objective functionsspecifying feedback to ML processes to achieve desired goals suchas a model with a high test accuracy or creating a fair classifier
When objective functions are made interactive they can serve asthe medium through which people can directly communicate theirdomain expertise preferences and other relevant information tothe system However specification of such intricate objective func-tions is difficult for users who do not have programming or MLexpertise For instance creating custom objective functions requiretranslating onersquos preferences goals and constraints into mathemat-ical expressions by writing code To support interaction with objec-tive functions we need interactive visual interfaces which can helpusers who seek to construct ML models expressively communi-cate their preferences or intents to the underlying models Even forexpert ML users (who can write code) interactive construction ofobjective functions can help them rapidly test various forms of ob-jectives to find optimal models that suits their goals
There are numerous constraints or specifications that can beadded to objective functions For example in a classification taska user might prefer models which correctly predict specific datainstances [RSG16] (data instances are rows in a tabular data) Fur-thermore users might expect to see similar data instances placed inthe same class [KLTH10 TLB11] remove data instances whichare noiseoutliers [TLKT09] etc Based on a literature review ofprevious work focused on interactive construction of ML models(eg [ZSZR18 RSG16 YSCR18 KLTH10]) we investigated thedesign space of such constraints
In this paper we present a prototype visual analytic (VA) sys-tem called QUESTO that translates user interactions with data intoobjective functions for classification QUESTO facilitates interac-tive construction of a classifier by allowing users to formulate theirpreferences as an objective function while they explore and interact
with a tabular dataset QUESTO visualizes the underlying objec-tive function to help users understand their specified goals and con-straints Furthermore through iterative interactions with the datathe user can refine the specified constraints and the objective func-tion to find a model that correctly characterises the data The re-sulting user-defined multi-objective objective function can be usedwith Auto-ML optimizers (such as Hyperopt [KBE14]) to guideand facilitate the construction of classification models (see Fig-ure 2) with the advantage of users being able to specify domain-specific constraints and objectives
In addition we present the findings of a within-subjects userstudy In this study we compared QUESTO with traditional com-mand line workflows (CMD) that allow construction of classifiersand objective functions by writing code and with stand alone Auto-ML Our study showed that (1) QUESTO is easier and faster touse than CMD workflows to specifytest several objective functionsto classifiers and (2) Although QUESTO generates models whichare slightly less accurate than models from stand alone Auto-MLthese models outperform Auto-ML in attaining user-specified con-straints Furthermore we seek qualitative participant feedback tounderstand their response on QUESTOrsquos interfaceinteraction de-sign and usability issues to further improve interactive construc-tion of objective functions Our contributions are
bull A design space of constraint specification derived from priorwork which categorizes various user goals for a classifierbull A prototype VA tool QUESTO for interactive objective func-
tion construction for classification tasksbull A user study evaluating how people specify objective functions
with QUESTO compared to writing them with code as well ascompared to existing Auto-ML approaches
2 Related Work
21 Visual Analytics for Interactive Machine Learning
Many visual analytics systems incorporate demonstration-basedinteractions to adjust underlying models [BNHL14 EFN12LHM13 EHM11 EBN13 GLG13] Demonstration-based in-teractions allow users to directly manipulate on-screen visual datarepresentations to adjust models without the need to write codeor adjust widgets in a control panel [BNHL14] These visual in-terfaces have helped researchers discover novel workflows in in-teractive machine learning to assist users to build models alignedwith their goals For example Gestalt [PBD10] showed the inte-gration of ML with traditional software development workflowsTheir system implemented a classification model pipeline helpingusers in model construction and analysis Other similar VA systemsinclude [BGV16 RHY14 KPHH11 EFN12 SKBE17 KDJH08KLTH10 TLKT09 SRL07] A complete overview of this inter-active process is discussed by Amershi et al [ACKK14]
VA systems use explicit user interactions to specify param-eters of underlying models These interaction techniques haveproven useful in various domains of ML (other than classi-fiers [VDEW11]) such as clustering [WN17] dimensional re-duction [KCPE16 KKW17 EHM11 JZF09] metric learning[BLBC12] etc Recent work utilised multiple ML models to satisfyuser preferences [SHB14 PSTW16] For example Hypertuner
ccopy 2020 The Author(s)Computer Graphics Forum ccopy 2020 The Eurographics Association and John Wiley amp Sons Ltd
Das et al QUESTO Interactive Construction of Objective Functions for Classification Tasks
[TCWM18] and BEAMES [DCCE18] allowed tuning hyperparam-eters of multiple regression models to support user goals Cluster-vision enabled exploring multiple cluster models to analyze the fit-ness based on metrics such as Silhouette Coefficient [KEV18]
In general these current VA tools interactively adjust ML modelsbased on a pre-defined objective function (by ML practitioners orsystem developers) which users often cannot adjust or view Suchtools do not allow users to interactively design an objective functionthat seeks to adjust the behavior of ML models or select modelsthat better suits the specified constraints Rather user interaction inthese tools is interpreted as changing feature weights or adjustingvalues of model parameters for model steering Instead this paperexplores how people can interact with objective functions
Past researchers have looked at human-in-the-loop based MLprocesses [AFKT11 BZSA17 BM17 KBS11 GFT16 KTD17]where they showed human contribution in ML processes in vari-ous ways For example the system Label-and-Learn facilitated auser-guided labeling process in ML using interactive visualizationtechniques [SLT17] Squares showed humans interactively debug-ging ML models [RAL17] Liu et al showed an interactive systemcalled CNNVis that helps ML experts debug diagnose and fur-ther improve CNN models [LSL17] Sacha et al have examinedvarious VA systems to discover that users evaluate models by aplethora of measures including conventional metrics such as ac-curacy and cost as well as novel criteria such as unexpectedness[SSZ17] Holzinger et al have claimed that in cases of insuffi-cient training data ML problems are often NP-hard which can besolved by interactive ML-based solutions using a domain-expertuserrsquos input [Hol16] To increase human input crowd-sourcing isa new avenue in human-machine collaboration [CFEC17] Crowdworkers perform various tasks such as cleantransform data ano-tateadd labels etc Novel techniques have improved the reliabilityof having crowd workers be part of conventional ML pipelines asshown in [CAK17 NKHK17 CB15 SRL09 WLDW01]
22 Auto-ML Systems
Conventional ML pipeline requires selecting an appropriate learn-ing algorithm and finding an optimal combination of hyperparam-eters to construct a model Evidently this workflow is not suitablefor novice ML users who otherwise rely on GUI based tools suchas WEKA [EW16] To help novices construct better ML modelsnew tools are developed in the space of automated ML or Auto-MLsuch as Auto Weka [THHLB13 KTH16] BigML [MLa] SigOpt[PPJ07] Hyperopt [BYC13 KBE14] Snowcat [CHH19] andAUTO-SKLEARN [FKE15] Holzinger et al explored Auto-MLbased workflows in various domains to further confirm the useful-ness of such systems [Hol16] While useful these tools are limitedto optimize ML models based on conventional metrics such as Pre-cision or Recall Users cannot specify constraints or metrics thatare more meaningfuluseful to them In this paper we seek to createa novel technique to incorporate domain expertise and userrsquos sub-jective preferences in model construction selection and evaluation
23 Visualizing Objective Functions and Solutions
Various techniques have been used to visualize solution sets froman objection function space such as MDS RadViz bubble chartparallel coordinates self organizing map etc [HY17] Further Heet al proposed a new visualization technique to map solutions froma high-dimensional objective space to a 2D polar coordinate plotTheir method helped a user to understand tradeoffs between ob-jectives and find desirable solutions [HY16] Sahu et al showedthe use of a radar chart to visualize many-objective solution spaces[SC11] Walker et al visualized a set of mutually non-dominatingsolutions using Radviz to show multi-objective solutions and intro-duced techniques to measure the similarity of non-dominating so-lutions [WEF13 WFE12] Many researchers have looked at mea-sures to assess the diversity of pareto-optimal solutions in multi-objective optimization problems [MLY17 LYL14] In QUESTOwe leverage these techniques to visualize solutions to a multi-objective objective function However the focus of our work is noton the visualization of the solution spaces but in helping users ex-press their analysis intent through objective functions
24 User PreferencesModeling
ML users solve various problems which are context dependentand personal [AF18] eg interaction with robots in a hospital[RLD18 EIZ13] Diverse problem scenarios create an opportu-nity to specify a diverse set of user preferences These preferencesare the building blocks to construct an objective function We stud-ied the literature to understand what kind of specifications userscan provide to construct a classifier [ZSZR18 YSCR18 CW18CES09 TDCF07] Kapoor et al discussed often users have torely on the overall classification accuracy of predictive models in-stead of relying on predictions generated by marginal models Thisoften leads to a bad model selection [KLTH10] Zhu et al de-scribed the machine teaching paradigm where a machine teacher(usually a domain expert) shows informative data instances of pos-itive and negative class labels to maximize the distance between theclasses [ZSZR18]
Lime a submodular optimization technique helped usersinterpret models by explaining the prediction of a classifier on aset of relevant data instances [RSG16] This showed the relevanceof a modelrsquos performance on a specific subset of data items thatthe users care about Tamuz et al showed an adaptive algorithmthat estimated a similarity matrix from human judgments basedon comparisons of triples [TLB11] Applying the same ideologyin classification tasks users can specify data instances that aresimilar and should be predicted to be in the same class label Thesystem Flock asked crowd workers to define the reason behind apair of instances to be in a positive class and vice versa [CB15]Kapoor et al discussed if users can understand the model behaviorthey can assess the possible next moves to adjust the model further[KLTH10] For example users can evaluate if models correctlypredict similar data instances in the same class label If these arenot in the same class users may provide additional examples torefine the model These pioneer works in the literature inspiredus to help users define their measure of success in a classifierconstruction process through interactive objective functions
ccopy 2020 The Author(s)Computer Graphics Forum ccopy 2020 The Eurographics Association and John Wiley amp Sons Ltd
Das et al QUESTO Interactive Construction of Objective Functions for Classification Tasks
3 Design space of objectives and constraints
We define objectives as a component or a function term of a multi-objective objective function These objectives are also referred to asuser preferences goals subjective requirements etc in the paperNext each of these objectives may have constraints For example auser may have an objective of finding a highly performant modelA constraint can be the accuracy be calculated using precision re-call or F1-score metrics Similarly another objective could be thatthe classifier performs better on hand-chosen data instances In thisobjective one constraint may be that it labels similar data instances(specified by the user) in the same class label
We analyzed 61 papers from visual analytics and interactive ma-chine learning areas which included 18 VA systems to formulatea set of objectives and their respective constraints for a classifica-tion task (dagger) Using an affinity diagramming approach we clusteredsimilar papers and VA systems with similar interactive constraintsFurther we iteratively refined these until we were satisfied withthe relationships between the clusters For example based on theliterature we derived constraints such as Critical that representsdata instances which users find important to be correctly predictedCandidate that captures data instances which are strong represen-tatives of a class label (and not necessarily Critical) Finally wederived 15 constraints users can define organized into 4 objectivecategories for a classification task Instance-based Feature-basedTrain-objectives and Test-objectives described below
31 Instance-based
This objective allows users to specify that the classifier should per-form well on a set of data instances While many of the constraintsin this section involve adjusting weights on specified data instanceswe categorized them separately based on how they are revealed inthe user interface and the user task supported
Similarity This constraint captures the degree of similarity (or dif-ference) between data items A user specifies a set of similar datainstances and expects them to be predicted in the same class labelUsers can also specify pairs of data items to be predicted in dif-ferent classes However in both cases (ldquosimilarrdquo and ldquodifferentrdquo)users do not specify the class in which the specified data instancesshould be placed There are various VA systemstechniques wheresimilarity and difference between data samples was sought fromusers to construct models For example Tamuz et al discussed asimilarity matrix to infer if an object rdquoArdquo is similar to rdquoBrdquo or rdquoCrdquofor a user [TLB11] Another system Flock asked crowd workersto specify paired examples to define similar or different instancesof positive or negative class [CB15]
Candidate This constraint type refers to user feedback on a set ofdata instances from the training set which are good representativesof their class Based on prior knowledge users can specify that datainstances represent a given class well
Critical This constraint lets users specify a set of data instances toshow that correct prediction of these are critical for them This con-straint can be specified when users want a set of data instances to
dagger The full list of papers is provided in the supplemental material
be correctly classified while the accuracy of other data instances isless important For example consider a financial analysis scenariowhere a company needs a classifier to predict which clients shouldbe granted a loan The analyst might know a few clients who aremore profitable than others Thus he or she might prefer a classi-fier that correctly predicts these clients than the less profitable onesUsers can assess constructed classifiers based on how accuratelythey predict the specified critical data instances Other researchershave looked at critical data instances For example Lime is a MLalgorithm which helps users to interpret models by explaining theirpredictions on data instances that are critical [RSG16]
Ignore This constraint specifies if the user intends to remove noisyor outlier data instances from the training set Removal of noise oran outlier increases the accuracy of prediction and the power of themodel to generalize on unseen data This constraint may also in-clude specification of data instances whose prediction (correct orincorrect) is irrelevant to users Elzen et al prototyped Baobab-View for inspecting outliers and noisy data to improve interactiveconstruction of decision trees [VDEW11]
32 Feature-based
This category includes items which users can specify to help amodel in its learning process The following constraints defined un-der this category operates at the level of the features (or attributes)
Feature selection This constraint allows users to specify fea-tures that are important for classification A classifier will only usethe specified features when it is learning the data or the Auto-MLsystem will penalize any model that uses features other than theones specified by the user This is inspired from previous workthat showed the value of human-centered feature selection in modelconstruction [KPB14 LWLZ17 CB15]
Correlation and Variance This constraint allows users to spec-ify correlation and variance in the features based on their domainexpertise Users specify perceived correlation between features andvariance per feature in the data Correlation and Variance are basedon the userrsquos domain knowledge and not necessarily grounded inthe training data For example a financial analyst might know thatexperienced bank customers in the age group of 40minus 50 are morelikely to spend economically and pay on time Thus the featuresage and payment are correlated based on the domain knowledge ofthe user which may or may not be present in the data Hall showeda feature selection method based on correlation in the data [H99]Instead of computing correlation in the features from the trainingdata users may specify correlation and variance in the data an in-formation that affects how the model learns from the data
33 Train-objectives and Test-objectives
ML models can be evaluated using conventional model met-rics or constraints such as Accuracy Precision Recall and F1-Score When applied to the training set we consider them Train-objectives compared to applying them to the test set when we con-sider them Test-objectives Together these two objectives help userscontrol for model overfitting Using the Train-objectives users canverify how well the model is learning from the data while using
ccopy 2020 The Author(s)Computer Graphics Forum ccopy 2020 The Eurographics Association and John Wiley amp Sons Ltd
Das et al QUESTO Interactive Construction of Objective Functions for Classification Tasks
the Test-objectives they can validate if the model generalises wellon unseen data For example one can first find models with hightraining accuracy (ie low bias) then tune the hyperparametersto achieve a high test set accuracy (ie low variance) and finallyweight or rank these constraints to find classifiers that show an op-timal tradeoff between bias and variance
4 QUESTO System Design and Description
QUESTO helps users interactively construct classifiers that ad-dress their subjective goals specified in the form of interactiveobjective functions The interface is designed to facilitate inter-active specification of constraints at the data instance and fea-ture level QUESTO enables users to see specified constraints andaddremoveedit them QUESTO supports classifier inspection andselection from a set of candidate models generated from the user-specified objective function with Hyperopt in the backend
Upon data import QUESTO splits the datasets into a trainingset multiple test sets and a final validation set The training set isused to build the initial model The multiple test sets are used foreach iteration of user feedback to test how well the model meets theobjectives and constraints specified When users are satisfied thereis a final validation set (which is never seen by the model duringthe previous iterations) used to validate the model
41 User Interface and Interactions
Data table view It displays the training and test data sets intwo data tables In addition it supports specification of 4 typesof constraints Critical Ignore Similarity and Candidate Tospecify Critical or Ignore constraints users can click on the row(See Figure 4-E) To specify a Similarity constraint users canspecify either rdquoSimilarrdquo or rdquoDifferentrdquo on pairs of data instancesTo specify the Candidate constraint (see Figure 4-B E) userscan select rows within a class to specify example data instancesWhen users select a model from the model interpreter view theclass label column of both training and test data shows correctpredictions with a check mark while incorrect predictions areshown with a cross mark (see Figure 1-A)
Scatterplot matrix view Shows the relationship between variousattributes and helps users find missing data outliers etc
Confusion matrix A confusion matrix for both the training andtest dataset is shown on the right of the data table view (see Fig-ure 1-C) Clicking on cells in the confusion matrix filters the datatable to show data instances responsible for the prediction
Feature panel The features of the data are visualized as a parallelcoordinate plot (Figure 4-G) Brushing on any feature (representedas vertical lines) allow users to filter the data instances in the datatable Users can specify a Feature Selection constraint by clickingon the cells over the vertical lines (Figure 4-F) Further right click-ing on these cells specifies a Correlation and Variance constraint
Objective function stack This view visualizes the interactive ob-jective function Each box (see Figure 1-G) represents an objec-tive category and contains constraints under the categorization de-scribed in section 3 Users can specify a constraint by clicking
on its name (a specified constraint is shown with a green check-mark see Figure 1-E) When users explore and interact with thedata QUESTO automatically infers constraints such as CandidateCritical etc However users can override the inferred constraintsif they disagree Underneath each box is a slider (Figure 1-D E)which allows users to adjust the weight of each objective Users canalso reorder constraints vertically to indicate priority
Model interpreter Shows metrics of k ML models Users canchoose to inspect each model by seeing it in a parallel coordinateor in a star plot (see Figure 1-F) Users can select a model whichupdates the data table view (showing predictions for each data in-stance) and updates the confusion matrices This view also showsthe top 3 features used by the classifier
Rule Panel When users specify any constraints by filtering datainstances QUESTO saves these data instances as part of a rule(Figure 1-I) that can be interacted with through this view
42 Technique
This section describes the underlying techniques in QUESTO thatdrive the construction of an interactive objective function (seeFigure 3) QUESTO uses an Auto-ML module called Hyperopt[KBE14] to find an optimal hyperparameter combination whichmay meet user goals QUESTO specifies a learning algorithmand a set of hyperparameters for Hyperopt to construct models(eg we used a random forest classifier with the hyperparame-ters MaxDepth Criteria (ldquoginirdquo or ldquoentropyrdquo) and MinSamples)Our technique uses an iterative model construction and evaluationworkflow Users formulate their preferences in the objective func-tion O by specifying a set of constraints Φ and a weight vectorW Per iteration Hyperopt consumes O to construct and rank newmodels M This cycle allows users to search for models by definingtheir goals and constraints in O
421 Classifier Creation and Selection
Model Construction QUESTO splits the loaded data set Z intotraining D multiple test sets T = T1T2T3Tt and a validation setV Next it triggers Hyperopt to start the model optimization pro-cess on the supplied data D to build M classifiers of size N (M =m1m2m3 mN ) It constructs each model mi using a suppliedlearning algorithm κ and sampled B hyperparameter combinationsWe used Scikit-Learnrsquos machine learning package to build the clas-sifiers [MLb] further supported by Hyperopt which provides newhyperparameter combinations Finally each of the trained model mipredicts class labels for both D and Ti The models are evaluatedbased on their performance on the supplied objective function O
Model Optimization Hyperopt traverses the space of pre-definedhyperparameters to construct a set of models As an input Hyper-opt expects a list of hyperparameters to tune H = h1h2hB anda domain space νi for each hyperparameter hi We pre-selectedB hyperparameters and their domain space For example if adomain space of 2 minus 100 for MaxDepth hyperparameter waschosen Hyperopt will sample a value between 2 to 100 Fur-ther using user-defined constraints such as Testing-Accuracy orCross-val-score Hyperopt samples the hyperparameter space tocontrol for model overfitting Hyperopt evaluates each model in
ccopy 2020 The Author(s)Computer Graphics Forum ccopy 2020 The Eurographics Association and John Wiley amp Sons Ltd
Das et al QUESTO Interactive Construction of Objective Functions for Classification Tasks
Figure 3 QUESTO system architecture
M with the supplied objective function O The objective functionO is constructed by a weighted linear combination of user-definedconstraints Φ Each model mi in M gets a objective function scoreS = s1s2 sN based on its performance on O Hyperopt ranks theN classifiers (we set N = 100 but can be changed) based on theobjective function scores in S
422 Interactive Objective Function Creation
The set of constraints Φ represent the different categories of goalsand constraints in our taxonomy (see Section 3) Using QUESTOusers can define the following constraints interactively
Critical Hyperopt trains a model mi on the supplied training setD with original labels Ldo Next it predicts labels on the trainingset as Ldp Users specify a list of IDs of x critical data instancesC = c1c2cx QUESTO retrieves the prediction on the criticaldata instances based on supplied IDs C as Lcp (Lcp sub Ldp)QUESTO retrieves the original class labels of the critical datainstances as Lco QUESTO initializes the score for the Criticalconstraint as s1 = 0 It compares Lco with Lcp to find the numberof correct matches and save in s1 (normalized between 0 to 1)
Similarity This constraint is of two types The first type capturessimilar data items when a user specifies a list of data items Y thatare similar and should be placed in the same class The algorithmiterates over Y to find the original class label Lno If Y belongs tomore than one class label the most frequent class label is assignedto Lno Next the algorithm matches the prediction Lnp with theoriginal class label Lno where i is the index iterating from 0 tob (the number of user-specified similar data instances) For everycorrect match the score for this constraint s2a gets a +1 scoreNext it normalizes s2a as (s2a)b to get a score between 0 to 1
The second type consists of users specifying items that should bedifferent A user does so by specifying a list of tuples σ where eachitem in the list is represented as σi = (σxσy) Here σx and σy aredata instances that users expect to be predicted in different classesThe algorithm iterates over σ and matches the predicted class labelLσpi of item σi to class label Lσp j of item σ j For every incorrectmatch the score for this constraint s2b gets a +1 point Next itnormalizes s2b as (s2b)b to get a score between 0 to 1 Finallythe score for this constraint is computed as s2 = (s2a + s2b) Wenormalize s2 to get a score between 0 to 1
Candidate Users specify a list of b data items in G with a classlabel A The algorithm increases the training data weights (W =w1ws2ws3wb) for these data items It inputs W to Hyperopt
which trains the classifiers M based on the updated weights The al-gorithm iterates through G and matches each items predicted classlabel L f p with A The score for this metric s3 is initialized as 0For each correct match in the iteration s3 is assigned a +1 pointFinally the algorithm normalizes s3 as s3 = s3b
Ignore Users specify a list of data items I The algorithm removesthese data items from D to form a new training set DII Furtherwhen computing classification model metrics such as PrecisionRecall etc the algorithm removes the data items in I from D
Accuracies This captures the classification model metrics definedas part of the category Train-objectives and Test-objectives (seesection 3) These are Precision Recall F1-Score etc For each ofthese QUESTO uses Scikit-Learns classification metrics [MLb]
Feature Selection Correlation and Variance QUESTO incor-porates a user-based feature selection technique Users can guidefeature selection in one of two ways First users can select a setof features Fd using the feature panel QUESTO interpretes thatthe user chose a set of features which has a high correlation withthe class label For model construction QUESTO will only use thefeatures in Fd Second users can specify a set of correlated fea-tures Fc or features with low variance in Fv QUESTO automati-cally discards the features which show high correlation (negativeor positive) with each other and selects the ones which are uncorre-lated Similarly QUESTO discards features with low variance Theselected features F = FminusFc or F = FminusFv are fed to Hyperopt
Objective Function Formulation The resulting objective func-tion in QUESTO is a weighted linear combination of constraintsΦ The algorithm computes the scores for each constraint Finallyit linearly combines these individual constraint scores as shown inthe equation O = s1 lowastω1 + s2 lowastω2 + s3 lowastω3 + s4 lowastω4 + s5 lowastω5where s1s2s3 etc are the scores of the user-specified constraints
Weighting Preferences Initially the weights W = ω1ω2 ωUare evenly set for each constraint in Φ However users can over-ride and specify weightings for each constraint by interaction tech-niques shown in Section 41 The weight vector W sums to 1 toensure correctness in computing the contribution of each item in Φ
Guarding Against Data Leakage QUESTO searches for bestmodels from a pool of sampled ML models (facilitated by Hyper-opt) This is different from optimizing the internal algorithm of MLmodels such as designing the loss function for a random forest Asour technique treats each model as a black box it can optimize formodels that may perform better on train or test data This is similarto conventional model construction processes where ML practi-tioners aim for a higher training or test accuracy or a balance be-tween each However to guard against data leakage our techniqueuses multiple sets of test data T = T1T2Tt (each used per itera-tion of model construction) When QUESTO loads input data Z itautomatically splits into three sets train D test T and validationV Next it makes t subsets of the test data each used per iterationof model construction This serves to address potential data leak-age as the models are tested on unseen data and during training thetest data is not used Per iteration the model gets a new test set Tito compute the objective score (test-accuracy test-F1-score etc) Inaddition when the model is exported by the user they get to validateit on the validation set V which is not used on any prior iteration
ccopy 2020 The Author(s)Computer Graphics Forum ccopy 2020 The Eurographics Association and John Wiley amp Sons Ltd
Das et al QUESTO Interactive Construction of Objective Functions for Classification Tasks
5 Usage Scenario
We describe a scenario showing how QUESTO can help users buildclassifiers on an imbalanced dataset through the specification of in-teractive objective functions Chris is a public policy analyst (withbasic knowledge of ML) is analyzing San Franciscorsquos employmentdata to predict employees department [Off] (10000 samples) Chrisexplores the salary data in QUESTO and begins constructing clas-sifiers They inspect the best classifier from the model interpreterto observe that it scored poorly on both training and test set (avg48 accuracy) Chris explores the confusion matrix to discover that80 of the original labels are of type public service indicating thatthe data is imbalanced (there are 5 class labels) While the currentmodel correctly predicted 70 of this label type it failed to predictthe other labels accurately Chris expects the classifier to predicteach class label with at least 80 accuracy to be valuable for theiranalysis Next using the objective function stack view Chris spec-ifies the constraint F1-Score to account for the imbalanced natureof the dataset and the constraint Cross-val-score to construct gen-eralisable models
Chris triggers QUESTO to construct a set of new classifiers (seenthrough the model interpreter) based on the updated objective func-tion They click on model 2 as it shows the best performance on allthe specified constraints in the star plot view However other thanthe class public service) this model failed to perform as per expec-tation on other labels For example the label culturalrecreationand adminfinance showed 0 correctly predicted data items Mo-tivated to resolve these two classes Chris brushes on the featureretirement on the feature panel to filter jobs with high retirementbenefits Next Chris picks the constraint Candidate from the drop-down menu as seen in Figure 4-B They click on a set of data itemsof label administrationfinance on the table (shown with a greenhighlight see Figure 4-E) When Chris specifies the Candidate con-straint QUESTO automatically records the selected data instancesas part of a rule (see Figure 1-I) Chris assigns it a custom namehigh-retirement Next they filter the data instances using the fea-ture panel with low overtime and high salary values Chris speci-fies a subset of these data instances as Candidate constraint for theclass culturalrecreation QUESTO saves these data instances as arule which Chris calls high-sal (Figure 1-I)
Chris inspects one of the new models (model 2) by hovering overthe two rules (high-retirement and high-sal shows associated dataitems in the table view) Quickly glancing through these data itemsChris observes that the prediction error is less than 10 which theyfind acceptable Next Chris explores the confusion matrices andfinds that the performance score for the model increased to 72accuracy (see Figure 5-BC) Furthermore Chris notices that themodelrsquos performance improved significantly achieving on average70 accuracy for all classes except adminfinance In order to boostthe performance of the label adminfinance Chris specifies all thedata instances of this label (in the training set with more than 80000retirement benefits total 12 items) as a Critical constraint
Iterating further Chris finds a new set of classifiers from the col-lection satisfied the constraints Candidate Critical and F1-ScoreHowever the performance dropped on the test set in all of thesemodels To further emphasize the performance on the test set as animportant criteria Chris specifies the Testing-Accuracy constraint
Figure 4 A Critical constraint B Other constraints C Classselector D Filter tags E Selected data F Select features corre-lation and variance G Parallel coordinate plot
Figure 5 Views for Evaluating Model Performance
In addition they lower the weights on the constraints in thecategories Train-objectives and Instance-based and increases theweight on the category Test-objectives (see Figure 1-D E) Theyalso re-order individual constraints specifying highest priorityto the constraint Candidate Chris constructs new classifiers andchooses model 3 based on its performance as viewed in the starplot view They hover over the two custom rules (see Figure 1-I) tosee that most of the data instances in them are correctly predictedand performs equally well on all class labels Content with thecurrent model Chris tests the model on a validation set and thenexports it for future use This usage scenario shows how QUESTOenabled a domain expert to build an accurate classifier on animbalanced dataset by exploring various objective functions thatcaptured his subjective preferences
6 Evaluation
Other than using interactive visual interfaces like QUESTO twopopular alternatives to constructing classifiers are (1) manuallycreating them via code or command-line (CMD) interfaces and (2)automatically generating them using Auto-ML We wanted to com-pare QUESTO with manually coding to verify if QUESTO is easierand faster to specify constraints Furthermore we wanted to com-pare QUESTO with Auto-ML to verify if QUESTO satisfies sub-jective user goals better and to compare the resulting accuracy Weconducted a within-subject controlled lab user study of QUESTOcomparing it with CMD and Auto-ML to construct a classifier Ourstudy addresses the following research questions
RQ1 Is QUESTO easier and faster to use than CMD workflowsRQ2 Does QUESTO build more accurate models than
automatically-generated models from Auto-MLRQ3 Does QUESTO build models that addresses user-specified
constraints better than models from Auto-ML
We hypothesize the interactive visual interface of QUESTO will
ccopy 2020 The Author(s)Computer Graphics Forum ccopy 2020 The Eurographics Association and John Wiley amp Sons Ltd
Das et al QUESTO Interactive Construction of Objective Functions for Classification Tasks
be easier and faster to use compared to command-line interfacesHere ldquofasterrdquo refers to the time it takes to specify constraints andconstruct classifiers it does not include the time needed to trainclassifiers Further we hypothesize that Auto-ML will generatemore globally accurate models given the objective function op-timizing towards a specified accuracy metric such as high cross-validation score However RQ3 tests our hypothesis that QUESTOwill be better at building models that fit specific user constraintsgiven the customized objective function thus illuminating thistradeoff between accuracy and user goals
In the literature there is no well-defined metric to measure howwell user-defined constraints are satisfied in classifier constructionThus we defined constraint satisfaction score as a metric thatcaptures how well a model attains user-specifed constraints suchas Critical Candidate etc These scores are normalized between0minus 1 (higher is better) It is expressed as (sumU
0 ωi lowast γi)U where ω
is the weight of U constraints γ is the score of each constraint U isthe total number of specified constraints in the objective function
We recruited 16 participants (7 Male 9 Female) aged between21-29 (M=25 SD=291) by inviting participants through our uni-versity mailing lists We required them to at least have a basic ex-pertise in writing python code with elementary understanding ofML All of the participants (undergraduate and graduate students)were familiar with basicintermediate data analysis using tools suchas MS Excel Tableau etc The experiment lasted 60 minutes andwe compensated each participants with a $10 Amazon gift cardThe study was conducted using a 17-inch display and a mouse
61 Study Design
We began the study with a practice session teaching users howto interact with both QUESTO and CMD (with VS Code as thescripting editor) During the practice session participants were en-couraged to ask questions to clarify uncertainty in relation to theworkflow or the interaction design We proceeded to the experi-mental sessions only when the participants felt confident in usingeach system For quantitative evaluation each participant interactedwith both QUESTO and CMD using one dataset Furthermore theorder of the interfaces (QUESTO and CMD) the datasets andthe tasks were randomized to remove any orderinglearning effectWe considered these dependent variables for quantitative analysis(1) Task completition times in specifying an objective functionthrough QUESTO or CMD (2) Model accuracy the accuracy ofthe model constructed using QUESTO CMD and Auto-ML standalone (3) Constraint satisfaction score measure to capture con-straints satisfied by the model and (4) User preference rating av-erage preference rating of Ease of Use for QUESTO and CMD
62 Datasets
For the practice session we provided a dataset of 10000 credit cardtransaction records [YL09] The data has attributes such as bill paidmonth 1 bill paid month 2 bill paid month 3 account balanceetc It was a binary classification task to predict if a bank customerwill default on a bank loan or not For the experimental sessionswe provided San Franciscorsquos employment dataset [Off] containing5000 data items for the quantitative evaluation Each row in the data
contains information about an employeersquos remuneration containingattributes such as dental benefits annual salary monthly salaryextra benefits etc The task was to predict the employeersquos depart-ment (5 classes) For the qualitative evaluation we used a moviesdataset [Mov] (5000 samples) containing attributes such as budgetgross revenue facebook likes of lead actors director cast etc Thedata has three labels for movie rating high medium and low Fol-lowing best ML practices we use multiple test datasets so that theconstructed model never sees unseen data instances
63 Tasks and Procedure
In the practice session we asked users to perform 2 tasks per inter-face The first task was to design an objective function in QUESTOby specifying a Critical constraint They were asked to iterate mul-tiple times and improve the classifiers performance by refining theconstraint The next task was to add two more constraints (Similar-ity and Candidate) to the objective function in QUESTO and iter-atively improve the classifiers performance They repeat the sametasks by writing code and using CMD to run their code to con-struct a classifier For the quantitative evaluation participants arerandomly assigned an interface (QUESTO or CMD) Participantswere encouraged to think aloud while they interact with each sys-tem The interviewer was a silent observer and was away from theparticipant to mitigate Hawthorne and Rosenthal effect during thesession Participants performed 3 tasks per interface (6 tasks total)Each of the tasks were in increasing level of difficulty
Task 1 Specify the constraint Similarity (Max time 3 minutes)Task 2 Specify Critical and Candidate (Max time 5 minutes)Task 3 Specify Critical Similarity Candidate F1-Score Preci-
sion Accuracy and Cross-Validation (Max time 7 minutes)
For the qualitative evaluation we asked participants to freely useQUESTO (may specify any constraint) to build a classifier (on themovies data) and improve its objective function score in 5 minutes
64 Data Collection
For quantitative assessment we saved log data which stores (periteration) models selected by users their learning algorithms andhyperparameters predicted class labels interacted data items user-specified constraints etc When participants completed the threetasks on both interfaces we asked them to fill a NASA-TLX form[HS88] and a post-study questionnaire with a set of likert scalequestions We asked questions to seek user preference rating to eachinterfacersquos various dimensions such as (1) Ease of use (2) Flexi-bility (3) Fun to use (4) Learnability and (5) Intuitiveness Afterthe qualitative evaluation we conducted a semi-structured interviewasking open-ended questions about the workflow system usabilityand interaction design for each interface In this interview we askedquestions such as (1) Describe your thought process while you in-teracted with QUESTO (2) Explain your experience in construct-ing an objective function interactively vs through writing code(3) How do you think we can improve the current workflow and de-sign of QUESTO We also captured video and audio of participantsscreen while they interacted with QUESTO
ccopy 2020 The Author(s)Computer Graphics Forum ccopy 2020 The Eurographics Association and John Wiley amp Sons Ltd
Das et al QUESTO Interactive Construction of Objective Functions for Classification Tasks
Figure 6 The study results comparing QUESTO with coding interfaces and Auto-ML techniques for classification tasks
65 Quantitative Analysis
For the following we used the Friedman Test for Repeated-Measures as it is a good indicator of statistical significance formulti-class classifiers with multiple datasets which may not fol-low a normal distribution as suggested by [Dem06] Furthermorewe utilised Post-hoc Wilcoxon signed-rank tests with Bonferronicorrection (new p value = 003) to test for statistical significance
Ease of use To answer RQ1 we used likert scale rating scores(5-point scale) from participants (average ease of use rating 464higher is better see Figure 6-D) The ease of use of QUESTO wassignificant across all tasks (χ2(1) = 4803 p lt 003) thus answer-ing RQ1 that QUESTO is easier to use than CMD
Task completion times Participants were significantly faster tospecify constraints in QUESTO than CMD (Figure 6-C) Every par-ticipant completed all tasks except for three who failed to completetask 3 in the allotted time using CMD In these cases we recordedthe maximum alotted time for that task Quantitatively we foundstatistically significant difference in task completion time for alltasks Task1 (χ2(1) = 160 p lt 003) Task2 (χ2(1) = 160 p lt003) and Task3 (χ2(1) = 40 p lt 003) This answered RQ1 thatQUESTO is faster to specify constraints than CMD
Model Accuracies To answer RQ2 we compared the models gen-erated using QUESTO CMD and Auto-ML with respect to theiraccuracies We found QUESTO generated similar quality modelsin relation to accuracies as produced by CMD (refer Figure 6-A)However accuracies generated by models from Auto-ML standalone were higher in comparison to QUESTO We observed sta-tistically significant difference in the model accuracy for task 1(χ2(1) = 1225 p lt 003) and task 3 (χ2(1) = 40 p lt 003)
Constraint satisfaction We found that QUESTO outperformedAuto-ML in meeting user-specified constraints for all tasks Task1(χ2(1) = 625 p lt 003) Task2 (χ2(1) = 225 p lt 003) andTask3 (χ2(1) = 90 p lt 003) This answered RQ3 We analysedthis based on data collected from the employment dataset [Off](users were given the example data items to specify as constraints)and on the movie dataset [Mov] (users freely specified constraints)
66 Qualitative Analysis
User Preferences We measured user preferences using 5-pointlikert scale rating QUESTOrsquos user preference ratings (out of 5)
were higher than CMD workflow in various aspects such as Easyof use (Q 453 CMD 322) Fun to use (Q 469 CMD 288) Learnable (Q 434 CMD 297) and Intuitive (Q 438 CMD287) (see Figure 6-D) In addition through the NASA-TLXsurvey we found that average participantsrsquo cognitive workload wassignificantly lower in QUESTO than CMD interfaces (Q 430CMD 887 out of 10 lower is better) Based on these results itis likely that participants preferred QUESTO compared to usingthe CMD interface for objective function creation However manyparticipants found CMD comparably flexible to QUESTO tospecify preferences (Q 378 CMD 352) and debug models
Easy workflow Every participant found QUESTOrsquos interface andthe workflow easy to learn and use Users liked the table view withthe ability to filter and search for specific data items as examplesfor constraint specification P03 said ldquoI like how I can mouseoveron the cells of the confusion matrix to see incorrectly predicteddata itemsrdquo P08 added ldquoI frequently brush over the feature panelto filter data items by a set of attributes I care aboutrdquo Howeverusers recommended that more advanced sorting feature in the tablewould have helped them find appropriate examples quickly
Level of Detail Some participants had elementary knowledge ofpython and ML while a few others had in-depth ML expertise P09reflected ldquoBest part of this workflow is how easy the tool makesto change my constraints in terms of weighting or ordering themwhich lets me look into a new set of classifiersrdquo While advancedML users appreciated the idea of an interactive interface to definean objective function reflected that they would prefer to look at thenumerical weights on each constraint so that they can better trusthow the modeling engine is selecting classifiers P13 said Thoughthe objective function view is very useful I am not sure if I un-derstand whatrsquos happening on the background without knowing thenumerical weights on these constraints
Meaningful constraints Participants found the constraints inQUESTO appropriate and useful for classifier construction P10added ldquoI think the constraints make a lot of sense to me When Itest models I frequently look at specific data items to verify if theclassifier modeled the data correctlyrdquo However a few participantscommented that it would help if QUESTO could recommend itemsto consider next For example P03 suggested ldquoI think you can useprediction probabilities to reflect on how confident the model is oneach prediction That may help me specify better examplesrdquo
Intuitive model selection Users found the model interpreter view
ccopy 2020 The Author(s)Computer Graphics Forum ccopy 2020 The Eurographics Association and John Wiley amp Sons Ltd
Das et al QUESTO Interactive Construction of Objective Functions for Classification Tasks
useful to compare models based on their performance on the spec-ified constraints P17 noted ldquoFrom the star plot view I can inspectthe size of the polygons to select models that performed better onrelevant constraints I would prefer to mouseover (instead of click)to browse the model output results on the table and the confusionmatricesrdquo However participants wanted to see a bookmark featureto save models they like Furthermore one participant desired tosee how each constraint contributed to a change in model output tounderstand what interaction improved performance
Task complexity The three tasks in the user study had differentlevels of complexity While task 1 and task 2 involved satisfyingonly subjective user preferences task 3 included finding modelsthat are accurate yet address constraints such as Similarity Can-didate etc Participants found task 3 more challenging as findingthe right model that is accurate and addresses their personal goalswas difficult P15 noted ldquoIt was hard to improve the classifiers per-formance when I had more than 4 constraints to specify Howeverwith QUESTO I could rapidly test different weightingsrankings tothese constraints to find an optimal classifierrdquo
Conflicting constraints We observed that participants sometimesspecified conflicting constraints For example they specified a setof data item as a Candidate constraint but in a later iteration theyspecified a subset of these data items as a Ignore constraint AsQUESTO currently does not support alerting users about conflictsin future we plan to mitigate them in objective specification
Modeling process From the study we found that QUESTOrsquosworkflow does not help users understand the underlying modelingprocess Often participants wondered what interaction in the previ-ous iteration led to the improvement or degradation in the accuracyor the objective function score Future work could make the mod-eling process more transparent and allow users to reason about theimpact of their objective specification on classifier selection
7 Discussion
User-System Feedback loop Interactive objective functions mayguide an Auto-ML model solver to select models that weigh datainstances preferentially to better support user goals For examplean objective function with the Critical constraint will guide theAuto-ML solver to prefer classifiers that correctly predict specificitems In response users may inspect a model in relation to howwell it supports the specified constraints Thus interactive objec-tive functions employ a two-way feedback loop between the userand the system for (1) communicating preferences to find suitablemodels and (2) providing a medium for understanding classifierperformance Participants confirmed that (per iteration) they vali-dated models in relation to how well they support the constraints
Tradeoff Analysis Practically in a multi-objective optimizationproblem satisfying every objective might not be feasible [SAS02]due to a plethora of reasons including conflicting constraints math-ematical infeasibility noiseoutliers in the data high dimensional-ity etc [KLTH10] Formalizing user goals as a set of constraintsin an objective function facilitates searching for a set of pareto-optimal solutions which may only satisfy a subset of the specifieduser goals Furthermore visualizing these pareto-optimal modelshelp users inspect them and understand tradeoffs
ML users often seek models that support other customizedsubjective goalsobjectives that are personal and problem-specific([KLTH10]) This study validated that while QUESTO producedslightly less accurate models than Auto-ML model solvers theymet subjective user-specified constraints We envision that userswill need to find a balance between these two extremes
71 Limitations
Scope and assumptions of the user study In the study we timedeach task to ensure the study can be completed within a reasonabletime However in more realistic settings optimizing for (or lim-iting) time may not be meaningful Further we used pre-definedhyperameters within which Hyperopt sampled values to constructclassifiers The study results may vary if the set of hyperparametersused are different Also our study only included participants withbasic expertise of python and ML
Model overfitting Good ML practices entail that trained modelshave no knowledge of test data In QUESTO we follow the sameprocess The test data view in the data table allows users to inspectclassifiers by reviewing the predictions made at the data instancelevel Furthermore by specifying the objectives Train-objectivesand (and weighting them) users can control for model overfit-ting Nevertheless we are aware that if users do not specify theymay produce overfitted models However this may be the case forcommand-line classifier construction as well if addition of regular-izers or cross-validation approaces are not used
Scalability The current UI design is based on datasets of mod-est size Thus there are aspects of the UI that would become lessusable if datasets grew larger For example while the table viewsupports sorting and filtering the fundamental design of showingitems in a table may make finding individual relevant data itemschallenging However for larger datsets we can augment QUESTOwith visualisations that can aggregate data and show example dataitems on demand (eg grouped heatmap view etc)
8 Conclusion
In this paper we present a design space of constraints categorizingvarious user goals for a classification task Grounded in this designspace we developed a prototype system QUESTO that supports in-teractive construct of objective functions to specify their subjectivepreferences to a classifier Finally we validate the effectiveness ofQUESTO by a within-subject user study that proved that QUESTOis easier and faster to use than conventional command line alterna-tives We also demonstrate that while QUESTO produces slightlyless accurate classifiers than Auto-ML it produces models that bet-ter satisfy user-specified constraints This presents a step towardsunderstanding how to integrate people into Auto-ML processes
9 Acknowledgements
Support for the research is partially provided by DARPA FA8750-17-2-0107 DARPA FA8750-17-2-010 NSF 1841349 and NSFIIS-1452977 The views and conclusions contained in this doc-ument are those of the authors and should not be interpreted asrepresenting the official policies either expressed or implied ofthe US Government
ccopy 2020 The Author(s)Computer Graphics Forum ccopy 2020 The Eurographics Association and John Wiley amp Sons Ltd
Das et al QUESTO Interactive Construction of Objective Functions for Classification Tasks
References[ACKK14] AMERSHI S CAKMAK M KNOX W B and KULESZA
T ldquoPower to the people The role of humans in interactive machine learn-ingrdquo AI Magazine 354 (2014) 105ndash120 2
[AF18] AHAMED F and FARID F ldquoApplying Internet of Things andMachine-Learning for Personalized Healthcare Issues and Challengesrdquo2018 International Conference on Machine Learning and Data Engi-neering (iCMLDE) 2018 19ndash21 DOI 101109iCMLDE201800014 3
[AFKT11] AMERSHI S FOGARTY J KAPOOR A and TAN D SldquoEffective End-User Interaction with Machine Learningrdquo AAAI 2011 3
[BGV16] BOUALI F GUETTALA A and VENTURINI G ldquoVizAssistAn Interactive User Assistant for Visual Data Miningrdquo Vis Comput3211 (Nov 2016) 1447ndash1463 ISSN 0178-2789 DOI 10 1007 s00371- 015- 1132- 9 URL httpdxdoiorg101007s00371-015-1132-9 2
[BLBC12] BROWN E T LIU J BRODLEY C E and CHANGR ldquoDis-function Learning distance functions interactivelyrdquo 2012IEEE Conference on Visual Analytics Science and Technology (VAST)2012 83ndash92 DOI 101109VAST20126400486 2
[BM17] BIRAN O and MCKEOWN K ldquoHuman-centric Justification ofMachine Learning Predictionsrdquo Proceedings of the 26th InternationalJoint Conference on Artificial Intelligence IJCAIrsquo17 Melbourne Aus-tralia AAAI Press 2017 1461ndash1467 ISBN 978-0-9992411-0-3 3
[BNHL14] BRADEL L NORTH C HOUSE L and LEMAN S ldquoMulti-model semantic interaction for text analyticsrdquo 2014 IEEE Conference onVisual Analytics Science and Technology (VAST) 2014 163ndash172 DOI101109VAST20147042492 2
[BYC13] BERGSTRA J YAMINS D and COX D D ldquoHyperopt Apython library for optimizing the hyperparameters of machine learn-ing algorithmsrdquo Proceedings of the 12th Python in Science Conference2013 13ndash20 3
[BZSA17] BERNARD J ZEPPELZAUER M SEDLMAIR M andAIGNER W ldquoA Unified Process for Visual-Interactive Labelingrdquo Euro-Vis Workshop on Visual Analytics (EuroVA) Ed by S MICHAEL and TCHRISTIAN The Eurographics Association 2017 ISBN 978-3-03868-042-0 DOI 102312eurova20171123 3
[CAK17] CHANG J C AMERSHI S and KAMAR E ldquoRevolt Collab-orative Crowdsourcing for Labeling Machine Learning Datasetsrdquo Pro-ceedings of the 2017 CHI Conference on Human Factors in ComputingSystems CHI rsquo17 Denver Colorado USA ACM 2017 2334ndash2346ISBN 978-1-4503-4655-9 DOI 10 1145 3025453 3026044URL httpdoiacmorg10114530254533026044 3
[CB15] CHENG J and BERNSTEIN M S ldquoFlock Hybrid Crowd-Machine Learning Classifiersrdquo Proceedings of the 18th ACM Confer-ence on Computer Supported Cooperative Work amp38 Social Comput-ing CSCW rsquo15 Vancouver BC Canada ACM 2015 600ndash611 ISBN978-1-4503-2922-4 DOI 10114526751332675214 3 4
[CES09] CRAMER H S M EVERS V S VAN et al ldquoAwarenessTraining and Trust in Interaction with Adaptive Spam Filtersrdquo Proceed-ings of the SIGCHI Conference on Human Factors in Computing Sys-tems CHI rsquo09 Boston MA USA ACM 2009 909ndash912 ISBN 978-1-60558-246-7 DOI 10114515187011518839 3
[CFEC17] CROUSER R J FRANKLIN L ENDERT A and COOK KldquoToward theoretical techniques for measuring the use of human effort invisual analytic systemsrdquo IEEE transactions on visualization and com-puter graphics 231 (2017) 121ndash130 3
[CHH19] CASHMAN D HUMAYOUN S F HEIMERL F et al ldquoAUser-based Visual Analytics Workflow for Exploratory Model Analy-sisrdquo Computer Graphics Forum 383 (2019) 185ndash199 DOI 101111cgf13681 3
[CW18] CHEN M and WANG H ldquoHow Personal Experience and Techni-cal Knowledge Affect Using Conversational Agentsrdquo Proceedings of the23rd International Conference on Intelligent User Interfaces Compan-ion IUI rsquo18 Companion Tokyo Japan ACM 2018 531ndash532 ISBN978-1-4503-5571-1 DOI 10114531803083180362 3
[DCCE18] DAS S CASHMAN D CHANG R and ENDERT AldquoBEAMES Interactive Multi-Model Steering Selection and Inspec-tion for Regression Tasksrdquo Symposium on Visualization in Data Sci-ence(VDS) Berlin Germany 2018 3
[Dem06] DEMŠAR JANEZ ldquoStatistical Comparisons of Classifiers overMultiple Data Setsrdquo J Mach Learn Res 7 (Dec 2006) 1ndash30 ISSN1532-4435 9
[EBN13] ENDERT ALEX BRADEL LAUREN and NORTH CHRIS ldquoBe-yond Control Panels Direct Manipulation for Visual Analyticsrdquo IEEEComputer Graphics and Applications 334 (2013) 6ndash13 ISSN 0272-1716 DOI 101109MCG201353 2
[EFN12] ENDERT A FIAUX P and NORTH C ldquoSemantic Interactionfor Visual Text Analyticsrdquo Proceedings of the SIGCHI Conference onHuman Factors in Computing Systems CHI rsquo12 Austin Texas USAACM 2012 473ndash482 ISBN 978-1-4503-1015-4 DOI 10 1145 22076762207741 2
[EHM11] ENDERT A HAN CHAO MAITI D et al ldquoObservation-level Interaction with Statistical Models for Visual Analyticsrdquo IEEEVAST 2011 121ndash130 2
[EIZ13] ESCUDERO J IFEACHOR E ZAJICEK J P et al ldquoMachineLearning-Based Method for Personalized and Cost-Effective Detectionof Alzheimerrsquos Diseaserdquo IEEE Transactions on Biomedical Engineer-ing 601 (2013) 164ndash168 ISSN 0018-9294 DOI 101109TBME20122212278 3
[EW16] EIBE F MARK A H and W IAN H The WEKA WorkbenchOnline Appendix for Data Mining Practical Machine Learning Toolsand Techniques 2016 3
[FKE15] FEURER M KLEIN A EGGENSPERGER K et al ldquoEfficientand robust automated machine learningrdquo Advances in Neural Informa-tion Processing Systems 2015 2962ndash2970 3
[GFT16] GILLIES M FIEBRINK R TANAKA A et al ldquoHuman-Centred Machine Learningrdquo Proceedings of the 2016 CHI ConferenceExtended Abstracts on Human Factors in Computing Systems CHI EArsquo16 San Jose California USA ACM 2016 3558ndash3565 ISBN 978-1-4503-4082-3 DOI 10114528515812856492 3
[GLG13] G SAMUEL L ALEXANDER G NILS et al ldquoLineUp Vi-sual Analysis of Multi-Attribute Rankingsrdquo IEEE Transactions on Vi-sualization and Computer Graphics (InfoVis rsquo13) 1912 (2013) 2277ndash2286 DOI 101109TVCG2013173 2
[H99] H MARK A Correlation-based Feature Selection for MachineLearning Tech rep 1999 4
[Hol16] HOLZINGER A ldquoInteractive machine learning for health infor-matics when do we need the human-in-the-looprdquo Brain Informatics32 (2016) 119ndash131 ISSN 2198-4026 DOI 101007s40708-016-0042-6 3
[HS88] H SANDRA G and S LOWELL E ldquoDevelopment of NASA-TLX (Task Load Index) Results of Empirical and Theoretical Re-searchrdquo Human Mental Workload Ed by H PETER A and M NA-JMEDIN Vol 52 Advances in Psychology North-Holland 1988 139 ndash183 DOI httpsdoiorg101016S0166-4115(08)62386-9 8
[HY16] HE Z and YEN G G ldquoVisualization and Performance Metricin Many-Objective Optimizationrdquo IEEE Transactions on EvolutionaryComputation 203 (2016) 386ndash402 ISSN 1089-778X DOI 101109TEVC20152472283 3
[HY17] HE Z and YEN G G ldquoComparison of visualization approachesin many-objective optimizationrdquo 2017 IEEE Congress on EvolutionaryComputation (CEC) 2017 357ndash363 DOI 101109CEC20177969334 3
ccopy 2020 The Author(s)Computer Graphics Forum ccopy 2020 The Eurographics Association and John Wiley amp Sons Ltd
Das et al QUESTO Interactive Construction of Objective Functions for Classification Tasks
[JZF09] JEONG D H ZIEMKIEWICZ C FISHER B et al ldquoiPCA AnInteractive System for PCA-based Visual Analyticsrdquo Computer Graph-ics Forum Vol 28 3 Wiley Online Library 2009 767ndash774 2
[KBE14] KOMER B BERGSTRA J and ELIASMITH C ldquoHyperopt-sklearn automatic hyperparameter configuration for scikit-learnrdquo ICMLworkshop on AutoML 2014 2 3 5
[KBS11] KULESZA T BURNETT M STUMPF S et al ldquoWhere AreMy Intelligent Assistantrsquos Mistakes A Systematic Testing ApproachrdquoProceedings of the Third International Conference on End-user Develop-ment IS-EUDrsquo11 Torre Canne Italy Springer-Verlag 2011 171ndash186ISBN 978-3-642-21529-2 3
[KCPE16] KIM H CHOO J PARK H and ENDERT A ldquoInterAxisSteering scatterplot axes via observation-level interactionrdquo IEEE trans-actions on visualization and computer graphics 221 (2016) 131ndash140 2
[KDJH08] KRESIMIR M DENIS G JELOVIC M and H HELWIGldquoInteractive Visual Steering ndash Rapid Visual Prototyping of a CommonRail Injection Systemrdquo IEEE Transactions on Visualization and Com-puter Graphics 146 (Nov 2008) URL httpswwwcgtuwienacatresearchpublications2008Matkovic-2008-Steer 2
[KEV18] KWON B C EYSENBACH B VERMA J et al ldquoCluster-vision Visual Supervision of Unsupervised Clusteringrdquo IEEE Transac-tions on Visualization and Computer Graphics 241 (2018) 142ndash151ISSN 1077-2626 DOI 101109TVCG20172745085 3
[KKW17] KWON B C KIM H WALL E et al ldquoAxiSketcher In-teractive Nonlinear Axis Mapping of Visualizations through User Draw-ingsrdquo IEEE Trans Vis Comput Graph 231 (2017) 221ndash230 2
[KLTH10] KAPOOR A LEE B TAN D and HORVITZ E ldquoInteractiveOptimization for Steering Machine Classificationrdquo Proceedings of theSIGCHI Conference on Human Factors in Computing Systems CHI rsquo10Atlanta Georgia USA ACM 2010 1343ndash1352 ISBN 978-1-60558-929-9 DOI 10114517533261753529 2 3 10
[KPB14] KRAUSE J PERER A and BERTINI E ldquoINFUSE Interac-tive Feature Selection for Predictive Modeling of High DimensionalDatardquo IEEE Transactions on Visualization and Computer Graphics2012 (2014) 1614ndash1623 ISSN 1077-2626 DOI 101109TVCG20142346482 4
[KPHH11] KANDEL S PAEPCKE A HELLERSTEIN J and HEERJ ldquoWrangler Interactive Visual Specification of Data TransformationScriptsrdquo ACM Human Factors in Computing Systems (CHI) 2011 2
[KTD17] KIM S TASSE D and DEY A K ldquoMaking Machine-Learning Applications for Time-Series Sensor Data Graphical and In-teractiverdquo ACM Trans Interact Intell Syst 72 (July 2017) 81ndash830ISSN 2160-6455 DOI 1011452983924 3
[KTH16] KOTTHOFF L THORNTON C HOOS H H et al ldquoAuto-WEKA 20 Automatic model selection and hyperparameter optimiza-tion in WEKArdquo Journal of Machine Learning Research 17 (2016) 1ndash5 3
[LHM13] LEMAN S C HOUSE L MAITI D et al ldquoVisual to para-metric interaction (v2pi)rdquo PloS one 83 (2013) e50474 2
[LSL17] LIU M SHI J LI Z et al ldquoTowards Better Analysis of DeepConvolutional Neural Networksrdquo IEEE Transactions on Visualizationand Computer Graphics 231 (2017) 91ndash100 ISSN 2160-9306 DOI101109TVCG20162598831 3
[LWLZ17] LIU S WANG X LIU M and ZHU J ldquoTowards betteranalysis of machine learning models A visual analytics perspectiverdquoVisual Informatics 11 (2017) 48 ndash56 ISSN 2468-502X DOI httpsdoiorg101016jvisinf201701006 4
[LYL14] LI M YANG S and LIU X ldquoDiversity Comparison of ParetoFront Approximations in Many-Objective Optimizationrdquo IEEE Transac-tions on Cybernetics 4412 (2014) 2568ndash2584 ISSN 2168-2267 DOI101109TCYB20142310651 3
[MLa] ML BIG Big ML httpsbigmlcom Accessed March20 2019 3
[MLb] ML SCIKIT LEARN Scikit Learn Model Metrics API Refer-ence httpsscikit- learnorgstablemodulesclasseshtmlmodule-sklearnmetrics Accessed March20 2019 5 6
[MLY17] MIQING L LIANGLI Z and Y XIN ldquoHow to Read Many-Objective Solution Sets in Parallel Coordinatesrdquo CoRR abs170500368(2017) 3
[Mov] Movies Dataset howpublished = https www kaggle comcarolzhangdcimdb-5000-movie-datasetmovie_metadatacsv note = Accessed 2018-12-11 8 9
[NKHK17] NUSHI B KAMAR E HORVITZ E and KOSSMANN DldquoOn Human Intellect and Machine Failures Troubleshooting IntegrativeMachine Learning Systemsrdquo Proceedings of the Thirty-First AAAI Con-ference on Artificial Intelligence AAAIrsquo17 San Francisco CaliforniaUSA AAAI Press 2017 1017ndash1025 3
[Off] OFFICE THE SAN FRANCISCO CONTROLLERrsquoS Employee Com-pensation Data https data sfgov org City -Management - and - Ethics Employee - Compensation 88g8-5mnd Accessed March 15 2019 7ndash9
[PBD10] PATEL K BANCROFT N DRUCKER S M et al ldquoGestaltIntegrated Support for Implementation and Analysis in Machine Learn-ingrdquo Proceedings of the 23Nd Annual ACM Symposium on User In-terface Software and Technology UIST rsquo10 New York New YorkUSA ACM 2010 37ndash46 ISBN 978-1-4503-0271-5 DOI 10114518660291866038 2
[PPJ07] PAPARIZOS S PATEL J M and JAGADISH HV ldquoSIGOPTUsing schema to optimize XML query processingrdquo Data Engineer-ing 2007 ICDE 2007 IEEE 23rd International Conference on IEEE2007 1456ndash1460 3
[PSTW16] PAJER S STREIT M TORSNEY-WEIR T et alldquoWeightLifter Visual Weight Space Exploration for Multi-Criteria De-cision Makingrdquo IEEE Transactions on Visualization and ComputerGraphics (2016) 2
[RAL17] REN D AMERSHI S LEE B et al ldquoSquares Support-ing Interactive Performance Analysis for Multiclass Classifiersrdquo IEEETransactions on Visualization and Computer Graphics 231 (2017) 61ndash70 ISSN 1077-2626 DOI 101109TVCG20162598828 3
[RHY14] REN D HOumlLLERER T and YUAN X ldquoiVisDesigner Expres-sive Interactive Design of Information Visualizationsrdquo IEEE Transac-tions on Visualization and Computer Graphics 2012 (2014) 2092ndash2101ISSN 1077-2626 DOI 101109TVCG20142346291 2
[RLD18] RUDOVIC O LEE J DAI M et al ldquoPersonalized machinelearning for robot perception of affect and engagement in autism ther-apyrdquo Science Robotics 319 (2018) DOI 101126sciroboticsaao6760 3
[RSG16] RIBEIRO M T SINGH S and GUESTRIN C ldquoWhy ShouldI Trust You Explaining the Predictions of Any Classifierrdquo Proceed-ings of the 22Nd ACM SIGKDD International Conference on KnowledgeDiscovery and Data Mining KDD rsquo16 San Francisco California USAACM 2016 1135ndash1144 ISBN 978-1-4503-4232-2 DOI 10114529396722939778 2ndash4
[SAS02] SARAVANAN R ASOKAN P and SACHIDANANDAM M ldquoAmulti-objective genetic algorithm (GA) approach for optimization of sur-face grinding operationsrdquo International Journal of Machine Tools andManufacture 4212 (2002) 1327 ndash1334 ISSN 0890-6955 DOI httpsdoiorg101016S0890-6955(02)00074-3 10
[SC11] SAHU R and CHATURVEDI A K ldquoMany-Objective Comparisonof Twelve Grid Scheduling Heuristicsrdquo 2011 3
[SHB14] SEDLMAIR M HEINZL C BRUCKNER S et al ldquoVisualParameter Space Analysis A Conceptual Frameworkrdquo IEEE Transac-tions on Visualization and Computer Graphics 2012 (2014) 2161ndash2170ISSN 1077-2626 DOI 101109TVCG20142346321 2
ccopy 2020 The Author(s)Computer Graphics Forum ccopy 2020 The Eurographics Association and John Wiley amp Sons Ltd
Das et al QUESTO Interactive Construction of Objective Functions for Classification Tasks
[SKBE17] SAKET B KIM H BROWN E T and ENDERT A ldquoVi-sualization by Demonstration An Interaction Paradigm for Visual DataExplorationrdquo IEEE Transactions on Visualization and Computer Graph-ics 231 (2017) 331ndash340 ISSN 1077-2626 DOI 101109TVCG20162598839 2
[SLT17] SUN Y LANK E and TERRY M ldquoLabel-and-Learn Visu-alizing the Likelihood of Machine Learning Classifierrsquos Success Dur-ing Data Labelingrdquo Proceedings of the 22Nd International Confer-ence on Intelligent User Interfaces IUI rsquo17 Limassol Cyprus ACM2017 523ndash534 ISBN 978-1-4503-4348-0 DOI 10114530251713025208 3
[SRL07] STUMPF S RAJARAM V LI L et al ldquoToward HarnessingUser Feedback for Machine Learningrdquo Proceedings of the 12th Inter-national Conference on Intelligent User Interfaces IUI rsquo07 HonoluluHawaii USA ACM 2007 82ndash91 ISBN 1-59593-481-2 DOI 10 114512162951216316 2
[SRL09] STUMPF S RAJARAM V LI L et al ldquoInteracting Mean-ingfully with Machine Learning Systems Three Experimentsrdquo Int JHum-Comput Stud 678 (Aug 2009) 639ndash662 ISSN 1071-5819 DOI101016jijhcs200903004 3
[SSZ17] S DOMINIK S MICHAEL Z LEISHI et al ldquoWhat you see iswhat you can change Human-centered machine learning by interactivevisualizationrdquo Neurocomputing 268 (2017) 164ndash175 3
[TCWM18] T LI CONVERTINO G WANG W and MOST H ldquoHyper-Tuner Visual Analytics for Hyperparameter Tuning by ProfessionalsrdquoMachine Learning from User Interaction for Visualization and Analyt-ics IEEE VIS 2018 (2018) 3
[TDCF07] TULLIO J DEY A K CHALECKI J and FOGARTY JldquoHow It Works A Field Study of Non-technical Users Interacting withan Intelligent Systemrdquo Proceedings of the SIGCHI Conference on Hu-man Factors in Computing Systems CHI rsquo07 San Jose CaliforniaUSA ACM 2007 31ndash40 ISBN 978-1-59593-593-9 DOI 10114512406241240630 3
[THHLB13] THORNTON C HUTTER F HOOS H H and LEYTON-BROWN K ldquoAuto-WEKA Combined selection and hyperparameter op-timization of classification algorithmsrdquo Proceedings of the 19th ACMSIGKDD international conference on Knowledge discovery and datamining ACM 2013 847ndash855 3
[TLB11] TAMUZ O LIU C BELONGIE S et al ldquoAdaptively Learn-ing the Crowd Kernelrdquo Proceedings of the 28th International Con-ference on International Conference on Machine Learning ICMLrsquo11Bellevue Washington USA Omnipress 2011 673ndash680 ISBN 978-1-4503-0619-5 2ndash4
[TLKT09] TALBOT J LEE B KAPOOR A and TAN D S ldquoEnsem-bleMatrix interactive visualization to support machine learning withmultiple classifiersrdquo CHI Ed by JR DAN R OLSEN ARTHURRICHARD B HINCKLEY KEN et al ACM 2009 1283ndash1292 ISBN978-1-60558-246-7 2
[VDEW11] VAN DEN ELZEN S and van WIJK J J ldquoBaobabview In-teractive construction and analysis of decision treesrdquo Visual Analyt-ics Science and Technology (VAST) 2011 IEEE Conference on IEEE2011 151ndash160 2 4
[WEF13] WALKER D J EVERSON R and FIELDSEND J E ldquoVisu-alizing Mutually Nondominating Solution Sets in Many-Objective Op-timizationrdquo Trans Evol Comp 172 (Apr 2013) 165ndash184 ISSN 1089-778X DOI 101109TEVC20122225064 3
[WFE12] WALKER D FIELDSEND J and EVERSON R ldquoVisualisingMany-objective Populationsrdquo Proceedings of the 14th Annual Confer-ence Companion on Genetic and Evolutionary Computation GECCOrsquo12 Philadelphia Pennsylvania USA ACM 2012 451ndash458 ISBN 978-1-4503-1178-6 DOI 10114523307842330853 3
[WLDW01] WOLFMAN S A LAU T DOMINGOS P and WELDD S ldquoMixed Initiative Interfaces for Learning Tasks SMARTeditTalks Backrdquo Proceedings of the 6th International Conference on Intel-ligent User Interfaces IUI rsquo01 Santa Fe New Mexico USA ACM2001 167ndash174 ISBN 1-58113-325-1 DOI 10 1145 359784 360332 3
[WN17] WENSKOVITCH J and NORTH C ldquoObservation-Level Inter-action with Clustering and Dimension Reduction Algorithmsrdquo Pro-ceedings of the 2Nd Workshop on Human-In-the-Loop Data AnalyticsHILDArsquo17 Chicago IL USA ACM 2017 141ndash146 ISBN 978-1-4503-5029-7 DOI 10114530772573077259 2
[YL09] YEH I and LIEN C ldquoThe comparisons of data mining tech-niques for the predictive accuracy of probability of default of credit cardclientsrdquo Expert Systems with Applications 362 Part 1 (2009) 2473 ndash2480 ISSN 0957-4174 DOI httpsdoiorg101016jeswa200712020 8
[YSCR18] YANG Q SUH J CHEN N and RAMOS G ldquoGroundingInteractive Machine Learning Tool Design in How Non-Experts ActuallyBuild Modelsrdquo ACM 2018 2 3
[ZSZR18] Z XIAOJIN SINGLA A ZILLES S and RAFFERTY A NldquoAn Overview of Machine Teachingrdquo CoRR abs180105927 (2018) 23
ccopy 2020 The Author(s)Computer Graphics Forum ccopy 2020 The Eurographics Association and John Wiley amp Sons Ltd

Das et al QUESTO Interactive Construction of Objective Functions for Classification Tasks
3 Design space of objectives and constraints
We define objectives as a component or a function term of a multi-objective objective function These objectives are also referred to asuser preferences goals subjective requirements etc in the paperNext each of these objectives may have constraints For example auser may have an objective of finding a highly performant modelA constraint can be the accuracy be calculated using precision re-call or F1-score metrics Similarly another objective could be thatthe classifier performs better on hand-chosen data instances In thisobjective one constraint may be that it labels similar data instances(specified by the user) in the same class label
We analyzed 61 papers from visual analytics and interactive ma-chine learning areas which included 18 VA systems to formulatea set of objectives and their respective constraints for a classifica-tion task (dagger) Using an affinity diagramming approach we clusteredsimilar papers and VA systems with similar interactive constraintsFurther we iteratively refined these until we were satisfied withthe relationships between the clusters For example based on theliterature we derived constraints such as Critical that representsdata instances which users find important to be correctly predictedCandidate that captures data instances which are strong represen-tatives of a class label (and not necessarily Critical) Finally wederived 15 constraints users can define organized into 4 objectivecategories for a classification task Instance-based Feature-basedTrain-objectives and Test-objectives described below
31 Instance-based
This objective allows users to specify that the classifier should per-form well on a set of data instances While many of the constraintsin this section involve adjusting weights on specified data instanceswe categorized them separately based on how they are revealed inthe user interface and the user task supported
Similarity This constraint captures the degree of similarity (or dif-ference) between data items A user specifies a set of similar datainstances and expects them to be predicted in the same class labelUsers can also specify pairs of data items to be predicted in dif-ferent classes However in both cases (ldquosimilarrdquo and ldquodifferentrdquo)users do not specify the class in which the specified data instancesshould be placed There are various VA systemstechniques wheresimilarity and difference between data samples was sought fromusers to construct models For example Tamuz et al discussed asimilarity matrix to infer if an object rdquoArdquo is similar to rdquoBrdquo or rdquoCrdquofor a user [TLB11] Another system Flock asked crowd workersto specify paired examples to define similar or different instancesof positive or negative class [CB15]
Candidate This constraint type refers to user feedback on a set ofdata instances from the training set which are good representativesof their class Based on prior knowledge users can specify that datainstances represent a given class well
Critical This constraint lets users specify a set of data instances toshow that correct prediction of these are critical for them This con-straint can be specified when users want a set of data instances to
dagger The full list of papers is provided in the supplemental material
be correctly classified while the accuracy of other data instances isless important For example consider a financial analysis scenariowhere a company needs a classifier to predict which clients shouldbe granted a loan The analyst might know a few clients who aremore profitable than others Thus he or she might prefer a classi-fier that correctly predicts these clients than the less profitable onesUsers can assess constructed classifiers based on how accuratelythey predict the specified critical data instances Other researchershave looked at critical data instances For example Lime is a MLalgorithm which helps users to interpret models by explaining theirpredictions on data instances that are critical [RSG16]
Ignore This constraint specifies if the user intends to remove noisyor outlier data instances from the training set Removal of noise oran outlier increases the accuracy of prediction and the power of themodel to generalize on unseen data This constraint may also in-clude specification of data instances whose prediction (correct orincorrect) is irrelevant to users Elzen et al prototyped Baobab-View for inspecting outliers and noisy data to improve interactiveconstruction of decision trees [VDEW11]
32 Feature-based
This category includes items which users can specify to help amodel in its learning process The following constraints defined un-der this category operates at the level of the features (or attributes)
Feature selection This constraint allows users to specify fea-tures that are important for classification A classifier will only usethe specified features when it is learning the data or the Auto-MLsystem will penalize any model that uses features other than theones specified by the user This is inspired from previous workthat showed the value of human-centered feature selection in modelconstruction [KPB14 LWLZ17 CB15]
Correlation and Variance This constraint allows users to spec-ify correlation and variance in the features based on their domainexpertise Users specify perceived correlation between features andvariance per feature in the data Correlation and Variance are basedon the userrsquos domain knowledge and not necessarily grounded inthe training data For example a financial analyst might know thatexperienced bank customers in the age group of 40minus 50 are morelikely to spend economically and pay on time Thus the featuresage and payment are correlated based on the domain knowledge ofthe user which may or may not be present in the data Hall showeda feature selection method based on correlation in the data [H99]Instead of computing correlation in the features from the trainingdata users may specify correlation and variance in the data an in-formation that affects how the model learns from the data
33 Train-objectives and Test-objectives
ML models can be evaluated using conventional model met-rics or constraints such as Accuracy Precision Recall and F1-Score When applied to the training set we consider them Train-objectives compared to applying them to the test set when we con-sider them Test-objectives Together these two objectives help userscontrol for model overfitting Using the Train-objectives users canverify how well the model is learning from the data while using
ccopy 2020 The Author(s)Computer Graphics Forum ccopy 2020 The Eurographics Association and John Wiley amp Sons Ltd
Das et al QUESTO Interactive Construction of Objective Functions for Classification Tasks
the Test-objectives they can validate if the model generalises wellon unseen data For example one can first find models with hightraining accuracy (ie low bias) then tune the hyperparametersto achieve a high test set accuracy (ie low variance) and finallyweight or rank these constraints to find classifiers that show an op-timal tradeoff between bias and variance
4 QUESTO System Design and Description
QUESTO helps users interactively construct classifiers that ad-dress their subjective goals specified in the form of interactiveobjective functions The interface is designed to facilitate inter-active specification of constraints at the data instance and fea-ture level QUESTO enables users to see specified constraints andaddremoveedit them QUESTO supports classifier inspection andselection from a set of candidate models generated from the user-specified objective function with Hyperopt in the backend
Upon data import QUESTO splits the datasets into a trainingset multiple test sets and a final validation set The training set isused to build the initial model The multiple test sets are used foreach iteration of user feedback to test how well the model meets theobjectives and constraints specified When users are satisfied thereis a final validation set (which is never seen by the model duringthe previous iterations) used to validate the model
41 User Interface and Interactions
Data table view It displays the training and test data sets intwo data tables In addition it supports specification of 4 typesof constraints Critical Ignore Similarity and Candidate Tospecify Critical or Ignore constraints users can click on the row(See Figure 4-E) To specify a Similarity constraint users canspecify either rdquoSimilarrdquo or rdquoDifferentrdquo on pairs of data instancesTo specify the Candidate constraint (see Figure 4-B E) userscan select rows within a class to specify example data instancesWhen users select a model from the model interpreter view theclass label column of both training and test data shows correctpredictions with a check mark while incorrect predictions areshown with a cross mark (see Figure 1-A)
Scatterplot matrix view Shows the relationship between variousattributes and helps users find missing data outliers etc
Confusion matrix A confusion matrix for both the training andtest dataset is shown on the right of the data table view (see Fig-ure 1-C) Clicking on cells in the confusion matrix filters the datatable to show data instances responsible for the prediction
Feature panel The features of the data are visualized as a parallelcoordinate plot (Figure 4-G) Brushing on any feature (representedas vertical lines) allow users to filter the data instances in the datatable Users can specify a Feature Selection constraint by clickingon the cells over the vertical lines (Figure 4-F) Further right click-ing on these cells specifies a Correlation and Variance constraint
Objective function stack This view visualizes the interactive ob-jective function Each box (see Figure 1-G) represents an objec-tive category and contains constraints under the categorization de-scribed in section 3 Users can specify a constraint by clicking
on its name (a specified constraint is shown with a green check-mark see Figure 1-E) When users explore and interact with thedata QUESTO automatically infers constraints such as CandidateCritical etc However users can override the inferred constraintsif they disagree Underneath each box is a slider (Figure 1-D E)which allows users to adjust the weight of each objective Users canalso reorder constraints vertically to indicate priority
Model interpreter Shows metrics of k ML models Users canchoose to inspect each model by seeing it in a parallel coordinateor in a star plot (see Figure 1-F) Users can select a model whichupdates the data table view (showing predictions for each data in-stance) and updates the confusion matrices This view also showsthe top 3 features used by the classifier
Rule Panel When users specify any constraints by filtering datainstances QUESTO saves these data instances as part of a rule(Figure 1-I) that can be interacted with through this view
42 Technique
This section describes the underlying techniques in QUESTO thatdrive the construction of an interactive objective function (seeFigure 3) QUESTO uses an Auto-ML module called Hyperopt[KBE14] to find an optimal hyperparameter combination whichmay meet user goals QUESTO specifies a learning algorithmand a set of hyperparameters for Hyperopt to construct models(eg we used a random forest classifier with the hyperparame-ters MaxDepth Criteria (ldquoginirdquo or ldquoentropyrdquo) and MinSamples)Our technique uses an iterative model construction and evaluationworkflow Users formulate their preferences in the objective func-tion O by specifying a set of constraints Φ and a weight vectorW Per iteration Hyperopt consumes O to construct and rank newmodels M This cycle allows users to search for models by definingtheir goals and constraints in O
421 Classifier Creation and Selection
Model Construction QUESTO splits the loaded data set Z intotraining D multiple test sets T = T1T2T3Tt and a validation setV Next it triggers Hyperopt to start the model optimization pro-cess on the supplied data D to build M classifiers of size N (M =m1m2m3 mN ) It constructs each model mi using a suppliedlearning algorithm κ and sampled B hyperparameter combinationsWe used Scikit-Learnrsquos machine learning package to build the clas-sifiers [MLb] further supported by Hyperopt which provides newhyperparameter combinations Finally each of the trained model mipredicts class labels for both D and Ti The models are evaluatedbased on their performance on the supplied objective function O
Model Optimization Hyperopt traverses the space of pre-definedhyperparameters to construct a set of models As an input Hyper-opt expects a list of hyperparameters to tune H = h1h2hB anda domain space νi for each hyperparameter hi We pre-selectedB hyperparameters and their domain space For example if adomain space of 2 minus 100 for MaxDepth hyperparameter waschosen Hyperopt will sample a value between 2 to 100 Fur-ther using user-defined constraints such as Testing-Accuracy orCross-val-score Hyperopt samples the hyperparameter space tocontrol for model overfitting Hyperopt evaluates each model in
ccopy 2020 The Author(s)Computer Graphics Forum ccopy 2020 The Eurographics Association and John Wiley amp Sons Ltd
Das et al QUESTO Interactive Construction of Objective Functions for Classification Tasks
Figure 3 QUESTO system architecture
M with the supplied objective function O The objective functionO is constructed by a weighted linear combination of user-definedconstraints Φ Each model mi in M gets a objective function scoreS = s1s2 sN based on its performance on O Hyperopt ranks theN classifiers (we set N = 100 but can be changed) based on theobjective function scores in S
422 Interactive Objective Function Creation
The set of constraints Φ represent the different categories of goalsand constraints in our taxonomy (see Section 3) Using QUESTOusers can define the following constraints interactively
Critical Hyperopt trains a model mi on the supplied training setD with original labels Ldo Next it predicts labels on the trainingset as Ldp Users specify a list of IDs of x critical data instancesC = c1c2cx QUESTO retrieves the prediction on the criticaldata instances based on supplied IDs C as Lcp (Lcp sub Ldp)QUESTO retrieves the original class labels of the critical datainstances as Lco QUESTO initializes the score for the Criticalconstraint as s1 = 0 It compares Lco with Lcp to find the numberof correct matches and save in s1 (normalized between 0 to 1)
Similarity This constraint is of two types The first type capturessimilar data items when a user specifies a list of data items Y thatare similar and should be placed in the same class The algorithmiterates over Y to find the original class label Lno If Y belongs tomore than one class label the most frequent class label is assignedto Lno Next the algorithm matches the prediction Lnp with theoriginal class label Lno where i is the index iterating from 0 tob (the number of user-specified similar data instances) For everycorrect match the score for this constraint s2a gets a +1 scoreNext it normalizes s2a as (s2a)b to get a score between 0 to 1
The second type consists of users specifying items that should bedifferent A user does so by specifying a list of tuples σ where eachitem in the list is represented as σi = (σxσy) Here σx and σy aredata instances that users expect to be predicted in different classesThe algorithm iterates over σ and matches the predicted class labelLσpi of item σi to class label Lσp j of item σ j For every incorrectmatch the score for this constraint s2b gets a +1 point Next itnormalizes s2b as (s2b)b to get a score between 0 to 1 Finallythe score for this constraint is computed as s2 = (s2a + s2b) Wenormalize s2 to get a score between 0 to 1
Candidate Users specify a list of b data items in G with a classlabel A The algorithm increases the training data weights (W =w1ws2ws3wb) for these data items It inputs W to Hyperopt
which trains the classifiers M based on the updated weights The al-gorithm iterates through G and matches each items predicted classlabel L f p with A The score for this metric s3 is initialized as 0For each correct match in the iteration s3 is assigned a +1 pointFinally the algorithm normalizes s3 as s3 = s3b
Ignore Users specify a list of data items I The algorithm removesthese data items from D to form a new training set DII Furtherwhen computing classification model metrics such as PrecisionRecall etc the algorithm removes the data items in I from D
Accuracies This captures the classification model metrics definedas part of the category Train-objectives and Test-objectives (seesection 3) These are Precision Recall F1-Score etc For each ofthese QUESTO uses Scikit-Learns classification metrics [MLb]
Feature Selection Correlation and Variance QUESTO incor-porates a user-based feature selection technique Users can guidefeature selection in one of two ways First users can select a setof features Fd using the feature panel QUESTO interpretes thatthe user chose a set of features which has a high correlation withthe class label For model construction QUESTO will only use thefeatures in Fd Second users can specify a set of correlated fea-tures Fc or features with low variance in Fv QUESTO automati-cally discards the features which show high correlation (negativeor positive) with each other and selects the ones which are uncorre-lated Similarly QUESTO discards features with low variance Theselected features F = FminusFc or F = FminusFv are fed to Hyperopt
Objective Function Formulation The resulting objective func-tion in QUESTO is a weighted linear combination of constraintsΦ The algorithm computes the scores for each constraint Finallyit linearly combines these individual constraint scores as shown inthe equation O = s1 lowastω1 + s2 lowastω2 + s3 lowastω3 + s4 lowastω4 + s5 lowastω5where s1s2s3 etc are the scores of the user-specified constraints
Weighting Preferences Initially the weights W = ω1ω2 ωUare evenly set for each constraint in Φ However users can over-ride and specify weightings for each constraint by interaction tech-niques shown in Section 41 The weight vector W sums to 1 toensure correctness in computing the contribution of each item in Φ
Guarding Against Data Leakage QUESTO searches for bestmodels from a pool of sampled ML models (facilitated by Hyper-opt) This is different from optimizing the internal algorithm of MLmodels such as designing the loss function for a random forest Asour technique treats each model as a black box it can optimize formodels that may perform better on train or test data This is similarto conventional model construction processes where ML practi-tioners aim for a higher training or test accuracy or a balance be-tween each However to guard against data leakage our techniqueuses multiple sets of test data T = T1T2Tt (each used per itera-tion of model construction) When QUESTO loads input data Z itautomatically splits into three sets train D test T and validationV Next it makes t subsets of the test data each used per iterationof model construction This serves to address potential data leak-age as the models are tested on unseen data and during training thetest data is not used Per iteration the model gets a new test set Tito compute the objective score (test-accuracy test-F1-score etc) Inaddition when the model is exported by the user they get to validateit on the validation set V which is not used on any prior iteration
ccopy 2020 The Author(s)Computer Graphics Forum ccopy 2020 The Eurographics Association and John Wiley amp Sons Ltd
Das et al QUESTO Interactive Construction of Objective Functions for Classification Tasks
5 Usage Scenario
We describe a scenario showing how QUESTO can help users buildclassifiers on an imbalanced dataset through the specification of in-teractive objective functions Chris is a public policy analyst (withbasic knowledge of ML) is analyzing San Franciscorsquos employmentdata to predict employees department [Off] (10000 samples) Chrisexplores the salary data in QUESTO and begins constructing clas-sifiers They inspect the best classifier from the model interpreterto observe that it scored poorly on both training and test set (avg48 accuracy) Chris explores the confusion matrix to discover that80 of the original labels are of type public service indicating thatthe data is imbalanced (there are 5 class labels) While the currentmodel correctly predicted 70 of this label type it failed to predictthe other labels accurately Chris expects the classifier to predicteach class label with at least 80 accuracy to be valuable for theiranalysis Next using the objective function stack view Chris spec-ifies the constraint F1-Score to account for the imbalanced natureof the dataset and the constraint Cross-val-score to construct gen-eralisable models
Chris triggers QUESTO to construct a set of new classifiers (seenthrough the model interpreter) based on the updated objective func-tion They click on model 2 as it shows the best performance on allthe specified constraints in the star plot view However other thanthe class public service) this model failed to perform as per expec-tation on other labels For example the label culturalrecreationand adminfinance showed 0 correctly predicted data items Mo-tivated to resolve these two classes Chris brushes on the featureretirement on the feature panel to filter jobs with high retirementbenefits Next Chris picks the constraint Candidate from the drop-down menu as seen in Figure 4-B They click on a set of data itemsof label administrationfinance on the table (shown with a greenhighlight see Figure 4-E) When Chris specifies the Candidate con-straint QUESTO automatically records the selected data instancesas part of a rule (see Figure 1-I) Chris assigns it a custom namehigh-retirement Next they filter the data instances using the fea-ture panel with low overtime and high salary values Chris speci-fies a subset of these data instances as Candidate constraint for theclass culturalrecreation QUESTO saves these data instances as arule which Chris calls high-sal (Figure 1-I)
Chris inspects one of the new models (model 2) by hovering overthe two rules (high-retirement and high-sal shows associated dataitems in the table view) Quickly glancing through these data itemsChris observes that the prediction error is less than 10 which theyfind acceptable Next Chris explores the confusion matrices andfinds that the performance score for the model increased to 72accuracy (see Figure 5-BC) Furthermore Chris notices that themodelrsquos performance improved significantly achieving on average70 accuracy for all classes except adminfinance In order to boostthe performance of the label adminfinance Chris specifies all thedata instances of this label (in the training set with more than 80000retirement benefits total 12 items) as a Critical constraint
Iterating further Chris finds a new set of classifiers from the col-lection satisfied the constraints Candidate Critical and F1-ScoreHowever the performance dropped on the test set in all of thesemodels To further emphasize the performance on the test set as animportant criteria Chris specifies the Testing-Accuracy constraint
Figure 4 A Critical constraint B Other constraints C Classselector D Filter tags E Selected data F Select features corre-lation and variance G Parallel coordinate plot
Figure 5 Views for Evaluating Model Performance
In addition they lower the weights on the constraints in thecategories Train-objectives and Instance-based and increases theweight on the category Test-objectives (see Figure 1-D E) Theyalso re-order individual constraints specifying highest priorityto the constraint Candidate Chris constructs new classifiers andchooses model 3 based on its performance as viewed in the starplot view They hover over the two custom rules (see Figure 1-I) tosee that most of the data instances in them are correctly predictedand performs equally well on all class labels Content with thecurrent model Chris tests the model on a validation set and thenexports it for future use This usage scenario shows how QUESTOenabled a domain expert to build an accurate classifier on animbalanced dataset by exploring various objective functions thatcaptured his subjective preferences
6 Evaluation
Other than using interactive visual interfaces like QUESTO twopopular alternatives to constructing classifiers are (1) manuallycreating them via code or command-line (CMD) interfaces and (2)automatically generating them using Auto-ML We wanted to com-pare QUESTO with manually coding to verify if QUESTO is easierand faster to specify constraints Furthermore we wanted to com-pare QUESTO with Auto-ML to verify if QUESTO satisfies sub-jective user goals better and to compare the resulting accuracy Weconducted a within-subject controlled lab user study of QUESTOcomparing it with CMD and Auto-ML to construct a classifier Ourstudy addresses the following research questions
RQ1 Is QUESTO easier and faster to use than CMD workflowsRQ2 Does QUESTO build more accurate models than
automatically-generated models from Auto-MLRQ3 Does QUESTO build models that addresses user-specified
constraints better than models from Auto-ML
We hypothesize the interactive visual interface of QUESTO will
ccopy 2020 The Author(s)Computer Graphics Forum ccopy 2020 The Eurographics Association and John Wiley amp Sons Ltd
Das et al QUESTO Interactive Construction of Objective Functions for Classification Tasks
be easier and faster to use compared to command-line interfacesHere ldquofasterrdquo refers to the time it takes to specify constraints andconstruct classifiers it does not include the time needed to trainclassifiers Further we hypothesize that Auto-ML will generatemore globally accurate models given the objective function op-timizing towards a specified accuracy metric such as high cross-validation score However RQ3 tests our hypothesis that QUESTOwill be better at building models that fit specific user constraintsgiven the customized objective function thus illuminating thistradeoff between accuracy and user goals
In the literature there is no well-defined metric to measure howwell user-defined constraints are satisfied in classifier constructionThus we defined constraint satisfaction score as a metric thatcaptures how well a model attains user-specifed constraints suchas Critical Candidate etc These scores are normalized between0minus 1 (higher is better) It is expressed as (sumU
0 ωi lowast γi)U where ω
is the weight of U constraints γ is the score of each constraint U isthe total number of specified constraints in the objective function
We recruited 16 participants (7 Male 9 Female) aged between21-29 (M=25 SD=291) by inviting participants through our uni-versity mailing lists We required them to at least have a basic ex-pertise in writing python code with elementary understanding ofML All of the participants (undergraduate and graduate students)were familiar with basicintermediate data analysis using tools suchas MS Excel Tableau etc The experiment lasted 60 minutes andwe compensated each participants with a $10 Amazon gift cardThe study was conducted using a 17-inch display and a mouse
61 Study Design
We began the study with a practice session teaching users howto interact with both QUESTO and CMD (with VS Code as thescripting editor) During the practice session participants were en-couraged to ask questions to clarify uncertainty in relation to theworkflow or the interaction design We proceeded to the experi-mental sessions only when the participants felt confident in usingeach system For quantitative evaluation each participant interactedwith both QUESTO and CMD using one dataset Furthermore theorder of the interfaces (QUESTO and CMD) the datasets andthe tasks were randomized to remove any orderinglearning effectWe considered these dependent variables for quantitative analysis(1) Task completition times in specifying an objective functionthrough QUESTO or CMD (2) Model accuracy the accuracy ofthe model constructed using QUESTO CMD and Auto-ML standalone (3) Constraint satisfaction score measure to capture con-straints satisfied by the model and (4) User preference rating av-erage preference rating of Ease of Use for QUESTO and CMD
62 Datasets
For the practice session we provided a dataset of 10000 credit cardtransaction records [YL09] The data has attributes such as bill paidmonth 1 bill paid month 2 bill paid month 3 account balanceetc It was a binary classification task to predict if a bank customerwill default on a bank loan or not For the experimental sessionswe provided San Franciscorsquos employment dataset [Off] containing5000 data items for the quantitative evaluation Each row in the data
contains information about an employeersquos remuneration containingattributes such as dental benefits annual salary monthly salaryextra benefits etc The task was to predict the employeersquos depart-ment (5 classes) For the qualitative evaluation we used a moviesdataset [Mov] (5000 samples) containing attributes such as budgetgross revenue facebook likes of lead actors director cast etc Thedata has three labels for movie rating high medium and low Fol-lowing best ML practices we use multiple test datasets so that theconstructed model never sees unseen data instances
63 Tasks and Procedure
In the practice session we asked users to perform 2 tasks per inter-face The first task was to design an objective function in QUESTOby specifying a Critical constraint They were asked to iterate mul-tiple times and improve the classifiers performance by refining theconstraint The next task was to add two more constraints (Similar-ity and Candidate) to the objective function in QUESTO and iter-atively improve the classifiers performance They repeat the sametasks by writing code and using CMD to run their code to con-struct a classifier For the quantitative evaluation participants arerandomly assigned an interface (QUESTO or CMD) Participantswere encouraged to think aloud while they interact with each sys-tem The interviewer was a silent observer and was away from theparticipant to mitigate Hawthorne and Rosenthal effect during thesession Participants performed 3 tasks per interface (6 tasks total)Each of the tasks were in increasing level of difficulty
Task 1 Specify the constraint Similarity (Max time 3 minutes)Task 2 Specify Critical and Candidate (Max time 5 minutes)Task 3 Specify Critical Similarity Candidate F1-Score Preci-
sion Accuracy and Cross-Validation (Max time 7 minutes)
For the qualitative evaluation we asked participants to freely useQUESTO (may specify any constraint) to build a classifier (on themovies data) and improve its objective function score in 5 minutes
64 Data Collection
For quantitative assessment we saved log data which stores (periteration) models selected by users their learning algorithms andhyperparameters predicted class labels interacted data items user-specified constraints etc When participants completed the threetasks on both interfaces we asked them to fill a NASA-TLX form[HS88] and a post-study questionnaire with a set of likert scalequestions We asked questions to seek user preference rating to eachinterfacersquos various dimensions such as (1) Ease of use (2) Flexi-bility (3) Fun to use (4) Learnability and (5) Intuitiveness Afterthe qualitative evaluation we conducted a semi-structured interviewasking open-ended questions about the workflow system usabilityand interaction design for each interface In this interview we askedquestions such as (1) Describe your thought process while you in-teracted with QUESTO (2) Explain your experience in construct-ing an objective function interactively vs through writing code(3) How do you think we can improve the current workflow and de-sign of QUESTO We also captured video and audio of participantsscreen while they interacted with QUESTO
ccopy 2020 The Author(s)Computer Graphics Forum ccopy 2020 The Eurographics Association and John Wiley amp Sons Ltd
Das et al QUESTO Interactive Construction of Objective Functions for Classification Tasks
Figure 6 The study results comparing QUESTO with coding interfaces and Auto-ML techniques for classification tasks
65 Quantitative Analysis
For the following we used the Friedman Test for Repeated-Measures as it is a good indicator of statistical significance formulti-class classifiers with multiple datasets which may not fol-low a normal distribution as suggested by [Dem06] Furthermorewe utilised Post-hoc Wilcoxon signed-rank tests with Bonferronicorrection (new p value = 003) to test for statistical significance
Ease of use To answer RQ1 we used likert scale rating scores(5-point scale) from participants (average ease of use rating 464higher is better see Figure 6-D) The ease of use of QUESTO wassignificant across all tasks (χ2(1) = 4803 p lt 003) thus answer-ing RQ1 that QUESTO is easier to use than CMD
Task completion times Participants were significantly faster tospecify constraints in QUESTO than CMD (Figure 6-C) Every par-ticipant completed all tasks except for three who failed to completetask 3 in the allotted time using CMD In these cases we recordedthe maximum alotted time for that task Quantitatively we foundstatistically significant difference in task completion time for alltasks Task1 (χ2(1) = 160 p lt 003) Task2 (χ2(1) = 160 p lt003) and Task3 (χ2(1) = 40 p lt 003) This answered RQ1 thatQUESTO is faster to specify constraints than CMD
Model Accuracies To answer RQ2 we compared the models gen-erated using QUESTO CMD and Auto-ML with respect to theiraccuracies We found QUESTO generated similar quality modelsin relation to accuracies as produced by CMD (refer Figure 6-A)However accuracies generated by models from Auto-ML standalone were higher in comparison to QUESTO We observed sta-tistically significant difference in the model accuracy for task 1(χ2(1) = 1225 p lt 003) and task 3 (χ2(1) = 40 p lt 003)
Constraint satisfaction We found that QUESTO outperformedAuto-ML in meeting user-specified constraints for all tasks Task1(χ2(1) = 625 p lt 003) Task2 (χ2(1) = 225 p lt 003) andTask3 (χ2(1) = 90 p lt 003) This answered RQ3 We analysedthis based on data collected from the employment dataset [Off](users were given the example data items to specify as constraints)and on the movie dataset [Mov] (users freely specified constraints)
66 Qualitative Analysis
User Preferences We measured user preferences using 5-pointlikert scale rating QUESTOrsquos user preference ratings (out of 5)
were higher than CMD workflow in various aspects such as Easyof use (Q 453 CMD 322) Fun to use (Q 469 CMD 288) Learnable (Q 434 CMD 297) and Intuitive (Q 438 CMD287) (see Figure 6-D) In addition through the NASA-TLXsurvey we found that average participantsrsquo cognitive workload wassignificantly lower in QUESTO than CMD interfaces (Q 430CMD 887 out of 10 lower is better) Based on these results itis likely that participants preferred QUESTO compared to usingthe CMD interface for objective function creation However manyparticipants found CMD comparably flexible to QUESTO tospecify preferences (Q 378 CMD 352) and debug models
Easy workflow Every participant found QUESTOrsquos interface andthe workflow easy to learn and use Users liked the table view withthe ability to filter and search for specific data items as examplesfor constraint specification P03 said ldquoI like how I can mouseoveron the cells of the confusion matrix to see incorrectly predicteddata itemsrdquo P08 added ldquoI frequently brush over the feature panelto filter data items by a set of attributes I care aboutrdquo Howeverusers recommended that more advanced sorting feature in the tablewould have helped them find appropriate examples quickly
Level of Detail Some participants had elementary knowledge ofpython and ML while a few others had in-depth ML expertise P09reflected ldquoBest part of this workflow is how easy the tool makesto change my constraints in terms of weighting or ordering themwhich lets me look into a new set of classifiersrdquo While advancedML users appreciated the idea of an interactive interface to definean objective function reflected that they would prefer to look at thenumerical weights on each constraint so that they can better trusthow the modeling engine is selecting classifiers P13 said Thoughthe objective function view is very useful I am not sure if I un-derstand whatrsquos happening on the background without knowing thenumerical weights on these constraints
Meaningful constraints Participants found the constraints inQUESTO appropriate and useful for classifier construction P10added ldquoI think the constraints make a lot of sense to me When Itest models I frequently look at specific data items to verify if theclassifier modeled the data correctlyrdquo However a few participantscommented that it would help if QUESTO could recommend itemsto consider next For example P03 suggested ldquoI think you can useprediction probabilities to reflect on how confident the model is oneach prediction That may help me specify better examplesrdquo
Intuitive model selection Users found the model interpreter view
ccopy 2020 The Author(s)Computer Graphics Forum ccopy 2020 The Eurographics Association and John Wiley amp Sons Ltd
Das et al QUESTO Interactive Construction of Objective Functions for Classification Tasks
useful to compare models based on their performance on the spec-ified constraints P17 noted ldquoFrom the star plot view I can inspectthe size of the polygons to select models that performed better onrelevant constraints I would prefer to mouseover (instead of click)to browse the model output results on the table and the confusionmatricesrdquo However participants wanted to see a bookmark featureto save models they like Furthermore one participant desired tosee how each constraint contributed to a change in model output tounderstand what interaction improved performance
Task complexity The three tasks in the user study had differentlevels of complexity While task 1 and task 2 involved satisfyingonly subjective user preferences task 3 included finding modelsthat are accurate yet address constraints such as Similarity Can-didate etc Participants found task 3 more challenging as findingthe right model that is accurate and addresses their personal goalswas difficult P15 noted ldquoIt was hard to improve the classifiers per-formance when I had more than 4 constraints to specify Howeverwith QUESTO I could rapidly test different weightingsrankings tothese constraints to find an optimal classifierrdquo
Conflicting constraints We observed that participants sometimesspecified conflicting constraints For example they specified a setof data item as a Candidate constraint but in a later iteration theyspecified a subset of these data items as a Ignore constraint AsQUESTO currently does not support alerting users about conflictsin future we plan to mitigate them in objective specification
Modeling process From the study we found that QUESTOrsquosworkflow does not help users understand the underlying modelingprocess Often participants wondered what interaction in the previ-ous iteration led to the improvement or degradation in the accuracyor the objective function score Future work could make the mod-eling process more transparent and allow users to reason about theimpact of their objective specification on classifier selection
7 Discussion
User-System Feedback loop Interactive objective functions mayguide an Auto-ML model solver to select models that weigh datainstances preferentially to better support user goals For examplean objective function with the Critical constraint will guide theAuto-ML solver to prefer classifiers that correctly predict specificitems In response users may inspect a model in relation to howwell it supports the specified constraints Thus interactive objec-tive functions employ a two-way feedback loop between the userand the system for (1) communicating preferences to find suitablemodels and (2) providing a medium for understanding classifierperformance Participants confirmed that (per iteration) they vali-dated models in relation to how well they support the constraints
Tradeoff Analysis Practically in a multi-objective optimizationproblem satisfying every objective might not be feasible [SAS02]due to a plethora of reasons including conflicting constraints math-ematical infeasibility noiseoutliers in the data high dimensional-ity etc [KLTH10] Formalizing user goals as a set of constraintsin an objective function facilitates searching for a set of pareto-optimal solutions which may only satisfy a subset of the specifieduser goals Furthermore visualizing these pareto-optimal modelshelp users inspect them and understand tradeoffs
ML users often seek models that support other customizedsubjective goalsobjectives that are personal and problem-specific([KLTH10]) This study validated that while QUESTO producedslightly less accurate models than Auto-ML model solvers theymet subjective user-specified constraints We envision that userswill need to find a balance between these two extremes
71 Limitations
Scope and assumptions of the user study In the study we timedeach task to ensure the study can be completed within a reasonabletime However in more realistic settings optimizing for (or lim-iting) time may not be meaningful Further we used pre-definedhyperameters within which Hyperopt sampled values to constructclassifiers The study results may vary if the set of hyperparametersused are different Also our study only included participants withbasic expertise of python and ML
Model overfitting Good ML practices entail that trained modelshave no knowledge of test data In QUESTO we follow the sameprocess The test data view in the data table allows users to inspectclassifiers by reviewing the predictions made at the data instancelevel Furthermore by specifying the objectives Train-objectivesand (and weighting them) users can control for model overfit-ting Nevertheless we are aware that if users do not specify theymay produce overfitted models However this may be the case forcommand-line classifier construction as well if addition of regular-izers or cross-validation approaces are not used
Scalability The current UI design is based on datasets of mod-est size Thus there are aspects of the UI that would become lessusable if datasets grew larger For example while the table viewsupports sorting and filtering the fundamental design of showingitems in a table may make finding individual relevant data itemschallenging However for larger datsets we can augment QUESTOwith visualisations that can aggregate data and show example dataitems on demand (eg grouped heatmap view etc)
8 Conclusion
In this paper we present a design space of constraints categorizingvarious user goals for a classification task Grounded in this designspace we developed a prototype system QUESTO that supports in-teractive construct of objective functions to specify their subjectivepreferences to a classifier Finally we validate the effectiveness ofQUESTO by a within-subject user study that proved that QUESTOis easier and faster to use than conventional command line alterna-tives We also demonstrate that while QUESTO produces slightlyless accurate classifiers than Auto-ML it produces models that bet-ter satisfy user-specified constraints This presents a step towardsunderstanding how to integrate people into Auto-ML processes
9 Acknowledgements
Support for the research is partially provided by DARPA FA8750-17-2-0107 DARPA FA8750-17-2-010 NSF 1841349 and NSFIIS-1452977 The views and conclusions contained in this doc-ument are those of the authors and should not be interpreted asrepresenting the official policies either expressed or implied ofthe US Government
ccopy 2020 The Author(s)Computer Graphics Forum ccopy 2020 The Eurographics Association and John Wiley amp Sons Ltd
Das et al QUESTO Interactive Construction of Objective Functions for Classification Tasks
References[ACKK14] AMERSHI S CAKMAK M KNOX W B and KULESZA
T ldquoPower to the people The role of humans in interactive machine learn-ingrdquo AI Magazine 354 (2014) 105ndash120 2
[AF18] AHAMED F and FARID F ldquoApplying Internet of Things andMachine-Learning for Personalized Healthcare Issues and Challengesrdquo2018 International Conference on Machine Learning and Data Engi-neering (iCMLDE) 2018 19ndash21 DOI 101109iCMLDE201800014 3
[AFKT11] AMERSHI S FOGARTY J KAPOOR A and TAN D SldquoEffective End-User Interaction with Machine Learningrdquo AAAI 2011 3
[BGV16] BOUALI F GUETTALA A and VENTURINI G ldquoVizAssistAn Interactive User Assistant for Visual Data Miningrdquo Vis Comput3211 (Nov 2016) 1447ndash1463 ISSN 0178-2789 DOI 10 1007 s00371- 015- 1132- 9 URL httpdxdoiorg101007s00371-015-1132-9 2
[BLBC12] BROWN E T LIU J BRODLEY C E and CHANGR ldquoDis-function Learning distance functions interactivelyrdquo 2012IEEE Conference on Visual Analytics Science and Technology (VAST)2012 83ndash92 DOI 101109VAST20126400486 2
[BM17] BIRAN O and MCKEOWN K ldquoHuman-centric Justification ofMachine Learning Predictionsrdquo Proceedings of the 26th InternationalJoint Conference on Artificial Intelligence IJCAIrsquo17 Melbourne Aus-tralia AAAI Press 2017 1461ndash1467 ISBN 978-0-9992411-0-3 3
[BNHL14] BRADEL L NORTH C HOUSE L and LEMAN S ldquoMulti-model semantic interaction for text analyticsrdquo 2014 IEEE Conference onVisual Analytics Science and Technology (VAST) 2014 163ndash172 DOI101109VAST20147042492 2
[BYC13] BERGSTRA J YAMINS D and COX D D ldquoHyperopt Apython library for optimizing the hyperparameters of machine learn-ing algorithmsrdquo Proceedings of the 12th Python in Science Conference2013 13ndash20 3
[BZSA17] BERNARD J ZEPPELZAUER M SEDLMAIR M andAIGNER W ldquoA Unified Process for Visual-Interactive Labelingrdquo Euro-Vis Workshop on Visual Analytics (EuroVA) Ed by S MICHAEL and TCHRISTIAN The Eurographics Association 2017 ISBN 978-3-03868-042-0 DOI 102312eurova20171123 3
[CAK17] CHANG J C AMERSHI S and KAMAR E ldquoRevolt Collab-orative Crowdsourcing for Labeling Machine Learning Datasetsrdquo Pro-ceedings of the 2017 CHI Conference on Human Factors in ComputingSystems CHI rsquo17 Denver Colorado USA ACM 2017 2334ndash2346ISBN 978-1-4503-4655-9 DOI 10 1145 3025453 3026044URL httpdoiacmorg10114530254533026044 3
[CB15] CHENG J and BERNSTEIN M S ldquoFlock Hybrid Crowd-Machine Learning Classifiersrdquo Proceedings of the 18th ACM Confer-ence on Computer Supported Cooperative Work amp38 Social Comput-ing CSCW rsquo15 Vancouver BC Canada ACM 2015 600ndash611 ISBN978-1-4503-2922-4 DOI 10114526751332675214 3 4
[CES09] CRAMER H S M EVERS V S VAN et al ldquoAwarenessTraining and Trust in Interaction with Adaptive Spam Filtersrdquo Proceed-ings of the SIGCHI Conference on Human Factors in Computing Sys-tems CHI rsquo09 Boston MA USA ACM 2009 909ndash912 ISBN 978-1-60558-246-7 DOI 10114515187011518839 3
[CFEC17] CROUSER R J FRANKLIN L ENDERT A and COOK KldquoToward theoretical techniques for measuring the use of human effort invisual analytic systemsrdquo IEEE transactions on visualization and com-puter graphics 231 (2017) 121ndash130 3
[CHH19] CASHMAN D HUMAYOUN S F HEIMERL F et al ldquoAUser-based Visual Analytics Workflow for Exploratory Model Analy-sisrdquo Computer Graphics Forum 383 (2019) 185ndash199 DOI 101111cgf13681 3
[CW18] CHEN M and WANG H ldquoHow Personal Experience and Techni-cal Knowledge Affect Using Conversational Agentsrdquo Proceedings of the23rd International Conference on Intelligent User Interfaces Compan-ion IUI rsquo18 Companion Tokyo Japan ACM 2018 531ndash532 ISBN978-1-4503-5571-1 DOI 10114531803083180362 3
[DCCE18] DAS S CASHMAN D CHANG R and ENDERT AldquoBEAMES Interactive Multi-Model Steering Selection and Inspec-tion for Regression Tasksrdquo Symposium on Visualization in Data Sci-ence(VDS) Berlin Germany 2018 3
[Dem06] DEMŠAR JANEZ ldquoStatistical Comparisons of Classifiers overMultiple Data Setsrdquo J Mach Learn Res 7 (Dec 2006) 1ndash30 ISSN1532-4435 9
[EBN13] ENDERT ALEX BRADEL LAUREN and NORTH CHRIS ldquoBe-yond Control Panels Direct Manipulation for Visual Analyticsrdquo IEEEComputer Graphics and Applications 334 (2013) 6ndash13 ISSN 0272-1716 DOI 101109MCG201353 2
[EFN12] ENDERT A FIAUX P and NORTH C ldquoSemantic Interactionfor Visual Text Analyticsrdquo Proceedings of the SIGCHI Conference onHuman Factors in Computing Systems CHI rsquo12 Austin Texas USAACM 2012 473ndash482 ISBN 978-1-4503-1015-4 DOI 10 1145 22076762207741 2
[EHM11] ENDERT A HAN CHAO MAITI D et al ldquoObservation-level Interaction with Statistical Models for Visual Analyticsrdquo IEEEVAST 2011 121ndash130 2
[EIZ13] ESCUDERO J IFEACHOR E ZAJICEK J P et al ldquoMachineLearning-Based Method for Personalized and Cost-Effective Detectionof Alzheimerrsquos Diseaserdquo IEEE Transactions on Biomedical Engineer-ing 601 (2013) 164ndash168 ISSN 0018-9294 DOI 101109TBME20122212278 3
[EW16] EIBE F MARK A H and W IAN H The WEKA WorkbenchOnline Appendix for Data Mining Practical Machine Learning Toolsand Techniques 2016 3
[FKE15] FEURER M KLEIN A EGGENSPERGER K et al ldquoEfficientand robust automated machine learningrdquo Advances in Neural Informa-tion Processing Systems 2015 2962ndash2970 3
[GFT16] GILLIES M FIEBRINK R TANAKA A et al ldquoHuman-Centred Machine Learningrdquo Proceedings of the 2016 CHI ConferenceExtended Abstracts on Human Factors in Computing Systems CHI EArsquo16 San Jose California USA ACM 2016 3558ndash3565 ISBN 978-1-4503-4082-3 DOI 10114528515812856492 3
[GLG13] G SAMUEL L ALEXANDER G NILS et al ldquoLineUp Vi-sual Analysis of Multi-Attribute Rankingsrdquo IEEE Transactions on Vi-sualization and Computer Graphics (InfoVis rsquo13) 1912 (2013) 2277ndash2286 DOI 101109TVCG2013173 2
[H99] H MARK A Correlation-based Feature Selection for MachineLearning Tech rep 1999 4
[Hol16] HOLZINGER A ldquoInteractive machine learning for health infor-matics when do we need the human-in-the-looprdquo Brain Informatics32 (2016) 119ndash131 ISSN 2198-4026 DOI 101007s40708-016-0042-6 3
[HS88] H SANDRA G and S LOWELL E ldquoDevelopment of NASA-TLX (Task Load Index) Results of Empirical and Theoretical Re-searchrdquo Human Mental Workload Ed by H PETER A and M NA-JMEDIN Vol 52 Advances in Psychology North-Holland 1988 139 ndash183 DOI httpsdoiorg101016S0166-4115(08)62386-9 8
[HY16] HE Z and YEN G G ldquoVisualization and Performance Metricin Many-Objective Optimizationrdquo IEEE Transactions on EvolutionaryComputation 203 (2016) 386ndash402 ISSN 1089-778X DOI 101109TEVC20152472283 3
[HY17] HE Z and YEN G G ldquoComparison of visualization approachesin many-objective optimizationrdquo 2017 IEEE Congress on EvolutionaryComputation (CEC) 2017 357ndash363 DOI 101109CEC20177969334 3
ccopy 2020 The Author(s)Computer Graphics Forum ccopy 2020 The Eurographics Association and John Wiley amp Sons Ltd
Das et al QUESTO Interactive Construction of Objective Functions for Classification Tasks
[JZF09] JEONG D H ZIEMKIEWICZ C FISHER B et al ldquoiPCA AnInteractive System for PCA-based Visual Analyticsrdquo Computer Graph-ics Forum Vol 28 3 Wiley Online Library 2009 767ndash774 2
[KBE14] KOMER B BERGSTRA J and ELIASMITH C ldquoHyperopt-sklearn automatic hyperparameter configuration for scikit-learnrdquo ICMLworkshop on AutoML 2014 2 3 5
[KBS11] KULESZA T BURNETT M STUMPF S et al ldquoWhere AreMy Intelligent Assistantrsquos Mistakes A Systematic Testing ApproachrdquoProceedings of the Third International Conference on End-user Develop-ment IS-EUDrsquo11 Torre Canne Italy Springer-Verlag 2011 171ndash186ISBN 978-3-642-21529-2 3
[KCPE16] KIM H CHOO J PARK H and ENDERT A ldquoInterAxisSteering scatterplot axes via observation-level interactionrdquo IEEE trans-actions on visualization and computer graphics 221 (2016) 131ndash140 2
[KDJH08] KRESIMIR M DENIS G JELOVIC M and H HELWIGldquoInteractive Visual Steering ndash Rapid Visual Prototyping of a CommonRail Injection Systemrdquo IEEE Transactions on Visualization and Com-puter Graphics 146 (Nov 2008) URL httpswwwcgtuwienacatresearchpublications2008Matkovic-2008-Steer 2
[KEV18] KWON B C EYSENBACH B VERMA J et al ldquoCluster-vision Visual Supervision of Unsupervised Clusteringrdquo IEEE Transac-tions on Visualization and Computer Graphics 241 (2018) 142ndash151ISSN 1077-2626 DOI 101109TVCG20172745085 3
[KKW17] KWON B C KIM H WALL E et al ldquoAxiSketcher In-teractive Nonlinear Axis Mapping of Visualizations through User Draw-ingsrdquo IEEE Trans Vis Comput Graph 231 (2017) 221ndash230 2
[KLTH10] KAPOOR A LEE B TAN D and HORVITZ E ldquoInteractiveOptimization for Steering Machine Classificationrdquo Proceedings of theSIGCHI Conference on Human Factors in Computing Systems CHI rsquo10Atlanta Georgia USA ACM 2010 1343ndash1352 ISBN 978-1-60558-929-9 DOI 10114517533261753529 2 3 10
[KPB14] KRAUSE J PERER A and BERTINI E ldquoINFUSE Interac-tive Feature Selection for Predictive Modeling of High DimensionalDatardquo IEEE Transactions on Visualization and Computer Graphics2012 (2014) 1614ndash1623 ISSN 1077-2626 DOI 101109TVCG20142346482 4
[KPHH11] KANDEL S PAEPCKE A HELLERSTEIN J and HEERJ ldquoWrangler Interactive Visual Specification of Data TransformationScriptsrdquo ACM Human Factors in Computing Systems (CHI) 2011 2
[KTD17] KIM S TASSE D and DEY A K ldquoMaking Machine-Learning Applications for Time-Series Sensor Data Graphical and In-teractiverdquo ACM Trans Interact Intell Syst 72 (July 2017) 81ndash830ISSN 2160-6455 DOI 1011452983924 3
[KTH16] KOTTHOFF L THORNTON C HOOS H H et al ldquoAuto-WEKA 20 Automatic model selection and hyperparameter optimiza-tion in WEKArdquo Journal of Machine Learning Research 17 (2016) 1ndash5 3
[LHM13] LEMAN S C HOUSE L MAITI D et al ldquoVisual to para-metric interaction (v2pi)rdquo PloS one 83 (2013) e50474 2
[LSL17] LIU M SHI J LI Z et al ldquoTowards Better Analysis of DeepConvolutional Neural Networksrdquo IEEE Transactions on Visualizationand Computer Graphics 231 (2017) 91ndash100 ISSN 2160-9306 DOI101109TVCG20162598831 3
[LWLZ17] LIU S WANG X LIU M and ZHU J ldquoTowards betteranalysis of machine learning models A visual analytics perspectiverdquoVisual Informatics 11 (2017) 48 ndash56 ISSN 2468-502X DOI httpsdoiorg101016jvisinf201701006 4
[LYL14] LI M YANG S and LIU X ldquoDiversity Comparison of ParetoFront Approximations in Many-Objective Optimizationrdquo IEEE Transac-tions on Cybernetics 4412 (2014) 2568ndash2584 ISSN 2168-2267 DOI101109TCYB20142310651 3
[MLa] ML BIG Big ML httpsbigmlcom Accessed March20 2019 3
[MLb] ML SCIKIT LEARN Scikit Learn Model Metrics API Refer-ence httpsscikit- learnorgstablemodulesclasseshtmlmodule-sklearnmetrics Accessed March20 2019 5 6
[MLY17] MIQING L LIANGLI Z and Y XIN ldquoHow to Read Many-Objective Solution Sets in Parallel Coordinatesrdquo CoRR abs170500368(2017) 3
[Mov] Movies Dataset howpublished = https www kaggle comcarolzhangdcimdb-5000-movie-datasetmovie_metadatacsv note = Accessed 2018-12-11 8 9
[NKHK17] NUSHI B KAMAR E HORVITZ E and KOSSMANN DldquoOn Human Intellect and Machine Failures Troubleshooting IntegrativeMachine Learning Systemsrdquo Proceedings of the Thirty-First AAAI Con-ference on Artificial Intelligence AAAIrsquo17 San Francisco CaliforniaUSA AAAI Press 2017 1017ndash1025 3
[Off] OFFICE THE SAN FRANCISCO CONTROLLERrsquoS Employee Com-pensation Data https data sfgov org City -Management - and - Ethics Employee - Compensation 88g8-5mnd Accessed March 15 2019 7ndash9
[PBD10] PATEL K BANCROFT N DRUCKER S M et al ldquoGestaltIntegrated Support for Implementation and Analysis in Machine Learn-ingrdquo Proceedings of the 23Nd Annual ACM Symposium on User In-terface Software and Technology UIST rsquo10 New York New YorkUSA ACM 2010 37ndash46 ISBN 978-1-4503-0271-5 DOI 10114518660291866038 2
[PPJ07] PAPARIZOS S PATEL J M and JAGADISH HV ldquoSIGOPTUsing schema to optimize XML query processingrdquo Data Engineer-ing 2007 ICDE 2007 IEEE 23rd International Conference on IEEE2007 1456ndash1460 3
[PSTW16] PAJER S STREIT M TORSNEY-WEIR T et alldquoWeightLifter Visual Weight Space Exploration for Multi-Criteria De-cision Makingrdquo IEEE Transactions on Visualization and ComputerGraphics (2016) 2
[RAL17] REN D AMERSHI S LEE B et al ldquoSquares Support-ing Interactive Performance Analysis for Multiclass Classifiersrdquo IEEETransactions on Visualization and Computer Graphics 231 (2017) 61ndash70 ISSN 1077-2626 DOI 101109TVCG20162598828 3
[RHY14] REN D HOumlLLERER T and YUAN X ldquoiVisDesigner Expres-sive Interactive Design of Information Visualizationsrdquo IEEE Transac-tions on Visualization and Computer Graphics 2012 (2014) 2092ndash2101ISSN 1077-2626 DOI 101109TVCG20142346291 2
[RLD18] RUDOVIC O LEE J DAI M et al ldquoPersonalized machinelearning for robot perception of affect and engagement in autism ther-apyrdquo Science Robotics 319 (2018) DOI 101126sciroboticsaao6760 3
[RSG16] RIBEIRO M T SINGH S and GUESTRIN C ldquoWhy ShouldI Trust You Explaining the Predictions of Any Classifierrdquo Proceed-ings of the 22Nd ACM SIGKDD International Conference on KnowledgeDiscovery and Data Mining KDD rsquo16 San Francisco California USAACM 2016 1135ndash1144 ISBN 978-1-4503-4232-2 DOI 10114529396722939778 2ndash4
[SAS02] SARAVANAN R ASOKAN P and SACHIDANANDAM M ldquoAmulti-objective genetic algorithm (GA) approach for optimization of sur-face grinding operationsrdquo International Journal of Machine Tools andManufacture 4212 (2002) 1327 ndash1334 ISSN 0890-6955 DOI httpsdoiorg101016S0890-6955(02)00074-3 10
[SC11] SAHU R and CHATURVEDI A K ldquoMany-Objective Comparisonof Twelve Grid Scheduling Heuristicsrdquo 2011 3
[SHB14] SEDLMAIR M HEINZL C BRUCKNER S et al ldquoVisualParameter Space Analysis A Conceptual Frameworkrdquo IEEE Transac-tions on Visualization and Computer Graphics 2012 (2014) 2161ndash2170ISSN 1077-2626 DOI 101109TVCG20142346321 2
ccopy 2020 The Author(s)Computer Graphics Forum ccopy 2020 The Eurographics Association and John Wiley amp Sons Ltd
Das et al QUESTO Interactive Construction of Objective Functions for Classification Tasks
[SKBE17] SAKET B KIM H BROWN E T and ENDERT A ldquoVi-sualization by Demonstration An Interaction Paradigm for Visual DataExplorationrdquo IEEE Transactions on Visualization and Computer Graph-ics 231 (2017) 331ndash340 ISSN 1077-2626 DOI 101109TVCG20162598839 2
[SLT17] SUN Y LANK E and TERRY M ldquoLabel-and-Learn Visu-alizing the Likelihood of Machine Learning Classifierrsquos Success Dur-ing Data Labelingrdquo Proceedings of the 22Nd International Confer-ence on Intelligent User Interfaces IUI rsquo17 Limassol Cyprus ACM2017 523ndash534 ISBN 978-1-4503-4348-0 DOI 10114530251713025208 3
[SRL07] STUMPF S RAJARAM V LI L et al ldquoToward HarnessingUser Feedback for Machine Learningrdquo Proceedings of the 12th Inter-national Conference on Intelligent User Interfaces IUI rsquo07 HonoluluHawaii USA ACM 2007 82ndash91 ISBN 1-59593-481-2 DOI 10 114512162951216316 2
[SRL09] STUMPF S RAJARAM V LI L et al ldquoInteracting Mean-ingfully with Machine Learning Systems Three Experimentsrdquo Int JHum-Comput Stud 678 (Aug 2009) 639ndash662 ISSN 1071-5819 DOI101016jijhcs200903004 3
[SSZ17] S DOMINIK S MICHAEL Z LEISHI et al ldquoWhat you see iswhat you can change Human-centered machine learning by interactivevisualizationrdquo Neurocomputing 268 (2017) 164ndash175 3
[TCWM18] T LI CONVERTINO G WANG W and MOST H ldquoHyper-Tuner Visual Analytics for Hyperparameter Tuning by ProfessionalsrdquoMachine Learning from User Interaction for Visualization and Analyt-ics IEEE VIS 2018 (2018) 3
[TDCF07] TULLIO J DEY A K CHALECKI J and FOGARTY JldquoHow It Works A Field Study of Non-technical Users Interacting withan Intelligent Systemrdquo Proceedings of the SIGCHI Conference on Hu-man Factors in Computing Systems CHI rsquo07 San Jose CaliforniaUSA ACM 2007 31ndash40 ISBN 978-1-59593-593-9 DOI 10114512406241240630 3
[THHLB13] THORNTON C HUTTER F HOOS H H and LEYTON-BROWN K ldquoAuto-WEKA Combined selection and hyperparameter op-timization of classification algorithmsrdquo Proceedings of the 19th ACMSIGKDD international conference on Knowledge discovery and datamining ACM 2013 847ndash855 3
[TLB11] TAMUZ O LIU C BELONGIE S et al ldquoAdaptively Learn-ing the Crowd Kernelrdquo Proceedings of the 28th International Con-ference on International Conference on Machine Learning ICMLrsquo11Bellevue Washington USA Omnipress 2011 673ndash680 ISBN 978-1-4503-0619-5 2ndash4
[TLKT09] TALBOT J LEE B KAPOOR A and TAN D S ldquoEnsem-bleMatrix interactive visualization to support machine learning withmultiple classifiersrdquo CHI Ed by JR DAN R OLSEN ARTHURRICHARD B HINCKLEY KEN et al ACM 2009 1283ndash1292 ISBN978-1-60558-246-7 2
[VDEW11] VAN DEN ELZEN S and van WIJK J J ldquoBaobabview In-teractive construction and analysis of decision treesrdquo Visual Analyt-ics Science and Technology (VAST) 2011 IEEE Conference on IEEE2011 151ndash160 2 4
[WEF13] WALKER D J EVERSON R and FIELDSEND J E ldquoVisu-alizing Mutually Nondominating Solution Sets in Many-Objective Op-timizationrdquo Trans Evol Comp 172 (Apr 2013) 165ndash184 ISSN 1089-778X DOI 101109TEVC20122225064 3
[WFE12] WALKER D FIELDSEND J and EVERSON R ldquoVisualisingMany-objective Populationsrdquo Proceedings of the 14th Annual Confer-ence Companion on Genetic and Evolutionary Computation GECCOrsquo12 Philadelphia Pennsylvania USA ACM 2012 451ndash458 ISBN 978-1-4503-1178-6 DOI 10114523307842330853 3
[WLDW01] WOLFMAN S A LAU T DOMINGOS P and WELDD S ldquoMixed Initiative Interfaces for Learning Tasks SMARTeditTalks Backrdquo Proceedings of the 6th International Conference on Intel-ligent User Interfaces IUI rsquo01 Santa Fe New Mexico USA ACM2001 167ndash174 ISBN 1-58113-325-1 DOI 10 1145 359784 360332 3
[WN17] WENSKOVITCH J and NORTH C ldquoObservation-Level Inter-action with Clustering and Dimension Reduction Algorithmsrdquo Pro-ceedings of the 2Nd Workshop on Human-In-the-Loop Data AnalyticsHILDArsquo17 Chicago IL USA ACM 2017 141ndash146 ISBN 978-1-4503-5029-7 DOI 10114530772573077259 2
[YL09] YEH I and LIEN C ldquoThe comparisons of data mining tech-niques for the predictive accuracy of probability of default of credit cardclientsrdquo Expert Systems with Applications 362 Part 1 (2009) 2473 ndash2480 ISSN 0957-4174 DOI httpsdoiorg101016jeswa200712020 8
[YSCR18] YANG Q SUH J CHEN N and RAMOS G ldquoGroundingInteractive Machine Learning Tool Design in How Non-Experts ActuallyBuild Modelsrdquo ACM 2018 2 3
[ZSZR18] Z XIAOJIN SINGLA A ZILLES S and RAFFERTY A NldquoAn Overview of Machine Teachingrdquo CoRR abs180105927 (2018) 23
ccopy 2020 The Author(s)Computer Graphics Forum ccopy 2020 The Eurographics Association and John Wiley amp Sons Ltd
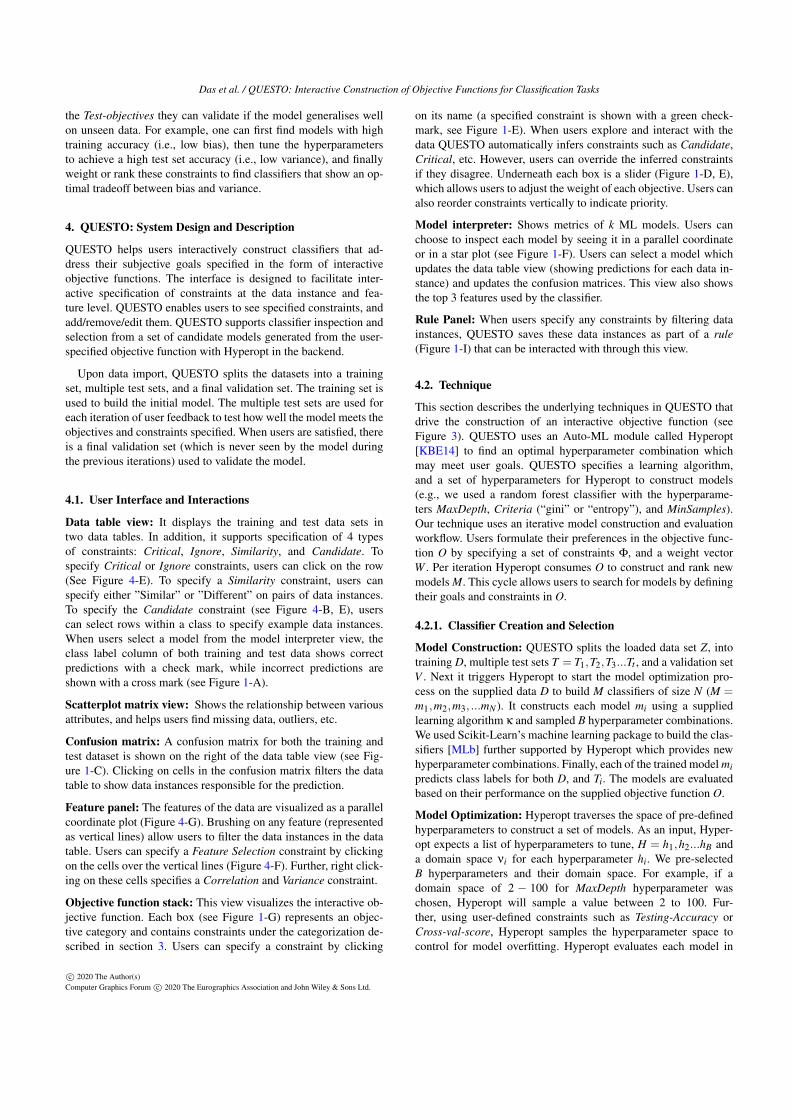
Das et al QUESTO Interactive Construction of Objective Functions for Classification Tasks
Figure 3 QUESTO system architecture
M with the supplied objective function O The objective functionO is constructed by a weighted linear combination of user-definedconstraints Φ Each model mi in M gets a objective function scoreS = s1s2 sN based on its performance on O Hyperopt ranks theN classifiers (we set N = 100 but can be changed) based on theobjective function scores in S
422 Interactive Objective Function Creation
The set of constraints Φ represent the different categories of goalsand constraints in our taxonomy (see Section 3) Using QUESTOusers can define the following constraints interactively
Critical Hyperopt trains a model mi on the supplied training setD with original labels Ldo Next it predicts labels on the trainingset as Ldp Users specify a list of IDs of x critical data instancesC = c1c2cx QUESTO retrieves the prediction on the criticaldata instances based on supplied IDs C as Lcp (Lcp sub Ldp)QUESTO retrieves the original class labels of the critical datainstances as Lco QUESTO initializes the score for the Criticalconstraint as s1 = 0 It compares Lco with Lcp to find the numberof correct matches and save in s1 (normalized between 0 to 1)
Similarity This constraint is of two types The first type capturessimilar data items when a user specifies a list of data items Y thatare similar and should be placed in the same class The algorithmiterates over Y to find the original class label Lno If Y belongs tomore than one class label the most frequent class label is assignedto Lno Next the algorithm matches the prediction Lnp with theoriginal class label Lno where i is the index iterating from 0 tob (the number of user-specified similar data instances) For everycorrect match the score for this constraint s2a gets a +1 scoreNext it normalizes s2a as (s2a)b to get a score between 0 to 1
The second type consists of users specifying items that should bedifferent A user does so by specifying a list of tuples σ where eachitem in the list is represented as σi = (σxσy) Here σx and σy aredata instances that users expect to be predicted in different classesThe algorithm iterates over σ and matches the predicted class labelLσpi of item σi to class label Lσp j of item σ j For every incorrectmatch the score for this constraint s2b gets a +1 point Next itnormalizes s2b as (s2b)b to get a score between 0 to 1 Finallythe score for this constraint is computed as s2 = (s2a + s2b) Wenormalize s2 to get a score between 0 to 1
Candidate Users specify a list of b data items in G with a classlabel A The algorithm increases the training data weights (W =w1ws2ws3wb) for these data items It inputs W to Hyperopt
which trains the classifiers M based on the updated weights The al-gorithm iterates through G and matches each items predicted classlabel L f p with A The score for this metric s3 is initialized as 0For each correct match in the iteration s3 is assigned a +1 pointFinally the algorithm normalizes s3 as s3 = s3b
Ignore Users specify a list of data items I The algorithm removesthese data items from D to form a new training set DII Furtherwhen computing classification model metrics such as PrecisionRecall etc the algorithm removes the data items in I from D
Accuracies This captures the classification model metrics definedas part of the category Train-objectives and Test-objectives (seesection 3) These are Precision Recall F1-Score etc For each ofthese QUESTO uses Scikit-Learns classification metrics [MLb]
Feature Selection Correlation and Variance QUESTO incor-porates a user-based feature selection technique Users can guidefeature selection in one of two ways First users can select a setof features Fd using the feature panel QUESTO interpretes thatthe user chose a set of features which has a high correlation withthe class label For model construction QUESTO will only use thefeatures in Fd Second users can specify a set of correlated fea-tures Fc or features with low variance in Fv QUESTO automati-cally discards the features which show high correlation (negativeor positive) with each other and selects the ones which are uncorre-lated Similarly QUESTO discards features with low variance Theselected features F = FminusFc or F = FminusFv are fed to Hyperopt
Objective Function Formulation The resulting objective func-tion in QUESTO is a weighted linear combination of constraintsΦ The algorithm computes the scores for each constraint Finallyit linearly combines these individual constraint scores as shown inthe equation O = s1 lowastω1 + s2 lowastω2 + s3 lowastω3 + s4 lowastω4 + s5 lowastω5where s1s2s3 etc are the scores of the user-specified constraints
Weighting Preferences Initially the weights W = ω1ω2 ωUare evenly set for each constraint in Φ However users can over-ride and specify weightings for each constraint by interaction tech-niques shown in Section 41 The weight vector W sums to 1 toensure correctness in computing the contribution of each item in Φ
Guarding Against Data Leakage QUESTO searches for bestmodels from a pool of sampled ML models (facilitated by Hyper-opt) This is different from optimizing the internal algorithm of MLmodels such as designing the loss function for a random forest Asour technique treats each model as a black box it can optimize formodels that may perform better on train or test data This is similarto conventional model construction processes where ML practi-tioners aim for a higher training or test accuracy or a balance be-tween each However to guard against data leakage our techniqueuses multiple sets of test data T = T1T2Tt (each used per itera-tion of model construction) When QUESTO loads input data Z itautomatically splits into three sets train D test T and validationV Next it makes t subsets of the test data each used per iterationof model construction This serves to address potential data leak-age as the models are tested on unseen data and during training thetest data is not used Per iteration the model gets a new test set Tito compute the objective score (test-accuracy test-F1-score etc) Inaddition when the model is exported by the user they get to validateit on the validation set V which is not used on any prior iteration
ccopy 2020 The Author(s)Computer Graphics Forum ccopy 2020 The Eurographics Association and John Wiley amp Sons Ltd
Das et al QUESTO Interactive Construction of Objective Functions for Classification Tasks
5 Usage Scenario
We describe a scenario showing how QUESTO can help users buildclassifiers on an imbalanced dataset through the specification of in-teractive objective functions Chris is a public policy analyst (withbasic knowledge of ML) is analyzing San Franciscorsquos employmentdata to predict employees department [Off] (10000 samples) Chrisexplores the salary data in QUESTO and begins constructing clas-sifiers They inspect the best classifier from the model interpreterto observe that it scored poorly on both training and test set (avg48 accuracy) Chris explores the confusion matrix to discover that80 of the original labels are of type public service indicating thatthe data is imbalanced (there are 5 class labels) While the currentmodel correctly predicted 70 of this label type it failed to predictthe other labels accurately Chris expects the classifier to predicteach class label with at least 80 accuracy to be valuable for theiranalysis Next using the objective function stack view Chris spec-ifies the constraint F1-Score to account for the imbalanced natureof the dataset and the constraint Cross-val-score to construct gen-eralisable models
Chris triggers QUESTO to construct a set of new classifiers (seenthrough the model interpreter) based on the updated objective func-tion They click on model 2 as it shows the best performance on allthe specified constraints in the star plot view However other thanthe class public service) this model failed to perform as per expec-tation on other labels For example the label culturalrecreationand adminfinance showed 0 correctly predicted data items Mo-tivated to resolve these two classes Chris brushes on the featureretirement on the feature panel to filter jobs with high retirementbenefits Next Chris picks the constraint Candidate from the drop-down menu as seen in Figure 4-B They click on a set of data itemsof label administrationfinance on the table (shown with a greenhighlight see Figure 4-E) When Chris specifies the Candidate con-straint QUESTO automatically records the selected data instancesas part of a rule (see Figure 1-I) Chris assigns it a custom namehigh-retirement Next they filter the data instances using the fea-ture panel with low overtime and high salary values Chris speci-fies a subset of these data instances as Candidate constraint for theclass culturalrecreation QUESTO saves these data instances as arule which Chris calls high-sal (Figure 1-I)
Chris inspects one of the new models (model 2) by hovering overthe two rules (high-retirement and high-sal shows associated dataitems in the table view) Quickly glancing through these data itemsChris observes that the prediction error is less than 10 which theyfind acceptable Next Chris explores the confusion matrices andfinds that the performance score for the model increased to 72accuracy (see Figure 5-BC) Furthermore Chris notices that themodelrsquos performance improved significantly achieving on average70 accuracy for all classes except adminfinance In order to boostthe performance of the label adminfinance Chris specifies all thedata instances of this label (in the training set with more than 80000retirement benefits total 12 items) as a Critical constraint
Iterating further Chris finds a new set of classifiers from the col-lection satisfied the constraints Candidate Critical and F1-ScoreHowever the performance dropped on the test set in all of thesemodels To further emphasize the performance on the test set as animportant criteria Chris specifies the Testing-Accuracy constraint
Figure 4 A Critical constraint B Other constraints C Classselector D Filter tags E Selected data F Select features corre-lation and variance G Parallel coordinate plot
Figure 5 Views for Evaluating Model Performance
In addition they lower the weights on the constraints in thecategories Train-objectives and Instance-based and increases theweight on the category Test-objectives (see Figure 1-D E) Theyalso re-order individual constraints specifying highest priorityto the constraint Candidate Chris constructs new classifiers andchooses model 3 based on its performance as viewed in the starplot view They hover over the two custom rules (see Figure 1-I) tosee that most of the data instances in them are correctly predictedand performs equally well on all class labels Content with thecurrent model Chris tests the model on a validation set and thenexports it for future use This usage scenario shows how QUESTOenabled a domain expert to build an accurate classifier on animbalanced dataset by exploring various objective functions thatcaptured his subjective preferences
6 Evaluation
Other than using interactive visual interfaces like QUESTO twopopular alternatives to constructing classifiers are (1) manuallycreating them via code or command-line (CMD) interfaces and (2)automatically generating them using Auto-ML We wanted to com-pare QUESTO with manually coding to verify if QUESTO is easierand faster to specify constraints Furthermore we wanted to com-pare QUESTO with Auto-ML to verify if QUESTO satisfies sub-jective user goals better and to compare the resulting accuracy Weconducted a within-subject controlled lab user study of QUESTOcomparing it with CMD and Auto-ML to construct a classifier Ourstudy addresses the following research questions
RQ1 Is QUESTO easier and faster to use than CMD workflowsRQ2 Does QUESTO build more accurate models than
automatically-generated models from Auto-MLRQ3 Does QUESTO build models that addresses user-specified
constraints better than models from Auto-ML
We hypothesize the interactive visual interface of QUESTO will
ccopy 2020 The Author(s)Computer Graphics Forum ccopy 2020 The Eurographics Association and John Wiley amp Sons Ltd
Das et al QUESTO Interactive Construction of Objective Functions for Classification Tasks
be easier and faster to use compared to command-line interfacesHere ldquofasterrdquo refers to the time it takes to specify constraints andconstruct classifiers it does not include the time needed to trainclassifiers Further we hypothesize that Auto-ML will generatemore globally accurate models given the objective function op-timizing towards a specified accuracy metric such as high cross-validation score However RQ3 tests our hypothesis that QUESTOwill be better at building models that fit specific user constraintsgiven the customized objective function thus illuminating thistradeoff between accuracy and user goals
In the literature there is no well-defined metric to measure howwell user-defined constraints are satisfied in classifier constructionThus we defined constraint satisfaction score as a metric thatcaptures how well a model attains user-specifed constraints suchas Critical Candidate etc These scores are normalized between0minus 1 (higher is better) It is expressed as (sumU
0 ωi lowast γi)U where ω
is the weight of U constraints γ is the score of each constraint U isthe total number of specified constraints in the objective function
We recruited 16 participants (7 Male 9 Female) aged between21-29 (M=25 SD=291) by inviting participants through our uni-versity mailing lists We required them to at least have a basic ex-pertise in writing python code with elementary understanding ofML All of the participants (undergraduate and graduate students)were familiar with basicintermediate data analysis using tools suchas MS Excel Tableau etc The experiment lasted 60 minutes andwe compensated each participants with a $10 Amazon gift cardThe study was conducted using a 17-inch display and a mouse
61 Study Design
We began the study with a practice session teaching users howto interact with both QUESTO and CMD (with VS Code as thescripting editor) During the practice session participants were en-couraged to ask questions to clarify uncertainty in relation to theworkflow or the interaction design We proceeded to the experi-mental sessions only when the participants felt confident in usingeach system For quantitative evaluation each participant interactedwith both QUESTO and CMD using one dataset Furthermore theorder of the interfaces (QUESTO and CMD) the datasets andthe tasks were randomized to remove any orderinglearning effectWe considered these dependent variables for quantitative analysis(1) Task completition times in specifying an objective functionthrough QUESTO or CMD (2) Model accuracy the accuracy ofthe model constructed using QUESTO CMD and Auto-ML standalone (3) Constraint satisfaction score measure to capture con-straints satisfied by the model and (4) User preference rating av-erage preference rating of Ease of Use for QUESTO and CMD
62 Datasets
For the practice session we provided a dataset of 10000 credit cardtransaction records [YL09] The data has attributes such as bill paidmonth 1 bill paid month 2 bill paid month 3 account balanceetc It was a binary classification task to predict if a bank customerwill default on a bank loan or not For the experimental sessionswe provided San Franciscorsquos employment dataset [Off] containing5000 data items for the quantitative evaluation Each row in the data
contains information about an employeersquos remuneration containingattributes such as dental benefits annual salary monthly salaryextra benefits etc The task was to predict the employeersquos depart-ment (5 classes) For the qualitative evaluation we used a moviesdataset [Mov] (5000 samples) containing attributes such as budgetgross revenue facebook likes of lead actors director cast etc Thedata has three labels for movie rating high medium and low Fol-lowing best ML practices we use multiple test datasets so that theconstructed model never sees unseen data instances
63 Tasks and Procedure
In the practice session we asked users to perform 2 tasks per inter-face The first task was to design an objective function in QUESTOby specifying a Critical constraint They were asked to iterate mul-tiple times and improve the classifiers performance by refining theconstraint The next task was to add two more constraints (Similar-ity and Candidate) to the objective function in QUESTO and iter-atively improve the classifiers performance They repeat the sametasks by writing code and using CMD to run their code to con-struct a classifier For the quantitative evaluation participants arerandomly assigned an interface (QUESTO or CMD) Participantswere encouraged to think aloud while they interact with each sys-tem The interviewer was a silent observer and was away from theparticipant to mitigate Hawthorne and Rosenthal effect during thesession Participants performed 3 tasks per interface (6 tasks total)Each of the tasks were in increasing level of difficulty
Task 1 Specify the constraint Similarity (Max time 3 minutes)Task 2 Specify Critical and Candidate (Max time 5 minutes)Task 3 Specify Critical Similarity Candidate F1-Score Preci-
sion Accuracy and Cross-Validation (Max time 7 minutes)
For the qualitative evaluation we asked participants to freely useQUESTO (may specify any constraint) to build a classifier (on themovies data) and improve its objective function score in 5 minutes
64 Data Collection
For quantitative assessment we saved log data which stores (periteration) models selected by users their learning algorithms andhyperparameters predicted class labels interacted data items user-specified constraints etc When participants completed the threetasks on both interfaces we asked them to fill a NASA-TLX form[HS88] and a post-study questionnaire with a set of likert scalequestions We asked questions to seek user preference rating to eachinterfacersquos various dimensions such as (1) Ease of use (2) Flexi-bility (3) Fun to use (4) Learnability and (5) Intuitiveness Afterthe qualitative evaluation we conducted a semi-structured interviewasking open-ended questions about the workflow system usabilityand interaction design for each interface In this interview we askedquestions such as (1) Describe your thought process while you in-teracted with QUESTO (2) Explain your experience in construct-ing an objective function interactively vs through writing code(3) How do you think we can improve the current workflow and de-sign of QUESTO We also captured video and audio of participantsscreen while they interacted with QUESTO
ccopy 2020 The Author(s)Computer Graphics Forum ccopy 2020 The Eurographics Association and John Wiley amp Sons Ltd
Das et al QUESTO Interactive Construction of Objective Functions for Classification Tasks
Figure 6 The study results comparing QUESTO with coding interfaces and Auto-ML techniques for classification tasks
65 Quantitative Analysis
For the following we used the Friedman Test for Repeated-Measures as it is a good indicator of statistical significance formulti-class classifiers with multiple datasets which may not fol-low a normal distribution as suggested by [Dem06] Furthermorewe utilised Post-hoc Wilcoxon signed-rank tests with Bonferronicorrection (new p value = 003) to test for statistical significance
Ease of use To answer RQ1 we used likert scale rating scores(5-point scale) from participants (average ease of use rating 464higher is better see Figure 6-D) The ease of use of QUESTO wassignificant across all tasks (χ2(1) = 4803 p lt 003) thus answer-ing RQ1 that QUESTO is easier to use than CMD
Task completion times Participants were significantly faster tospecify constraints in QUESTO than CMD (Figure 6-C) Every par-ticipant completed all tasks except for three who failed to completetask 3 in the allotted time using CMD In these cases we recordedthe maximum alotted time for that task Quantitatively we foundstatistically significant difference in task completion time for alltasks Task1 (χ2(1) = 160 p lt 003) Task2 (χ2(1) = 160 p lt003) and Task3 (χ2(1) = 40 p lt 003) This answered RQ1 thatQUESTO is faster to specify constraints than CMD
Model Accuracies To answer RQ2 we compared the models gen-erated using QUESTO CMD and Auto-ML with respect to theiraccuracies We found QUESTO generated similar quality modelsin relation to accuracies as produced by CMD (refer Figure 6-A)However accuracies generated by models from Auto-ML standalone were higher in comparison to QUESTO We observed sta-tistically significant difference in the model accuracy for task 1(χ2(1) = 1225 p lt 003) and task 3 (χ2(1) = 40 p lt 003)
Constraint satisfaction We found that QUESTO outperformedAuto-ML in meeting user-specified constraints for all tasks Task1(χ2(1) = 625 p lt 003) Task2 (χ2(1) = 225 p lt 003) andTask3 (χ2(1) = 90 p lt 003) This answered RQ3 We analysedthis based on data collected from the employment dataset [Off](users were given the example data items to specify as constraints)and on the movie dataset [Mov] (users freely specified constraints)
66 Qualitative Analysis
User Preferences We measured user preferences using 5-pointlikert scale rating QUESTOrsquos user preference ratings (out of 5)
were higher than CMD workflow in various aspects such as Easyof use (Q 453 CMD 322) Fun to use (Q 469 CMD 288) Learnable (Q 434 CMD 297) and Intuitive (Q 438 CMD287) (see Figure 6-D) In addition through the NASA-TLXsurvey we found that average participantsrsquo cognitive workload wassignificantly lower in QUESTO than CMD interfaces (Q 430CMD 887 out of 10 lower is better) Based on these results itis likely that participants preferred QUESTO compared to usingthe CMD interface for objective function creation However manyparticipants found CMD comparably flexible to QUESTO tospecify preferences (Q 378 CMD 352) and debug models
Easy workflow Every participant found QUESTOrsquos interface andthe workflow easy to learn and use Users liked the table view withthe ability to filter and search for specific data items as examplesfor constraint specification P03 said ldquoI like how I can mouseoveron the cells of the confusion matrix to see incorrectly predicteddata itemsrdquo P08 added ldquoI frequently brush over the feature panelto filter data items by a set of attributes I care aboutrdquo Howeverusers recommended that more advanced sorting feature in the tablewould have helped them find appropriate examples quickly
Level of Detail Some participants had elementary knowledge ofpython and ML while a few others had in-depth ML expertise P09reflected ldquoBest part of this workflow is how easy the tool makesto change my constraints in terms of weighting or ordering themwhich lets me look into a new set of classifiersrdquo While advancedML users appreciated the idea of an interactive interface to definean objective function reflected that they would prefer to look at thenumerical weights on each constraint so that they can better trusthow the modeling engine is selecting classifiers P13 said Thoughthe objective function view is very useful I am not sure if I un-derstand whatrsquos happening on the background without knowing thenumerical weights on these constraints
Meaningful constraints Participants found the constraints inQUESTO appropriate and useful for classifier construction P10added ldquoI think the constraints make a lot of sense to me When Itest models I frequently look at specific data items to verify if theclassifier modeled the data correctlyrdquo However a few participantscommented that it would help if QUESTO could recommend itemsto consider next For example P03 suggested ldquoI think you can useprediction probabilities to reflect on how confident the model is oneach prediction That may help me specify better examplesrdquo
Intuitive model selection Users found the model interpreter view
ccopy 2020 The Author(s)Computer Graphics Forum ccopy 2020 The Eurographics Association and John Wiley amp Sons Ltd
Das et al QUESTO Interactive Construction of Objective Functions for Classification Tasks
useful to compare models based on their performance on the spec-ified constraints P17 noted ldquoFrom the star plot view I can inspectthe size of the polygons to select models that performed better onrelevant constraints I would prefer to mouseover (instead of click)to browse the model output results on the table and the confusionmatricesrdquo However participants wanted to see a bookmark featureto save models they like Furthermore one participant desired tosee how each constraint contributed to a change in model output tounderstand what interaction improved performance
Task complexity The three tasks in the user study had differentlevels of complexity While task 1 and task 2 involved satisfyingonly subjective user preferences task 3 included finding modelsthat are accurate yet address constraints such as Similarity Can-didate etc Participants found task 3 more challenging as findingthe right model that is accurate and addresses their personal goalswas difficult P15 noted ldquoIt was hard to improve the classifiers per-formance when I had more than 4 constraints to specify Howeverwith QUESTO I could rapidly test different weightingsrankings tothese constraints to find an optimal classifierrdquo
Conflicting constraints We observed that participants sometimesspecified conflicting constraints For example they specified a setof data item as a Candidate constraint but in a later iteration theyspecified a subset of these data items as a Ignore constraint AsQUESTO currently does not support alerting users about conflictsin future we plan to mitigate them in objective specification
Modeling process From the study we found that QUESTOrsquosworkflow does not help users understand the underlying modelingprocess Often participants wondered what interaction in the previ-ous iteration led to the improvement or degradation in the accuracyor the objective function score Future work could make the mod-eling process more transparent and allow users to reason about theimpact of their objective specification on classifier selection
7 Discussion
User-System Feedback loop Interactive objective functions mayguide an Auto-ML model solver to select models that weigh datainstances preferentially to better support user goals For examplean objective function with the Critical constraint will guide theAuto-ML solver to prefer classifiers that correctly predict specificitems In response users may inspect a model in relation to howwell it supports the specified constraints Thus interactive objec-tive functions employ a two-way feedback loop between the userand the system for (1) communicating preferences to find suitablemodels and (2) providing a medium for understanding classifierperformance Participants confirmed that (per iteration) they vali-dated models in relation to how well they support the constraints
Tradeoff Analysis Practically in a multi-objective optimizationproblem satisfying every objective might not be feasible [SAS02]due to a plethora of reasons including conflicting constraints math-ematical infeasibility noiseoutliers in the data high dimensional-ity etc [KLTH10] Formalizing user goals as a set of constraintsin an objective function facilitates searching for a set of pareto-optimal solutions which may only satisfy a subset of the specifieduser goals Furthermore visualizing these pareto-optimal modelshelp users inspect them and understand tradeoffs
ML users often seek models that support other customizedsubjective goalsobjectives that are personal and problem-specific([KLTH10]) This study validated that while QUESTO producedslightly less accurate models than Auto-ML model solvers theymet subjective user-specified constraints We envision that userswill need to find a balance between these two extremes
71 Limitations
Scope and assumptions of the user study In the study we timedeach task to ensure the study can be completed within a reasonabletime However in more realistic settings optimizing for (or lim-iting) time may not be meaningful Further we used pre-definedhyperameters within which Hyperopt sampled values to constructclassifiers The study results may vary if the set of hyperparametersused are different Also our study only included participants withbasic expertise of python and ML
Model overfitting Good ML practices entail that trained modelshave no knowledge of test data In QUESTO we follow the sameprocess The test data view in the data table allows users to inspectclassifiers by reviewing the predictions made at the data instancelevel Furthermore by specifying the objectives Train-objectivesand (and weighting them) users can control for model overfit-ting Nevertheless we are aware that if users do not specify theymay produce overfitted models However this may be the case forcommand-line classifier construction as well if addition of regular-izers or cross-validation approaces are not used
Scalability The current UI design is based on datasets of mod-est size Thus there are aspects of the UI that would become lessusable if datasets grew larger For example while the table viewsupports sorting and filtering the fundamental design of showingitems in a table may make finding individual relevant data itemschallenging However for larger datsets we can augment QUESTOwith visualisations that can aggregate data and show example dataitems on demand (eg grouped heatmap view etc)
8 Conclusion
In this paper we present a design space of constraints categorizingvarious user goals for a classification task Grounded in this designspace we developed a prototype system QUESTO that supports in-teractive construct of objective functions to specify their subjectivepreferences to a classifier Finally we validate the effectiveness ofQUESTO by a within-subject user study that proved that QUESTOis easier and faster to use than conventional command line alterna-tives We also demonstrate that while QUESTO produces slightlyless accurate classifiers than Auto-ML it produces models that bet-ter satisfy user-specified constraints This presents a step towardsunderstanding how to integrate people into Auto-ML processes
9 Acknowledgements
Support for the research is partially provided by DARPA FA8750-17-2-0107 DARPA FA8750-17-2-010 NSF 1841349 and NSFIIS-1452977 The views and conclusions contained in this doc-ument are those of the authors and should not be interpreted asrepresenting the official policies either expressed or implied ofthe US Government
ccopy 2020 The Author(s)Computer Graphics Forum ccopy 2020 The Eurographics Association and John Wiley amp Sons Ltd
Das et al QUESTO Interactive Construction of Objective Functions for Classification Tasks
References[ACKK14] AMERSHI S CAKMAK M KNOX W B and KULESZA
T ldquoPower to the people The role of humans in interactive machine learn-ingrdquo AI Magazine 354 (2014) 105ndash120 2
[AF18] AHAMED F and FARID F ldquoApplying Internet of Things andMachine-Learning for Personalized Healthcare Issues and Challengesrdquo2018 International Conference on Machine Learning and Data Engi-neering (iCMLDE) 2018 19ndash21 DOI 101109iCMLDE201800014 3
[AFKT11] AMERSHI S FOGARTY J KAPOOR A and TAN D SldquoEffective End-User Interaction with Machine Learningrdquo AAAI 2011 3
[BGV16] BOUALI F GUETTALA A and VENTURINI G ldquoVizAssistAn Interactive User Assistant for Visual Data Miningrdquo Vis Comput3211 (Nov 2016) 1447ndash1463 ISSN 0178-2789 DOI 10 1007 s00371- 015- 1132- 9 URL httpdxdoiorg101007s00371-015-1132-9 2
[BLBC12] BROWN E T LIU J BRODLEY C E and CHANGR ldquoDis-function Learning distance functions interactivelyrdquo 2012IEEE Conference on Visual Analytics Science and Technology (VAST)2012 83ndash92 DOI 101109VAST20126400486 2
[BM17] BIRAN O and MCKEOWN K ldquoHuman-centric Justification ofMachine Learning Predictionsrdquo Proceedings of the 26th InternationalJoint Conference on Artificial Intelligence IJCAIrsquo17 Melbourne Aus-tralia AAAI Press 2017 1461ndash1467 ISBN 978-0-9992411-0-3 3
[BNHL14] BRADEL L NORTH C HOUSE L and LEMAN S ldquoMulti-model semantic interaction for text analyticsrdquo 2014 IEEE Conference onVisual Analytics Science and Technology (VAST) 2014 163ndash172 DOI101109VAST20147042492 2
[BYC13] BERGSTRA J YAMINS D and COX D D ldquoHyperopt Apython library for optimizing the hyperparameters of machine learn-ing algorithmsrdquo Proceedings of the 12th Python in Science Conference2013 13ndash20 3
[BZSA17] BERNARD J ZEPPELZAUER M SEDLMAIR M andAIGNER W ldquoA Unified Process for Visual-Interactive Labelingrdquo Euro-Vis Workshop on Visual Analytics (EuroVA) Ed by S MICHAEL and TCHRISTIAN The Eurographics Association 2017 ISBN 978-3-03868-042-0 DOI 102312eurova20171123 3
[CAK17] CHANG J C AMERSHI S and KAMAR E ldquoRevolt Collab-orative Crowdsourcing for Labeling Machine Learning Datasetsrdquo Pro-ceedings of the 2017 CHI Conference on Human Factors in ComputingSystems CHI rsquo17 Denver Colorado USA ACM 2017 2334ndash2346ISBN 978-1-4503-4655-9 DOI 10 1145 3025453 3026044URL httpdoiacmorg10114530254533026044 3
[CB15] CHENG J and BERNSTEIN M S ldquoFlock Hybrid Crowd-Machine Learning Classifiersrdquo Proceedings of the 18th ACM Confer-ence on Computer Supported Cooperative Work amp38 Social Comput-ing CSCW rsquo15 Vancouver BC Canada ACM 2015 600ndash611 ISBN978-1-4503-2922-4 DOI 10114526751332675214 3 4
[CES09] CRAMER H S M EVERS V S VAN et al ldquoAwarenessTraining and Trust in Interaction with Adaptive Spam Filtersrdquo Proceed-ings of the SIGCHI Conference on Human Factors in Computing Sys-tems CHI rsquo09 Boston MA USA ACM 2009 909ndash912 ISBN 978-1-60558-246-7 DOI 10114515187011518839 3
[CFEC17] CROUSER R J FRANKLIN L ENDERT A and COOK KldquoToward theoretical techniques for measuring the use of human effort invisual analytic systemsrdquo IEEE transactions on visualization and com-puter graphics 231 (2017) 121ndash130 3
[CHH19] CASHMAN D HUMAYOUN S F HEIMERL F et al ldquoAUser-based Visual Analytics Workflow for Exploratory Model Analy-sisrdquo Computer Graphics Forum 383 (2019) 185ndash199 DOI 101111cgf13681 3
[CW18] CHEN M and WANG H ldquoHow Personal Experience and Techni-cal Knowledge Affect Using Conversational Agentsrdquo Proceedings of the23rd International Conference on Intelligent User Interfaces Compan-ion IUI rsquo18 Companion Tokyo Japan ACM 2018 531ndash532 ISBN978-1-4503-5571-1 DOI 10114531803083180362 3
[DCCE18] DAS S CASHMAN D CHANG R and ENDERT AldquoBEAMES Interactive Multi-Model Steering Selection and Inspec-tion for Regression Tasksrdquo Symposium on Visualization in Data Sci-ence(VDS) Berlin Germany 2018 3
[Dem06] DEMŠAR JANEZ ldquoStatistical Comparisons of Classifiers overMultiple Data Setsrdquo J Mach Learn Res 7 (Dec 2006) 1ndash30 ISSN1532-4435 9
[EBN13] ENDERT ALEX BRADEL LAUREN and NORTH CHRIS ldquoBe-yond Control Panels Direct Manipulation for Visual Analyticsrdquo IEEEComputer Graphics and Applications 334 (2013) 6ndash13 ISSN 0272-1716 DOI 101109MCG201353 2
[EFN12] ENDERT A FIAUX P and NORTH C ldquoSemantic Interactionfor Visual Text Analyticsrdquo Proceedings of the SIGCHI Conference onHuman Factors in Computing Systems CHI rsquo12 Austin Texas USAACM 2012 473ndash482 ISBN 978-1-4503-1015-4 DOI 10 1145 22076762207741 2
[EHM11] ENDERT A HAN CHAO MAITI D et al ldquoObservation-level Interaction with Statistical Models for Visual Analyticsrdquo IEEEVAST 2011 121ndash130 2
[EIZ13] ESCUDERO J IFEACHOR E ZAJICEK J P et al ldquoMachineLearning-Based Method for Personalized and Cost-Effective Detectionof Alzheimerrsquos Diseaserdquo IEEE Transactions on Biomedical Engineer-ing 601 (2013) 164ndash168 ISSN 0018-9294 DOI 101109TBME20122212278 3
[EW16] EIBE F MARK A H and W IAN H The WEKA WorkbenchOnline Appendix for Data Mining Practical Machine Learning Toolsand Techniques 2016 3
[FKE15] FEURER M KLEIN A EGGENSPERGER K et al ldquoEfficientand robust automated machine learningrdquo Advances in Neural Informa-tion Processing Systems 2015 2962ndash2970 3
[GFT16] GILLIES M FIEBRINK R TANAKA A et al ldquoHuman-Centred Machine Learningrdquo Proceedings of the 2016 CHI ConferenceExtended Abstracts on Human Factors in Computing Systems CHI EArsquo16 San Jose California USA ACM 2016 3558ndash3565 ISBN 978-1-4503-4082-3 DOI 10114528515812856492 3
[GLG13] G SAMUEL L ALEXANDER G NILS et al ldquoLineUp Vi-sual Analysis of Multi-Attribute Rankingsrdquo IEEE Transactions on Vi-sualization and Computer Graphics (InfoVis rsquo13) 1912 (2013) 2277ndash2286 DOI 101109TVCG2013173 2
[H99] H MARK A Correlation-based Feature Selection for MachineLearning Tech rep 1999 4
[Hol16] HOLZINGER A ldquoInteractive machine learning for health infor-matics when do we need the human-in-the-looprdquo Brain Informatics32 (2016) 119ndash131 ISSN 2198-4026 DOI 101007s40708-016-0042-6 3
[HS88] H SANDRA G and S LOWELL E ldquoDevelopment of NASA-TLX (Task Load Index) Results of Empirical and Theoretical Re-searchrdquo Human Mental Workload Ed by H PETER A and M NA-JMEDIN Vol 52 Advances in Psychology North-Holland 1988 139 ndash183 DOI httpsdoiorg101016S0166-4115(08)62386-9 8
[HY16] HE Z and YEN G G ldquoVisualization and Performance Metricin Many-Objective Optimizationrdquo IEEE Transactions on EvolutionaryComputation 203 (2016) 386ndash402 ISSN 1089-778X DOI 101109TEVC20152472283 3
[HY17] HE Z and YEN G G ldquoComparison of visualization approachesin many-objective optimizationrdquo 2017 IEEE Congress on EvolutionaryComputation (CEC) 2017 357ndash363 DOI 101109CEC20177969334 3
ccopy 2020 The Author(s)Computer Graphics Forum ccopy 2020 The Eurographics Association and John Wiley amp Sons Ltd
Das et al QUESTO Interactive Construction of Objective Functions for Classification Tasks
[JZF09] JEONG D H ZIEMKIEWICZ C FISHER B et al ldquoiPCA AnInteractive System for PCA-based Visual Analyticsrdquo Computer Graph-ics Forum Vol 28 3 Wiley Online Library 2009 767ndash774 2
[KBE14] KOMER B BERGSTRA J and ELIASMITH C ldquoHyperopt-sklearn automatic hyperparameter configuration for scikit-learnrdquo ICMLworkshop on AutoML 2014 2 3 5
[KBS11] KULESZA T BURNETT M STUMPF S et al ldquoWhere AreMy Intelligent Assistantrsquos Mistakes A Systematic Testing ApproachrdquoProceedings of the Third International Conference on End-user Develop-ment IS-EUDrsquo11 Torre Canne Italy Springer-Verlag 2011 171ndash186ISBN 978-3-642-21529-2 3
[KCPE16] KIM H CHOO J PARK H and ENDERT A ldquoInterAxisSteering scatterplot axes via observation-level interactionrdquo IEEE trans-actions on visualization and computer graphics 221 (2016) 131ndash140 2
[KDJH08] KRESIMIR M DENIS G JELOVIC M and H HELWIGldquoInteractive Visual Steering ndash Rapid Visual Prototyping of a CommonRail Injection Systemrdquo IEEE Transactions on Visualization and Com-puter Graphics 146 (Nov 2008) URL httpswwwcgtuwienacatresearchpublications2008Matkovic-2008-Steer 2
[KEV18] KWON B C EYSENBACH B VERMA J et al ldquoCluster-vision Visual Supervision of Unsupervised Clusteringrdquo IEEE Transac-tions on Visualization and Computer Graphics 241 (2018) 142ndash151ISSN 1077-2626 DOI 101109TVCG20172745085 3
[KKW17] KWON B C KIM H WALL E et al ldquoAxiSketcher In-teractive Nonlinear Axis Mapping of Visualizations through User Draw-ingsrdquo IEEE Trans Vis Comput Graph 231 (2017) 221ndash230 2
[KLTH10] KAPOOR A LEE B TAN D and HORVITZ E ldquoInteractiveOptimization for Steering Machine Classificationrdquo Proceedings of theSIGCHI Conference on Human Factors in Computing Systems CHI rsquo10Atlanta Georgia USA ACM 2010 1343ndash1352 ISBN 978-1-60558-929-9 DOI 10114517533261753529 2 3 10
[KPB14] KRAUSE J PERER A and BERTINI E ldquoINFUSE Interac-tive Feature Selection for Predictive Modeling of High DimensionalDatardquo IEEE Transactions on Visualization and Computer Graphics2012 (2014) 1614ndash1623 ISSN 1077-2626 DOI 101109TVCG20142346482 4
[KPHH11] KANDEL S PAEPCKE A HELLERSTEIN J and HEERJ ldquoWrangler Interactive Visual Specification of Data TransformationScriptsrdquo ACM Human Factors in Computing Systems (CHI) 2011 2
[KTD17] KIM S TASSE D and DEY A K ldquoMaking Machine-Learning Applications for Time-Series Sensor Data Graphical and In-teractiverdquo ACM Trans Interact Intell Syst 72 (July 2017) 81ndash830ISSN 2160-6455 DOI 1011452983924 3
[KTH16] KOTTHOFF L THORNTON C HOOS H H et al ldquoAuto-WEKA 20 Automatic model selection and hyperparameter optimiza-tion in WEKArdquo Journal of Machine Learning Research 17 (2016) 1ndash5 3
[LHM13] LEMAN S C HOUSE L MAITI D et al ldquoVisual to para-metric interaction (v2pi)rdquo PloS one 83 (2013) e50474 2
[LSL17] LIU M SHI J LI Z et al ldquoTowards Better Analysis of DeepConvolutional Neural Networksrdquo IEEE Transactions on Visualizationand Computer Graphics 231 (2017) 91ndash100 ISSN 2160-9306 DOI101109TVCG20162598831 3
[LWLZ17] LIU S WANG X LIU M and ZHU J ldquoTowards betteranalysis of machine learning models A visual analytics perspectiverdquoVisual Informatics 11 (2017) 48 ndash56 ISSN 2468-502X DOI httpsdoiorg101016jvisinf201701006 4
[LYL14] LI M YANG S and LIU X ldquoDiversity Comparison of ParetoFront Approximations in Many-Objective Optimizationrdquo IEEE Transac-tions on Cybernetics 4412 (2014) 2568ndash2584 ISSN 2168-2267 DOI101109TCYB20142310651 3
[MLa] ML BIG Big ML httpsbigmlcom Accessed March20 2019 3
[MLb] ML SCIKIT LEARN Scikit Learn Model Metrics API Refer-ence httpsscikit- learnorgstablemodulesclasseshtmlmodule-sklearnmetrics Accessed March20 2019 5 6
[MLY17] MIQING L LIANGLI Z and Y XIN ldquoHow to Read Many-Objective Solution Sets in Parallel Coordinatesrdquo CoRR abs170500368(2017) 3
[Mov] Movies Dataset howpublished = https www kaggle comcarolzhangdcimdb-5000-movie-datasetmovie_metadatacsv note = Accessed 2018-12-11 8 9
[NKHK17] NUSHI B KAMAR E HORVITZ E and KOSSMANN DldquoOn Human Intellect and Machine Failures Troubleshooting IntegrativeMachine Learning Systemsrdquo Proceedings of the Thirty-First AAAI Con-ference on Artificial Intelligence AAAIrsquo17 San Francisco CaliforniaUSA AAAI Press 2017 1017ndash1025 3
[Off] OFFICE THE SAN FRANCISCO CONTROLLERrsquoS Employee Com-pensation Data https data sfgov org City -Management - and - Ethics Employee - Compensation 88g8-5mnd Accessed March 15 2019 7ndash9
[PBD10] PATEL K BANCROFT N DRUCKER S M et al ldquoGestaltIntegrated Support for Implementation and Analysis in Machine Learn-ingrdquo Proceedings of the 23Nd Annual ACM Symposium on User In-terface Software and Technology UIST rsquo10 New York New YorkUSA ACM 2010 37ndash46 ISBN 978-1-4503-0271-5 DOI 10114518660291866038 2
[PPJ07] PAPARIZOS S PATEL J M and JAGADISH HV ldquoSIGOPTUsing schema to optimize XML query processingrdquo Data Engineer-ing 2007 ICDE 2007 IEEE 23rd International Conference on IEEE2007 1456ndash1460 3
[PSTW16] PAJER S STREIT M TORSNEY-WEIR T et alldquoWeightLifter Visual Weight Space Exploration for Multi-Criteria De-cision Makingrdquo IEEE Transactions on Visualization and ComputerGraphics (2016) 2
[RAL17] REN D AMERSHI S LEE B et al ldquoSquares Support-ing Interactive Performance Analysis for Multiclass Classifiersrdquo IEEETransactions on Visualization and Computer Graphics 231 (2017) 61ndash70 ISSN 1077-2626 DOI 101109TVCG20162598828 3
[RHY14] REN D HOumlLLERER T and YUAN X ldquoiVisDesigner Expres-sive Interactive Design of Information Visualizationsrdquo IEEE Transac-tions on Visualization and Computer Graphics 2012 (2014) 2092ndash2101ISSN 1077-2626 DOI 101109TVCG20142346291 2
[RLD18] RUDOVIC O LEE J DAI M et al ldquoPersonalized machinelearning for robot perception of affect and engagement in autism ther-apyrdquo Science Robotics 319 (2018) DOI 101126sciroboticsaao6760 3
[RSG16] RIBEIRO M T SINGH S and GUESTRIN C ldquoWhy ShouldI Trust You Explaining the Predictions of Any Classifierrdquo Proceed-ings of the 22Nd ACM SIGKDD International Conference on KnowledgeDiscovery and Data Mining KDD rsquo16 San Francisco California USAACM 2016 1135ndash1144 ISBN 978-1-4503-4232-2 DOI 10114529396722939778 2ndash4
[SAS02] SARAVANAN R ASOKAN P and SACHIDANANDAM M ldquoAmulti-objective genetic algorithm (GA) approach for optimization of sur-face grinding operationsrdquo International Journal of Machine Tools andManufacture 4212 (2002) 1327 ndash1334 ISSN 0890-6955 DOI httpsdoiorg101016S0890-6955(02)00074-3 10
[SC11] SAHU R and CHATURVEDI A K ldquoMany-Objective Comparisonof Twelve Grid Scheduling Heuristicsrdquo 2011 3
[SHB14] SEDLMAIR M HEINZL C BRUCKNER S et al ldquoVisualParameter Space Analysis A Conceptual Frameworkrdquo IEEE Transac-tions on Visualization and Computer Graphics 2012 (2014) 2161ndash2170ISSN 1077-2626 DOI 101109TVCG20142346321 2
ccopy 2020 The Author(s)Computer Graphics Forum ccopy 2020 The Eurographics Association and John Wiley amp Sons Ltd
Das et al QUESTO Interactive Construction of Objective Functions for Classification Tasks
[SKBE17] SAKET B KIM H BROWN E T and ENDERT A ldquoVi-sualization by Demonstration An Interaction Paradigm for Visual DataExplorationrdquo IEEE Transactions on Visualization and Computer Graph-ics 231 (2017) 331ndash340 ISSN 1077-2626 DOI 101109TVCG20162598839 2
[SLT17] SUN Y LANK E and TERRY M ldquoLabel-and-Learn Visu-alizing the Likelihood of Machine Learning Classifierrsquos Success Dur-ing Data Labelingrdquo Proceedings of the 22Nd International Confer-ence on Intelligent User Interfaces IUI rsquo17 Limassol Cyprus ACM2017 523ndash534 ISBN 978-1-4503-4348-0 DOI 10114530251713025208 3
[SRL07] STUMPF S RAJARAM V LI L et al ldquoToward HarnessingUser Feedback for Machine Learningrdquo Proceedings of the 12th Inter-national Conference on Intelligent User Interfaces IUI rsquo07 HonoluluHawaii USA ACM 2007 82ndash91 ISBN 1-59593-481-2 DOI 10 114512162951216316 2
[SRL09] STUMPF S RAJARAM V LI L et al ldquoInteracting Mean-ingfully with Machine Learning Systems Three Experimentsrdquo Int JHum-Comput Stud 678 (Aug 2009) 639ndash662 ISSN 1071-5819 DOI101016jijhcs200903004 3
[SSZ17] S DOMINIK S MICHAEL Z LEISHI et al ldquoWhat you see iswhat you can change Human-centered machine learning by interactivevisualizationrdquo Neurocomputing 268 (2017) 164ndash175 3
[TCWM18] T LI CONVERTINO G WANG W and MOST H ldquoHyper-Tuner Visual Analytics for Hyperparameter Tuning by ProfessionalsrdquoMachine Learning from User Interaction for Visualization and Analyt-ics IEEE VIS 2018 (2018) 3
[TDCF07] TULLIO J DEY A K CHALECKI J and FOGARTY JldquoHow It Works A Field Study of Non-technical Users Interacting withan Intelligent Systemrdquo Proceedings of the SIGCHI Conference on Hu-man Factors in Computing Systems CHI rsquo07 San Jose CaliforniaUSA ACM 2007 31ndash40 ISBN 978-1-59593-593-9 DOI 10114512406241240630 3
[THHLB13] THORNTON C HUTTER F HOOS H H and LEYTON-BROWN K ldquoAuto-WEKA Combined selection and hyperparameter op-timization of classification algorithmsrdquo Proceedings of the 19th ACMSIGKDD international conference on Knowledge discovery and datamining ACM 2013 847ndash855 3
[TLB11] TAMUZ O LIU C BELONGIE S et al ldquoAdaptively Learn-ing the Crowd Kernelrdquo Proceedings of the 28th International Con-ference on International Conference on Machine Learning ICMLrsquo11Bellevue Washington USA Omnipress 2011 673ndash680 ISBN 978-1-4503-0619-5 2ndash4
[TLKT09] TALBOT J LEE B KAPOOR A and TAN D S ldquoEnsem-bleMatrix interactive visualization to support machine learning withmultiple classifiersrdquo CHI Ed by JR DAN R OLSEN ARTHURRICHARD B HINCKLEY KEN et al ACM 2009 1283ndash1292 ISBN978-1-60558-246-7 2
[VDEW11] VAN DEN ELZEN S and van WIJK J J ldquoBaobabview In-teractive construction and analysis of decision treesrdquo Visual Analyt-ics Science and Technology (VAST) 2011 IEEE Conference on IEEE2011 151ndash160 2 4
[WEF13] WALKER D J EVERSON R and FIELDSEND J E ldquoVisu-alizing Mutually Nondominating Solution Sets in Many-Objective Op-timizationrdquo Trans Evol Comp 172 (Apr 2013) 165ndash184 ISSN 1089-778X DOI 101109TEVC20122225064 3
[WFE12] WALKER D FIELDSEND J and EVERSON R ldquoVisualisingMany-objective Populationsrdquo Proceedings of the 14th Annual Confer-ence Companion on Genetic and Evolutionary Computation GECCOrsquo12 Philadelphia Pennsylvania USA ACM 2012 451ndash458 ISBN 978-1-4503-1178-6 DOI 10114523307842330853 3
[WLDW01] WOLFMAN S A LAU T DOMINGOS P and WELDD S ldquoMixed Initiative Interfaces for Learning Tasks SMARTeditTalks Backrdquo Proceedings of the 6th International Conference on Intel-ligent User Interfaces IUI rsquo01 Santa Fe New Mexico USA ACM2001 167ndash174 ISBN 1-58113-325-1 DOI 10 1145 359784 360332 3
[WN17] WENSKOVITCH J and NORTH C ldquoObservation-Level Inter-action with Clustering and Dimension Reduction Algorithmsrdquo Pro-ceedings of the 2Nd Workshop on Human-In-the-Loop Data AnalyticsHILDArsquo17 Chicago IL USA ACM 2017 141ndash146 ISBN 978-1-4503-5029-7 DOI 10114530772573077259 2
[YL09] YEH I and LIEN C ldquoThe comparisons of data mining tech-niques for the predictive accuracy of probability of default of credit cardclientsrdquo Expert Systems with Applications 362 Part 1 (2009) 2473 ndash2480 ISSN 0957-4174 DOI httpsdoiorg101016jeswa200712020 8
[YSCR18] YANG Q SUH J CHEN N and RAMOS G ldquoGroundingInteractive Machine Learning Tool Design in How Non-Experts ActuallyBuild Modelsrdquo ACM 2018 2 3
[ZSZR18] Z XIAOJIN SINGLA A ZILLES S and RAFFERTY A NldquoAn Overview of Machine Teachingrdquo CoRR abs180105927 (2018) 23
ccopy 2020 The Author(s)Computer Graphics Forum ccopy 2020 The Eurographics Association and John Wiley amp Sons Ltd
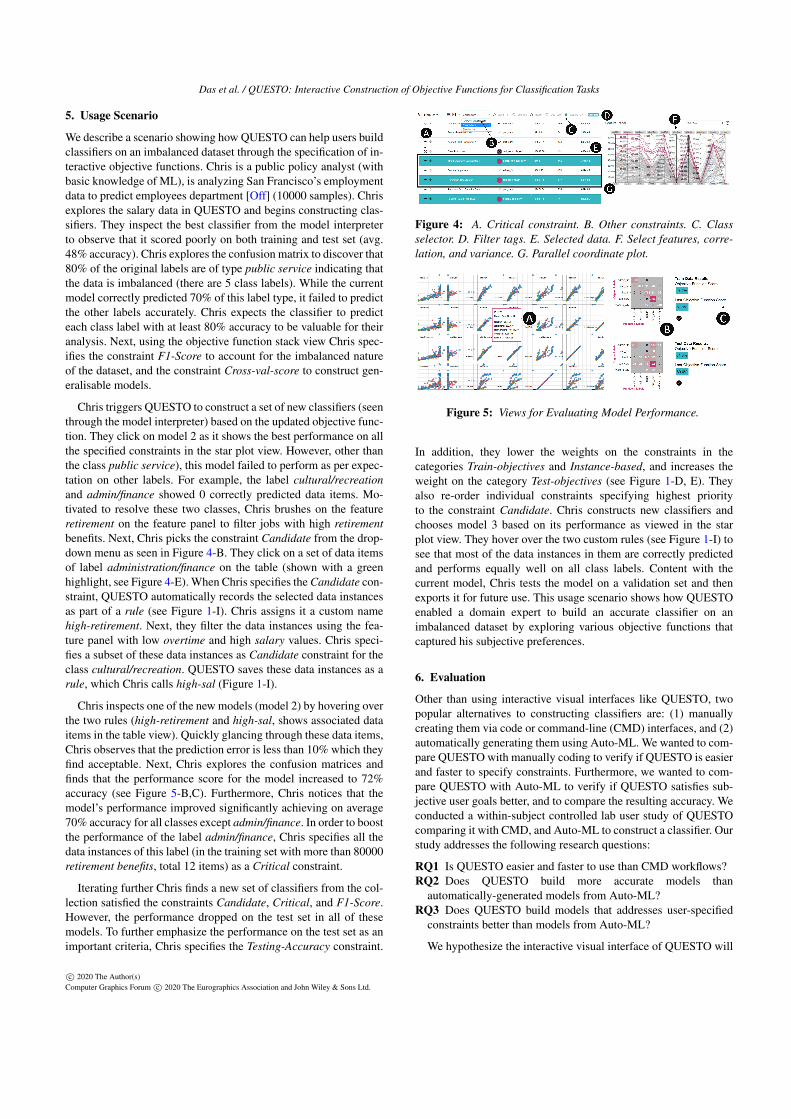
Das et al QUESTO Interactive Construction of Objective Functions for Classification Tasks
5 Usage Scenario
We describe a scenario showing how QUESTO can help users buildclassifiers on an imbalanced dataset through the specification of in-teractive objective functions Chris is a public policy analyst (withbasic knowledge of ML) is analyzing San Franciscorsquos employmentdata to predict employees department [Off] (10000 samples) Chrisexplores the salary data in QUESTO and begins constructing clas-sifiers They inspect the best classifier from the model interpreterto observe that it scored poorly on both training and test set (avg48 accuracy) Chris explores the confusion matrix to discover that80 of the original labels are of type public service indicating thatthe data is imbalanced (there are 5 class labels) While the currentmodel correctly predicted 70 of this label type it failed to predictthe other labels accurately Chris expects the classifier to predicteach class label with at least 80 accuracy to be valuable for theiranalysis Next using the objective function stack view Chris spec-ifies the constraint F1-Score to account for the imbalanced natureof the dataset and the constraint Cross-val-score to construct gen-eralisable models
Chris triggers QUESTO to construct a set of new classifiers (seenthrough the model interpreter) based on the updated objective func-tion They click on model 2 as it shows the best performance on allthe specified constraints in the star plot view However other thanthe class public service) this model failed to perform as per expec-tation on other labels For example the label culturalrecreationand adminfinance showed 0 correctly predicted data items Mo-tivated to resolve these two classes Chris brushes on the featureretirement on the feature panel to filter jobs with high retirementbenefits Next Chris picks the constraint Candidate from the drop-down menu as seen in Figure 4-B They click on a set of data itemsof label administrationfinance on the table (shown with a greenhighlight see Figure 4-E) When Chris specifies the Candidate con-straint QUESTO automatically records the selected data instancesas part of a rule (see Figure 1-I) Chris assigns it a custom namehigh-retirement Next they filter the data instances using the fea-ture panel with low overtime and high salary values Chris speci-fies a subset of these data instances as Candidate constraint for theclass culturalrecreation QUESTO saves these data instances as arule which Chris calls high-sal (Figure 1-I)
Chris inspects one of the new models (model 2) by hovering overthe two rules (high-retirement and high-sal shows associated dataitems in the table view) Quickly glancing through these data itemsChris observes that the prediction error is less than 10 which theyfind acceptable Next Chris explores the confusion matrices andfinds that the performance score for the model increased to 72accuracy (see Figure 5-BC) Furthermore Chris notices that themodelrsquos performance improved significantly achieving on average70 accuracy for all classes except adminfinance In order to boostthe performance of the label adminfinance Chris specifies all thedata instances of this label (in the training set with more than 80000retirement benefits total 12 items) as a Critical constraint
Iterating further Chris finds a new set of classifiers from the col-lection satisfied the constraints Candidate Critical and F1-ScoreHowever the performance dropped on the test set in all of thesemodels To further emphasize the performance on the test set as animportant criteria Chris specifies the Testing-Accuracy constraint
Figure 4 A Critical constraint B Other constraints C Classselector D Filter tags E Selected data F Select features corre-lation and variance G Parallel coordinate plot
Figure 5 Views for Evaluating Model Performance
In addition they lower the weights on the constraints in thecategories Train-objectives and Instance-based and increases theweight on the category Test-objectives (see Figure 1-D E) Theyalso re-order individual constraints specifying highest priorityto the constraint Candidate Chris constructs new classifiers andchooses model 3 based on its performance as viewed in the starplot view They hover over the two custom rules (see Figure 1-I) tosee that most of the data instances in them are correctly predictedand performs equally well on all class labels Content with thecurrent model Chris tests the model on a validation set and thenexports it for future use This usage scenario shows how QUESTOenabled a domain expert to build an accurate classifier on animbalanced dataset by exploring various objective functions thatcaptured his subjective preferences
6 Evaluation
Other than using interactive visual interfaces like QUESTO twopopular alternatives to constructing classifiers are (1) manuallycreating them via code or command-line (CMD) interfaces and (2)automatically generating them using Auto-ML We wanted to com-pare QUESTO with manually coding to verify if QUESTO is easierand faster to specify constraints Furthermore we wanted to com-pare QUESTO with Auto-ML to verify if QUESTO satisfies sub-jective user goals better and to compare the resulting accuracy Weconducted a within-subject controlled lab user study of QUESTOcomparing it with CMD and Auto-ML to construct a classifier Ourstudy addresses the following research questions
RQ1 Is QUESTO easier and faster to use than CMD workflowsRQ2 Does QUESTO build more accurate models than
automatically-generated models from Auto-MLRQ3 Does QUESTO build models that addresses user-specified
constraints better than models from Auto-ML
We hypothesize the interactive visual interface of QUESTO will
ccopy 2020 The Author(s)Computer Graphics Forum ccopy 2020 The Eurographics Association and John Wiley amp Sons Ltd
Das et al QUESTO Interactive Construction of Objective Functions for Classification Tasks
be easier and faster to use compared to command-line interfacesHere ldquofasterrdquo refers to the time it takes to specify constraints andconstruct classifiers it does not include the time needed to trainclassifiers Further we hypothesize that Auto-ML will generatemore globally accurate models given the objective function op-timizing towards a specified accuracy metric such as high cross-validation score However RQ3 tests our hypothesis that QUESTOwill be better at building models that fit specific user constraintsgiven the customized objective function thus illuminating thistradeoff between accuracy and user goals
In the literature there is no well-defined metric to measure howwell user-defined constraints are satisfied in classifier constructionThus we defined constraint satisfaction score as a metric thatcaptures how well a model attains user-specifed constraints suchas Critical Candidate etc These scores are normalized between0minus 1 (higher is better) It is expressed as (sumU
0 ωi lowast γi)U where ω
is the weight of U constraints γ is the score of each constraint U isthe total number of specified constraints in the objective function
We recruited 16 participants (7 Male 9 Female) aged between21-29 (M=25 SD=291) by inviting participants through our uni-versity mailing lists We required them to at least have a basic ex-pertise in writing python code with elementary understanding ofML All of the participants (undergraduate and graduate students)were familiar with basicintermediate data analysis using tools suchas MS Excel Tableau etc The experiment lasted 60 minutes andwe compensated each participants with a $10 Amazon gift cardThe study was conducted using a 17-inch display and a mouse
61 Study Design
We began the study with a practice session teaching users howto interact with both QUESTO and CMD (with VS Code as thescripting editor) During the practice session participants were en-couraged to ask questions to clarify uncertainty in relation to theworkflow or the interaction design We proceeded to the experi-mental sessions only when the participants felt confident in usingeach system For quantitative evaluation each participant interactedwith both QUESTO and CMD using one dataset Furthermore theorder of the interfaces (QUESTO and CMD) the datasets andthe tasks were randomized to remove any orderinglearning effectWe considered these dependent variables for quantitative analysis(1) Task completition times in specifying an objective functionthrough QUESTO or CMD (2) Model accuracy the accuracy ofthe model constructed using QUESTO CMD and Auto-ML standalone (3) Constraint satisfaction score measure to capture con-straints satisfied by the model and (4) User preference rating av-erage preference rating of Ease of Use for QUESTO and CMD
62 Datasets
For the practice session we provided a dataset of 10000 credit cardtransaction records [YL09] The data has attributes such as bill paidmonth 1 bill paid month 2 bill paid month 3 account balanceetc It was a binary classification task to predict if a bank customerwill default on a bank loan or not For the experimental sessionswe provided San Franciscorsquos employment dataset [Off] containing5000 data items for the quantitative evaluation Each row in the data
contains information about an employeersquos remuneration containingattributes such as dental benefits annual salary monthly salaryextra benefits etc The task was to predict the employeersquos depart-ment (5 classes) For the qualitative evaluation we used a moviesdataset [Mov] (5000 samples) containing attributes such as budgetgross revenue facebook likes of lead actors director cast etc Thedata has three labels for movie rating high medium and low Fol-lowing best ML practices we use multiple test datasets so that theconstructed model never sees unseen data instances
63 Tasks and Procedure
In the practice session we asked users to perform 2 tasks per inter-face The first task was to design an objective function in QUESTOby specifying a Critical constraint They were asked to iterate mul-tiple times and improve the classifiers performance by refining theconstraint The next task was to add two more constraints (Similar-ity and Candidate) to the objective function in QUESTO and iter-atively improve the classifiers performance They repeat the sametasks by writing code and using CMD to run their code to con-struct a classifier For the quantitative evaluation participants arerandomly assigned an interface (QUESTO or CMD) Participantswere encouraged to think aloud while they interact with each sys-tem The interviewer was a silent observer and was away from theparticipant to mitigate Hawthorne and Rosenthal effect during thesession Participants performed 3 tasks per interface (6 tasks total)Each of the tasks were in increasing level of difficulty
Task 1 Specify the constraint Similarity (Max time 3 minutes)Task 2 Specify Critical and Candidate (Max time 5 minutes)Task 3 Specify Critical Similarity Candidate F1-Score Preci-
sion Accuracy and Cross-Validation (Max time 7 minutes)
For the qualitative evaluation we asked participants to freely useQUESTO (may specify any constraint) to build a classifier (on themovies data) and improve its objective function score in 5 minutes
64 Data Collection
For quantitative assessment we saved log data which stores (periteration) models selected by users their learning algorithms andhyperparameters predicted class labels interacted data items user-specified constraints etc When participants completed the threetasks on both interfaces we asked them to fill a NASA-TLX form[HS88] and a post-study questionnaire with a set of likert scalequestions We asked questions to seek user preference rating to eachinterfacersquos various dimensions such as (1) Ease of use (2) Flexi-bility (3) Fun to use (4) Learnability and (5) Intuitiveness Afterthe qualitative evaluation we conducted a semi-structured interviewasking open-ended questions about the workflow system usabilityand interaction design for each interface In this interview we askedquestions such as (1) Describe your thought process while you in-teracted with QUESTO (2) Explain your experience in construct-ing an objective function interactively vs through writing code(3) How do you think we can improve the current workflow and de-sign of QUESTO We also captured video and audio of participantsscreen while they interacted with QUESTO
ccopy 2020 The Author(s)Computer Graphics Forum ccopy 2020 The Eurographics Association and John Wiley amp Sons Ltd
Das et al QUESTO Interactive Construction of Objective Functions for Classification Tasks
Figure 6 The study results comparing QUESTO with coding interfaces and Auto-ML techniques for classification tasks
65 Quantitative Analysis
For the following we used the Friedman Test for Repeated-Measures as it is a good indicator of statistical significance formulti-class classifiers with multiple datasets which may not fol-low a normal distribution as suggested by [Dem06] Furthermorewe utilised Post-hoc Wilcoxon signed-rank tests with Bonferronicorrection (new p value = 003) to test for statistical significance
Ease of use To answer RQ1 we used likert scale rating scores(5-point scale) from participants (average ease of use rating 464higher is better see Figure 6-D) The ease of use of QUESTO wassignificant across all tasks (χ2(1) = 4803 p lt 003) thus answer-ing RQ1 that QUESTO is easier to use than CMD
Task completion times Participants were significantly faster tospecify constraints in QUESTO than CMD (Figure 6-C) Every par-ticipant completed all tasks except for three who failed to completetask 3 in the allotted time using CMD In these cases we recordedthe maximum alotted time for that task Quantitatively we foundstatistically significant difference in task completion time for alltasks Task1 (χ2(1) = 160 p lt 003) Task2 (χ2(1) = 160 p lt003) and Task3 (χ2(1) = 40 p lt 003) This answered RQ1 thatQUESTO is faster to specify constraints than CMD
Model Accuracies To answer RQ2 we compared the models gen-erated using QUESTO CMD and Auto-ML with respect to theiraccuracies We found QUESTO generated similar quality modelsin relation to accuracies as produced by CMD (refer Figure 6-A)However accuracies generated by models from Auto-ML standalone were higher in comparison to QUESTO We observed sta-tistically significant difference in the model accuracy for task 1(χ2(1) = 1225 p lt 003) and task 3 (χ2(1) = 40 p lt 003)
Constraint satisfaction We found that QUESTO outperformedAuto-ML in meeting user-specified constraints for all tasks Task1(χ2(1) = 625 p lt 003) Task2 (χ2(1) = 225 p lt 003) andTask3 (χ2(1) = 90 p lt 003) This answered RQ3 We analysedthis based on data collected from the employment dataset [Off](users were given the example data items to specify as constraints)and on the movie dataset [Mov] (users freely specified constraints)
66 Qualitative Analysis
User Preferences We measured user preferences using 5-pointlikert scale rating QUESTOrsquos user preference ratings (out of 5)
were higher than CMD workflow in various aspects such as Easyof use (Q 453 CMD 322) Fun to use (Q 469 CMD 288) Learnable (Q 434 CMD 297) and Intuitive (Q 438 CMD287) (see Figure 6-D) In addition through the NASA-TLXsurvey we found that average participantsrsquo cognitive workload wassignificantly lower in QUESTO than CMD interfaces (Q 430CMD 887 out of 10 lower is better) Based on these results itis likely that participants preferred QUESTO compared to usingthe CMD interface for objective function creation However manyparticipants found CMD comparably flexible to QUESTO tospecify preferences (Q 378 CMD 352) and debug models
Easy workflow Every participant found QUESTOrsquos interface andthe workflow easy to learn and use Users liked the table view withthe ability to filter and search for specific data items as examplesfor constraint specification P03 said ldquoI like how I can mouseoveron the cells of the confusion matrix to see incorrectly predicteddata itemsrdquo P08 added ldquoI frequently brush over the feature panelto filter data items by a set of attributes I care aboutrdquo Howeverusers recommended that more advanced sorting feature in the tablewould have helped them find appropriate examples quickly
Level of Detail Some participants had elementary knowledge ofpython and ML while a few others had in-depth ML expertise P09reflected ldquoBest part of this workflow is how easy the tool makesto change my constraints in terms of weighting or ordering themwhich lets me look into a new set of classifiersrdquo While advancedML users appreciated the idea of an interactive interface to definean objective function reflected that they would prefer to look at thenumerical weights on each constraint so that they can better trusthow the modeling engine is selecting classifiers P13 said Thoughthe objective function view is very useful I am not sure if I un-derstand whatrsquos happening on the background without knowing thenumerical weights on these constraints
Meaningful constraints Participants found the constraints inQUESTO appropriate and useful for classifier construction P10added ldquoI think the constraints make a lot of sense to me When Itest models I frequently look at specific data items to verify if theclassifier modeled the data correctlyrdquo However a few participantscommented that it would help if QUESTO could recommend itemsto consider next For example P03 suggested ldquoI think you can useprediction probabilities to reflect on how confident the model is oneach prediction That may help me specify better examplesrdquo
Intuitive model selection Users found the model interpreter view
ccopy 2020 The Author(s)Computer Graphics Forum ccopy 2020 The Eurographics Association and John Wiley amp Sons Ltd
Das et al QUESTO Interactive Construction of Objective Functions for Classification Tasks
useful to compare models based on their performance on the spec-ified constraints P17 noted ldquoFrom the star plot view I can inspectthe size of the polygons to select models that performed better onrelevant constraints I would prefer to mouseover (instead of click)to browse the model output results on the table and the confusionmatricesrdquo However participants wanted to see a bookmark featureto save models they like Furthermore one participant desired tosee how each constraint contributed to a change in model output tounderstand what interaction improved performance
Task complexity The three tasks in the user study had differentlevels of complexity While task 1 and task 2 involved satisfyingonly subjective user preferences task 3 included finding modelsthat are accurate yet address constraints such as Similarity Can-didate etc Participants found task 3 more challenging as findingthe right model that is accurate and addresses their personal goalswas difficult P15 noted ldquoIt was hard to improve the classifiers per-formance when I had more than 4 constraints to specify Howeverwith QUESTO I could rapidly test different weightingsrankings tothese constraints to find an optimal classifierrdquo
Conflicting constraints We observed that participants sometimesspecified conflicting constraints For example they specified a setof data item as a Candidate constraint but in a later iteration theyspecified a subset of these data items as a Ignore constraint AsQUESTO currently does not support alerting users about conflictsin future we plan to mitigate them in objective specification
Modeling process From the study we found that QUESTOrsquosworkflow does not help users understand the underlying modelingprocess Often participants wondered what interaction in the previ-ous iteration led to the improvement or degradation in the accuracyor the objective function score Future work could make the mod-eling process more transparent and allow users to reason about theimpact of their objective specification on classifier selection
7 Discussion
User-System Feedback loop Interactive objective functions mayguide an Auto-ML model solver to select models that weigh datainstances preferentially to better support user goals For examplean objective function with the Critical constraint will guide theAuto-ML solver to prefer classifiers that correctly predict specificitems In response users may inspect a model in relation to howwell it supports the specified constraints Thus interactive objec-tive functions employ a two-way feedback loop between the userand the system for (1) communicating preferences to find suitablemodels and (2) providing a medium for understanding classifierperformance Participants confirmed that (per iteration) they vali-dated models in relation to how well they support the constraints
Tradeoff Analysis Practically in a multi-objective optimizationproblem satisfying every objective might not be feasible [SAS02]due to a plethora of reasons including conflicting constraints math-ematical infeasibility noiseoutliers in the data high dimensional-ity etc [KLTH10] Formalizing user goals as a set of constraintsin an objective function facilitates searching for a set of pareto-optimal solutions which may only satisfy a subset of the specifieduser goals Furthermore visualizing these pareto-optimal modelshelp users inspect them and understand tradeoffs
ML users often seek models that support other customizedsubjective goalsobjectives that are personal and problem-specific([KLTH10]) This study validated that while QUESTO producedslightly less accurate models than Auto-ML model solvers theymet subjective user-specified constraints We envision that userswill need to find a balance between these two extremes
71 Limitations
Scope and assumptions of the user study In the study we timedeach task to ensure the study can be completed within a reasonabletime However in more realistic settings optimizing for (or lim-iting) time may not be meaningful Further we used pre-definedhyperameters within which Hyperopt sampled values to constructclassifiers The study results may vary if the set of hyperparametersused are different Also our study only included participants withbasic expertise of python and ML
Model overfitting Good ML practices entail that trained modelshave no knowledge of test data In QUESTO we follow the sameprocess The test data view in the data table allows users to inspectclassifiers by reviewing the predictions made at the data instancelevel Furthermore by specifying the objectives Train-objectivesand (and weighting them) users can control for model overfit-ting Nevertheless we are aware that if users do not specify theymay produce overfitted models However this may be the case forcommand-line classifier construction as well if addition of regular-izers or cross-validation approaces are not used
Scalability The current UI design is based on datasets of mod-est size Thus there are aspects of the UI that would become lessusable if datasets grew larger For example while the table viewsupports sorting and filtering the fundamental design of showingitems in a table may make finding individual relevant data itemschallenging However for larger datsets we can augment QUESTOwith visualisations that can aggregate data and show example dataitems on demand (eg grouped heatmap view etc)
8 Conclusion
In this paper we present a design space of constraints categorizingvarious user goals for a classification task Grounded in this designspace we developed a prototype system QUESTO that supports in-teractive construct of objective functions to specify their subjectivepreferences to a classifier Finally we validate the effectiveness ofQUESTO by a within-subject user study that proved that QUESTOis easier and faster to use than conventional command line alterna-tives We also demonstrate that while QUESTO produces slightlyless accurate classifiers than Auto-ML it produces models that bet-ter satisfy user-specified constraints This presents a step towardsunderstanding how to integrate people into Auto-ML processes
9 Acknowledgements
Support for the research is partially provided by DARPA FA8750-17-2-0107 DARPA FA8750-17-2-010 NSF 1841349 and NSFIIS-1452977 The views and conclusions contained in this doc-ument are those of the authors and should not be interpreted asrepresenting the official policies either expressed or implied ofthe US Government
ccopy 2020 The Author(s)Computer Graphics Forum ccopy 2020 The Eurographics Association and John Wiley amp Sons Ltd
Das et al QUESTO Interactive Construction of Objective Functions for Classification Tasks
References[ACKK14] AMERSHI S CAKMAK M KNOX W B and KULESZA
T ldquoPower to the people The role of humans in interactive machine learn-ingrdquo AI Magazine 354 (2014) 105ndash120 2
[AF18] AHAMED F and FARID F ldquoApplying Internet of Things andMachine-Learning for Personalized Healthcare Issues and Challengesrdquo2018 International Conference on Machine Learning and Data Engi-neering (iCMLDE) 2018 19ndash21 DOI 101109iCMLDE201800014 3
[AFKT11] AMERSHI S FOGARTY J KAPOOR A and TAN D SldquoEffective End-User Interaction with Machine Learningrdquo AAAI 2011 3
[BGV16] BOUALI F GUETTALA A and VENTURINI G ldquoVizAssistAn Interactive User Assistant for Visual Data Miningrdquo Vis Comput3211 (Nov 2016) 1447ndash1463 ISSN 0178-2789 DOI 10 1007 s00371- 015- 1132- 9 URL httpdxdoiorg101007s00371-015-1132-9 2
[BLBC12] BROWN E T LIU J BRODLEY C E and CHANGR ldquoDis-function Learning distance functions interactivelyrdquo 2012IEEE Conference on Visual Analytics Science and Technology (VAST)2012 83ndash92 DOI 101109VAST20126400486 2
[BM17] BIRAN O and MCKEOWN K ldquoHuman-centric Justification ofMachine Learning Predictionsrdquo Proceedings of the 26th InternationalJoint Conference on Artificial Intelligence IJCAIrsquo17 Melbourne Aus-tralia AAAI Press 2017 1461ndash1467 ISBN 978-0-9992411-0-3 3
[BNHL14] BRADEL L NORTH C HOUSE L and LEMAN S ldquoMulti-model semantic interaction for text analyticsrdquo 2014 IEEE Conference onVisual Analytics Science and Technology (VAST) 2014 163ndash172 DOI101109VAST20147042492 2
[BYC13] BERGSTRA J YAMINS D and COX D D ldquoHyperopt Apython library for optimizing the hyperparameters of machine learn-ing algorithmsrdquo Proceedings of the 12th Python in Science Conference2013 13ndash20 3
[BZSA17] BERNARD J ZEPPELZAUER M SEDLMAIR M andAIGNER W ldquoA Unified Process for Visual-Interactive Labelingrdquo Euro-Vis Workshop on Visual Analytics (EuroVA) Ed by S MICHAEL and TCHRISTIAN The Eurographics Association 2017 ISBN 978-3-03868-042-0 DOI 102312eurova20171123 3
[CAK17] CHANG J C AMERSHI S and KAMAR E ldquoRevolt Collab-orative Crowdsourcing for Labeling Machine Learning Datasetsrdquo Pro-ceedings of the 2017 CHI Conference on Human Factors in ComputingSystems CHI rsquo17 Denver Colorado USA ACM 2017 2334ndash2346ISBN 978-1-4503-4655-9 DOI 10 1145 3025453 3026044URL httpdoiacmorg10114530254533026044 3
[CB15] CHENG J and BERNSTEIN M S ldquoFlock Hybrid Crowd-Machine Learning Classifiersrdquo Proceedings of the 18th ACM Confer-ence on Computer Supported Cooperative Work amp38 Social Comput-ing CSCW rsquo15 Vancouver BC Canada ACM 2015 600ndash611 ISBN978-1-4503-2922-4 DOI 10114526751332675214 3 4
[CES09] CRAMER H S M EVERS V S VAN et al ldquoAwarenessTraining and Trust in Interaction with Adaptive Spam Filtersrdquo Proceed-ings of the SIGCHI Conference on Human Factors in Computing Sys-tems CHI rsquo09 Boston MA USA ACM 2009 909ndash912 ISBN 978-1-60558-246-7 DOI 10114515187011518839 3
[CFEC17] CROUSER R J FRANKLIN L ENDERT A and COOK KldquoToward theoretical techniques for measuring the use of human effort invisual analytic systemsrdquo IEEE transactions on visualization and com-puter graphics 231 (2017) 121ndash130 3
[CHH19] CASHMAN D HUMAYOUN S F HEIMERL F et al ldquoAUser-based Visual Analytics Workflow for Exploratory Model Analy-sisrdquo Computer Graphics Forum 383 (2019) 185ndash199 DOI 101111cgf13681 3
[CW18] CHEN M and WANG H ldquoHow Personal Experience and Techni-cal Knowledge Affect Using Conversational Agentsrdquo Proceedings of the23rd International Conference on Intelligent User Interfaces Compan-ion IUI rsquo18 Companion Tokyo Japan ACM 2018 531ndash532 ISBN978-1-4503-5571-1 DOI 10114531803083180362 3
[DCCE18] DAS S CASHMAN D CHANG R and ENDERT AldquoBEAMES Interactive Multi-Model Steering Selection and Inspec-tion for Regression Tasksrdquo Symposium on Visualization in Data Sci-ence(VDS) Berlin Germany 2018 3
[Dem06] DEMŠAR JANEZ ldquoStatistical Comparisons of Classifiers overMultiple Data Setsrdquo J Mach Learn Res 7 (Dec 2006) 1ndash30 ISSN1532-4435 9
[EBN13] ENDERT ALEX BRADEL LAUREN and NORTH CHRIS ldquoBe-yond Control Panels Direct Manipulation for Visual Analyticsrdquo IEEEComputer Graphics and Applications 334 (2013) 6ndash13 ISSN 0272-1716 DOI 101109MCG201353 2
[EFN12] ENDERT A FIAUX P and NORTH C ldquoSemantic Interactionfor Visual Text Analyticsrdquo Proceedings of the SIGCHI Conference onHuman Factors in Computing Systems CHI rsquo12 Austin Texas USAACM 2012 473ndash482 ISBN 978-1-4503-1015-4 DOI 10 1145 22076762207741 2
[EHM11] ENDERT A HAN CHAO MAITI D et al ldquoObservation-level Interaction with Statistical Models for Visual Analyticsrdquo IEEEVAST 2011 121ndash130 2
[EIZ13] ESCUDERO J IFEACHOR E ZAJICEK J P et al ldquoMachineLearning-Based Method for Personalized and Cost-Effective Detectionof Alzheimerrsquos Diseaserdquo IEEE Transactions on Biomedical Engineer-ing 601 (2013) 164ndash168 ISSN 0018-9294 DOI 101109TBME20122212278 3
[EW16] EIBE F MARK A H and W IAN H The WEKA WorkbenchOnline Appendix for Data Mining Practical Machine Learning Toolsand Techniques 2016 3
[FKE15] FEURER M KLEIN A EGGENSPERGER K et al ldquoEfficientand robust automated machine learningrdquo Advances in Neural Informa-tion Processing Systems 2015 2962ndash2970 3
[GFT16] GILLIES M FIEBRINK R TANAKA A et al ldquoHuman-Centred Machine Learningrdquo Proceedings of the 2016 CHI ConferenceExtended Abstracts on Human Factors in Computing Systems CHI EArsquo16 San Jose California USA ACM 2016 3558ndash3565 ISBN 978-1-4503-4082-3 DOI 10114528515812856492 3
[GLG13] G SAMUEL L ALEXANDER G NILS et al ldquoLineUp Vi-sual Analysis of Multi-Attribute Rankingsrdquo IEEE Transactions on Vi-sualization and Computer Graphics (InfoVis rsquo13) 1912 (2013) 2277ndash2286 DOI 101109TVCG2013173 2
[H99] H MARK A Correlation-based Feature Selection for MachineLearning Tech rep 1999 4
[Hol16] HOLZINGER A ldquoInteractive machine learning for health infor-matics when do we need the human-in-the-looprdquo Brain Informatics32 (2016) 119ndash131 ISSN 2198-4026 DOI 101007s40708-016-0042-6 3
[HS88] H SANDRA G and S LOWELL E ldquoDevelopment of NASA-TLX (Task Load Index) Results of Empirical and Theoretical Re-searchrdquo Human Mental Workload Ed by H PETER A and M NA-JMEDIN Vol 52 Advances in Psychology North-Holland 1988 139 ndash183 DOI httpsdoiorg101016S0166-4115(08)62386-9 8
[HY16] HE Z and YEN G G ldquoVisualization and Performance Metricin Many-Objective Optimizationrdquo IEEE Transactions on EvolutionaryComputation 203 (2016) 386ndash402 ISSN 1089-778X DOI 101109TEVC20152472283 3
[HY17] HE Z and YEN G G ldquoComparison of visualization approachesin many-objective optimizationrdquo 2017 IEEE Congress on EvolutionaryComputation (CEC) 2017 357ndash363 DOI 101109CEC20177969334 3
ccopy 2020 The Author(s)Computer Graphics Forum ccopy 2020 The Eurographics Association and John Wiley amp Sons Ltd
Das et al QUESTO Interactive Construction of Objective Functions for Classification Tasks
[JZF09] JEONG D H ZIEMKIEWICZ C FISHER B et al ldquoiPCA AnInteractive System for PCA-based Visual Analyticsrdquo Computer Graph-ics Forum Vol 28 3 Wiley Online Library 2009 767ndash774 2
[KBE14] KOMER B BERGSTRA J and ELIASMITH C ldquoHyperopt-sklearn automatic hyperparameter configuration for scikit-learnrdquo ICMLworkshop on AutoML 2014 2 3 5
[KBS11] KULESZA T BURNETT M STUMPF S et al ldquoWhere AreMy Intelligent Assistantrsquos Mistakes A Systematic Testing ApproachrdquoProceedings of the Third International Conference on End-user Develop-ment IS-EUDrsquo11 Torre Canne Italy Springer-Verlag 2011 171ndash186ISBN 978-3-642-21529-2 3
[KCPE16] KIM H CHOO J PARK H and ENDERT A ldquoInterAxisSteering scatterplot axes via observation-level interactionrdquo IEEE trans-actions on visualization and computer graphics 221 (2016) 131ndash140 2
[KDJH08] KRESIMIR M DENIS G JELOVIC M and H HELWIGldquoInteractive Visual Steering ndash Rapid Visual Prototyping of a CommonRail Injection Systemrdquo IEEE Transactions on Visualization and Com-puter Graphics 146 (Nov 2008) URL httpswwwcgtuwienacatresearchpublications2008Matkovic-2008-Steer 2
[KEV18] KWON B C EYSENBACH B VERMA J et al ldquoCluster-vision Visual Supervision of Unsupervised Clusteringrdquo IEEE Transac-tions on Visualization and Computer Graphics 241 (2018) 142ndash151ISSN 1077-2626 DOI 101109TVCG20172745085 3
[KKW17] KWON B C KIM H WALL E et al ldquoAxiSketcher In-teractive Nonlinear Axis Mapping of Visualizations through User Draw-ingsrdquo IEEE Trans Vis Comput Graph 231 (2017) 221ndash230 2
[KLTH10] KAPOOR A LEE B TAN D and HORVITZ E ldquoInteractiveOptimization for Steering Machine Classificationrdquo Proceedings of theSIGCHI Conference on Human Factors in Computing Systems CHI rsquo10Atlanta Georgia USA ACM 2010 1343ndash1352 ISBN 978-1-60558-929-9 DOI 10114517533261753529 2 3 10
[KPB14] KRAUSE J PERER A and BERTINI E ldquoINFUSE Interac-tive Feature Selection for Predictive Modeling of High DimensionalDatardquo IEEE Transactions on Visualization and Computer Graphics2012 (2014) 1614ndash1623 ISSN 1077-2626 DOI 101109TVCG20142346482 4
[KPHH11] KANDEL S PAEPCKE A HELLERSTEIN J and HEERJ ldquoWrangler Interactive Visual Specification of Data TransformationScriptsrdquo ACM Human Factors in Computing Systems (CHI) 2011 2
[KTD17] KIM S TASSE D and DEY A K ldquoMaking Machine-Learning Applications for Time-Series Sensor Data Graphical and In-teractiverdquo ACM Trans Interact Intell Syst 72 (July 2017) 81ndash830ISSN 2160-6455 DOI 1011452983924 3
[KTH16] KOTTHOFF L THORNTON C HOOS H H et al ldquoAuto-WEKA 20 Automatic model selection and hyperparameter optimiza-tion in WEKArdquo Journal of Machine Learning Research 17 (2016) 1ndash5 3
[LHM13] LEMAN S C HOUSE L MAITI D et al ldquoVisual to para-metric interaction (v2pi)rdquo PloS one 83 (2013) e50474 2
[LSL17] LIU M SHI J LI Z et al ldquoTowards Better Analysis of DeepConvolutional Neural Networksrdquo IEEE Transactions on Visualizationand Computer Graphics 231 (2017) 91ndash100 ISSN 2160-9306 DOI101109TVCG20162598831 3
[LWLZ17] LIU S WANG X LIU M and ZHU J ldquoTowards betteranalysis of machine learning models A visual analytics perspectiverdquoVisual Informatics 11 (2017) 48 ndash56 ISSN 2468-502X DOI httpsdoiorg101016jvisinf201701006 4
[LYL14] LI M YANG S and LIU X ldquoDiversity Comparison of ParetoFront Approximations in Many-Objective Optimizationrdquo IEEE Transac-tions on Cybernetics 4412 (2014) 2568ndash2584 ISSN 2168-2267 DOI101109TCYB20142310651 3
[MLa] ML BIG Big ML httpsbigmlcom Accessed March20 2019 3
[MLb] ML SCIKIT LEARN Scikit Learn Model Metrics API Refer-ence httpsscikit- learnorgstablemodulesclasseshtmlmodule-sklearnmetrics Accessed March20 2019 5 6
[MLY17] MIQING L LIANGLI Z and Y XIN ldquoHow to Read Many-Objective Solution Sets in Parallel Coordinatesrdquo CoRR abs170500368(2017) 3
[Mov] Movies Dataset howpublished = https www kaggle comcarolzhangdcimdb-5000-movie-datasetmovie_metadatacsv note = Accessed 2018-12-11 8 9
[NKHK17] NUSHI B KAMAR E HORVITZ E and KOSSMANN DldquoOn Human Intellect and Machine Failures Troubleshooting IntegrativeMachine Learning Systemsrdquo Proceedings of the Thirty-First AAAI Con-ference on Artificial Intelligence AAAIrsquo17 San Francisco CaliforniaUSA AAAI Press 2017 1017ndash1025 3
[Off] OFFICE THE SAN FRANCISCO CONTROLLERrsquoS Employee Com-pensation Data https data sfgov org City -Management - and - Ethics Employee - Compensation 88g8-5mnd Accessed March 15 2019 7ndash9
[PBD10] PATEL K BANCROFT N DRUCKER S M et al ldquoGestaltIntegrated Support for Implementation and Analysis in Machine Learn-ingrdquo Proceedings of the 23Nd Annual ACM Symposium on User In-terface Software and Technology UIST rsquo10 New York New YorkUSA ACM 2010 37ndash46 ISBN 978-1-4503-0271-5 DOI 10114518660291866038 2
[PPJ07] PAPARIZOS S PATEL J M and JAGADISH HV ldquoSIGOPTUsing schema to optimize XML query processingrdquo Data Engineer-ing 2007 ICDE 2007 IEEE 23rd International Conference on IEEE2007 1456ndash1460 3
[PSTW16] PAJER S STREIT M TORSNEY-WEIR T et alldquoWeightLifter Visual Weight Space Exploration for Multi-Criteria De-cision Makingrdquo IEEE Transactions on Visualization and ComputerGraphics (2016) 2
[RAL17] REN D AMERSHI S LEE B et al ldquoSquares Support-ing Interactive Performance Analysis for Multiclass Classifiersrdquo IEEETransactions on Visualization and Computer Graphics 231 (2017) 61ndash70 ISSN 1077-2626 DOI 101109TVCG20162598828 3
[RHY14] REN D HOumlLLERER T and YUAN X ldquoiVisDesigner Expres-sive Interactive Design of Information Visualizationsrdquo IEEE Transac-tions on Visualization and Computer Graphics 2012 (2014) 2092ndash2101ISSN 1077-2626 DOI 101109TVCG20142346291 2
[RLD18] RUDOVIC O LEE J DAI M et al ldquoPersonalized machinelearning for robot perception of affect and engagement in autism ther-apyrdquo Science Robotics 319 (2018) DOI 101126sciroboticsaao6760 3
[RSG16] RIBEIRO M T SINGH S and GUESTRIN C ldquoWhy ShouldI Trust You Explaining the Predictions of Any Classifierrdquo Proceed-ings of the 22Nd ACM SIGKDD International Conference on KnowledgeDiscovery and Data Mining KDD rsquo16 San Francisco California USAACM 2016 1135ndash1144 ISBN 978-1-4503-4232-2 DOI 10114529396722939778 2ndash4
[SAS02] SARAVANAN R ASOKAN P and SACHIDANANDAM M ldquoAmulti-objective genetic algorithm (GA) approach for optimization of sur-face grinding operationsrdquo International Journal of Machine Tools andManufacture 4212 (2002) 1327 ndash1334 ISSN 0890-6955 DOI httpsdoiorg101016S0890-6955(02)00074-3 10
[SC11] SAHU R and CHATURVEDI A K ldquoMany-Objective Comparisonof Twelve Grid Scheduling Heuristicsrdquo 2011 3
[SHB14] SEDLMAIR M HEINZL C BRUCKNER S et al ldquoVisualParameter Space Analysis A Conceptual Frameworkrdquo IEEE Transac-tions on Visualization and Computer Graphics 2012 (2014) 2161ndash2170ISSN 1077-2626 DOI 101109TVCG20142346321 2
ccopy 2020 The Author(s)Computer Graphics Forum ccopy 2020 The Eurographics Association and John Wiley amp Sons Ltd
Das et al QUESTO Interactive Construction of Objective Functions for Classification Tasks
[SKBE17] SAKET B KIM H BROWN E T and ENDERT A ldquoVi-sualization by Demonstration An Interaction Paradigm for Visual DataExplorationrdquo IEEE Transactions on Visualization and Computer Graph-ics 231 (2017) 331ndash340 ISSN 1077-2626 DOI 101109TVCG20162598839 2
[SLT17] SUN Y LANK E and TERRY M ldquoLabel-and-Learn Visu-alizing the Likelihood of Machine Learning Classifierrsquos Success Dur-ing Data Labelingrdquo Proceedings of the 22Nd International Confer-ence on Intelligent User Interfaces IUI rsquo17 Limassol Cyprus ACM2017 523ndash534 ISBN 978-1-4503-4348-0 DOI 10114530251713025208 3
[SRL07] STUMPF S RAJARAM V LI L et al ldquoToward HarnessingUser Feedback for Machine Learningrdquo Proceedings of the 12th Inter-national Conference on Intelligent User Interfaces IUI rsquo07 HonoluluHawaii USA ACM 2007 82ndash91 ISBN 1-59593-481-2 DOI 10 114512162951216316 2
[SRL09] STUMPF S RAJARAM V LI L et al ldquoInteracting Mean-ingfully with Machine Learning Systems Three Experimentsrdquo Int JHum-Comput Stud 678 (Aug 2009) 639ndash662 ISSN 1071-5819 DOI101016jijhcs200903004 3
[SSZ17] S DOMINIK S MICHAEL Z LEISHI et al ldquoWhat you see iswhat you can change Human-centered machine learning by interactivevisualizationrdquo Neurocomputing 268 (2017) 164ndash175 3
[TCWM18] T LI CONVERTINO G WANG W and MOST H ldquoHyper-Tuner Visual Analytics for Hyperparameter Tuning by ProfessionalsrdquoMachine Learning from User Interaction for Visualization and Analyt-ics IEEE VIS 2018 (2018) 3
[TDCF07] TULLIO J DEY A K CHALECKI J and FOGARTY JldquoHow It Works A Field Study of Non-technical Users Interacting withan Intelligent Systemrdquo Proceedings of the SIGCHI Conference on Hu-man Factors in Computing Systems CHI rsquo07 San Jose CaliforniaUSA ACM 2007 31ndash40 ISBN 978-1-59593-593-9 DOI 10114512406241240630 3
[THHLB13] THORNTON C HUTTER F HOOS H H and LEYTON-BROWN K ldquoAuto-WEKA Combined selection and hyperparameter op-timization of classification algorithmsrdquo Proceedings of the 19th ACMSIGKDD international conference on Knowledge discovery and datamining ACM 2013 847ndash855 3
[TLB11] TAMUZ O LIU C BELONGIE S et al ldquoAdaptively Learn-ing the Crowd Kernelrdquo Proceedings of the 28th International Con-ference on International Conference on Machine Learning ICMLrsquo11Bellevue Washington USA Omnipress 2011 673ndash680 ISBN 978-1-4503-0619-5 2ndash4
[TLKT09] TALBOT J LEE B KAPOOR A and TAN D S ldquoEnsem-bleMatrix interactive visualization to support machine learning withmultiple classifiersrdquo CHI Ed by JR DAN R OLSEN ARTHURRICHARD B HINCKLEY KEN et al ACM 2009 1283ndash1292 ISBN978-1-60558-246-7 2
[VDEW11] VAN DEN ELZEN S and van WIJK J J ldquoBaobabview In-teractive construction and analysis of decision treesrdquo Visual Analyt-ics Science and Technology (VAST) 2011 IEEE Conference on IEEE2011 151ndash160 2 4
[WEF13] WALKER D J EVERSON R and FIELDSEND J E ldquoVisu-alizing Mutually Nondominating Solution Sets in Many-Objective Op-timizationrdquo Trans Evol Comp 172 (Apr 2013) 165ndash184 ISSN 1089-778X DOI 101109TEVC20122225064 3
[WFE12] WALKER D FIELDSEND J and EVERSON R ldquoVisualisingMany-objective Populationsrdquo Proceedings of the 14th Annual Confer-ence Companion on Genetic and Evolutionary Computation GECCOrsquo12 Philadelphia Pennsylvania USA ACM 2012 451ndash458 ISBN 978-1-4503-1178-6 DOI 10114523307842330853 3
[WLDW01] WOLFMAN S A LAU T DOMINGOS P and WELDD S ldquoMixed Initiative Interfaces for Learning Tasks SMARTeditTalks Backrdquo Proceedings of the 6th International Conference on Intel-ligent User Interfaces IUI rsquo01 Santa Fe New Mexico USA ACM2001 167ndash174 ISBN 1-58113-325-1 DOI 10 1145 359784 360332 3
[WN17] WENSKOVITCH J and NORTH C ldquoObservation-Level Inter-action with Clustering and Dimension Reduction Algorithmsrdquo Pro-ceedings of the 2Nd Workshop on Human-In-the-Loop Data AnalyticsHILDArsquo17 Chicago IL USA ACM 2017 141ndash146 ISBN 978-1-4503-5029-7 DOI 10114530772573077259 2
[YL09] YEH I and LIEN C ldquoThe comparisons of data mining tech-niques for the predictive accuracy of probability of default of credit cardclientsrdquo Expert Systems with Applications 362 Part 1 (2009) 2473 ndash2480 ISSN 0957-4174 DOI httpsdoiorg101016jeswa200712020 8
[YSCR18] YANG Q SUH J CHEN N and RAMOS G ldquoGroundingInteractive Machine Learning Tool Design in How Non-Experts ActuallyBuild Modelsrdquo ACM 2018 2 3
[ZSZR18] Z XIAOJIN SINGLA A ZILLES S and RAFFERTY A NldquoAn Overview of Machine Teachingrdquo CoRR abs180105927 (2018) 23
ccopy 2020 The Author(s)Computer Graphics Forum ccopy 2020 The Eurographics Association and John Wiley amp Sons Ltd
Das et al QUESTO Interactive Construction of Objective Functions for Classification Tasks
be easier and faster to use compared to command-line interfacesHere ldquofasterrdquo refers to the time it takes to specify constraints andconstruct classifiers it does not include the time needed to trainclassifiers Further we hypothesize that Auto-ML will generatemore globally accurate models given the objective function op-timizing towards a specified accuracy metric such as high cross-validation score However RQ3 tests our hypothesis that QUESTOwill be better at building models that fit specific user constraintsgiven the customized objective function thus illuminating thistradeoff between accuracy and user goals
In the literature there is no well-defined metric to measure howwell user-defined constraints are satisfied in classifier constructionThus we defined constraint satisfaction score as a metric thatcaptures how well a model attains user-specifed constraints suchas Critical Candidate etc These scores are normalized between0minus 1 (higher is better) It is expressed as (sumU
0 ωi lowast γi)U where ω
is the weight of U constraints γ is the score of each constraint U isthe total number of specified constraints in the objective function
We recruited 16 participants (7 Male 9 Female) aged between21-29 (M=25 SD=291) by inviting participants through our uni-versity mailing lists We required them to at least have a basic ex-pertise in writing python code with elementary understanding ofML All of the participants (undergraduate and graduate students)were familiar with basicintermediate data analysis using tools suchas MS Excel Tableau etc The experiment lasted 60 minutes andwe compensated each participants with a $10 Amazon gift cardThe study was conducted using a 17-inch display and a mouse
61 Study Design
We began the study with a practice session teaching users howto interact with both QUESTO and CMD (with VS Code as thescripting editor) During the practice session participants were en-couraged to ask questions to clarify uncertainty in relation to theworkflow or the interaction design We proceeded to the experi-mental sessions only when the participants felt confident in usingeach system For quantitative evaluation each participant interactedwith both QUESTO and CMD using one dataset Furthermore theorder of the interfaces (QUESTO and CMD) the datasets andthe tasks were randomized to remove any orderinglearning effectWe considered these dependent variables for quantitative analysis(1) Task completition times in specifying an objective functionthrough QUESTO or CMD (2) Model accuracy the accuracy ofthe model constructed using QUESTO CMD and Auto-ML standalone (3) Constraint satisfaction score measure to capture con-straints satisfied by the model and (4) User preference rating av-erage preference rating of Ease of Use for QUESTO and CMD
62 Datasets
For the practice session we provided a dataset of 10000 credit cardtransaction records [YL09] The data has attributes such as bill paidmonth 1 bill paid month 2 bill paid month 3 account balanceetc It was a binary classification task to predict if a bank customerwill default on a bank loan or not For the experimental sessionswe provided San Franciscorsquos employment dataset [Off] containing5000 data items for the quantitative evaluation Each row in the data
contains information about an employeersquos remuneration containingattributes such as dental benefits annual salary monthly salaryextra benefits etc The task was to predict the employeersquos depart-ment (5 classes) For the qualitative evaluation we used a moviesdataset [Mov] (5000 samples) containing attributes such as budgetgross revenue facebook likes of lead actors director cast etc Thedata has three labels for movie rating high medium and low Fol-lowing best ML practices we use multiple test datasets so that theconstructed model never sees unseen data instances
63 Tasks and Procedure
In the practice session we asked users to perform 2 tasks per inter-face The first task was to design an objective function in QUESTOby specifying a Critical constraint They were asked to iterate mul-tiple times and improve the classifiers performance by refining theconstraint The next task was to add two more constraints (Similar-ity and Candidate) to the objective function in QUESTO and iter-atively improve the classifiers performance They repeat the sametasks by writing code and using CMD to run their code to con-struct a classifier For the quantitative evaluation participants arerandomly assigned an interface (QUESTO or CMD) Participantswere encouraged to think aloud while they interact with each sys-tem The interviewer was a silent observer and was away from theparticipant to mitigate Hawthorne and Rosenthal effect during thesession Participants performed 3 tasks per interface (6 tasks total)Each of the tasks were in increasing level of difficulty
Task 1 Specify the constraint Similarity (Max time 3 minutes)Task 2 Specify Critical and Candidate (Max time 5 minutes)Task 3 Specify Critical Similarity Candidate F1-Score Preci-
sion Accuracy and Cross-Validation (Max time 7 minutes)
For the qualitative evaluation we asked participants to freely useQUESTO (may specify any constraint) to build a classifier (on themovies data) and improve its objective function score in 5 minutes
64 Data Collection
For quantitative assessment we saved log data which stores (periteration) models selected by users their learning algorithms andhyperparameters predicted class labels interacted data items user-specified constraints etc When participants completed the threetasks on both interfaces we asked them to fill a NASA-TLX form[HS88] and a post-study questionnaire with a set of likert scalequestions We asked questions to seek user preference rating to eachinterfacersquos various dimensions such as (1) Ease of use (2) Flexi-bility (3) Fun to use (4) Learnability and (5) Intuitiveness Afterthe qualitative evaluation we conducted a semi-structured interviewasking open-ended questions about the workflow system usabilityand interaction design for each interface In this interview we askedquestions such as (1) Describe your thought process while you in-teracted with QUESTO (2) Explain your experience in construct-ing an objective function interactively vs through writing code(3) How do you think we can improve the current workflow and de-sign of QUESTO We also captured video and audio of participantsscreen while they interacted with QUESTO
ccopy 2020 The Author(s)Computer Graphics Forum ccopy 2020 The Eurographics Association and John Wiley amp Sons Ltd
Das et al QUESTO Interactive Construction of Objective Functions for Classification Tasks
Figure 6 The study results comparing QUESTO with coding interfaces and Auto-ML techniques for classification tasks
65 Quantitative Analysis
For the following we used the Friedman Test for Repeated-Measures as it is a good indicator of statistical significance formulti-class classifiers with multiple datasets which may not fol-low a normal distribution as suggested by [Dem06] Furthermorewe utilised Post-hoc Wilcoxon signed-rank tests with Bonferronicorrection (new p value = 003) to test for statistical significance
Ease of use To answer RQ1 we used likert scale rating scores(5-point scale) from participants (average ease of use rating 464higher is better see Figure 6-D) The ease of use of QUESTO wassignificant across all tasks (χ2(1) = 4803 p lt 003) thus answer-ing RQ1 that QUESTO is easier to use than CMD
Task completion times Participants were significantly faster tospecify constraints in QUESTO than CMD (Figure 6-C) Every par-ticipant completed all tasks except for three who failed to completetask 3 in the allotted time using CMD In these cases we recordedthe maximum alotted time for that task Quantitatively we foundstatistically significant difference in task completion time for alltasks Task1 (χ2(1) = 160 p lt 003) Task2 (χ2(1) = 160 p lt003) and Task3 (χ2(1) = 40 p lt 003) This answered RQ1 thatQUESTO is faster to specify constraints than CMD
Model Accuracies To answer RQ2 we compared the models gen-erated using QUESTO CMD and Auto-ML with respect to theiraccuracies We found QUESTO generated similar quality modelsin relation to accuracies as produced by CMD (refer Figure 6-A)However accuracies generated by models from Auto-ML standalone were higher in comparison to QUESTO We observed sta-tistically significant difference in the model accuracy for task 1(χ2(1) = 1225 p lt 003) and task 3 (χ2(1) = 40 p lt 003)
Constraint satisfaction We found that QUESTO outperformedAuto-ML in meeting user-specified constraints for all tasks Task1(χ2(1) = 625 p lt 003) Task2 (χ2(1) = 225 p lt 003) andTask3 (χ2(1) = 90 p lt 003) This answered RQ3 We analysedthis based on data collected from the employment dataset [Off](users were given the example data items to specify as constraints)and on the movie dataset [Mov] (users freely specified constraints)
66 Qualitative Analysis
User Preferences We measured user preferences using 5-pointlikert scale rating QUESTOrsquos user preference ratings (out of 5)
were higher than CMD workflow in various aspects such as Easyof use (Q 453 CMD 322) Fun to use (Q 469 CMD 288) Learnable (Q 434 CMD 297) and Intuitive (Q 438 CMD287) (see Figure 6-D) In addition through the NASA-TLXsurvey we found that average participantsrsquo cognitive workload wassignificantly lower in QUESTO than CMD interfaces (Q 430CMD 887 out of 10 lower is better) Based on these results itis likely that participants preferred QUESTO compared to usingthe CMD interface for objective function creation However manyparticipants found CMD comparably flexible to QUESTO tospecify preferences (Q 378 CMD 352) and debug models
Easy workflow Every participant found QUESTOrsquos interface andthe workflow easy to learn and use Users liked the table view withthe ability to filter and search for specific data items as examplesfor constraint specification P03 said ldquoI like how I can mouseoveron the cells of the confusion matrix to see incorrectly predicteddata itemsrdquo P08 added ldquoI frequently brush over the feature panelto filter data items by a set of attributes I care aboutrdquo Howeverusers recommended that more advanced sorting feature in the tablewould have helped them find appropriate examples quickly
Level of Detail Some participants had elementary knowledge ofpython and ML while a few others had in-depth ML expertise P09reflected ldquoBest part of this workflow is how easy the tool makesto change my constraints in terms of weighting or ordering themwhich lets me look into a new set of classifiersrdquo While advancedML users appreciated the idea of an interactive interface to definean objective function reflected that they would prefer to look at thenumerical weights on each constraint so that they can better trusthow the modeling engine is selecting classifiers P13 said Thoughthe objective function view is very useful I am not sure if I un-derstand whatrsquos happening on the background without knowing thenumerical weights on these constraints
Meaningful constraints Participants found the constraints inQUESTO appropriate and useful for classifier construction P10added ldquoI think the constraints make a lot of sense to me When Itest models I frequently look at specific data items to verify if theclassifier modeled the data correctlyrdquo However a few participantscommented that it would help if QUESTO could recommend itemsto consider next For example P03 suggested ldquoI think you can useprediction probabilities to reflect on how confident the model is oneach prediction That may help me specify better examplesrdquo
Intuitive model selection Users found the model interpreter view
ccopy 2020 The Author(s)Computer Graphics Forum ccopy 2020 The Eurographics Association and John Wiley amp Sons Ltd
Das et al QUESTO Interactive Construction of Objective Functions for Classification Tasks
useful to compare models based on their performance on the spec-ified constraints P17 noted ldquoFrom the star plot view I can inspectthe size of the polygons to select models that performed better onrelevant constraints I would prefer to mouseover (instead of click)to browse the model output results on the table and the confusionmatricesrdquo However participants wanted to see a bookmark featureto save models they like Furthermore one participant desired tosee how each constraint contributed to a change in model output tounderstand what interaction improved performance
Task complexity The three tasks in the user study had differentlevels of complexity While task 1 and task 2 involved satisfyingonly subjective user preferences task 3 included finding modelsthat are accurate yet address constraints such as Similarity Can-didate etc Participants found task 3 more challenging as findingthe right model that is accurate and addresses their personal goalswas difficult P15 noted ldquoIt was hard to improve the classifiers per-formance when I had more than 4 constraints to specify Howeverwith QUESTO I could rapidly test different weightingsrankings tothese constraints to find an optimal classifierrdquo
Conflicting constraints We observed that participants sometimesspecified conflicting constraints For example they specified a setof data item as a Candidate constraint but in a later iteration theyspecified a subset of these data items as a Ignore constraint AsQUESTO currently does not support alerting users about conflictsin future we plan to mitigate them in objective specification
Modeling process From the study we found that QUESTOrsquosworkflow does not help users understand the underlying modelingprocess Often participants wondered what interaction in the previ-ous iteration led to the improvement or degradation in the accuracyor the objective function score Future work could make the mod-eling process more transparent and allow users to reason about theimpact of their objective specification on classifier selection
7 Discussion
User-System Feedback loop Interactive objective functions mayguide an Auto-ML model solver to select models that weigh datainstances preferentially to better support user goals For examplean objective function with the Critical constraint will guide theAuto-ML solver to prefer classifiers that correctly predict specificitems In response users may inspect a model in relation to howwell it supports the specified constraints Thus interactive objec-tive functions employ a two-way feedback loop between the userand the system for (1) communicating preferences to find suitablemodels and (2) providing a medium for understanding classifierperformance Participants confirmed that (per iteration) they vali-dated models in relation to how well they support the constraints
Tradeoff Analysis Practically in a multi-objective optimizationproblem satisfying every objective might not be feasible [SAS02]due to a plethora of reasons including conflicting constraints math-ematical infeasibility noiseoutliers in the data high dimensional-ity etc [KLTH10] Formalizing user goals as a set of constraintsin an objective function facilitates searching for a set of pareto-optimal solutions which may only satisfy a subset of the specifieduser goals Furthermore visualizing these pareto-optimal modelshelp users inspect them and understand tradeoffs
ML users often seek models that support other customizedsubjective goalsobjectives that are personal and problem-specific([KLTH10]) This study validated that while QUESTO producedslightly less accurate models than Auto-ML model solvers theymet subjective user-specified constraints We envision that userswill need to find a balance between these two extremes
71 Limitations
Scope and assumptions of the user study In the study we timedeach task to ensure the study can be completed within a reasonabletime However in more realistic settings optimizing for (or lim-iting) time may not be meaningful Further we used pre-definedhyperameters within which Hyperopt sampled values to constructclassifiers The study results may vary if the set of hyperparametersused are different Also our study only included participants withbasic expertise of python and ML
Model overfitting Good ML practices entail that trained modelshave no knowledge of test data In QUESTO we follow the sameprocess The test data view in the data table allows users to inspectclassifiers by reviewing the predictions made at the data instancelevel Furthermore by specifying the objectives Train-objectivesand (and weighting them) users can control for model overfit-ting Nevertheless we are aware that if users do not specify theymay produce overfitted models However this may be the case forcommand-line classifier construction as well if addition of regular-izers or cross-validation approaces are not used
Scalability The current UI design is based on datasets of mod-est size Thus there are aspects of the UI that would become lessusable if datasets grew larger For example while the table viewsupports sorting and filtering the fundamental design of showingitems in a table may make finding individual relevant data itemschallenging However for larger datsets we can augment QUESTOwith visualisations that can aggregate data and show example dataitems on demand (eg grouped heatmap view etc)
8 Conclusion
In this paper we present a design space of constraints categorizingvarious user goals for a classification task Grounded in this designspace we developed a prototype system QUESTO that supports in-teractive construct of objective functions to specify their subjectivepreferences to a classifier Finally we validate the effectiveness ofQUESTO by a within-subject user study that proved that QUESTOis easier and faster to use than conventional command line alterna-tives We also demonstrate that while QUESTO produces slightlyless accurate classifiers than Auto-ML it produces models that bet-ter satisfy user-specified constraints This presents a step towardsunderstanding how to integrate people into Auto-ML processes
9 Acknowledgements
Support for the research is partially provided by DARPA FA8750-17-2-0107 DARPA FA8750-17-2-010 NSF 1841349 and NSFIIS-1452977 The views and conclusions contained in this doc-ument are those of the authors and should not be interpreted asrepresenting the official policies either expressed or implied ofthe US Government
ccopy 2020 The Author(s)Computer Graphics Forum ccopy 2020 The Eurographics Association and John Wiley amp Sons Ltd
Das et al QUESTO Interactive Construction of Objective Functions for Classification Tasks
References[ACKK14] AMERSHI S CAKMAK M KNOX W B and KULESZA
T ldquoPower to the people The role of humans in interactive machine learn-ingrdquo AI Magazine 354 (2014) 105ndash120 2
[AF18] AHAMED F and FARID F ldquoApplying Internet of Things andMachine-Learning for Personalized Healthcare Issues and Challengesrdquo2018 International Conference on Machine Learning and Data Engi-neering (iCMLDE) 2018 19ndash21 DOI 101109iCMLDE201800014 3
[AFKT11] AMERSHI S FOGARTY J KAPOOR A and TAN D SldquoEffective End-User Interaction with Machine Learningrdquo AAAI 2011 3
[BGV16] BOUALI F GUETTALA A and VENTURINI G ldquoVizAssistAn Interactive User Assistant for Visual Data Miningrdquo Vis Comput3211 (Nov 2016) 1447ndash1463 ISSN 0178-2789 DOI 10 1007 s00371- 015- 1132- 9 URL httpdxdoiorg101007s00371-015-1132-9 2
[BLBC12] BROWN E T LIU J BRODLEY C E and CHANGR ldquoDis-function Learning distance functions interactivelyrdquo 2012IEEE Conference on Visual Analytics Science and Technology (VAST)2012 83ndash92 DOI 101109VAST20126400486 2
[BM17] BIRAN O and MCKEOWN K ldquoHuman-centric Justification ofMachine Learning Predictionsrdquo Proceedings of the 26th InternationalJoint Conference on Artificial Intelligence IJCAIrsquo17 Melbourne Aus-tralia AAAI Press 2017 1461ndash1467 ISBN 978-0-9992411-0-3 3
[BNHL14] BRADEL L NORTH C HOUSE L and LEMAN S ldquoMulti-model semantic interaction for text analyticsrdquo 2014 IEEE Conference onVisual Analytics Science and Technology (VAST) 2014 163ndash172 DOI101109VAST20147042492 2
[BYC13] BERGSTRA J YAMINS D and COX D D ldquoHyperopt Apython library for optimizing the hyperparameters of machine learn-ing algorithmsrdquo Proceedings of the 12th Python in Science Conference2013 13ndash20 3
[BZSA17] BERNARD J ZEPPELZAUER M SEDLMAIR M andAIGNER W ldquoA Unified Process for Visual-Interactive Labelingrdquo Euro-Vis Workshop on Visual Analytics (EuroVA) Ed by S MICHAEL and TCHRISTIAN The Eurographics Association 2017 ISBN 978-3-03868-042-0 DOI 102312eurova20171123 3
[CAK17] CHANG J C AMERSHI S and KAMAR E ldquoRevolt Collab-orative Crowdsourcing for Labeling Machine Learning Datasetsrdquo Pro-ceedings of the 2017 CHI Conference on Human Factors in ComputingSystems CHI rsquo17 Denver Colorado USA ACM 2017 2334ndash2346ISBN 978-1-4503-4655-9 DOI 10 1145 3025453 3026044URL httpdoiacmorg10114530254533026044 3
[CB15] CHENG J and BERNSTEIN M S ldquoFlock Hybrid Crowd-Machine Learning Classifiersrdquo Proceedings of the 18th ACM Confer-ence on Computer Supported Cooperative Work amp38 Social Comput-ing CSCW rsquo15 Vancouver BC Canada ACM 2015 600ndash611 ISBN978-1-4503-2922-4 DOI 10114526751332675214 3 4
[CES09] CRAMER H S M EVERS V S VAN et al ldquoAwarenessTraining and Trust in Interaction with Adaptive Spam Filtersrdquo Proceed-ings of the SIGCHI Conference on Human Factors in Computing Sys-tems CHI rsquo09 Boston MA USA ACM 2009 909ndash912 ISBN 978-1-60558-246-7 DOI 10114515187011518839 3
[CFEC17] CROUSER R J FRANKLIN L ENDERT A and COOK KldquoToward theoretical techniques for measuring the use of human effort invisual analytic systemsrdquo IEEE transactions on visualization and com-puter graphics 231 (2017) 121ndash130 3
[CHH19] CASHMAN D HUMAYOUN S F HEIMERL F et al ldquoAUser-based Visual Analytics Workflow for Exploratory Model Analy-sisrdquo Computer Graphics Forum 383 (2019) 185ndash199 DOI 101111cgf13681 3
[CW18] CHEN M and WANG H ldquoHow Personal Experience and Techni-cal Knowledge Affect Using Conversational Agentsrdquo Proceedings of the23rd International Conference on Intelligent User Interfaces Compan-ion IUI rsquo18 Companion Tokyo Japan ACM 2018 531ndash532 ISBN978-1-4503-5571-1 DOI 10114531803083180362 3
[DCCE18] DAS S CASHMAN D CHANG R and ENDERT AldquoBEAMES Interactive Multi-Model Steering Selection and Inspec-tion for Regression Tasksrdquo Symposium on Visualization in Data Sci-ence(VDS) Berlin Germany 2018 3
[Dem06] DEMŠAR JANEZ ldquoStatistical Comparisons of Classifiers overMultiple Data Setsrdquo J Mach Learn Res 7 (Dec 2006) 1ndash30 ISSN1532-4435 9
[EBN13] ENDERT ALEX BRADEL LAUREN and NORTH CHRIS ldquoBe-yond Control Panels Direct Manipulation for Visual Analyticsrdquo IEEEComputer Graphics and Applications 334 (2013) 6ndash13 ISSN 0272-1716 DOI 101109MCG201353 2
[EFN12] ENDERT A FIAUX P and NORTH C ldquoSemantic Interactionfor Visual Text Analyticsrdquo Proceedings of the SIGCHI Conference onHuman Factors in Computing Systems CHI rsquo12 Austin Texas USAACM 2012 473ndash482 ISBN 978-1-4503-1015-4 DOI 10 1145 22076762207741 2
[EHM11] ENDERT A HAN CHAO MAITI D et al ldquoObservation-level Interaction with Statistical Models for Visual Analyticsrdquo IEEEVAST 2011 121ndash130 2
[EIZ13] ESCUDERO J IFEACHOR E ZAJICEK J P et al ldquoMachineLearning-Based Method for Personalized and Cost-Effective Detectionof Alzheimerrsquos Diseaserdquo IEEE Transactions on Biomedical Engineer-ing 601 (2013) 164ndash168 ISSN 0018-9294 DOI 101109TBME20122212278 3
[EW16] EIBE F MARK A H and W IAN H The WEKA WorkbenchOnline Appendix for Data Mining Practical Machine Learning Toolsand Techniques 2016 3
[FKE15] FEURER M KLEIN A EGGENSPERGER K et al ldquoEfficientand robust automated machine learningrdquo Advances in Neural Informa-tion Processing Systems 2015 2962ndash2970 3
[GFT16] GILLIES M FIEBRINK R TANAKA A et al ldquoHuman-Centred Machine Learningrdquo Proceedings of the 2016 CHI ConferenceExtended Abstracts on Human Factors in Computing Systems CHI EArsquo16 San Jose California USA ACM 2016 3558ndash3565 ISBN 978-1-4503-4082-3 DOI 10114528515812856492 3
[GLG13] G SAMUEL L ALEXANDER G NILS et al ldquoLineUp Vi-sual Analysis of Multi-Attribute Rankingsrdquo IEEE Transactions on Vi-sualization and Computer Graphics (InfoVis rsquo13) 1912 (2013) 2277ndash2286 DOI 101109TVCG2013173 2
[H99] H MARK A Correlation-based Feature Selection for MachineLearning Tech rep 1999 4
[Hol16] HOLZINGER A ldquoInteractive machine learning for health infor-matics when do we need the human-in-the-looprdquo Brain Informatics32 (2016) 119ndash131 ISSN 2198-4026 DOI 101007s40708-016-0042-6 3
[HS88] H SANDRA G and S LOWELL E ldquoDevelopment of NASA-TLX (Task Load Index) Results of Empirical and Theoretical Re-searchrdquo Human Mental Workload Ed by H PETER A and M NA-JMEDIN Vol 52 Advances in Psychology North-Holland 1988 139 ndash183 DOI httpsdoiorg101016S0166-4115(08)62386-9 8
[HY16] HE Z and YEN G G ldquoVisualization and Performance Metricin Many-Objective Optimizationrdquo IEEE Transactions on EvolutionaryComputation 203 (2016) 386ndash402 ISSN 1089-778X DOI 101109TEVC20152472283 3
[HY17] HE Z and YEN G G ldquoComparison of visualization approachesin many-objective optimizationrdquo 2017 IEEE Congress on EvolutionaryComputation (CEC) 2017 357ndash363 DOI 101109CEC20177969334 3
ccopy 2020 The Author(s)Computer Graphics Forum ccopy 2020 The Eurographics Association and John Wiley amp Sons Ltd
Das et al QUESTO Interactive Construction of Objective Functions for Classification Tasks
[JZF09] JEONG D H ZIEMKIEWICZ C FISHER B et al ldquoiPCA AnInteractive System for PCA-based Visual Analyticsrdquo Computer Graph-ics Forum Vol 28 3 Wiley Online Library 2009 767ndash774 2
[KBE14] KOMER B BERGSTRA J and ELIASMITH C ldquoHyperopt-sklearn automatic hyperparameter configuration for scikit-learnrdquo ICMLworkshop on AutoML 2014 2 3 5
[KBS11] KULESZA T BURNETT M STUMPF S et al ldquoWhere AreMy Intelligent Assistantrsquos Mistakes A Systematic Testing ApproachrdquoProceedings of the Third International Conference on End-user Develop-ment IS-EUDrsquo11 Torre Canne Italy Springer-Verlag 2011 171ndash186ISBN 978-3-642-21529-2 3
[KCPE16] KIM H CHOO J PARK H and ENDERT A ldquoInterAxisSteering scatterplot axes via observation-level interactionrdquo IEEE trans-actions on visualization and computer graphics 221 (2016) 131ndash140 2
[KDJH08] KRESIMIR M DENIS G JELOVIC M and H HELWIGldquoInteractive Visual Steering ndash Rapid Visual Prototyping of a CommonRail Injection Systemrdquo IEEE Transactions on Visualization and Com-puter Graphics 146 (Nov 2008) URL httpswwwcgtuwienacatresearchpublications2008Matkovic-2008-Steer 2
[KEV18] KWON B C EYSENBACH B VERMA J et al ldquoCluster-vision Visual Supervision of Unsupervised Clusteringrdquo IEEE Transac-tions on Visualization and Computer Graphics 241 (2018) 142ndash151ISSN 1077-2626 DOI 101109TVCG20172745085 3
[KKW17] KWON B C KIM H WALL E et al ldquoAxiSketcher In-teractive Nonlinear Axis Mapping of Visualizations through User Draw-ingsrdquo IEEE Trans Vis Comput Graph 231 (2017) 221ndash230 2
[KLTH10] KAPOOR A LEE B TAN D and HORVITZ E ldquoInteractiveOptimization for Steering Machine Classificationrdquo Proceedings of theSIGCHI Conference on Human Factors in Computing Systems CHI rsquo10Atlanta Georgia USA ACM 2010 1343ndash1352 ISBN 978-1-60558-929-9 DOI 10114517533261753529 2 3 10
[KPB14] KRAUSE J PERER A and BERTINI E ldquoINFUSE Interac-tive Feature Selection for Predictive Modeling of High DimensionalDatardquo IEEE Transactions on Visualization and Computer Graphics2012 (2014) 1614ndash1623 ISSN 1077-2626 DOI 101109TVCG20142346482 4
[KPHH11] KANDEL S PAEPCKE A HELLERSTEIN J and HEERJ ldquoWrangler Interactive Visual Specification of Data TransformationScriptsrdquo ACM Human Factors in Computing Systems (CHI) 2011 2
[KTD17] KIM S TASSE D and DEY A K ldquoMaking Machine-Learning Applications for Time-Series Sensor Data Graphical and In-teractiverdquo ACM Trans Interact Intell Syst 72 (July 2017) 81ndash830ISSN 2160-6455 DOI 1011452983924 3
[KTH16] KOTTHOFF L THORNTON C HOOS H H et al ldquoAuto-WEKA 20 Automatic model selection and hyperparameter optimiza-tion in WEKArdquo Journal of Machine Learning Research 17 (2016) 1ndash5 3
[LHM13] LEMAN S C HOUSE L MAITI D et al ldquoVisual to para-metric interaction (v2pi)rdquo PloS one 83 (2013) e50474 2
[LSL17] LIU M SHI J LI Z et al ldquoTowards Better Analysis of DeepConvolutional Neural Networksrdquo IEEE Transactions on Visualizationand Computer Graphics 231 (2017) 91ndash100 ISSN 2160-9306 DOI101109TVCG20162598831 3
[LWLZ17] LIU S WANG X LIU M and ZHU J ldquoTowards betteranalysis of machine learning models A visual analytics perspectiverdquoVisual Informatics 11 (2017) 48 ndash56 ISSN 2468-502X DOI httpsdoiorg101016jvisinf201701006 4
[LYL14] LI M YANG S and LIU X ldquoDiversity Comparison of ParetoFront Approximations in Many-Objective Optimizationrdquo IEEE Transac-tions on Cybernetics 4412 (2014) 2568ndash2584 ISSN 2168-2267 DOI101109TCYB20142310651 3
[MLa] ML BIG Big ML httpsbigmlcom Accessed March20 2019 3
[MLb] ML SCIKIT LEARN Scikit Learn Model Metrics API Refer-ence httpsscikit- learnorgstablemodulesclasseshtmlmodule-sklearnmetrics Accessed March20 2019 5 6
[MLY17] MIQING L LIANGLI Z and Y XIN ldquoHow to Read Many-Objective Solution Sets in Parallel Coordinatesrdquo CoRR abs170500368(2017) 3
[Mov] Movies Dataset howpublished = https www kaggle comcarolzhangdcimdb-5000-movie-datasetmovie_metadatacsv note = Accessed 2018-12-11 8 9
[NKHK17] NUSHI B KAMAR E HORVITZ E and KOSSMANN DldquoOn Human Intellect and Machine Failures Troubleshooting IntegrativeMachine Learning Systemsrdquo Proceedings of the Thirty-First AAAI Con-ference on Artificial Intelligence AAAIrsquo17 San Francisco CaliforniaUSA AAAI Press 2017 1017ndash1025 3
[Off] OFFICE THE SAN FRANCISCO CONTROLLERrsquoS Employee Com-pensation Data https data sfgov org City -Management - and - Ethics Employee - Compensation 88g8-5mnd Accessed March 15 2019 7ndash9
[PBD10] PATEL K BANCROFT N DRUCKER S M et al ldquoGestaltIntegrated Support for Implementation and Analysis in Machine Learn-ingrdquo Proceedings of the 23Nd Annual ACM Symposium on User In-terface Software and Technology UIST rsquo10 New York New YorkUSA ACM 2010 37ndash46 ISBN 978-1-4503-0271-5 DOI 10114518660291866038 2
[PPJ07] PAPARIZOS S PATEL J M and JAGADISH HV ldquoSIGOPTUsing schema to optimize XML query processingrdquo Data Engineer-ing 2007 ICDE 2007 IEEE 23rd International Conference on IEEE2007 1456ndash1460 3
[PSTW16] PAJER S STREIT M TORSNEY-WEIR T et alldquoWeightLifter Visual Weight Space Exploration for Multi-Criteria De-cision Makingrdquo IEEE Transactions on Visualization and ComputerGraphics (2016) 2
[RAL17] REN D AMERSHI S LEE B et al ldquoSquares Support-ing Interactive Performance Analysis for Multiclass Classifiersrdquo IEEETransactions on Visualization and Computer Graphics 231 (2017) 61ndash70 ISSN 1077-2626 DOI 101109TVCG20162598828 3
[RHY14] REN D HOumlLLERER T and YUAN X ldquoiVisDesigner Expres-sive Interactive Design of Information Visualizationsrdquo IEEE Transac-tions on Visualization and Computer Graphics 2012 (2014) 2092ndash2101ISSN 1077-2626 DOI 101109TVCG20142346291 2
[RLD18] RUDOVIC O LEE J DAI M et al ldquoPersonalized machinelearning for robot perception of affect and engagement in autism ther-apyrdquo Science Robotics 319 (2018) DOI 101126sciroboticsaao6760 3
[RSG16] RIBEIRO M T SINGH S and GUESTRIN C ldquoWhy ShouldI Trust You Explaining the Predictions of Any Classifierrdquo Proceed-ings of the 22Nd ACM SIGKDD International Conference on KnowledgeDiscovery and Data Mining KDD rsquo16 San Francisco California USAACM 2016 1135ndash1144 ISBN 978-1-4503-4232-2 DOI 10114529396722939778 2ndash4
[SAS02] SARAVANAN R ASOKAN P and SACHIDANANDAM M ldquoAmulti-objective genetic algorithm (GA) approach for optimization of sur-face grinding operationsrdquo International Journal of Machine Tools andManufacture 4212 (2002) 1327 ndash1334 ISSN 0890-6955 DOI httpsdoiorg101016S0890-6955(02)00074-3 10
[SC11] SAHU R and CHATURVEDI A K ldquoMany-Objective Comparisonof Twelve Grid Scheduling Heuristicsrdquo 2011 3
[SHB14] SEDLMAIR M HEINZL C BRUCKNER S et al ldquoVisualParameter Space Analysis A Conceptual Frameworkrdquo IEEE Transac-tions on Visualization and Computer Graphics 2012 (2014) 2161ndash2170ISSN 1077-2626 DOI 101109TVCG20142346321 2
ccopy 2020 The Author(s)Computer Graphics Forum ccopy 2020 The Eurographics Association and John Wiley amp Sons Ltd
Das et al QUESTO Interactive Construction of Objective Functions for Classification Tasks
[SKBE17] SAKET B KIM H BROWN E T and ENDERT A ldquoVi-sualization by Demonstration An Interaction Paradigm for Visual DataExplorationrdquo IEEE Transactions on Visualization and Computer Graph-ics 231 (2017) 331ndash340 ISSN 1077-2626 DOI 101109TVCG20162598839 2
[SLT17] SUN Y LANK E and TERRY M ldquoLabel-and-Learn Visu-alizing the Likelihood of Machine Learning Classifierrsquos Success Dur-ing Data Labelingrdquo Proceedings of the 22Nd International Confer-ence on Intelligent User Interfaces IUI rsquo17 Limassol Cyprus ACM2017 523ndash534 ISBN 978-1-4503-4348-0 DOI 10114530251713025208 3
[SRL07] STUMPF S RAJARAM V LI L et al ldquoToward HarnessingUser Feedback for Machine Learningrdquo Proceedings of the 12th Inter-national Conference on Intelligent User Interfaces IUI rsquo07 HonoluluHawaii USA ACM 2007 82ndash91 ISBN 1-59593-481-2 DOI 10 114512162951216316 2
[SRL09] STUMPF S RAJARAM V LI L et al ldquoInteracting Mean-ingfully with Machine Learning Systems Three Experimentsrdquo Int JHum-Comput Stud 678 (Aug 2009) 639ndash662 ISSN 1071-5819 DOI101016jijhcs200903004 3
[SSZ17] S DOMINIK S MICHAEL Z LEISHI et al ldquoWhat you see iswhat you can change Human-centered machine learning by interactivevisualizationrdquo Neurocomputing 268 (2017) 164ndash175 3
[TCWM18] T LI CONVERTINO G WANG W and MOST H ldquoHyper-Tuner Visual Analytics for Hyperparameter Tuning by ProfessionalsrdquoMachine Learning from User Interaction for Visualization and Analyt-ics IEEE VIS 2018 (2018) 3
[TDCF07] TULLIO J DEY A K CHALECKI J and FOGARTY JldquoHow It Works A Field Study of Non-technical Users Interacting withan Intelligent Systemrdquo Proceedings of the SIGCHI Conference on Hu-man Factors in Computing Systems CHI rsquo07 San Jose CaliforniaUSA ACM 2007 31ndash40 ISBN 978-1-59593-593-9 DOI 10114512406241240630 3
[THHLB13] THORNTON C HUTTER F HOOS H H and LEYTON-BROWN K ldquoAuto-WEKA Combined selection and hyperparameter op-timization of classification algorithmsrdquo Proceedings of the 19th ACMSIGKDD international conference on Knowledge discovery and datamining ACM 2013 847ndash855 3
[TLB11] TAMUZ O LIU C BELONGIE S et al ldquoAdaptively Learn-ing the Crowd Kernelrdquo Proceedings of the 28th International Con-ference on International Conference on Machine Learning ICMLrsquo11Bellevue Washington USA Omnipress 2011 673ndash680 ISBN 978-1-4503-0619-5 2ndash4
[TLKT09] TALBOT J LEE B KAPOOR A and TAN D S ldquoEnsem-bleMatrix interactive visualization to support machine learning withmultiple classifiersrdquo CHI Ed by JR DAN R OLSEN ARTHURRICHARD B HINCKLEY KEN et al ACM 2009 1283ndash1292 ISBN978-1-60558-246-7 2
[VDEW11] VAN DEN ELZEN S and van WIJK J J ldquoBaobabview In-teractive construction and analysis of decision treesrdquo Visual Analyt-ics Science and Technology (VAST) 2011 IEEE Conference on IEEE2011 151ndash160 2 4
[WEF13] WALKER D J EVERSON R and FIELDSEND J E ldquoVisu-alizing Mutually Nondominating Solution Sets in Many-Objective Op-timizationrdquo Trans Evol Comp 172 (Apr 2013) 165ndash184 ISSN 1089-778X DOI 101109TEVC20122225064 3
[WFE12] WALKER D FIELDSEND J and EVERSON R ldquoVisualisingMany-objective Populationsrdquo Proceedings of the 14th Annual Confer-ence Companion on Genetic and Evolutionary Computation GECCOrsquo12 Philadelphia Pennsylvania USA ACM 2012 451ndash458 ISBN 978-1-4503-1178-6 DOI 10114523307842330853 3
[WLDW01] WOLFMAN S A LAU T DOMINGOS P and WELDD S ldquoMixed Initiative Interfaces for Learning Tasks SMARTeditTalks Backrdquo Proceedings of the 6th International Conference on Intel-ligent User Interfaces IUI rsquo01 Santa Fe New Mexico USA ACM2001 167ndash174 ISBN 1-58113-325-1 DOI 10 1145 359784 360332 3
[WN17] WENSKOVITCH J and NORTH C ldquoObservation-Level Inter-action with Clustering and Dimension Reduction Algorithmsrdquo Pro-ceedings of the 2Nd Workshop on Human-In-the-Loop Data AnalyticsHILDArsquo17 Chicago IL USA ACM 2017 141ndash146 ISBN 978-1-4503-5029-7 DOI 10114530772573077259 2
[YL09] YEH I and LIEN C ldquoThe comparisons of data mining tech-niques for the predictive accuracy of probability of default of credit cardclientsrdquo Expert Systems with Applications 362 Part 1 (2009) 2473 ndash2480 ISSN 0957-4174 DOI httpsdoiorg101016jeswa200712020 8
[YSCR18] YANG Q SUH J CHEN N and RAMOS G ldquoGroundingInteractive Machine Learning Tool Design in How Non-Experts ActuallyBuild Modelsrdquo ACM 2018 2 3
[ZSZR18] Z XIAOJIN SINGLA A ZILLES S and RAFFERTY A NldquoAn Overview of Machine Teachingrdquo CoRR abs180105927 (2018) 23
ccopy 2020 The Author(s)Computer Graphics Forum ccopy 2020 The Eurographics Association and John Wiley amp Sons Ltd

Das et al QUESTO Interactive Construction of Objective Functions for Classification Tasks
useful to compare models based on their performance on the spec-ified constraints P17 noted ldquoFrom the star plot view I can inspectthe size of the polygons to select models that performed better onrelevant constraints I would prefer to mouseover (instead of click)to browse the model output results on the table and the confusionmatricesrdquo However participants wanted to see a bookmark featureto save models they like Furthermore one participant desired tosee how each constraint contributed to a change in model output tounderstand what interaction improved performance
Task complexity The three tasks in the user study had differentlevels of complexity While task 1 and task 2 involved satisfyingonly subjective user preferences task 3 included finding modelsthat are accurate yet address constraints such as Similarity Can-didate etc Participants found task 3 more challenging as findingthe right model that is accurate and addresses their personal goalswas difficult P15 noted ldquoIt was hard to improve the classifiers per-formance when I had more than 4 constraints to specify Howeverwith QUESTO I could rapidly test different weightingsrankings tothese constraints to find an optimal classifierrdquo
Conflicting constraints We observed that participants sometimesspecified conflicting constraints For example they specified a setof data item as a Candidate constraint but in a later iteration theyspecified a subset of these data items as a Ignore constraint AsQUESTO currently does not support alerting users about conflictsin future we plan to mitigate them in objective specification
Modeling process From the study we found that QUESTOrsquosworkflow does not help users understand the underlying modelingprocess Often participants wondered what interaction in the previ-ous iteration led to the improvement or degradation in the accuracyor the objective function score Future work could make the mod-eling process more transparent and allow users to reason about theimpact of their objective specification on classifier selection
7 Discussion
User-System Feedback loop Interactive objective functions mayguide an Auto-ML model solver to select models that weigh datainstances preferentially to better support user goals For examplean objective function with the Critical constraint will guide theAuto-ML solver to prefer classifiers that correctly predict specificitems In response users may inspect a model in relation to howwell it supports the specified constraints Thus interactive objec-tive functions employ a two-way feedback loop between the userand the system for (1) communicating preferences to find suitablemodels and (2) providing a medium for understanding classifierperformance Participants confirmed that (per iteration) they vali-dated models in relation to how well they support the constraints
Tradeoff Analysis Practically in a multi-objective optimizationproblem satisfying every objective might not be feasible [SAS02]due to a plethora of reasons including conflicting constraints math-ematical infeasibility noiseoutliers in the data high dimensional-ity etc [KLTH10] Formalizing user goals as a set of constraintsin an objective function facilitates searching for a set of pareto-optimal solutions which may only satisfy a subset of the specifieduser goals Furthermore visualizing these pareto-optimal modelshelp users inspect them and understand tradeoffs
ML users often seek models that support other customizedsubjective goalsobjectives that are personal and problem-specific([KLTH10]) This study validated that while QUESTO producedslightly less accurate models than Auto-ML model solvers theymet subjective user-specified constraints We envision that userswill need to find a balance between these two extremes
71 Limitations
Scope and assumptions of the user study In the study we timedeach task to ensure the study can be completed within a reasonabletime However in more realistic settings optimizing for (or lim-iting) time may not be meaningful Further we used pre-definedhyperameters within which Hyperopt sampled values to constructclassifiers The study results may vary if the set of hyperparametersused are different Also our study only included participants withbasic expertise of python and ML
Model overfitting Good ML practices entail that trained modelshave no knowledge of test data In QUESTO we follow the sameprocess The test data view in the data table allows users to inspectclassifiers by reviewing the predictions made at the data instancelevel Furthermore by specifying the objectives Train-objectivesand (and weighting them) users can control for model overfit-ting Nevertheless we are aware that if users do not specify theymay produce overfitted models However this may be the case forcommand-line classifier construction as well if addition of regular-izers or cross-validation approaces are not used
Scalability The current UI design is based on datasets of mod-est size Thus there are aspects of the UI that would become lessusable if datasets grew larger For example while the table viewsupports sorting and filtering the fundamental design of showingitems in a table may make finding individual relevant data itemschallenging However for larger datsets we can augment QUESTOwith visualisations that can aggregate data and show example dataitems on demand (eg grouped heatmap view etc)
8 Conclusion
In this paper we present a design space of constraints categorizingvarious user goals for a classification task Grounded in this designspace we developed a prototype system QUESTO that supports in-teractive construct of objective functions to specify their subjectivepreferences to a classifier Finally we validate the effectiveness ofQUESTO by a within-subject user study that proved that QUESTOis easier and faster to use than conventional command line alterna-tives We also demonstrate that while QUESTO produces slightlyless accurate classifiers than Auto-ML it produces models that bet-ter satisfy user-specified constraints This presents a step towardsunderstanding how to integrate people into Auto-ML processes
9 Acknowledgements
Support for the research is partially provided by DARPA FA8750-17-2-0107 DARPA FA8750-17-2-010 NSF 1841349 and NSFIIS-1452977 The views and conclusions contained in this doc-ument are those of the authors and should not be interpreted asrepresenting the official policies either expressed or implied ofthe US Government
ccopy 2020 The Author(s)Computer Graphics Forum ccopy 2020 The Eurographics Association and John Wiley amp Sons Ltd
Das et al QUESTO Interactive Construction of Objective Functions for Classification Tasks
References[ACKK14] AMERSHI S CAKMAK M KNOX W B and KULESZA
T ldquoPower to the people The role of humans in interactive machine learn-ingrdquo AI Magazine 354 (2014) 105ndash120 2
[AF18] AHAMED F and FARID F ldquoApplying Internet of Things andMachine-Learning for Personalized Healthcare Issues and Challengesrdquo2018 International Conference on Machine Learning and Data Engi-neering (iCMLDE) 2018 19ndash21 DOI 101109iCMLDE201800014 3
[AFKT11] AMERSHI S FOGARTY J KAPOOR A and TAN D SldquoEffective End-User Interaction with Machine Learningrdquo AAAI 2011 3
[BGV16] BOUALI F GUETTALA A and VENTURINI G ldquoVizAssistAn Interactive User Assistant for Visual Data Miningrdquo Vis Comput3211 (Nov 2016) 1447ndash1463 ISSN 0178-2789 DOI 10 1007 s00371- 015- 1132- 9 URL httpdxdoiorg101007s00371-015-1132-9 2
[BLBC12] BROWN E T LIU J BRODLEY C E and CHANGR ldquoDis-function Learning distance functions interactivelyrdquo 2012IEEE Conference on Visual Analytics Science and Technology (VAST)2012 83ndash92 DOI 101109VAST20126400486 2
[BM17] BIRAN O and MCKEOWN K ldquoHuman-centric Justification ofMachine Learning Predictionsrdquo Proceedings of the 26th InternationalJoint Conference on Artificial Intelligence IJCAIrsquo17 Melbourne Aus-tralia AAAI Press 2017 1461ndash1467 ISBN 978-0-9992411-0-3 3
[BNHL14] BRADEL L NORTH C HOUSE L and LEMAN S ldquoMulti-model semantic interaction for text analyticsrdquo 2014 IEEE Conference onVisual Analytics Science and Technology (VAST) 2014 163ndash172 DOI101109VAST20147042492 2
[BYC13] BERGSTRA J YAMINS D and COX D D ldquoHyperopt Apython library for optimizing the hyperparameters of machine learn-ing algorithmsrdquo Proceedings of the 12th Python in Science Conference2013 13ndash20 3
[BZSA17] BERNARD J ZEPPELZAUER M SEDLMAIR M andAIGNER W ldquoA Unified Process for Visual-Interactive Labelingrdquo Euro-Vis Workshop on Visual Analytics (EuroVA) Ed by S MICHAEL and TCHRISTIAN The Eurographics Association 2017 ISBN 978-3-03868-042-0 DOI 102312eurova20171123 3
[CAK17] CHANG J C AMERSHI S and KAMAR E ldquoRevolt Collab-orative Crowdsourcing for Labeling Machine Learning Datasetsrdquo Pro-ceedings of the 2017 CHI Conference on Human Factors in ComputingSystems CHI rsquo17 Denver Colorado USA ACM 2017 2334ndash2346ISBN 978-1-4503-4655-9 DOI 10 1145 3025453 3026044URL httpdoiacmorg10114530254533026044 3
[CB15] CHENG J and BERNSTEIN M S ldquoFlock Hybrid Crowd-Machine Learning Classifiersrdquo Proceedings of the 18th ACM Confer-ence on Computer Supported Cooperative Work amp38 Social Comput-ing CSCW rsquo15 Vancouver BC Canada ACM 2015 600ndash611 ISBN978-1-4503-2922-4 DOI 10114526751332675214 3 4
[CES09] CRAMER H S M EVERS V S VAN et al ldquoAwarenessTraining and Trust in Interaction with Adaptive Spam Filtersrdquo Proceed-ings of the SIGCHI Conference on Human Factors in Computing Sys-tems CHI rsquo09 Boston MA USA ACM 2009 909ndash912 ISBN 978-1-60558-246-7 DOI 10114515187011518839 3
[CFEC17] CROUSER R J FRANKLIN L ENDERT A and COOK KldquoToward theoretical techniques for measuring the use of human effort invisual analytic systemsrdquo IEEE transactions on visualization and com-puter graphics 231 (2017) 121ndash130 3
[CHH19] CASHMAN D HUMAYOUN S F HEIMERL F et al ldquoAUser-based Visual Analytics Workflow for Exploratory Model Analy-sisrdquo Computer Graphics Forum 383 (2019) 185ndash199 DOI 101111cgf13681 3
[CW18] CHEN M and WANG H ldquoHow Personal Experience and Techni-cal Knowledge Affect Using Conversational Agentsrdquo Proceedings of the23rd International Conference on Intelligent User Interfaces Compan-ion IUI rsquo18 Companion Tokyo Japan ACM 2018 531ndash532 ISBN978-1-4503-5571-1 DOI 10114531803083180362 3
[DCCE18] DAS S CASHMAN D CHANG R and ENDERT AldquoBEAMES Interactive Multi-Model Steering Selection and Inspec-tion for Regression Tasksrdquo Symposium on Visualization in Data Sci-ence(VDS) Berlin Germany 2018 3
[Dem06] DEMŠAR JANEZ ldquoStatistical Comparisons of Classifiers overMultiple Data Setsrdquo J Mach Learn Res 7 (Dec 2006) 1ndash30 ISSN1532-4435 9
[EBN13] ENDERT ALEX BRADEL LAUREN and NORTH CHRIS ldquoBe-yond Control Panels Direct Manipulation for Visual Analyticsrdquo IEEEComputer Graphics and Applications 334 (2013) 6ndash13 ISSN 0272-1716 DOI 101109MCG201353 2
[EFN12] ENDERT A FIAUX P and NORTH C ldquoSemantic Interactionfor Visual Text Analyticsrdquo Proceedings of the SIGCHI Conference onHuman Factors in Computing Systems CHI rsquo12 Austin Texas USAACM 2012 473ndash482 ISBN 978-1-4503-1015-4 DOI 10 1145 22076762207741 2
[EHM11] ENDERT A HAN CHAO MAITI D et al ldquoObservation-level Interaction with Statistical Models for Visual Analyticsrdquo IEEEVAST 2011 121ndash130 2
[EIZ13] ESCUDERO J IFEACHOR E ZAJICEK J P et al ldquoMachineLearning-Based Method for Personalized and Cost-Effective Detectionof Alzheimerrsquos Diseaserdquo IEEE Transactions on Biomedical Engineer-ing 601 (2013) 164ndash168 ISSN 0018-9294 DOI 101109TBME20122212278 3
[EW16] EIBE F MARK A H and W IAN H The WEKA WorkbenchOnline Appendix for Data Mining Practical Machine Learning Toolsand Techniques 2016 3
[FKE15] FEURER M KLEIN A EGGENSPERGER K et al ldquoEfficientand robust automated machine learningrdquo Advances in Neural Informa-tion Processing Systems 2015 2962ndash2970 3
[GFT16] GILLIES M FIEBRINK R TANAKA A et al ldquoHuman-Centred Machine Learningrdquo Proceedings of the 2016 CHI ConferenceExtended Abstracts on Human Factors in Computing Systems CHI EArsquo16 San Jose California USA ACM 2016 3558ndash3565 ISBN 978-1-4503-4082-3 DOI 10114528515812856492 3
[GLG13] G SAMUEL L ALEXANDER G NILS et al ldquoLineUp Vi-sual Analysis of Multi-Attribute Rankingsrdquo IEEE Transactions on Vi-sualization and Computer Graphics (InfoVis rsquo13) 1912 (2013) 2277ndash2286 DOI 101109TVCG2013173 2
[H99] H MARK A Correlation-based Feature Selection for MachineLearning Tech rep 1999 4
[Hol16] HOLZINGER A ldquoInteractive machine learning for health infor-matics when do we need the human-in-the-looprdquo Brain Informatics32 (2016) 119ndash131 ISSN 2198-4026 DOI 101007s40708-016-0042-6 3
[HS88] H SANDRA G and S LOWELL E ldquoDevelopment of NASA-TLX (Task Load Index) Results of Empirical and Theoretical Re-searchrdquo Human Mental Workload Ed by H PETER A and M NA-JMEDIN Vol 52 Advances in Psychology North-Holland 1988 139 ndash183 DOI httpsdoiorg101016S0166-4115(08)62386-9 8
[HY16] HE Z and YEN G G ldquoVisualization and Performance Metricin Many-Objective Optimizationrdquo IEEE Transactions on EvolutionaryComputation 203 (2016) 386ndash402 ISSN 1089-778X DOI 101109TEVC20152472283 3
[HY17] HE Z and YEN G G ldquoComparison of visualization approachesin many-objective optimizationrdquo 2017 IEEE Congress on EvolutionaryComputation (CEC) 2017 357ndash363 DOI 101109CEC20177969334 3
ccopy 2020 The Author(s)Computer Graphics Forum ccopy 2020 The Eurographics Association and John Wiley amp Sons Ltd
Das et al QUESTO Interactive Construction of Objective Functions for Classification Tasks
[JZF09] JEONG D H ZIEMKIEWICZ C FISHER B et al ldquoiPCA AnInteractive System for PCA-based Visual Analyticsrdquo Computer Graph-ics Forum Vol 28 3 Wiley Online Library 2009 767ndash774 2
[KBE14] KOMER B BERGSTRA J and ELIASMITH C ldquoHyperopt-sklearn automatic hyperparameter configuration for scikit-learnrdquo ICMLworkshop on AutoML 2014 2 3 5
[KBS11] KULESZA T BURNETT M STUMPF S et al ldquoWhere AreMy Intelligent Assistantrsquos Mistakes A Systematic Testing ApproachrdquoProceedings of the Third International Conference on End-user Develop-ment IS-EUDrsquo11 Torre Canne Italy Springer-Verlag 2011 171ndash186ISBN 978-3-642-21529-2 3
[KCPE16] KIM H CHOO J PARK H and ENDERT A ldquoInterAxisSteering scatterplot axes via observation-level interactionrdquo IEEE trans-actions on visualization and computer graphics 221 (2016) 131ndash140 2
[KDJH08] KRESIMIR M DENIS G JELOVIC M and H HELWIGldquoInteractive Visual Steering ndash Rapid Visual Prototyping of a CommonRail Injection Systemrdquo IEEE Transactions on Visualization and Com-puter Graphics 146 (Nov 2008) URL httpswwwcgtuwienacatresearchpublications2008Matkovic-2008-Steer 2
[KEV18] KWON B C EYSENBACH B VERMA J et al ldquoCluster-vision Visual Supervision of Unsupervised Clusteringrdquo IEEE Transac-tions on Visualization and Computer Graphics 241 (2018) 142ndash151ISSN 1077-2626 DOI 101109TVCG20172745085 3
[KKW17] KWON B C KIM H WALL E et al ldquoAxiSketcher In-teractive Nonlinear Axis Mapping of Visualizations through User Draw-ingsrdquo IEEE Trans Vis Comput Graph 231 (2017) 221ndash230 2
[KLTH10] KAPOOR A LEE B TAN D and HORVITZ E ldquoInteractiveOptimization for Steering Machine Classificationrdquo Proceedings of theSIGCHI Conference on Human Factors in Computing Systems CHI rsquo10Atlanta Georgia USA ACM 2010 1343ndash1352 ISBN 978-1-60558-929-9 DOI 10114517533261753529 2 3 10
[KPB14] KRAUSE J PERER A and BERTINI E ldquoINFUSE Interac-tive Feature Selection for Predictive Modeling of High DimensionalDatardquo IEEE Transactions on Visualization and Computer Graphics2012 (2014) 1614ndash1623 ISSN 1077-2626 DOI 101109TVCG20142346482 4
[KPHH11] KANDEL S PAEPCKE A HELLERSTEIN J and HEERJ ldquoWrangler Interactive Visual Specification of Data TransformationScriptsrdquo ACM Human Factors in Computing Systems (CHI) 2011 2
[KTD17] KIM S TASSE D and DEY A K ldquoMaking Machine-Learning Applications for Time-Series Sensor Data Graphical and In-teractiverdquo ACM Trans Interact Intell Syst 72 (July 2017) 81ndash830ISSN 2160-6455 DOI 1011452983924 3
[KTH16] KOTTHOFF L THORNTON C HOOS H H et al ldquoAuto-WEKA 20 Automatic model selection and hyperparameter optimiza-tion in WEKArdquo Journal of Machine Learning Research 17 (2016) 1ndash5 3
[LHM13] LEMAN S C HOUSE L MAITI D et al ldquoVisual to para-metric interaction (v2pi)rdquo PloS one 83 (2013) e50474 2
[LSL17] LIU M SHI J LI Z et al ldquoTowards Better Analysis of DeepConvolutional Neural Networksrdquo IEEE Transactions on Visualizationand Computer Graphics 231 (2017) 91ndash100 ISSN 2160-9306 DOI101109TVCG20162598831 3
[LWLZ17] LIU S WANG X LIU M and ZHU J ldquoTowards betteranalysis of machine learning models A visual analytics perspectiverdquoVisual Informatics 11 (2017) 48 ndash56 ISSN 2468-502X DOI httpsdoiorg101016jvisinf201701006 4
[LYL14] LI M YANG S and LIU X ldquoDiversity Comparison of ParetoFront Approximations in Many-Objective Optimizationrdquo IEEE Transac-tions on Cybernetics 4412 (2014) 2568ndash2584 ISSN 2168-2267 DOI101109TCYB20142310651 3
[MLa] ML BIG Big ML httpsbigmlcom Accessed March20 2019 3
[MLb] ML SCIKIT LEARN Scikit Learn Model Metrics API Refer-ence httpsscikit- learnorgstablemodulesclasseshtmlmodule-sklearnmetrics Accessed March20 2019 5 6
[MLY17] MIQING L LIANGLI Z and Y XIN ldquoHow to Read Many-Objective Solution Sets in Parallel Coordinatesrdquo CoRR abs170500368(2017) 3
[Mov] Movies Dataset howpublished = https www kaggle comcarolzhangdcimdb-5000-movie-datasetmovie_metadatacsv note = Accessed 2018-12-11 8 9
[NKHK17] NUSHI B KAMAR E HORVITZ E and KOSSMANN DldquoOn Human Intellect and Machine Failures Troubleshooting IntegrativeMachine Learning Systemsrdquo Proceedings of the Thirty-First AAAI Con-ference on Artificial Intelligence AAAIrsquo17 San Francisco CaliforniaUSA AAAI Press 2017 1017ndash1025 3
[Off] OFFICE THE SAN FRANCISCO CONTROLLERrsquoS Employee Com-pensation Data https data sfgov org City -Management - and - Ethics Employee - Compensation 88g8-5mnd Accessed March 15 2019 7ndash9
[PBD10] PATEL K BANCROFT N DRUCKER S M et al ldquoGestaltIntegrated Support for Implementation and Analysis in Machine Learn-ingrdquo Proceedings of the 23Nd Annual ACM Symposium on User In-terface Software and Technology UIST rsquo10 New York New YorkUSA ACM 2010 37ndash46 ISBN 978-1-4503-0271-5 DOI 10114518660291866038 2
[PPJ07] PAPARIZOS S PATEL J M and JAGADISH HV ldquoSIGOPTUsing schema to optimize XML query processingrdquo Data Engineer-ing 2007 ICDE 2007 IEEE 23rd International Conference on IEEE2007 1456ndash1460 3
[PSTW16] PAJER S STREIT M TORSNEY-WEIR T et alldquoWeightLifter Visual Weight Space Exploration for Multi-Criteria De-cision Makingrdquo IEEE Transactions on Visualization and ComputerGraphics (2016) 2
[RAL17] REN D AMERSHI S LEE B et al ldquoSquares Support-ing Interactive Performance Analysis for Multiclass Classifiersrdquo IEEETransactions on Visualization and Computer Graphics 231 (2017) 61ndash70 ISSN 1077-2626 DOI 101109TVCG20162598828 3
[RHY14] REN D HOumlLLERER T and YUAN X ldquoiVisDesigner Expres-sive Interactive Design of Information Visualizationsrdquo IEEE Transac-tions on Visualization and Computer Graphics 2012 (2014) 2092ndash2101ISSN 1077-2626 DOI 101109TVCG20142346291 2
[RLD18] RUDOVIC O LEE J DAI M et al ldquoPersonalized machinelearning for robot perception of affect and engagement in autism ther-apyrdquo Science Robotics 319 (2018) DOI 101126sciroboticsaao6760 3
[RSG16] RIBEIRO M T SINGH S and GUESTRIN C ldquoWhy ShouldI Trust You Explaining the Predictions of Any Classifierrdquo Proceed-ings of the 22Nd ACM SIGKDD International Conference on KnowledgeDiscovery and Data Mining KDD rsquo16 San Francisco California USAACM 2016 1135ndash1144 ISBN 978-1-4503-4232-2 DOI 10114529396722939778 2ndash4
[SAS02] SARAVANAN R ASOKAN P and SACHIDANANDAM M ldquoAmulti-objective genetic algorithm (GA) approach for optimization of sur-face grinding operationsrdquo International Journal of Machine Tools andManufacture 4212 (2002) 1327 ndash1334 ISSN 0890-6955 DOI httpsdoiorg101016S0890-6955(02)00074-3 10
[SC11] SAHU R and CHATURVEDI A K ldquoMany-Objective Comparisonof Twelve Grid Scheduling Heuristicsrdquo 2011 3
[SHB14] SEDLMAIR M HEINZL C BRUCKNER S et al ldquoVisualParameter Space Analysis A Conceptual Frameworkrdquo IEEE Transac-tions on Visualization and Computer Graphics 2012 (2014) 2161ndash2170ISSN 1077-2626 DOI 101109TVCG20142346321 2
ccopy 2020 The Author(s)Computer Graphics Forum ccopy 2020 The Eurographics Association and John Wiley amp Sons Ltd
Das et al QUESTO Interactive Construction of Objective Functions for Classification Tasks
[SKBE17] SAKET B KIM H BROWN E T and ENDERT A ldquoVi-sualization by Demonstration An Interaction Paradigm for Visual DataExplorationrdquo IEEE Transactions on Visualization and Computer Graph-ics 231 (2017) 331ndash340 ISSN 1077-2626 DOI 101109TVCG20162598839 2
[SLT17] SUN Y LANK E and TERRY M ldquoLabel-and-Learn Visu-alizing the Likelihood of Machine Learning Classifierrsquos Success Dur-ing Data Labelingrdquo Proceedings of the 22Nd International Confer-ence on Intelligent User Interfaces IUI rsquo17 Limassol Cyprus ACM2017 523ndash534 ISBN 978-1-4503-4348-0 DOI 10114530251713025208 3
[SRL07] STUMPF S RAJARAM V LI L et al ldquoToward HarnessingUser Feedback for Machine Learningrdquo Proceedings of the 12th Inter-national Conference on Intelligent User Interfaces IUI rsquo07 HonoluluHawaii USA ACM 2007 82ndash91 ISBN 1-59593-481-2 DOI 10 114512162951216316 2
[SRL09] STUMPF S RAJARAM V LI L et al ldquoInteracting Mean-ingfully with Machine Learning Systems Three Experimentsrdquo Int JHum-Comput Stud 678 (Aug 2009) 639ndash662 ISSN 1071-5819 DOI101016jijhcs200903004 3
[SSZ17] S DOMINIK S MICHAEL Z LEISHI et al ldquoWhat you see iswhat you can change Human-centered machine learning by interactivevisualizationrdquo Neurocomputing 268 (2017) 164ndash175 3
[TCWM18] T LI CONVERTINO G WANG W and MOST H ldquoHyper-Tuner Visual Analytics for Hyperparameter Tuning by ProfessionalsrdquoMachine Learning from User Interaction for Visualization and Analyt-ics IEEE VIS 2018 (2018) 3
[TDCF07] TULLIO J DEY A K CHALECKI J and FOGARTY JldquoHow It Works A Field Study of Non-technical Users Interacting withan Intelligent Systemrdquo Proceedings of the SIGCHI Conference on Hu-man Factors in Computing Systems CHI rsquo07 San Jose CaliforniaUSA ACM 2007 31ndash40 ISBN 978-1-59593-593-9 DOI 10114512406241240630 3
[THHLB13] THORNTON C HUTTER F HOOS H H and LEYTON-BROWN K ldquoAuto-WEKA Combined selection and hyperparameter op-timization of classification algorithmsrdquo Proceedings of the 19th ACMSIGKDD international conference on Knowledge discovery and datamining ACM 2013 847ndash855 3
[TLB11] TAMUZ O LIU C BELONGIE S et al ldquoAdaptively Learn-ing the Crowd Kernelrdquo Proceedings of the 28th International Con-ference on International Conference on Machine Learning ICMLrsquo11Bellevue Washington USA Omnipress 2011 673ndash680 ISBN 978-1-4503-0619-5 2ndash4
[TLKT09] TALBOT J LEE B KAPOOR A and TAN D S ldquoEnsem-bleMatrix interactive visualization to support machine learning withmultiple classifiersrdquo CHI Ed by JR DAN R OLSEN ARTHURRICHARD B HINCKLEY KEN et al ACM 2009 1283ndash1292 ISBN978-1-60558-246-7 2
[VDEW11] VAN DEN ELZEN S and van WIJK J J ldquoBaobabview In-teractive construction and analysis of decision treesrdquo Visual Analyt-ics Science and Technology (VAST) 2011 IEEE Conference on IEEE2011 151ndash160 2 4
[WEF13] WALKER D J EVERSON R and FIELDSEND J E ldquoVisu-alizing Mutually Nondominating Solution Sets in Many-Objective Op-timizationrdquo Trans Evol Comp 172 (Apr 2013) 165ndash184 ISSN 1089-778X DOI 101109TEVC20122225064 3
[WFE12] WALKER D FIELDSEND J and EVERSON R ldquoVisualisingMany-objective Populationsrdquo Proceedings of the 14th Annual Confer-ence Companion on Genetic and Evolutionary Computation GECCOrsquo12 Philadelphia Pennsylvania USA ACM 2012 451ndash458 ISBN 978-1-4503-1178-6 DOI 10114523307842330853 3
[WLDW01] WOLFMAN S A LAU T DOMINGOS P and WELDD S ldquoMixed Initiative Interfaces for Learning Tasks SMARTeditTalks Backrdquo Proceedings of the 6th International Conference on Intel-ligent User Interfaces IUI rsquo01 Santa Fe New Mexico USA ACM2001 167ndash174 ISBN 1-58113-325-1 DOI 10 1145 359784 360332 3
[WN17] WENSKOVITCH J and NORTH C ldquoObservation-Level Inter-action with Clustering and Dimension Reduction Algorithmsrdquo Pro-ceedings of the 2Nd Workshop on Human-In-the-Loop Data AnalyticsHILDArsquo17 Chicago IL USA ACM 2017 141ndash146 ISBN 978-1-4503-5029-7 DOI 10114530772573077259 2
[YL09] YEH I and LIEN C ldquoThe comparisons of data mining tech-niques for the predictive accuracy of probability of default of credit cardclientsrdquo Expert Systems with Applications 362 Part 1 (2009) 2473 ndash2480 ISSN 0957-4174 DOI httpsdoiorg101016jeswa200712020 8
[YSCR18] YANG Q SUH J CHEN N and RAMOS G ldquoGroundingInteractive Machine Learning Tool Design in How Non-Experts ActuallyBuild Modelsrdquo ACM 2018 2 3
[ZSZR18] Z XIAOJIN SINGLA A ZILLES S and RAFFERTY A NldquoAn Overview of Machine Teachingrdquo CoRR abs180105927 (2018) 23
ccopy 2020 The Author(s)Computer Graphics Forum ccopy 2020 The Eurographics Association and John Wiley amp Sons Ltd
Das et al QUESTO Interactive Construction of Objective Functions for Classification Tasks
[SKBE17] SAKET B KIM H BROWN E T and ENDERT A ldquoVi-sualization by Demonstration An Interaction Paradigm for Visual DataExplorationrdquo IEEE Transactions on Visualization and Computer Graph-ics 231 (2017) 331ndash340 ISSN 1077-2626 DOI 101109TVCG20162598839 2
[SLT17] SUN Y LANK E and TERRY M ldquoLabel-and-Learn Visu-alizing the Likelihood of Machine Learning Classifierrsquos Success Dur-ing Data Labelingrdquo Proceedings of the 22Nd International Confer-ence on Intelligent User Interfaces IUI rsquo17 Limassol Cyprus ACM2017 523ndash534 ISBN 978-1-4503-4348-0 DOI 10114530251713025208 3
[SRL07] STUMPF S RAJARAM V LI L et al ldquoToward HarnessingUser Feedback for Machine Learningrdquo Proceedings of the 12th Inter-national Conference on Intelligent User Interfaces IUI rsquo07 HonoluluHawaii USA ACM 2007 82ndash91 ISBN 1-59593-481-2 DOI 10 114512162951216316 2
[SRL09] STUMPF S RAJARAM V LI L et al ldquoInteracting Mean-ingfully with Machine Learning Systems Three Experimentsrdquo Int JHum-Comput Stud 678 (Aug 2009) 639ndash662 ISSN 1071-5819 DOI101016jijhcs200903004 3
[SSZ17] S DOMINIK S MICHAEL Z LEISHI et al ldquoWhat you see iswhat you can change Human-centered machine learning by interactivevisualizationrdquo Neurocomputing 268 (2017) 164ndash175 3
[TCWM18] T LI CONVERTINO G WANG W and MOST H ldquoHyper-Tuner Visual Analytics for Hyperparameter Tuning by ProfessionalsrdquoMachine Learning from User Interaction for Visualization and Analyt-ics IEEE VIS 2018 (2018) 3
[TDCF07] TULLIO J DEY A K CHALECKI J and FOGARTY JldquoHow It Works A Field Study of Non-technical Users Interacting withan Intelligent Systemrdquo Proceedings of the SIGCHI Conference on Hu-man Factors in Computing Systems CHI rsquo07 San Jose CaliforniaUSA ACM 2007 31ndash40 ISBN 978-1-59593-593-9 DOI 10114512406241240630 3
[THHLB13] THORNTON C HUTTER F HOOS H H and LEYTON-BROWN K ldquoAuto-WEKA Combined selection and hyperparameter op-timization of classification algorithmsrdquo Proceedings of the 19th ACMSIGKDD international conference on Knowledge discovery and datamining ACM 2013 847ndash855 3
[TLB11] TAMUZ O LIU C BELONGIE S et al ldquoAdaptively Learn-ing the Crowd Kernelrdquo Proceedings of the 28th International Con-ference on International Conference on Machine Learning ICMLrsquo11Bellevue Washington USA Omnipress 2011 673ndash680 ISBN 978-1-4503-0619-5 2ndash4
[TLKT09] TALBOT J LEE B KAPOOR A and TAN D S ldquoEnsem-bleMatrix interactive visualization to support machine learning withmultiple classifiersrdquo CHI Ed by JR DAN R OLSEN ARTHURRICHARD B HINCKLEY KEN et al ACM 2009 1283ndash1292 ISBN978-1-60558-246-7 2
[VDEW11] VAN DEN ELZEN S and van WIJK J J ldquoBaobabview In-teractive construction and analysis of decision treesrdquo Visual Analyt-ics Science and Technology (VAST) 2011 IEEE Conference on IEEE2011 151ndash160 2 4
[WEF13] WALKER D J EVERSON R and FIELDSEND J E ldquoVisu-alizing Mutually Nondominating Solution Sets in Many-Objective Op-timizationrdquo Trans Evol Comp 172 (Apr 2013) 165ndash184 ISSN 1089-778X DOI 101109TEVC20122225064 3
[WFE12] WALKER D FIELDSEND J and EVERSON R ldquoVisualisingMany-objective Populationsrdquo Proceedings of the 14th Annual Confer-ence Companion on Genetic and Evolutionary Computation GECCOrsquo12 Philadelphia Pennsylvania USA ACM 2012 451ndash458 ISBN 978-1-4503-1178-6 DOI 10114523307842330853 3
[WLDW01] WOLFMAN S A LAU T DOMINGOS P and WELDD S ldquoMixed Initiative Interfaces for Learning Tasks SMARTeditTalks Backrdquo Proceedings of the 6th International Conference on Intel-ligent User Interfaces IUI rsquo01 Santa Fe New Mexico USA ACM2001 167ndash174 ISBN 1-58113-325-1 DOI 10 1145 359784 360332 3
[WN17] WENSKOVITCH J and NORTH C ldquoObservation-Level Inter-action with Clustering and Dimension Reduction Algorithmsrdquo Pro-ceedings of the 2Nd Workshop on Human-In-the-Loop Data AnalyticsHILDArsquo17 Chicago IL USA ACM 2017 141ndash146 ISBN 978-1-4503-5029-7 DOI 10114530772573077259 2
[YL09] YEH I and LIEN C ldquoThe comparisons of data mining tech-niques for the predictive accuracy of probability of default of credit cardclientsrdquo Expert Systems with Applications 362 Part 1 (2009) 2473 ndash2480 ISSN 0957-4174 DOI httpsdoiorg101016jeswa200712020 8
[YSCR18] YANG Q SUH J CHEN N and RAMOS G ldquoGroundingInteractive Machine Learning Tool Design in How Non-Experts ActuallyBuild Modelsrdquo ACM 2018 2 3
[ZSZR18] Z XIAOJIN SINGLA A ZILLES S and RAFFERTY A NldquoAn Overview of Machine Teachingrdquo CoRR abs180105927 (2018) 23
ccopy 2020 The Author(s)Computer Graphics Forum ccopy 2020 The Eurographics Association and John Wiley amp Sons Ltd