questions for data scientists in software engineering: a
TRANSCRIPT

Questions for Data Scientists in Software Engineering:A Replication
Hennie HuijgensDelft University of Technology
Delft, The [email protected]
Ayushi RastogiErnst Mulders∗
Delft University of TechnologyDelft, The [email protected]@mulde.rs
Georgios GousiosArie van Deursen
Delft University of TechnologyDelft, The [email protected]
ABSTRACTIn 2014, a Microsoft study investigated the sort of questions thatdata science applied to software engineering should answer. This re-sulted in 145 questions that developers considered relevant for datascientists to answer, thus providing a research agenda to the com-munity. Fast forward to five years, no further studies investigatedwhether the questions from the software engineers at Microsofthold for other software companies, including software-intensivecompanies with different primary focus (to which we refer assoftware-defined enterprises). Furthermore, it is not evident thatthe problems identified five years ago are still applicable, given thetechnological advances in software engineering.
This paper presents a study at ING, a software-defined enter-prise in banking in which over 15,000 IT staff provides in-housesoftware solutions. This paper presents a comprehensive guide ofquestions for data scientists selected from the previous study atMicrosoft along with our current work at ING. We replicated theoriginal Microsoft study at ING, looking for questions that impactboth software companies and software-defined enterprises and con-tinue to impact software engineering. We also add new questionsthat emerged from differences in the context of the two companiesand the five years gap in between. Our results show that softwareengineering questions for data scientists in the software-definedenterprise are largely similar to the software company, albeit withexceptions. We hope that the software engineering research com-munity builds on the new list of questions to create a useful bodyof knowledge.
CCS CONCEPTS• General and reference→ Surveys and overviews.
KEYWORDSData Science, Software Engineering, Software Analytics.
∗Work completed during an internship at ING.
Permission to make digital or hard copies of all or part of this work for personal orclassroom use is granted without fee provided that copies are not made or distributedfor profit or commercial advantage and that copies bear this notice and the full citationon the first page. Copyrights for components of this work owned by others than ACMmust be honored. Abstracting with credit is permitted. To copy otherwise, or republish,to post on servers or to redistribute to lists, requires prior specific permission and/or afee. Request permissions from [email protected]/FSE ’20, November 8–13, 2020, Virtual Event, USA© 2020 Association for Computing Machinery.ACM ISBN 978-1-4503-7043-1/20/11. . . $15.00https://doi.org/10.1145/3368089.3409717
ACM Reference Format:HennieHuijgens, Ayushi Rastogi, ErnstMulders, Georgios Gousios, andArievan Deursen. 2020. Questions for Data Scientists in Software Engineering: AReplication. In Proceedings of the 28th ACM Joint European Software Engineer-ing Conference and Symposium on the Foundations of Software Engineering(ESEC/FSE ’20), November 8–13, 2020, Virtual Event, USA. ACM, New York,NY, USA, 21 pages. https://doi.org/10.1145/3368089.3409717
1 INTRODUCTIONSoftware engineering researchers try solving problems that arerelevant to software developers, teams, and organizations. Histori-cally, researchers identified these problems from their experience,connections in industry and/or prior research. In 2014, however, astudy at Microsoft [6] systematically analyzed software engineer-ing questions that data scientists can answer and made it accessibleto a wider audience.
Switching context, in the past few years ING transformed it-self from a finance-oriented company to a software-defined, data-driven enterprise. From a software engineering perspective, thisincludes the implementation of fully automated release engineer-ing pipelines for software development activities in more than 600teams performing 2,500+ deployments per month for 750+ appli-cations. These activities leave a trove of data, suggesting that datascientists using, e.g., modern machine learning techniques couldoffer valuable and actionable insights to ING.
To that end, ING needs questions that are relevant for theirengineers which their data scientists can answer. As we startedlooking for existing resources, we came across the 145 softwareengineering questions for data scientists presented in the Microsoftstudy [6]. However, before adopting the list, we wanted to know:RQ: To what extent do software engineering questions relevant forMicrosoft apply to ING, five years later?
Microsoft is a large software company, while ING that is a Fin-Tech company using software to improve its banking solutions(software-defined enterprise). Moreover, the two companies are atdifferent scale. In 2014, Microsoft had more than 30,000 engineerswhile even today ING is almost half its size with approximately15,000 IT employees (on a total of 45,000). More details on thedifferences in the context of the two companies are available inTable 1. We try to understand whether the questions relevant fora software company extend to a software-defined enterprise. Wecompare the results of the original Microsoft study [6] with ourresults at ING to understand the relevance of the questions beyondMicrosoft but also as a guide for other software-defined enterprisesthat are undergoing their digital transformation. We further explore
arX
iv:2
010.
0316
5v3
[cs
.SE
] 4
Jan
202
1
ESEC/FSE ’20, November 8–13, 2020, Virtual Event, USA Hennie Huijgens, Ayushi Rastogi, Ernst Mulders, Georgios Gousios, and Arie van Deursen
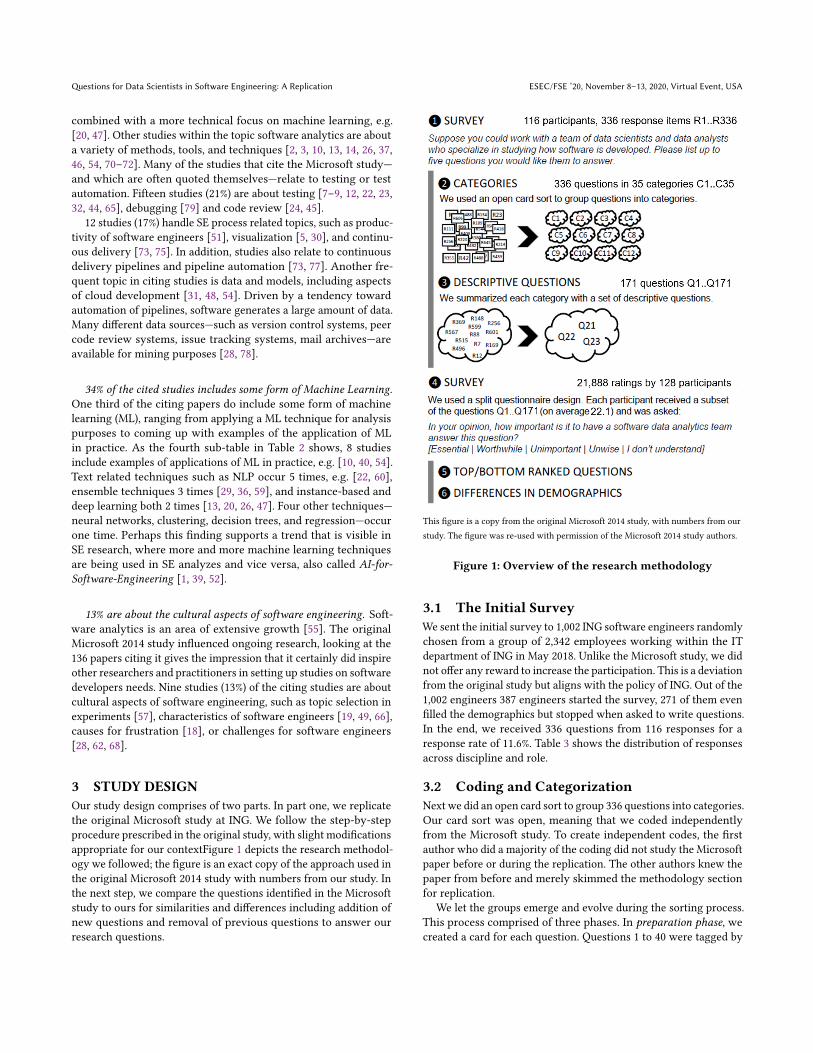
whether the technological advances in the last five years changedthe way we develop software. To answer this question, we carriedout a replication of the original Microsoft study at ING. Similarto the original study, we conducted two surveys: one, to find datascience problems in software engineering, and second, to rank thequestions in the order of their relevance (see Figure 1). For the firstsurvey, we randomly sampled 1,002 ING engineers and received116 responses with 336 questions. We grouped the 336 questions onsimilarities resulting in 171 descriptive questions. We shared sub-sets of these 171 descriptive questions with another random sampleof 1,296 ING engineers for ranking. In the end, we received 21,888rankings from 128 ING engineers. These ranked 171 questions arethe questions that engineers at ING would like data scientists tosolve. Further, we compare our list of 171 questions to the originallist of 145 questions to answer our research question. Our studyshows that the core software development problems, relating tocode (e.g. understanding code, testing, and quality), developer pro-ductivity (both individuals and team) and customer are same for thesoftware company and the software-defined enterprise. Nonethe-less, subtle differences in the type of questions point to changes inmarket as well as differences in the context of the two companies.
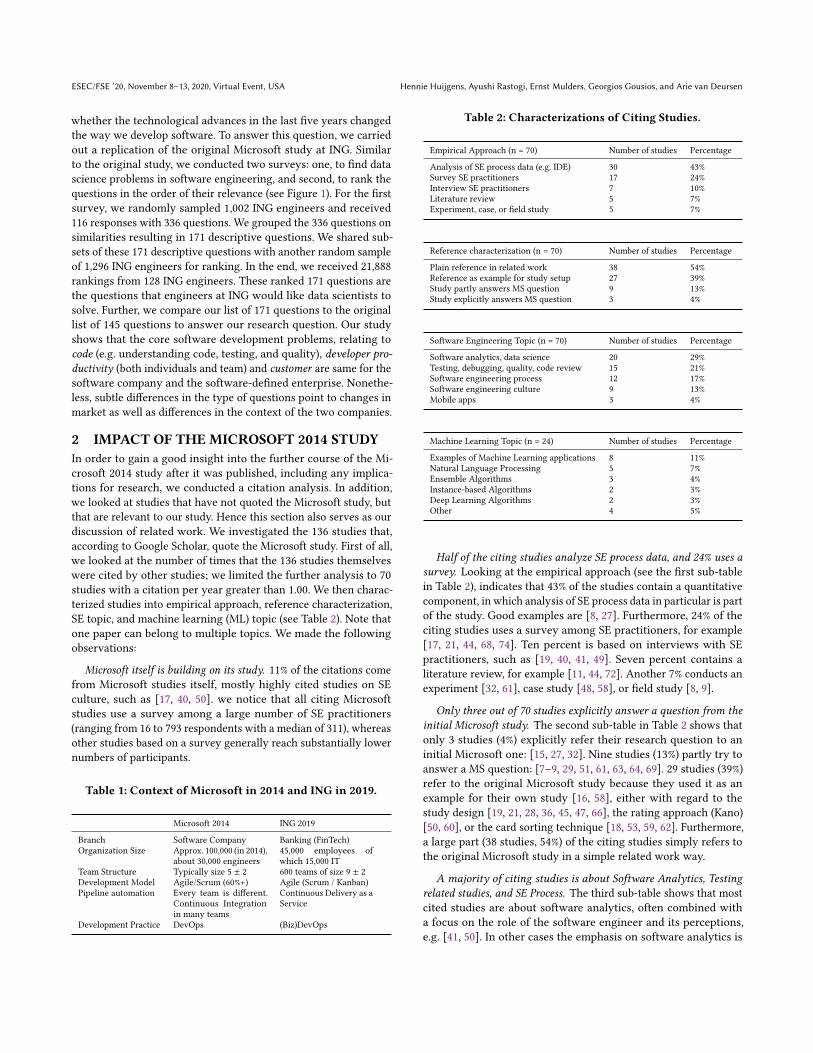
2 IMPACT OF THE MICROSOFT 2014 STUDYIn order to gain a good insight into the further course of the Mi-crosoft 2014 study after it was published, including any implica-tions for research, we conducted a citation analysis. In addition,we looked at studies that have not quoted the Microsoft study, butthat are relevant to our study. Hence this section also serves as ourdiscussion of related work. We investigated the 136 studies that,according to Google Scholar, quote the Microsoft study. First of all,we looked at the number of times that the 136 studies themselveswere cited by other studies; we limited the further analysis to 70studies with a citation per year greater than 1.00. We then charac-terized studies into empirical approach, reference characterization,SE topic, and machine learning (ML) topic (see Table 2). Note thatone paper can belong to multiple topics. We made the followingobservations:
Microsoft itself is building on its study. 11% of the citations comefrom Microsoft studies itself, mostly highly cited studies on SEculture, such as [17, 40, 50]. we notice that all citing Microsoftstudies use a survey among a large number of SE practitioners(ranging from 16 to 793 respondents with a median of 311), whereasother studies based on a survey generally reach substantially lowernumbers of participants.
Table 1: Context of Microsoft in 2014 and ING in 2019.
Microsoft 2014 ING 2019
Branch Software Company Banking (FinTech)Organization Size Approx. 100,000 (in 2014),
about 30,000 engineers45,000 employees ofwhich 15,000 IT
Team Structure Typically size 5 ± 2 600 teams of size 9 ± 2Development Model Agile/Scrum (60%+) Agile (Scrum / Kanban)Pipeline automation Every team is different.
Continuous Integrationin many teams
Continuous Delivery as aService
Development Practice DevOps (Biz)DevOps
Table 2: Characterizations of Citing Studies.
Empirical Approach (n = 70) Number of studies Percentage
Analysis of SE process data (e.g. IDE) 30 43%Survey SE practitioners 17 24%Interview SE practitioners 7 10%Literature review 5 7%Experiment, case, or field study 5 7%
Reference characterization (n = 70) Number of studies Percentage
Plain reference in related work 38 54%Reference as example for study setup 27 39%Study partly answers MS question 9 13%Study explicitly answers MS question 3 4%
Software Engineering Topic (n = 70) Number of studies Percentage
Software analytics, data science 20 29%Testing, debugging, quality, code review 15 21%Software engineering process 12 17%Software engineering culture 9 13%Mobile apps 3 4%
Machine Learning Topic (n = 24) Number of studies Percentage
Examples of Machine Learning applications 8 11%Natural Language Processing 5 7%Ensemble Algorithms 3 4%Instance-based Algorithms 2 3%Deep Learning Algorithms 2 3%Other 4 5%
Half of the citing studies analyze SE process data, and 24% uses asurvey. Looking at the empirical approach (see the first sub-tablein Table 2), indicates that 43% of the studies contain a quantitativecomponent, in which analysis of SE process data in particular is partof the study. Good examples are [8, 27]. Furthermore, 24% of theciting studies uses a survey among SE practitioners, for example[17, 21, 44, 68, 74]. Ten percent is based on interviews with SEpractitioners, such as [19, 40, 41, 49]. Seven percent contains aliterature review, for example [11, 44, 72]. Another 7% conducts anexperiment [32, 61], case study [48, 58], or field study [8, 9].
Only three out of 70 studies explicitly answer a question from theinitial Microsoft study. The second sub-table in Table 2 shows thatonly 3 studies (4%) explicitly refer their research question to aninitial Microsoft one: [15, 27, 32]. Nine studies (13%) partly try toanswer a MS question: [7–9, 29, 51, 61, 63, 64, 69]. 29 studies (39%)refer to the original Microsoft study because they used it as anexample for their own study [16, 58], either with regard to thestudy design [19, 21, 28, 36, 45, 47, 66], the rating approach (Kano)[50, 60], or the card sorting technique [18, 53, 59, 62]. Furthermore,a large part (38 studies, 54%) of the citing studies simply refers tothe original Microsoft study in a simple related work way.
A majority of citing studies is about Software Analytics, Testingrelated studies, and SE Process. The third sub-table shows that mostcited studies are about software analytics, often combined witha focus on the role of the software engineer and its perceptions,e.g. [41, 50]. In other cases the emphasis on software analytics is
Questions for Data Scientists in Software Engineering: A Replication ESEC/FSE ’20, November 8–13, 2020, Virtual Event, USA
combined with a more technical focus on machine learning, e.g.[20, 47]. Other studies within the topic software analytics are abouta variety of methods, tools, and techniques [2, 3, 10, 13, 14, 26, 37,46, 54, 70–72]. Many of the studies that cite the Microsoft study—and which are often quoted themselves—relate to testing or testautomation. Fifteen studies (21%) are about testing [7–9, 12, 22, 23,32, 44, 65], debugging [79] and code review [24, 45].
12 studies (17%) handle SE process related topics, such as produc-tivity of software engineers [51], visualization [5, 30], and continu-ous delivery [73, 75]. In addition, studies also relate to continuousdelivery pipelines and pipeline automation [73, 77]. Another fre-quent topic in citing studies is data and models, including aspectsof cloud development [31, 48, 54]. Driven by a tendency towardautomation of pipelines, software generates a large amount of data.Many different data sources—such as version control systems, peercode review systems, issue tracking systems, mail archives—areavailable for mining purposes [28, 78].
34% of the cited studies includes some form of Machine Learning.One third of the citing papers do include some form of machinelearning (ML), ranging from applying a ML technique for analysispurposes to coming up with examples of the application of MLin practice. As the fourth sub-table in Table 2 shows, 8 studiesinclude examples of applications of ML in practice, e.g. [10, 40, 54].Text related techniques such as NLP occur 5 times, e.g. [22, 60],ensemble techniques 3 times [29, 36, 59], and instance-based anddeep learning both 2 times [13, 20, 26, 47]. Four other techniques—neural networks, clustering, decision trees, and regression—occurone time. Perhaps this finding supports a trend that is visible inSE research, where more and more machine learning techniquesare being used in SE analyzes and vice versa, also called AI-for-Software-Engineering [1, 39, 52].
13% are about the cultural aspects of software engineering. Soft-ware analytics is an area of extensive growth [55]. The originalMicrosoft 2014 study influenced ongoing research, looking at the136 papers citing it gives the impression that it certainly did inspireother researchers and practitioners in setting up studies on softwaredevelopers needs. Nine studies (13%) of the citing studies are aboutcultural aspects of software engineering, such as topic selection inexperiments [57], characteristics of software engineers [19, 49, 66],causes for frustration [18], or challenges for software engineers[28, 62, 68].
3 STUDY DESIGNOur study design comprises of two parts. In part one, we replicatethe original Microsoft study at ING. We follow the step-by-stepprocedure prescribed in the original study, with slight modificationsappropriate for our contextFigure 1 depicts the research methodol-ogy we followed; the figure is an exact copy of the approach used inthe original Microsoft 2014 study with numbers from our study. Inthe next step, we compare the questions identified in the Microsoftstudy to ours for similarities and differences including addition ofnew questions and removal of previous questions to answer ourresearch questions.
This figure is a copy from the original Microsoft 2014 study, with numbers from ourstudy. The figure was re-used with permission of the Microsoft 2014 study authors.
Figure 1: Overview of the research methodology
3.1 The Initial SurveyWe sent the initial survey to 1,002 ING software engineers randomlychosen from a group of 2,342 employees working within the ITdepartment of ING in May 2018. Unlike the Microsoft study, we didnot offer any reward to increase the participation. This is a deviationfrom the original study but aligns with the policy of ING. Out of the1,002 engineers 387 engineers started the survey, 271 of them evenfilled the demographics but stopped when asked to write questions.In the end, we received 336 questions from 116 responses for aresponse rate of 11.6%. Table 3 shows the distribution of responsesacross discipline and role.
3.2 Coding and CategorizationNext we did an open card sort to group 336 questions into categories.Our card sort was open, meaning that we coded independentlyfrom the Microsoft study. To create independent codes, the firstauthor who did a majority of the coding did not study the Microsoftpaper before or during the replication. The other authors knew thepaper from before and merely skimmed the methodology sectionfor replication.
We let the groups emerge and evolve during the sorting process.This process comprised of three phases. In preparation phase, wecreated a card for each question. Questions 1 to 40 were tagged by

ESEC/FSE ’20, November 8–13, 2020, Virtual Event, USA Hennie Huijgens, Ayushi Rastogi, Ernst Mulders, Georgios Gousios, and Arie van Deursen
the second author. Questions 41 to 80 were tagged by the fourthauthor. Questions 81 to 90 were tagged by both the second andthe fourth author. The tags of questions 1 to 90 were discussed byboth the second and fourth author and based on their discussionfinal tags were prepared. The remaining questions 91 to 336 werethen tagged by the first author, based on the tags from the previousstep. We discarded cards that made general comments on softwaredevelopment and did not inquire any specific topic.
In the execution phase, cards were sorted into meaningful groupsand were assigned a descriptive title. Similar to the Microsoft study,the questions were not easy to work with; many questions weresame or similar to one another, most were quite verbose while oth-ers were overly specific. We distilled them into a set of so-calleddescriptive questions that more concisely describe each category(and sub-category). In this step, out of the 336 questions, 49 ques-tions were discarded and the remaining 287 questions were dividedinto 35 sub-categories. An example of reaching descriptive questionis presented below1: ‘What factors affect the composition of DevOps teams?’
from the following respondents’ questions:7“Would it be better to create specialized development teams insteadof DevOps teams?"7"What is your idea of an ideal team that should develop software?How many and what kind of people should be part of it?"
Finally, in the analysis phase, we created abstract hierarchiesto deduce general categories and themes. In total, we created 171descriptive questions, a full list of which is available in the appendix.
3.3 The Rating SurveyWe created a second survey to rate the 171 descriptive questions.We split the questionnaire into eight component blocks (similarto the Microsoft study) and sent component blocks to potentialrespondents. The idea behind using the split questionnaire surveydesign is to avoid low response rate. Each participant received ablock of questions along with a text "In your opinion, how importantis it to have a software data analytics team answer this question?"with possible answers as "Essential", "Worthwhile", "Unimportant","Unwise", and "I don’t understand" [38].
1A closed balloon indicates a respondent question; an open balloon indicates a descrip-tive question.
Table 3: Distribution of responses based on discipline androle in the initial survey as well as rating survey.
Discipline Initial Survey Rating Survey
Development & Testing 62.0% 68.8%Project Management 2.0% 3.9%Other Engineering (e.g. architect) 28.0% 19.5%Non-Engineering 8.0% 7.8%
Current Role Initial Survey Rating Survey
Developer 51.1% 20.0%Lead 14.3% 18.7%Architect 9.0% 11.8%Manager & Executive 8.3% 20.0%Other 17.3% 29.6%
The rating survey was sent to the remaining 1,296 softwareengineers at ING. Here too, 360 engineers started the survey (28%),but many of them did not complete it (36% drop-out rate). Finally,we received 128 responses, for a somewhat low response rate of10%. On an average each question received 21,888/177=123 ratingsmaking the resulting ranks stable. Table 3 shows the distributionof responses for the rating survey based on discipline and currentrole.
3.3.1 Top-Rated/Bottom-Rated Questions. Finally, to rank eachquestion, we dichotomized the ordinal Kano scale avoiding anyscale violations [43]. We computed the following percentages foreach descriptive question:
• Percentage of ’Essential’ responses among all the responses:
𝐸𝑠𝑠𝑒𝑛𝑡𝑖𝑎𝑙
𝐸𝑠𝑠𝑒𝑛𝑡𝑖𝑎𝑙 +𝑊𝑜𝑟𝑡ℎ𝑤ℎ𝑖𝑙𝑒 +𝑈𝑛𝑖𝑚𝑝𝑜𝑟𝑡𝑎𝑛𝑡 +𝑈𝑛𝑤𝑖𝑠𝑒
• Percentage of ’Essential’ and ’Worthwhile’ responses amongall the responses (to which we refer asWorthwhile+):
𝐸𝑠𝑠𝑒𝑛𝑡𝑖𝑎𝑙 +𝑊𝑜𝑟𝑡ℎ𝑤ℎ𝑖𝑙𝑒
𝐸𝑠𝑠𝑒𝑛𝑡𝑖𝑎𝑙 +𝑊𝑜𝑟𝑡ℎ𝑤ℎ𝑖𝑙𝑒 +𝑈𝑛𝑖𝑚𝑝𝑜𝑟𝑡𝑎𝑛𝑡 +𝑈𝑛𝑤𝑖𝑠𝑒
• Percentage of ’Unwise’ responses among all the responses:
𝑈𝑛𝑤𝑖𝑠𝑒
𝐸𝑠𝑠𝑒𝑛𝑡𝑖𝑎𝑙 +𝑊𝑜𝑟𝑡ℎ𝑤ℎ𝑖𝑙𝑒 +𝑈𝑛𝑖𝑚𝑝𝑜𝑟𝑡𝑎𝑛𝑡 +𝑈𝑛𝑤𝑖𝑠𝑒
We rank each question based on the above percentages, withthe top rank (#1) having the highest percentage in a dimension(Essential, Worthwhile+, or Unwise). Table 5 and Table 6 presentsthe most desired (Top 10 Essential, Top 10 Worthwhile+) and themost undesired (Top 10 Unwise) descriptive questions. For all 171questions and their rank, see the appendix.
3.3.2 Rating by Demographics. Unlike the Microsoft study, we didnot have employee database to rank responses based on demograph-ics, and privacy regulations prevented us from asking people-relatedaspects such as years of experience (another deviation from theoriginal study). Nonetheless, in both the initial and the rating sur-vey, we asked the following professional background data from theparticipants:
• Discipline: Participants were asked to indicate their primaryworking area: Development, Test, Project Management, OtherEngineer (e.g. architect, lead), or Other Non-Engineer (onlyone selection was possible).
• Current Role: Participants were asked to indicate their cur-rent role: Individual Contributor, Lead, Architect, Manager,Executive, or Other (more selections were possible).
To investigate the relations of descriptive questions to profes-sional background (discipline or current role), we built stepwiselogistic regression models. We build our own models since the refer-enced study did not share scripts to run statistical tests although wedid follow their procedure as is. Stepwise regression eliminated pro-fessional backgrounds that did not improve the model for a givenquestion and a response. In addition, we removed professional back-grounds for which the coefficient in the model was not statisticallysignificant at p-value < 0.01. For each of the 171 questions, we builta model with Essential response (yes/no) as a dependent variable
Questions for Data Scientists in Software Engineering: A Replication ESEC/FSE ’20, November 8–13, 2020, Virtual Event, USA
and professional background as independent variable. We built sim-ilar models for Worthwhile+ and Unwise responses. In total, webuilt 513 models, three for each of the 171 descriptive questions.
3.4 Comparison of QuestionsAs a preliminary analysis, we start by looking at the similarities anddifferences in the broader themes or categories in both the studies.Then for each theme, we see how the prominent questions in INGcompare against the prominent questions at Microsoft.
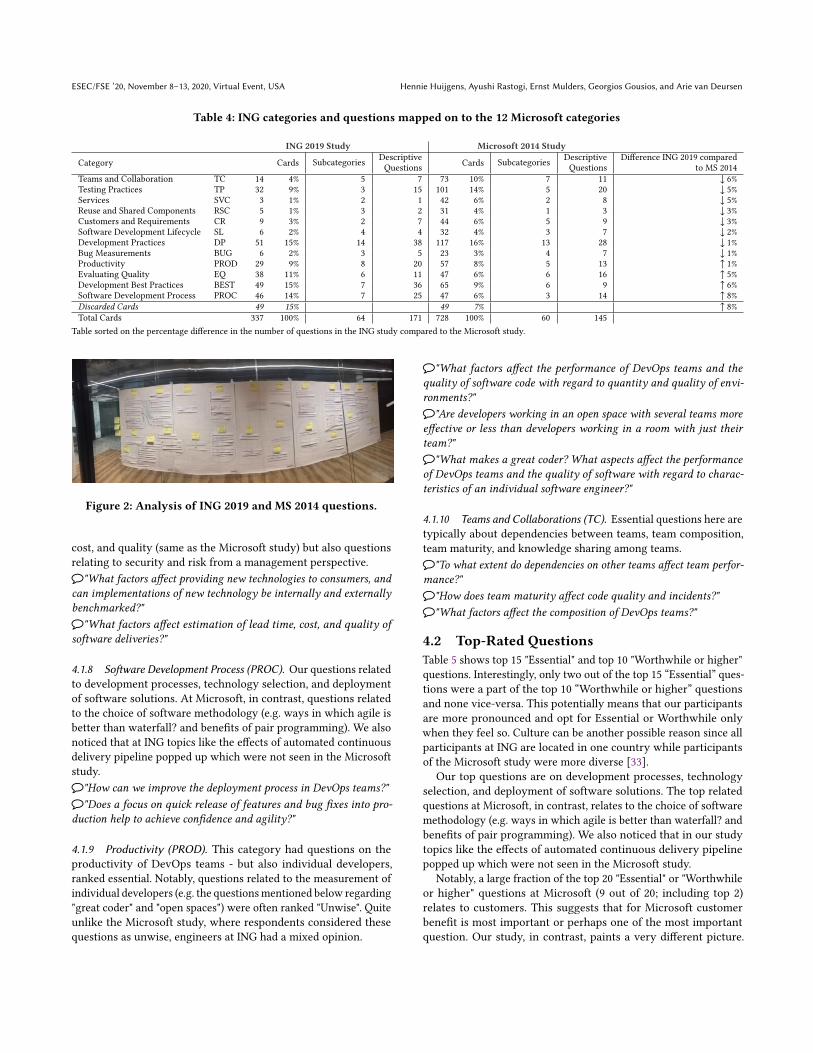
To make the comparison systematic, we followed a two-stepapproach. First, we ran word counts on the questions from both thecompanies presenting a text-based comparison to identify broaddifferences. Further, the first two authors manually analyzed top 100essential questions from the two companies in detail. The authorsdrew affinity diagrams using Microsoft questions (see Figure 2) andappended related questions from ING to it. In case no cluster fitsa question, a new cluster is created. This resulted in three typesof clusters: match and no match (addition of ING questions anddeletion of Microsoft questions). Analyses of the three clusters andthe frequency distribution of questions (in addition to the previousthree analyses) present insights into our research question.
4 RESULTSThe original Microsoft study came up with 145 questions that soft-ware engineers want data scientists to answer. Replicating theoriginal study at ING, we identified 171 data science questions.
This section presents a comparison of the two sets of questionsbased on category, type of questions within categories, top-ratedquestions, bottom-rated questions, and questions relevant for dif-ferent demographics. Next, we compare the questions from the twocompanies using word count and affinity diagrams to answer ourresearch question.
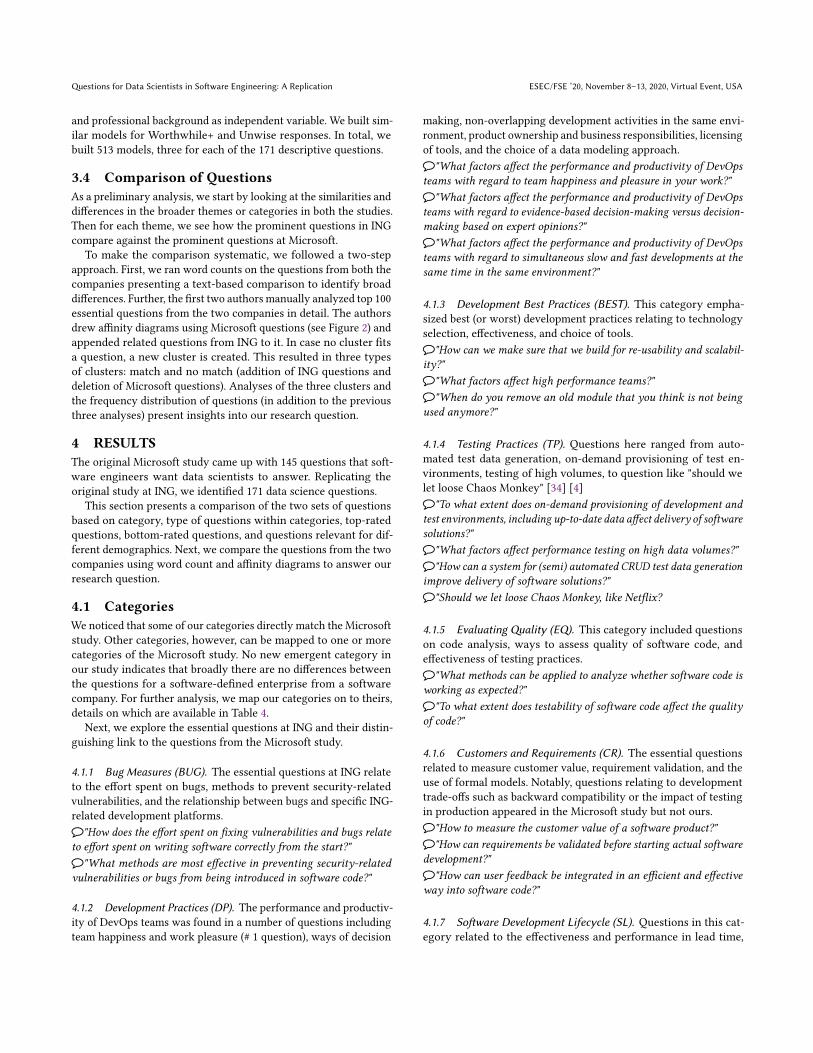
4.1 CategoriesWe noticed that some of our categories directly match the Microsoftstudy. Other categories, however, can be mapped to one or morecategories of the Microsoft study. No new emergent category inour study indicates that broadly there are no differences betweenthe questions for a software-defined enterprise from a softwarecompany. For further analysis, we map our categories on to theirs,details on which are available in Table 4.
Next, we explore the essential questions at ING and their distin-guishing link to the questions from the Microsoft study.
4.1.1 Bug Measures (BUG). The essential questions at ING relateto the effort spent on bugs, methods to prevent security-relatedvulnerabilities, and the relationship between bugs and specific ING-related development platforms."How does the effort spent on fixing vulnerabilities and bugs relateto effort spent on writing software correctly from the start?""What methods are most effective in preventing security-relatedvulnerabilities or bugs from being introduced in software code?"
4.1.2 Development Practices (DP). The performance and productiv-ity of DevOps teams was found in a number of questions includingteam happiness and work pleasure (# 1 question), ways of decision
making, non-overlapping development activities in the same envi-ronment, product ownership and business responsibilities, licensingof tools, and the choice of a data modeling approach."What factors affect the performance and productivity of DevOpsteams with regard to team happiness and pleasure in your work?""What factors affect the performance and productivity of DevOpsteams with regard to evidence-based decision-making versus decision-making based on expert opinions?""What factors affect the performance and productivity of DevOpsteams with regard to simultaneous slow and fast developments at thesame time in the same environment?"
4.1.3 Development Best Practices (BEST). This category empha-sized best (or worst) development practices relating to technologyselection, effectiveness, and choice of tools."How can we make sure that we build for re-usability and scalabil-ity?""What factors affect high performance teams?""When do you remove an old module that you think is not beingused anymore?"
4.1.4 Testing Practices (TP). Questions here ranged from auto-mated test data generation, on-demand provisioning of test en-vironments, testing of high volumes, to question like "should welet loose Chaos Monkey" [34] [4]"To what extent does on-demand provisioning of development andtest environments, including up-to-date data affect delivery of softwaresolutions?""What factors affect performance testing on high data volumes?""How can a system for (semi) automated CRUD test data generationimprove delivery of software solutions?""Should we let loose Chaos Monkey, like Netflix?
4.1.5 EvaluatingQuality (EQ). This category included questionson code analysis, ways to assess quality of software code, andeffectiveness of testing practices."What methods can be applied to analyze whether software code isworking as expected?""To what extent does testability of software code affect the qualityof code?"
4.1.6 Customers and Requirements (CR). The essential questionsrelated to measure customer value, requirement validation, and theuse of formal models. Notably, questions relating to developmenttrade-offs such as backward compatibility or the impact of testingin production appeared in the Microsoft study but not ours."How to measure the customer value of a software product?""How can requirements be validated before starting actual softwaredevelopment?""How can user feedback be integrated in an efficient and effectiveway into software code?"
4.1.7 Software Development Lifecycle (SL). Questions in this cat-egory related to the effectiveness and performance in lead time,
ESEC/FSE ’20, November 8–13, 2020, Virtual Event, USA Hennie Huijgens, Ayushi Rastogi, Ernst Mulders, Georgios Gousios, and Arie van Deursen
Table 4: ING categories and questions mapped on to the 12 Microsoft categories
ING 2019 Study Microsoft 2014 Study
Category Cards Subcategories DescriptiveQuestions Cards Subcategories Descriptive
QuestionsDifference ING 2019 compared
to MS 2014Teams and Collaboration TC 14 4% 5 7 73 10% 7 11 ↓ 6%Testing Practices TP 32 9% 3 15 101 14% 5 20 ↓ 5%Services SVC 3 1% 2 1 42 6% 2 8 ↓ 5%Reuse and Shared Components RSC 5 1% 3 2 31 4% 1 3 ↓ 3%Customers and Requirements CR 9 3% 2 7 44 6% 5 9 ↓ 3%Software Development Lifecycle SL 6 2% 4 4 32 4% 3 7 ↓ 2%Development Practices DP 51 15% 14 38 117 16% 13 28 ↓ 1%Bug Measurements BUG 6 2% 3 5 23 3% 4 7 ↓ 1%Productivity PROD 29 9% 8 20 57 8% 5 13 ↑ 1%Evaluating Quality EQ 38 11% 6 11 47 6% 6 16 ↑ 5%Development Best Practices BEST 49 15% 7 36 65 9% 6 9 ↑ 6%Software Development Process PROC 46 14% 7 25 47 6% 3 14 ↑ 8%Discarded Cards 49 15% 49 7% ↑ 8%Total Cards 337 100% 64 171 728 100% 60 145
Table sorted on the percentage difference in the number of questions in the ING study compared to the Microsoft study.
Figure 2: Analysis of ING 2019 and MS 2014 questions.
cost, and quality (same as the Microsoft study) but also questionsrelating to security and risk from a management perspective."What factors affect providing new technologies to consumers, andcan implementations of new technology be internally and externallybenchmarked?""What factors affect estimation of lead time, cost, and quality ofsoftware deliveries?"
4.1.8 Software Development Process (PROC). Our questions relatedto development processes, technology selection, and deploymentof software solutions. At Microsoft, in contrast, questions relatedto the choice of software methodology (e.g. ways in which agile isbetter than waterfall? and benefits of pair programming). We alsonoticed that at ING topics like the effects of automated continuousdelivery pipeline popped up which were not seen in the Microsoftstudy."How can we improve the deployment process in DevOps teams?""Does a focus on quick release of features and bug fixes into pro-duction help to achieve confidence and agility?"
4.1.9 Productivity (PROD). This category had questions on theproductivity of DevOps teams - but also individual developers,ranked essential. Notably, questions related to the measurement ofindividual developers (e.g. the questionsmentioned below regarding"great coder" and "open spaces") were often ranked "Unwise". Quiteunlike the Microsoft study, where respondents considered thesequestions as unwise, engineers at ING had a mixed opinion.
"What factors affect the performance of DevOps teams and thequality of software code with regard to quantity and quality of envi-ronments?""Are developers working in an open space with several teams moreeffective or less than developers working in a room with just theirteam?""What makes a great coder? What aspects affect the performanceof DevOps teams and the quality of software with regard to charac-teristics of an individual software engineer?"
4.1.10 Teams and Collaborations (TC). Essential questions here aretypically about dependencies between teams, team composition,team maturity, and knowledge sharing among teams."To what extent do dependencies on other teams affect team perfor-mance?""How does team maturity affect code quality and incidents?""What factors affect the composition of DevOps teams?"
4.2 Top-Rated QuestionsTable 5 shows top 15 "Essential" and top 10 "Worthwhile or higher"questions. Interestingly, only two out of the top 15 “Essential” ques-tions were a part of the top 10 “Worthwhile or higher” questionsand none vice-versa. This potentially means that our participantsare more pronounced and opt for Essential or Worthwhile onlywhen they feel so. Culture can be another possible reason since allparticipants at ING are located in one country while participantsof the Microsoft study were more diverse [33].
Our top questions are on development processes, technologyselection, and deployment of software solutions. The top relatedquestions at Microsoft, in contrast, relates to the choice of softwaremethodology (e.g. ways in which agile is better than waterfall? andbenefits of pair programming). We also noticed that in our studytopics like the effects of automated continuous delivery pipelinepopped up which were not seen in the Microsoft study.
Notably, a large fraction of the top 20 "Essential" or "Worthwhileor higher" questions at Microsoft (9 out of 20; including top 2)relates to customers. This suggests that for Microsoft customerbenefit is most important or perhaps one of the most importantquestion. Our study, in contrast, paints a very different picture.

Questions for Data Scientists in Software Engineering: A Replication ESEC/FSE ’20, November 8–13, 2020, Virtual Event, USA
Table 5: Questions with the highest "Essential" and "Worthwhile or higher" percentages.
Percentages RankQuestion Category Essential Worthwhile+ Unwise Essential Worthwhile+ Unwise
³ Q143 What factors affect the performance and productivity of DevOps teamswith regard to team happiness and pleasure in your work?
DP 68.4% 94.7% 0.0% 1 9 68
⋆ Q98 How does on-demand provisoning of develop- and test environments, in-cluding up-to-date data affect delivery of software solutions?
TP 66,7% 77,8% 0,0% 2 95 68
⋆ Q37 How can we make sure that we build for reusability and scalability? BEST 63.2% 89.5% 5.3% 3 42 63³ Q145 What factors affect the performance of DevOps teams and the quality of
software code with regard to quantity and quality of environments?PROD 60.0% 100.0% 0.0% 4 1 68
³ Q114 What factors affect High Performance Teams? BEST 58.8% 82.4% 0.0% 5 75 68⋆ Q154 What factors affect understandability and readability of software code for
other developers?DP 58.3% 91.7% 8.3% 6 25 44
³ Q76 How can we improve the deployment process in DevOps teams? PROC 56.3% 93.8% 0.0% 7 15 68⋆ Q36 How does the effort spend on fixing vulnerabilities and bugs relate to effort
spend on writing software correctly from the start?BUG 56.3% 93.8% 0.0% 7 15 68
³ Q53 How does a continuous delivery pipeline with automated testing and mi-grating, including rollback facilities affect the performance of DevOps teamsand the quality of software?
PROC 56.3% 93.8% 0.0% 7 15 68
⋆ Q22 How can requirements be validated before starting actual software devel-opment?
CR 55.6% 88.9% 0.0% 10 44 68
⋆ Q123 What factors affect performance testing on high data volumes? TP 55.6% 88.9% 0.0% 10 44 68g Q58 How to measure the customer value of a software product? CR 55.6% 77.8% 11.1% 10 95 20
⋆ Q88 To what extent does testability affect the quality of software code? EQ 52.9% 100.0% 0.0% 14 1 68³ Q67 To what extent do automated checks of coding conventions, code quality,
code complexity, and test-coverage affect the quality of software systemsand the performance of DevOps teams?
EQ 47.1% 100.0% 0.0% 25 1 68
⋆ Q11 How can a system for (semi) automated CRUD test data generation improvedelivery of software solutions?
TP 44.4% 100.0% 0.0% 32 1 68
³ Q104 What aspects affect the performance of DevOps teams and the quality ofsoftware with regard to software architecture?
PROD 40.0% 100.0% 0.0% 44 1 68
⋆ Q19 How can editors help software developers to document their public func-tions in a way that it is available for other developers?
CR 33.3% 100.0% 0.0% 73 1 68
⋆ Q122 What factors affect maintainability of software systems? EQ 33.3% 100.0% 0.0% 73 1 68⋆ Q80 How do automated controls within the continuous delivery pipeline affect
the effort spent on risk and security?DP 50.0% 95.0% 0.0% 15 8 68
Table is sorted on Rank Essential. The icon g indicates customer related questions,³ indicates questions that focus on the engineer and the effects of software developmentpractices and processes on her work, and ⋆ indicates quality related questions.
Only two out of the 336 questions in the initial survey mentionedthe word "customer" and only one of those questions made it tothe top-20 (Q58 "How to measure the customer value of a softwareproduct" at rank 10 "Essential"). This question is, in line with theMicrosoft study, marked with icon g, in Table 5.
Another eight "Essential" or "Worthwhile or higher" questions intheMicrosoft study (marked with icon³) focus on the engineer andthe effects of software development practices and processes on herwork. In our study, we identified nine questions with this icon. Inaddition to the focus on individual engineer, many of the questionsin our study relates to the concept of the DevOps team. Overall,it seems that Microsoft has a big focus on customer while INGemphasizes on the engineering team itself. Finally, seven questionsin the Microsoft study (marked with the icon⋆) were about quality-related issues (same as ours with eleven questions).
4.3 Bottom-Rated QuestionsTable 6 shows the top 10 unwise questions. The most "Unwise"question (Q27) at ING is the use of domain-specific language foruse by non-experts. In the Microsoft study, the top five "Unwise"questions were all about a fear that respondents had of being rated.This effect can be seen in our study too (two of the top ten unwisequestions - Q161 and Q30 - relate to measuring the performance of
individual engineers), but not nearly as strongly as in the Microsoftstudy. Respondents in our study are torn on this topic; Q161 andQ30 are ranked as "Unwise" by respectively 22.2% and 20.0% ofthe respondents, but also ranked as "Essential" by another groupof 44.4% and 40.0% of the respondents. Also, it was interesting tosee that measuring and benchmarking time to market of softwaresolutions (Q38) is one of the top 10 unwise questions. It indicates re-sistance against comparing departments based on key performanceindicators like the time to market.
4.4 Rating by DemographicsTable 7 shows essential questions for different disciplines (Devel-oper, Tester, Project Management) and roles (Manager, IndividualContributor, Architect). The complete inventory of questions for"Worthwhile or higher" and "Unwise" responses is present in theappendix.
4.4.1 Discipline. Microsoft study showed tester as a specific disci-pline mainly interested in test suites, bugs, and product quality. Wedo not see the discipline "tester" in our study. This can be seen inTable 7 in which overall scores relating to "Test" are low and high-est for "Development". Software engineers in the DevOps teams atING consider themselves to be generic developers, and testing is anintegrated part of the discipline "developer". Both developers and

ESEC/FSE ’20, November 8–13, 2020, Virtual Event, USA Hennie Huijgens, Ayushi Rastogi, Ernst Mulders, Georgios Gousios, and Arie van Deursen
Table 6: Questions with the highest "Unwise" percentages (opposition).
Percentages RankQuestion Category Essential Worthwhile+ Unwise Essential Worthwhile+ Unwise
Q27 How can software solutions in one common language be developed in a waythat it is applicable to every person, regardless of ones interest in softwaredevelopment?
CR 22.2% 55.6% 33.3% 121 152 1
Q39 How can Windows-server images be created in order to facilitate testing withina continuous delivery pipeline?
DP 9.1% 45.5% 27.3% 162 163 2
Q170 Why do many developers focus on the newest of the newest? Why don’t theyleave this to a small group in order to use time and effort more efficiently?
DP 21.1% 47.4% 26.3% 128 161 3
Q161 What makes a great coder? What aspects affect the performance of DevOpsteams and the quality of software with regard to characteristics of an individualsoftware engineer?
PROD 44.4% 66.7% 22.2% 32 128 4
Q134 What factors affect TFS (Team Foundation Services) - a Microsoft product thatprovides source code management - with regard to working with automatedpipelines?
BEST 38.9% 72.2% 22.2% 54 118 4
Q30 How can the performance of individual software engineers be benchmarkedinternally ING and externally with other companies?
PROD 40.0% 50.0% 20.0% 44 157 6
Q77 To what extent does changing of requirements during development affect thedelivery of software solutions?
PROC 12.5% 68.8% 18.8% 150 124 7
Q21 How can PL1 software code be converted to Cobol code, while maintainingreadability of the code in order to simplify an application environment?
BEST 18.2% 36.4% 18.2% 140 169 8
Q38 How can we measure the time to market of software solutions delivered withina department at ING in order to benchmark the performance of that departmentagainst others.
DP 9.1% 54.5% 18.2% 162 155 8
Q149 What factors affect the use of machine learning in software development overa period of ten years?
DP 16.7% 66.7% 16.7% 143 128 10
Q28 How can the cost of data be identified, in order to sign a price tag to data? DP 5.6% 50.0% 16.7% 168 157 10
Table is sorted on Rank Unwise.
Table 7: Statistically significant rating differences for the response "Essential" by professional background.
DisciplineQuestion Category Response Dev Test PM
Q2 Are there practices of good software teams from the perspective of releasing software solutionsinto production?
PROC Essential 66.7% 5.6 % 11.1%
Q21 How can PL1 software code be converted to Cobol code, while maintaining readability of thecode in order to simplify an application environment?
BEST Essential 66.7% 4.8 % 0.0%
Q28 How can the cost of data be identified, in order to sign a price tag to data? DP Essential 72.7% 0.0 % 0.0%Q46 How do static code analysis tools such as Fortify and Sonar influence the quality of software
engineering products?BEST Essential 36.6% 0.0 % 27.3%
Q88 To what extent does testability affect the quality of software code? EQ Essential 68.4% 0.0 % 0.0%Q89 How does time spent - in terms of full-time versus part-time - of a Scrum master affect the
delivery of software solutions?PROC Essential 66.7% 5.6 % 11.1%
Q95 To what extent do dependencies on other teams affect team performance? TC Essential 68.4% 0.0 % 0.0%Q97 How does documentation during software maintenance affect delivery of software solutions? TP Essential 50.0% 0.0 % 0.0%Q110 What factors affect data analytics with regard to the use of external sources - such as market
research reports and follow market trends - and let individual teams handle their localevolution?
PROC Essential 66.7% 5.6 % 11.1%
Q162 What methods are most effective in preventing security related vulnerabilities or bugs frombeing introduced in software code?
BUG Essential 68.4% 0.0 % 0.0%
Current RoleQuestion Category Response Manager Individual Architect
Q2 Are there practices of good software teams from the perspective of releasing software solutionsinto production?
PROC Essential 41.4% 44.8 % 6.9%
Q46 How do static code analysis tools such as Fortify and Sonar influence the quality of softwareengineering products?
BEST Essential 69.2% 15.4 % 0.0%
Q97 How does documentation during software maintenance affect delivery of software solutions? TP Essential 10.0% 60.0 % 20.0%Q153 What factors affect trunk-based development - a source-control branching model, where
developers collaborate on code in a single branch - with regard to quality of software code?BEST Essential 22.6% 54.8 % 9.7%
The professional background with the highest rating is highlighted in bold. Questions that are also in Table 5 are shown in italics. The role "Manager" includes the responses for"Manager" and "Lead".
testers are for example significantly interested in the testability ofsoftware code, and the quality of software related to an agile way
of working and working in DevOps teams. Other findings relate todevelopers being significantly interested in team performance, e.g.

Questions for Data Scientists in Software Engineering: A Replication ESEC/FSE ’20, November 8–13, 2020, Virtual Event, USA
regarding practices of good software teams from the perspectiveof releasing software into production, the use of data analytics toimprove individual teams, and dependencies on other teams.
4.4.2 Role. More individual contributors (e.g. developers) thanmanagers are interested in good practices for software teams torelease software into production. More managers than individualcontributors, on the other hand, are interested in how software canhelp realize new policies and changes in the way of working, therelationship between documentation and maintenance of software,and to what extent the use of static code analysis tools such asFortify and Sonar can affect the quality of software.
4.5 Comparing ING and Microsoft QuestionsA comparison of the top 15 words from each company (see Table 8)shows that a majority of the popular themes are the same (e.g.,code, test, software, and quality). Subtle differences, however, existrelating to rank (words in italics do not make it to top-15 in an-other company) and to the usage of a word in the other company(underlined).
A subset of these differences can be attributed to differencesin terminology. For instance, Microsoft uses terms like employ-ee/employees and team/teams, while their equivalents at ING areteam/squad and engineer. Apart from this, Microsoft questions fo-cused more on bugs, cost, time, customers, and tools while INGemployees talked about version, problem, systems, process, andimpact.
Next, we inferred 24 themes from the clusters in the affinitydiagram organically merging into three broad categories: relatingto code (like understanding code, testing, quality), developers (indi-vidual and team productivity) and customers (note that while cus-tomers did not make it to the top-10 essential questions, they wereimportant in the top-100). The 24 themes are automated testing,testing, understanding code, documentation, formal methods, codereview, debugging, risk, refactoring, deployment, bug fixing, legacy,software quality, requirement, release, cloud, customer, estimation,team productivity, employer productivity, cost, team awareness,
Table 8: Top 15 words from questions at ING and Microsoft
Microsoft 2014 ING 2019Word Count Word Count
code / coding 48 (19%) testing / debugging 92 (14%)test / tests / testing 39 (16%) code / coding 87 (13%)software 31 (13%) software 76 (11%)employee / employees 16 (6%) team / squad 72 (11%)quality 13 (5%) development 62 (9%)bugs 13 (5%) version / library 39 (6%)development 12 (5%) data 37 (6%)cost 11 (4%) incident, issue, problem 36 (5%)team / teams 11 (4%) security / risk 34 (5%)time 10 (4%) system / systems 34 (5%)customer / customers 9 (4%) quality 34 (5%)impact 9 (4%) production 21 (3%)productivity 9 (4%) engineer 14 (2%)project 9 (4%) process 14 (2%)tools 7 (3%) impact 13 (2%)
Top 15 words (sorted on count) from Microsoft 2014 and ING 2019 study. Words in thetop-15 of one company and not the other are printed in italic. Words in one list and notthe other are underlined.
and agile working. Investigating each theme and category in detail,we noticed that despite minor differences in the individual ques-tions (some questions are broad in one company and specific inanother), largely the key questions remain the same. For instance,employees at both the companies find questions relating to teamproductivity and employee productivity important, and yet assess-ing and comparing individual employees is undesirable. There were,however, subtle differences. For instance, in the Microsoft study, wenoticed a few questions eliciting the need for agile (vs. waterfall)as well as automated testing. In the ING study, however, we donot see such questions. Rather, we see questions relating to thefunctional aspects of agile and automated testing. Another subtledifference between the two companies is relating to code size. Whilenot stated explicitly, from the nature of questions, it seems that thesoftware teams at Microsoft are dealing with a large legacy code-base. This was reflected in questions relating to team awareness,code monitoring, backward compatibility, and refactoring. Suchquestions, however, did not occur in ING. Other than the above,we saw cloud-related questions appearing in the Microsoft studyonly, while deployment-related questions appeared in ING only.In a nutshell, the core software development challenges of INGare consistent with Microsoft. There are although some nuanceddifferences which relate to the evolution of software market in thelast five years as well as differences in the characteristics of the twocompanies.
5 DISCUSSIONIn this section, we discuss potential explanations for the differencesin the list of questions found in our study compared to the Microsoftstudy. We saw questions eliciting the need of agile methods in theMicrosoft study while at ING the questions related to functionalaspects. Our hypothesis here is that in the last five years there hasbeen a change in the market: while in 2014, the questions on theadoption of agile and automated testing were common, in 2019agile and automated testing became the norm.
We noticed that many questions at Microsoft deal with the scaleof legacy code while no such question appeared at ING. One poten-tial explanation for the observation can be that software systems atING are not of the same scale as Microsoft. Nonetheless, it remainsa lesson that in the next 10 years, ING can also be dealing with thecomplexity of large code base as Microsoft is experiencing today.
Finally, some questions appeared in only one organization. Webelieve that these observations have something to do with the indi-vidual practices followed at Microsoft and ING. The deployment-related questions at ING might be a result of the adoption of contin-uous delivery as a service. Surprisingly, we did not see any finance-related questions in the ING study. ING is a finance-based companyand we expected to see some issues relating to both finance andsoftware appear. We noticed that employees often talked aboutsecurity, but no real finance-related questions appear. One expla-nation for this observation can be that the data science challengesrelating to software development are independent of the actualfield to which it is applied. Supporting this argument, 145 questionsfrom Microsoft also did not bring up any product specific details.Another potential explanation can be that through our question

ESEC/FSE ’20, November 8–13, 2020, Virtual Event, USA Hennie Huijgens, Ayushi Rastogi, Ernst Mulders, Georgios Gousios, and Arie van Deursen
we anchored our respondents into asking software developmentrelated questions only.
5.1 ImplicationsOne of the key findings of this paper is a list of 171 questionsthat software engineers in a large, software-driven organizationwould like to see answered, in order to optimize their softwaredevelopment activities. From this, we see implications both in termsof practice and industry.
From a practical perspective, our study offers a new way ofthinking to software development organizations who care abouttheir development processes. The questions originally raised byMicrosoft are not just relevant to one of the largest tech compa-nies in the world, but also to large software-defined enterprisesactive outside the tech-sector proper. Inspired by these questions,an organization may select the most relevant ones, and seek waysto address them. While some questions are fundamentally hardto answer, organizations can make a starting point by collectingrelevant data about their development processes. This, then, canhelp to make the development process itself more and more data-driven. This is exactly how ING intends to use the questions, andwe believe companies around the world can follow suit.
From a research perspective, we have seen that the originalMicrosoft study has generated a series of papers that apply someform of Machine Learning to address the challenges raised in thatstudy. In the research community, AI-for-Software-Engineering isan increasingly important topic, with many papers appearing thatseek to apply machine learning to address software engineeringproblems. Our study aims to add urgency and direction to thisemerging field, by highlighting not just which questions can beanswered, but which ones should be answered, from a practitionerperspective.
5.2 Threats to ValidityWhile our study expands the external validity of the original study,the fact remains that the two lists of questions are based on just twocompanies, which are both large organizations with over 10,000software developers. Our study highlights relevance to the FinTechsector, but it would be interesting to see further replications, forexample in the automotive or health care sector, with differentregulatory and additional safety constraints. We expect that manyof the questions are also relevant to smaller organizations, especiallygiven the agile way of working at ING. Nevertheless, it will beworthwhile to further explore this.
From a perspective of internal validity, creating codes indepen-dent of the prior study is challenging. It is possible that the similar-ities and differences seen compared to the Microsoft study relatesto factors (e.g. researcher bias) other than the actual data. We triedmitigating it by limiting our exposure to the previous study, notinvolving authors from the Microsoft study, and multiple authorsgenerating codes independently. Nonetheless, these biases are likelyto exist.
For reasons of replication, we have used where possible the samesurvey questions, method of analysis and division into work areaand discipline as in the Microsoft study [6]. Apart from positive ef-fects, this choice also had a negative effect with regard to analysis of
demographics, mainly due to the fact that ING uses a different wayof working, including corresponding roles and team structure, thanwithin Microsoft. Especially mapping the professional background"Discipline" of the original study on the demographic "Discipline"as applied within ING was challenging.
ING works with DevOps teams, where an engineer fulfills boththe area of developer and that of tester. As a result, testers wereunder-represented in both of the surveys we conducted. As a mit-igation measure we therefore opted for combining the results ofdevelopers and testers in the further analysis.
Another potential threat is sensitivity of the ranks which mostlyoccurs at the extreme sides of the ranking, when, e.g., none of theparticipants label a question as ‘Unwise’. In our study, on aver-age each question received 21, 888/177 = 123 ratings and hencesensitivity of ranks is unlikely.
The presented results are free from corporate influence includ-ing Microsoft. A number of stakeholders at ING (CIO, CorporateCommunications) reviewed the submitted paper and approved itwithout any changes. Nevertheless, self-censorship by the authorsremains a potential threat. Furthermore, researchers may have theirbiases which can potentially influence the results.
As also emphasized in related work on replications [76] [67][35] [42] [56] [25], our study seeks to replicate earlier findings in adifferent context (e.g. other companies) and during a different time(environments and perceptions of engineers do change over time).In order to facilitate future replication of our study, we make thetotal set of descriptive questions and additional info on results ofour tests available in our technical report.
6 CONCLUSIONConducted at ING—a software-defined enterprise providing bank-ing solutions—this study presents 171 questions that software engi-neers at ING would like data scientists to answer. This study is areplication of a similar study at software company Microsoft, whichresulted in 145 questions for data scientists. Further, we went a stepbeyond to investigate the applicability of Microsoft’s questions inING, as well as changes in trends over the last five years.
We compared the two lists of questions and found that the coresoftware development challenges (relating to code, developer, andcustomer) remain the same. Nonetheless, we observed subtle differ-ences relating to the technology and software process developments(e.g., currently the debate about agile versus waterfall is now largelyabsent) and differences in the two organizations (e.g., Microsoft’sfocus on solving problems with a large code bases and ING’s chal-lenges with continuous deployment). We complete our analysiswith a report on the impact Microsoft 2014 study generated, alsoindicating the impact that our study is capable to generate.
A thorough understanding of key questions software engineershave that can be answered by data scientists is of crucial importanceto both the research community and modern software engineeringpractice. Our study aims to contribute to this understanding.We callon other companies, large and small, to conduct a similar analysis,in order to transform a software engineering into a data-drivenendeavour addressing the most pressing questions.

Questions for Data Scientists in Software Engineering: A Replication ESEC/FSE ’20, November 8–13, 2020, Virtual Event, USA
ACKNOWLEDGMENTSThe authors thank ING and all participating engineers for sharingtheir experience and views with us. We thank the authors of theoriginal Microsoft study for the permission to reuse their researchdesign figure.
REFERENCES[1] Saleema Amershi, Andrew Begel, Christian Bird, Robert DeLine, Harald Gall, Ece
Kamar, Nachiappan Nagappan, Besmira Nushi, and Thomas Zimmermann. 2019.Software engineering for machine learning: A case study. In 2019 IEEE/ACM 41stInternational Conference on Software Engineering: Software Engineering in Practice(ICSE-SEIP). IEEE, 291–300.
[2] Oana Andrei, Muffy Calder, Matthew Chalmers, Alistair Morrison, and MattiasRost. 2016. Probabilistic formal analysis of app usage to inform redesign. InInternational Conference on Integrated Formal Methods. Springer, 115–129.
[3] Timothy Arndt. 2018. Big Data and software engineering: prospects for mutualenrichment. Iran Journal of Computer Science 1, 1 (2018), 3–10.
[4] Ali Basiri, Lorin Hochstein, Nora Jones, and Haley Tucker. 2019. Automatingchaos experiments in production. Proceedings of the 41st ACM/IEEE InternationalConference on Software Engineering (ICSE) (2019).
[5] Andrea Batch and Niklas Elmqvist. 2017. The interactive visualization gap ininitial exploratory data analysis. IEEE transactions on visualization and computergraphics 24, 1 (2017), 278–287.
[6] Andrew Begel and Thomas Zimmermann. 2014. Analyze This! 145 Questions forData Scientists in Software Engineering. In Proceedings of the 36th InternationalConference on Software Engineering (ICSE 2014). ACM, New York, NY, USA, 12–23.https://doi.org/10.1145/2568225.2568233
[7] Moritz Beller, Georgios Gousios, Annibale Panichella, Sebastian Proksch, SvenAmann, and Andy Zaidman. 2017. Developer testing in the ide: Patterns, beliefs,and behavior. IEEE Transactions on Software Engineering 45, 3 (2017), 261–284.
[8] Moritz Beller, Georgios Gousios, Annibale Panichella, and Andy Zaidman. 2015.When, how, and why developers (do not) test in their IDEs. In Proceedings of the2015 10th Joint Meeting on Foundations of Software Engineering. ACM, 179–190.
[9] Moritz Beller, Georgios Gousios, and Andy Zaidman. 2015. How (much) dodevelopers test?. In 2015 IEEE/ACM 37th IEEE International Conference on SoftwareEngineering, Vol. 2. IEEE, 559–562.
[10] Christian Bird, Tim Menzies, and Thomas Zimmermann. 2015. Chapter 1 -Past, Present, and Future of Analyzing Software Data. In The Art and Science ofAnalyzing Software Data, Christian Bird, TimMenzies, and Thomas Zimmermann(Eds.). Morgan Kaufmann, Boston, 1 – 13. https://doi.org/10.1016/B978-0-12-411519-4.00001-X
[11] Bruno Cartaxo, Gustavo Pinto, and Sergio Soares. 2018. The role of rapid reviewsin supporting decision-making in software engineering practice. In Proceedingsof the 22nd International Conference on Evaluation and Assessment in SoftwareEngineering 2018. 24–34.
[12] Jeffrey C Carver, Oscar Dieste, Nicholas A Kraft, David Lo, and Thomas Zim-mermann. 2016. How practitioners perceive the relevance of esem research. InProceedings of the 10th ACM/IEEE International Symposium on Empirical SoftwareEngineering and Measurement. ACM, 56.
[13] Di Chen, Wei Fu, Rahul Krishna, and Tim Menzies. 2018. Applications of psy-chological science for actionable analytics. In Proceedings of the 2018 26th ACMJoint Meeting on European Software Engineering Conference and Symposium onthe Foundations of Software Engineering. 456–467.
[14] Jacek Dąbrowski, Emmanuel Letier, Anna Perini, and Angelo Susi. 2019. Findingand analyzing app reviews related to specific features: A research preview. InInternational Working Conference on Requirements Engineering: Foundation forSoftware Quality. Springer, 183–189.
[15] Boonyarit Deewattananon and Usa Sammapun. 2017. Analyzing user reviews inThai language toward aspects in mobile applications. In 2017 14th InternationalJoint Conference on Computer Science and Software Engineering (JCSSE). IEEE,1–6.
[16] Paul Denny, Brett A Becker,Michelle Craig, GregWilson, and Piotr Banaszkiewicz.2019. Research This! Questions That Computing Educators Most Want Comput-ing Education Researchers to Answer. In Proceedings of the 2019 ACM Conferenceon International Computing Education Research. 259–267.
[17] P. Devanbu, T. Zimmermann, and C. Bird. 2016. Belief Evidence in EmpiricalSoftware Engineering. In 2016 IEEE/ACM 38th International Conference on SoftwareEngineering (ICSE). 108–119. https://doi.org/10.1145/2884781.2884812
[18] Denae Ford and Chris Parnin. 2015. Exploring causes of frustration for softwaredevelopers. In 2015 IEEE/ACM 8th International Workshop on Cooperative andHuman Aspects of Software Engineering. IEEE, 115–116.
[19] Denae Ford, Justin Smith, Philip J Guo, and Chris Parnin. 2016. Paradise un-plugged: Identifying barriers for female participation on stack overflow. In Pro-ceedings of the 2016 24th ACM SIGSOFT International Symposium on Foundationsof Software Engineering. 846–857.
[20] Wei Fu and Tim Menzies. 2017. Easy over hard: A case study on deep learning. InProceedings of the 2017 11th joint meeting on foundations of software engineering.49–60.
[21] Vahid Garousi, Ahmet Coşkunçay, Aysu Betin-Can, and Onur Demirörs. 2015.A survey of software engineering practices in Turkey. Journal of Systems andSoftware 108 (2015), 148–177.
[22] Vahid Garousi and Michael Felderer. 2017. Worlds apart: industrial and academicfocus areas in software testing. IEEE Software 34, 5 (2017), 38–45.
[23] Vahid Garousi and Kadir Herkiloglu. 2016. Selecting the right topics for industry-academia collaborations in software testing: an experience report. In 2016 IEEEInternational Conference on Software Testing, Verification and Validation (ICST).IEEE, 213–222.
[24] Daniel German, Gregorio Robles, Germán Poo-Caamaño, Xin Yang, Hajimu Iida,and Katsuro Inoue. 2018. " Was My Contribution Fairly Reviewed?" A Frameworkto Study the Perception of Fairness in Modern Code Reviews. In 2018 IEEE/ACM40th International Conference on Software Engineering (ICSE). IEEE, 523–534.
[25] Omar S. Gómez, Natalia Juristo, and Sira Vegas. 2014. Understanding replicationof experiments in software engineering: A classification. Information and SoftwareTechnology 56, 8 (2014), 1033 – 1048. https://doi.org/10.1016/j.infsof.2014.04.004
[26] Georgios Gousios, Dominik Safaric, and Joost Visser. 2016. Streaming softwareanalytics. In 2016 IEEE/ACM 2nd International Workshop on Big Data SoftwareEngineering (BIGDSE). IEEE, 8–11.
[27] Xiaodong Gu and Sunghun Kim. 2015. " What Parts of Your Apps are Lovedby Users?"(T). In 2015 30th IEEE/ACM International Conference on AutomatedSoftware Engineering (ASE). IEEE, 760–770.
[28] Monika Gupta, Ashish Sureka, Srinivas Padmanabhuni, and Allahbaksh Mo-hammedali Asadullah. 2015. Identifying Software Process Management Chal-lenges: Survey of Practitioners in a Large Global IT Company. In Proceedingsof the 12th Working Conference on Mining Software Repositories (MSR ’15). IEEEPress, Piscataway, NJ, USA, 346–356.
[29] Emitza Guzman, Muhammad El-Haliby, and Bernd Bruegge. 2015. Ensemblemethods for app review classification: An approach for software evolution (n). In2015 30th IEEE/ACM International Conference on Automated Software Engineering(ASE). IEEE, 771–776.
[30] Sebastian Hahn, Matthias Trapp, Nikolai Wuttke, and Jürgen Döllner. 2015.Thread City: Combined Visualization of Structure and Activity for the Explo-ration of Multi-threaded Software Systems. In 2015 19th International Conferenceon Information Visualisation. IEEE, 101–106.
[31] Ahmed E Hassan and Tao Xie. 2010. Software intelligence: the future of miningsoftware engineering data. In Proceedings of the FSE/SDP workshop on Future ofsoftware engineering research. ACM, 161–166.
[32] Michael Hilton, Nicholas Nelson, Hugh McDonald, Sean McDonald, Ron Metoyer,and Danny Dig. 2016. Tddviz: Using software changes to understand confor-mance to test driven development. In International Conference on Agile SoftwareDevelopment. Springer, Cham, 53–65.
[33] Geert Hofstede and Michael H. Bond. 1984. Hofstede’s Culture Dimensions: AnIndependent Validation Using Rokeach’s Value Survey. Journal of Cross-CulturalPsychology 15, 4 (1984), 417–433. https://doi.org/10.1177/0022002184015004003arXiv:https://doi.org/10.1177/0022002184015004003
[34] Yury Izrailevsky and Ariel Tseitlin. 2011. The Netflix Simian Army. NetflixTechnology Blog (2011). https://medium.com/netflix-techblog/the-netflix-simian-army-16e57fbab116
[35] Natalia Juristo and Omar S. Gómez. 2012. Replication of Software EngineeringExperiments. Springer Berlin Heidelberg, Berlin, Heidelberg, 60–88. https://doi.org/10.1007/978-3-642-25231-0-2
[36] Shaikh Jeeshan Kabeer, Maleknaz Nayebi, Guenther Ruhe, Chris Carlson, andFrancis Chew. 2017. Predicting the vector impact of change-an industrial casestudy at brightsquid. In 2017 ACM/IEEE International Symposium on EmpiricalSoftware Engineering and Measurement (ESEM). IEEE, 131–140.
[37] Verena Käfer. 2017. Summarizing software engineering communication artifactsfrom different sources. In Proceedings of the 2017 11th Joint Meeting on Foundationsof Software Engineering. 1038–1041.
[38] Noriaki Kano, Nobuhiko Seraku, Fumio Takahashi, and Shin ichi Tsuji. 1984.Attractive Quality and Must-Be Quality. Journal of the Japanese Society forQuality Control 14 (1984), 39–48.
[39] Foutse Khomh, Bram Adams, Jinghui Cheng, Marios Fokaefs, and Giuliano Anto-niol. 2018. Software engineering for machine-learning applications: The roadahead. IEEE Software 35, 5 (2018), 81–84.
[40] Miryung Kim, Thomas Zimmermann, Robert DeLine, and Andrew Begel. 2016.The Emerging Role of Data Scientists on Software Development Teams. In Pro-ceedings of the 38th International Conference on Software Engineering (ICSE ’16).ACM, New York, NY, USA, 96–107. https://doi.org/10.1145/2884781.2884783
[41] Miryung Kim, Thomas Zimmermann, Robert DeLine, and Andrew Begel. 2016.The emerging role of data scientists on software development teams. In Proceed-ings of the 38th International Conference on Software Engineering. ACM, 96–107.
[42] Barbara Kitchenham. 2008. The role of replications in empirical software engi-neering - a word of warning. Empirical Software Engineering 13, 2 (2008), 219–221.https://doi.org/10.1007/s10664-008-9061-0

ESEC/FSE ’20, November 8–13, 2020, Virtual Event, USA Hennie Huijgens, Ayushi Rastogi, Ernst Mulders, Georgios Gousios, and Arie van Deursen
[43] B. Kitchenham and S. Pfleeger. 2008. Personal Opinion Surveys. Guide to AdvancedEmpirical Software Engineering (2008).
[44] Pavneet Singh Kochhar, Xin Xia, David Lo, and Shanping Li. 2016. Practitioners’expectations on automated fault localization. In Proceedings of the 25th Interna-tional Symposium on Software Testing and Analysis. ACM, 165–176.
[45] Oleksii Kononenko, Olga Baysal, and Michael W Godfrey. 2016. Code reviewquality: how developers see it. In 2016 IEEE/ACM 38th International Conferenceon Software Engineering (ICSE). IEEE, 1028–1038.
[46] Rahul Krishna. 2017. Learning effective changes for software projects. In 201732nd IEEE/ACM International Conference on Automated Software Engineering(ASE). IEEE, 1002–1005.
[47] Rahul Krishna and TimMenzies. 2018. Bellwethers: A baselinemethod for transferlearning. IEEE Transactions on Software Engineering 45, 11 (2018), 1081–1105.
[48] Philipp Leitner, Jürgen Cito, and Emanuel Stöckli. 2016. Modelling and managingdeployment costs of microservice-based cloud applications. In Proceedings of the9th International Conference on Utility and Cloud Computing. ACM, 165–174.
[49] Paul Luo Li, Andrew J Ko, and Jiamin Zhu. 2015. What makes a great soft-ware engineer?. In Proceedings of the 37th International Conference on SoftwareEngineering-Volume 1. IEEE Press, 700–710.
[50] David Lo, Nachiappan Nagappan, and Thomas Zimmermann. 2015. How practi-tioners perceive the relevance of software engineering research. In Proceedingsof the 2015 10th Joint Meeting on Foundations of Software Engineering. ACM,415–425.
[51] Cuauhtemoc Lopez-Martin, Arturo Chavoya, and Maria Elena Meda-Campaña.2014. A machine learning technique for predicting the productivity of practition-ers from individually developed software projects. In 15th IEEE/ACIS InternationalConference on Software Engineering, Artificial Intelligence, Networking and Paral-lel/Distributed Computing (SNPD). IEEE, 1–6.
[52] Lucy Ellen Lwakatare, Aiswarya Raj, Jan Bosch, Helena Holmström Olsson, andIvica Crnkovic. 2019. A taxonomy of software engineering challenges for machinelearning systems: An empirical investigation. In International Conference on AgileSoftware Development. Springer, 227–243.
[53] Björn Mathis, Vitalii Avdiienko, Ezekiel O Soremekun, Marcel Böhme, and An-dreas Zeller. 2017. Detecting information flow by mutating input data. In 201732nd IEEE/ACM International Conference on Automated Software Engineering(ASE). IEEE, 263–273.
[54] Tim Menzies, Ekrem Kocaguneli, Burak Turhan, Leandro Minku, and FayolaPeters. 2014. Sharing data and models in software engineering. Morgan Kaufmann.
[55] Tim Menzies and Thomas Zimmermann. 2018. Software Analytics: What’s Next?IEEE Software 35, 5 (2018), 64–70.
[56] James Miller. 2005. Replicating software engineering experiments: a poisonedchalice or the Holy Grail. Information and Software Technology 47, 4 (2005), 233 –244. https://doi.org/10.1016/j.infsof.2004.08.005
[57] Ayse Tosun Misirli, Hakan Erdogmus, Natalia Juristo, and Oscar Dieste. 2014.Topic selection in industry experiments. In Proceedings of the 2nd InternationalWorkshop on Conducting Empirical Studies in Industry. 25–30.
[58] Maleknaz Nayebi, Yuanfang Cai, Rick Kazman, Guenther Ruhe, Qiong Feng,Chris Carlson, and Francis Chew. 2019. A longitudinal study of identifying andpaying down architecture debt. In 2019 IEEE/ACM 41st International Conference onSoftware Engineering: Software Engineering in Practice (ICSE-SEIP). IEEE, 171–180.
[59] Maleknaz Nayebi, Konstantin Kuznetsov, Paul Chen, Andreas Zeller, and Guen-ther Ruhe. 2018. Anatomy of functionality deletion: an exploratory study onmobile apps. In Proceedings of the 15th International Conference onMining SoftwareRepositories. 243–253.
[60] Maleknaz Nayebi, Mahshid Marbouti, Rache Quapp, Frank Maurer, and GuentherRuhe. 2017. Crowdsourced exploration of mobile app features: A case study ofthe fort mcmurray wildfire. In 2017 IEEE/ACM 39th International Conference onSoftware Engineering: Software Engineering in Society Track (ICSE-SEIS). IEEE,57–66.
[61] Tobias Roehm. 2015. Two user perspectives in program comprehension: endusers and developer users. In 2015 IEEE 23rd International Conference on ProgramComprehension. IEEE, 129–139.
[62] Saurabh Sarkar and Chris Parnin. 2017. Characterizing and predicting mentalfatigue during programming tasks. In 2017 IEEE/ACM 2nd International Workshopon Emotion Awareness in Software Engineering (SEmotion). IEEE, 32–37.
[63] Anand Ashok Sawant, Romain Robbes, and Alberto Bacchelli. 2016. On thereaction to deprecation of 25,357 clients of 4+ 1 popular Java APIs. In 2016 IEEEInternational Conference on Software Maintenance and Evolution (ICSME). IEEE,400–410.
[64] Anand Ashok Sawant, Romain Robbes, and Alberto Bacchelli. 2018. On thereaction to deprecation of clients of 4+ 1 popular Java APIs and the JDK. EmpiricalSoftware Engineering 23, 4 (2018), 2158–2197.
[65] Gerald Schermann, Dominik Schöni, Philipp Leitner, and Harald C Gall. 2016.Bifrost: Supporting continuous deployment with automated enactment of multi-phase live testing strategies. In Proceedings of the 17th International MiddlewareConference. 1–14.
[66] Vibhu Saujanya Sharma, Rohit Mehra, and Vikrant Kaulgud. 2017. What do devel-opers want? an advisor approach for developer priorities. In 2017 IEEE/ACM 10thInternational Workshop on Cooperative and Human Aspects of Software Engineering(CHASE). IEEE, 78–81.
[67] Forrest J. Shull, Jeffrey C. Carver, Sira Vegas, and Natalia Juristo. 2008. The role ofreplications in Empirical Software Engineering. Empirical Software Engineering13, 2 (01 Apr 2008), 211–218. https://doi.org/10.1007/s10664-008-9060-1
[68] Margaret-Anne Storey, Alexey Zagalsky, Fernando Figueira Filho, Leif Singer,and Daniel M German. 2016. How social and communication channels shape andchallenge a participatory culture in software development. IEEE Transactions onSoftware Engineering 43, 2 (2016), 185–204.
[69] Sampo Suonsyrjä, Laura Hokkanen, Henri Terho, Kari Systä, and Tommi Mikko-nen. 2016. Post-deployment data: A recipe for satisfying knowledge needs insoftware development?. In 2016 Joint Conference of the International Workshop onSoftware Measurement and the International Conference on Software Process andProduct Measurement (IWSM-MENSURA). IEEE, 139–147.
[70] Sampo Suonsyrjä and Tommi Mikkonen. 2015. Designing an unobtrusive an-alytics framework for monitoring java applications. In Software Measurement.Springer, 160–175.
[71] Mohammadali Tavakoli, Liping Zhao, Atefeh Heydari, and Goran Nenadić. 2018.Extracting useful software development information from mobile applicationreviews: A survey of intelligent mining techniques and tools. Expert Systemswith Applications 113 (2018), 186–199.
[72] Ambika Tripathi, Savita Dabral, and Ashish Sureka. 2015. University-industrycollaboration and open source software (oss) dataset in mining software reposito-ries (msr) research. In 2015 IEEE 1st International Workshop on Software Analytics(SWAN). IEEE, 39–40.
[73] Carmine Vassallo, Fiorella Zampetti, Daniele Romano, Moritz Beller, AnnibalePanichella, Massimiliano Di Penta, and Andy Zaidman. 2016. Continuous deliverypractices in a large financial organization. In 2016 IEEE International Conferenceon Software Maintenance and Evolution (ICSME). IEEE, 519–528.
[74] Zhiyuan Wan, Xin Xia, Ahmed E Hassan, David Lo, Jianwei Yin, and XiaohuYang. 2018. Perceptions, expectations, and challenges in defect prediction. IEEETransactions on Software Engineering (2018).
[75] David Gray Widder, Michael Hilton, Christian Kästner, and Bogdan Vasilescu.2019. A conceptual replication of continuous integration pain points in thecontext of Travis CI. In Proceedings of the 2019 27th ACM JointMeeting on EuropeanSoftware Engineering Conference and Symposium on the Foundations of SoftwareEngineering. 647–658.
[76] Claes Wohlin. 2014. Guidelines for Snowballing in Systematic Literature Studiesand a Replication in Software Engineering. In Proceedings of the 18th InternationalConference on Evaluation and Assessment in Software Engineering (EASE ’14). ACM,NewYork, NY, USA, Article 38, 10 pages. https://doi.org/10.1145/2601248.2601268
[77] Fiorella Zampetti, Simone Scalabrino, Rocco Oliveto, Gerardo Canfora, and Mas-similiano Di Penta. 2017. How open source projects use static code analysistools in continuous integration pipelines. In 2017 IEEE/ACM 14th InternationalConference on Mining Software Repositories (MSR). IEEE, 334–344.
[78] Thomas Zimmermann. 2017. Software Productivity Decoded: How Data ScienceHelps to Achieve More (Keynote). In Proceedings of the 2017 International Confer-ence on Software and System Process (ICSSP 2017). ACM, New York, NY, USA, 1–2.https://doi.org/10.1145/3084100.3087674
[79] Weiqin Zou, David Lo, Zhenyu Chen, Xin Xia, Yang Feng, and Baowen Xu. 2018.How practitioners perceive automated bug report management techniques. IEEETransactions on Software Engineering (2018).
Questions for Data Scientists in Software Engineering: A Replication ESEC/FSE ’20, November 8–13, 2020, Virtual Event, USA
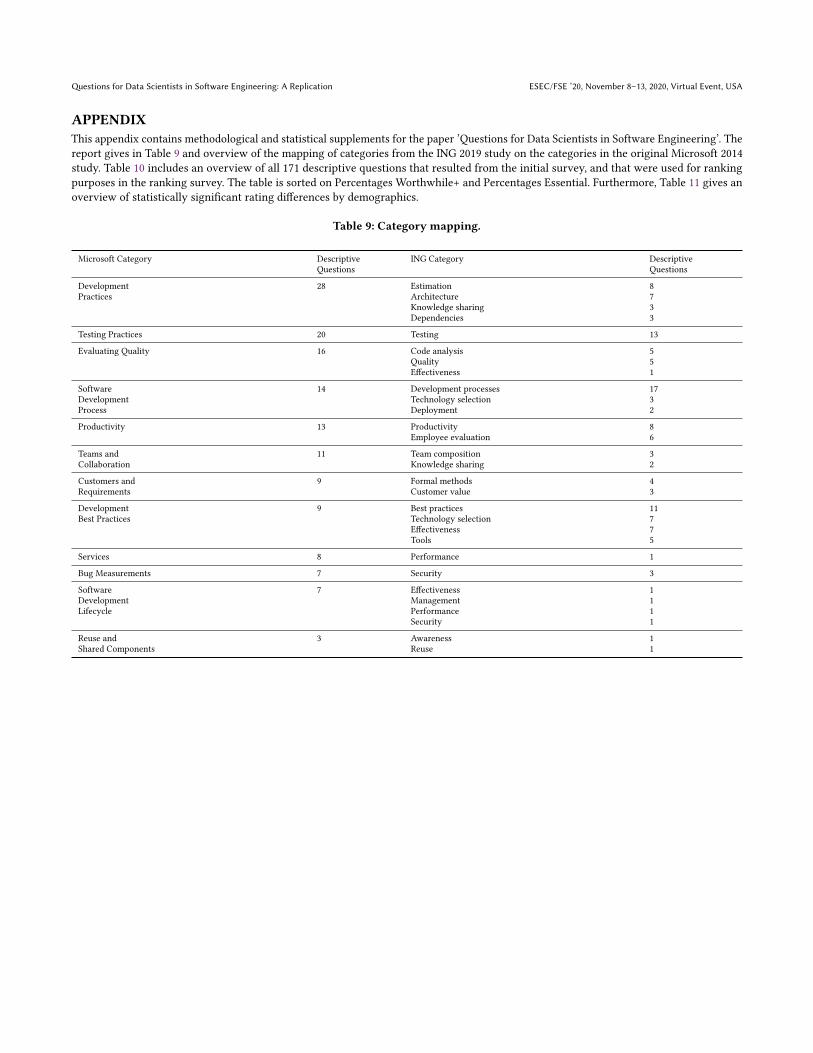
APPENDIXThis appendix contains methodological and statistical supplements for the paper ’Questions for Data Scientists in Software Engineering’. Thereport gives in Table 9 and overview of the mapping of categories from the ING 2019 study on the categories in the original Microsoft 2014study. Table 10 includes an overview of all 171 descriptive questions that resulted from the initial survey, and that were used for rankingpurposes in the ranking survey. The table is sorted on Percentages Worthwhile+ and Percentages Essential. Furthermore, Table 11 gives anoverview of statistically significant rating differences by demographics.
Table 9: Category mapping.
Microsoft Category Descriptive ING Category DescriptiveQuestions Questions
Development 28 Estimation 8Practices Architecture 7
Knowledge sharing 3Dependencies 3
Testing Practices 20 Testing 13
Evaluating Quality 16 Code analysis 5Quality 5Effectiveness 1
Software 14 Development processes 17Development Technology selection 3Process Deployment 2
Productivity 13 Productivity 8Employee evaluation 6
Teams and 11 Team composition 3Collaboration Knowledge sharing 2
Customers and 9 Formal methods 4Requirements Customer value 3
Development 9 Best practices 11Best Practices Technology selection 7
Effectiveness 7Tools 5
Services 8 Performance 1
Bug Measurements 7 Security 3
Software 7 Effectiveness 1Development Management 1Lifecycle Performance 1
Security 1
Reuse and 3 Awareness 1Shared Components Reuse 1

ESEC/FSE ’20, November 8–13, 2020, Virtual Event, USA Hennie Huijgens, Ayushi Rastogi, Ernst Mulders, Georgios Gousios, and Arie van Deursen
Table 10: Overview of all descriptive questions.
Percentages RankQuestion Category Essential Worthwhile+ Unwise Essential Worthwhile+ Unwise
Q143 What factors affect the performance and productivity of DevOpsteams with regard to team happiness and pleasure in your work?
DP 68.4% 94.7% 0.0% 1 9 68
Q98 To what extent does on-demand provisioning of develop- and testenvironments, including up-to-date data affect delivery of softwaresolutions?
TP 66.7% 77.8% 0.0% 2 95 68
Q37 How can we make sure that we build for re-usability and scalability? BEST 63.2% 89.5% 5.3% 3 42 63Q145 What factors affect the performance of DevOps teams and the quality
of software code with regard to quantity and quality of environments?PROD 60.0% 100.0% 0.0% 4 1 68
Q114 What factors affect High Performance Teams? BEST 58.8% 82.4% 0.0% 5 75 68
Q154 What factors affect understand-ability and readability of softwarecode for other developers?
DP 58.3% 91.7% 8.3% 6 25 44
Q76 To what extent affects building software solutions by using a continu-ous delivery pipeline with automated testing and migrating, includingrollback facilities the performance of DevOps teams and the qualityof software?
PROC 56.3% 93.8% 0.0% 7 15 68
Q36 How can we improve the deployment process in DevOps teams? PROC 56.3% 93.8% 0.0% 7 15 68Q53 How does the effort spent on fixing vulnerabilities and bugs relate to
effort spent on writing software correctly from the start?BUG 56.3% 93.8% 0.0% 7 15 68
Q22 How can requirements be validated before starting actual softwaredevelopment?
CR 55.6% 88.9% 0.0% 10 44 68
Q123 What factors affect performance testing on high data volumes? TP 55.6% 88.9% 0.0% 10 44 68Q58 How to measure the customer value of a software product? CR 55.6% 77.8% 11,1% 10 95 20Q163 What methods can be applied to analyze whether software code is
working as expected?EQ 53.3% 93.3% 0.0% 13 19 68
Q88 To what extent affects the test ability of software code the quality ofcode?
EQ 52.9% 100.0% 0.0% 14 1 68
Q80 To what extent affects implementing automated controls within thecontinuous delivery pipeline the effort spent on accountability withregard to risks and security?
DP 50.0% 95.0% 0.0% 15 8 68
Q125 What factors affect providing new technologies to consumers, andcan implementations of new technology be internally and externallybenchmarked?
SL 50.0% 90.0% 0.0% 15 30 68
Q109 What factors affect creating and maintaining software solutions your-self, versus using off-the-shelve solutions?
BEST 50.0% 90.0% 0.0% 15 30 68
Q34 How can user feedback be integrated in an efficient and effective wayinto software code?
CR 50.0% 87.5% 12.5% 15 56 15
Q1 Are developers working in an open space with several teams moreeffective or less than developers working in a room with just theirteam?
PROD 50.0% 83.3% 8.3% 15 73 44
Q140 What factors affect the level of competence - such as novice, advanced,competent - of software engineers in order to gain insight into tasks,time spent, and development goals per competence level.
DP 50.0% 75.0% 8.3% 15 106 44
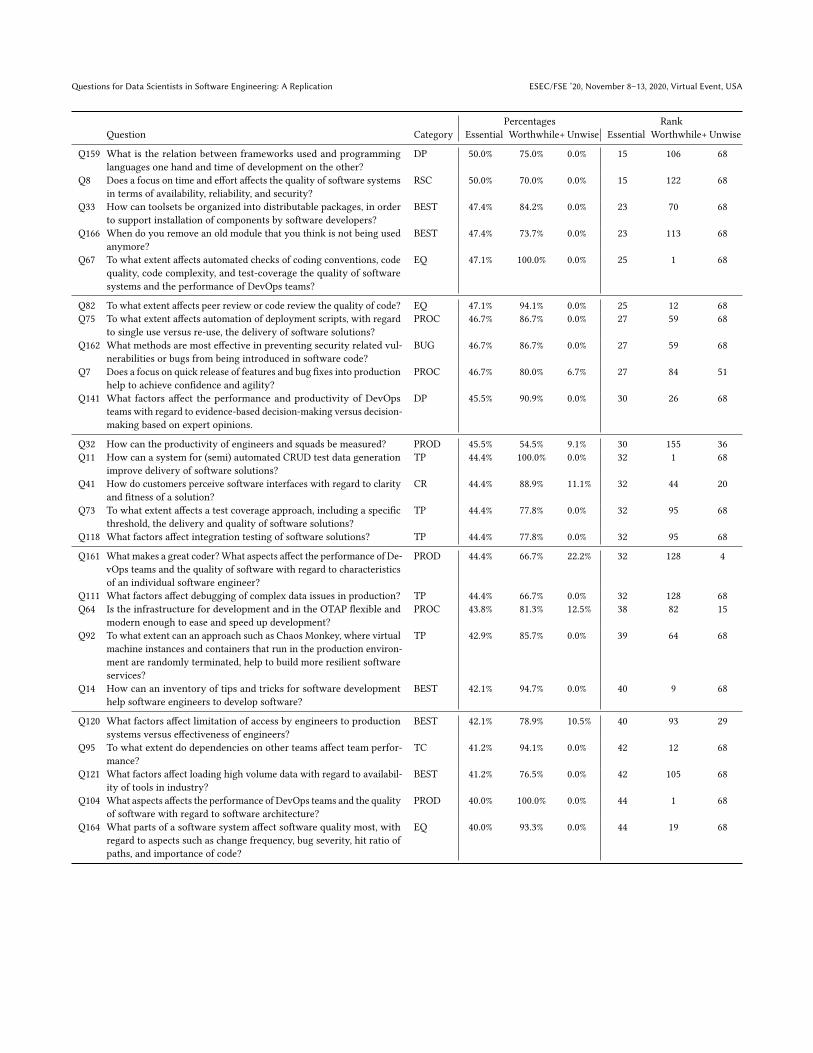
Questions for Data Scientists in Software Engineering: A Replication ESEC/FSE ’20, November 8–13, 2020, Virtual Event, USA
Percentages RankQuestion Category Essential Worthwhile+ Unwise Essential Worthwhile+ Unwise
Q159 What is the relation between frameworks used and programminglanguages one hand and time of development on the other?
DP 50.0% 75.0% 0.0% 15 106 68
Q8 Does a focus on time and effort affects the quality of software systemsin terms of availability, reliability, and security?
RSC 50.0% 70.0% 0.0% 15 122 68
Q33 How can toolsets be organized into distributable packages, in orderto support installation of components by software developers?
BEST 47.4% 84.2% 0.0% 23 70 68
Q166 When do you remove an old module that you think is not being usedanymore?
BEST 47.4% 73.7% 0.0% 23 113 68
Q67 To what extent affects automated checks of coding conventions, codequality, code complexity, and test-coverage the quality of softwaresystems and the performance of DevOps teams?
EQ 47.1% 100.0% 0.0% 25 1 68
Q82 To what extent affects peer review or code review the quality of code? EQ 47.1% 94.1% 0.0% 25 12 68Q75 To what extent affects automation of deployment scripts, with regard
to single use versus re-use, the delivery of software solutions?PROC 46.7% 86.7% 0.0% 27 59 68
Q162 What methods are most effective in preventing security related vul-nerabilities or bugs from being introduced in software code?
BUG 46.7% 86.7% 0.0% 27 59 68
Q7 Does a focus on quick release of features and bug fixes into productionhelp to achieve confidence and agility?
PROC 46.7% 80.0% 6.7% 27 84 51
Q141 What factors affect the performance and productivity of DevOpsteams with regard to evidence-based decision-making versus decision-making based on expert opinions.
DP 45.5% 90.9% 0.0% 30 26 68
Q32 How can the productivity of engineers and squads be measured? PROD 45.5% 54.5% 9.1% 30 155 36Q11 How can a system for (semi) automated CRUD test data generation
improve delivery of software solutions?TP 44.4% 100.0% 0.0% 32 1 68
Q41 How do customers perceive software interfaces with regard to clarityand fitness of a solution?
CR 44.4% 88.9% 11.1% 32 44 20
Q73 To what extent affects a test coverage approach, including a specificthreshold, the delivery and quality of software solutions?
TP 44.4% 77.8% 0.0% 32 95 68
Q118 What factors affect integration testing of software solutions? TP 44.4% 77.8% 0.0% 32 95 68
Q161 What makes a great coder?What aspects affect the performance of De-vOps teams and the quality of software with regard to characteristicsof an individual software engineer?
PROD 44.4% 66.7% 22.2% 32 128 4
Q111 What factors affect debugging of complex data issues in production? TP 44.4% 66.7% 0.0% 32 128 68Q64 Is the infrastructure for development and in the OTAP flexible and
modern enough to ease and speed up development?PROC 43.8% 81.3% 12.5% 38 82 15
Q92 To what extent can an approach such as Chaos Monkey, where virtualmachine instances and containers that run in the production environ-ment are randomly terminated, help to build more resilient softwareservices?
TP 42.9% 85.7% 0.0% 39 64 68
Q14 How can an inventory of tips and tricks for software developmenthelp software engineers to develop software?
BEST 42.1% 94.7% 0.0% 40 9 68
Q120 What factors affect limitation of access by engineers to productionsystems versus effectiveness of engineers?
BEST 42.1% 78.9% 10.5% 40 93 29
Q95 To what extent do dependencies on other teams affect team perfor-mance?
TC 41.2% 94.1% 0.0% 42 12 68
Q121 What factors affect loading high volume data with regard to availabil-ity of tools in industry?
BEST 41.2% 76.5% 0.0% 42 105 68
Q104 What aspects affects the performance of DevOps teams and the qualityof software with regard to software architecture?
PROD 40.0% 100.0% 0.0% 44 1 68
Q164 What parts of a software system affect software quality most, withregard to aspects such as change frequency, bug severity, hit ratio ofpaths, and importance of code?
EQ 40.0% 93.3% 0.0% 44 19 68

ESEC/FSE ’20, November 8–13, 2020, Virtual Event, USA Hennie Huijgens, Ayushi Rastogi, Ernst Mulders, Georgios Gousios, and Arie van Deursen
Percentages RankQuestion Category Essential Worthwhile+ Unwise Essential Worthwhile+ Unwise
Q47 How do the number and severity of security incidents relate to plat-forms or types of software such as Linux, Windows, Mainframe,CDaaS, non-CDaaS, TFS, BOTS, SAAS, and inhouse development?
BUG 40.0% 93.3% 0.0% 44 19 68
Q48 How does automated testing as part of the design and build processinfluence the time of delivery of software products?
BEST 40.0% 90.0% 0.0% 44 30 68
Q70 To what extent affect the requirements of a laptop the performanceof DevOps teams and the quality of software?
PROD 40.0% 90.0% 0.0% 44 30 68
Q113 What factors affect estimation of lead time, cost, and quality of soft-ware deliveries?
SL 40.0% 80.0% 0.0% 44 84 68
Q85 To what extent affects security by design - meaning that the softwarehas been designed from the foundation to be secure - the delivery ofsoftware solutions?
SL 40.0% 80.0% 0.0% 44 84 68
Q133 What factors affect testing and fixing bugs during a sprint versustesting and fixing bugs just before release (after several sprints)?
BEST 40.0% 80.0% 0.0% 44 84 68
Q168 Which input data is in the end result worth say ten times more thanother?
TP 40.0% 80.0% 0.0% 44 84 68
Q30 How can the performance of individual software engineers be bench-marked internally ING and externally with other companies?
PROD 40.0% 50.0% 20.0% 44 157 6
Q131 What factors affect team on-boarding on ING frameworks with regardto speed of development?
DP 38.9% 88.9% 0.0% 54 44 68
Q12 How can an inventory of best practices for analytical solutions insoftware development help software engineers to develop software?
BEST 38.9% 88.9% 0.0% 54 44 68
Q165 What properties affect the quality of tooling for backlog management,development, such as tools for Configuration Items, issue tracking,logging, monitoring, and crash reporting?
BEST 38.9% 88.9% 0.0% 54 44 68
Q153 What factors affect trunk-based development - a source-controlbranching model, where developers collaborate on code in a singlebranch - with regard to quality of software code?
BEST 38.9% 83.3% 5.6% 54 73 61
Q134 What factors affect TFS (Team Foundation Services) - aMicrosoft prod-uct that provides source code management - with regard to workingwith automated pipelines?
BEST 38.9% 72.2% 22.2% 54 118 4
Q63 Is it more expensive to develop front-end applications using ’modern’JavaScript frameworks, like Angular, Polymer, React than frameworkslike Vaadin, GWT, Icefaces and maybe some others around?
BEST 38.5% 84.6% 7.7% 59 69 47
Q71 To what extent affects a checklist before pushing code into productionimprove performance and quality of a software system?
DP 38.1% 85.7% 0.0% 60 64 68
Q52 How does team maturity affect code quality and incidents? TC 37.5% 93.8% 0.0% 61 15 68Q142 What factors affect the performance and productivity of DevOps
teams with regard to simultaneous slow and fast developments at thesame time in same environments?
DP 37.5% 87.5% 0.0% 61 56 68
Q139 What factors affect the different software engineering approachessuch as Scrum and Kanban in practical settings?
PROC 37.5% 68.8% 12.5% 61 124 15
Q127 What factors affect replication of production data into a test environ-ment in order to be able to test migrations and releases on an exactcopy of the production environment?
DP 36.4% 90.9% 9.1% 64 26 36
Q115 What factors affect individual software engineer productivity withregard to facilitation by others?
PROD 36.4% 90.9% 9.1% 64 26 36
Q116 What factors affect individual software engineer productivity withregard to knowledge and skills?
PROD 36.4% 81.8% 9.1% 64 77 36
Q45 How do software engineers deal with pressure from management orstakeholders?
PROD 36.4% 81.8% 0.0% 64 77 68
Q147 What factors affect the requirements for a version control system inorder to test for fitness within the ING environment?
DP 36.4% 72.7% 0.0% 64 115 68
Q59 How valuable would it be to have architects that are more busy withhelping other developer and not being fully busy with own develop-ment?
PROD 36.4% 72.7% 0.0% 64 115 68
Q135 What factors affect the composition of DevOps teams? TC 35.7% 92.9% 0.0% 70 24 68

Questions for Data Scientists in Software Engineering: A Replication ESEC/FSE ’20, November 8–13, 2020, Virtual Event, USA
Percentages RankQuestion Category Essential Worthwhile+ Unwise Essential Worthwhile+ Unwise
Q96 To what extent do standardization for solution development affectteam performance?
TC 35.3% 94.1% 0.0% 71 12 68
Q94 To what extent do dependencies of people, people changing roles orpeople leaving a team affect team performance?
TC 35.3% 64.7% 5.9% 71 138 59
Q19 How can editors help software developers to document their publicfunctions in a way that it is available for other developers?
CR 33.3% 100.0% 0.0% 73 1 68
Q122 What factors affect maintainability of software systems? EQ 33.3% 100.0% 0.0% 73 1 68Q10 How are deadlines be handled within the scope of an agile way of
working?PROC 33.3% 88.9% 0.0% 73 44 68
Q119 What factors affect lead time of software deliveries, with regard toidea creation, design, development, test, deploy, and release?
TP 33.3% 88.9% 11.1% 73 44 20
Q137 What factors affect the delivery of software solutions - includingaspects such as architecture, modularization, and distributed com-ponents - with regard to collaboration of teams located in differentcountries?
PROC 33.3% 86.7% 6.7% 73 59 51
Q90 To what extent affects the upfront preparation of a design the deliveryof software solutions?
PROC 33.3% 86.7% 0.0% 73 59 68
Q2 Are there practices of good software teams from the perspective ofreleasing software solutions into production?
PROC 33.3% 80.0% 0.0% 73 84 68
Q107 What factors affect adopting a micro-service architecture - an archi-tectural style that structures an application as a collection of looselycoupled services, which implement business capabilities - for softwareengineering purposes?
DP 33.3% 77.8% 5.6% 73 95 61
Q18 How can descriptive statistics such as averages, minimum, and maxi-mum of data-sets in use be measured in order to scale the processingof data?
DP 33.3% 77.8% 0.0% 73 95 68
Q146 What factors affect the quality of the CDaaS solution for continuousdelivery of software, and how can improvements be realized?
PROC 33.3% 77.8% 0.0% 73 95 68
Q50 How does involvement of business stakeholders affect the delivery ofsoftware solutions?
TP 33.3% 77.8% 11.1% 73 95 20
Q100 To what extent does Test Driven Development - meaning that first testare designed and after that the code is prepared - affects the deliveryand quality of software solutions?
TP 33.3% 77.8% 11.1% 73 95 20
Q132 What factors affect team performance and system quality with regardto the number of teams working simultaneously on one application?
DP 33.3% 75.0% 0.0% 73 106 68
Q29 How can the performance of DevOps teams be benchmarked overdepartments and with regard to the Dreyfus model?
PROD 33.3% 66.7% 0.0% 73 128 68
Q43 How do naming standards affect the development of software? CR 33.3% 66.7% 11.1% 73 128 20Q97 To what extent does documentation during software maintenance
affect delivery of software solutions?TP 33.3% 66.7% 11.1% 73 128 20
Q152 What factors affect the way how DevOps teams perform, with regardto product ownership, and business responsibilities?
DP 31.6% 94.7% 0.0% 89 9 68
Q69 To what extent affect pair programming - a software developmenttechnique in which two programmers work together at one worksta-tion and switch roles from code writer to reviewer frequently - thedelivery of software solutions?
PROC 31.3% 75.0% 6.3% 90 106 55
Q74 To what extent affects an agile way of working the platform or toolsused for delivery of software solutions?
PROC 31.3% 68.8% 12.5% 90 124 15
Q56 How much time is spent on risk management, security coding, andresilient architecture as part of software development?
SL 30.0% 90.0% 0.0% 92 30 68
Q6 Do unit tests save more time in debugging than they take to write,run, or keep updated?
BEST 30.0% 90.0% 0.0% 92 30 68
Q129 What factors affect running systems on many Linux platforms versusrunning systems on a centralized mainframe?
BEST 30.0% 90.0% 0.0% 92 30 68
Q55 Howmuch time does it take for a beginning software engineer to starthaving a real contribution to a DevOps team, and how to optimizethat?
PROD 30.0% 90.0% 0.0% 92 30 68

ESEC/FSE ’20, November 8–13, 2020, Virtual Event, USA Hennie Huijgens, Ayushi Rastogi, Ernst Mulders, Georgios Gousios, and Arie van Deursen
Percentages RankQuestion Category Essential Worthwhile+ Unwise Essential Worthwhile+ Unwise
Q103 What aspects affects the performance of DevOps teams and the qualityof software with regard to an agile way of working and working inDevOps teams?
PROD 30.0% 90.0% 0.0% 92 30 68
Q20 How can effort needed - in terms of time, effort, and cost - to performa software project reliable be estimated?
DP 30.0% 80.0% 10.0% 92 84 32
Q112 What factors affect different test frameworks with regard to effortspend and result of the test performed?
BEST 30.0% 60.0% 0.0% 92 144 68
Q148 What factors affect the use of Docker - combined with Docker man-agement solution, such as kubernetes - and a delivery pipeline, suchas the one supplied by open-stack with regard to team performance?
BEST 28.6% 85.7% 7.1% 99 64 49
Q144 What factors affect the performance of DevOps teams and the qualityof software code with regard to growing software systems organicallyversus start building a software system from scratch?
EQ 28.6% 85.7% 0.0% 99 64 68
Q150 What factors affect the use of PowerShell versus Ansible for deploy-ment of systems?
BEST 27.8% 55.6% 0.0% 101 152 68
Q126 What factors affect reliability and security of software libraries? DP 27.3% 90.9% 0.0% 102 26 68Q17 How can data be cashed in order to prevent from retrieving data
multiple times?DP 27.3% 81.8% 9.1% 102 77 36
Q87 To what extent affects the reservation of time and effort dedicatedfor re-factoring purposes the performance of a DevOps team and thequality of software?
PROD 27.3% 81.8% 0.0% 102 77 68
Q84 To what extent affects screen size the performance and productivityof software engineers?
PROD 27.3% 81.8% 0.0% 102 77 68
Q26 How can software engineers know what other engineers are using asoftware component when adjusting one?
RSC 27.3% 72.7% 0.0% 102 115 68
Q83 To what extent affects redesign of code the quality of code and theperformance of DevOps teams?
EQ 26.7% 93.3% 0.0% 107 19 68
Q136 What factors affect the current setup of networks and WIFI versus anopen segment of the network where Internet and a limited number ofING network resources are available?
BEST 26.7% 73.3% 0.0% 107 114 68
Q31 How can the process - in terms of the state of individual requests - bemonitored in the production environment?
SVC 26.3% 89.5% 0.0% 109 42 68
Q108 What factors affect an architectural design of an application withregard to availability of such a design, and quality of such a design?
DP 26.3% 84.2% 0.0% 109 70 68
Q16 How can code be made understandable without extensive documen-tation?
DP 26.3% 78.9% 5.3% 109 93 63
Q160 What is the status of quantum-computing and what effect will it haveon software development?
BEST 26.3% 57.9% 10.5% 109 148 29
Q106 What factors affect a focus on feature development instead of mi-grating towards new technologies or architectures versus a focuson migration towards new technologies or architectures as a part offeature development?
BEST 25.0% 87.5% 0.0% 113 56 68
Q24 How can software development be simplified in order to make itaccessible for more people?
PROC 25.0% 81.3% 12.5% 113 82 15
Q157 What impact does code quality have on the ability to monetize asoftware service?
DP 25.0% 80.0% 5.0% 113 84 67
Q13 How can an inventory of code to be re-compiled or re-linked beprepared when a configuration item is changed?
BEST 25.0% 75.0% 0.0% 113 106 68
Q54 How does the use of a shell on Unix - both in industry and withinING- influence performance of software developing teams?
BEST 25.0% 62.5% 6.3% 113 142 55
Q138 What factors affect the development- and operations (DevOps) toolsused by system engineers versus front-end engineers?
PROC 25.0% 50.0% 0.0% 113 157 68
Q51 How does knowledge sharing of backlog components affect teamperformance?
TC 23.5% 70.6% 5.9% 119 121 59
Q171 Why is security by many developers seen as ’not sexy’? BUG 23.1% 46.2% 7.7% 120 162 47
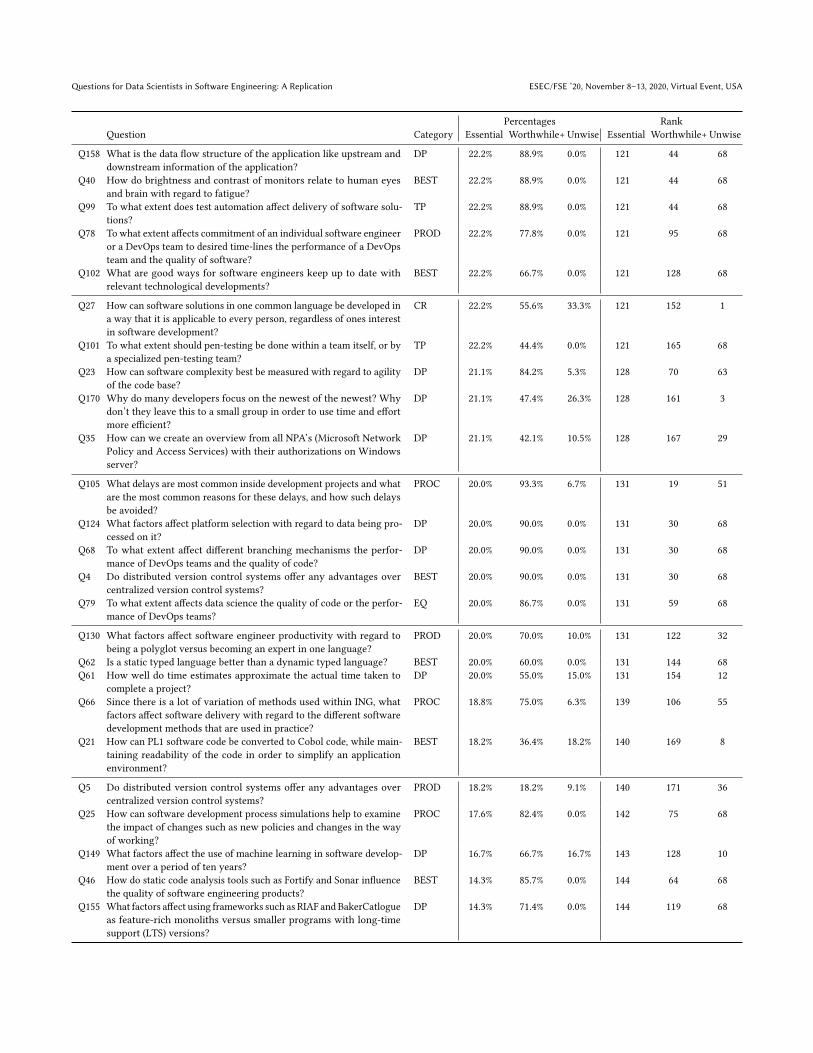
Questions for Data Scientists in Software Engineering: A Replication ESEC/FSE ’20, November 8–13, 2020, Virtual Event, USA
Percentages RankQuestion Category Essential Worthwhile+ Unwise Essential Worthwhile+ Unwise
Q158 What is the data flow structure of the application like upstream anddownstream information of the application?
DP 22.2% 88.9% 0.0% 121 44 68
Q40 How do brightness and contrast of monitors relate to human eyesand brain with regard to fatigue?
BEST 22.2% 88.9% 0.0% 121 44 68
Q99 To what extent does test automation affect delivery of software solu-tions?
TP 22.2% 88.9% 0.0% 121 44 68
Q78 To what extent affects commitment of an individual software engineeror a DevOps team to desired time-lines the performance of a DevOpsteam and the quality of software?
PROD 22.2% 77.8% 0.0% 121 95 68
Q102 What are good ways for software engineers keep up to date withrelevant technological developments?
BEST 22.2% 66.7% 0.0% 121 128 68
Q27 How can software solutions in one common language be developed ina way that it is applicable to every person, regardless of ones interestin software development?
CR 22.2% 55.6% 33.3% 121 152 1
Q101 To what extent should pen-testing be done within a team itself, or bya specialized pen-testing team?
TP 22.2% 44.4% 0.0% 121 165 68
Q23 How can software complexity best be measured with regard to agilityof the code base?
DP 21.1% 84.2% 5.3% 128 70 63
Q170 Why do many developers focus on the newest of the newest? Whydon’t they leave this to a small group in order to use time and effortmore efficient?
DP 21.1% 47.4% 26.3% 128 161 3
Q35 How can we create an overview from all NPA’s (Microsoft NetworkPolicy and Access Services) with their authorizations on Windowsserver?
DP 21.1% 42.1% 10.5% 128 167 29
Q105 What delays are most common inside development projects and whatare the most common reasons for these delays, and how such delaysbe avoided?
PROC 20.0% 93.3% 6.7% 131 19 51
Q124 What factors affect platform selection with regard to data being pro-cessed on it?
DP 20.0% 90.0% 0.0% 131 30 68
Q68 To what extent affect different branching mechanisms the perfor-mance of DevOps teams and the quality of code?
DP 20.0% 90.0% 0.0% 131 30 68
Q4 Do distributed version control systems offer any advantages overcentralized version control systems?
BEST 20.0% 90.0% 0.0% 131 30 68
Q79 To what extent affects data science the quality of code or the perfor-mance of DevOps teams?
EQ 20.0% 86.7% 0.0% 131 59 68
Q130 What factors affect software engineer productivity with regard tobeing a polyglot versus becoming an expert in one language?
PROD 20.0% 70.0% 10.0% 131 122 32
Q62 Is a static typed language better than a dynamic typed language? BEST 20.0% 60.0% 0.0% 131 144 68Q61 How well do time estimates approximate the actual time taken to
complete a project?DP 20.0% 55.0% 15.0% 131 154 12
Q66 Since there is a lot of variation of methods used within ING, whatfactors affect software delivery with regard to the different softwaredevelopment methods that are used in practice?
PROC 18.8% 75.0% 6.3% 139 106 55
Q21 How can PL1 software code be converted to Cobol code, while main-taining readability of the code in order to simplify an applicationenvironment?
BEST 18.2% 36.4% 18.2% 140 169 8
Q5 Do distributed version control systems offer any advantages overcentralized version control systems?
PROD 18.2% 18.2% 9.1% 140 171 36
Q25 How can software development process simulations help to examinethe impact of changes such as new policies and changes in the wayof working?
PROC 17.6% 82.4% 0.0% 142 75 68
Q149 What factors affect the use of machine learning in software develop-ment over a period of ten years?
DP 16.7% 66.7% 16.7% 143 128 10
Q46 How do static code analysis tools such as Fortify and Sonar influencethe quality of software engineering products?
BEST 14.3% 85.7% 0.0% 144 64 68
Q155 What factors affect using frameworks such as RIAF and BakerCatlogueas feature-rich monoliths versus smaller programs with long-timesupport (LTS) versions?
DP 14.3% 71.4% 0.0% 144 119 68
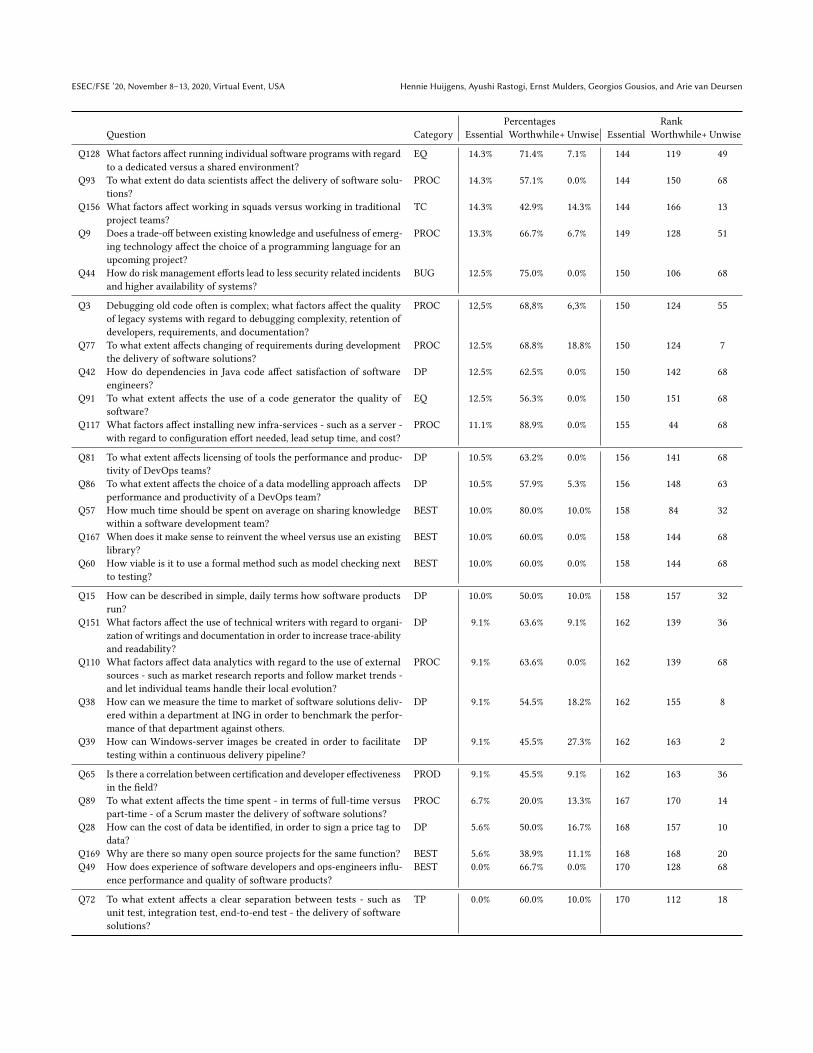
ESEC/FSE ’20, November 8–13, 2020, Virtual Event, USA Hennie Huijgens, Ayushi Rastogi, Ernst Mulders, Georgios Gousios, and Arie van Deursen
Percentages RankQuestion Category Essential Worthwhile+ Unwise Essential Worthwhile+ Unwise
Q128 What factors affect running individual software programs with regardto a dedicated versus a shared environment?
EQ 14.3% 71.4% 7.1% 144 119 49
Q93 To what extent do data scientists affect the delivery of software solu-tions?
PROC 14.3% 57.1% 0.0% 144 150 68
Q156 What factors affect working in squads versus working in traditionalproject teams?
TC 14.3% 42.9% 14.3% 144 166 13
Q9 Does a trade-off between existing knowledge and usefulness of emerg-ing technology affect the choice of a programming language for anupcoming project?
PROC 13.3% 66.7% 6.7% 149 128 51
Q44 How do risk management efforts lead to less security related incidentsand higher availability of systems?
BUG 12.5% 75.0% 0.0% 150 106 68
Q3 Debugging old code often is complex; what factors affect the qualityof legacy systems with regard to debugging complexity, retention ofdevelopers, requirements, and documentation?
PROC 12,5% 68,8% 6,3% 150 124 55
Q77 To what extent affects changing of requirements during developmentthe delivery of software solutions?
PROC 12.5% 68.8% 18.8% 150 124 7
Q42 How do dependencies in Java code affect satisfaction of softwareengineers?
DP 12.5% 62.5% 0.0% 150 142 68
Q91 To what extent affects the use of a code generator the quality ofsoftware?
EQ 12.5% 56.3% 0.0% 150 151 68
Q117 What factors affect installing new infra-services - such as a server -with regard to configuration effort needed, lead setup time, and cost?
PROC 11.1% 88.9% 0.0% 155 44 68
Q81 To what extent affects licensing of tools the performance and produc-tivity of DevOps teams?
DP 10.5% 63.2% 0.0% 156 141 68
Q86 To what extent affects the choice of a data modelling approach affectsperformance and productivity of a DevOps team?
DP 10.5% 57.9% 5.3% 156 148 63
Q57 How much time should be spent on average on sharing knowledgewithin a software development team?
BEST 10.0% 80.0% 10.0% 158 84 32
Q167 When does it make sense to reinvent the wheel versus use an existinglibrary?
BEST 10.0% 60.0% 0.0% 158 144 68
Q60 How viable is it to use a formal method such as model checking nextto testing?
BEST 10.0% 60.0% 0.0% 158 144 68
Q15 How can be described in simple, daily terms how software productsrun?
DP 10.0% 50.0% 10.0% 158 157 32
Q151 What factors affect the use of technical writers with regard to organi-zation of writings and documentation in order to increase trace-abilityand readability?
DP 9.1% 63.6% 9.1% 162 139 36
Q110 What factors affect data analytics with regard to the use of externalsources - such as market research reports and follow market trends -and let individual teams handle their local evolution?
PROC 9.1% 63.6% 0.0% 162 139 68
Q38 How can we measure the time to market of software solutions deliv-ered within a department at ING in order to benchmark the perfor-mance of that department against others.
DP 9.1% 54.5% 18.2% 162 155 8
Q39 How can Windows-server images be created in order to facilitatetesting within a continuous delivery pipeline?
DP 9.1% 45.5% 27.3% 162 163 2
Q65 Is there a correlation between certification and developer effectivenessin the field?
PROD 9.1% 45.5% 9.1% 162 163 36
Q89 To what extent affects the time spent - in terms of full-time versuspart-time - of a Scrum master the delivery of software solutions?
PROC 6.7% 20.0% 13.3% 167 170 14
Q28 How can the cost of data be identified, in order to sign a price tag todata?
DP 5.6% 50.0% 16.7% 168 157 10
Q169 Why are there so many open source projects for the same function? BEST 5.6% 38.9% 11.1% 168 168 20Q49 How does experience of software developers and ops-engineers influ-
ence performance and quality of software products?BEST 0.0% 66.7% 0.0% 170 128 68
Q72 To what extent affects a clear separation between tests - such asunit test, integration test, end-to-end test - the delivery of softwaresolutions?
TP 0.0% 60.0% 10.0% 170 112 18
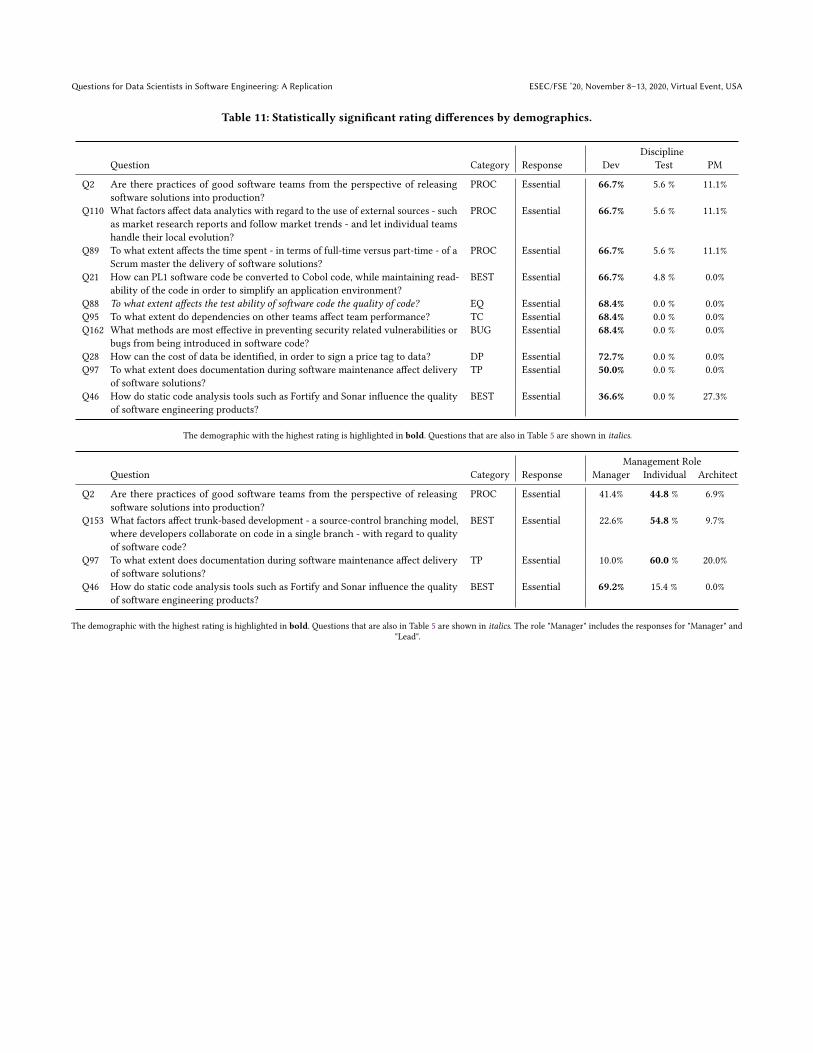
Questions for Data Scientists in Software Engineering: A Replication ESEC/FSE ’20, November 8–13, 2020, Virtual Event, USA
Table 11: Statistically significant rating differences by demographics.
DisciplineQuestion Category Response Dev Test PM
Q2 Are there practices of good software teams from the perspective of releasingsoftware solutions into production?
PROC Essential 66.7% 5.6 % 11.1%
Q110 What factors affect data analytics with regard to the use of external sources - suchas market research reports and follow market trends - and let individual teamshandle their local evolution?
PROC Essential 66.7% 5.6 % 11.1%
Q89 To what extent affects the time spent - in terms of full-time versus part-time - of aScrum master the delivery of software solutions?
PROC Essential 66.7% 5.6 % 11.1%
Q21 How can PL1 software code be converted to Cobol code, while maintaining read-ability of the code in order to simplify an application environment?
BEST Essential 66.7% 4.8 % 0.0%
Q88 To what extent affects the test ability of software code the quality of code? EQ Essential 68.4% 0.0 % 0.0%Q95 To what extent do dependencies on other teams affect team performance? TC Essential 68.4% 0.0 % 0.0%Q162 What methods are most effective in preventing security related vulnerabilities or
bugs from being introduced in software code?BUG Essential 68.4% 0.0 % 0.0%
Q28 How can the cost of data be identified, in order to sign a price tag to data? DP Essential 72.7% 0.0 % 0.0%Q97 To what extent does documentation during software maintenance affect delivery
of software solutions?TP Essential 50.0% 0.0 % 0.0%
Q46 How do static code analysis tools such as Fortify and Sonar influence the qualityof software engineering products?
BEST Essential 36.6% 0.0 % 27.3%
The demographic with the highest rating is highlighted in bold. Questions that are also in Table 5 are shown in italics.
Management RoleQuestion Category Response Manager Individual Architect
Q2 Are there practices of good software teams from the perspective of releasingsoftware solutions into production?
PROC Essential 41.4% 44.8 % 6.9%
Q153 What factors affect trunk-based development - a source-control branching model,where developers collaborate on code in a single branch - with regard to qualityof software code?
BEST Essential 22.6% 54.8 % 9.7%
Q97 To what extent does documentation during software maintenance affect deliveryof software solutions?
TP Essential 10.0% 60.0 % 20.0%
Q46 How do static code analysis tools such as Fortify and Sonar influence the qualityof software engineering products?
BEST Essential 69.2% 15.4 % 0.0%
The demographic with the highest rating is highlighted in bold. Questions that are also in Table 5 are shown in italics. The role "Manager" includes the responses for "Manager" and"Lead".